Data integration to explore the dynamics of conflict a ...
98
Calhoun: The NPS Institutional Archive Theses and Dissertations Thesis Collection 2008-12 Data integration to explore the dynamics of conflict a preliminary study Germann, Wade Anthony. Monterey, California. Naval Postgraduate School http://hdl.handle.net/10945/3848
Transcript of Data integration to explore the dynamics of conflict a ...

Calhoun: The NPS Institutional Archive
Theses and Dissertations Thesis Collection
2008-12
Data integration to explore the dynamics of conflict a
preliminary study
Germann, Wade Anthony.
Monterey, California. Naval Postgraduate School
http://hdl.handle.net/10945/3848

NAVAL
POSTGRADUATE SCHOOL
MONTEREY, CALIFORNIA
THESIS
Approved for public release; distribution is unlimited
DATA INTEGRATION TO EXPLORE THE DYNAMICS OF CONFLICT: A PRELIMINARY STUDY
by
Eric Hartunian and
Wade A. Germann
December 2008
Thesis Advisor: Nancy C. Roberts Second Reader: Douglas A. Borer

THIS PAGE INTENTIONALLY LEFT BLANK
i
REPORT DOCUMENTATION PAGE Form Approved OMB No. 0704-0188 Public reporting burden for this collection of information is estimated to average 1 hour per response, including the time for reviewing instruction, searching existing data sources, gathering and maintaining the data needed, and completing and reviewing the collection of information. Send comments regarding this burden estimate or any other aspect of this collection of information, including suggestions for reducing this burden, to Washington headquarters Services, Directorate for Information Operations and Reports, 1215 Jefferson Davis Highway, Suite 1204, Arlington, VA 22202-4302, and to the Office of Management and Budget, Paperwork Reduction Project (0704-0188) Washington DC 20503. 1. AGENCY USE ONLY (Leave blank)
2. REPORT DATE December 2008
3. REPORT TYPE AND DATES COVERED Master’s Thesis
4. TITLE AND SUBTITLE Data Integration to Explore the Dynamics of Conflict: a Preliminary Study 6. AUTHOR(S) Eric Hartunian and Wade A. Germann
5. FUNDING NUMBERS
7. PERFORMING ORGANIZATION NAME(S) AND ADDRESS(ES) Naval Postgraduate School Monterey, CA 93943-5000
8. PERFORMING ORGANIZATION REPORT NUMBER
9. SPONSORING /MONITORING AGENCY NAME(S) AND ADDRESS(ES) N/A
10. SPONSORING/MONITORING AGENCY REPORT NUMBER
11. SUPPLEMENTARY NOTES The views expressed in this thesis are those of the author and do not reflect the official policy or position of the Department of Defense or the U.S. Government. 12a. DISTRIBUTION / AVAILABILITY STATEMENT Approved for public release; distribution is unlimited
12b. DISTRIBUTION CODE
13. ABSTRACT (maximum 200 words)
This thesis is an exploration of the concepts of data integration with respect to military operations. It is an attempt to establish practices that analysts and operators can use to integrate many types of data from disparate sources. The project focuses on two software platforms: Palantir Technologies and Google Earth. These specific programs are utilized because they provide off-the-shelf products that are easy to use, require little training, and are compatible with each other. Using these software packages, we attempt to integrate data with geospatial, temporal and relational data in order to gain greater understanding and insight into complex problems.
15. NUMBER OF PAGES
97
14. SUBJECT TERMS Data integration, data layering, fusion center
16. PRICE CODE
17. SECURITY CLASSIFICATION OF REPORT
Unclassified
18. SECURITY CLASSIFICATION OF THIS PAGE
Unclassified
19. SECURITY CLASSIFICATION OF ABSTRACT
Unclassified
20. LIMITATION OF ABSTRACT
UU NSN 7540-01-280-5500 Standard Form 298 (Rev. 2-89) Prescribed by ANSI Std. 239-18

ii
THIS PAGE INTENTIONALLY LEFT BLANK

iii
Approved for public release; distribution is unlimited
DATA INTEGRATION TO EXPLORE THE DYNAMICS OF CONFLICT: A PRELIMINARY STUDY
Eric Hartunian
Major, United States Army B.A., Economics, Louisiana State University, 1999
M.A., Management, Webster University, 2004
and
Wade Anthony Germann Major, United States Army
B.A., English Literature, Virginia Military Institute, 1998
Submitted in partial fulfillment of the requirements for the degree of
MASTER OF SCIENCE IN DEFENSE ANALYSIS
from the
NAVAL POSTGRADUATE SCHOOL December 2008
Authors: Eric Hartunian Wade A. Germann
Approved by: Nancy C. Roberts Thesis Advisor
Douglas A. Borer Second Reader
Gordon McCormick Chairman, Department of Defense Analysis

iv
THIS PAGE INTENTIONALLY LEFT BLANK

v
ABSTRACT
This thesis is an exploration of the concepts of data integration with respect to
military operations. It is an attempt to establish practices that analysts and operators can
use to integrate many types of data from disparate sources. The project focuses on two
software platforms: Palantir Technologies and Google Earth. These specific programs are
utilized because they provide off-the-shelf products that are easy to use, require little
training, and are compatible with each other. Using these software packages, we attempt
to integrate data with geospatial, temporal and relational data in order to gain greater
understanding and insight into complex problems.

vi
THIS PAGE INTENTIONALLY LEFT BLANK

vii
TABLE OF CONTENTS
I. INTRODUCTION........................................................................................................1 A. PURPOSE.........................................................................................................1
1. Data Integration Defined.....................................................................1 2. General Importance.............................................................................2 3. Military Importance ............................................................................2
B. SCOPE ..............................................................................................................3 1. Criteria..................................................................................................4 2. Software ................................................................................................4
C. APPLYING TECHNOLOGY-BASED DATA INTEGRATION TO MINDANAO.....................................................................................................6
D. STRUCTURE AND OUTLINE......................................................................7
II. DATA INTEGRATION OVERVIEW.......................................................................9 A. WHAT IS DATA INTEGRATION................................................................9 B. APPROACHES TO DATA INTEGRATION.............................................10
1. Discipline Based .................................................................................10 2. Organization Based............................................................................13 3. Technical Based..................................................................................14
C. WHAT ARE DATA INTEGRATION PROCESSES.................................15 D. TYPES OF DATA TO INTEGRATE..........................................................18
1. Geospatial Representations...............................................................19 2. Temporal Representations ................................................................20 3. Relational Representations ...............................................................20
E. STEPS TO DATA INTEGRATION ............................................................21 1. Data Collection...................................................................................22 2. Data Coding and Entry .....................................................................24 3. Data Analysis......................................................................................25
III. DATA INTEGRATION EXAMPLE: MINDANAO ..............................................27 A. MINDANAO...................................................................................................27
1. History.................................................................................................27 2. People ..................................................................................................32
a. Moro or Bangsa Moro ............................................................32 b. Lumad (Indigenous People) ...................................................33 c. Christians ................................................................................33
3. Primary Groups .................................................................................34 a. Moro National Liberation Front (MNLF).............................34 b. Moro Islamic Liberation Front (MILF) ................................35 c. New People’s Army (NPA) .....................................................36 d. Abu Sayyaf Group (ASG) .......................................................37
B. PROCESSING MINDANAO DATA ...........................................................38 1. Workflow ............................................................................................38 2. Building the Database Structure in Palantir ...................................40

viii
3. Building the Database Structure in Google Earth..........................52 C. VISUALIZATION OF THE DATASET .....................................................54
IV. ASSESSMENT OF SOFTWARE AS APPLIED TO MINDANAO CASE STUDY........................................................................................................................57 A. INTRODUCTION..........................................................................................57 B. CRITIQUE OF SOFTWARE AND PERFORMANCE.............................57
1. Data Coding and Entry .....................................................................57 a. Data Coding.............................................................................57 b. Data Entry ...............................................................................58
2. Geospatial Entity Selection ...............................................................58 3. No Link Depth ‘0’ Search Ability.....................................................59 4. Palantir Updates for Version 2.1 ......................................................59
C. DATA INTEGRATION STRENGTHS AND WEAKNESSES.................59 1. Integrating Relational and Temporal Data .....................................59 2. Integrating Geospatial and Temporal Data ....................................60 3. Layering Relational and Geospatial Data........................................61
D. INSIGHTS IDENTIFIED FROM THE MINDANAO STUDY ................62 E. BEST PRACTICES .......................................................................................63
1. Organizations Should Hold Synchronization Meetings .................63 2. Everyone Must Have the Codebook.................................................63 3. Data Entry and Analysis Should be Integrated ..............................63 4. Do Not Limit the Data to be Input ...................................................64
V. CONCLUSION ..........................................................................................................65 A. OBJECTIVE ..................................................................................................65 B. LIMITATIONS OF THE STUDY ...............................................................65 C. FINDINGS......................................................................................................65 D. RECOMMENDATIONS FOR FUTURE RESEARCH.............................66
1. Software Developers ..........................................................................66 2. Data Collectors ...................................................................................66 3. Analysts...............................................................................................66
APPENDIX A. MINDANAO DATABASE CODE BOOK................................................67
APPENDIX B. MINDANAO PROJECT DATABASE......................................................73
LIST OF REFERENCES......................................................................................................77
BIBLIOGRAPHY..................................................................................................................79
INITIAL DISTRIBUTION LIST .........................................................................................83

ix
LIST OF FIGURES
Figure 1. Destroyed Darfur Settlements..........................................................................11 Figure 2. Student Project depicting Noordin’s Network.................................................12 Figure 3. Example of Data Layering ...............................................................................17 Figure 4. Example of Data Fusion...................................................................................18 Figure 5. Palantir Relationships Image ...........................................................................21 Figure 6. Three Step Cycle for Data Integration. ............................................................22 Figure 7. “Tagging” from a Document to Create an Entity in Palantir...........................40 Figure 8. Entity Organization “Abu Sayyaf Group” Creation in Palantir.......................42 Figure 9. Diagram Depicting Events Through Traditional SNA Relationships..............43 Figure 10. Diagram Depicting Event as Central Focus in Palantir. ..................................44 Figure 11. RAND Insurgent Attack Event Chain Model. .................................................45 Figure 12. Individual events and entities created for operation OPLAN Ultimatum........47 Figure 13. ‘The OPLAN Ultimatum Group’ created in Palantir.......................................48 Figure 14. Palantir Screen Capture of a Phone Call Event Link.......................................49 Figure 15. Palantir Screen Capture of Financial Transaction Event Entity. .....................50 Figure 16. Palantir Screen Capture of Financial Transaction Event Entity. .....................51 Figure 17. Palantir Screen Capture of “Flows” Function..................................................52 Figure 18. Google Earth Screen Capture of Region and Province Layers........................53 Figure 19. Palantir Visualization of the Mindanao Dataset. .............................................55 Figure 20. Palantir Visualization of the Southeast Asia Terror Network. ........................56 Figure 21. Palantir Screen Capture of Timeline Function.................................................60 Figure 22. Google Earth Screen Capture with Socio-Economic and Palantir Entities
Layered. ...........................................................................................................61

x
THIS PAGE INTENTIONALLY LEFT BLANK

xi
ACKNOWLEDGMENTS
The authors would like to give a special thanks to Professor Nancy Roberts for the
indispensible guidance without which this research project would not have been possible.
We are also in debt to Professor Douglas Borer who served as an advisor in the early
phases of the project and started us on the path to researching conflict in Mindanao. In
addition, we would like to express our appreciation to Mr. Gabe Rosen of Palantir
Technologies, Stephen Lieberman and Mr. Steffen Merten for their technical expertise
and assistance.

xii
THIS PAGE INTENTIONALLY LEFT BLANK

1
I. INTRODUCTION
A. PURPOSE
The purpose of this thesis is to explore the concept of data integration as an
approach to visualizing complex sets of data. This is important as it provides field
operators and policy makers the opportunity to see associations between vast amounts of
data. In today’s global threat environment, where massive amounts of information and
data are collected, analysis and output of actionable intelligence under significant time
constraints is critical to combating threats. Current capabilities for processing vast
amounts of disparate data are lacking. The ability for analysts to sort through the volumes
of reports and incompatible databases is limited, as is the ability to visualize, represent,
and share the results of that analysis. As the 9/11 Commission Report states, “The
importance of integrated, all-source analysis cannot be overstated. Without it, it is not
possible to "connect the dots." No one component holds all the relevant information.”1
This thesis seeks to develop techniques that can help fill this void.
1. Data Integration Defined
Data integration is the process of bringing together data from varying sources and
visualizing the data in order to facilitate discovery of associations between places, events,
people, relationships, and time. It is comprised of data layering, the process of overlaying
images of data; and data fusion, the process of fusing varying data sources to a specific
geographic location. The resulting visualizations act as a thinking tool that assists
commanders and policy makers in seeing their data in a different way and helps to make
sense of vast amounts of multi-source data.
1 The 9/11 Commission Report: Final Report of the National Commission of Terrorist Attacks Upon
the United States, (New York: WW Norton & Company, 2004), 408.

2
2. General Importance
In addition to the technical challenges of collecting, processing, and disseminating
intelligence, there is a broader issue that must be addressed in this study that stems from
one overarching challenge: the need to analyze overwhelming amounts of disparate,
conflicting and dynamic information that requires human interaction and judgment to act
upon.2 Much of the early literature after the 9/11 attacks focused on the lack of the
Intelligence Community’s ability to connect the dots. Terrorist attacks often fall into the
gap between foreign intelligence (focused on external threats and developments) and
domestic intelligence (focused on homeland threats and developments).3 The culture
against information sharing fostered, and even incentivized, organizations of the U. S.
government to avoid sharing intelligence.4 This in and of itself is a major impediment to
connecting dots. Ultimately, more recent literature underscores the need for this
information sharing, but also identifies the difficulties involved.
3. Military Importance
The military is well versed in intelligence operations for the conventional warfare
scenario. Operators and analysts tend to understand enemy formations, order of battle,
and typical enemy doctrine. This allows the military to operate with relative efficiency to
conduct intelligence preparation of the battlefield (IPB), and keep abreast of changes in
the enemy situation. This culminates in the intelligence updates to commanders and
policy makers, which can inform decisions and tactics.5 Intelligence requirements for
counterinsurgencies present different challenges. There is no typical enemy formation;
the enemy does not wear uniforms, but rather blends with the population; tactics can
2 James J. Thomas and Kristen A. Cook, "Illuminating the Path," National Visualization and Analytics
Center (2005), 2. 3 The 9/11 Commission Report: Final Report of the National Commission of Terrorist Attacks Upon
the United States, (New York: WW Norton & Company, 2004), 263. 4 John Rollins, Fusion Centers: Issues and Options for Congress, Congressional Research Service
(CRS, 2008), 25. 5 Walter L. Perry and John Gordon IV, Analytic Support to Intelligence in Counter Insurgencies,
National Defense Research Institute, RAND Corporation (Santa Monica, CA: RAND Corporation, 2008), 14-15.

3
often resemble criminal or gang-like behavior.6 Analysts, commanders, and policymakers
must adjust to this very different environment and at times accept less than ideal
intelligence products.
Current collection efforts in Iraq and Afghanistan are stymied by the multiple
databases, usually unconnected and incompatible.7 These systems lead to analysis
without the ability to cross-reference, which increases the likelihood of faulty conclusions
based on limited data. The basic focus of military programs is the trend to streamline the
“sensor-to-shooter” concept.8 In essence, a collection or observation platform can
identify a target, feed the data to a decision making cell for analysis, and allocate an asset
to attack the target. Nevertheless, the U.S. military as a whole is making progress on its
ability to collect and disseminate intelligence. The concern here is that most of the
programs are inter-service, or even branch-specific in the case of the Special Forces
community. These systems often do not communicate seamlessly with each other and
only perpetuate the lack of data integration.
B. SCOPE
The scope of this study is to explore how data integration may be used to provide
a more holistic visual representation of a complex problem with large amounts of data to
be analyzed. Technology is the key enabler of this study. As stated in the purpose, we
recognize the need for operators in the field to have capabilities to process large amounts
of disparate data. Off-the-shelf technology solutions, therefore, allow us to proceed with
data representation and visualization techniques in order to satisfy the end user in the
field.
6 Walter L. Perry and John Gordon IV, Analytic Support to Intelligence in Counter Insurgencies,
National Defense Research Institute, RAND Corporation (Santa Monica, CA: RAND Corporation, 2008), 15
7 Ibid., xviii. 8 Nancy C. Roberts, "Data Layering and Data Fusion in the Analysis of Dark Networks," Naval
Postgraduate School, Dept. of Defense Analysis (Montery, CA: NPS, 2008), 12.

4
1. Criteria
We began with three general criteria: first, the technology utilized needed to be
available to the operator; second, the systems should be relatively easy to use and require
limited operator training; finally, the applied concepts should not yield results that restrict
analysts’ or policy makers’ ability to think creatively. We addressed the first and second
criteria by using off the shelf technology with Google Earth and Palantir. These two
platforms are compatible, easy to use, and supportive of the type of work we envisioned
for this thesis. Both authors attended an eight-hour introductory class taught by the
Palantir software representatives. This training was sufficient to enable significant work
with the system. This is a key benefit, as organizations using Palantir will not lose
personnel for excessive training periods.
The third criterion is the most challenging to achieve. A critical aspect of
choosing a software package is the assumptions under which the software was created.
Essentially, how does the software force you to think? An appropriate method to arrive at
this conclusion is to first identify and understand what it is you wish to do, or more
specifically, what the nature of your work is. From this point, requirements can be
derived. Anecdotal evidence suggests that many software packages are created by first
enabling capabilities for the system, and then using those capabilities to address
requirements of the work required. This logic tends to lead to the creation of software that
forces the user into a particular paradigm; something we wanted to avoid.
2. Software
We will utilize two specific software packages in order to explore the concept of
data integration. The first is the analytical visualization platform Palantir version 2.0.
Palantir is relatively new software that combines data integration, search and discovery,
knowledge management, and collaboration. The second software package we will use is
Google Earth version 4.0.2742. Google Earth will be utilized as a geospatial visualization
platform to represent the data from Palantir. Google Earth and Palantir have a seamless
compatibility that will allow us to focus on the data representation and integration, rather
than any compatibility problems between the two software packages.
5
A small group of Silicon Valley technology entrepreneurs and alumni of
Stanford’s computer science department founded Palantir Technologies in 2004, with the
mission of revolutionizing how analysts interact with data to produce meaningful
intelligence. Palantir is an enterprise analytical platform combining data integration,
search and discovery, knowledge management, and collaboration in a secure
environment. It simultaneously supports numerous forms of analysis within a single
storage and manipulation framework. In addition to its intuitive user interface and suite of
standard tools, the Palantir platform is built on open standards and integrates with third-
party applications such as ESRI, UCINet, and Google Earth. Palantir is deployed
throughout the intelligence, military, and law enforcement communities.9
Several factors influenced the decision to use Palantir for this study. First, this
software is relatively intuitive and easy to use. While some training is required, once the
user is accustomed to the interface, data entry is straightforward and relatively fast.
Additionally, this software eliminates the need to format and code data prior to analysis.
For example, standard data processing would select Excel and a blank spreadsheet that
inserts data with appropriate formatting for columns. Then, data extracted from reports
are then inputted into the spreadsheet. These data would likely need further analysis in
other software such as UCINet, which may require additional formatting. All of this data
entry and processing takes significant time and effort.
Palantir offers the simplicity of inputting and coding data at the same time. It
allows the user to create an ontology as the work progresses, such that the format can
evolve as necessary. This is not only easy to do, but saves the user time since there is no
need to work with multiple programs. The seamless integration with Google Earth,
discussed below, is another benefit of Palantir. This software allows the researcher to
visualize geospatial, relational, and temporal data easily with one program.
The second software package in this study is Google Earth. Google Earth was
chosen over more powerful geospatial information systems (GIS) software for several
reasons. First, it is free and convenient. Any person with access to a computer and the
9 Gabe Rosen, Palantir Technologies, embedded analyst, Naval Postgraduate School, email message to authors, August 10, 2008.

6
internet can download and use a free version of this software which provides all the
functionality necessary for the data-layering process. This is particularly important
because the intended benefactors of this approach are military officers, who may or may
not have access to powerful GIS tools. Second, and perhaps most important, Google
Earth is a fairly intuitive, easy-to-use program. There are ample resources on the Internet
so that a new user can be competently using its features quickly and with a high degree of
success. Google Earth’s streamlined compatibility with Palantir also speeds data entry
and provides for easier transfer of data between software suites.
The alternative software package considered was ArcGIS. ArcGIS is a
visualization and spatial analysis tool that allows the user to model geographic
information and other types of data in order to provide useful tools for decision making
and problem solving. The software is ideal for purposes of data integration because the
interface allows multiple layers to be viewed at the same time over one base map.
Additionally, the data and or layers can be visualized in different ways to reduce clutter
or to highlight important aspects of the problem set. Unfortunately, ArcGIS must be
licensed and therefore bears a financial cost to the user. Additionally, in order to fully
utilize the feature set of ArcGIS requires considerable training.
C. APPLYING TECHNOLOGY-BASED DATA INTEGRATION TO MINDANAO
In order to properly test and explore the dynamics of data integration, it was
important to find a rich dataset that offered not just geospatial, relational, and temporal
data in isolation, but also added some of the complexities of real world problems. For this
reason we chose the island of Mindanao in the southern Philippines.
Underlying the basis of the conflict in Mindanao are struggles among the ‘tri-
people’ comprised of Moros (or Bangasa Moro-Muslims), Lumads (indigenous,
predominately non-Muslim people), and Christian settlers. The struggles these groups

7
face today are referred to as the ‘Mindanao problem,’10 and are rooted in the islands
conflicted past. Generations of instability and conflict have created and interwoven many
unresolved issues ranging from: the question of ancestral domain and agrarian rights; the
plight of thousands of displaced and landless families who have witnessed the destruction
of their property; social and cultural discrimination between people of different historical
or religious traditions; widespread poverty; the exploitation of natural resources,
described as ‘development aggression;’ and finally, the inability to develop a system of
governance compatible with the values of the tri-people in the land they commonly
inhabit.11 What binds the Mindanao people in solidarity with each other is their common
history of oppression and disenfranchisement as they share the same perspectives in the
struggle for their rights. Yet, as in the past, this same history that could unite them,
continues to divide them.
There is not just one conflict in Mindanao, but several, as the lines between
identity, kinship, ideology, and a common enemy in the Philippine government, become
interconnected among the many different insurgent and terrorist groups. Today’s tangled
web of rebel factions intertwined with foreign international terrorist organizations makes
for confusing and often misunderstood conditions for Philippine government forces, rebel
groups, and the people of Mindanao alike, as terrorist and insurgent ideologies compete
for power, land, and resources.
In this context Mindanao offers a complex situation with a large set of data
ranging from religious and ethnic ties, insurgent and terrorist groups, and economic and
resource competition ideal for the purposes of this study.
D. STRUCTURE AND OUTLINE
Chapter I has identified the scope and purpose of data integration for this
exploratory study. It has discussed the dataset of Mindanao that will be used and the
10 Susan D. Russell and others, “The Mindanao Conflict and Prospects for Peace in the Southern
Philippines,” excerpted from “Mindanao: A Perspective on Youth, Inter-Ethnic Dialogue and Conflict Resolution In the Southern Philippines,” Center for Southeast Asian Studies and Office of International Training (Northern Illinois University, IL: 2004), 6-7.
11 Ibid.

8
primary geospatial, relational, and temporal components that will be utilized.
Additionally it has given a brief introduction to what data integration is.
Chapter II provides an overview of data integration and discuss how it is
accomplished. It will explore how various disciplines use data integration principals
within their own scope. Further, it will define what types of data are integrated and
briefly discuss the methods used in this study.
Chapter III discusses the history of Mindanao and illustrate the workflow of the
data integration process. It will explain the steps and techniques used to integrate and
visualize the data in this study. It will discuss specifically what data was integrated from
our dataset and how.
Chapter IV provides an assessment of the software used in the study. It will
highlight strengths and weaknesses, and identify several best practices for the data
integration process as a whole, and the individual software packages.
Chapter V will conclude this thesis and provide recommendations for future
research.

9
II. DATA INTEGRATION OVERVIEW
This chapter discusses the utilization of technical data integration as an approach
to explore dynamics of conflict. This method attempts to pull data from multiple
disciplines, and overlay those data in order to gain a more thorough understanding of the
situation. We seek to identify methods that can synthesize all types of data with
geospatial, temporal, and relational components. In particular, we are interested in
layering and fusing those data in an effort to explore the dynamics of conflict and provide
a holistic picture of a situation.
A. WHAT IS DATA INTEGRATION
The overall data integration process is defined as the process of integrating data
from various sources and combining them visually. This process not only allows holistic
analysis in order to gain better understanding of a particular phenomenon, but it also
allows analysis of data which usually is collected by different means, and is often
analyzed separately. This is critical in today’s dynamic threat environment. Counter
terrorism organizations receive tremendous volumes of disparate data, all of which need
to be analyzed and possibly acted upon. The associations between these data sources
often go unseen because there is no way to present the data in such a way that allows
connections to be made. As such, data integration seeks to provide methods to visualize
disparate data in order to facilitate more thorough analysis.
Data integration, as discussed in this study, is not simply about sitting in the same
room with different agencies. The process is visual, allowing the analyst to see
associations that may not have been noticeable with more traditional methods. In other
words, data layering is additive in that the process adds all the data together to form a
more complete understanding of the phenomena. The data integration approach goes
beyond merely looking at a problem through different lenses; it collects the respective
lenses, and looks through them all at the same time for an in-depth view of the problem.
Used effectively, data integration is a tool that provokes thought, and allows associations
and relationships to become clear across the spectrum of geo-time.

10
B. APPROACHES TO DATA INTEGRATION
The concepts behind integrating data are not new. Many academic fields integrate
data in their own narrow scope and do so with great success. In this section, we identify
these other fields of study by subdividing them by discipline, organization, and
technology. These broad categories generally capture the types of data integration
currently being practiced in various fields.
1. Discipline Based
Geographers tend to use maps to layer human geography on top of physical
geography. By using maps, geographers can depict a vast amount of information, which
can readily be disseminated. Often, these maps offer layers of data which present
information in a way that allows the viewer to see more than just locations of key points.
While this approach is useful for many purposes, it does not capture relational data or
temporal data, which can provide further insight. Figure 1 is an example of a geospatial
product that layers data. In this map, we see settlements that were destroyed in Darfur.
Additionally, it shows the locations of water sources, and settlements that are within a
two-mile proximity to those water sources. Hence, this map displays several layers of
geographic information depicting the relationship of conflict in Darfur with the location
of drinking water sources.

11
Figure 1. Destroyed Darfur Settlements12
Social network analysts also tend to layer data in order to see the inner workings
of networks more clearly. This data stacking, as it is called, layers several data matrices
in an effort to see complex relationships. As with the geospatial example, data stacking is
still solely within the discipline of social network analysis, and often does not take into
account geospatial or temporal aspects. Figure 2 for example, is a slide from a student
project at the Naval Postgraduate School using UCINET. This figure illustrates how
stacked data can be used to display complex relationships. In this slide, we see part of the
Noordin terrorist network from Indonesia. At first glance, it appears to be a simple
network diagram. However, this slide represents a great deal of detail. First, the slide
depicts two separate matrices that are stacked to combine the internal communications
12 Student project by Eric Hartunian.

12
matrix with the key leader matrix. Second, by manipulating the shapes of the nodes, the
slide also highlights what roles each actor fills (attribute data). Finally, the data in the
slide was filtered to only show which actors are alive and not incarcerated. The primary
shortcoming of the pure SNA approach is that it lacks geospatial and temporal
components. This hinders the analyst when trying to put the relational data into the
context of time and space. Ultimately, the analyst would have to discern trends or
interesting social network findings, and then move to a map to see if there are any further
questions or answers. This is not only inefficient, but could easily miss important
associations among the data.
Figure 2. Student Project depicting Noordin’s Network13
The military offers another example. Military units historically collect a
tremendous amount of data on the battlefield. These data comes from varied sources
ranging from formal and informal reports, imagery intelligence (IMINT), human
13 Student project by Eric Hartunian.
13
intelligence (HUMINT), signals intelligence (SIGINT), and many others. These data are
typically represented on a map or on various charts on the walls. Much of the data awaits
analysis, hidden in reams of paper reports. Often, different staff sections collect these
different datasets; hence, they are posted on charts that are usually in separate work areas.
This further complicates the information flow. This is highly inefficient, as the
commander may have a great deal of answers to his many questions and not even know
it. Additionally, there are questions that will not even be asked because the data are not
presented in a way which allows or facilitates unconventional thinking.
One of the military’s answers to this dilemma is the All Source Analysis System
(ASAS). This is a computer system that automates the processing and analysis of
intelligence from all sources.14 This software is designed to link collection assets with
analysts and then provide intelligence products to users at multiple echelons. The focus of
ASAS is to manage a great deal of information, and provide limited analysis of that
information. While it does accomplish this task, ASAS fails to offer an integrated
solution because the system does not include relational data. Another shortcoming is that
ASAS was developed with conventional war fighting in mind. This is an important point
because it demonstrates how a legacy system is not advanced enough to deal effectively
with the unconventional nature of counter terrorism.
2. Organization Based
Whole organizations have been created in the wake of the 9/11 attacks in order to
solve the information-sharing dilemma. The primary examples are the various fusion
centers appearing across the country. One of the stated goals of the fusion centers is the
ability to fuse a broad range of data, from both traditional and non-traditional sources.15
While these organizations are somewhat effective, they are still attempting to chart their
course and find their niche. This is not the type of data fusion with which this study is
concerned.
14 Global Security.org, “Intel Systems,” April 26, 2005,
http://www.globalsecurity.org/intell/systems/asas.htm (accessed August 4, 2008). 15 John Rollins, Fusion Centers: Issues and Options for Congress, Congressional Research Service
(CRS, 2008), 3.

14
Following the September 11th attacks, there was an outcry about the failure of
information sharing between the federal intelligence and law enforcement communities
and state and local officials. The 9/11 Commission concluded, “The biggest impediment
to all-source analysis — to a greater likelihood of connecting the dots — is the human or
systemic resistance to sharing information.”16 The concept of fusion centers came full
circle in the post-9/11 homeland security environment. Fusion centers, by definition, are
a collaborative effort by two or more agencies that provide resources, expertise, and
information to the center with the goal of maximizing their ability to detect, investigate,
prevent, and respond to criminal or terrorist activity.17 One of the values the Department
of Homeland Security placed on fusion centers is that it is essential to fuse a broader
range of data, including nontraditional sources, in order to form a more complete picture
of threats.18 There are two fundamental differences between the concepts of fusion
centers and the type of data integration discussed in this thesis: information sharing and
collocation.
Fusion centers are highly concerned with sharing information across agencies.
Conceptually, this allows members of multiple agencies to be collocated and collaborate
on their respective investigations. The entire focus is on “connecting dots.” Members of
the fusion center can share data and intelligence, and recognize similarities or
associations amongst the various data available and provide proactive analysis to their
parent organizations (local law enforcement, FBI, etc.).
3. Technical Based
Emerging technologies are shaping the way analysts process large amounts of
data. These tools must be enablers, facilitating the analyst’s ability to digest massive
amounts of intelligence and create some type of assessments. During interviews with
analysts, RAND Corporation researchers noted that some agencies are “awash in
16 John Rollins, Fusion Centers: Issues and Options for Congress, Congressional Research Service
(CRS, 2008), 25. 17 Ibid., 1. 18 Ibid., 3.

15
tools…the tools define the box they (analysts) are in, and the tools won’t let them out.”19
More importantly, there lacks an effective conduit between the tool developers and the
analysts. This creates a dilemma where the tools created do not necessarily answer the
requirements of the analysts. This is further exacerbated by the reality that each of the
sixteen intelligence organizations, and the military, are searching for technical solutions
separately. “No community-wide effort to leverage common needs and solutions
exists…”20
How to integrate data is largely a technical issue determined by the availability of
the analytical tools and software packages. As previously stated, there is a lack of
compatible technical solutions to accomplish this. This thesis focuses on helping to fill
this need.
C. WHAT ARE DATA INTEGRATION PROCESSES
Data integration is the process of visualizing data in order to facilitate discovery
of associations between places, events, people, relationships, and time. It is a thinking
tool, that assists commanders and policy makers in seeing their data in a different way
and helps to make sense of vast amounts of multi-source data.
Data integration is an umbrella term that is composed of two data integration
processes: data fusion and data layering. Data fusion combines data on the same geo-
spatial coordinates while data layering combines and overlays geospatial images or
pictures but does not actually connect the images to geo-spatial coordinate data. Software
such as Palantir and Google Earth provide platforms for data fusion.
Data layering is defined as the additive process of overlaying two or more layers
of data from different sources onto an image.21 Figure 3 is an example of data layering
where data on Philippine socio-economic pressures is layered with data on Philippine
average incomes. While these images are displayed on a map, they are layered because
19 Gregory F. Treverton and Bryan Gabbard C., Assessing the Analysis of Intelligence Tradecraft, National Security Research Division, RAND (Santa Monica: RAND Corporation, 2008), 19.
20 Ibid., 26. 21 Nancy C. Roberts, "Data Layering and Data Fusion in the Analysis of Dark Networks," Naval
Postgraduate School, Dept. of Defense Analysis (Montery, CA: NPS, 2008), 25.

16
there are no specific ties to geographical points. Additionally, the data points are only
graphic representations of the data, not the data itself (in other words, an analyst cannot
“click” on the image and get any further data).
Data fusion is defined as the registering of data on a map to a precise geographic
grid.22 Figure 4 is an example of data fusion. In this figure, we see a map with specific
points imported from Palantir that are fused with the map on Google Earth. These points
are tied to specific geographic coordinates, and are data points themselves (not merely
representations of data). Again, the diference between layering and fusing data is distinct
in that layered data often is composed of representations of data, which does not natively
lend itself to further research while fused data are actual data points (not pictoral
representations of them) geo-located on a map.
22 Nancy C. Roberts, "Data Layering and Data Fusion in the Analysis of Dark Networks," Naval
Postgraduate School, Dept. of Defense Analysis (Montery, CA: NPS, 2008), 26.

17
Figure 3. Example of Data Layering

18
Figure 4. Example of Data Fusion
D. TYPES OF DATA TO INTEGRATE
Data integration addresses two questions: what to integrate and how to integrate.
What to integrate is a function of the questions the analyst asks, the data that are available
for analysis, and the time limitations of the study. For example, an analyst wishing to
explore the relationship between economic activity and violent events may begin by
layering socio-economic data on a map, and then bringing data about violent events into

19
the workspace to determine what associations may exist. The overarching concept is to
have a data repository, rich with all types of data, which can be utilized as the
investigation deems necessary.
Three data representations, or how the data are represented visually to the analyst,
are of particular interest to this study: geospatial, temporal, and relational representations.
Our goal in this study is to integrate these three representations together so that
associations among people (relations), at certain points in time (temporal), at specific
locations (geospatial) can be used to inform operations and policy making and gain a
more holistic visualization of the problem. These three representations were chosen
because in a military context, all intelligence and/ or data contain geospatial, temporal,
and relational properties. It is this triad of properties that we wish to integrate in order to
identify trends and associations that otherwise would go unnoticed.
1. Geospatial Representations
Geospatial representations display data relating to locations and topography.
Temporal representations display data with relation to events taking place in time.
Relational representations display data in terms of relations between people and entities.
These representations when examined individually provide insight into specific actions,
events and relationships. However, when integrated together, these three representations
provide a more comprehensive picture of the operating environment that can inform
future policy and operations.
The geospatial representation will be much more than a simple map displaying
borders. This representation will layer different kinds of data. For example, economic
data such as the dollar amount of infrastructure improvements can be layered with
ethnicity. Other layers can be added, such as tribal boundaries and government activity in
the region. With geospatial data, events can easily be exported from Palantir software to
Google Earth, facilitating more holistic analysis.

20
2. Temporal Representations
The temporal representation anchors events and people in time. This
representation ensures that events and activities maintain a temporal sequence. This can
be highly beneficial when trying to determine how events occur with respect to time.
Analysts can use this information to develop trends and make predictions for future
activities. For example, the Sinjar records show the influx of foreign fighters from Syria
into Iraq. This document shows when the fighters came across the border and provides
analysts a clear picture of temporal trends.23 It was easy for analysts viewing this data to
identify when foreign fighters were crossing the border, thus allowing for operations
planning to interrupt the flow of insurgents into Iraq.
3. Relational Representations
The relational representation describes relationships between people and various
entities. In Figure 5, we see the relationships in the Mohammed Noordin Top network in
Indonesia. This screen capture from the Southeast Asia terrorist network, created by
Stephen Martin at the NPS CORE Lab, displays relationships between people (red),
schools (blue), and groups (grey) as depicted in Palantir.
23 Combating Terrorism Center, “Sinjar Records,” Palantir, 2008, www.sinjarrecords.com (accessed
August 5, 2008).

21
Figure 5. Palantir Relationships Image
E. STEPS TO DATA INTEGRATION
There are three basic steps to data integration: data collection, data coding and
entry, and data analysis. This is not a one-time process, but a cycle that continues as long
as there is new data being collected, inputted, and analyzed. This section highlights
several types of data, and describes the process by which we enter and code them into the
data repository.

22
Figure 6. Three Step Cycle for Data Integration.
1. Data Collection
A challenge posed by any research is the need to collect data and organize the
data for easy access and analysis. This is a particular problem in this case, due to the
nature of the varied types of, and sources of, data involved. In Illuminating the Path, the
authors discuss two types of data: numeric and non-numeric data. Numeric data often
originate from measuring instruments or sensors. Non-numeric data can be any other type
of data, ranging from text news stories to maps and photos. Their level of structure
further defines these data types. Data can either be structured, as in categorical data found
in a spreadsheet; or unstructured, such as informal written reports. Unstructured data is
not necessarily without a pattern, but rather, it is the type of data which requires human
interpretation in order to understand.24
“All analysis depends on data.”25 This statement poses several challenges. Four in
particular are data collection, unevenness of reporting, multiple databases, and lack of a
standard lexicon. This thesis does not seek to solve these problems, only to highlight
them as challenges in need of further research.
24 James J. Thomas and Kristen A. Cook, "Illuminating the Path," National Visualization and
Analytics Center (2005), 108. 25 Walter L. Perry and John Gordon IV, Analytic Support to Intelligence in Counter Insurgencies,
National Defense Research Institute, RAND Corporation (Santa Monica, CA: RAND Corporation, 2008), xviii.

23
Data collection, in its current forms across the Department of Defense (DOD),
tends to be unorganized. At best, there is structure to the collection process at local levels,
but that structure does not transcend organizations within DOD. Convincing commanders
of the need to collect information which supports analysis is also challenging, as the force
tends to focus on collection to support operations.
Data is generally collected or generated in one of two ways: field reports and
historic or academic documents. Most data associated with military operations originates
from a field report such as Significant Activity Report (SIGACT) or Draft Intelligence
Information Report (DIIR). For example, an attack from an improved explosive device
(IED) on friendly forces during a patrol will generate a SIGACT report to the higher
headquarters that will identify where the attack took place (geospatial), when the attack
occurred (temporal), and other associated data available such as casualties, if the
perpetrator of the attack was killed or captured, etc. This study does not focus on how and
where the specific data are collected. More important here is the process of layering and
integrating data in order to inform analysis.
Another key problem in data collection is the completeness and accuracy of the
reporting.26 For example, what is a significant activity? To a platoon operating in Iraq, it
may be an IED attack. To an analyst, even a seemingly small detail could be critically
important. The dissemination of collection requirements to the lowest levels can help
inform operators what is important to report. This is also an effective way to address the
challenge of having a standard lexicon.
In the course of this study, data were collected on Mindanao from various articles
authored by reputable organizations such as the International Crisis Group (ICG),
Australian Strategic Policy Institute (ASPI), and Southeast Asia Research Centre
(SEARC). For a complete list of sources used to build the Mindanao database see
Appendix B. Validity of the data is assumed here, though in the course of operational use,
26 Walter L. Perry and John Gordon IV, Analytic Support to Intelligence in Counter Insurgencies,
National Defense Research Institute, RAND Corporation (Santa Monica, CA: RAND Corporation, 2008), 26.

24
this process would require the using organization to set parameters to properly validate
any data and sources before coding and analysis.
2. Data Coding and Entry
Perhaps the most challenging part of this study is coding data for entry into the
database. Data coding is defined as the process by which data are filtered in order to
categorize them in a mutually exclusive manner. By use of a codebook, the process of
coding and entering data is standardized within the organization, and ideally across
organizations as well. Analysts must have the ability to enter data without any ambiguity
as to how a particular event, person, or place is categorized. The codebook seeks to
provide this clarity. The codebook is, in essence, a document which lists the ontology and
defines all of the terms therein ensuring consistency throughout the data coding and entry
process. The ontology, as it exists in Palantir, dictates the types of objects, properties, and
links and how they interact with each other in the user interface. This ontology is user-
customizable, and is highly beneficial as it allows the using organization to customize the
features that are applicable to its own requirements. Palantir allows the user (or system
administrator, more likely) to alter the ontology and pick and chose what items will be
present in the interface. This feature may provide the key to a software package which
can be utilized across the interagency spectrum.
For example, we have already explained the need for multiple databases to have
compatibility across agencies. The dilemma, however, is that the nature of work in these
different agencies varies. The pivotal element, therefore, is the need for a common
lexicon amongst the different agencies. By first addressing the nature of work each
agency performs, ontology can be created which can support that work. This ontology
holds common terminology, such that a menu of options can allow the different agencies
to choose the appropriate items from the ontology for their work, while maintaining
compatibility across agencies.
In order to have consistent database searches, data must be entered into the
database consistently. This is not only important within an organization, but also across
organizations. Inter-rater reliability, the means to measure consistency among coders, is

25
an important step in this process. An important way to achieve inter-rater reliability is to
create a codebook as previously mentioned. This codebook serves two purposes: first, to
provide the data entry operator precise definitions of the variables and the scales that will
be utilized to code the data in order to minimize inconsistency among coders; the second
purpose is to provide a framework for data collectors. The codebook standardizes the
lexicon across agencies. This will give collectors across DOD, for example, a guide
informing them what types of information is required to build a complete dataset for
analysis.
Data entry and data coding in multiple databases presents another unique
challenge. When many analysts are inputting data into different databases, there exists a
high likelihood that different analysts will code data differently. For example, what is al
Qaeda? Is it a religious organization? A political organization? Perhaps it is a terrorist
organization or a military organization? While a valid argument could be made for any of
these choices, the challenge is consistency between those doing data coding and data
entry. Different organizations, each with its own database, may code al Qaeda differently.
While there may be internal consistency, the varying databases are not standard and do
not communicate with each other. The Congressional Research Service report on fusion
centers highlights this problem. It provides recommendations to Congress for the
intelligence community to standardize the “dictionary of intelligence” in order to allow
local, state, and federal agencies to more readily communicate with each other.27
3. Data Analysis
Data analysis can be conducted once enough data has been collected, coded, and
entered to yield results. This may be difficult to determine depending on the complexity
and scale of the database and ultimately may never be complete. Because the process is
cyclical, new data can always be added for further analysis and refinement, and as
previously stated, the process does not have an end point, but is cyclical. Analysis
conducted for this project will be covered in greater detail later in chapter III and IV.
27 John Rollins, Fusion Centers: Issues and Options for Congress, Congressional Research Service
(CRS, 2008), 62.

26
THIS PAGE INTENTIONALLY LEFT BLANK

27
III. DATA INTEGRATION EXAMPLE: MINDANAO
This chapter focuses on the process conducted for data integration in the case
study of Mindanao. Mindanao was selected as a case study because it offered a complex
environment that was rich in data. First, we give a basic overview of the history, people,
and primary groups involved in the current struggle to give a basic understanding of the
complexities facing Mindanao. Second, we describe the processes used to convert the
information on Mindanao and code and enter data into both Palantir and Google Earth to
create a dataset. Finally, we discuss the visualization of the dataset and its integration into
a larger network for Southeast Asia.
A. MINDANAO
1. History
The population of Mindanao is comprised of three groups: Moros or Bangasa
Moro-Muslims; Lumads who are indigenous, predominately non-Muslim people; and
Christian settlers. In 1946 the Philippines received its independence from the United
States and continued to exploit Mindanao’s rich resources and available land to the
benefit of the north. While the numbers of Christian emigrates from central and northern
Philippines to Mindanao remained relatively small during the American colonialism, it
began to intensify following World War II.28 By the 1970s, the immigration of Christian
Filipinos to Mindanao had created a social landscape where Moros and Lumads had
become the minorities with Muslims accounting for only one quarter of Mindanao’s
population, down from about three quarters at the beginning of the century.29 The
Philippine government also continued the policy of encouraging plantation agriculture
and deforestation on a large scale in Mindanao, allowing some of the most productive
28 Susan D. Russell and others, “The Mindanao Conflict and Prospects for Peace in the Southern
Philippines,” excerpted from “Mindanao: A Perspective on Youth, Inter-Ethnic Dialogue and Conflict Resolution In the Southern Philippines,” Center for Southeast Asian Studies and Office of International Training (Northern Illinois University, IL: 2004), 3.
29 Sylvia Concepcion and others, “Breaking the Links Between Economics and Conflict in Mindanao,” (lecture presented at the “Waging Peace” conference, Manila, Philippines, December 2003), 7.

28
lands to be occupied by transnational corporations.30 Both Moros and Lumads felt that
not only was the access to their ancestral lands and other productive resources being
taken, but that their cultural identities were being overwhelmed by the Christian settlers.
Generations of instability and conflict have created and interwoven many
unresolved issues ranging from: the question of ancestral domain and agrarian rights; the
plight of thousands of displaced and landless families who have witnessed the destruction
of their property; social and cultural discrimination between people of different historical
or religious traditions; widespread poverty; the exploitation of natural resources,
described as ‘development aggression;’ and finally, the inability to develop a system of
governance compatible with the values of the tri-people in the land they commonly
inhabit.31
The gap between the Muslims and Christians widened, manifesting itself in the
form or economic disparity and a strong desire for a return to autonomy and smaller self-
governed societies. It was during this time that violent encounters between Moros,
Lumads, and Christians become common in Mindanao, over rights to ancestral land and
political marginalization.32As competition for land intensified, both Christian and
Muslim landowners established private armies to extend or defend their holdings.
From the earliest days of its establishment the Government of the Republic of the
Philippines (GRP) marginalized Mindanao. National governments were generally aware
of problems in Mindanao, but few presidents gave it much attention or any priority.
Mindanao was seen as a resource rich area to be exploited by the rest of the Philippines.33
The dictatorial regime of the Philippine government under President Ferdinand Marcos
(1965-1986) in the late 1960s, triggered a series of events that sparked the formation of
30 Sylvia Concepcion and others, “Breaking the Links Between Economics and Conflict in
Mindanao,” (lecture presented at the “Waging Peace” conference, Manila, Philippines, December 2003), 7. 31 Susan D. Russell and others, “The Mindanao Conflict and Prospects for Peace in the Southern
Philippines,” excerpted from “Mindanao: A Perspective on Youth, Inter-Ethnic Dialogue and Conflict Resolution In the Southern Philippines,” Center for Southeast Asian Studies and Office of International Training (Northern Illinois University, IL: 2004), 6-7.
32 Ibid., 3. 33 Ibid.

29
an insurgency in Mindanao and the formation of the Moro National Liberation Front
(MNLF). The government’s response to the Moro rebellion in 1972 was a declaration of
martial law by Marcos and years of fighting and military confrontations between the two
groups ensued. By the mid-1970s, the war had reached a stalemate and under heavy
pressure from the international community, both parties sat down for peace talks.34
The Tripoli Agreement was signed in Libya in 1976 between the MNLF and the
Philippine government.35 The agreement granted autonomy to 13 provinces in Mindanao,
Sulu, and Pawan Islands and established a regional government with its own executive,
legislative, and judicial branches, with an independent security force.36 The agreement
eventually unraveled in disputes over how it was implemented, and within a year war had
resumed. Despite popular dissatisfaction with the administration of the autonomous
regions, they lasted until the dictatorial regime of Marcos was toppled in an uprising in
1986.
Corazon Aquino became President of the Philippines (1986-1992) after the
overthrow of Ferdinand Marcos under the promise that her regime would be ‘radically
different’ from the Marcos dictatorship. Civil-society actors were invited to participate in
drawing up a new Philippine Constitution which was later ratified in 1986. It included
provisions for the creation of the Autonomous Region in Muslim Mindanao (ARMM),
which provided a limited measure of self-rule. However, the autonomous government
lacked the resources to tackle the problems of the poorest regions of the Philippines, and
34 Sylvia Concepcion and others, “Breaking the Links Between Economics and Conflict in
Mindanao,” (lecture presented at the “Waging Peace” conference, Manila, Philippines, December 2003), 10-17.
35 Susan D. Russell and others, “The Mindanao Conflict and Prospects for Peace in the Southern Philippines,” excerpted from “Mindanao: A Perspective on Youth, Inter-Ethnic Dialogue and Conflict Resolution In the Southern Philippines,” Center for Southeast Asian Studies and Office of International Training (Northern Illinois University, IL: 2004), 3.
36 Sylvia Concepcion and others, “Breaking the Links Between Economics and Conflict in Mindanao,” (lecture presented at the “Waging Peace” conference, Manila, Philippines, December 2003), 10.

30
the devastation caused by years of war. In the views of many Muslims, the ARMM
simply became another layer of bureaucracy, providing positions and opportunities for
the already privileged few.37
Fidel V. Ramos, a former head of the armed forces, was elected to the Presidency
in 1992 (1992-1998). Mindanao was a primary component in Ramos’ overall
development vision, and he was determined to forge a comprehensive and enduring peace
settlement, starting with the MNLF. Ramos believed that peace was a prerequisite for
successful economic development in Mindanao. In 1996 the Final Peace Agreement
(FPA) was signed between the GRP and MNLF. It provided for new institutions, led by
the MNLF and supported by the government, to oversee a major development effort in a
Special Zone of Peace and Development (SZOPAD) covering the territory stipulated in
the Tripoli Agreement. Problems in the implementation of the FPA began almost
immediately as the government attempted to solve the massive socio-economic problems
within the SZOPAD. However, it is regarded as a remarkable benchmark, given the
MNLF’s decision to scale down its demands from separatism to autonomy.38
The situation began to change once again for the worse when Joseph Ejercito
Estrada was elected President in 1998 (1998-2001), bringing many opponents of the FPA
into the government. Under Estrada’s direction, the armed forces launched a military
offensive against several of the MILF’s camps in Abu Bakar, and subsequently declared
victory over the MILF (a splinter group of the MNLF discussed later in this article).
Estrada also alienated the MNLF by creating a Mindanao Coordinating Council to
manage infrastructure projects in the ARMM, thus weakening the role of the institutions
set up under the FPA. In 2001, Estrada’s Presidency came to an end when he was ousted
from power for involvement in government corruption.39
37 Sylvia Concepcion and others, “Breaking the Links Between Economics and Conflict in
Mindanao,” (lecture presented at the “Waging Peace” conference, Manila, Philippines, December 2003), 10-17.
38 Ibid. 39 Ibid.

31
Estrada was succeeded by his Vice President, Gloria Macapagal Arroyo (2001-
present), who declared a policy of ‘all-out peace.’ Arroyo sent emissaries to talk to the
MNLF and MILF and formed a presidential task force to take the lead in rehabilitating
areas in Mindanao that had been devastated by years of war.40 However, Arroyo
suspended the formal peace talks with the MILF in 2002 under reports that the MILF was
sheltering criminal gangs and conducting ceasefire violations, although closed
negotiations reportedly continued.41
After the attacks of September 11, 2001, President Arroyo was one of the first
Asian leaders to express support for the U.S. ‘War on Terrorism.’ Her pledged support
included statements about continuing the war against ‘local terrorists’ that included
Muslim armed groups in Mindanao. With the Abu Sayyaf Group (ASG) and New
People’s Army (NPA) (groups discussed later in this article), being listed on the US
terrorist organizations list, US forces were sent to train Philippine troops who were
pursuing the Abu Sayyaf, and Arroyo obtained a $356 million package for counter-
terrorism aid.42 The MNLF and MILF were excluded from the list because they are
widely regarded as revolutionary organizations fighting for independence. However, the
Philippine Government and the United States strongly believe the MILF and MNLF have
links to all of these groups including Jemaah Islamiyah (JI) and Al Qaeda (AQ), although
the MILF claims to officially disavow terrorism.43
There is not just one conflict in Mindanao, but several, as the lines between
identity, kinship, ideology, and a common enemy in the Philippine government, become
interconnected among the insurgent and terrorist groups. Today’s tangled web of rebel
40 Sylvia Concepcion and others, “Breaking the Links Between Economics and Conflict in Mindanao,” (lecture presented at the “Waging Peace” conference, Manila, Philippines, December 2003), 10-17.
41 Susan D. Russell and others, Susan D., “The Mindanao Conflict and Prospects for Peace in the Southern Philippines,” excerpted from “Mindanao: A Perspective on Youth, Inter-Ethnic Dialogue and Conflict Resolution In the Southern Philippines,” Center for Southeast Asian Studies and Office of International Training (Northern Illinois University, IL: 2004), 5.
42 Sylvia Concepcion and others, “Breaking the Links Between Economics and Conflict in Mindanao,” (lecture presented at the “Waging Peace” conference, Manila, Philippines, December 2003), 10-17.
43 International Crisis Group (ICG), Southern Philippines Backgrounder: Terrorism and the Peace Process (ICG Asia Report No. 80, July13, 2004), 1.

32
factions intertwined with foreign international terrorist organizations makes for confusing
and often misunderstood conditions for both Philippine government forces and rebel
groups alike, as terrorist and insurgent ideologies compete for power and land.
2. People
The people of Mindanao include 13 Islamized ethno-linguistic groups, more
popularly known as Moro or Bangsa Moro, more than 18 other indigenous tribes
collectively referred to as the Lumad, and Christian Filipino’s from the central and
northern Philippines.44
a. Moro or Bangsa Moro
Muslims, or as they call themselves the Moro or Bangasa Moro (“Moro
nation”), are made up of 13 ethno-linguistic groups, including the Iranun, Jama Mapun,
Palawani, Molbog, Kalagan, Kalibugan, Maguindanao, Maranao, Sama, Sangil, Tausug,
Badjao, and Yakan.45 Today, it is estimated they comprise about 20 percent of the total
Mindanao and Sulu population.46
The word “Moro” was originally designated by the Spanish for the
Muslims from North Africa, the Moors who invaded the Iberian Peninsula in the eighth
century. Today “Moro” gives the wrong impression, that there is an ethnic group called
“the Moros.” This gives the confusing impression that the various Mindanao tribes, such
as the Tausugs, Maguindanaos, Kalibugan, Iranuns, Samals, and Yakans, are all united.47
The fact is, although they each share similar racial, linguistic, and religious traits, they all
developed their own unique societies and histories.
44 Mindanao, “History,” http://www.philippines.hvu.nl (accessed 11 July 11, 2008). 45 Susan D. Russell and others, Susan D., “The Mindanao Conflict and Prospects for Peace in the
Southern Philippines,” excerpted from “Mindanao: A Perspective on Youth, Inter-Ethnic Dialogue and Conflict Resolution In the Southern Philippines,” Center for Southeast Asian Studies and Office of International Training (Northern Illinois University, IL: 2004), 6.
46 Hazel Jean L. Malapit and others, “Does Violent Conflict Make Chronic Poverty More Likely? The Mindanao Experience,” (paper presented at the conference “Staying Poor: Chronic Poverty and Development Policy” held at the University of Manchester, England April 7-9, 2003).
47 Shinzo Hayase, “Mindanao Ethnohistory Beyond Nations: Maguindanao, Sangir, and Bagabo Societies in East Maritime Southeast Asia,” translated by Dr. Motoe Terami-Wada (Ateneo de Manila University Press, Quezon City, Philippine: 2007), 48.

33
b. Lumad (Indigenous People)
Lumad is a generic term for the non-Muslim and non-Christian tribal
groups, or “cultural communities” in Mindanao, that means indigenous people. There are
18 very diverse ethno-linguistic Lumad groups that consist of the: Ata, Bagobo, B'laan,
Bukidnon, Dibabawon, Mamanua, Mandaya, Kamayo, Mangguwangan, Manobo,
Mansaka, Matigsalog, Subanun, Tagakaolo, Tala-andig, T’boli, Tiruray, and Ubo.48 Most
of the Lumad tribes still retain their traditional animistic religion based on a strong belief
in the power of the spirits of ancestors and in the influence of more than one god.49
However, some of these tribes are partly Christianized, and others partly Islamicized.
Moreover, there are still others, such as the Maranao in the central highlands of
Mindanao, which are partially both. Today, these ethnic groups make up only 5 percent
of the total Mindanao population.50
c. Christians
There are almost 200,000 Christians and Visayan-speaking people on the
Island of Mindanao.51 They are comprised mostly of the converted indigenous people
during the Spanish occupation and transplants from the northern Philippine islands of
Luzon and Visayas during the American colonial and Philippine independence periods.
These include people from the areas of: Butuan, Davao, Camiguin Island, Cagayan de
Oro, Misamis Oriental, Iligan, Ozamiz, Dapitan, Dipolog, and Zamboanga City.
Although many have now integrated into the larger Christian population of Mindanao,
dialect differences remain apparent among the different tribes. Most of the Christian
48 Susan D. Russell and others, Susan D., “The Mindanao Conflict and Prospects for Peace in the Southern Philippines,” excerpted from “Mindanao: A Perspective on Youth, Inter-Ethnic Dialogue and Conflict Resolution In the Southern Philippines,” Center for Southeast Asian Studies and Office of International Training (Northern Illinois University, IL: 2004), 6.
49 Mindanao, “History,” http://www.philippines.hvu.nl (accessed 11 July 11, 2008). 50 Hazel Jean L. Malapit and others, “Does Violent Conflict Make Chronic Poverty More Likely? The
Mindanao Experience,” (paper presented at the conference “Staying Poor: Chronic Poverty and Development Policy” held at the University of Manchester, England April 7-9, 2003).
51 Mindanao, “History,” http://www.philippines.hvu.nl (accessed 11 July 11, 2008).

34
inhabitants of Mindanao are descended from the Chavacanos of Manila from the mid-
1800s.52 Today, Christian Filipino’s comprise roughly 75 percent of the population in
Mindanao.53
3. Primary Groups
It is important to look at each of the distinct rebel groups in Mindanao separately
in order to understand their unique objectives, but not forget that each of these groups is
tied together through common historical struggles and a multitude of personal and
religious links.54
a. Moro National Liberation Front (MNLF)
After decades of political, social, and economic deterioration for the
Moros in Mindanao, sentiments for an independent Muslim community finally became
strong enough to take root. The MNLF defines its struggle as one against the Philippine
state, not against Mindanao Christians, and its ideology attempted to go beyond local
concerns and gain control over social services, to benefit from economic development,
and protect their ancestral lands from Christian settlers and government owned
corporations. The MNLF’s educated leadership promoted a Bangsa Moro identity above
the various ethnic affiliations of Mindanao Muslims with the ultimate goal of an
independent Bangsa Moro state.55
52 Susan D. Russell and others, Susan D., “The Mindanao Conflict and Prospects for Peace in the
Southern Philippines,” excerpted from “Mindanao: A Perspective on Youth, Inter-Ethnic Dialogue and Conflict Resolution In the Southern Philippines,” Center for Southeast Asian Studies and Office of International Training (Northern Illinois University, IL: 2004), 6.
53 Hazel Jean L. Malapit and others, “Does Violent Conflict Make Chronic Poverty More Likely? The Mindanao Experience,” (paper presented at the conference “Staying Poor: Chronic Poverty and Development Policy” held at the University of Manchester, England April 7-9, 2003).
54 For more information on insurgent vs terrorist groups in Mindanao see the International Crisis Group report, “Southern Philippines Backgrounder: Terrorism and the Peace Process” (ICG Asia Report No. 80, July 13, 2004).
55 Susan D. Russell and others, Susan D., “The Mindanao Conflict and Prospects for Peace in the Southern Philippines,” excerpted from “Mindanao: A Perspective on Youth, Inter-Ethnic Dialogue and Conflict Resolution In the Southern Philippines,” Center for Southeast Asian Studies and Office of International Training (Northern Illinois University, IL: 2004), 2.

35
The MNLF was able to gain a large amount of support from the global
Muslim community because they claimed to be a movement representing all Muslims in
the Philippines. Throughout the 1970s the MNLF gained most of its funding from Libya,
who supported the training of fighters within its borders, and the Chief Minister of the
state of Sabah in Malaysia, Tun Mustapha, a Tausug whose family originated from
Sulu.56
In 1996 after years of fighting and failed peace agreements with the
government, Nur Misuari, head of the MNLF, and President Ramos, reached a peace
agreement in Libya. The agreement provided for the employment and repatriation of
MNLF rebels and socio-economic development assistance. Nur Misuari was later
appointed chairman of the Southern Philippines Council for Peace and Development
(SPCPD) and elected governor of the ARMM. In 1998 after little economic improvement
for Muslims had been achieved, Misuari was not re-elected governor and again continued
to launch attacks with the MNLF against the Philippine National Army. He was later
arrested in Malaysia and is currently awaiting trial in jail in Manila.57 The MNLF still
retains governmental recognition as a representative of the Moro people of Mindanao at
the government level, although they have seen a diminished military capacity over the
years as the MNLF has evolved into a more political role.
b. Moro Islamic Liberation Front (MILF)
In 1977, the resumption of hostilities between the Filipino government and
the MNLF was accompanied by fragmentation within the MNLF leading to the formation
of the Moro Islamic Liberation Front (MILF).58 After years of failing to see any real
progress for Moro independence in Mindanao from the MNLF, MNLF followers broke
away and established the Moro Islamic Liberation Front (MILF) in 1984, with a more
56 Sylvia Concepcion and others, “Breaking the Links Between Economics and Conflict in
Mindanao,” (lecture presented at the “Waging Peace” conference, Manila, Philippines, December 2003), 9. 57 Susan D. Russell and others, Susan D., “The Mindanao Conflict and Prospects for Peace in the
Southern Philippines,” excerpted from “Mindanao: A Perspective on Youth, Inter-Ethnic Dialogue and Conflict Resolution In the Southern Philippines,” Center for Southeast Asian Studies and Office of International Training (Northern Illinois University, IL: 2004), 4.
58 Ibid., 2.

36
faith-based agenda.59 The MILF’s primary support base is in Central Mindanao, in
particular Maguindanao and Lanao del Sur, but it also has a presence in Muslim
communities of North Cotabato, Sultan Kudarat, South Cotabato, Lanao del Norte and
the Zamboanga peninsula.60 Local rebel commanders dominate these enclaves with
varying degrees of allegiance to the MILF central leadership because their power is
rooted in clan and tribal loyalties. Between 1987 and 1990 the MILF claimed to have
122,000 trained supporters that could be mobilized to back the 10,000 to 15,000 armed
regulars.61 By the mid-1980s, the MILF had become the strongest group militarily in
Mindanao.
After the Philippine army’s attack on the MILF’s camp headquarters at
Abu Bakar in 2000, and the death of Hashim in 2003, the MILF forces have been
dispersed into smaller autonomous units,62 Hashim’s successor, Al-Haj Murad Ebrahim,
faces the challenge of not allowing it to separate into its many segmented parts.63
c. New People’s Army (NPA)
The New People’s Army is the military wing of the Communist Party of
the Philippines (CPP) that was formed in 1969 with the aim of overthrowing the
Philippine government through a long protracted war. The NPA was founded by Jose
Maria Sison, who is currently the CPP’s Central Committee Chairman, as a communist
group based on the teachings of Moa.64 The NPA is primarily a rural guerrilla group, but
does have a small active urban infrastructure available to support it. The NPA targets
59 International Crisis Group (ICG), ”Southern Philippines Backgrounder: Terrorism and the Peace
Process” (ICG Asia Report No. 80, July 13, 2004), 4. 60 Sylvia Concepcion and others, “Breaking the Links Between Economics and Conflict in
Mindanao,” (lecture presented at the “Waging Peace” conference, Manila, Philippines, December 2003), 10.
61 International Crisis Group (ICG), ”Southern Philippines Backgrounder: Terrorism and the Peace Process” (ICG Asia Report No. 80, July 13, 2004), 4-5.
62 Ibid., 4. 63 Astrid S. Tuminez, “The Past is Always Present: The Moros of Mindanao and the Quest for Peace,”
(working paper No. 99 for the Southeast Asia Research Center Management Committee, City University of Hong Kong: May 2008), 29-30.
64 FAS Intelligence Resource Program, “New People’s Army (NPA),” http://www.fas.org (accessed July 22, 2008).

37
Philippine security forces, politicians, judges, and even rival splinter groups and criminal.
It derives most of its funding from support-based contributions in the Philippines and
Europe, from taxes extorted from local businesses and politicians, and is believed to have
received support from China.65 The NPA is known to operate under an umbrella
organization known as the New Democratic Front (NDF) that represents 13 smaller
communists groups in political talks. Although there have been several smaller groups
that have broken away from the NPA, such as the Revolutionary Army of the People,
Revolutionary Party of Workers in Mindanao (RPM-M), and Proletarian Revolutionary
Army, none have the size and influence of the NPA. The NPA is reported to be slowly
growing in popularity and numbers after years of low memberships, has an estimated
10,000 members today.66
d. Abu Sayyaf Group (ASG)
The failure of the Tripoli Agreement, the fragmentation of the liberation
movement, and the weakening of the MNLF’s leadership contributed to the emergence of
a more radical armed group, the Abu Sayyaf Group (ASG), based on the island of
Basilan. Unlike the MNLF and MILF, the Abu Sayyaf Group is explicitly anti-Christian.
The group appears to operate as a network of networks with an alliance of smaller groups
or cells that compete or cooperate to maximize their individual needs.67 They continue to
be involved in various terrorist activities (to include ties with JI and AQ), kidnappings of
foreign tourists and missionaries for ransom, bombing attacks, and arms smuggling. Its
leaders continue to present justifications for their activities in crude political and religious
messages. Contrary to some assertions that the group has lost its political strategy or
65 Armed Conflicts Report, “Philippines CPP/NPA,” January 2008,
http://www.ploughshares.ca.libraries (accessed July 22, 2008). 66 FAS Intelligence Resource Program, “New People’s Army (NPA),” http://www.fas.org (accessed
July 22, 2008). 67 International Crisis Group (ICG), ”Southern Philippines Backgrounder: Terrorism and the Peace
Process” (ICG Asia Report No. 80, July 13, 2004), 7.

38
focus, they have always tended to function more like an organized crime gang.68 Abu
Sayyaf membership is believed to number between 400 and 1,000.69
The history of Mindanao, information on specific groups, and their
relationships to each other is identified from researching credible written sources. The
difficulty and challenge is how to translate this disparate data into a usable database that
visualizes the conditions and is suitable for analysis. The process used to convert this
disparate data, such as the above background on Mindanao, will be covered in the next
section.
B. PROCESSING MINDANAO DATA
This section describes the process used to provide an efficient mechanism for
coding and inputting disparate data in order to build a useable database. In the case of this
study, we began working with numerous articles rich in data about the conflict in
Mindanao (see Appendix B for a complete list of sources). Additionally, we discuss the
process used to build the Mindanao database in both Palantir and Google Earth. In this
study, we utilize a workflow that systematically allows large amounts of data to be
processed. This processing is efficient, and is facilitated by the tools available in the
software packages we selected. It is import to state up front that we only focus in this
study on the procedures that are either necessary in order to give the reader a basic
understanding of the whole process, or those areas that produced problems because of the
complexities in determining how to properly code or structure the data. It is not intended
to be an all-inclusive step-by-step manual for creating a database in Palantir or Google
Earth.
1. Workflow
Palantir offers several features that facilitate the workflow of data coding and
entry. The primary benefit is the ability of the software to work with unstructured data,
68 Sylvia Concepcion and others, “Breaking the Links Between Economics and Conflict in Mindanao,” (lecture presented at the “Waging Peace” conference, Manila, Philippines, December 2003), 11.
69 Council on Foreign Relations, “Abu Sayyaf Group,” Philippines, Islamist Separatists, June 25, 2008, http://www.cfr.org (accessed July 17, 2008).

39
such as news articles, or unstructured reports. This feature allows the analyst to view a
document, and then highlight key terms or names and “tag” them, which establishes an
electronic link from the created entity to the document, and also amongst different
entities. For example, when a name appears in a document, the analyst can highlight that
name and tag it to create a specific entity (person, place, or event) for that tag in the
document (see Figure 7 for a screen capture example of Palantir “tagging”). The analyst
can additionally link that tag to any number of other entities that have already been
created. This process lends structure to the data; which allows for in-depth querying of
the dataset when analysis is conducted and allows the analyst to know specifically the
source of the entity. The Palantir software interface further streamlines the process of
data coding and entry by allowing the coder to select whether the “tag” is for just one
specific occasion, or to be associated with all further appearances, not only in the current
document, but also in any additional documents in the “data repository.” This dual-
purpose step greatly increasing efficiency and reducing data entry time. For example, for
the first tagging of the Moro Islamic Liberation Front in one document, the software
found 1306 instances of that group, across the twenty-nine documents loaded in the data
repository, and tagged them all at one time.

40
Figure 7. “Tagging” from a Document to Create an Entity in Palantir.70
The capability of the tag function in Palantir is one of its major benefits from a
data coding and input perspective because of its ability to rapidly facilitate data
management. However, as with any data entry, it is necessary to stress proper quality
control in order to ensure the highest level of accuracy.
2. Building the Database Structure in Palantir
The Palantir system operates on the premise of ontology. The ontology is a menu
of options allowing the categorization of people, events, and relationships. It provides the
user a customizable interface which defines how the data are first categorized then linked
together. We begin with the overarching person, place, or event called an entity. The
entity is created by the user in accordance with the codebook as a representation of a
specific person, place, or event and is either manually input or electronically tagged from
70 Screen capture from Palantir of the document display menu in the data repository for the ICG document “Southern Philippines Backgrounder: Terrorism and the Peace Process.” The highlighted ‘blue’ words have been “tagged” creating entities for them. The ‘insert’ shows what the tagged entities look like on the graph display window with links associating them to other entities.

41
a document in the data repository. Later, links are created between entities to establish
ties, relationships, or general connections between two or more entities. The following
examples will depict how this is accomplished.
The first example describes the method for coding a person or group; the process
is identical for both. This example will utilize the creation of the Abu Sayyaf Group
(ASG). The first priority is to decide what type of entity the group represents or
resembles. With the standard Palantir package, there are twelve different organization
entity types to choose from; these range from academic, charity, commercial, criminal,
military, etc. There are also six different person types to choose from with varying
specificity. Choosing which organization type to use to best represent an entity is based
on contextual reading and on independent knowledge. This decision on how to
characterize an organization or person can be difficult, especially for ambiguous or
complex organizations. For example, the Moro National Liberation Front (MNLF) in
Mindanao has characteristics that could allow it to be defined as a terrorist organization,
or a military organization, or one could even argue a political organization. Since
insurgent organization is not an option, which is what most sources would define the
MNLF as today, it is important to be specific and consistent once the coder has made a
decision. For our purposes, the ASG is coded as a terrorist group. We created it as an
entity with its definition defined in the codebook to ensure future consistency for other
organizations that meet the same criteria. At this point, the entity can be opened and any
additional properties such as dates, membership, addresses, etc., can be added as
appropriate (see Figure 8). All groups, people, and places are created as entities in this
manner. It is important to note that all the specific details of an entity are not necessary in
order for its initial creation. As the investigation develops and more information about the
person or organization is revealed, the entity may be updated accordingly at any time.

42
Figure 8. Entity Organization “Abu Sayyaf Group” Creation in Palantir.71
Events are another key item that often form ties linking people with places and
actions. The methods for deciding how to code an event are more complicated than with
persons or groups. Individual steps that make up an event can range through multiple
layers such as geospatial, temporal, and relational. Representing them in a way that both
intuitively makes sense and facilitates analysis is difficult.
There are two schools of thought regarding how to organize or structure data in
order to represent relationships between persons and events. The first is used primarily by
social network analysts and bases relationships around the person where all persons are
connected through various relationships or attributes. Here, it is the person that is the
primary focus and events, or locations, become the relational tie that connects people
together.72 For example, person ‘X’ and person ‘Y’ may be connected to one another in
71 Screen capture from Palantir for the display menu of the entity “Abu Sayyaf Group.” From this
menu the operator can input, view, or search specific properties, related events, related entities, and any notes associated with this particular entity. The ‘insert’ shows what the entity “Abu Sayyaf Group” looks like on the graph display window with links associating it to other entities: persons in blue, events in red; organizations in grey; locations in pink.
72 For information regarding Social Network Analysis see Introduction to social network methods by Robert A. Hanneman and Mark Riddle, University of California, Riverside, 2005, (published in digital form at http://faculty.ucr.edu/~hanneman/).

43
that they were both involved in the same bombing incident. The bombing event is an
attribute that ties the two persons together, but the persons are the primary focus.
Likewise, person ‘Y’ and person ‘Z’ may be connected by the attribute that they are
related to one another. Again, the attribute of “related to” is the tie connecting the two
persons together (see Figure 9). If this is the way the coder wishes to build their database
it is recommended to use a more powerful social network analytic platform such as
UCINet or Pajek to take advantage of the specific algorithmic functions that they offer
for better relational analysis. However, as previously stated, the purpose of this study is
to test the benefits of Palantir as a data integration platform rather than pure social
network analysis.
Figure 9. Diagram Depicting Events Through Traditional SNA Relationships.
The second school of thought is derived from the functionality of more recent
software platforms and the methods of analysts attempting to solve problems where the
significant event is the primary focus and other associated information may not be
known. This method places the event at the center of analysis with all other persons,
locations, or their relationship to that event acting as links and supporting data (see
Figure 10). This is one of the strengths of Palantir because the event can be structured

44
several different ways to facilitate the coders’ needs. It also tends to be the way operators
intuitively think. Additionally, it is useful when an event has occurred but the participants
of the event, or how the event is linked to the bigger picture may not be known.
Figure 10. Diagram Depicting Event as Central Focus in Palantir.
There is no wrong or right way for representing data. The most important thing is
that the data are represented in a manner that best facilitates the needs of the user and all
coders are consistent throughout the entire process. No matter how the data are inputted
into Palantir, it can be searched and analyzed in the same manner.
Once the method for coding the event has been decided, the coder needs to
identify the critical steps surrounding the event. These can involve adding multiple layers
such as geospatial, temporal, and relational data, or just one layer depending on how
complicated the event is. RAND provides a useful flowchart depicting the chain of events
for an insurgent attack, that lays out in a linear fashion seven broad categories that may
need to be represented or coded for an attack event (see Figure 11). This suggests that
every insurgent attack has several supporting events as represented in the small boxes in
the figure such as financing, logistics, etc.
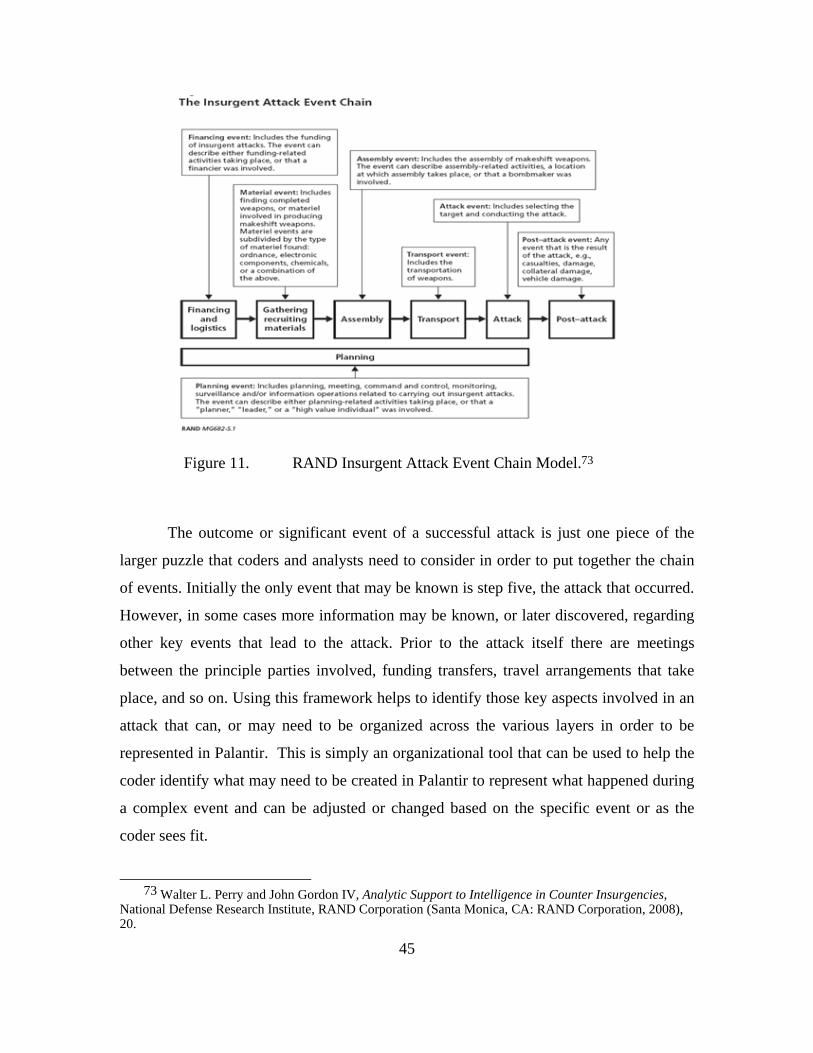
45
Figure 11. RAND Insurgent Attack Event Chain Model.73
The outcome or significant event of a successful attack is just one piece of the
larger puzzle that coders and analysts need to consider in order to put together the chain
of events. Initially the only event that may be known is step five, the attack that occurred.
However, in some cases more information may be known, or later discovered, regarding
other key events that lead to the attack. Prior to the attack itself there are meetings
between the principle parties involved, funding transfers, travel arrangements that take
place, and so on. Using this framework helps to identify those key aspects involved in an
attack that can, or may need to be organized across the various layers in order to be
represented in Palantir. This is simply an organizational tool that can be used to help the
coder identify what may need to be created in Palantir to represent what happened during
a complex event and can be adjusted or changed based on the specific event or as the
coder sees fit.
73 Walter L. Perry and John Gordon IV, Analytic Support to Intelligence in Counter Insurgencies,
National Defense Research Institute, RAND Corporation (Santa Monica, CA: RAND Corporation, 2008), 20.

46
The next step, as with creating a person or group, is to identify what type of event
occurred in order to be able to best classify the event type for its definition in Palantir.
There are five broad category event types that a coder can use to classify an event, with a
further twenty-five sub-category classifications that are much more specific in nature
such as communication, bombing, raid, payment, or travel. Utilizing Palantir, we can
create the event entity with a unique name, and then proceed to create, or use previously
created, entities associated with this event tying them together by appropriate link types.
This method of managing the data allows the analyst to later filter searches by events, and
easily see all persons, places, and sub-events associated with the event of interest as a
whole.
The insurgent attack chain model can also be used to help frame complicated
events that are not just attacks but still contain separate distinct actions. For example,
OPLAN Ultimatum was a joint operation between the Armed Forces of the Philippines
(AFP) and U.S. Special Operations Forces in the Sulu region of Mindanao that took place
over nine months between 2006 and 2007.74 Due to the long duration of the operation, it
was recognized that there would need to be many separate and important events
represented in Palantir to capture all of the critical aspects of the operation, and yet these
separate events still needed to remain linked together under the primary event of the
operation itself. To accomplish this task, we created event entities, ranging from meetings
to raids, to represent the significant occurrences leading up to, supporting, during, and
following the operation, similar to actions such as funding, traveling, and planning, in the
insurgent attack chain model. With each of these individually created events, numerous
supporting entities such as persons, locations, and organizations were created as
necessary and linked to each of their respective events (see Figure 12).
74 For more information regarding Oplan Ultimatum refer to the International Crisis Groups report
“The Philippines: Counter-Insurgency VS. Counter-Terrorism in Mindanao,” Asia report N. 152, May 14, 2008.

47
Figure 12. Individual events and entities created for operation OPLAN Ultimatum.75
The temporal and geospatial data associated with each of these events and all
related entities are added as properties within the event entity, as is any other data from
the original report such as locations with latitude and longitude coordinates, specific
duration date and time, and casualties. This enables the greatest fidelity in information at
the smallest level because data are entered and associated with each specific meeting or
raid versus all thirteen events rolled into one. To tie each of these individual events
together under one umbrella of OPLAN Ultimatum, we utilized a feature in Palantir
called a ‘group node,’ which collects any number of selected entities such as events,
persons, or locations and places them under the umbrella of one single entity. For
OPLAN Ultimatum, six individual event entities were grouped under the group entity
‘the OPLAN Ultimatum Group’, with an additional twenty-three entities created and
associated by various links to events within this group (see Figure 13). This procedure
provides a convenient grouping of multiple events associated to one name.
75 Screen capture from Palantir for the individual events and entities created for operation Oplan
Ultimatum. The events are created and linked separately to allow for the greatest fidelity of data associated with each event. The Oplan Ultimatum event entity is in the upper right-hand corner highlighted in yellow.

48
Figure 13. ‘The OPLAN Ultimatum Group’ created in Palantir.76
As previously stated, events can also be coded as links between two entities to
capture an action that has occurred. In some cases it may be better to represent an event
as a link rather than an entity. For example, when there are multiple entities connected by
a phone call, that phone call event can best be represented as a separate event entity to
which multiple entities can then be linked. However, if there are only two entities
involved, building the phone call as a link may simplify the representation of the event.
In either case, the fidelity of the data remains unchanged; the most important concept is
to be consistent across the dataset. Using the example of OPLAN Ultimatum, some
events such as phone calls were coded as a link between two persons rather than creating
a separate phone call event entity (see Figure 14). The coder will have to decide which
method or methods will best represent the data. Utilizing this method in conjunction with
building events as entities adds further fidelity to the database.
76 Screen capture from Palantir for the ‘OPLAN Ultimatum Group’ created for operation OPLAN Ultimatum and all associated events. The OPLAN Ultimatum event entity is in the center of the screen with the six sub-events selected to be a part of the group listed underneath it in the gray box. The other associated entities can be seen on either side with their links tying them to the group. The group can be separated back out into each of the six sub-events at any time the coder or analyst chooses.

49
Figure 14. Palantir Screen Capture of a Phone Call Event Link.77
Monetary transactions are another type of event that requires special attention.
Just as there are several ways to code and enter events in Palantir, there are several ways
that monetary transactions can be represented. Transactions can be created as event
entities with properties embedded within the entity, or as an event link between two
entities with the transaction event and all of its properties embedded into the link itself.
Once again, there is no right or wrong way for doing this, as either method will provide
the same search and analysis ability. However, there are some visual representation
differences that Palantir offers depending on the method used. If the financial transaction
is created as a separate event, it will remain on the display screen as an event entity icon
with various links tying it to other entities (see Figure 15). All of the specific information
about the transaction, date-time, amount, etc. is embedded in the properties of the event.
77 Screen capture from Palantir for a phone call event created between the MNLF organization and the
person entity Gen Dolorfino. The ‘related info’ page is displayed for the person entity ‘gen dolorfino’ showing the phone call event highlighted in yellow. All info regarding the phone call can be input and accessed in the property fields such as phone number, time, and date of occurrence. The insert in the upper right-hand corner shows what the event looks like on the Palantir display screen where the link event is highlighted in yellow.

50
Figure 15. Palantir Screen Capture of Financial Transaction Event Entity.78
However, if the transaction event is built within the link of two entities as in
Figure 16, then a function in Palantir called the “flows” tab can be used to visually
represent the transaction taking place between the two entities. The flows function in
Palantir acts as a visual representation of all transactions that are coded into the data so an
analyst can see which entities money is being transferred to and from. A red sphere
moves in the direction of travel of the transaction along the link between the entities,
highlighting the transaction taking place.
78 Screen capture from Palantir for a financial transaction event created between multiple entities. The
financial transaction is built as a separate event entity, highlighted in red, with all other associated entities linked to it. The summary page for the death payment event, with all info pertaining to the payment, is displayed in the upper right-hand corner. All info regarding the payment can be input and accessed in the property fields such as amount, time, and date of transaction.

51
Figure 16. Palantir Screen Capture of Financial Transaction Event Entity.79
Additionally, a window opens on the display with a bar graph displaying the
currency amounts that are being represented. A toggle on the graph allows the analyst to
filter the level of transactions they wish to see (see Figure 17). This function is only
available if the transaction event is built within the link. If there are more than two
entities linked together by the same transaction event, then the transaction cannot be built
into the link and it will have to remain as a separate entity icon on the display graph.
Again it is important to state that the data remains in the database regardless of how it is
inputted by the coder. The additional benefit of the flows function assists the analyst if
transaction events are built within the link of two icons. This feature is highly useful as a
presentation tool.
79 Screen capture from Palantir for a financial transaction event created as a link between two entities.
The financial transaction event is highlighted in yellow where it is built as a link, and highlighted in red where it was built as a separate event entity. The link summary page for the death payment transaction, with all info pertaining to the payment, is displayed in the upper right-hand corner. All info regarding the payment can be input and accessed in the property fields such as amount, time, and date of transaction.

52
Figure 17. Palantir Screen Capture of “Flows” Function.80
3. Building the Database Structure in Google Earth
Operating in Google Earth provides an easy to use interface. It is intuitive and
provides the type of data integration solution that illustrates the basic concepts of this
thesis. However, there are several limitations to the software that we must discuss. First,
the software is unclassified, limiting the types of data we can use with it. This is of no
concern for this thesis, as all data presented here are unclassified. Second, the Google
Earth software relies on satellite imagery. This imagery has coordinate systems overlaid
on top, allowing the location of specific places using geographic coordinates.81 The
reality of this system, however, is that the map in Google Earth is not geo-referenced to a
particular datum, so the data are not accurate enough for targeting purposes. We accept
this limitation for the purpose of this thesis, and utilize the tools available in Google
Earth as a vehicle to explore data integration.
80 Screen capture from Palantir showing the flows function of a financial transaction between two
entities. The financial transaction is represented by a pulsing red sphere which travels on the link between the two entities involved in the transaction. The ‘money flows’ display window on the right displays the approximate values of money being transferred and can be filtered by amount sizes.
81 Google Earth, “Google Earth,” 2008, www.earth.google.com (accessed September 23, 2008).

53
The first task in using Google Earth is to define what types of data are available
for layering. This process takes available maps (or images of maps), and places them on
the Google Earth workspace for use in analysis. For example, Figure 18 shows a screen
capture of the Philippine regions on Google Earth with a map of Mindanao provinces
over-laid. This image of the provinces was carefully resized in order to fit as close as
possible the boundaries on the Google Earth map. It can then be stored as a layer that can
be toggled on and off as needed to further analysis. There are two shortcomings of this
technique: first, this overlay leaves the Google Earth screen rather cluttered; second, the
image does not scale.82
Figure 18. Google Earth Screen Capture of Region and Province Layers.
When these layers are imported into Google Earth, the remaining map related
tasks are generally executed in the Palantir software. For example, any entity created in
Palantir that includes location properties (coordinates) may be exported from Palantir into
Google Earth with a single keystroke. This export will place an appropriate icon on the
82 When zooming in or out in Google Earth, the image overlay will maintain its shape, but the text and graphics lose resolution. This can be problematic, especially on layers that are rich in data. The best way to resolve this is to past the image into Google Earth with the largest screen size available, as this is the size that will maintain the highest resolution.

54
Google Earth workspace in the location defined in that entity’s property field.
Additionally, and of great interest to this study, temporal data existing in the entity’s
property field are also exported. This allows the analyst the ability to layer entities on a
map with relation to their locations and time span. The analyst can then utilize the time
play feature of Google Earth to “play” the sequence of events on the screen. This is a
very powerful visualization tool and lends itself well to presentations.
C. VISUALIZATION OF THE DATASET
Once the disparate data have been coded and entered into Palantir they can be
visualized. The visualization of the dataset is a very powerful tool. It helps to identify key
information that otherwise would be lost in text documents alone and saves time in
digesting vast amounts of data in reading documents. Of particular importance is the fact
that these visualizations can be created within minutes. Groupings, links, and
relationships between entities, persons, events, and organizations can to be identified,
some playing a more central role and others acting as a bridge between groups, and still
others falling as peripheral players in the network.
The Mindanao dataset at the time of this writing consists of 139 separate entities.
These entities consist of persons (77), terrorist organizations (14), political organizations
(10), and 19 other organizations. There are 46 event entities within the dataset comprised
of raids (14), bombings (9), and other events such as meetings, payments, and sightings.
Additionally, there are 411 links connecting the 139 entities that range from relationships
to events. A visualization of the Mindanao dataset can be seen below in Figure 19.

55
Created10/30/2008 09:20 PDT Figure 19. Palantir Visualization of the Mindanao Dataset.83
The visualization of datasets that have been combined can provide further benefits
for analysts to help identify possible links across vast networks. When the Mindanao
dataset was combined with the Southeast Asia terror network created by Steffen Merten,
a research assistant for the Core Lab at the Naval Postgraduate School, we were able to
see how organizations operating within Mindanao were integrated into the larger
Southeast Asia terror network. The same visual identifications that were made from
looking at just the Mindanao dataset, such as links and relationships between entities,
persons, events, and organizations, can be applied on a larger scale to the larger South
East Asia terror network. Figure 20 below shows the Mindanao dataset highlighted in
blue merged into the Southeast Asia terror network. Again, this visualization tool can be
very powerful in helping identify key information about how larger organizations are
inter-related to one another that would normally take vast amounts of time to process and
understand.
83 Screen capture from Palantir displaying the entire Mindanao dataset. The entity coding is as follows: blue represents persons, yellow represents terrorist organizations, grey represents other organizations, pink represents locations, and events are icon based. The inset in the lower right-hand corner is the ‘histogram’ window that gives all of the specific statistics for numbers and types of entities in the database.

56
Created 10/13/2008 11:20 PDT
Figure 20. Palantir Visualization of the Southeast Asia Terror Network.84
84 Screen capture from Palantir displaying the Southeast Asia terror network with the Mindanao dataset highlighted in blue. The Southeast Asia terror network was created by Steffen Merten, a research assistant for the Core Lab at the Naval Postgraduate School, and represents affiliations between persons, organizations, and events involved in terrorist activities throughout Southeast Asia. At the time of this publication the network consisted of over 717 entities.

57
IV. ASSESSMENT OF SOFTWARE AS APPLIED TO MINDANAO CASE STUDY
A. INTRODUCTION
This study began with the intent to develop methods to integrate data utilizing a
dataset from Mindanao. The notion that we live and operate in an environment with
complex problems and increasingly large datasets led us to question if there is a better
way to visualize these disparate datasets in an effort to facilitate policy making and
operations. We attempted to integrate data from the Philippine island of Mindanao with
the intent to seek a better understanding of some of the complexities by fusing and
layering data with relational, geospatial, and temporal properties. After creating the
Mindanao dataset, we identified several technical challenges regarding software
performance, our ability to integrate data, and some best practices for conducting data
integration faced in this study.
B. CRITIQUE OF SOFTWARE AND PERFORMANCE
1. Data Coding and Entry
After working with the Mindanao dataset, it was determined that there are some
general rules for data coding and entry that should be applied in order to ensure that the
structure remains consistent throughout the entire data coding and entry process. These
general rules are listed below.
a. Data Coding
• All entities will be coded based on the specific definitions that are established in the codebook. Events and organizations will be coded based on their degree of violence. For example, if a political group is involved in mostly peaceful, but occasionally conducts terror attacks, it will be coded as a terror organization, not a political organization.
• Coders should strive to define relationships by the greatest degree of specificity possible. For example, if all that is known is that two individuals communicated, then they are defined with the link type communicated with. If during the course of the investigation, the

58
coder determines the communication relationship was for the purpose of gaining financial support, then the relationship type should be changed from communicated with to contributor of.
• Whenever possible, events will be coded as individual entities wherein other entities are linked to that event rather than created as links tying two entities together.
• Monetary transactions will be coded as payment transactions within the link of two entities whenever possible in order to facilitate the use of the flows function in Palantir.
b. Data Entry
• General place names of countries will be geo-located by capital city. General locations such as islands or cities will be geo-located by center of mass grid. All other locations will be geo-located as specific as information will allow.
• As much information as possible will be entered to populate each entity. This will include all persons, places, and events. Each entity created will be populated with as much supporting data as is available to include all known property fields, geo-data, and any notes relevant for providing refined information.
• The method of tagging to create entities from documents in the data repository will be the primary method used in order to create a digital link to the documents where the information came from. Entering data manually will be a last resort method and only be used if no documents in the data repository can be used.
2. Geospatial Entity Selection
Palantir version 2.0 has limited geospatial visualization capability. The software
integrates with Google Earth relatively seamlessly, but has some shortcomings. Once the
entities have been imported into Google Earth from Palantir, there is no easy way to
select entities for analysis based on geo-location from within Google Earth. For example,
suppose the analyst is viewing the Google Earth map with imported Palantir entities and
wants to see all activities that occurred on the island of Mindanao. There is no convenient
way to simply draw a circle around the island, and use that circle to highlight all entities
within the circle. With the current Palantir version, the analyst has to identify the objects
within Google Earth on the map, and then manually select them on the Palantir display

59
interface to conduct analysis. This is not a difficult problem when working with a small
dataset, however the problem increases exponentially as the dataset becomes larger.
3. No Link Depth ‘0’ Search Ability
There is no ability to conduct a link depth ‘0’ search when conducting analysis.
Palantir only has the ability to conduct analysis on link depths ‘1’ through ‘4.’ For
example, there is no capability to search for links between only those selected entities on
the display without bringing in entities from one, or more, levels removed. Therefore, it is
very difficult to conduct analysis and see links or relationships between only those
selected entities on the display.
4. Palantir Updates for Version 2.1
As of this writing, Palantir Technologies is planning a release of version 2.1. This
version plans to address the following issues:
• Map Window and Geo-search: Palantir 2.1 includes its own map tool, which can incorporate tile sets from any source and also cache them in order to work offline. The map tool includes the ability to draw a radius, polygon (with an unlimited number of sides) or path (with variable width) on the map and search for any events/objects in the area, whether they have specifically been brought to the map or not. Geo-tagging of events and objects will also be possible. In addition, folders, selection, histogram, and timeline will interact with the map just as they do with the graph.
• New ‘Search Around’ features: Depth limits will be available to prevent out-of-memory errors. Overlapping time intervals (e.g. who has the same address at the same time; who is linked to location X at the same time) will be available for searches.
• A new event tagging interface will allow the analyst to quickly tag start and end dates during normal workflow entry.85
C. DATA INTEGRATION STRENGTHS AND WEAKNESSES
1. Integrating Relational and Temporal Data
The layering of relational and temporal data was conducted in Palantir. Every
entity that was created in the database was populated with time/date data within its
85 Rosen, Palantir Technologies, embedded analyst, Naval Postgraduate School, email message to authors, September 5, 2008.

60
property field. This enabled the data to be viewed and analyzed by the timeline function
built into Palantir. By viewing the database through the timeline display, the entities can
be visualized in the time sequence in which they occurred. As the sliding time bar is
moved forwards or backwards the entities and links between them become highlighted in
sequential order by their date, and remain highlighted until the end of their occurrence
(see Figure 21). This is a simple and excellent way to see correlations between events,
persons, and each of their respective links through time. In this manner, we are fusing
relational and temporal data.
Figure 21. Palantir Screen Capture of Timeline Function.
2. Integrating Geospatial and Temporal Data
The layering of geospatial and temporal data was conducted in Google Earth.
Every event, organization, and location entity created in the database was populated with
geo-coordinate data and time/date data within its property fields. This enabled the data to
be exported to Google Earth and viewed and analyzed by the time play function built into
Google Earth. By viewing the exported Palantir entities through the time play feature in

61
Google Earth, the entities can be visualized by their location geospatially throughout
Mindanao, and in the time sequence that they occurred. As the sliding time bar is moved
forwards or backwards the entities populate the map in sequential order by their date, and
remain on the map until the end of their occurrence. This is a simple and powerful
visualization tool to see correlations between events that occurred over time and their
subsequent location to each other. Additionally, any map layers built in Google Earth can
be toggled on or off to further visualize possible correlations (see Figure 22). This fuses
geospatial and temporal data.
Figure 22. Google Earth Screen Capture with Socio-Economic and Palantir Entities Layered.
3. Layering Relational and Geospatial Data
The ability to properly fuse relational and geospatial data is a limitation of these
two software packages. Neither Palantir nor Google Earth has the functionality, at this
time, to properly facilitate the visualization of relational data over geospatial data. It is
still possible to replicate the layering of these two data, but the method is cumbersome
and does not give as concise a visualization as can be done between the other methods. In

62
order to accomplish layering relational and geospatial data, first the entities must be
exported from Palantir to Google Earth. With the entities now represented geospatially,
the analyst can determine which specific entities they would like to analyze relationally.
Once these entities have been selected, the analyst must go back into Palantir, select those
entities from the display, and begin relational analysis of those entities to determine any
correlations. This process can be repeated again and again to gain further insights
between possible relational and geospatial data. Until either Palantir or Google Earth can
provide the functionality to display relational data over geospatial data this limitation will
remain.
D. INSIGHTS IDENTIFIED FROM THE MINDANAO STUDY
The Mindanao dataset helped to identify some general findings:
• At some point the size and scale of the dataset begins to inhibit analysis. As the database becomes larger and larger, the ability to make sense of the information begins to get exponentially more difficult for the analyst. Redundancies in the dataset further congest the ability to determine what is happening and adds confusion. The point at which this happens is difficult to determine and depends greatly on the ability level of the analyst and complexity of the dataset.
• Palantir is a great tool for organizing and visualizing vast amounts of data. It presents a way to represent the same information that was previously contained in volumes of documents, in a more efficient manner. A helpful way to think of this is as a virtual file cabinet that can be quickly sorted and easily accessed by way of visual icons, rather than having to sort through large written documents or reports.
• Palantir is a good tool for conducting exploratory analysis, however, the larger the database becomes the more complicated it becomes to work with and draw, or see correlations. It is, therefore, important to stress it is not a decision making tool to be used in isolation.
• Different analysts arriving at different conclusions from the same dataset is all right. Different analysts may come to different conclusions when analyzing the same dataset. This should not be a major concern as long as the dataset the analysts used has been coded in a consistent way. Just as there may be differing opinions as to the best course of action to take, there may be differing opinions concerning what the data is telling the analysts. It is up to the analysts and decision makers to use their best judgment on these issues.
63
E. BEST PRACTICES
This study identifies some best practices for conducting data integration. These
best practices create an environment where workflow is more efficient, and perhaps more
importantly, analysis can be more thorough.
1. Organizations Should Hold Synchronization Meetings
Inevitably, the possibility exists where analysts will not agree on how to
categorize particular entities or events. Even with mutually exclusive definitions in the
codebook, this challenge exists. Regularly scheduled synchronization meetings will help
to address this dilemma and sort out possible disagreements. The stakeholders can meet
and go over the list of questionable entities, and deliberate until a decision is reached.
Results of this meeting can then be broadcast to the organization as a whole to ensure all
members have consensus on the entities in question. This process is critical to ensuring
that consistency and clarity exists in the codebook and thereby, the database.
2. Everyone Must Have the Codebook
It is absolutely critical that all coders, analysts, and anyone working with the
database have and operate off the same codebook. The codebook is what ensures that
there is consistency throughout the entire data coding and entry process and standardizes
the lexicon across all the user agencies. The codebook also ensures that those parties that
conduct analysis on, or work with the database at a later point in time, properly interpret
the database as the coders intended so inaccurate conclusions are not drawn.
3. Data Entry and Analysis Should be Integrated
We found that when the same person coded and input the data, much more
efficient analysis was able to take place. When the same person handles the data, that
person develops an intimate understanding of the data. This creates a situation where the
analyst has in depth knowledge of what data is in the system, which may create
opportunities to sense emerging patterns in the data that may otherwise go unseen.
Additionally, this addresses the problem addressed in the 9/11 Commission Report where

64
analysts felt they were getting finished intelligence instead of raw data.86 There is no
substitute for familiarity with the database and the more knowledge that the codes and
analysts have with the data, the better the end result will be both in terms of structure and
analysis.
4. Do Not Limit the Data to be Input
There should be no restrictions placed on the types of data that are input into the
database. Coders should input data that is both lethal and non-lethal in nature in order to
facilitate all types of analysis. This will facilitate analysis conducted at a later date to be
open enough to support a wider range of recommendations for decision makers and not
force courses of action in only one area, such as indirect or direct action. For example, if
the preponderance of data entered into the system supports kinetic operations, then the
analysis of that data will show biased support for those types of operations. Therefore, it
is important to include data across the entire environment. In other words, the broadest
range of data will allow for the broadest analysis.
86 The 9/11 Commission report: Final Report of the National Commission of Terrorist Attacks Upon
the United States, (New York: WW Norton & Company, 2004), 408.

65
V. CONCLUSION
A. OBJECTIVE
The overall objective of this thesis was to determine if data integration techniques
could help manage complex, disparate data utilizing off the shelf technology. The chosen
software, Palantir and Google Earth, were able to integrate data to a degree. The software
performed flawlessly in the areas of their specific emphasis, but were unable to fully
integrate relational and geospatial data together. This is not to say that greater insight was
not achieved despite this shortcoming, but that the limitation of the software inhibits fully
integrating all three types (geospatial, relational, and temporal) of data. Nevertheless,
there is value added because the software integration allows us to visualize extensive
datasets thereby allowing for better, more efficient analysis. We are confident that with a
robust dataset, the process of data integration will provide a clearer visualization of the
operating environment.
B. LIMITATIONS OF THE STUDY
We began this study by bounding our research to only unclassified data. While
this limited the size of our database, it allowed us to apply and validate data integration
techniques. As such, this study does not purport to be a complete record, or provide
solutions to solve the conflict in Mindanao. Instead, it highlights capabilities and
limitations of the chosen software and allows us to create efficient tools to work with vast
amounts of data.
C. FINDINGS
Data integration is possible to an extent. The ability to fuse temporal and
geospatial data is clearly demonstrated in this study. Fusing relational data with temporal
data is also feasible. We were unable, however, to fuse relational and geospatial data with
the software packages. Nevertheless, the process of integrating data proved worthwhile as
it allows analysts to visualize a great deal of data from multiple sources in a

66
manner that creates meaning. In other words, this process presented data in a way
that meshes well with our cognitive processes.
D. RECOMMENDATIONS FOR FUTURE RESEARCH
This study validated the use of data integration techniques to visualize vast
amounts of data. Through the course of the study, we identify several recommendations
for future research by category:
1. Software Developers
The utility to visualize relational data with geospatial data cannot be addressed at
this time because it cannot be accomplished. Software developers should view this as a
valid requirement, and attempt to develop tools that can meet this need.
2. Data Collectors
This process teaches us the importance of integrating data collection and data
processing for analysis. All personnel tasked with collecting data, military and civilian
alike, should conform their collection to the tools used to analyze the data. This is not to
say that collection techniques should be modified, but that the coding process as used in
this thesis can be applied to the collection and reporting process. This will streamline the
data entry process, and allow for faster analysis. It also reduces ambiguity in coding the
data, because reports will already be structured according to the ontology of the system.
This clearly presents a tremendous training challenge, as every field collector would need
familiarity with the process.
3. Analysts
Analysts are the key to making sense of the tremendous volumes of data present
in today’s environment. The benefits associated with using analysts to code as well as
analyze data cannot be emphasized enough. This creates an environment where the
analysts are intimately knowledgeable of the data available, and will create more
opportunities for connecting the dots and be able to provide more comprehensive
recommendations to the decision maker.

67
APPENDIX A. MINDANAO DATABASE CODE BOOK
General Rules 1. All entities will be coded based on the below definitions. Events will be coded by
their degree of violence. For example, if a political group is involved in mostly peaceful, but occasionally conducts terror attacks, it will be coded as a terror organization, not a political organization.
2. Coders should strive to define relationships by the greatest degree of specificity possible. For example, if all that is known is that two individuals communicated, then they are defined with the link type communicated with. If during the course of the investigation, the coder determines the communication relationship was for the purpose of gaining financial support, then the relationship type should be changed from communicated with to contributor of.
3. General place names of countries will be geo-located by capital city. General locations such as islands or cities will be geo-located by center of mass grid. All other locations will be geo-located as specific as information will allow.
4. As much information as possible will be coded. This will include all persons, places, and events. Each entity created will be populated with as much supporting data as is available to include all properties, geo-data, and any notes relevant for providing more information.
5. Whenever possible events will be coded as individual entities wherein other entities are linked to that event rather than created as links tying two entities together.
6. Monetary transactions will be coded as payment transactions within the link of two entities whenever possible in order to facilitate the use of the flows function.
7. The method of tagging to create entities from documents in the data repository will be the primary method in order to create a digital link to the documents where the information came from. Entering data manually will be a last resort method and only be used if no documents in the data repository can be used.
Terminology Data Repository- The place in Palantir where digital documents are stored and accessed for the purposes of researching and coding data. Entity- A particular and discrete unit that can be created to exist in Palantir to represent persons, organizations, locations, or events. Event- Something that takes place; an occurrence; a significant occurrence or happening. Can be coded and entered as an entity or a link. Flows- A function in Palantir which acts as a visual representation of monetary transactions that are coded into the data so an analyst can see which entities money is being transferred to and from. Link- A connecting element in Palantir used to show a tie or bond between entities. Can be coded and entered as a relationship or event. Tag/Tagging- A function in Palantir which allows the coder to view a document, highlight key terms or names, and establish an electronic link from a created entity to a document.

68
Ties- The connection or relationship between two or more entities. Entities Persons: 1. Person- Default tag for any human entity.
a. Suicide Bomber- A person who trains or plans to commit a suicide bombing. Includes those who succeed and fail in this endeavor.
Organizations: 1. Academic Organization- Schools, universities, colleges, and any other type of
academic institution. Includes religious schools. 2. Charity- Any organization that collects donations for any purpose. 3. Commercial Organization- Any commercial enterprise of any type (excluding
criminal) or affiliated organizations (example: labor unions). 4. Criminal Organization- 5. Government Organization- Any organization that is responsible for government
functions. Example: post office, dep’t of motor vehicles, etc. 6. Law Enforcement Organization- Any organization whose primary mission or purpose
is to conduct law enforcement or police activities. Does not include military police, or military units conducting policing operations.
7. Military Organization- Any organization whose primary mission or purpose is to conduct military operations.
8. Organization- Default tag for any organization that does not fall within a specific organization types listed. Example: Elk’s Lodge Club.
9. Political Organization- Political parties, interest groups, fronts, or any other politically minded group that does NOT engage in terrorism.
10. Terrorist Organization- Clandestine organizations that employ terrorism. Entity: 1. Entity- Any “thing” which doesn’t fit into a more specific category. Example: drug
sniffing dog.
Location: 1. Location- A place where something is or could be located; a site. Should always have
geo-coordinates associated with it.
Events: 1. Communication- Default tag for a message of any kind sent from one party to
another. Method of communication doesn’t fall into specific forms or is not known (example: fax).
a. Phone Call- A phone call initiated (but not necessarily received) by a person. b. Meeting- Communication (in person) between two or more persons. c. E-Mail- An E-mail initiated (but not necessarily received) by a person.
2. Incident- a. Attack-

69
i. Attempted Attack- A terrorist attack or plot that did not succeed for any reason.
ii. Bombing- Any bombing, excluding those involving a “suicide bomber.”
iii. IED Attack- iv. Suicide Bombing- Any bombing carried out by a suicide bomber. v. Terrorist Attack- Any attack carried out by a terrorist organization not
involving explosives. b. Arrest- The arrest of any individual or group of individuals by authorities. c. Raid- Raid by authorities against a location which may or may not result in an
arrest. d. Sighting- Positive identification of a person at a specific time or location.
3. Transaction- a. Payment- The transaction of FUNDS from one party to another. b. Transaction- The transaction of anything OTHER THAN FUNDS from one
party to another. 4. Travel- Default travel event used when specific mode of travel is unknown OR for
permanent or semi-permanent travel (moving to a new location). a. Ground Travel- Ground travel that does not involve a bus or a train. b. Flight- Air travel by any means. c. Travel- Default tag for any kind of movement that does not fall under a more
specific category. 5. Event- Default event type for events which do not fit into a more specific category. Links Relationships: 1. Appears in- Default relationship for linking an entity (person, organization, etc.) to an
event (bombing, meeting, travel, etc.). 2. Acquaintance of- Relationship for two individuals that know one another but do not
meet the criteria for another personal relationship (friend of, enemy of, sibling of, boyfriend of, etc.). This is the default relationship when data supporting another personal relationship is unknown or unavailable.
3. Authorizer of- Relationship between an individual and an event wherein the person orders or consents to a specific event.
4. Beneficiary of- Relationship between entities wherein one is the recipient of funds, property, or other benefits of the other.
5. Collaborates with- Relationship between two entities (persons or organizations) wherein information is exchanged between the two entities on an ongoing basis (this is used to define splinter groups that continue to operate together).
6. Colleague of- Relationship between two entities (persons or organizations) wherein one is familiar works in a similar field or organization as another.
7. Communicated with- Relationship between two entities (persons or organizations) wherein one has maintained ongoing communications of any kind with another.

70
8. Contributor to- Relationship wherein an entity (organization or person) aids another entity (organization, person, or location) in any way (money, arms, etc.) OTHER THAN the provision of information (funding, moral support, personnel, etc.).
9. Coworker of- Relationship between two persons wherein one works in the same organization as another, without being under his/her direct authority.
10. Crew of- Relationship between two persons in a small group or cell wherein one is the cell leader and the other(s) answer directly to the leader and only the leader.
11. Employee of- Relationship between a person and a commercial organization wherein the person works at/for the commercial organization.
12. Friend of- Strong personal friendship between two individuals. 13. Head of- Relationship between a person and an organization wherein the person has
chief authority over the organization. 14. Kin of- A relationship between two persons wherein one is related to the other either
through marriage or blood, excluding siblings and spouses. 15. Manager of- Relationship between two persons in a hierarchical organization wherein
one manages the actions of the other(s). A person may have multiple managers. Or a relationship between a person and an event wherein the person directs or organizes the event. Example: training coordinator.
16. Member of- Relationship between a person and an organization or group wherein the person has a direct relationship, affiliation, or status with that organization or group.
17. Occupier of- Relationship between entities wherein one maintains control over the other in location.
18. Organizational Leader of- Relationship between a person/organization and a non-political organization wherein one contributes to the direction of the other. There may be multiple organizational leaders of the same organization.
19. Owner of- Relationship between a person/organization wherein one owns through monetary means the organization. There may be multiple owners of the same organization.
20. Participated In- Relationship between a person and an organization wherein the person or organization participated in an event. Example: a peace negotiation where the negotiation itself is coded as an event, and the negotiating parties are participants of the event.
21. Political Leader of- Relationship between a person and an organization/person wherein one guides the political actions of the other(s).
22. Provider of- Relationship wherein an entity (person, organization, location) contributes specific support in the form of tangible goods to another entity. Example: a person which provides a safe haven for another at his house.
23. Related to- A relationship between two persons wherein one is related to the other either through marriage or blood.
24. Religious Leader of/Follower of- Relationship between a person/organization and a religious organization wherein one contributes to the direction of or the membership of the other. There may be multiple religious leaders of the same organization.
25. Student of/Teacher of- Relationship wherein an entity (person, organization, or location) contributes to the education/training of another entity (or vice versa).

71
26. Supporter of- Relationship wherein an entity (person, organization, location) contributes intangible support to another entity. Example: a political organization which officially recognizes or acknowledges another entity. Differs from contributor of because no tangible items are exchanged.
27. Victim of- Relationship between person, organization, or event entities wherein one is taken advantage of by the other. Example: a person killed by a raid is the ‘victim of’ that raid.
28. Visitor of- Relationship between a person and a location/organization wherein one often visits the location of the other.
Properties: 1. AKA- Also Known As names associated with an entity. Aliases. 2. Ethnicity- Represents the state of belonging to a group that shares common national
and cultural traditions. 3. Nationality- Represents the status of belonging to a particular nation. 4. Skills- An art, trade, talent, or ability that a person may poses. 5. Sect- Represents a group of people with different religious beliefs than the group to
which they belong. Tribal or clan affiliation of an individual. 6. Status- The current known standing of a person; alive, dead, captured, free. 7. String- A series of similar or related acts, events, items, or sets of objects that need to
be associated in order to facilitate searches of entities for analysis. A location to enter keywords.

72
THIS PAGE INTENTIONALLY LEFT BLANK

73
APPENDIX B. MINDANAO PROJECT DATABASE
Software Software: Palantir 2.0 Google Earth: 4.0.2742; Built March 13, 2007; Microsoft Windows XP (Service Pack 3) Database in Numbers (At the time of publication) Documents in Data Repository: 18 Total Entities: 139
Persons: 77 Locations: 19 Organizations: 42
Terrorist: 14 Political: 10 Commercial: 5 Academic: 4 Organization: 4 Charity: 2
Military: 2 Criminal: 1 Law Enforcement: 1
Events: 46 Raid: 14
Bombing: 9 Meeting: 2 Payment: 2 Sighting: 1 Attempted Attack: 1
Total Links: 411 Documents Utilized Aguirre, Alexander P., “Insurgency and Terrorism in the Philippines: Strategies and
Counter-Measures,” paper prepared for lecture-presentation at the U.S. Pacific Command Multi-lateral Interagency Cooperation Symposium, Bangkok, Thailand, 17-20 September 2007.
Chalk, Peter and Carl Ungerer, “Neighbourhood Watch: The evolving terrorist threat in Southeast Asia,” Australian Strategic Policy Institute (ASPI), Australia, June 2008.
Concepcion, Sylvia, Larry Digal, Rufa Guiam, Romulo De La Rosa, and Mara Stankovitch, “Breaking the links between economics and conflict in Mindanao,” discussion paper presented at the ‘Waging Peace’ conference, Manila, December 2003.

74
CRS Report for Congress “Abu Sayyaf: Target of Philippine-U.S. Anti-Terrorism Cooperation,” Congressional Research Service, Library of Congress, 20 January 2006.
Dominguez, Paul G., “Brunei Darussalam Indonesia Malaysia Philippines East Asian Growth Area (BIMP-EAGA),” Mindanao Economic Development Council Philippines, Asian Review of Public Administration.
Ellorin, BenCyrus G., “Degradation of natural resources creates conflict and how people are coping to reverse the trend,” paper presented at the Regional Workshop on Land Issues in Asia, Cambodia, 4-6 June 2002.
Gross, Max L., “A Muslim Archipelago: Islam and Politics in Southeast Asia,” Center for Strategic Intelligence Research, National Defense Intelligence College Press, Washington, DC, March 2007.
International Crisis Group (ICG), “The Philippines: Counter-insurgency vs. counter-terrorism in Mindanao,” Asia report No. 152, 14 May 2008.
International Crisis Group (ICG), “Southern Philippines backgrounder: Terrorism and the peace process,” Asia report No. 80, 13 July 2004.
Judd, Mary, “Social Assessment of Conflict Affected Communities in Mindanao,” Environment and Social Development Unit, East Asia and Pacific Region, World Bank Office, Manila, Philippines, March 2003.
Malapit, Hazel Jean L., Tina S. Clemente, and Cristina Yunzal, “Does Violent Conflict Make Chronic Poverty More likely? The Mindanao Experience,” paper presented at the conference ‘Staying Poor: Chronic Poverty and Development Policy,’ University of Manchester, 7-9 April 2003.
“Mapping Philippine Vulnerability to Environmental Disasters,” http://www.observatory.ph/vm/summary.html, accessed 9 May 2008.
“Mindanao in Figures,” Mindanao Economic Development Council (MEDCO), http://www.medco.gov.ph/medcoweb/mindanao.asp, accessed 23 June 2008.
Niksch, Larry, “Abu Sayyaf: Target of Philippine-U.S. Anti-Terrorism Cooperation,” CRS Report for Congress, Congressional Research Service, Library of Congress, January 20, 2006.
Russell, Linda Davide-Ong, April Rica Gonzalez, Rey Ty, Nagasura T. Madale, and Noemi A. Medina, “The Mindanao conflict and prospects for peace in the southern Philippines,” excepted from Mindanao: A Perspective on Youth, Inter-Ethnic Dialouge and Conflict Resolution in the Southern Philippines, Center for Southeast Asian Studies and Office of International Training, Northern Illinois University, DeKalb, Illinois, 2004.

75
Tuminez, Astrid S., “The Past is Always Present: The Moros of Mindanao and the Quest for Peace,” Southeast Asia Research Centre, Working Paper Series No. 99, City University, Hong Kong, May 2008.
Tuminez, Astrid S., “This Land is Our Land: Moro Ancestral Domain and its Implications for Peace and Development in the Southern Philippines,” SAIS Review, The Johns Hopkins University Press, Vol. XXVII, No. 2, Summer-Fall 2007.

76
THIS PAGE INTENTIONALLY LEFT BLANK

77
LIST OF REFERENCES
Armed Conflicts Report, “Philippines CPP/NPA,” January 2008, http://www.ploughshares.ca.libraries (accessed July 22, 2008).
Combating Terrorism Center, “Sinjar Records,” Palantir, 2008, www.sinjarrecords.com
(accessed August 5, 2008). Concepcion, Sylvia, and others, “Breaking the Links Between Economics and Conflict in
Mindanao,” lecture presented at the “Waging Peace” conference, Manila, Philippines, December 2003.
Council on Foreign Relations, “Abu Sayyaf Group,” Philippines, Islamist Separatists,
June 25, 2008, http://www.cfr.org (accessed July 17, 2008). FAS Intelligence Resource Program, “New People’s Army (NPA),” http://www.fas.org
(accessed July 22, 2008). Global Security.org, “Intel Systems,” April 26, 2005,
http://www.globalsecurity.org/intell/systems/asas.htm (accessed August 4, 2008). Google Earth, “Google Earth,” 2008, www.earth.google.com (accessed September 23,
2008). Hanneman, Robert A., and Mark Riddle, “Introduction to Social Network Methods,”
University of California, Riverside, 2005 (published in digital form at http://faculty.ucr.edu/~hanneman/).
Hayase, Shinzo, “Mindanao Ethnohistory Beyond Nations: Maguindanao, Sangir, and
Bagabo Societies in East Maritime Southeast Asia,” translated by Dr. Motoe Terami-Wada, Ateneo de Manila University Press, Quezon City, Philippine: 2007.
International Crisis Group (ICG), Southern Philippines Backgrounder: Terrorism and the
Peace Process, ICG Asia Report No. 80, July 13, 2004. Malapit, Hazel Jean L., and others, “Does Violent Conflict Make Chronic Poverty More
Likely? The Mindanao Experience,” paper presented at the conference “Staying Poor: Chronic Poverty and Development Policy” held at the University of Manchester, England April 7-9, 2003.
Mindanao, “History,” http://www.philippines.hvu.nl (accessed 11 July 11, 2008).

78
Perry Walter L., and John Gordon IV, Analytic Support to Intelligence in Counter Insurgencies, National Defense Research Institute, RAND Corporation, Santa Monica, CA: RAND Corporation, 2008.
Roberts, Nancy C., "Data Layering and Data Fusion in the Analysis of Dark Networks,"
Naval Postgraduate School, Dept. of Defense Analysis, Montery, CA: NPS, 2008. Rollins, John, Fusion Centers: Issues and Options for Congress, Congressional Research
Service, 2008. Russell Susan D., and others, Susan D., “The Mindanao Conflict and Prospects for Peace
in the Southern Philippines,” excerpted from “Mindanao: A Perspective on Youth, Inter-Ethnic Dialogue and Conflict Resolution In the Southern Philippines,” Center for Southeast Asian Studies and Office of International Training, Northern Illinois University, IL: 2004.
The 9/11 Commission Report: Final Report of the National Commission of Terrorist
Attacks Upon the United States, New York: WW Norton & Company, 2004. Thomas James J. and Kristen A. Cook, "Illuminating the Path," National Visualization
and Analytics Center, 2005. Tuminez, Astrid S., “The Past is Always Present: The Moros of Mindanao and the Quest
for Peace,” Working Paper No. 99 for the Southeast Asia Research Center Management Committee, City University of Hong Kong: May 2008.

79
BIBLIOGRAPHY
Aguirre, Alexander P., “Insurgency and Terrorism in the Philippines: Strategies and Counter-Measures,” paper prepared for lecture-presentation at the U.S. Pacific Command Multi-lateral Interagency Cooperation Symposium, Bangkok, Thailand, 17-20 September 2007.
Armed Conflicts Report, “Philippines CPP/NPA,” January 2008,
http://www.ploughshares.ca.libraries (accessed July 22, 2008). Chalk, Peter and Carl Ungerer, “Neighbourhood Watch: The evolving terrorist threat in
Southeast Asia,” Australian Strategic Policy Institute (ASPI), Australia, June 2008.
Combating Terrorism Center, “Sinjar Records,” Palantir, 2008, www.sinjarrecords.com
(accessed August 5, 2008). Concepcion, Sylvia, Larry Digal, Rufa Guiam, Romulo De La Rosa, and Mara
Stankovitch, “Breaking the Links Between Economics and Conflict in Mindanao,” lecture presented at the “Waging Peace” conference, Manila, Philippines, December 2003.
Council on Foreign Relations, “Abu Sayyaf Group,” Philippines, Islamist Separatists,
June 25, 2008, http://www.cfr.org (accessed July 17, 2008). Creswell, John W., “Research Design: Qualitative, Quantitative, and Mixed Methods
Approaches,” 2nd Edition, Thousand Oaks, California: Sage Publications, 2003. CRS Report for Congress “Abu Sayyaf: Target of Philippine-U.S. Anti-Terrorism
Cooperation,” Congressional Research Service, Library of Congress, 20 January 2006.
Dominguez, Paul G., “Brunei Darussalam Indonesia Malaysia Philippines East Asian
Growth Area (BIMP-EAGA),” Mindanao Economic Development Council Philippines, Asian Review of Public Administration.
Ellorin, BenCyrus G., “Degradation of natural resources creates conflict and how people
are coping to reverse the trend,” paper presented at the Regional Workshop on Land Issues in Asia, Cambodia, June 4-6, 2002.
FAS Intelligence Resource Program, “New People’s Army (NPA),” http://www.fas.org
(accessed July 22, 2008).

80
Global Security.org, “Intel Systems,” April 26, 2005, http://www.globalsecurity.org/intell/systems/asas.htm (accessed August 4, 2008).
Google Earth, “Google Earth,” 2008, www.earth.google.com (accessed September 23,
2008). Gross, Max L., “A Muslim Archipelago: Islam and Politics in Southeast Asia,” Center for
Strategic Intelligence Research, National Defense Intelligence College Press, Washington, DC, March 2007.
Hanneman, Robert A., and Mark Riddle, “Introduction to Social Network Methods,”
University of California, Riverside, 2005, (published in digital form at http://faculty.ucr.edu/~hanneman/).
Hayase, Shinzo, “Mindanao Ethnohistory Beyond Nations: Maguindanao, Sangir, and
Bagabo Societies in East Maritime Southeast Asia,” translated by Dr. Motoe Terami-Wada, Ateneo de Manila University Press, Quezon City, Philippine: 2007.
International Crisis Group (ICG), “The Philippines: Counter-insurgency vs. counter-
terrorism in Mindanao,” Asia report No. 152, May 14, 2008. International Crisis Group (ICG), “Southern Philippines backgrounder: Terrorism and the
peace process,” Asia report No. 80, July 13, 2004. Judd, Mary, “Social Assessment of Conflict Affected Communities in Mindanao,”
Environment and Social Development Unit, East Asia and Pacific Region, World Bank Office, Manila, Philippines, March 2003.
Malapit, Hazel Jean L., Tina S. Clemente, and Cristina Yunzal, “Does Violent Conflict
Make Chronic Poverty More Likely? The Mindanao Experience,” paper presented at the conference “Staying Poor: Chronic Poverty and Development Policy” held at the University of Manchester, England April 7-9, 2003.
Mapping Philippine Vulnerability to Environmental Disasters,
http://www.observatory.ph/vm/summary.html, accessed May 9, 2008. Mindanao, “History,” http://www.philippines.hvu.nl (accessed July 11, 2008). Mindanao in Figures, Mindanao Economic Development Council (MEDCO),
http://www.medco.gov.ph/medcoweb/mindanao.asp, accessed June 23, 2008. Niksch, Larry, “Abu Sayyaf: Target of Philippine-U.S. Anti-Terrorism Cooperation,”
CRS Report for Congress, Congressional Research Service, Library of Congress, January 20, 2006.

81
Perry Walter L., and John Gordon IV, Analytic Support to Intelligence in Counter Insurgencies, National Defense Research Institute, RAND Corporation, Santa Monica, CA: RAND Corporation, 2008.
Roberts, Nancy C., "Data Layering and Data Fusion in the Analysis of Dark Networks,"
Naval Postgraduate School, Dept. of Defense Analysis, Montery, CA: NPS, 2008. Rollins, John, Fusion Centers: Issues and Options for Congress, Congressional Research
Service, 2008. Russell, Linda Davide-Ong, April Rica Gonzalez, Rey Ty, Nagasura T. Madale, and
Noemi A. Medina, “The Mindanao conflict and prospects for peace in the southern Philippines,” excepted from Mindanao: A Perspective on Youth, Inter-Ethnic Dialouge and Conflict Resolution in the Southern Philippines, Center for Southeast Asian Studies and Office of International Training, Northern Illinois University, DeKalb, Illinois, 2004.
The 9/11 Commission Report: Final Report of the National Commission of Terrorist
Attacks Upon the United States, New York: WW Norton & Company, 2004. Thomas James J. and Kristen A. Cook, "Illuminating the Path," National Visualization
and Analytics Center, 2005. Treverton, Gregory F., and Bryan Gabbard C., “Assessing the Analysis of Intelligence
Tradecraft,” National Security Research Division, RAND, Santa Monica: RAND Corporation, 2008.
Tuminez, Astrid S., “The Past is Always Present: The Moros of Mindanao and the Quest
for Peace,” Southeast Asia Research Centre, Working Paper Series No. 99, City University, Hong Kong, May 2008.
Tuminez, Astrid S., “This Land is Our Land: Moro Ancestral Domain and its
Implications for Peace and Development in the Southern Philippines,” SAIS Review, The Johns Hopkins University Press, Vol. XXVII, No. 2, Summer-Fall 2007.

82
THIS PAGE INTENTIONALLY LEFT BLANK

83
INITIAL DISTRIBUTION LIST
1. Defense Technical Information Center Ft. Belvoir, Virginia
2. Dudley Knox Library Naval Postgraduate School Monterey, California
3. Joint Special Operations University Hurlburt AFB, Florida
4. Assistant Secretary of Defense, SOLIC Pentagon, Washington, D.C.
5. Special Operations Command, J-7
HQ, USSOCOM MacDill AFB, Florida
6. U. S. Special Operations Command Library
HQ, USSOCOM MacDill AFB, Florida