Data-Informed Decision-Making and the Identification of ... · the Identification of School...
31
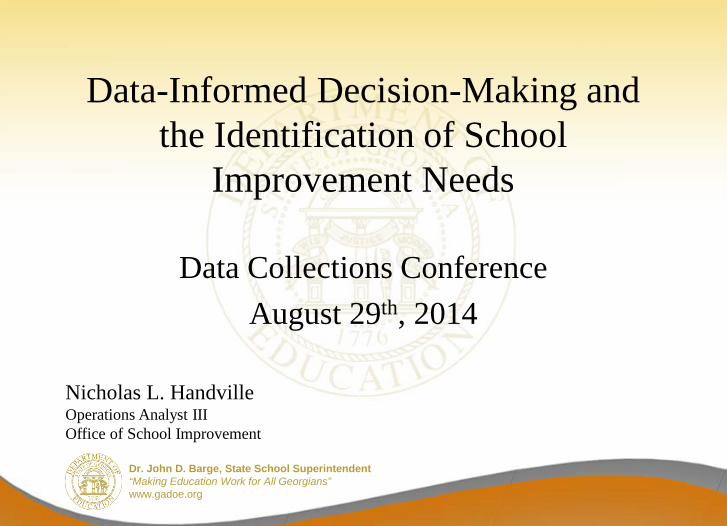
Dr. John D. Barge, State School Superintendent “Making Education Work for All Georgians” www.gadoe.org Data-Informed Decision-Making and the Identification of School Improvement Needs Nicholas L. Handville Operations Analyst III Office of School Improvement Data Collections Conference August 29 th , 2014
Transcript of Data-Informed Decision-Making and the Identification of ... · the Identification of School...
Dr. John D. Barge, State School Superintendent “Making Education Work for All Georgians” www.gadoe.org
Data-Informed Decision-Making and the Identification of School
Improvement Needs
Nicholas L. Handville Operations Analyst III Office of School Improvement
Data Collections Conference August 29th, 2014

Dr. John D. Barge, State School Superintendent “Making Education Work for All Georgians” www.gadoe.org
Dr. John D. Barge, State School Superintendent “Making Education Work for All Georgians” www.gadoe.org
Survey of the Room • Location
– State – District – School – Other
• Position Type – Leadership – Management – Data/research – School support staff – Other
• Level of Experience/ Knowledge with Data – Minimally experienced/
knowledgeable – Moderately experienced/
knowledgeable – Highly experienced/
knowledgeable
3
Dr. John D. Barge, State School Superintendent “Making Education Work for All Georgians” www.gadoe.org
Dr. John D. Barge, State School Superintendent “Making Education Work for All Georgians” www.gadoe.org
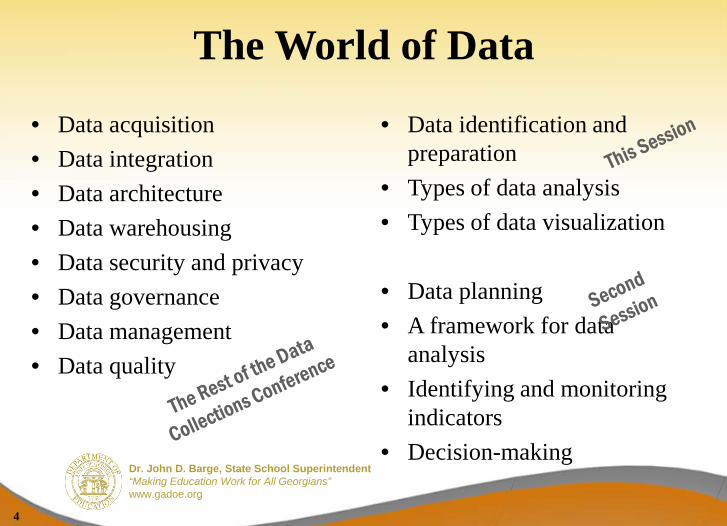
The World of Data
• Data acquisition • Data integration • Data architecture • Data warehousing • Data security and privacy • Data governance • Data management • Data quality
• Data identification and preparation
• Types of data analysis • Types of data visualization • Data planning • A framework for data
analysis • Identifying and monitoring
indicators • Decision-making
4
Dr. John D. Barge, State School Superintendent “Making Education Work for All Georgians” www.gadoe.org
Dr. John D. Barge, State School Superintendent “Making Education Work for All Georgians” www.gadoe.org
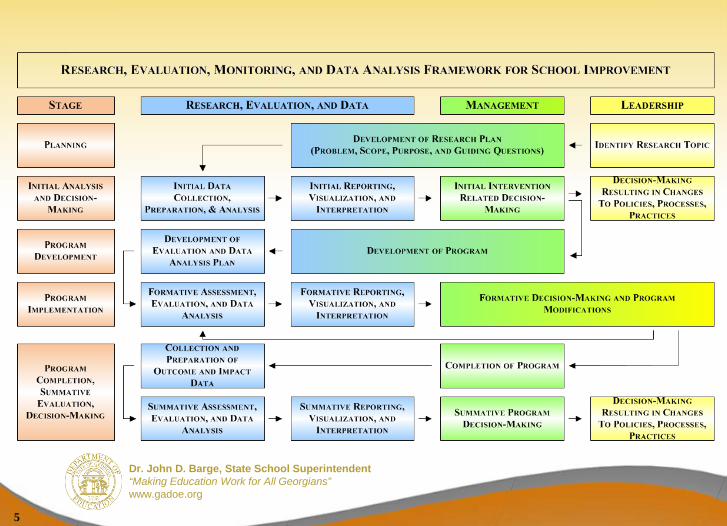
5
Dr. John D. Barge, State School Superintendent “Making Education Work for All Georgians” www.gadoe.org
DATA IDENTIFICATION & PREPARATION
Data Analysis for Beginners
6
Dr. John D. Barge, State School Superintendent “Making Education Work for All Georgians” www.gadoe.org
Dr. John D. Barge, State School Superintendent “Making Education Work for All Georgians” www.gadoe.org
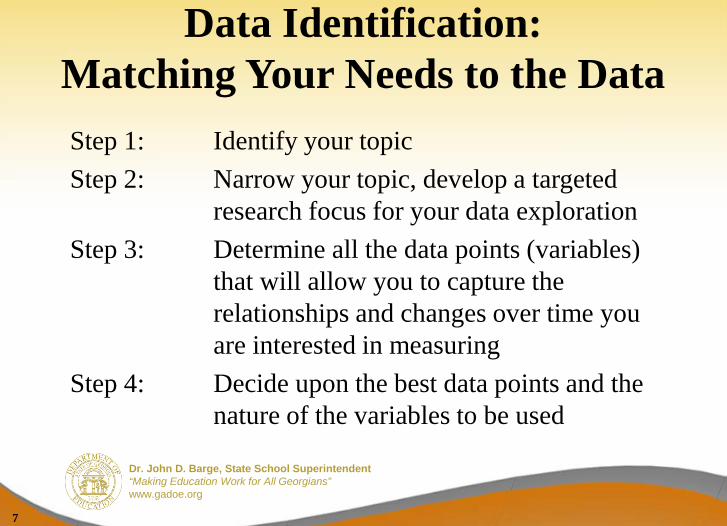
Data Identification: Matching Your Needs to the Data Step 1: Identify your topic Step 2: Narrow your topic, develop a targeted research focus for your data exploration Step 3: Determine all the data points (variables) that will allow you to capture the relationships and changes over time you are interested in measuring Step 4: Decide upon the best data points and the nature of the variables to be used
7
Dr. John D. Barge, State School Superintendent “Making Education Work for All Georgians” www.gadoe.org
Dr. John D. Barge, State School Superintendent “Making Education Work for All Georgians” www.gadoe.org
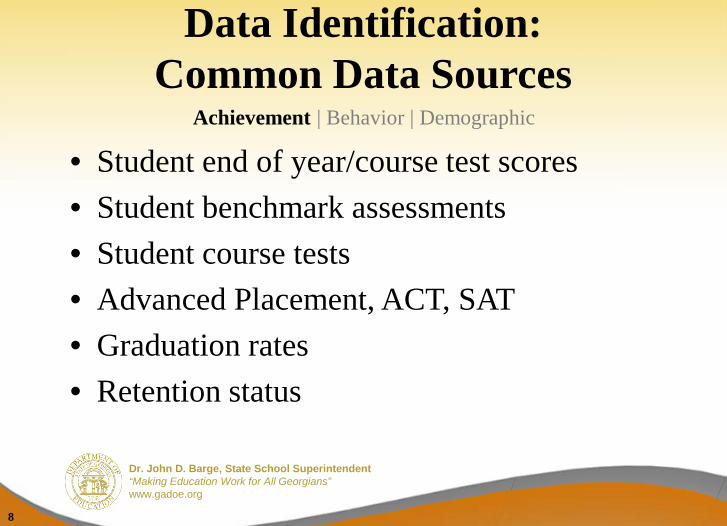
Data Identification: Common Data Sources
• Student end of year/course test scores • Student benchmark assessments • Student course tests • Advanced Placement, ACT, SAT • Graduation rates • Retention status
8
Achievement | Behavior | Demographic

Dr. John D. Barge, State School Superintendent “Making Education Work for All Georgians” www.gadoe.org
Dr. John D. Barge, State School Superintendent “Making Education Work for All Georgians” www.gadoe.org
Data Identification: Common Data Sources
• Attendance • Discipline
9
Achievement | Behavior | Demographic

Dr. John D. Barge, State School Superintendent “Making Education Work for All Georgians” www.gadoe.org
Dr. John D. Barge, State School Superintendent “Making Education Work for All Georgians” www.gadoe.org
Data Identification: Common Data Sources
• Race • Sex or gender • Socio-economic status (captured through free
and reduced-price meals) • English language learner • Zip codes
10
Achievement | Behavior | Demographic

Dr. John D. Barge, State School Superintendent “Making Education Work for All Georgians” www.gadoe.org
Dr. John D. Barge, State School Superintendent “Making Education Work for All Georgians” www.gadoe.org
Data Identification: Going Beyond Your SIS and the SLDS
Quantitative: • School-level data • Classroom-level data • Community data
11
Qualitative: • Students, parents,
teachers/staff – Attitudes – Perceptions – Engagement
• Community data

Dr. John D. Barge, State School Superintendent “Making Education Work for All Georgians” www.gadoe.org
Dr. John D. Barge, State School Superintendent “Making Education Work for All Georgians” www.gadoe.org
Data Collection & Preparation: Common Pitfalls to Avoid
• Assuming the data is clean • Excluding or including outliers • Ignoring context - context is very important!
12 Adapted from: Croll and Yoskovitz, 2013

Dr. John D. Barge, State School Superintendent “Making Education Work for All Georgians” www.gadoe.org
Dr. John D. Barge, State School Superintendent “Making Education Work for All Georgians” www.gadoe.org
Important Takeaway: Preparing and Cleaning Your Data
13
Cleaning and preparing your data may be tedious, but this process will save you the embarrassment of presenting inaccurate
results.

Dr. John D. Barge, State School Superintendent “Making Education Work for All Georgians” www.gadoe.org
TYPES OF DATA ANALYSIS Data Analysis for Beginners
14

Dr. John D. Barge, State School Superintendent “Making Education Work for All Georgians” www.gadoe.org
Dr. John D. Barge, State School Superintendent “Making Education Work for All Georgians” www.gadoe.org
Making Meaning from Data: What Can We Do With Data?
• Describe the basic characteristics of interest (What does the data tell us about the basic features of our group of interest?)
• Correlate relationships between data (What is the nature of the relationship between two variables?)
• Infer about a large group based on sample data (What does the data collected on 40 students in a school tell us about the school’s students as a whole?)
• Find Cause and Effect relationships (Does x cause y?)
15

Dr. John D. Barge, State School Superintendent “Making Education Work for All Georgians” www.gadoe.org
Dr. John D. Barge, State School Superintendent “Making Education Work for All Georgians” www.gadoe.org
Important Takeaway: Does Your Data Analysis Reflect
Reality?
16

Dr. John D. Barge, State School Superintendent “Making Education Work for All Georgians” www.gadoe.org
TYPES OF DATA VISUALIZATION
Data Analysis for Beginners
17

Dr. John D. Barge, State School Superintendent “Making Education Work for All Georgians” www.gadoe.org
Dr. John D. Barge, State School Superintendent “Making Education Work for All Georgians” www.gadoe.org
Data Visualization: Purpose and Goals
• To present more data than otherwise possible • To illustrate patterns that are not immediately apparent • To compare values or show changes over time • To make it possible to answer questions—even
questions you didn’t know you should be asking until you saw the pattern of the data in the visualization
Source: Stacey 2013 18

Dr. John D. Barge, State School Superintendent “Making Education Work for All Georgians” www.gadoe.org
Dr. John D. Barge, State School Superintendent “Making Education Work for All Georgians” www.gadoe.org
19
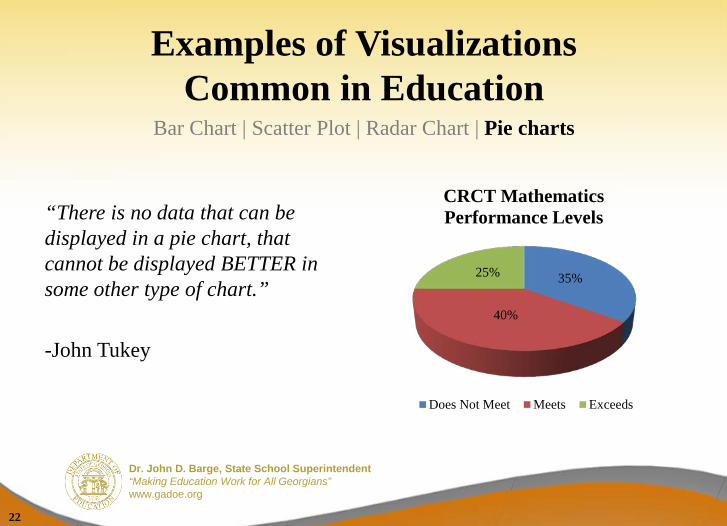
Examples of Visualizations Common in Education
Bar Chart | Scatter Plot | Radar Chart | Pie charts
• Good for comparing: – 1-3 groups across multiple
points in time – 1-3 groups at one point in time
across multiple measures on the same scale
• Only useful if you can segment all of the data into a few discrete groups
823.5 829.8 815.3
830.1 826.3 841.5
750
775
800
825
850
875
900
Math ELA
CRCT Comparison Scores
School District State

Dr. John D. Barge, State School Superintendent “Making Education Work for All Georgians” www.gadoe.org
Dr. John D. Barge, State School Superintendent “Making Education Work for All Georgians” www.gadoe.org
20
Examples of Visualizations Common in Education
Bar Chart | Scatter Plot | Radar Chart | Pie charts
• Good for comparing: – Two variables that are believed
to correlate with one another – Scores for a large number of
groups or individuals on two data points at one point in time
• Allows for each case to be visualized separately
• Provides a strong visual if relationship between variables is obvious 2.00
2.202.402.602.803.003.203.403.603.804.00
70 75 80 85 90 95 100
Attendance Rates and GPAs for a Math Class

Dr. John D. Barge, State School Superintendent “Making Education Work for All Georgians” www.gadoe.org
Dr. John D. Barge, State School Superintendent “Making Education Work for All Georgians” www.gadoe.org
21
Examples of Visualizations Common in Education
Bar Chart | Scatter Plot | Radar Chart | Pie charts
• Good for comparing: – 1-2 groups or individuals
across 3-6 categories on the same scale
– 1 individual or group to a district, state, or national average
• Not a good choice when there is little variation between compared values or across categories
842
835
825 829
805
839
845
840 835
821
Mathematics
EnglishLanguage Arts
ReadingScience
Social Studies
CRCT Scores for All Subjects
Student School Average
Dr. John D. Barge, State School Superintendent “Making Education Work for All Georgians” www.gadoe.org
Dr. John D. Barge, State School Superintendent “Making Education Work for All Georgians” www.gadoe.org
22
Examples of Visualizations Common in Education
Bar Chart | Scatter Plot | Radar Chart | Pie charts
“There is no data that can be displayed in a pie chart, that cannot be displayed BETTER in some other type of chart.” -John Tukey
35%
40%
25%
CRCT Mathematics Performance Levels
Does Not Meet Meets Exceeds

Dr. John D. Barge, State School Superintendent “Making Education Work for All Georgians” www.gadoe.org
Dr. John D. Barge, State School Superintendent “Making Education Work for All Georgians” www.gadoe.org
Choosing the Right Visualization
• Identifying the right visualization is not as easy as picking from a list of options in Excel.
• The right visualization can convey deeper insight than the numbers alone.
• The wrong visualization might confuse people, distort your message, or even convey the wrong message.
Adapted from: Stacey, 2013. 23

Dr. John D. Barge, State School Superintendent “Making Education Work for All Georgians” www.gadoe.org
Dr. John D. Barge, State School Superintendent “Making Education Work for All Georgians” www.gadoe.org
Important Takeaway: Don’t Use Pie Charts!
24
Dr. John D. Barge, State School Superintendent “Making Education Work for All Georgians” www.gadoe.org
Dr. John D. Barge, State School Superintendent “Making Education Work for All Georgians” www.gadoe.org
Data Can Be Powerful, Beautiful, and Fun
25
Source: The Joy of Stats, Presented by Hans Rosling, BBC4 Link

Dr. John D. Barge, State School Superintendent “Making Education Work for All Georgians” www.gadoe.org
Dr. John D. Barge, State School Superintendent “Making Education Work for All Georgians” www.gadoe.org
What Insights Can We Apply to Our Work in Education?
“I know having the data is not enough. I have to show the data in ways people both
enjoy and understand.”
-Hans Rosling
26

Dr. John D. Barge, State School Superintendent “Making Education Work for All Georgians” www.gadoe.org
Dr. John D. Barge, State School Superintendent “Making Education Work for All Georgians” www.gadoe.org
Important Takeaway: Working With Data is Like
Going to the Gym
27
Step 1. Start off with what you can do without hurting yourself
Step 2. Set goals for personal development and work at getting
a little better every day
Step 3. Enjoy the attention as others marvel at your results!
Dr. John D. Barge, State School Superintendent “Making Education Work for All Georgians” www.gadoe.org
Dr. John D. Barge, State School Superintendent “Making Education Work for All Georgians” www.gadoe.org
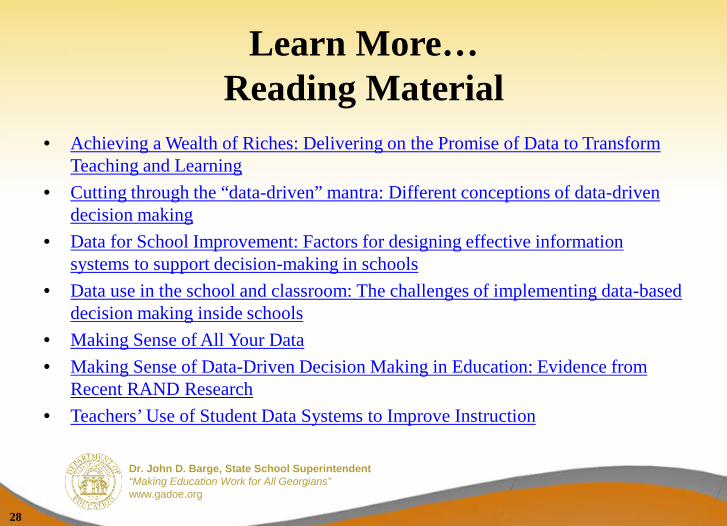
Learn More… Reading Material
• Achieving a Wealth of Riches: Delivering on the Promise of Data to Transform Teaching and Learning
• Cutting through the “data-driven” mantra: Different conceptions of data-driven decision making
• Data for School Improvement: Factors for designing effective information systems to support decision-making in schools
• Data use in the school and classroom: The challenges of implementing data-based decision making inside schools
• Making Sense of All Your Data • Making Sense of Data-Driven Decision Making in Education: Evidence from
Recent RAND Research • Teachers’ Use of Student Data Systems to Improve Instruction
28
Dr. John D. Barge, State School Superintendent “Making Education Work for All Georgians” www.gadoe.org
Dr. John D. Barge, State School Superintendent “Making Education Work for All Georgians” www.gadoe.org
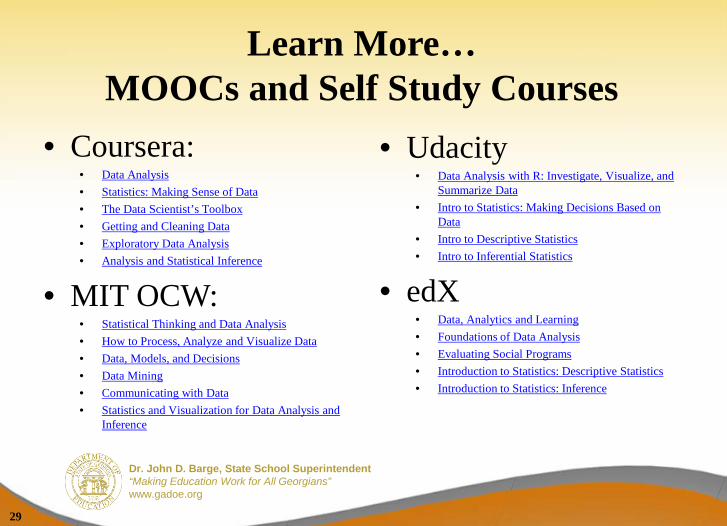
Learn More… MOOCs and Self Study Courses
• Coursera: • Data Analysis • Statistics: Making Sense of Data • The Data Scientist’s Toolbox • Getting and Cleaning Data • Exploratory Data Analysis • Analysis and Statistical Inference
• MIT OCW: • Statistical Thinking and Data Analysis • How to Process, Analyze and Visualize Data • Data, Models, and Decisions • Data Mining • Communicating with Data • Statistics and Visualization for Data Analysis and
Inference
• Udacity • Data Analysis with R: Investigate, Visualize, and
Summarize Data • Intro to Statistics: Making Decisions Based on
Data • Intro to Descriptive Statistics • Intro to Inferential Statistics
• edX • Data, Analytics and Learning • Foundations of Data Analysis • Evaluating Social Programs • Introduction to Statistics: Descriptive Statistics • Introduction to Statistics: Inference
29
Dr. John D. Barge, State School Superintendent “Making Education Work for All Georgians” www.gadoe.org
Dr. John D. Barge, State School Superintendent “Making Education Work for All Georgians” www.gadoe.org
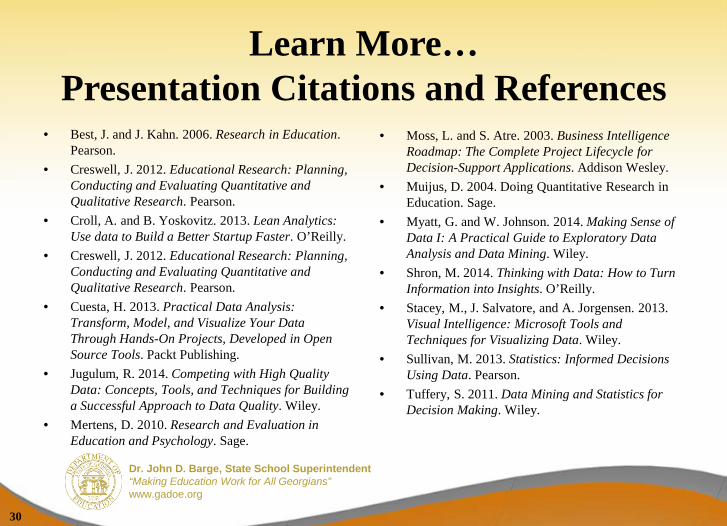
Learn More… Presentation Citations and References
• Best, J. and J. Kahn. 2006. Research in Education. Pearson.
• Creswell, J. 2012. Educational Research: Planning, Conducting and Evaluating Quantitative and Qualitative Research. Pearson.
• Croll, A. and B. Yoskovitz. 2013. Lean Analytics: Use data to Build a Better Startup Faster. O’Reilly.
• Creswell, J. 2012. Educational Research: Planning, Conducting and Evaluating Quantitative and Qualitative Research. Pearson.
• Cuesta, H. 2013. Practical Data Analysis: Transform, Model, and Visualize Your Data Through Hands-On Projects, Developed in Open Source Tools. Packt Publishing.
• Jugulum, R. 2014. Competing with High Quality Data: Concepts, Tools, and Techniques for Building a Successful Approach to Data Quality. Wiley.
• Mertens, D. 2010. Research and Evaluation in Education and Psychology. Sage.
• Moss, L. and S. Atre. 2003. Business Intelligence Roadmap: The Complete Project Lifecycle for Decision-Support Applications. Addison Wesley.
• Muijus, D. 2004. Doing Quantitative Research in Education. Sage.
• Myatt, G. and W. Johnson. 2014. Making Sense of Data I: A Practical Guide to Exploratory Data Analysis and Data Mining. Wiley.
• Shron, M. 2014. Thinking with Data: How to Turn Information into Insights. O’Reilly.
• Stacey, M., J. Salvatore, and A. Jorgensen. 2013. Visual Intelligence: Microsoft Tools and Techniques for Visualizing Data. Wiley.
• Sullivan, M. 2013. Statistics: Informed Decisions Using Data. Pearson.
• Tuffery, S. 2011. Data Mining and Statistics for Decision Making. Wiley.
30

Dr. John D. Barge, State School Superintendent “Making Education Work for All Georgians” www.gadoe.org
Dr. John D. Barge, State School Superintendent “Making Education Work for All Georgians” www.gadoe.org
Contact Information
Nicholas L. Handville Operations Analyst III
Office of School Improvement Georgia Department of Education
1854 Twin Towers East 205 Jesse Hill Jr. Drive, SE
Atlanta, Georgia 30334
Office: (404) 657-9864 [email protected]
www.doe.k12.ga.us
31