DATA GATHERING AND ANALYSIS - Faculty of …taminmn/pdf-files/ULP 0010.pdf · · 2009-05-15DATA...
69
DATA GATHERING AND ANALYSIS MOHD NASIR BIN TAMIN (Ph.D. Mechanical Engineering and Applied Mechanics) Professor Department of Applied Mechanics 1 Department of Applied Mechanics Faculty of Mechanical Engineering, UTM ULP 0010 - Research Methodology 29 th January 2009
Transcript of DATA GATHERING AND ANALYSIS - Faculty of …taminmn/pdf-files/ULP 0010.pdf · · 2009-05-15DATA...

DATA GATHERING AND ANALYSIS
MOHD NASIR BIN TAMIN(Ph.D. Mechanical Engineering and Applied Mechanics)
ProfessorDepartment of Applied Mechanics
1
Department of Applied MechanicsFaculty of Mechanical Engineering, UTM
ULP 0010 - Research Methodology
29th January 2009

RESEARCH – a process
Identify researcharea
Literature review
ProblemIdentification
Theoretical
2
TheoreticalFramework
MethodologyResearch Design
Data Collection & Analysis
Conclusions

A COURSE ON RESEARCH METHODOLOGY- A Typical Outline
Philosophy and Overview of Research
Literature Review
Problem Formulation
Research Design
Data Gathering, Instrumentation and Measurement
3
Data Gathering, Instrumentation and Measurement
Sampling
Techniques of Data Analysis
Academic Writing
Thesis Presentation

OBJECTIVES
To identify methods and techniques in gatheringexperimental data.
To describe issues related to the working principles of devices associated with instrumentation.
To illustrate the principles and procedures involved in sampling and measuringphysical quantities.
4
in sampling and measuringphysical quantities.
To review general considerations in analysisof experimental data.
To illustrate the use of statistical techniques and physical reasoning in describing, analyzingand comparing experimental data.

Data Gathering Instrumentation
Measurement
Sampling
OUTLINE
Data Analysis
5
Servo-hydraulic universal testing machine with furnace for high-temperature test.
Data Analysis
Types and nature of measured data
Considerations in data analysis
Statistical considerations
Regression analysis
The physical aspects of measured data

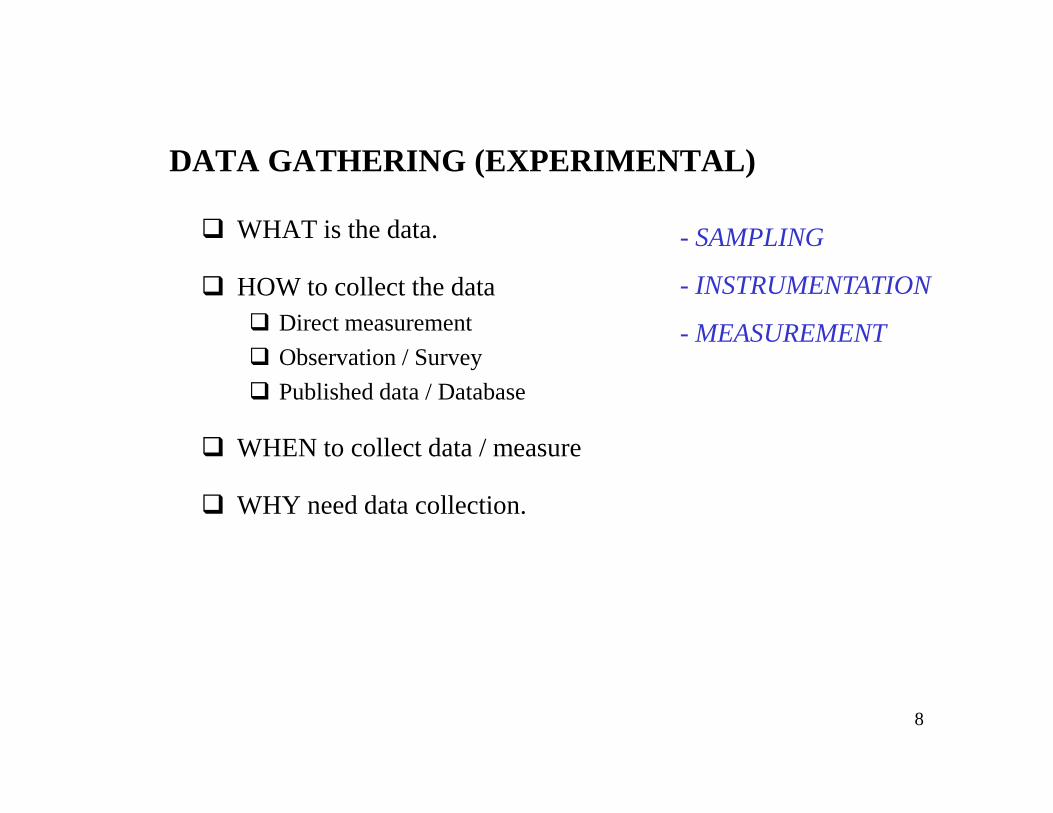
DATA GATHERING (EXPERIMENTAL)
Activities of acquiring (measuring, observing, surveying) physical quantities of selected samples employing specific technique and instrument.
6
Collecting published data.

Material: AISI 4340 SteelEXAMPLE 1 - MECHANICAL (TENSION) TEST
PTHE MACHINE / INSTRUMENT
7
P
Lo+∆LLo
Ao
Elongation, ∆L (in.)
Load
, P(lb
f)
THE SAMPLE
THE MEASUREMENTS
DATA GATHERING (EXPERIMENTAL)
WHAT is the data.
HOW to collect the data Direct measurement
Observation / Survey
Published data / Database
- SAMPLING
- INSTRUMENTATION
- MEASUREMENT
8
WHEN to collect data / measure
WHY need data collection.

Force
Indenter
SampleIndentation
EXAMPLE 2 – INDENTATION HARDNESS TEST
Data Gathering Instrumentation
Measurement
Sampling
9
OBJECTIVE
To determine the hardness number for a material by measurements of surface indention

INSTRUMENTATION
Working/ Test Principle
Machine/ System Characteristics
Calibration
10Micro-hardness tester

TEST PRINCIPLE
Hardness is determined by forcing a hardened indentor under a known load into the surface of a material and measuring the size of the indentation left after the test.
Select a suitable indentor
Apply known force(1 to 1000g)
Measure size of indentafter load removal
BRINELL HARDNESS TEST
11
indentor
eg. 10-mm sphere
(1 to 1000g) after load removal
dD
Smaller indent reflectsgreater hardness
−=
2d2D-DDπ
P2BHN
d2
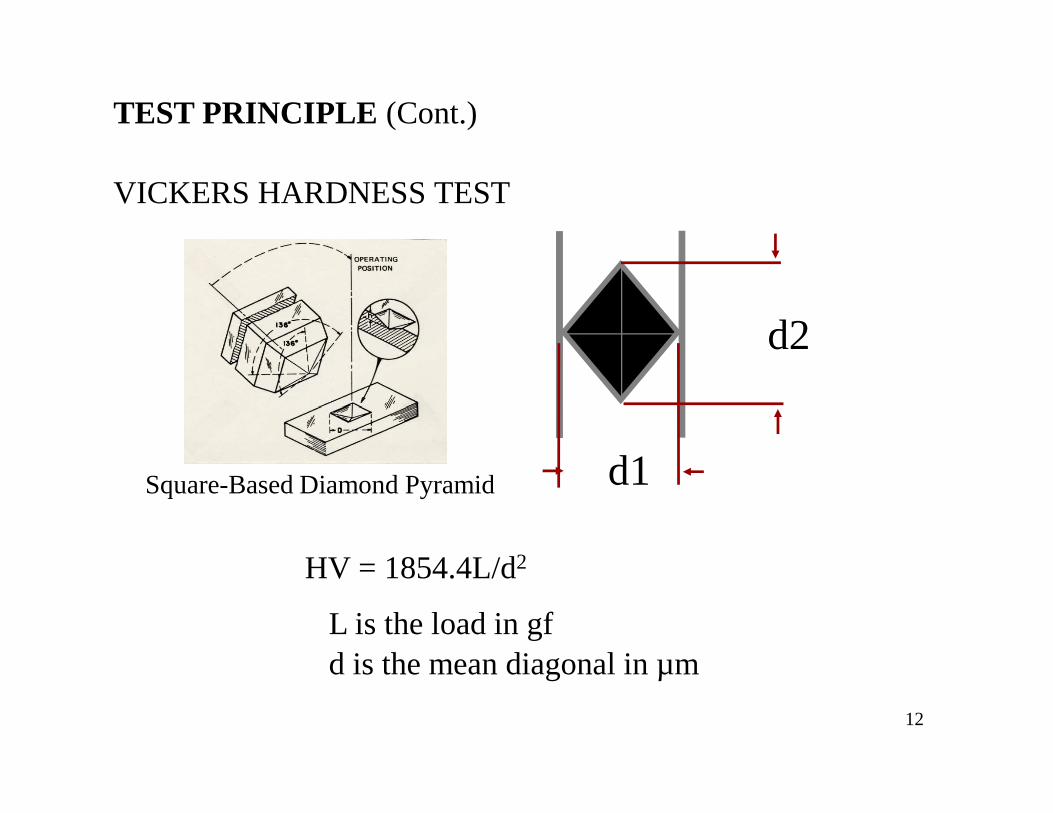
VICKERS HARDNESS TEST
TEST PRINCIPLE (Cont.)
12
Square-Based Diamond Pyramid d1
HV = 1854.4L/d2
L is the load in gfd is the mean diagonal in µm

MACHINE / SYSTEM CHARACTERISTICS
Repeatability and Reproducibility
Sensitivity
Zero-setting
Shake-down
13
Shake-down
Automatic features
SAFETY
REPEATABILITY(Hardness Test)
For each standardized block, let d1, d2 ..., d5 be the diagonal lengths of the indentations, arranged in increasing order of magnitude.
14
The repeatability of the machine is expressed by the quantity (d5 - d1)/ davg, where davg is the average of d1
to d5.

REPEATABILITY
Ability of the measuring instrument to produce identical readings repeatedly.
Hardness Test
15

SENSITIVITY
When a small increment of input (excitation) causes a large change in the response (read-out) of the instrument.
600
16Terikan
0.0 0.1 0.2 0.3 0.4 0.5
Teg
asan
( M
Pa)
0
200
400
Ujikaji AUjikaji B
E = 200x103 MPaRequires sensitive strain measuring device

BUILT-IN SYSTEM RESPONSE
17
440C at 62.7 HRC

Universal testing machine
Load cell
ZERO-SETTING
FORCE DISP.
18
Specimen
Load cell
Specimen grips
Crosshead
Data acquisition system
Extensometer

SHAKE-DOWN
Application of repetitive small load magnitude to set-in the load train and avoid lag or back-lash.
19

AUTOMATIC FEATURES
On-line data processing software provides a quick glance of the quality of collected test data.
20

SAFETY
The operator (YOU)
People around test set-up
Machine and devices
While Working in the Lab:
21
Close Calls
1
10
600
30
Disabling injury
Minor injuries
Property damage incidents
Report all:
Accidents
Injuries
Fires
Spills
Close calls
Adopted from W. Wood, McGill University

CALIBRATION
Setting/ tuning of measuring devices so as to output actual/ true quantity being measured.
0.3
0.35
0.4
0.45
Ap
plie
d S
trai
n (
mm
/mm
) [R
ead
ing
s fr
om
mic
rom
eter
]
Tru
e/ r
efer
ence
d q
uan
tity
22
Extensometer calibration curve for Instron 4206+8801Gauge Length = 25 mm
Travel Length = 12.5 mm22-02-2006
0
0.05
0.1
0.15
0.2
0.25
0.3
0 0.05 0.1 0.15 0.2 0.25 0.3 0.35 0.4 0.45
Measured Strain (mm/mm) [readings from console/PC]
Ap
plie
d S
trai
n (
mm
/mm
) [R
ead
ing
s fr
om
mic
rom
eter
]
MeasuredStrain (Instron 8801)
MeasuredStrain (Instron 4206)
Measured quantity
Tru
e/ r
efer
ence
d q
uan
tity

What and How to measure
How many measurements are sufficient
Accuracy, Precision and Bias
Uncertainty
MEASUREMENT
23
Error
Data Gathering Instrumentation
Measurement
Sampling

Square-Based Diamond Pyramid d1
d2
MEASUREMENT – VICKERS HARDNESS, HV
24
Square-Based Diamond Pyramid d1
HV = 1854.4L/d2
L is the load in gfd is the mean diagonal in µm

HOW TO MEASURE
(MEASUREMENT OF LENGTH)
25
Learn how to read vernier sacles, dial gages and estimate of uncertainties.
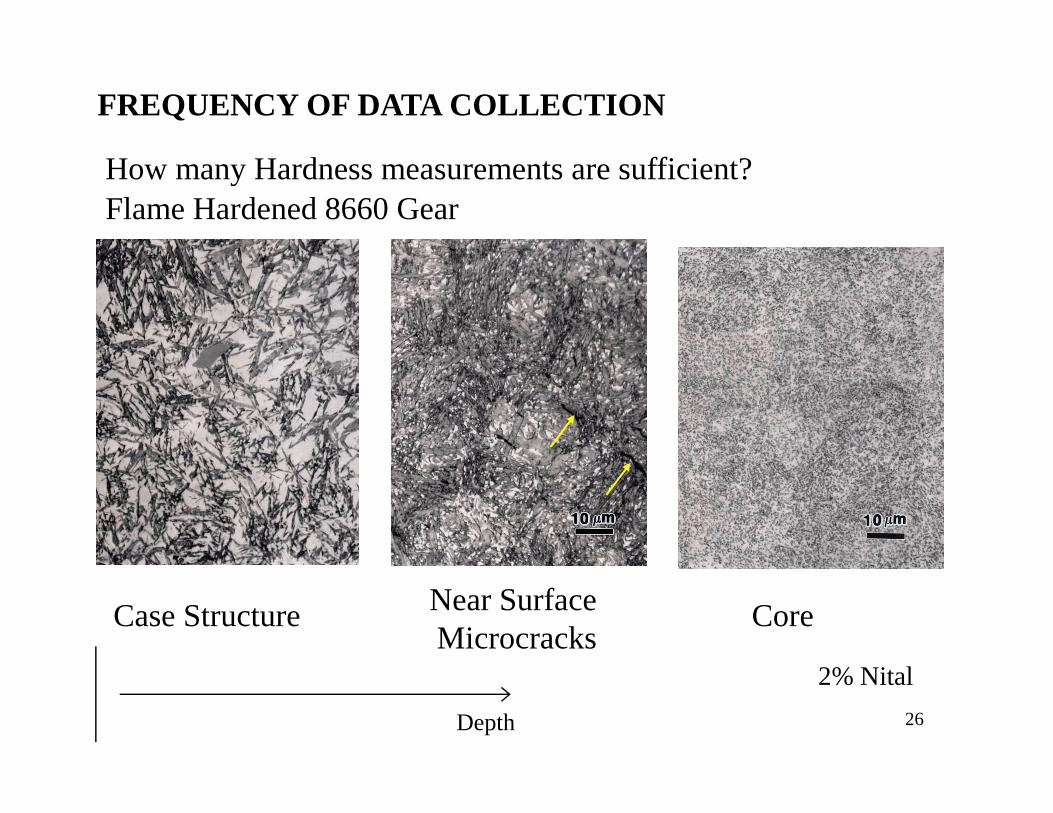
Flame Hardened 8660 Gear
FREQUENCY OF DATA COLLECTION
How many Hardness measurements are sufficient?
26
Near SurfaceMicrocracks
Case Structure Core
2% Nital
Depth

Automated MHT HV Traverse FREQUENCY OF DATA COLLECTION
27Flame Hardened 8660 Alloy Steel Gear

Accuracy – the degree to which the measurements deviate from the true value.
Precision – ability to give
Accuracy
ACCURACY, PRECISION AND BIAS
28
Precision – ability to give multiple estimates that are near to each other.
Bias - a systematic deviation of values from the true value.
Precisio
n

Instrument Factors
(Hardness Test)
Accuracy of applied load Inertia effects, speed of loading Lateral indenter movement
FACTORS AFFECTING PRECISION AND BIAS
29
Lateral indenter movement Indentation time Indenter shape deviations Damage to the indenter (plus films) Insufficient spacing between indents and from edges

Measurement Factors
(Hardness Test)
Calibration of measurement system Resolution of the optics Magnification
FACTORS AFFECTING PRECISION AND BIAS
30
Magnification Operator bias in sizing indents Inadequate image quality Non-uniform illumination
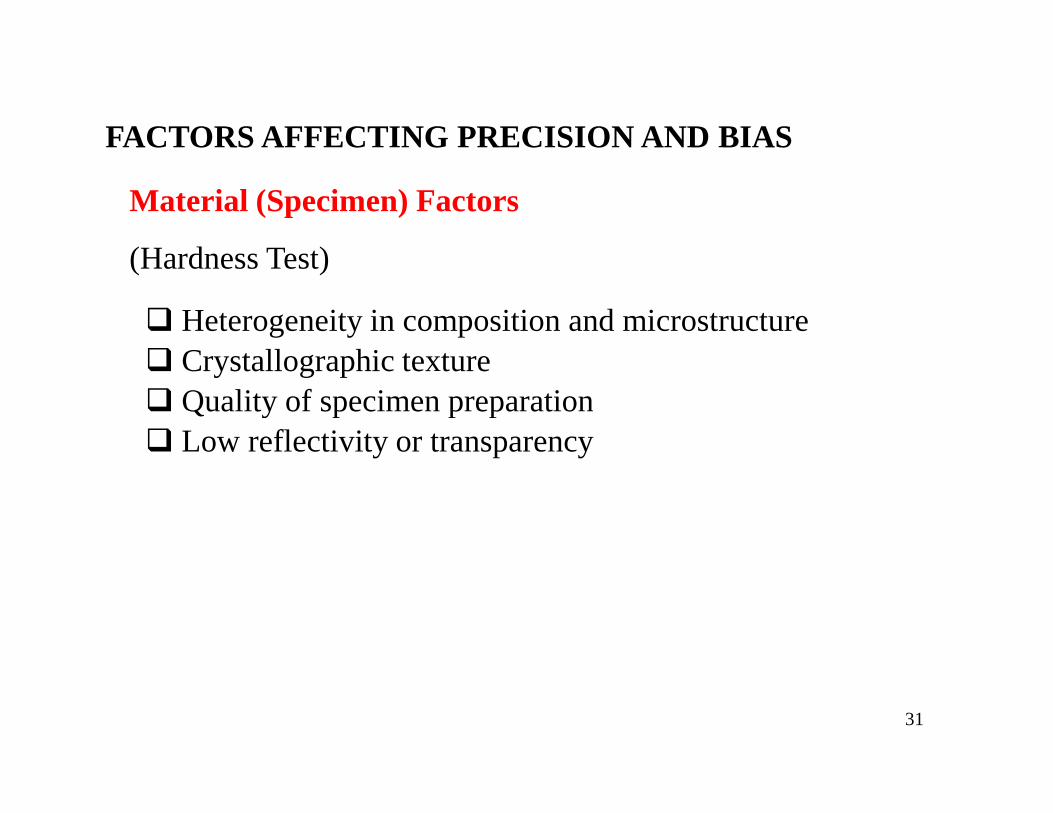
Material (Specimen) Factors
(Hardness Test)
Heterogeneity in composition and microstructure Crystallographic texture Quality of specimen preparation
FACTORS AFFECTING PRECISION AND BIAS
31
Quality of specimen preparation Low reflectivity or transparency

UNCERTAINTY ESTIMATION
Report: Pressure, p = 100 kN/m2 ± 1 kN/m2
For a set of n experimental measurements x1, x2, x3,…,xn
with uncertainty w1, w2, w3,…,wn
The uncertainty, w , in the desired result, R = R(x, x , x ,…,x) is
32
The uncertainty, wR, in the desired result, R = R(x1, x2, x3,…,xn) is
2/122
22
2
11
...
∂∂++
∂∂+
∂∂= n
nR w
x
Rw
x
Rw
x
Rw
Ref: Kline, S.J. and F.A. McClintock, “Describing Uncertainties in Single-Sample Experiment”, Mech. Eng., pp. 3, Jan. 1953

Example 3:
The resistance of a certain size of copper wire is given as:
R = Ro [1 + α (T – 20)]
Where
33
Ro = 6Ω ± 0.3 pct. at 20 oC
α = 0.004 /oC ± 1 pct.
T = 30 oC ± 1 oC
Calculate the resistance of the wire and its uncertainty

Solution 3:Nominal value of the resistance:
R = Ro [1 + α (T – 20)] = 6 [1 + (0.004) (30 – 20)] = 6.24 ΩUncertainties:
= 1 + α (T – 20) = 1 + (0.004) (30-20) = 1.04
= Ro (T-20) = 6 (30-20) = 60
oR
R
∂∂
α∂∂R
34
= Ro α = 6 (0.004) = 0,024
α∂
oR
R
∂∂
wRo = 6 (0.003) = 0.018 Ω
wα = (0.004) (0.01) = 4x10⁻⁵ /oC
wT = 1 oC
wR = [(1.04)2 (0.018)2 + (60)2 (4x10⁻⁵)2 + (0.024)2 (1)2 ] 1/2 = 0.0305 Ω or 0.49 pct.

ERROR(Hardness Test)
• The error of the machine is expressed by the quantity dstd - davg, where davg is the average of the indentation diagonals and dstd is the value provided on the test block certification.
35
provided on the test block certification.
• The average observed diagonal shall not differ from the certificate diagonal by more than 2% or 0.5 µm, whichever is greater.

INACCURACY OF MEASUREMENTS
Instrument Calibration
Instrument Reproducibility
The purpose of measurements is to describe some physical properties of an object / material / system quantitatively
Sources of Error
36
Instrument Reproducibility
Measuring arrangement
Work piece
Environmental Conditions
Observer’s Skill

SCATTER OF MEASURED DATA
37

SCATTER OF EXPERIMENTAL DATA
We should be able to handle the analysis of this data.
38
this data.

SAMPLING DESIGN
Materials:• Virgin• Retired
Example 4:
Creep-fatigue interaction effects on high-strength steels
39
Location of cut for retired samples
Direction of cutfor specimen
Shape, size and numberof specimens
Data Gathering Instrumentation
Measurement
Sampling
Ref. : ASTM E370

SAMPLING PROCEDURES
Unrestricted Random SamplingRandom sample selection from the population as a whole.
Stratified Random SamplingPartition the population into known meaningful strata. Random selection is made within each stratum, making sure
To obtain a representative sample with maximum randomness.
40
Random selection is made within each stratum, making sure all strata are represented.
Optimum-allocation-of-strata Random SamplingIf information about the population strata and the way they will be used is available, optimum sample selection is made to give the most representative information about the population.

FATIGUE TEST PROCEDURES
∆P, R = -1
Completely reversed axial fatigue
(This test is commonly done in reversed bending cycles)
Raw data:
Stress(MPa)
Nf
(cycles)
SAMPLING
How many test samples are sufficient?
41
Str
ess
Time
(MPa) (cycles)
1 pair of data per specimen
0

STRESS-LIFE (S-N) DIAGRAM
Fat
igue
str
engt
h, S
f(M
Pa)
600
800
1000
Cr-Mo steel, normalized
SUT = 800 MPa
Se = 338 MPa
DESIRED RESULTS
42
1 10 102 103 104 105 106 107 108
Number of stress cycles, N
Fat
igue
str
engt
h, S
300
400
500
600
Ref: Shigley, J.E., Mechanical Engineering Design, First Metric Edition, McGraw-Hill, 1986
Fatigue limit
Data Gathering Instrumentation
Measurement
Sampling
OUTLINE (re-visit)
Data Analysis
43
Data Analysis
Types and nature of measured data
Considerations in data analysis
Statistical considerations
Regression analysis
The physical aspects of measured data

ROADMAP OF DATA ANALYSIS
MEASURED DATA
Curve-fitting
Verification & Validation
Physical Aspects
44
fitting
Numerical & Analytical
Models
(Extract model Parameters)
Validation
Reliability Analysis
Aspects
Information / Knowledge
(Interpret & Establish)
(Comparative Study)

TYPES OF DATA
Generated data
Measured data
Single reading
Random measurements
Time-dependent data
45
Others (micrographs)
Composition of steel (wt. %)

NATURE OF MEASURED DATA
Consistency
Uncertainty
Scatter
Outliers
46
Trends
Physical-based content
Evolution / history

CONSIDERATIONS IN DATA ANALYSIS
Anticipate the results from theory
Examine the data for consistency
Reduce the data
Perform a statistical analysis of data
where appropriate
47
Estimate the uncertainties in the
results
Correlate the data
Interpret and extract information

TOOLS / METHODS FOR DATA ANALYSIS
Data reduction
Uncertainty analysis
Statistical analysis
Regression analysis / Correlation
Mechanism-based interpretation
48
Simulation
V = 180 m/min
t = 0.125 mm/rev0
100
200
300
0.0 0.2 0.4 0.6 0.8 1.0Tool Advancement (mm)
Cut
ting
For
ce (
N)

STATISTICAL CONSIDERATION
Influence of the distribution of variables
(e.g. Stress and strength, household expenditure and income)
49
Pf = P( Stress ≥ Strength)
R = 1 - Pf
QUALITY versus
RELIABILITY

STATISTICS – BASIC DEFINITIONS
Population (or Universe)
a collection of objects having some common (fixed) characteristics.The characteristics of a population are called parameters.
Sample
any sub-collection of objects drawn from a population.
50
any sub-collection of objects drawn from a population.The characteristics of samples are called statistics.
Population parameters are usually estimatedon the basis of statisticscalculated for representative sample.
Procedures used to select samples and determine appropriate sample size are often called statistical design of experiment.
All sample types have in common some element of randomness.

DESCRIPTIVE STATISTICSSome useful statistics used in estimating population parameters.
51

IMPORTANT SAMPLING DISTRIBUTIONS
Gaussian or Normal
Chi-squared distribution
Student’s t-distribution
Snedcor distribution
52
Weibull distribution
-often used for representation of life data

SAMPLING DISTRIBUTION
- a three-parameter distribution (Na, No, b)
- A family of probability density functions, each can be written as:
Weibull Distribution
b
oa
o
NN
NNb
oa
o
oa
eNN
NN
NN
bNf
−−
−−
−−
−=
1
)(
N = spec. life, cycles
53
Shape parameter:
b = 1 simple exponential
b = 2 Rayleigh
b = 3.57 Appx. Gaussian
N = spec. life, cycles
No ≥ 0 , minimum life parameter
Na = characteristic life parameter at 63.2 pct. failed

WEIBULL DISTRIBUTION
Two-parameter Weibull distribution is widely
used for life data analysis
Weibull cumulative probability distribution
−−=B
n
tF(t) exp1
F(t) = Fraction failingt = time
Failure distribution type:
B<1.0 (Infant mortality)
54
t = timen = characteristic life B = slope or shape parameter
Weibull distribution uses existing service experience data. It does not predict future service experience using first engineering principles
B=1.0 (Random failure, independent of usage)
1.0< B<4.0 (Early wear out failure)
B>4.0 (Old age/ rapid wear out failure)

WEIBULL DISTRIBUTION
99
90
8070
Delta T&Stress
Delta T=150; dwell=29.5min
Delta T=150; dwell=12.5min
Delta T=150; dwell=1min
Probability Plot for Start
Arbitrary Censoring - LSXY Estimates
Weibull
Effect of dwell (hold) time at peak temperature on thermal shock tests of microelectronic chips.
Per
cent
of c
ompo
nent
fai
led
55
Start
Percent
100001000
70605040
30
20
10
5
3
2
1
Table of Statistics
1.000
6.35594 591.43 1.000
Shape Scale C orr
6.35594 1747.47 0.947
6.35594 7658.47
Delta T=150; dwell=29.5min
Cycles to Failure, Nf
Per
cent
of c
ompo
nent
fai
led
ACCELERATION FACTOR

REGRESSION / CURVE FITTING
Regression is a process used by statisticians to obtain a curve which best fit a set of data points.
(But you are not a statistician!)
To plot curves of experimental data and extract various significant facts from these curves
56
(Must understand physical phenomena involved in the experiment)
Correlation of experimental data is desired in terms of an analytical expression between variables that were measured in the experiment.

METHOD OF LEAST SQUARES
For a set of n observations x1, x2, x3,…,xn
the sum of the squares of their deviations from some mean value is
( )∑=
−=n
imi xxS
1
2
To minimize Swith respect to xm
57
( )∑ ∑= =
−−=−−==∂∂ n
i
n
imimi
m
nxxxxx
S
1 1
220
∑=
=n
iim x
nx
1
1 is the arithmetic mean value which minimizes the sum of the squares of the deviations

LINEAR REGRESSION
Equation of a straight line:
y = mx + c
Slope, and y-intercept, ( )
∑∑−
∑∑ ∑−
=
N
xx
N
yxxy
m 22
N
xmyb
∑ ∑−=
58
Correlation coefficient, ( -1 ≤ r ≤ 1)
N
y
x
s
msr =
r = 0 : no correlation
r = 1 : perfect correlation

Fuel Consumption Data
Example 5 – Curve fitting
Car Weight
(1000 lbs)
Fuel consumption
(gal/100 miles)
AMC Concorde 3.4 5.5
Chevy Caprice 3.8 5.9
Ford Wagon 4.1 6.5
59
Ford Wagon 4.1 6.5
Chevette 2.2 3.3
Toyota Corona 2.6 3.6
Ford Mustang Ghia 2.9 4.6
Mazda GLC 2.0 2.9
AMC Sprint 2.7 3.6
VW Rabbit 1.9 3.1
Buick Century 3.4 4.9
DEMO

Fuel Consumption Data
Example 5 – Curve fitting
Fue
l Con
sum
ptio
n (g
al/1
00 m
iles)
5
6
7
- W ↑ , Consmp ↑
- extrapolation
60
Weight (kips)
1 2 3 4 5
Fue
l Con
sum
ptio
n (g
al/1
00 m
iles)
2
3
4
y = 0.0518 + 1.3055x + 0.0613x2 r2 = 0.9806
- zero-intercept
- validity of extracted information
-
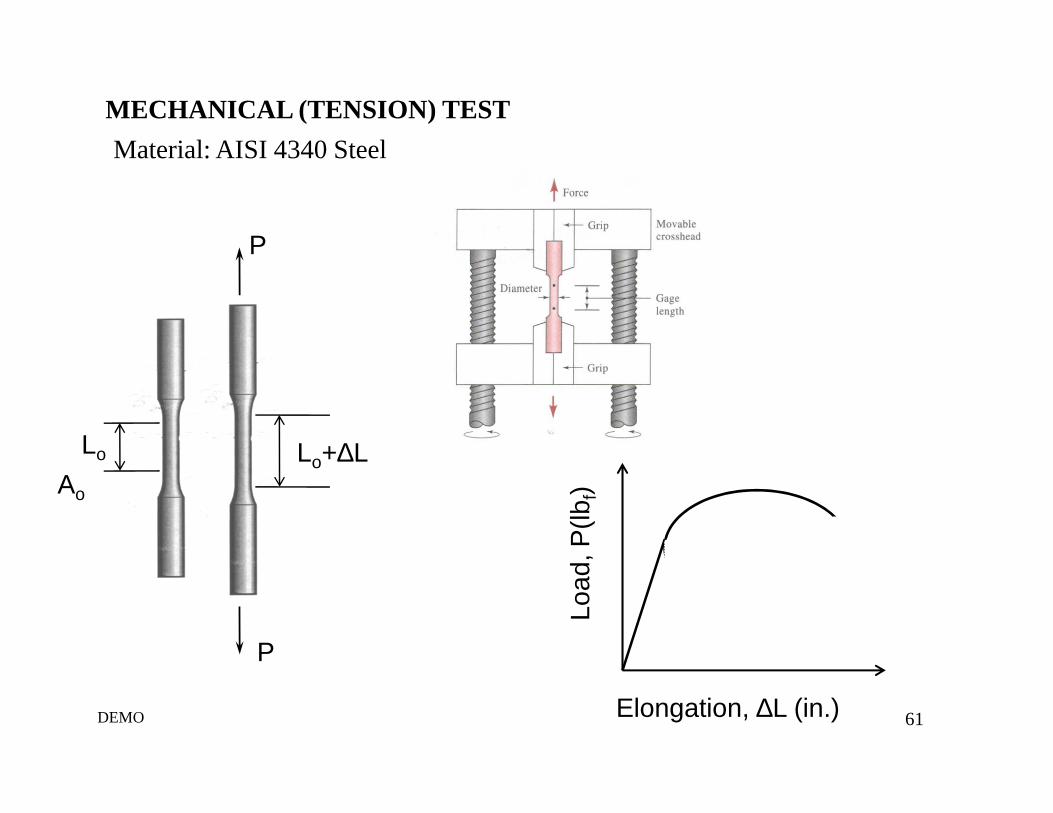
Material: AISI 4340 Steel
MECHANICAL (TENSION) TEST
P
61
P
Lo+∆LLo
Ao
Elongation, ∆L (in.)
Load
, P(lb
f)
DEMO

ST
RE
SS
, σ (
MP
a)
200
400
600
800
Example 6 – Curve fitting
150
200
Non-linear /Power-law
σ = K(εp)n
62
STRAIN, ε(%)
0.0 0.1 0.2 0.3 0.4 0.5 0.60
200
ALYAWS RELATE EXPERIMENTAL DATA TO THE PHYSICS OF THE PHENOMENON
STRAIN, ε(%)
0.0000 0.0002 0.0004 0.0006 0.0008 0.0010S
TR
ES
S, σ
(M
Pa)
0
50
100
σ = EεLinear σ = Eε

ST
RE
SS
, σ (
MP
a)
100
200
300
400
500
600
700
(M
Pa)
1000
63
PLASTIC STRAIN, εp
0.0 0.1 0.2 0.3 0.4 0.5 0.60
PLASTIC STRAIN, εp
0.01 0.1 1
ST
RE
SS
, σ (
MP
a)
100
σ = Kεn
log K = 2.8735n = 0.1992r2 = 0.9772
199.03.747 pεσ =
ALYAWS RELATE EXPERIMENTAL DATA TO THE PHYSICS OF THE PHENOMENON

Fatigue crack growth rate data for TiAl intermetallic alloy
Example 7 – Physical Mechanisms
64

Fatigue crack growth rate data for TiAl intermetallic alloy
65

Fatigue crack growth rate data for TiAl intermetallic alloy
We should be able to describe the physical mechanism
66
physical mechanism of observed phenomenon

• American Standard for Testing and Materials (ASTM)ASTM E139 – 00 Standard Test Method for Conducting Creep, Creep-Rupture,
and Stress-Rupture Tests of Metallic Materials
• International Standard (ISO)ISO 6892:1998(E) Metallic Materials – Tensile Testing at Ambient Temperature
TESTING STANDARDS
STANDARDS AND GUIDELINES
67
• European Standard (EN), British Standard (BS)EN ISO 7500-2:1999 E Metallic Materials – Verification of Static Uniaxial Testing
Machines – Part 2: Tension Creep Testing Machines – Verification of the Applied Load
• Japanese Industrial Standard (JIS)JIS Z 2271:1999 (E) Method of Creep and Creep Rupture Test for Metallic Materials
• Malaysian Standard (MS)MS ISO 1352:1998 Steel – Torsional Stress Fatigue Testing

LEVEL OF EXACTNESS
FACTS
KNOWLEDGE
Le
vel o
f e
xact
ness
of
sta
tistic
al m
ode
l
WISDOM
68
DATA
INFORMATION
Level of improvements in decision making
Le
vel o
f e
xact
ness
of
sta
tistic
al m
ode
l

Q & A SESSION
69
Q & A SESSION

![BioSig:TheFreeandOpenSourceSoftwareLibraryfor …pub.ist.ac.at/~schloegl/publications/Vidaurre2011Biosig.… · · 2011-03-15data format for storing biosignals. ... [3] are able](https://static.fdocuments.in/doc/165x107/5ad7e3577f8b9a9d5c8ca1d9/biosigthefreeandopensourcesoftwarelibraryfor-pubistacatschloeglpublicationsvidaurre2011biosig2011-03-15data.jpg)