Data flow diagrams. shows how data moves through an information system but does not show program...
40
data flow diagrams
-
Upload
simon-gallagher -
Category
Documents
-
view
212 -
download
0
Transcript of Data flow diagrams. shows how data moves through an information system but does not show program...

data flow diagrams
data flow diagrams shows how data moves through an
information system but does not show program logic or processing steps
provides a logical model that shows what the system does, not how it does it
data flow diagrams notation
use four basic symbols that represent processes, data flows, data stores, and external entities
Gane and Sarson symbol set Yourdon symbol set
referenced by using all capital letters for the symbol name

DFD notation
DATA STORE
PROCESS
DATA FLOW
EXTERNALENTITY
DATA FLOW
DATA FLOW
DATA FLOW
DATA STORE
EXTERNALENTITY
PROCESSGane &Sarson
Yourdon
DFD notation process symbol
receives input data and produces output that has a different content, form, or both
contain the business logic, also called business rules
referred to as a black box data flow symbol
represents one or more data items

DFD notation data store symbol
represent data that the system stores logical representation (physical
characteristics of data store are unimportant)
external entity symbol represents the source or sink of data
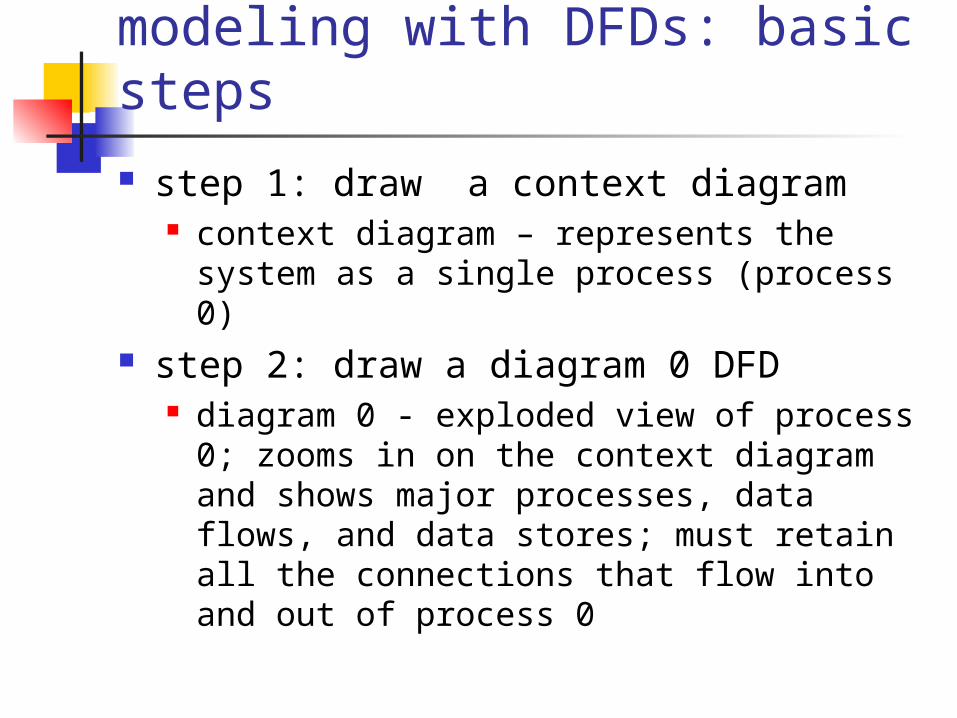
modeling with DFDs: basic steps step 1: draw a context diagram
context diagram – represents the system as a single process (process 0)
step 2: draw a diagram 0 DFD diagram 0 - exploded view of process 0;
zooms in on the context diagram and shows major processes, data flows, and data stores; must retain all the connections that flow into and out of process 0

modeling with a DFD: basic steps step 3: draw the lower-level diagrams
functional decomposition of diagram 0 observe leveling – use a series of
increasingly detailed DFDs to describe the information system
observe balancing – maintain the input and output data flows of the parent DFD on the child DFD
modeling with DFDs guidelines for drawing DFDs
context diagram should fit on one page use the name of the information system as
the process name in the context diagram use unique names within each set of
symbols do not cross lines provide a unique name and reference
number for each process obtain as much user input and feedback as
possible
modeling with DFDs other syntactic rules
avoid the following combinations of data flow and process
spontaneous generation black hole gray hole
an external entity should be connected by a data flow to a process only
data stores cannot be connected to each other

modeling with DFDs other concepts
naming conventions conservation of data diverging data flows converging data flows composite data flow control flow (e.g., time)
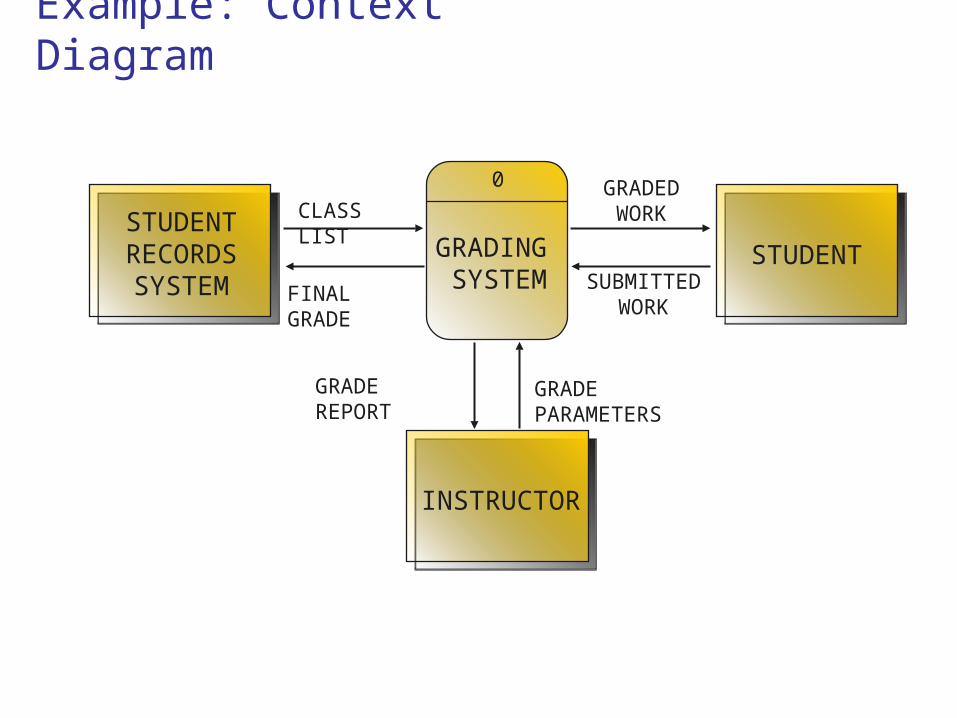
Example: Context Diagram
GRADING SYSTEM
STUDENTRECORDSSYSTEM
STUDENT
INSTRUCTOR
FINAL GRADE
CLASS LIST
GRADE REPORT
SUBMITTED WORK
GRADED WORK
GRADE PARAMETERS
0
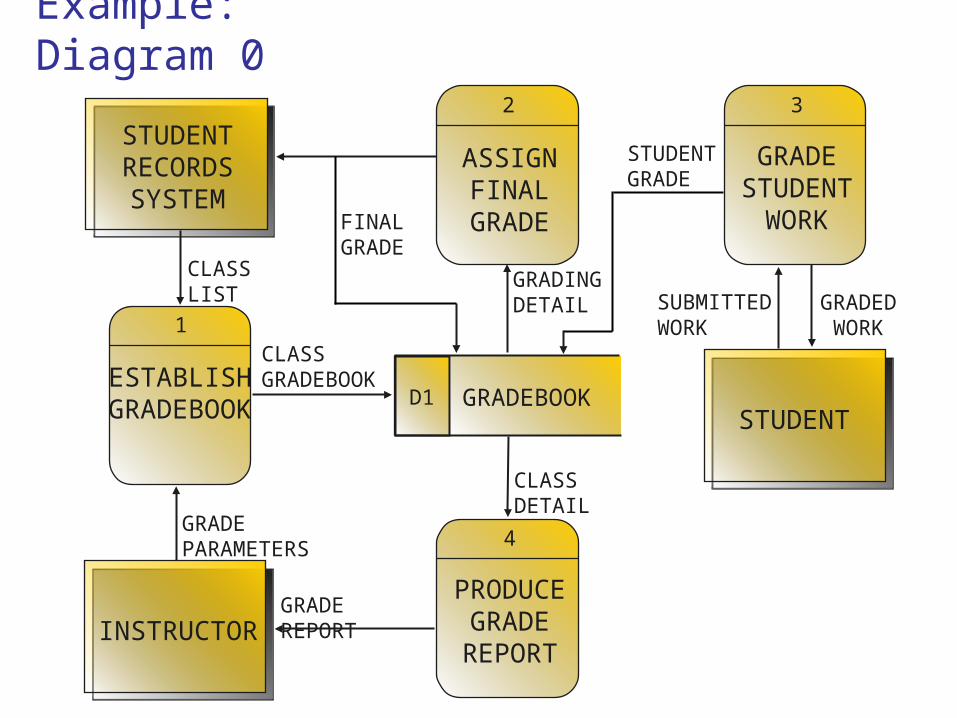
Example: Diagram 0
STUDENTRECORDSSYSTEM
STUDENT
INSTRUCTOR
GRADINGDETAIL
CLASS LIST
GRADE REPORT
SUBMITTED WORK
GRADED
WORK
GRADE PARAMETERS
GRADEBOOKD1
ASSIGNFINAL
GRADE
2
GRADESTUDENT
WORK
3
ESTABLISHGRADEBOOK
1
PRODUCEGRADEREPORT
4
CLASSGRADEBOOK
CLASS DETAIL
FINAL GRADE
STUDENTGRADE

DFD levels
Context diagram
Level 0 diagram
Level 1 diagram
Level 2 diagram
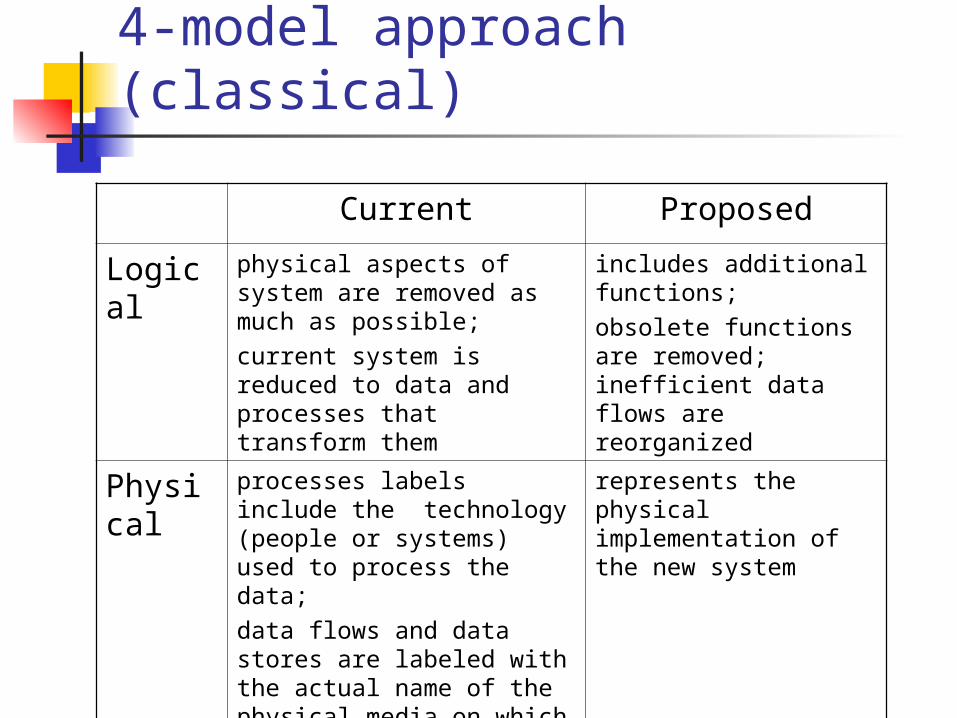
4-model approach (classical)
Current Proposed
Logical
physical aspects of system are removed as much as possible;current system is reduced to data and processes that transform them
includes additional functions;obsolete functions are removed; inefficient data flows are reorganized
Physical
processes labels include the technology (people or systems) used to process the data;data flows and data stores are labeled with the actual name of the physical media on which data flow or in which data are stored
represents the physical implementation of the new system

data dictionary data elements must be documented in a
data dictionary so that clear, comprehensive information about the data and processes that make up the system are stored
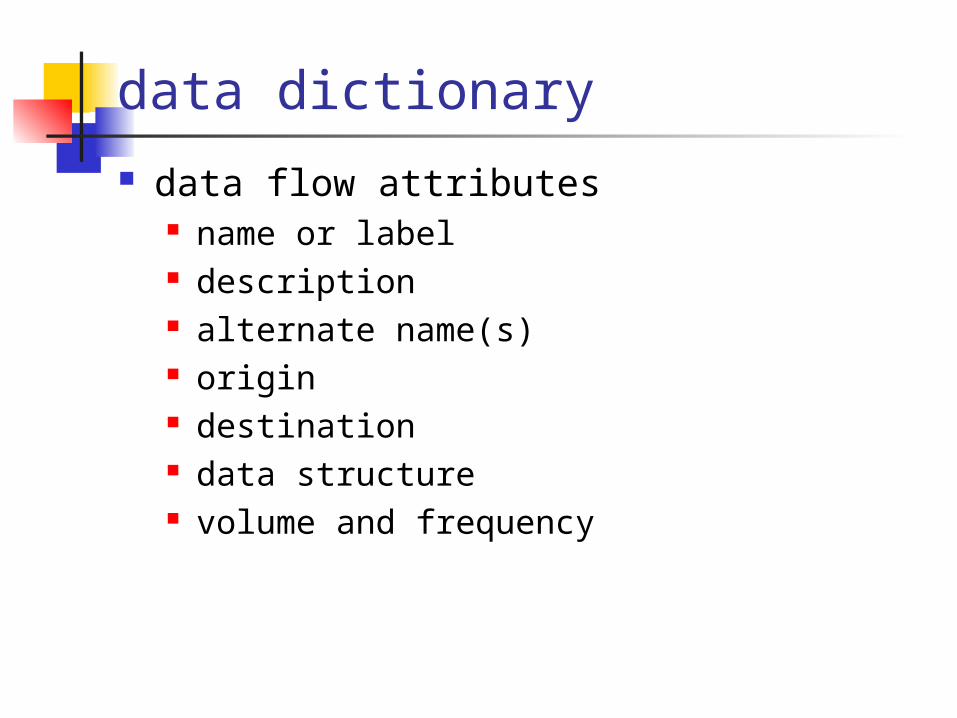
data dictionary data flow attributes
name or label description alternate name(s) origin destination data structure volume and frequency

data dictionary data store characteristics
data store name or label description alternate name(s) data structure volume and frequency

data dictionary process characteristics
process name or label description process number process description
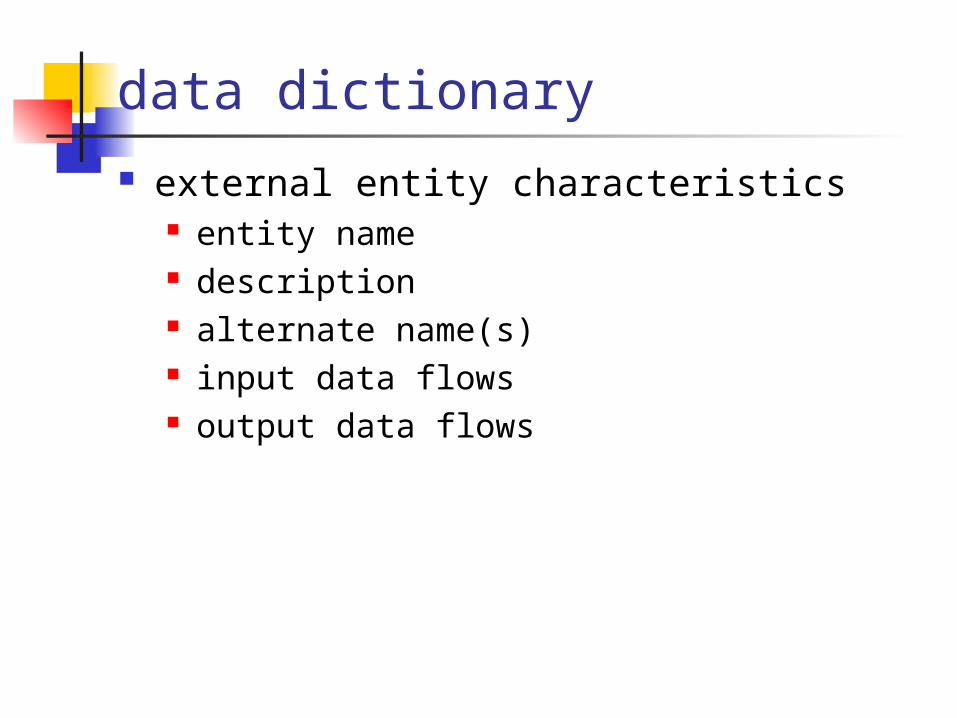
data dictionary external entity characteristics
entity name description alternate name(s) input data flows output data flows
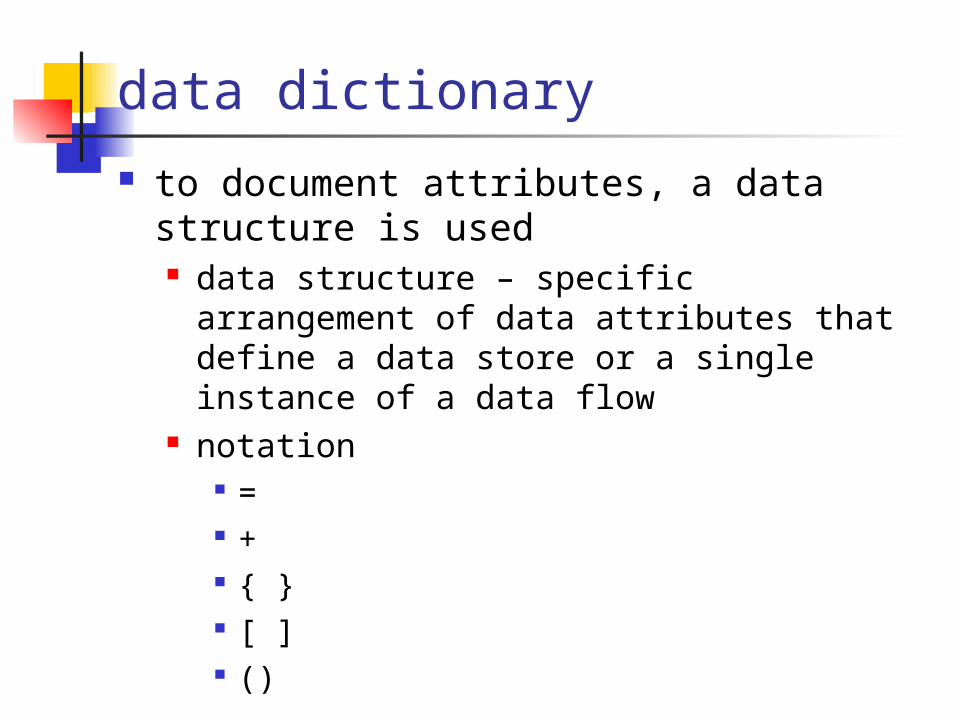
data dictionary to document attributes, a data structure
is used data structure – specific arrangement of
data attributes that define a data store or a single instance of a data flow
notation = + { } [ ] ()

data dictionary: example
ORDER = ORDER NUMBER + ORDER DATE +
[CUSTOMER NUMBER|CORPORATE ACCOUNT] + SHIP ADDRESS + BILL ADDRESS + {PRODUCT} +
AMOUNT
PRODUCT = PRODUCT NUMBER + DESCRIPTION +
QUANITY ORDERED + PRICE + EXTENDED PRICE
SHIP ADDRESS = ADDRESS
BILL ADDRESS = ADDRESS
ADDRESS = (POBOX NUMBER) + STREET + CITY +
[STATE|PROVINCE] + (COUNTRY) + ZIPCODE
ORDERS = {ORDER}

decomposition diagram depicts the partitioning of the system
into logical subsystems or processes shows the top-down functional
decomposition of a system used as a planning tool for the DFD also known as a hierarchy chart

decomposition diagram
GRADINGSYSTEM
ESTABLISHGRADEBOOK
ASSIGN FINAL
GRADE
GRADESTUDENT
WORK
TASK 1 TASK 2
PRODUCEGRADEREPORT

process description describes the logic of primitive processes may be represented in the following
forms: structured English decision table decision tree

process description structured English
use the three logical building blocks sequence selection iteration
use indentation for readability use standard terms used in the data
dictionary and specific words that describe the processing rules
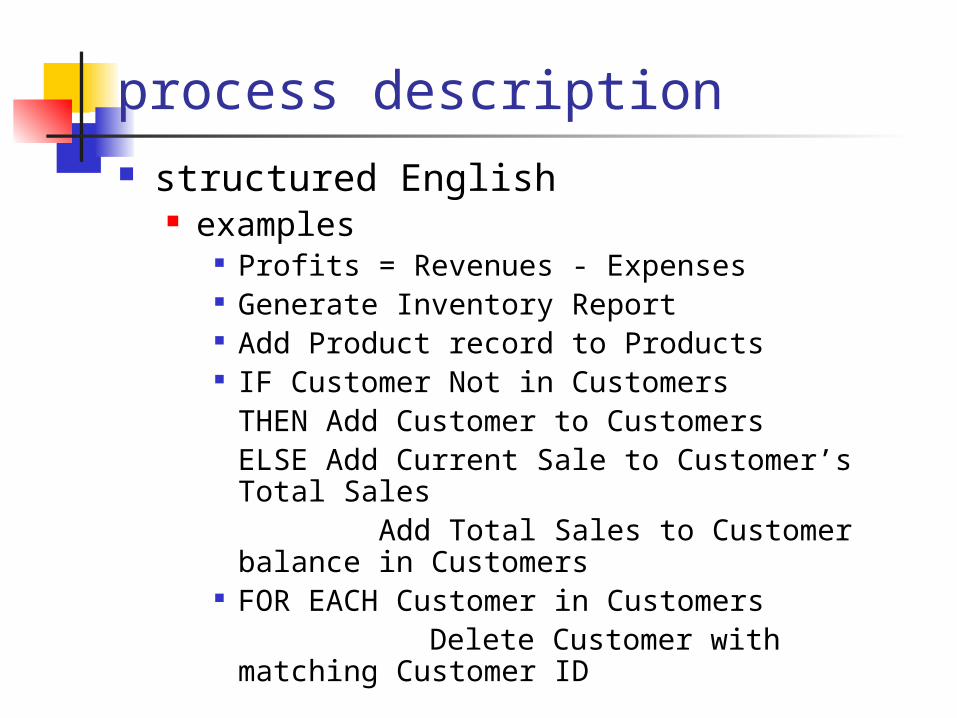
process description structured English
examples Profits = Revenues - Expenses Generate Inventory Report Add Product record to Products IF Customer Not in Customers
THEN Add Customer to CustomersELSE Add Current Sale to Customer’s Total Sales Add Total Sales to Customer balance in Customers
FOR EACH Customer in CustomersDelete Customer with matching
Customer ID
process description decision tables
alternative way to describe business rules or processing that involve a complex set of conditions
shows a logical structure, with all possible combinations of conditions and resulting actions
rows represent conditions and possible outcomes; columns indicate which combinations of conditions result in specific actions
combination of conditions may result in more than one outcome
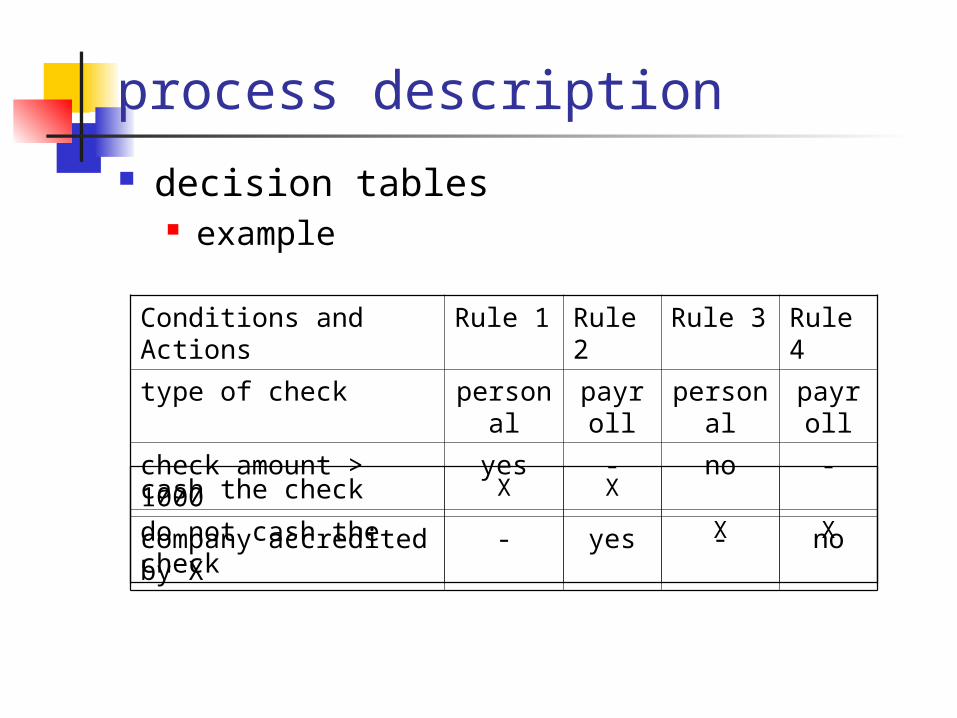
process description decision tables
example
Conditions and Actions
Rule 1 Rule 2
Rule 3 Rule 4
type of check personal
payroll
personal
payroll
check amount > 1000
yes - no -
company accredited by X
- yes - no
cash the check X X
do not cash the check X X

process description decision trees
Graphical representation of the conditions, actions, and rules found in a decision table
choice between a decision table or decision tree is a matter of personal preference
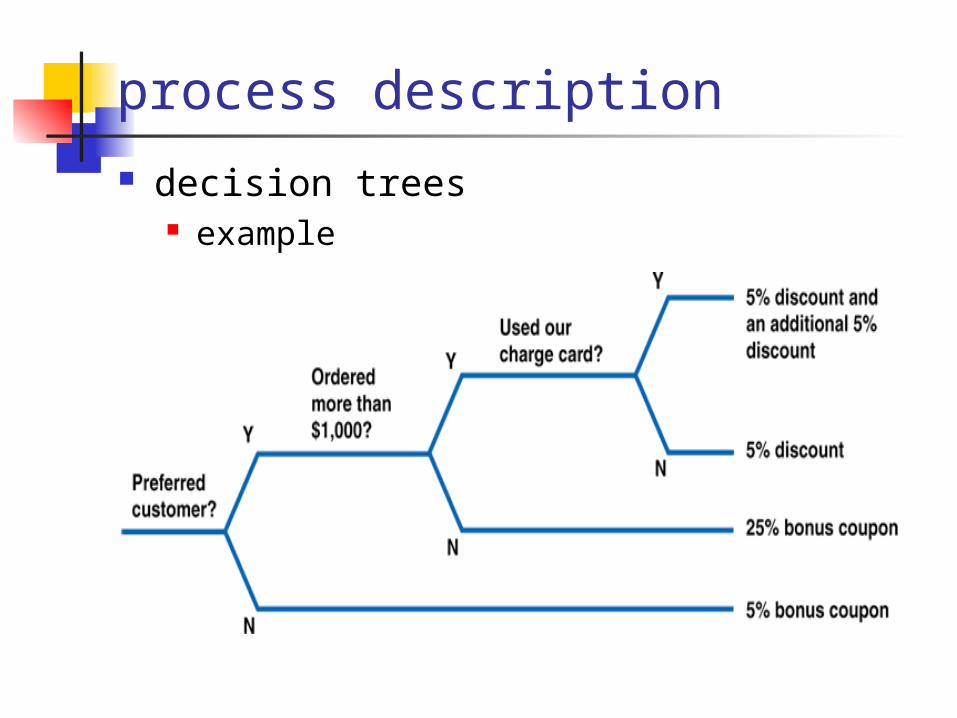
process description decision trees
example
other process analysis tools
event-driven approach
use case analysis tool used to describe a business
task and how the user (actor) interacts with the system to accomplish the task
may be represented in narrative or graphical form
no standard template for documenting detailed use cases
analysts are encouraged to use templates that work for them or the project they are on

use case example
Name: Place New OrderUse-Case ID: UC123Source: Requirement 1.00Description: A club member submits a new
order for products. The member’s account standing is validated. When the availability of products is verified, a packing order is sent to the warehouse for it to prepare the shipment. Back orders are created for products not in stock. On completion, the member is sent an order confirmation.
use case example
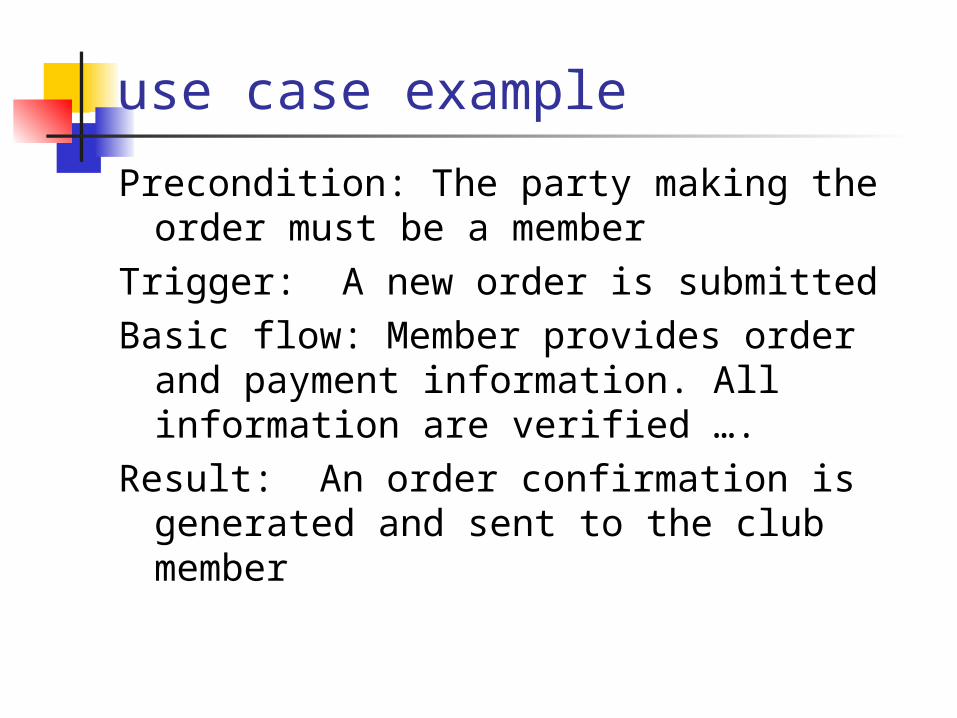
Precondition: The party making the order must be a member
Trigger: A new order is submittedBasic flow: Member provides order and
payment information. All information are verified ….
Result: An order confirmation is generated and sent to the club member

use case sections Use Case Name Iteration Description Preconditions Triggers Basic course of events Alternative paths Postconditions Business rules Notes Author and date Additional sections such as assumptions,
exceptions, recommendations, technical requirements

event-response list depicts the business events that the
system must respond to employ use case analysis contains information on:
actor that initiates the event event trigger or input response or output
event decomposition diagram map the events to the decomposition serves as an outline for the lower-level
data flow diagrams
system diagram merged events depicted in the data flow
diagram a single diagram may represent the
entire system may be a collection of DFDs representing
a set of events for a major component of the system(e.g., a process in diagram 0)

modern structured analysis draw the context DFD of the proposed
system make the corresponding functional
decomposition diagram and diagram 0 create an event-response or use-case list draw an event DFD for each event * merge event DFDs into a system diagram draw detailed, primitive DFDs for the more
complex events update the data dictionary make the process descriptions