Data Envelopment Analysis of different climate policy scenarios
15
ANALYSIS Data Envelopment Analysis of different climate policy scenarios ☆,☆☆ Valentina Bosetti a, ⁎ , Barbara Buchner b,1,2 a Fondazione Eni Enrico Mattei, C.so Magenta, 63 20123 Milano, Italy b International Energy Agency; 9, rue de la Fédération, 75739 Paris Cedex 15, France ARTICLE DATA ABSTRACT Article history: Received 3 June 2007 Received in revised form 5 September 2008 Accepted 7 September 2008 Available online 10 October 2008 Recent developments in the political, scientific and economic debate on climate change suggest that it is of critical importance to develop new approaches able to compare policy scenarios for their environmental effectiveness, their distributive effects, their enforceability, their costs and many other dimensions. This paper discusses a quantitative methodology to assess the relative performance of different climate policy scenarios when accounting for their long-term economic, social and environmental impacts. The proposed procedure is based on Data Envelopment Analysis, here employed in evaluating the relative efficiency of eleven global climate policy scenarios. The methodology provides a promising comparison framework; it can be seen as a way of setting some basic guidelines to frame further debates and negotiations and can be flexibly adopted and modified by decision makers to obtain relevant information for policy design. Three major findings emerge from this analysis: (i) stringent climate policies can outperform less ambitious proposals if all sustainability dimensions are taken into account; (ii) a carefully chosen burden-sharing rule is able to bring together climate stabilisation and equity considerations; and (iii) the most inefficient strategy results from the failure to negotiate a post-2012 global climate agreement. © 2008 Elsevier B.V. All rights reserved. Keywords: Climate policy Valuation Data Envelopment Analysis Sustainability JEL classification: H41; Q51; Q54; C61; 1. Introduction During the last few decades, climate change has evolved as one of the major threats to the earth's sustainability. Political responses in the form of the United Nations Framework Convention on Climate Change (UNFCCC, 1992) and more specifically the Kyoto Protocol have started a process towards new policy architecture able to deal with the complexities of climate change in a better way. However, recent negotiations and developments suggest that it might be difficult to achieve a single global agreement through the usual top-down policy architecture design methods, and that regional or sub-global ECOLOGICAL ECONOMICS 68 (2009) 1340 – 1354 ☆ This paper is part of the research work being carried out by the Climate Change Modelling and Policy Unit at Fondazione Eni Enrico Mattei. Financial support of the TranSust.Scan project is gratefully acknowledged. The authors are grateful to Christoph Böhringer, Carlo Carraro, Marzio Galeotti and Henry Jacoby for helpful suggestions and remarks. The usual disclaimer applies. ☆☆ The ideas expressed in this paper are those of the authors and do not necessarily represent views of the International Energy Agency or its Member Countries. ⁎ Corresponding author. Tel.: +39 02 52036983; fax: +39 02 52036946. E-mail addresses: [email protected] (V. Bosetti), [email protected] (B. Buchner). 1 Tel.: +33 1 4057 6687; fax: +33 1 4057 6739. 2 At the time of writing, Barbara Buchner was Senior Researcher at Fondazione Eni Enrico Mattei, Italy. 0921-8009/$ – see front matter © 2008 Elsevier B.V. All rights reserved. doi:10.1016/j.ecolecon.2008.09.007 available at www.sciencedirect.com www.elsevier.com/locate/ecolecon
-
Upload
valentina-bosetti -
Category
Documents
-
view
212 -
download
0
Transcript of Data Envelopment Analysis of different climate policy scenarios

E C O L O G I C A L E C O N O M I C S 6 8 ( 2 0 0 9 ) 1 3 4 0 – 1 3 5 4
ava i l ab l e a t www.sc i enced i rec t . com
www.e l sev i e r. com/ l oca te /eco l econ
ANALYSIS
Data Envelopment Analysis of different climatepolicy scenarios☆,☆☆
Valentina Bosettia,⁎, Barbara Buchnerb,1,2
aFondazione Eni Enrico Mattei, C.so Magenta, 63 20123 Milano, ItalybInternational Energy Agency; 9, rue de la Fédération, 75739 Paris Cedex 15, France
A R T I C L E D A T A
☆ This paper is part of the research work beMattei. Financial support of the TranSust.ScaCarraro, Marzio Galeotti and Henry Jacoby fo☆☆ The ideas expressed in this paper are thoor its Member Countries.⁎ Corresponding author. Tel.: +39 02 52036983E-mail addresses: [email protected]
1 Tel.: +33 1 4057 6687; fax: +33 1 4057 67392 At the time of writing, Barbara Buchner w
0921-8009/$ – see front matter © 2008 Elsevidoi:10.1016/j.ecolecon.2008.09.007
A B S T R A C T
Article history:Received 3 June 2007Received in revised form5 September 2008Accepted 7 September 2008Available online 10 October 2008
Recent developments in the political, scientific and economic debate on climate changesuggest that it is of critical importance to develop new approaches able to compare policyscenarios for their environmental effectiveness, their distributive effects, theirenforceability, their costs and many other dimensions. This paper discusses aquantitative methodology to assess the relative performance of different climate policyscenarios when accounting for their long-term economic, social and environmentalimpacts. The proposed procedure is based on Data Envelopment Analysis, here employedin evaluating the relative efficiency of eleven global climate policy scenarios. Themethodology provides a promising comparison framework; it can be seen as a way ofsetting some basic guidelines to frame further debates and negotiations and can be flexiblyadopted and modified by decision makers to obtain relevant information for policy design.Three major findings emerge from this analysis: (i) stringent climate policies canoutperform less ambitious proposals if all sustainability dimensions are taken intoaccount; (ii) a carefully chosen burden-sharing rule is able to bring together climatestabilisation and equity considerations; and (iii) the most inefficient strategy results fromthe failure to negotiate a post-2012 global climate agreement.
© 2008 Elsevier B.V. All rights reserved.
Keywords:Climate policyValuationData Envelopment AnalysisSustainability
JEL classification:H41; Q51; Q54; C61;
1. Introduction
During the last few decades, climate change has evolved asone of the major threats to the earth's sustainability. Politicalresponses in the form of the United Nations FrameworkConvention on Climate Change (UNFCCC, 1992) and more
ing carried out by the Cln project is gratefully ackr helpful suggestions andse of the authors and do n
; fax: +39 02 52036946.(V. Bosetti), barbara.buch
.as Senior Researcher at F
er B.V. All rights reserved
specifically the Kyoto Protocol have started a process towardsnew policy architecture able to deal with the complexities ofclimate change in a better way. However, recent negotiationsand developments suggest that it might be difficult to achievea single global agreement through the usual top-down policyarchitecture design methods, and that regional or sub-global
imate Change Modelling and Policy Unit at Fondazione Eni Enriconowledged. The authors are grateful to Christoph Böhringer, Carloremarks. The usual disclaimer applies.ot necessarily represent views of the International Energy Agency
[email protected] (B. Buchner).
ondazione Eni Enrico Mattei, Italy.
.

1341E C O L O G I C A L E C O N O M I C S 6 8 ( 2 0 0 9 ) 1 3 4 0 – 1 3 5 4
agreements are more likely to emerge.3 The usual way ofplanning climate policy has led to a deadlock in negotiations,which has consequently induced the search for new policyarchitectures to deal more successfully with ever-increasingemissions. Even though the Kyoto Protocol came into force inFebruary 2005, from a global perspective its environmentaleffectiveness is low due to the lack of participation of severalkey countries, in particular, the world's largest producer ofGHG emissions, the US. In addition, only industrialised coun-tries have adopted quantified mitigation commitments, inaccordance with the principle of “common but differentiatedresponsibilities and respective capabilities”, stated in Article 3.1of the UNFCCC (UNFCCC, 1992). However, rapid economicgrowth in large emerging countries, such as China and India,is expected to make developing countries' CO2 emissionsaccount for more than half of global emissions before 2030,although per capita emission levels would remain higher in theindustrialised world (IEA, 2007). As a consequence, generalconsensus has emerged that the Kyoto Protocol represents onlya first step towards the broader aimofminimising the danger ofclimate change.4 This has stimulated detailed discussions onpotential climate policy scenarios and a number of differentapproaches have been applied in order to analyse the possiblefuture of climate policy. In this context, recent experiences inthepolitics and economics of climate change control have givenan indication of how important it is to be accurate inmeasuringthe efficiency of efforts towards climate control in order toincrease the feasibility of a possible policy scenario.
Yet, given the difficulty of measuring climate policies in asatisfactory way, no strategy that can satisfy all the needs of allcountries has yet been identified. This problem is becomingmore pressing because of the increasing urgency to improve thecredibility of climate policy in general. In order tomove forwardin climate negotiations, countries need to have a better way ofevaluating efforts at their disposal. The paper aims at con-tributing to this objective.
Two particular reasons stress the importance of such anevaluation tool. First, countries currently not involved inquantitativemitigation efforts under the international climate
3 Indeed, due to free-riding incentives and strong economic andenvironmental asymmetries, it is unlikely that an internationalclimate agreement will be signed by a large number of countries(Carraro and Siniscalco, 1993; Botteon and Carraro, 1997), unlessits goals are not significantly different from those of a non-cooperative, business-as-usual, domestic policy (Barrett, 1994).Therefore, more recently the idea of a global bottom-up climateagreement has been proposed (Cf. Carraro, 1998, 1999; Buchnerand Carraro, in press; Egenhofer et al., 2001; Stewart and Wiener,2003). The basic idea is to adopt a bottom-up, country-drivenapproach to defining national commitments, instead of a top-down, international negotiation of national emission targets.4 Actually, in July 2005 six nations led by the US and Australia
unveiled a complementary pact to theKyoto Protocol, aimed to fightglobalwarming.TheAsia-PacificPartnershiponCleanDevelopmentand Climate constitutes a voluntary, technology-based initiative toreduce greenhouse gas emissionswithout legally binding emissionstargets, whosemain idea is to develop new technologies and deploythese in developing countries. Notwithstanding its being voluntary,this agreement couldbe interpreted asa further step towards amorecomprehensive climate policy. Formore information on this pact—signed by the US, Australia, Japan, China, India and South Korea —see http://www.ap6.gov.au/.
architecture need to have instruments to evaluate their nextsteps in climate policy in order to justify their strategies bothdomestically and internationally. Second, negotiations on apost-2012 phasehave started since theKyoto Protocol containscommitments only up until 2012. At the climate negotiationsin Montreal in 2005, a new round of climate talks was initiatedboth under the UNFCCC and under the Kyoto Protocol,focussing on the future of the international climate effort.5
The general stalemate in the Kyoto negotiations suggests thatall countries would benefit from a new approach to looking atclimate change mitigation measures. Above all, focussingexclusively on emissions or emission concentrations ortemperature appears to be a too narrow approach.6 By movingbeyond this perspective, the efficiency of climate changecontrol can be evaluatedmore comprehensively. In particular,given the international commitment towards sustainabledevelopment as the overall guideline for all areas of policymaking7,measurements of efficiency better able to account forthe three dimensions of sustainability — i.e., the economic,social and environmental aspects — are essential if climate-energy policy is to be more effective and successful.
Attempts to compare and measure climate policies are notnew. The climate policy scenarios embedded in most of theexisting policy proposals usually represent mitigation scenar-ios that are defined through a description and a quantifiedprojection of how GHG emissions can be reduced with respectto some baseline scenario and/or how a specific GHG targetcan be achieved in order to stabilise atmospheric concentra-tions (the so-called QUELRO approach8). They contain newemission profiles as well as costs and benefits associated withemission reductions. In order to obtain the relevant informa-tion that characterises the final outcome, policies are simu-lated using economic-climate models in order to forecast thepotential long-term effects on relevant variables, such as theimplied increase in global atmospheric temperature or theeffect on GDP growth. By means of such simulations, acomparison of different climate policy scenarios should bepossible. Still, given the prevailing scientific uncertainties, anaccurate evaluationmay need to account for a greater numberof indicators and thus comparison of climate policy proposalsbecomes more difficult.
5 The Conference of the Parties serving as the meeting of theParties to the Kyoto Protocol on its first session (COP/MOP 1) tookdecisions on a process for considering new binding commitmentsafter the end of the Protocol's first commitment period, for post-2012, for the Kyoto Annex B countries. The Conference of the Partieson its eleventh session (COP 11) launched a process on the future oclimate change control under the UNFCCC, opening a nonbinding“Dialogue on long-term cooperative action to address climatechange by enhancing implementation of the Convention”.6 An increase in recent research efforts emphasises the need to go
beyondtraditionalCO2concentrationstabilisationexercises (seee.g.Sarofimet al., 2004;Kemfert et al., 2006; Richels et al., 2004; Tol, 2006)7 See, for example, the Johannesburg Declaration on Sustainable
Development that was adopted at the World Summit onSustainable Development held in Johannesburg, South Africafrom 2 to 4 September 2002. This statement reaffirms the world’scommitment to sustainable development.8 QUELRO stands for “Quantified Emission Limitation and Reduc-
tion Objective” and its terminology was introduced by the KyotoProtocol.
f
,.
,

1342 E C O L O G I C A L E C O N O M I C S 6 8 ( 2 0 0 9 ) 1 3 4 0 – 1 3 5 4
Therefore, the objective of this paper is not solely to discuss andcomment on different policies or policy scenarios, but isprimarily to extract useful information from the phase whereproposed and simulated climate policy scenarios are compared.Thisphase isusually crucial for thepath thenegotiations follow.For this purpose, we apply the Data Envelopment Analysis(DEA), a methodology which is technically closely related toMulti-Criteria Analysis, in that it allows us to deal withsituations where multiple inputs and outputs occur. In parti-cular, we are interested in incorporating the economic, envir-onmental and social dimensions of the positive and negativeimpacts of each policy scenario, in order to bridge the gapbetween the simulation phase, in which long-run effects ofpolicies are mimicked, and the valuation phase, in whichusually a coherent cost benefit analysis framework is adopted.Indeed, these phases should culminate by feeding the informa-tion obtained back into the policy-designing process.
DEA uses data observations to directly evaluate the relativeperformance of a set of policy scenarios, in a multi input–multioutput context. At first, DEA was developed to evaluate therelative efficiency of firms by transformingmultiple inputs intomultiple outputs,makingminimal prior assumptions about theshapeof theproductionpossibility set, but inferring informationfrom the data set. While the conventional definition ofefficiency can be traced back to Farrell (1957), the first publica-tion that made the DEAmethodology popular and introduced itinto the operation research world was Charnes et al. (1978).Subsequently, DEA has been applied to evaluate the relativeperformance of medical services, as in Nyman and Bricker(1989), and educational institutions, as inCharnes et al. (1981). Ithas also been applied in the private sector, in the evaluation ofbanks, in Charnes et al. (1990).9 Applications to environmentaland resource management problems are less frequent. Ingeneral, environmental and social impacts can be modelled asundesirable outputs or as conventional inputs. The absence ofmarketprices for theseundesirableoutputs,which isagenerallyrecognised valuation problem, can be overcome by employingDEA.10 However, to the authors' knowledge, DEA has not yetbeen applied in the comparative assessment of (climate)policies.11 Moreover, to date, DEA has been mainly used for ex
9 A thorough review of the theory and applications related toDEA can be found in Coelli et al. (1998), while an extensivebibliography is reported in the survey article by Seiford (1996).10 Some studies have applied DEA in measuring ecologicalefficiency (e.g. Dyckhoff and Allen, 2001); some others inmeasuring the environmental impact of different productiontechnologies, as for example De Koeijer et al. (2002), where theimpacts of different production techniques in the farm industryare compared. Bosetti and Locatelli (2006) consider the economicand environmental dimensions of management performances inNational Parks, while Hernandez-Sancho et al. (2000) consider theissue of efficiency in environmental regulation. An interestingoverview of the role of DEA in environmental valuation can befound in Kortelainen and Kuosmanen (2007), while a survey ofindicators of firms’ environmental behaviour can be found inTyteca (1996).11 A recent paper deals with a similar thematic as the one we havechosen. Kuosmanen et al. (in press) provide an environmental cost–benefit analysis of alternative timing strategies in greenhouse gasabatement based on data envelopment analysis, and confirm thusthe attractiveness of this approach for the area of climate policy.
post performance assessment. This is the first paper to applyDEAonsimulateddata for exante assessment of environmentalpolicy options. Some earlier studies used DEA as an ex anteguide to choosing a location for certain activities from one ofseveral alternative sites; see Thompson et al. (1986), andTakamura and Tone (2003). In the context of ex post perfor-mance evaluation, Kuosmanen and Kortelainen (2005) usedsynthetic data from a simulation model in a DEA assessment.On the other hand, Cherchye (2001) applied DEA in an ex postassessment of macroeconomic policy performance.
The present paper applies this technique in order toevaluate eleven climate policy scenarios and discover howscenarios that would not pass the economic efficiency testmight deliver a good performance in terms of sustainability,notwithstanding their relatively high costs.
The rest of the paper is organised as follows. Section 2introduces the methodological framework describing, on onehand, the model adopted to simulate long-run effects of thedifferent policies, theWITCHmodel, and on the other hand, theData Envelopment Analysis (DEA) methodology, which is thenapplied tocompare thevariouspolicy scenarios. Inparticular, thechoice of cost and benefit indicators for each policy is introducedand discussed. Section 3 provides a detailed overview of thepolicy scenarios that are the subject of this analysis. Both thefeatures of thepolicyproposals and theirunderlyingmotivationsare tackled. Finally, Section 4 discusses the results and providesconclusions as well as indications for further future research.
2. Methodology
The proposed analysis is based on a composed methodology,as sketched in Fig. 1, which couples a traditional simulationanalysis— performed in our case bymeans of a hybrid optimalgrowth economic-climate model, the WITCH model — with arelative efficiency valuation technique, namely the DEA.
This methodology allows us to compare a set of policyscenarios; some stemming from political feasibility considera-tions, others from scientific concerns regarding global warm-ing and yet others from a combination of the two. Motivationsbehind the design of each policy scenario both in its short andlong-term features are discussed in greater detail in thesubsequent section. We shall now focus on the methodologi-cal issues.
Fig. 1 –A sketch of the hybrid methodology.

1343E C O L O G I C A L E C O N O M I C S 6 8 ( 2 0 0 9 ) 1 3 4 0 – 1 3 5 4
Let us start by briefly discussing the simulation phase.Scenarios should be simulated using one, or better, severalsimulation and/or optimization models (as in the case of theSRES scenarios12 or several other comparison exercises). Tokeep our study as simple as possible architectures aresimulated using one single model, the WITCH model.
WITCH — World Induced Technical Change Hybridmodel — is a regional integrated assessment modelstructured to provide normative information on the optimalresponses of world economies to climate damages and tomodel the channels through which climate policy istransmitted to the economic system. It is a hybrid modelbecause it combines features of both top-down and bottom-up modelling: the top-down component consists of an inter-temporal optimal growth model in which the energy inputof the aggregate production function has been expanded togive a bottom-up like description of the energy sector.World countries are grouped in 12 regions13 that strategi-cally interact following a game theoretic structure. A three-box climate module and a damage function provide feed-back to the economy from the emissions of carbon dioxideinto the atmosphere (see Nordhaus and Boyer, 2000).14 TheWITCH top-down framework guarantees a coherent, fullyinter-temporal allocation of investments that have animpact on the level of mitigation — R&D effort, investmentin energy technologies, and fossil fuel expenditures. Theregional specification of the model and the presence ofstrategic interaction among regions — through CO2, exhaus-tible natural resources, and technological spillovers — allowus to account for the incentives to free-ride. Applying anopen-loop Nash game, the investment strategies are opti-mized by taking into account both economic and environ-mental externalities. In WITCH the energy sector has beendetailed and allows a reasonable characterisation of futureenergy and technological scenarios and an assessment oftheir compatibility with the goal of stabilising greenhousegases concentrations. Also, by endogenously modelling fuel(oil, coal, natural gas, uranium) prices, as well as the cost ofstoring the captured CO2, the model can be used to evaluatethe implication of mitigation policies for the energy system
12 Based on an extensive assessment of the literature, a range ofmodeling approaches, and close interaction with many groupsand individuals, the IPCC has developed a set of long-termemission scenarios which are described in the IPCC SpecialReports on Emission Scenarios (SRES). These scenarios cover awide array of driving forces for future emissions, and encompassdifferent future developments that might influence GHG sourcesand sinks. Themost recent set of scenarios was published in 2000,more information is available at http://www.grida.no/climate/ipcc/emission/.13 1) CAJANZ (Canada, Japan, New Zealand); 2) USA; 3) LACA(Latin America, Mexico and Caribbean); 4) OLDEURO (Old Europe);5) NEWEURO (New Europe); 6) MENA (Middle East and NorthAfrica); 7) SSA (Sub-Saharan Africa excl. South Africa); 8) TE(Transition Economies); 9) SASIA (South Asia); 10) CHINA (includ-ing Taiwan); 11) EASIA (South East Asia); 12) KOSAU (Korea, SouthAfrica, Australia).14 The three-box climate model is based on a reduced form of theMAGIC climate model. Radiative forcing depends on CO2 con-centrations and is corrected for exogenous forcing coming fromother gasses and aerosols.
in all its components. For a thorough description of themodel see Bosetti et al. (2006, 2007).
The model simulates each climate policy scenario, thusproviding the ingredients for the subsequent comparisonphase. A set of indicators accounting for performances indifferent dimensions is stored for each simulated scenario;particularly relevant is information concerning its economic,social and environmental performances. In principle, in thecase when more than one model has been simultaneouslyused to simulate each policy scenario,multiple values for eachindicator should be stored. The comparison phase is obviouslyextremely sensitive to the choice of indicators used torepresent different dimensions of sustainability. The choicemay depend on what features one would like to emphasiseand/or onwhat features themodel accounts for. Modelswith aregional detail can provide information on the distribution ofthe burden of positive and negative impacts across the world.Obviously, this cannot be accounted for in world aggregatemodels, even though the issue of uneven distribution isrecognised as one of the most problematic features of theclimate change issue. Besides, models with a detaileddescription of different climate change impacts15, can providea wider set of environmental indicators.
Given a set of indicators — the reader is referred to adetailed discussion on indicators used in the present analysisand reasons behind their choice later in the paper — it is notalways univocally possible to assess which are the mostpromising policies, unless one weakly dominates all theothers (i.e. a policy is superior in at least one dimensionwithout being inferior in any of the remaining dimensions).This depends on the fact that no straightforward ways ofaggregating different impacts exist. Therefore, even though aset of modelling groups is asked to report to an internationalorganisation, say the IPCC, on long-term implications ofdifferent policy scenarios, results might not be straightfor-wardwhen read. The DEA approach overcomes the problem ofincomparability in that it endogenously infers a set of weightsby enveloping the data. Note that DEA is extended from itstraditional application, namely the evaluation of productionfirms' performances, to evaluating the performance of poli-cies. Thus, terms such as inputs and outputs, traditionallyadopted in the DEA framework, have to be understood here ina broader sense as indicators of costs (or whatever indicatorsfor which lower values are preferred) and indicators ofbenefits.
There are two alternative DEA approaches to compare thesustainability of different policy scenarios; one based on theefficiency score defined as a relative ratio and another basedon Competitive Advantage (CA)measured in terms of absoluteprices.
In the first case, more in line with traditional DEAapplications, relative efficiency measures are computed foreach policy, where efficiency is measured as the ratio of theweighted sum of outputs (i.e., indicators whose maximumvalues are better) to the weighted sum of inputs (i.e.,
15 For example, information on the impact on sea-level rise couldbe included in the analysis. See Roson et al. (2004).

1344 E C O L O G I C A L E C O N O M I C S 6 8 ( 2 0 0 9 ) 1 3 4 0 – 1 3 5 4
indicators whose minimum values are optimal). In particular,a policy is 100% efficient if and only if:
– none of its outputs can be increased without eitherincreasing one or more of its inputs, or decreasing someof its other outputs;
– noneof its inputs canbedecreasedwithout eitherdecreasingsome of its outputs or increasing some of its other inputs.
To illustrate, let us consider a simple numerical example offive policy scenarios, denoted in Fig. 2 as A, B, C, D and E, eachusing different combinations of two indicators to be minimised(input), say some inequity indicator and the level of temperatureincrease, and one output to be maximised, say somemeasure ofglobal welfare. In order to facilitate comparisons, input levels areexpressed per unit of output. Data are plotted in Fig. 2. A kinkedfrontier isdrawnfromAtoCtoD, representing thesetof relativelyefficient scenarios, and the frontier envelopes all these datapoints and approximates a smooth efficiency frontier. Scenarioson the efficiency frontier are assumed to be efficient relative toscenarios B and E, which are considered to be dominated.
Following the second approach, for each scenario the neteconomic impact, expressed in monetary value, is aggregatedthrough weights to the social and environmental impacts,which are expressed in their own unitary measures. DEA isapplied in order to obtain the weights by “letting the dataspeak”. Themain advantage of this approach is that efficiencyis measured in absolute monetary terms (see Kortelainen andKuosmanen, 2007, for details on this approach).
As discussed above, a choice has to be made about whichindicators to use in order to evaluate each simulated scenario.An indicator accounting for the global inter-temporal economicperformance of the scenario needs to be defined. In ourapplicationwepropose a globalwelfare indicator for eachpolicyscenario defined as the discounted present value of GDPsummed over all world regions. In addition, each scenario ischaracterisedbya social impact indicatorandanenvironmentalimpact indicator. In our application, to account for the socialperspective, we value each scenario for its impact on thedistribution of income among different regions of the world,measured using an equity index. The choice of a certainmeasure of inequality is a debated one, because it always
Fig. 2 –The relative efficient frontier.
involves the introduction of specific value judgements; seeAtkinson (1970) for a detailed discussion of this topic. In ourworkweadopt theGini indicator16 to account for theequity levelreached by the end of the century in each different scenario.
Finally, in order to account for the environmental impact ofeach policy once more one faces the choice among severalalternative measures; e.g. carbon or GHGs emissions, carbonor GHGs atmospheric concentrations, increase in radiativeforcing or in temperature or total damage. For simplicity, inthe present study we employ the increase in temperatureabove pre-industrial levels in degrees Celsius.
2.1. DEA relative efficiency computation
The first approach considered involves the computation ofrelative efficiency scores. A maximum score of unity (or 100%)is considered as the benchmark. Indicators are interpreted interms of inputs and outputs. Both inputs and outputs maybelong to the economic, environmental or social dimension. Inour application, we consider social and environmental indi-cators as inputs. Both the Gini indicator and the globalatmospheric temperature are optimal at minimum values.On the other hand, we consider global discounted GDP whichis optimal at maximum values as an output.
The efficiency score of each policy scenario is expressed asthe ratio of theweighted sumof outputs over theweighted sumof inputs. For each policy, a set of weights is chosen such that itmaximises its efficiency. More formally, given the set of Mpolicies, each with J outputs (benefits) given a set of I inputs(costs), let us denote the vectors representing the quantities ofoutputs and inputs relative to them-th policy scenario using yjmand xim, respectively. The efficiency of them-th policy can thusbe calculated as:
em ¼
PJj¼1
ujyjm
PIi¼1
vixim
;j ¼ 1; ::; Ji ¼ 1; ::; I
� �ð1Þ
where uj and vi are two vectors of weights used in themeasurement of policy m's relative importance of inputs andoutputs calculated through themaximisation problem,which isstated below for policym:
maxuj ;vi
ems:t:XJ
j¼1
ujyjn
XI
i¼1
vixin
V1 8n ¼ 1; N ;m;: : :;M
0VujV10VviV1 :
ð2Þ
Weights must be constrained to take strictly positivevalues (greater than or equal to a very small quantity epsilon)so that no inputs or outputs are ignored in the process ofdetermining the efficiency of each policy.
16 The Gini coefficient is a measure of statistical dispersion andis used here as a measure of inequality of income distributionacross different regions of the world.

19 Annex B-US denotes the countries listed in the Annex B of theKyoto Protocol without the participation of the United States.20 The Kyoto Protocol imposes absolute reduction targets, i.e. areduction of absolute GHG emissions by a specified percentage.21 In order to replicate the US strategy as precisely as possible, ourmodel computes the −18% intensity reduction by 2010 compared totheyear 2000.Climatepolicy in termsof emission intensity targets istypically expressed as percentage reductions from some base yearlevel. In the US context, greenhouse gas intensity is given by theratio of greenhouse gas emissions to economic output.22 Note that scenarios 2 to 6, chosen to cover both optimistic and
1345E C O L O G I C A L E C O N O M I C S 6 8 ( 2 0 0 9 ) 1 3 4 0 – 1 3 5 4
If the solution to the maximisation problem gives a value ofefficiencyequal to 100, the corresponding scenario is consideredto be efficient or non-dominated; if instead the efficiency valueis inferior to 100, then the corresponding scenario is said to bedominated, and therefore does not lie on the efficiency frontier,which is defined by the envelopment of efficient scenarios.Furthermore, information concerning potential improvementsof inefficient policies can be obtained.
2.2. DEA-based cost benefit analysis
Following the second DEA approach, we can define totalbenefit, TBm of policy m as the difference between the globalwelfare index, NBm
17, and the environmental, Ze,m and social,Zs,m impacts, more formally:
TBm ¼ NBm � peZe;m � psZs;m ð3Þwhere pe and ps are theweights associated to the environmentaland social indices. As extensively discussed in Kuosmanen andKortelainen (2007), we can consider the problem from a gametheoretic perspective and suppose that supporters of a parti-cular policy can adopt strategic opportunistic behaviour andpropose18 theweightvector,p,whichmaximises theadvantagesof their supported policy over that of the others. In practice, thisconsists of solving, for each policym, the problem of choosing anon-negative weight vector that maximises that policy'sCompetitive Advantage (CAm), defined as the (minimum)multi-dimensional distance to all other policy's total benefits.More formally, it consists of solving, for each of the analysedpolicies,m∈M, the following linear programming problem:
maxpe ;ps
CAm
s:t:CAmV NBm � peZe;m � psZs;m
� �� NB1 � peZe;1 � psZs;1� �
CAmV NBm � peZe;m � psZs;m� �� NB2 � peZe;2 � psZs;2
� �vCAmV NBm � peZe;m � psZs;m
� �� NBm�1 � peZe;m�1 � psZs;m�1� �
CAmV NBm � peZe;m � psZs;m� �� NBmþ1 � peZe;mþ1 � psZs;mþ1
� �vCAmV NBm � peZe;m � psZs;m
� �� NBM � peZe;M � psZs;M� �
NBm � peZe;m � psZs;mz0pe;psz0 ð4Þ
:
When the m-th policy turns out not to have any competitiveadvantageover theothers, CAmb 0, evenallowing for the choiceofthe most convenient weight vector, then the policy should berejected, according to the chosen set of indicators. For policiesshowing a non-negative competitive advantage over otherpolicies CAm≥0, a sensitivity analysis on weights should beperformed in order to obtain more information. Indeed, if one orbothweights are set at zero— in order tomagnify the competitiveadvantage of the policy — it means that one or both of theenvironmental and social dimensions have been dropped out ofthe valuation procedure. The process can be enhanced byinterfacing the discussion on the domain of weights with the
17 NBm represents the global economic welfare measured as thepresent value of GDP summed over all world regions, expressed in1995 USD.18 On the basis of results from a contingent valuation survey, forexample.
political debate, thus enabling policy makers to gain a betterunderstanding of how to interpret analysis results.
3. Eleven climate policy scenarios
Based on the above methodological framework, a number ofpolicy scenarios canbe evaluated. This sectionwill introduce thepolicy scenarios that have been chosen for our analysis, anddescribe the relevant policy framework as well as the reasonsbehind the choices that were made. In total, we have designedeleven scenarios on the basis of indications from policyprocesses and the scientific community. The resulting scenariosare particularly relevant for potential considerations of futureclimatepolicy, andcoveraseriesofpotential futureperspectives.The number of scenarios is arbitrary; given the overall objectiveof appropriately testing a new evaluation tool, a wide range ofboth more and less likely options are essential. In addition tothese policy scenarios, we provide as a first scenario a business-as-usual projection in order tohavea credible benchmark for ourevaluation. The BAU scenario is characterised by a continuationof the current trends in the main economic and environmentalparameters. In particular, inWITCHbaseline emissions andGDPgrowth are in line with a B2 storyline of IPCC SRES scenarios.
The remaining eleven policy scenarios possess some com-mon features. In particular, all scenarios assume that theabsolute emission reductions defined in the Kyoto Protocolwill be achieved by the Annex B-US countries19 by 2010 (firstcommitment period). Indeed, it was Russia's ratification of theKyoto Protocol onNovember 4, 2004 that opened theway for theProtocol's coming into force on February 16, 2005, thus makingthe emissions targets takenon for the 2008–2012 period bymorethan 30 developed countries (including the EU, Russia, Japan,Canada, New Zealand, Norway and Switzerland) legallybinding.20 According to its domestic policy target, the US isassumed to achieve its −18% emission intensity target in orderto slow the growth of GHG emissions per unit of economicactivity over the next 10 years.21 Developing countries have notarget in the first commitment period. Then, different assump-tions characterise the different scenarios from 2020 onwards.22
The second scenario assumes a continuation of the currentsituation. After the US announced its defection from the Kyoto
pessimistic predictions on future abatement targets, have alreadybeen discussed in greater detail in Buchner and Carraro (in press)In particular, using the integrated climate-economy model FEEM-RICE, the six different scenarios of future emission abatemencommitments were analysed to provide an assessment of theirimplications for the economy. Here we will briefly review theirmain features in order to give the reader a comprehensivebackground to our analysis.
.
t

26 At the Council meeting in February 2007, the environmentministers agreed on the emission reduction targets proposed bythe European Commission in January 2007, showing the will-
1346 E C O L O G I C A L E C O N O M I C S 6 8 ( 2 0 0 9 ) 1 3 4 0 – 1 3 5 4
Protocol in March 2001, the remaining countries that hadaccepted quantifiedmitigation commitments under the KyotoProtocol — in particular the EU and Japan — put great effortinto the continuation of the Kyoto process, in particular byconvincing Russia to participate in the Protocol. After meetingthe Kyoto objectives at the end of the first commitment period,this scenario assumes that the Annex B-US countries decide tomaintain their initial Kyoto targets and thus the correspond-ing emission level until the year 2100, whereas the US remainsout of the Kyoto Protocol and implements no effective climatepolicy. This scenario thus represents the situation in whichthe Annex B-US countries behave according to the “Kyotoforever” hypothesis, whereas the US and the developingcountries have no binding emission constraints. All countriesadopt cost-effective environmental policies, and in particular,emissions trading takes place among the Annex B-US countries.
In the third scenario we assume that, given internationaland domestic political pressures, the US decides to join thegroup of countries committed to the Kyoto Protocol in thesecond commitment period and afterwards. Continuity withKyoto could be attractive for the countries that are alreadyengaged in the Kyoto Protocol, i.e. the Annex B-US, since thesecountries have already made a substantial investment in theKyoto process (Bodansky, 2003). Developing countries, as in“Kyoto forever”, are assumed not to adopt any emission targetuntil 2050. Consequently, by 2100, emissions in Annex Bcountries will be stabilised at about −5% of their 1990 values,whereas emissions in developing countries will keep growing.
Common assumptions characterise the second commitmentperiod (2010–2020) in scenarios 4 and 5.23 International anddomestic pressures for climate change control are expected toinduce countries to further strengthen their efforts in interna-tional climate policy (Cf. IPCC WG1, 2007). In particular, by 2020,both the Annex B countries that have currently ratified the KyotoProtocol and the US are assumed to agree to reduce emissions byan additional 20% from 1990 levels. The ‘−20% objective fordeveloped countries’ scenario seems to be a real possibility givenrecent policy signals. On one hand, the European Commissionpresented its Integrated Energy and Climate Package on 10 January2007 with the objective of establishing a new energy policy forEurope to combat climate change and at the same time boost theEU's energy security and competitiveness.24 Among others, theCommission put forward plans for ambitious GHG emissionstargets: a reduction of 30% in GHG emissions from developedcountries by 2020 is proposed if an international agreement canbe reached. Alternatively, a unilateral EU emissions reductiontarget of at least 20% by 2020 is proposed.25 These targets have
23 Under the original UNFCCC intentions, the second commitmentperiod was supposed to last from 2013 to 2017. However, there arediscussions about the possibility of longer commitment periods inorder to provide more flexibility and predictability to actors. Due tothese debates and given constraints in themodel— particularly thebase year of 2002and the timesteps of five years— the commitmentperiods are defined differently.24 The communication from the Commission on “An energy policyfor Europe” can be downloaded at http://eur-lex.europa.eu/LexUr-iServ/site/en/com/2007/com2007_0001en01.pdf.25 The communication from the Commission on “Limiting GlobalClimate Change to 2 degrees Celsius — The way ahead for 2020and beyond” can be downloaded at http://ec.europa.eu/environ-ment/climat/pdf/future_action/com_2007_2_en.pdf.
subsequently been supported by the environmentalministries ofthe EU member states.26 On the other hand, a −10% target fordeveloped countries was indicated as the most likely one for thesecond commitment period by a panel of 78 experts interviewedby Böhringer and Löschel (2003). Taking all these signals intoaccount, a 20%-target for industrialised countries appears a likelycompromise. Inorder toaccount fordevelopingcountries' need tocontinue their economic and social development, they are stillexempt from complying with emission reduction targets. Thisassumption is also in line with recent research studies whichconclude that it is unlikely that developing countries will beincluded in international climate change control agreementsbefore 202027 and conforms with indications from the policyprocess (for instance, arising from the “Dialogue on long-termcooperative action to address climate change by enhancingimplementation of the Convention” that was launched underthe UNFCCC). Scenarios 5 to 12 are based on the sameassumptions for the second commitment period, apart from thefact that the more ambitious emission reduction targetssupported by the European Union are assumed for industrialisedcountries (−30% in GHG emissions 2020).
In the fourth scenario, therefore, the Annex B-US countriesachieve the Kyoto target in the first commitment period andthe −20% target (w.r.t. 1990 emissions) in the second one. TheUS adopts its −18% intensity target in the first commitmentperiod and the −10% absolute target (w.r.t. 1990 emissions) inthe second one. Developing countries do not commit to anyemission reductions. After 2020, we assume that cooperationon climate change control collapses and emissions return totheir business-as-usual (BAU) paths.
The fifth scenario is based on the idea that Kyoto targets arelargely sub-optimal — i.e. the incentives to reduce carbonemissions should be great enough to reach more ambitioustargets — and that countries are only likely to adopt targetscloser to the optimal ones in the medium term. The two initialcommitmentperiods are thesameas in scenario 4.Then,AnnexB countries (including the US) and developing countries adoptwhat we call “enhanced permanent cooperation emissiontargets”, computed as follows. All countries cooperativelymaximise their joint welfare with respect to their policyvariables, including GHG emissions, and cooperatively inter-nalize the global environmental externality. This yields the
ingness to commit to a 30% reduction of 1990 GHG emission levelsby 2020, “provided that other developed countries committhemselves to comparable emission reductions and economicallymore advanced developing countries adequately contributeaccording to their responsibilities and respective capabilities”and suggesting that the EU should reduce GHG emissions to 20%below 1990 levels by 2020. This last conclusion will also beaddressed at the Spring European Council (8–9 March 2007).Further details are provided at http://europa.eu/rapid/pressRelea-sesAction.do?reference=PRES/07/25&format=HTML&aged=0&lan-guage=EN&guiLanguage=en.27 For example, expert judgements presented in Böhringer andLöschel (2003) reveal that in the second commitment period up to2020 “… in 75% of the policy-relevant scenarios, developingcountries do not commit themselves to binding targets.” (p. 9).
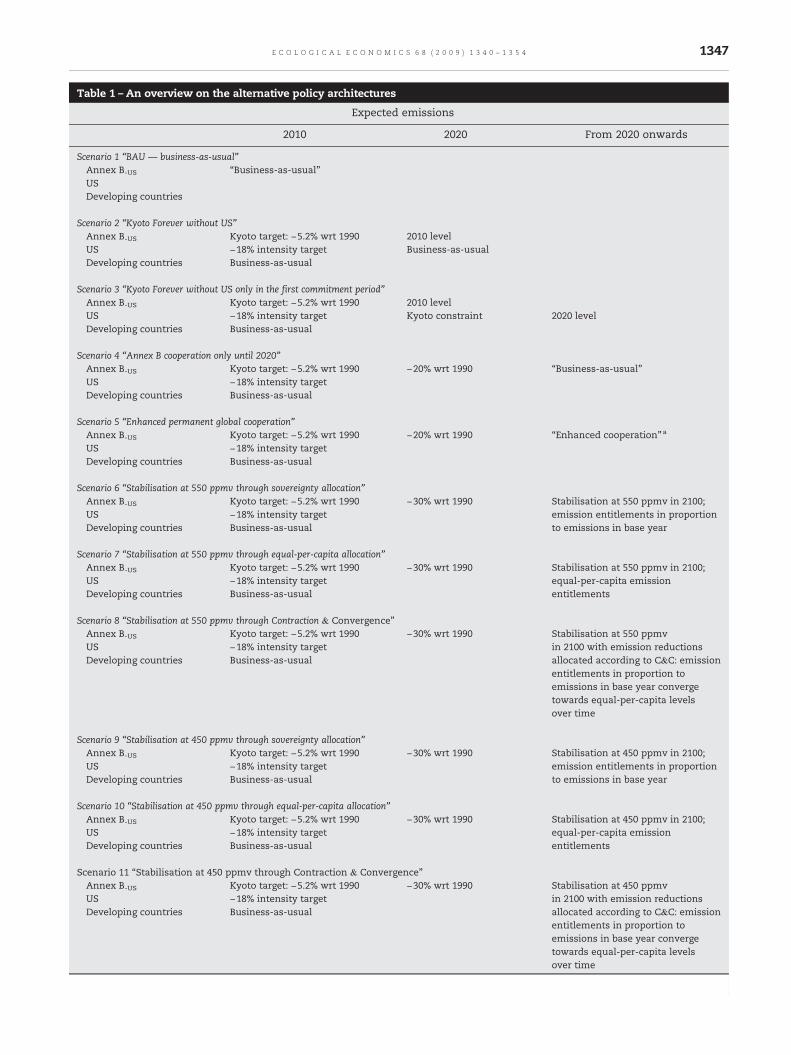
Table 1 – An overview on the alternative policy architectures
Expected emissions
2010 2020 From 2020 onwards
Scenario 1 “BAU — business-as-usual”Annex B-US “Business-as-usual”USDeveloping countries
Scenario 2 “Kyoto Forever without US”Annex B-US Kyoto target: −5.2% wrt 1990 2010 levelUS −18% intensity target Business-as-usualDeveloping countries Business-as-usual
Scenario 3 “Kyoto Forever without US only in the first commitment period”Annex B-US Kyoto target: −5.2% wrt 1990 2010 levelUS −18% intensity target Kyoto constraint 2020 levelDeveloping countries Business-as-usual
Scenario 4 “Annex B cooperation only until 2020”Annex B-US Kyoto target: −5.2% wrt 1990 −20% wrt 1990 “Business-as-usual”US −18% intensity targetDeveloping countries Business-as-usual
Scenario 5 “Enhanced permanent global cooperation”Annex B-US Kyoto target: −5.2% wrt 1990 −20% wrt 1990 “Enhanced cooperation”a
US −18% intensity targetDeveloping countries Business-as-usual
Scenario 6 “Stabilisation at 550 ppmv through sovereignty allocation”Annex B-US Kyoto target: −5.2% wrt 1990 −30% wrt 1990 Stabilisation at 550 ppmv in 2100;
emission entitlements in proportionto emissions in base year
US −18% intensity targetDeveloping countries Business-as-usual
Scenario 7 “Stabilisation at 550 ppmv through equal-per-capita allocation”Annex B-US Kyoto target: −5.2% wrt 1990 −30% wrt 1990 Stabilisation at 550 ppmv in 2100;
equal-per-capita emissionentitlements
US −18% intensity targetDeveloping countries Business-as-usual
Scenario 8 “Stabilisation at 550 ppmv through Contraction & Convergence”Annex B-US Kyoto target: −5.2% wrt 1990 −30% wrt 1990 Stabilisation at 550 ppmv
in 2100 with emission reductionsallocated according to C&C: emissionentitlements in proportion toemissions in base year convergetowards equal-per-capita levelsover time
US −18% intensity targetDeveloping countries Business-as-usual
Scenario 9 “Stabilisation at 450 ppmv through sovereignty allocation”Annex B-US Kyoto target: −5.2% wrt 1990 −30% wrt 1990 Stabilisation at 450 ppmv in 2100;
emission entitlements in proportionto emissions in base year
US −18% intensity targetDeveloping countries Business-as-usual
Scenario 10 “Stabilisation at 450 ppmv through equal-per-capita allocation”Annex B-US Kyoto target: −5.2% wrt 1990 −30% wrt 1990 Stabilisation at 450 ppmv in 2100;
equal-per-capita emissionentitlements
US −18% intensity targetDeveloping countries Business-as-usual
Scenario 11 “Stabilisation at 450 ppmv through Contraction & Convergence”Annex B-US Kyoto target: −5.2% wrt 1990 −30% wrt 1990 Stabilisation at 450 ppmv
in 2100 with emission reductionsallocated according to C&C: emissionentitlements in proportion toemissions in base year convergetowards equal-per-capita levelsover time
US −18% intensity targetDeveloping countries Business-as-usual
(continued on next page)
1347E C O L O G I C A L E C O N O M I C S 6 8 ( 2 0 0 9 ) 1 3 4 0 – 1 3 5 4

Table 1 (continued)
Expected emissions
2010 2020 From 2020 onwards
Scenario 12 “Meaningful Action”Annex B-US Kyoto target: −5.2% wrt 1990 −30% emission target
2020 wrt 1990−70% emission target 2050 wrt 1990,then stabilise thereUS −18% intensity target
Developing countries Business-as-usual until 2030(for China and India),business-as-usual until 2050(for Rest of the World)
−5% emission target 2050 wrt 2005
a Targets deduced from the optimal cooperative inter-temporal solution of the dynamic game among countries.
1348 E C O L O G I C A L E C O N O M I C S 6 8 ( 2 0 0 9 ) 1 3 4 0 – 1 3 5 4
optimal path of GHG emissions in all world regions, as itrepresents the cooperative outcome to all nations. This strategyleads to a global emission reduction of 50% with respect to thebaseline path (roughly this entails the stabilisation of globalemissions at a level which is 50% higher w.r.t. 2005).
Scenarios 6, 7 and 8 are based on the common view that astabilisation level of 550 ppmv28 in 2100 represents a reason-able goal; this goal was also adopted in the emissionmitigation scenarios examined by the Third IPCC report(IPCC, 2001).29 In particular, the analysis of Working Group IIIin the TAR suggests that achieving the aggregate Kyotocommitments in the first commitment period can be consis-tent with trajectories that achieve stabilisation at 550 ppmv bythe end of the century (WGIII TAR, Section 2.5.2). Thisconcentration level also coincides with a doubling of CO2
atmospheric concentrations compared to pre-industriallevels, implying a global warming of up to 3 °C with a changein the mean surface temperature in the range of 1.6 °C–2.9 °Cby 2100.30 This long-term goal is imposed from the secondcommitment period onwards, from 2020 to 2100, and is to beachieved through various means of burden sharing.
In the sixth scenario we assume that all countries agree tomake substantial efforts to control GHG emissions and tostabilise global GHG emissions at 550 ppmv in the year 2100.We assume linear convergence to 550 ppmv in 2100, starting in2020. This global target is allocated among the different worldregions according to the “sovereignty” equity rule, as sug-gested by the 78 experts interviewed by Böhringer and Löschel(2003). This rule requires that the emission entitlements areshared in proportion to emissions; current emissions thusconstitute a type of status quo at themoment (also recognisedas ‘grandfathering’). Therefore, the emission targets for 2030,2040 and 2050 for all world regions, including developing
28 Parts per million by volume is a measure of the concentrationof gases in the atmosphere.29 The target of not exceeding the 550 ppmv concentration levelis also supported by the EU. The first significant EU proposal for aclimate target for the post-2000 period, presented at the EUCouncil of Ministers in 1996, suggested stabilising the atmo-spheric concentrations of CO2 at a level around twice the pre-industrial level of about 280 ppmv, which corresponds to theconcentration target of 550 ppmv.30 In this range, although the strongest effects of climate changecan be prevented, potentially serious damage attributable toclimatic changes could still occur.
countries, are based on both the 550 ppmv stabilisation goaland the sovereignty rule.
The seventh scenario is based on the Rawlsian principle ofequal entitlements to emit, usually supported by developingcountries. The idea is to achieve the stabilisation of atmo-spheric concentrations at 550 ppmv in 2100 through burdensharing based on the equal-per-capita emissions.
The eighth scenario applies an allocation concept proposedby the Global Commons Institute, the so-called Contraction &
Convergence approach (Meyer, 2000), to stabilise atmosphericconcentrations at 550 ppmv in 2100. This burden-sharing ruleis also known as the Per Capita Convergence (PCC) approachand defines emission permits on the basis of a convergence ofper capita emissions under a contracting global GHG emissionprofile. In such a convergence regime, all countries participatein the climate regime with emission allowances allocated onthe basis of base year emissions and converging through timeto equal-per-capita levels over time.
The last four scenarios take into account the immensedangers embedded in a potential climate change. They arethus derived from the scientific perspective of climatologistswho claim that strong emission reductions are required inorder to halt the threat of global warming.
Scenarios 9, 10, and 11 are based on the aim to stabilise CO2
concentrations at 450 ppmv by 2100. This emission reductiontarget is in general considered to be quite stringent. It limitsglobal mean warming to less than 3 °C (see the analysis by theWorking Group III in IPCC, 2001), thus making the achieve-ment of the often-cited 2 °C target possible. Stabilisingemissions at this level is supposed to significantly reduce oreven avoid many of the impacts listed for 3 °C warming ormore, and lead to much higher benefits than stabilisation athigher levels.31 We assume linear convergence to 450 ppmv in2100, starting in 2020, imposing the same criteria as in the550 ppmv scenarios (i.e., in scenario 9 according to sovereigntyallocation, in scenario 10 according to equal-per-capitadistribution and in scenario 11 according to the lines ofContraction & Convergence.).
The twelfth scenario, ‘Meaningful Action’, starts from thesame premise as the previous ones, namely that seriousemission reductions are essential. Therefore, developedcountries are assumed to follow the suggestion by the
31 Note, however, that there would still be the risk of impactsassociated with mean warming of less than 3 °C.

Fig. 3 –Different scenarios' performances in terms of temperature increase (a), GWP (b), expressed as the % difference wrt thebaseline scenarios, and equity (c).
1349E C O L O G I C A L E C O N O M I C S 6 8 ( 2 0 0 9 ) 1 3 4 0 – 1 3 5 4

1350 E C O L O G I C A L E C O N O M I C S 6 8 ( 2 0 0 9 ) 1 3 4 0 – 1 3 5 4
European Commission, e.g. to reduce their GHG emissions by30% compared to their 1990 emissions by 2020. Starting from2020, the industrialised countries are supposed to haveachieved a total reduction in GHG emissions of −70% withrespect to their 1990 emissions by 2050. This target is based onthe recommendations of several politicians regarding thedangers of climate change. In a recent announcement, theEuropean Council re-affirmed this intention, although theambitious goal has not yet been supported by an agreedstatement.32 The need for a stringent long-term emissionsreductions goal is also reflected in the recent waves of US billson climate change action, and McCain and Lieberman proposeto reduce US emissions by 2050 by 60% compared to 1990emissions.33 Developing regions on the other hand, areallowed to continue their business-as-usual path up to 2050in order to continue their development. However, from 2030onwards, the large developing countries China and India agreeto reduce their emissions by 5% compared to their 2005 levelsby 2050. These targets thus imply strong emission reductionsin both the US and the developing countries. From 2050onwards, when countries have achieved the ambitious emis-sion levels, all nations are committed to maintaining theseemission levels, which leads to atmospheric CO2 concentra-tions of just above 450 ppm.
Table 1 provides a comprehensive summary of the mainfeatures of the 12 scenarios. It also highlights that thescenarios can be organised within three groups of environ-mental effectiveness: low (scenarios 1 to 4), medium (scenar-ios 5 to 8) and high (scenarios 9 to 12).
The clustering in terms of environmental effectiveness alsoappears in part a of Fig. 3, where we show the performance ofthese 12 scenarios along the different dimensions we havechosen to consider for the present analysis. As expected, aclustering mirroring environmental effectiveness appearswhen considering the economic cost imposed by eachscenario (part b of Fig. 3). More stringent scenarios are alsomore burdensome in terms of cost. A slightly different storycan be told with respect to the distribution of income resultingfrom different burden-sharing rules (part c of Fig. 3). When alarger share of the burden is left on the shoulders ofdeveloping countries the effect on equity is negative andincreasingly so the more stringent the policy is. On the otherhand, Contraction & Convergence or equal-per-capita basedallocation results in better equity distribution by the end of thecentury.
32 On March 23 2005, the 25 ministers agreed that developednations should pursue cuts of heat-trapping gases of 15–30percent by 2020 and 60–80% by 2050 compared with levels set inthe Kyoto Protocol, which uses 1990 as a base in most cases. Butthe longer-term 2050 goal has been omitted from an agreedstatement. At the Council meeting in February 2007, the environ-ment ministers agreed on the emission reduction targetsproposed by the European Commission in January 2007, butmade no progress on the 2050-target.33 For an overview of recent economy-wide US cap and tradeproposals see http://www.pewclimate.org/docUploads/110th%20Congress%20Economy-wide%20Cap&Trade%20Proposals%2001-30-2008%20-%20Chart.pdf.
4. Discussion of results and conclusions
For the purpose of this paper, we have simulated a set ofeleven policy scenarios, computed the three indicators foreach of them (cumulated discounted GDP over the century,temperature increase by 2100, and the Gini equity indicator by2100), and finally applied DEA using the two approaches. Asmentioned above, the idea is to have each scenario evaluatedas its supporters would do, thus selecting weights to aggregateindicators in the most favourable way for that scenario. Whilethe evaluation of a policy is typically made either on the basisof its short/long-term economic performance or on environ-mental performance alone, this approach allows accountingfor more dimensions contemporaneously. Results derivedfrom the two DEA interpretations are very similar, but wepresent both of them in order to emphasise the potentials ofeach of the two approaches. Given that even technicallysophisticated ranking systems often contain hidden biases,our aim in this final section is to present how the ranking ofpolicy scenarios differs when different assumptions aremade.This information allows us to shed some light on the draw-backs of the methodology as well as to point out the robustlessons that can be drawn from this analysis.
Three major findings emerge from the analysis: (i) strin-gent climate policies can outperform less ambitious proposalsif all sustainability dimensions are taken into account; (ii) acarefully chosen burden-sharing rule is able to bring togetherclimate stabilisation and equity considerations; and (iii) themost inefficient strategy results from the failure to negotiate aglobal post-2012 climate agreement.
Let us first consider the ranking of scenarios in efficiencyterms. The efficiency scores for the eleven plus one policyscenarios have been estimated using the DEA relativeefficiency computation, assuming both constant (CRS) andvariable returns to scale (VRS).34 Scenarios are ranked indecreasing order of relative efficiency, with the most efficientscoring 1.
According to theCRS analysis (results are shown in Table 2),scenario 7, the stabilisation at 450 ppmv (CO2 only) assumingan equal-per-capita allocation rule, strictly dominates theothers. Indeed, an interesting result emerging from Table 2 isthat according to the CRS approach the more environmentaleffective scenarios are also the more efficient ones; all fourscenarios belonging to the group of high environmentaleffectiveness, scenarios 9 to 12, are characterised by a highefficiency score.
To verify the outcome of the efficiency ranking if differentassumptions were adopted, we calculated the results for theVRS specification of the same model. As expected, the CRSapproach tends to lower the efficiency scores while the VRSapproach tends to raise efficiency scores, as showed in Table 3,where the proportion of efficient scenarios becomes relativelyhigher when variable returns to scale are assumed. The VRSapproach's generosity in assigning full efficiency scores allows
34 Returns to scale refers to increasing or decreasing efficiencybased on how ambitious a climate policy scenario is. Givenabatement costs are highly non-linear the VRS assumption isprobably more appropriate here.

Table 4 – Competitive advantages of different scenarios
Table 2 – Results of the DEA ranking of scenarios (CRS)
Scenario Score
“450 ppmv EPC” 1.00000“450 ppmv C&C” 0.99977“450 ppmv SOV” 0.99873“Meaningful Action” 0.94860“550 ppmv EPC” 0.80904“550 ppmv C&C” 0.80735“550 ppmv SOV” 0.80727“Enhanced cooperation” 0.73722“Kyoto Forever w/o US” 0.69154“Kyoto Forever w/o US in 1st period” 0.66586“Annex B coop until 2020” 0.64257“BAU” 0.63726
1351E C O L O G I C A L E C O N O M I C S 6 8 ( 2 0 0 9 ) 1 3 4 0 – 1 3 5 4
for lower discrimination capacity, which is one of the potentialdrawbacks of the methodology. Nonetheless, there appears tobe one winner and two losers emerging from both analyses,namely one policy at least weakly dominating all the othersand two policies at least weakly dominated by all the others.
Let us first discuss the ‘winner’ among the scenarios,scenario 7: the stabilisation at 450 ppmv through equal-per-capita allocation. This policy represents the best performancewithin each of the three categories, in terms of costs, of equity/wealth redistributionandof environmental effectiveness. Let ustry to understand why this scenario — which due to its highenvironmental stringency is not necessarily expected to be themost efficient scenario — is dominating all the others. Itsattractiveness in environmental terms is obvious: indeed, thereis an effective impact on temperature increase (1.7 °C by 2100)which puts this scenario among those performing best inenvironmental terms. Of course, this strong environmentaleffectiveness comes at a high cost, but that cost is still lowerthan the cost of scenarios 6 and 8[AU1]. The pressure put ondeveloped countries by this burden-sharing rule stimulateslarge R&D investments and spurs innovation that in turn spillsover to other countries. This lowers the cost of stabilisationeffortswith respect to scenarioswith the same ambitious targetbut a different allocation scheme.At the same time, theway theburden of this climate policy is distributed amongworld regionsimplies a significant redistribution of wealth, which allows thisscenario to have the best performance in social terms (togetherwith scenario 8). This result is interesting because it indicatesthat a stringent climate policy canbecomeanattractive option ifall sustainability impacts are taken intoaccount. Inaddition, it is
Table 3 – Results of the DEA ranking of scenarios (VRS)
Scenario Score
“BAU” 1.00000“Kyoto Forever w/o US” 1.00000“Enhanced cooperation” 1.00000“550 ppmv EPC” 1.00000“450 ppmv C&C” 1.00000“450 ppmv SOV” 1.00000“450 ppmv EPC” 1.00000“550 ppmv C&C” 0.99910“550 ppmv SOV” 0.99874“Meaningful Action” 0.99623“Kyoto Forever w/o US in 1st period” 0.99330“Annex B coop until 2020” 0.94084
also supported by the fact that the two scenarios that ranksecond and third in both analyses also belong to the group ofmost environmentally effective scenarios, i.e. stabilisation at450 ppmv through respectively Contraction& Convergence andsovereignty allocation.
As mentioned, both the CRS and VRS DEA efficiencyapproaches also indicate two dominated scenarios, “Annex Bcooperation until 2020” (scenario 4) and “Kyoto Foreverwithout US only in the first period” (scenario 3). Theinefficiency of scenario 4 comes as no surprise. Mostimportantly, the relatively low costs it entails cannot out-weigh the implications that the failure of the negotiationprocess to produce a follow up set of climate policies forsubsequent phases would involve. Indeed, such a situationwould inevitably imply the loss of sunk cost for the earlyreductions without getting any overall positive social orenvironmental effect. Similarly, scenario 3 appears to berelatively inefficient for a number of reasons. First of all,even if the cooperation between industrialised countries isextended, the lack of participation from developing countriesfails to bring about the halt in emissions needed to make achange (by the end of the century temperature has increasedby just 0.25 °C less than in the baseline). To worsen thesituation, poor environmental performance is coupled withthe US's costly participation to the agreement. One shouldnotice that in all scenarios we assume non-OECD countriesparticipate in the carbon market (in scenarios where they donot undergo any cuts in emissions they trade their baselineemissions). If this were not the case, then the marginal cost ofabatement for the countries involved would be even higherand this scenario would have an even worse performance.
As mentioned, an appropriate burden-sharing rule canincrease the efficiency of climate policies. In particular, if equityis a concern, then allocations based on the equal-per-capitaprinciple, or similarly on rules entailing significant redistribu-tion ofwealth fromdeveloped to developing countries, are to bepreferred. The roleof equity is alsodominant indetermining theinefficiency of the “Meaningful Action” scenario (scenario 12),where a large part of the effort is undertaken by fast growingcountries. One could argue that efficiency is lost at the cost ofpolitical feasibility, given that significant abatement efforts bydeveloping countries is a pre-condition for a number of
Scenario CAN0, forpeN0.5 and
psN0.5
CAN0, forpeNε andpsN ε
CAN0, forany Pe and
Ps
“BAU” – – ✓
“Kyoto Forever w/o US” – ✓ ✓
“Kyoto Forever w/o US in1st period”
– – –
“Annex B coop until 2020” – – –“Enhanced cooperation” – – ✓
“550 ppmv EPC” – ✓ ✓
“550 ppmv C&C” – – –“550 ppmv SOV” – – –“450 ppmv C&C” – – –“450 ppmv SOV” – – –“450 ppmv EPC” ✓ ✓ ✓
“Meaningful Action” – – –

36 As pointed out by one of our referees, we have tested for thesensitivity of the ranking to upper bounds on weights. We havethus assumed an upper bound of weights which is equal to3 trillion 1995 USD which is the value resulting from the rough
1352 E C O L O G I C A L E C O N O M I C S 6 8 ( 2 0 0 9 ) 1 3 4 0 – 1 3 5 4
countries to accept a stringent future climate policy. However,this allocation clearly limits the level of convergence acrosscountries reached by the end of the century, thus leading to alow performance in terms of equity.
The results of the DEA-based Cost Benefit Analysis confirmsome of the findings emerging from the DEA efficiencycomputation. The competitive advantage analysis makes itpossible to investigate results for different lower bounds onweights, which represent different assumptions about therelative importance policy makers attach to the social andenvironmental dimensions. Results are reported in Table 4,where scenarios with a positive competitive advantage areassigned a tick.
Let us start by considering the case where each scenario'scompetitive advantage is computed allowing weights toassume any positive value (last column in Table 4). Assigninga positive weight to the environmental and/or social effec-tiveness has negative consequences for scenarios performingpoorly in terms of increase in temperature or equity levels.Thus, policy makers supporting these scenarios will have anincentive to assign zero weights to those criteria. On the otherhand, scenarios entailing a positive performance in terms of,say, avoided temperature increase, will assign a positiveweight to the environmental dimension, because this willgive them a competitive advantage over the other scenarios.For example, policy makers in favour of the baseline scenario,which has the lowest performance in terms of avoidedtemperature increase, will assign a zero value to the environ-mental effectiveness indicator.Where weights can range fromzero to any positive value this setting has a low power ofdiscrimination, in the sense that relatively low environmentaland social performances can be “hidden” by assigning zeroweights to that dimension. What we see from this analysis isthat the set of policies with negative performances isconsistent with those emerging from the previous analysis,strengthening the robustness of previously discussed results.
In a second step, let us consider the casewhere bothweightsare constrained to a minimum, but have a positive value (ε).Although arbitrary, one way of proceeding is to increase thelower bounds on weights from zero to the first value for whichthe baseline scenario ceases to exert a competitive advantageover the other scenarios. The corresponding weights are 0.005trillion 1995 USD per unit of temperature and per unit of equityindicator, respectively.35 In order to provide some insight on themeaning of these weights we compare the temperature weightwith the avoided damage costs associated with the decrease in2100 temperature from 3 °C to 2 °C by using the quadraticdamage function estimated in Nordhaus and Boyer (2000) andcomputing the present value by assuming that avoideddamages are perceived during the last 30 years of the century.Thediscounted figure isaround3 trillion1995USD.Compared tothis number, the first set of bounds is fairly low. This is thereason why we refer to the second column as the case whereboth weights have to be greater than an arbitrarily smallnumber, ε. What we see is that three scenarios have a positivecompetitive advantage over others: one for each of the
35 Weights are used to aggregate the increase in temperature andthe equity score to the policy costs and are therefore expressed intrillions of 1995 USD losses per °C and per unit of equity.
environmental effectiveness groups. Both in the cases of mild(i.e., stabilisationat 550ppmv) and stringent (i.e., stabilisation at450 ppmv) scenarios the decisive factor for the positiveperformance of these scenarios is allocation based on per capitaterms, in that it improves the equity performance. Wheninstead a low degree of environmental effectiveness is theobjective of the climate policy scenario, then continued actionwithout the US is the preferred solution.
Finally, raising the lower bound of weights to the muchhigher value of 0.5 trillion 1990 USD per unit of temperaturereduction and per unit of equity attained, respectively, theonly scenario with a positive competitive advantage is the 450stabilisation based on the equal-per-capita principle.36 Thisagain confirms our previous findings, showing that stringentclimate policies can outperform less ambitious proposals ifmore dimensions are taken into account.
The findings of this analysis need to be interpretedcautiously, because of the arbitrariness of the choice ofindicators and of the simulation model. Nonetheless, thisstudy is an attempt to go beyond the comparisons of policyarchitectures based purely on economic terms that aretypically undertaken in order to discuss the advantages ofalternative long-term climate policies.
It is important to notice that DEA's drawbacks include ahigh sensitivity to variable selection, model specification,sample set and the choice of the simulationmodel. It is not ourintention to argue that DEA is the definitive solution to thewell known problem of ranking techniques applied tosustainability in that they tend to be “prone to error andcreate(s) the illusion of absolute and categorical interpreta-tion” (Morsea and Fraser, 2005, pag. 625). However, anappealing feature of this approach is that it allows one toassess the efficiency of policy alternatives in various dimen-sions of sustainability without imposing arbitrary weights orpreference assumptions. Since weights are openly assigned inorder to maximise the competitive advantage of each sce-nario, the methodology results in a ranking that can beconsidered as a useful benchmark to guide policy discussion.Moreover, by applying the DEA-based Cost Benefit Analysis itis possible to analyse the effects of constraining weights indetail, in order to evaluate competitive advantages based ondifferent perceptions of the dimensions at stake.
To conclude, the application of DEA on simulated data forex ante assessments of environmental policy options repre-sents an important operation for policy makers who want toshed some light on the relative performances of a number ofpolicy strategies that appear to be crucial for the evolution ofthe future climate debate. As a consequence, the approachadopted in this paper could be extremely beneficial ifcombined with different types of climate-economy modelsand different choices of cost and benefit indicators.
calculation done using the damage function as developed byNordhaus and Boyer (2000). Results are insensitive however toupper bounds above the value 0.5. In fact from that value onward,there is only one single scenario with a positive competitiveadvantage, namely the 450 EPC scenario.

1353E C O L O G I C A L E C O N O M I C S 6 8 ( 2 0 0 9 ) 1 3 4 0 – 1 3 5 4
R E F E R E N C E S
Atkinson, A.B., 1970. On themeasurement of inequality. Journal ofEconomic Theory 2, 244–263.
Barrett, S., 1994. Self-enforcing international environmentalagreements. Oxford Economic Papers 46, 878–894.
Bodansky, D., 2003. Climate commitments: assessing the options.Pew center on global climate change. In: Aldy, et al. (Ed.),Beyond Kyoto. Advancing the International Effort AgainstClimate Change. Pew Center on Global Climate Change.
Böhringer, C., Löschel, A., 2003. Climate policy beyond kyoto: quovadis? A Computable General Equilibrium Analysis based onExpert Judgements. Centre for European Economic Research(ZEW). ZEW Discussion Paper No. 03-09, Mannheim.
Bosetti, V., Locatelli, G., 2006. A data envelopment analysisapproach to the assessment of natural parks' economicefficiency and sustainability. The case of Italian national parks.Sustainable Development 14 (4), 277–286.
Bosetti, V., Carraro, C., Galeotti, M., Massetti, E., Tavoni, M., 2006.WITCH: a world induced technical change hybrid model. TheEnergy Journal, Special Issue on Hybrid Modeling ofEnergy-Environment Policies: Reconciling Bottom-up andTop-down, pp. 13–38.
Bosetti, V., Massetti, E., Tavoni, M., 2007. FEEM's WITCH Model:Structure, Baseline, Solutions. FEEMWorking Paper No 10/2007.
Botteon, M., Carraro, C., 1997. Burden-sharing and coalitionstability in environmental negotiations with asymmetriccountries. In: Carraro, C. (Ed.), International EnvironmentalAgreements. Strategic Policy Issues. E. Elgar, Cheltenham.
Buchner, B. Carraro, C., in press. Parallel Climate Blocs. Incentivesto Cooperation in International ClimateNegotiations. In: R. Guesnerie and H. Tulkens (Editors), TheDesign of Climate Policy. MIT Press.
Carraro, C., 1998. Beyond Kyoto: a game theoretic perspective. Inthe Proceedings of the OECD Workshop on “Climate Changeand Economic Modelling. Background Analysis for the KyotoProtocol”, Paris, pp. 17–18.9.
Carraro, C., 1999. The structure of international agreements onclimate change. In: Carraro, C. (Ed.), InternationalEnvironmental Agreements on Climate Change. KluwerAcademic Pub, Dordrecht.
Carraro, C., Siniscalco, D., 1993. Strategies for the internationalprotection of the environment. Journal of Public Economics 52,309–328.
Charnes, A., Cooper, W.W., Rhodes, E., 1978. Measuring efficiencyof decision making units. European Journal of OperationalResearch 2 (6), 429–444.
Charnes, A., Cooper, W.W., Rhodes, E., 1981. Evaluating programandmanagerial efficiency: an application of data envelopmentanalysis to follow through.Management Science 27 (6), 668–696.
Charnes, A., Cooper, W.W., Huang, Z., Sun, D., 1990. Polyhedralcone-ratio DEA models with an illustrative application to largecommercial banks. Journal of Econometrics 46 (1/2), 73–91.
Cherchye, L., 2001. Using data envelopment analysis to assessmacroeconomic policy performance. Applied Economics 33 (3),407–416.
Coelli, T., Prasada Rao, D.S., Battese, G.E., 1998. An Introduction toEfficiency and Productivity Analysis. Kluwer AcademicPublishers, Boston.
Dyckhoff, H., Allen, K., 2001. Measuring ecological efficiency withdata envelopment analysis (DEA). European Journal ofOperational Research 132 (2), 312–325.
De Koeijer, T.J., Wossink, G.A.A., Struik, P.C., Renkema, J.A., 2002.Measuring agricultural sustainability in terms of efficiency: thecase of Dutch sugar beet growers. Journal of EnvironmentalManagement 66 (1), 9–17.
Egenhofer, C., Hager, W., Legge, T., 2001. Defining Europe's NearAbroad in Climate Change: A Russian-EU Alliance— Sub-global
Bargaining to Further International EnvironmentalAgreements. CEPS Discussion Paper, Brussels.
Farrell, M.J., 1957. The measurement of productive efficiency.Journal of the Statistical Society Series A (General) 120, 253–281.
Hernandez-Sancho, F., Picazo-Tadeo, A., Reig-Martinez, E., 2000.Efficiency and environmental regulation an application toSpanish wooden goods and furnishings industry.Environmental and Resource Economics 15, 365–378.
Intergovernmental Panel on Climate Change (IPCC), 2001. ClimateChange 2001:Mitigation. CambridgeUniversityPress,Cambridge.
Intergovernmental Panel on Climate Change (IPCC), 2007. Climatechange 2007: the physical science basis, summary forpolicymakers. Contribution of Working Group I to the FourthAssessment Report. http://ipcc-wg1.ucar.edu/wg1/docs/WG1AR4_SPM_Approved_05Feb.pdf.
International Energy Agency (IEA), 2007. World Energy Outlook2007 — China and India Insights. OECD, Paris.
Kemfert, C., Truong, T., Bruckner, T., 2006. Economic impactassessment of climate change: a multi-gas investigation withWIAGEM-GTAPEL-ICM. The Energy Journal 28 (Special IssueNumber 3), 441–460.
Kortelainen, M., Kuosmanen, T., 2007. Eco-efficiency analysis ofconsumer durables using absolute shadow prices. Journal ofProductivity Analysis 28 (1), 57–69.
Kuosmanen, T., Kortelainen, M., 2005. Measuring eco-efficiency ofproduction with data envelopment analysis. Journal ofIndustrial Ecology 9 (4), 59–72.
Kuosmanen, T., Kortelainen, M., 2007. Valuing environmentalfactors in cost–benefit analysis using data envelopmentanalysis. Ecological Economics, Elsevier 62 (1), 56–65.
Kuosmanen, T., Bijsterbosch, N., Dellink, R., in press.Environmental cost–benefit analysis of alternative timingstrategies in greenhouse gas abatement: A data envelopmentanalysis approach. Ecological Economics. Corrected Proof,available online 21 August 2008.
Meyer, A., 2000. Contraction& convergence. The Global Solution toClimate Change. Schumacher Briefings, vol. 5. Green Books,Bristol, UK.
Morsea, S., Fraser, E.D.G., 2005. Making ‘dirty’ nations look clean?The nation state and the problem of selecting and weightingindices as tools for measuring progress towards sustainability.Geoforum 36 (5), 625–640.
Nyman, J.A., Bricker, D.L., 1989. Profit incentives and technicalefficiency in the production of nursing home care. Review ofEconomics and Statistics 71 (4), 586–594.
Nordhaus, W.D., Boyer, J., 2000. Warming the World. MIT Press,Cambridge.
Richels, R.G., Manne, A.S., Wigley, T.M.L., 2004. Moving beyondconcentrations: the challenge of limiting temperature change.AEI-Brookings Joint Center for Regulatory Studies. WorkingPaper 04-11.
Roson, R., Bosello, F., Lazzarin, M., Tol, R., 2004. Economy-WideEstimates of the Implications of Climate Change: Seal LevelRise. FEEM Working Paper 96.04, Milan.
Sarofim, M.C., Forest, C.M., Reiner, D.M., Reilly, J.M, 2004.Stabilization and global climate policy. MIT Joint Program onthe Science and Policy of Global Change Report No. 110.Massachusetts Institute of Technology (MIT). Cambridge, MA.
Seiford, L.M., 1996. Data envelopment analysis: the evaluation ofthe state of art (1978–1995). The Journal of ProductivityAnalysis 7, 99–137.
Stewart, R., Wiener, J., 2003. Reconstructing Climate Policy.American Enterprise Institute Press.
Takamura, T., Tone, K., 2003. A comparative site evaluation studyfor relocating Japanese government agencies out of Tokyo.Socio-Economic Planning Sciences 37, 85–102.
Thompson, R.G., Singleton Jr., F.D., Thrall, R.M., Smith, B.A., 1986.Comparative site evaluation for locating a high-energy physicslab in Texas. Interfaces 16, 35–49.

1354 E C O L O G I C A L E C O N O M I C S 6 8 ( 2 0 0 9 ) 1 3 4 0 – 1 3 5 4
Tol, R.S.J., 2006. Multi-gas emission reduction for climate changepolicy: an application of FUND. The Energy Journal 28(Special Issue Number 3), 235–250.
Tyteca, D., 1996. On the measurement of the environmentalperformance of firms — a literature review and a productive
efficiency perspective. Journal of Environmental Management46, 281–308.
UNFCCC, 1992. United Nations general assembly. United NationsFramework Convention on Climate Change. United Nations,New York. http://www.unfccc.int/resources.