
Data-driven Fault Diagnosis in a Hybrid Electric Vehicle ... · Data-driven Fault Diagnosis in a...
11
978-1-4577-0557-1/12/$26.00 ©2012 IEEE 1 Data-driven Fault Diagnosis in a Hybrid Electric Vehicle Regenerative Braking System Chaitanya Sankavaram 1 , Bharath Pattipati 1 , Krishna Pattipati 1 , Yilu Zhang 2 , Mark Howell 2 , and Mutasim Salman 2 1 Department of Electrical and Computer Engineering, University of Connecticut, 371 Fairfield Road, U-2157, Storrs, CT 06269, USA 2 GM R&D, General Motors Company, 30500 Mound Rd, Warren, MI 48090, USA {chaitanya, krishna}@engr.uconn.edu Abstract— Regenerative braking is one of the most promising and environmentally friendly technologies used in electric and hybrid electric vehicles to improve energy efficiency and vehicle stability. In this paper, we discuss a systematic data-driven process for detecting and diagnosing faults in the regenerative braking system of hybrid electric vehicles. The process involves data reduction techniques, exemplified by multi-way partial least squares, multi-way principal component analysis, for implementation in memory- constrained electronic control units and well-known fault classification techniques based on reduced data, such as support vector machines, k-nearest neighbor, partial least squares, principal component analysis and probabilistic neural network, to isolate faults in the braking system. The results demonstrate that highly accurate fault diagnosis is possible with the pattern recognition-based techniques. The process can be employed for fault analysis in a wide variety of systems, ranging from automobiles to buildings to aerospace systems. TABLE OF CONTENTS 1. INTRODUCTION.................................................................1 2. MODELING OF REGENERATIVE BRAKING SYSTEM ........2 3. FAULT UNIVERSE AND MONITORED SIGNALS ................3 4. FAULT DETECTION AND DIAGNOSIS PROCESS................4 5. EXPERIMENTAL RESULTS ................................................8 6. CONCLUSIONS ..................................................................9 ACKNOWLEDGMENTS ..........................................................9 REFERENCES ........................................................................9 BIOGRAPHIES .....................................................................10 1. INTRODUCTION Hybrid electric vehicles (HEVs) employ regenerative braking to improve fuel economy, enable energy regeneration and provide environmental protection [1]. The primary function of a regenerative braking system (RBS) is to convert kinetic energy into electrical energy and store it in batteries during braking mode for later use in propelling the vehicle (see Fig 1) [2]. Failures in a regenerative braking system may significantly degrade the performance and efficiency of vehicles. Hence, an intelligent diagnostic process is crucial to quickly detect and isolate faults in order to aid in vehicle health monitoring and, consequently, enhance the reliability of vehicular systems. Diagnostic methods have mainly evolved upon three major paradigms, viz., physics-based modeling, data-driven and knowledge-based approaches. The physics-based modeling approach employs consistency checks between the sensed measurements and the outputs of a mathematical model. The expectation is that inconsistencies are large in the presence of malfunctions and small in the presence of normal disturbances, noise and modeling errors. Two main methods of generating the consistency checks are based on observers (e.g., Kalman filters, reduced-order unknown input observers, interacting multiple models, particle filters) and parity relations (dynamic consistency checks among measured variables stemming from hardware or information redundancy relations). A data-driven approach is preferred when the system monitoring data for nominal and degraded conditions is available. Neural network and statistical classification methods are illustrative of data-driven techniques. The knowledge-based approach uses graphical models such as dependency graphs (digraphs), Petri nets, multi-signal (multi-functional) flow graphs, and Bayesian networks for diagnostic knowledge representation and inference [3][4][5]. In this paper, we develop a systematic data-driven fault detection and diagnosis (FDD) process for diagnosing faults in a regenerative braking system. For FDD analysis, Powertrain System Analysis Toolkit (PSAT) [6], a vehicle simulation software tool, was used to create a Matlab/Simulink ® model of RBS with series-parallel drivetrain configuration. The fault diagnosis process involves data reduction techniques, such as multi-way partial least squares, multi-way principal component analysis [7], Fig. 1: Regenerative Braking System - Energy Flow Diagram in HEVs
Transcript of Data-driven Fault Diagnosis in a Hybrid Electric Vehicle ... · Data-driven Fault Diagnosis in a...
978-1-4577-0557-1/12/$26.00 ©2012 IEEE 1
Data-driven Fault Diagnosis in a Hybrid Electric Vehicle
Regenerative Braking System Chaitanya Sankavaram
1, Bharath Pattipati
1, Krishna Pattipati
1, Yilu Zhang
2, Mark Howell
2, and Mutasim Salman
2
1Department of Electrical and Computer Engineering,
University of Connecticut, 371 Fairfield Road, U-2157, Storrs, CT 06269, USA 2GM R&D, General Motors Company, 30500 Mound Rd, Warren, MI 48090, USA
{chaitanya, krishna}@engr.uconn.edu
Abstract— Regenerative braking is one of the most
promising and environmentally friendly technologies used in
electric and hybrid electric vehicles to improve energy
efficiency and vehicle stability. In this paper, we discuss a
systematic data-driven process for detecting and diagnosing
faults in the regenerative braking system of hybrid electric
vehicles. The process involves data reduction techniques,
exemplified by multi-way partial least squares, multi-way
principal component analysis, for implementation in memory-
constrained electronic control units and well-known fault
classification techniques based on reduced data, such as
support vector machines, k-nearest neighbor, partial least
squares, principal component analysis and probabilistic neural
network, to isolate faults in the braking system. The results
demonstrate that highly accurate fault diagnosis is possible
with the pattern recognition-based techniques. The process can
be employed for fault analysis in a wide variety of systems,
ranging from automobiles to buildings to aerospace systems.
TABLE OF CONTENTS
1. INTRODUCTION .................................................................1 2. MODELING OF REGENERATIVE BRAKING SYSTEM ........2 3. FAULT UNIVERSE AND MONITORED SIGNALS ................3 4. FAULT DETECTION AND DIAGNOSIS PROCESS ................4 5. EXPERIMENTAL RESULTS ................................................8 6. CONCLUSIONS ..................................................................9 ACKNOWLEDGMENTS ..........................................................9 REFERENCES ........................................................................9 BIOGRAPHIES .....................................................................10
1. INTRODUCTION
Hybrid electric vehicles (HEVs) employ regenerative
braking to improve fuel economy, enable energy
regeneration and provide environmental protection [1]. The
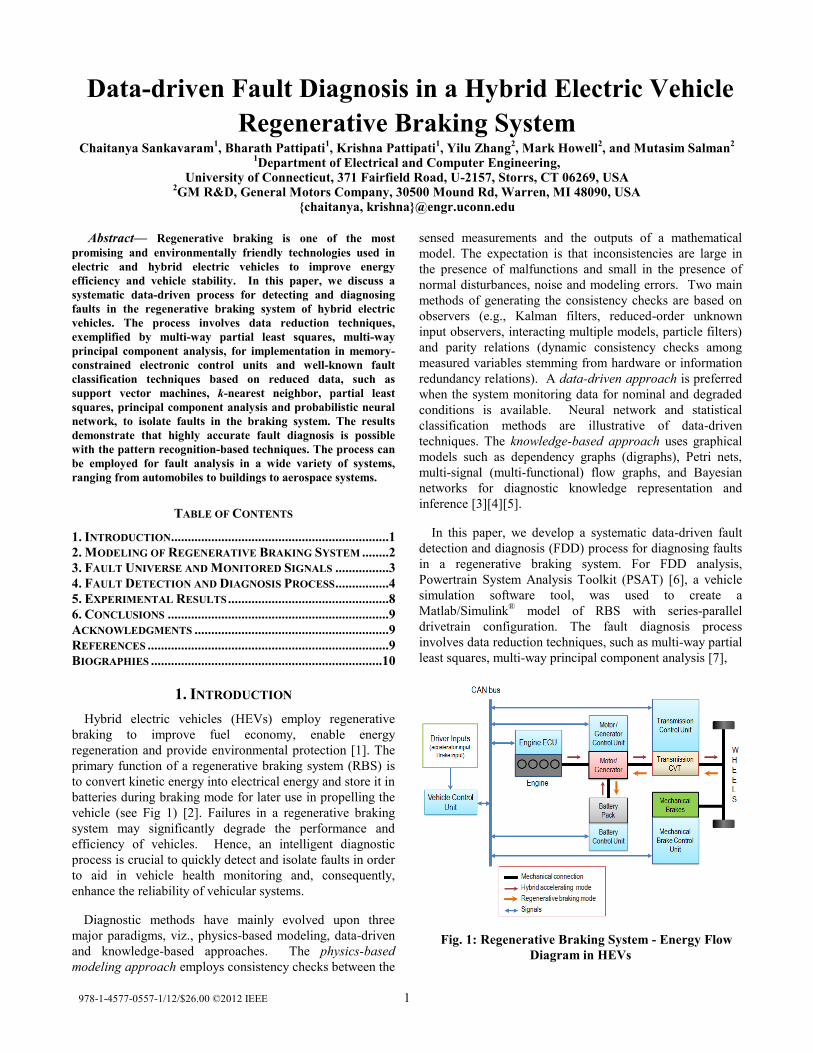
primary function of a regenerative braking system (RBS) is
to convert kinetic energy into electrical energy and store it in
batteries during braking mode for later use in propelling the
vehicle (see Fig 1) [2]. Failures in a regenerative braking
system may significantly degrade the performance and
efficiency of vehicles. Hence, an intelligent diagnostic
process is crucial to quickly detect and isolate faults in order
to aid in vehicle health monitoring and, consequently,
enhance the reliability of vehicular systems.
Diagnostic methods have mainly evolved upon three
major paradigms, viz., physics-based modeling, data-driven
and knowledge-based approaches. The physics-based
modeling approach employs consistency checks between the
sensed measurements and the outputs of a mathematical
model. The expectation is that inconsistencies are large in
the presence of malfunctions and small in the presence of
normal disturbances, noise and modeling errors. Two main
methods of generating the consistency checks are based on
observers (e.g., Kalman filters, reduced-order unknown
input observers, interacting multiple models, particle filters)
and parity relations (dynamic consistency checks among
measured variables stemming from hardware or information
redundancy relations). A data-driven approach is preferred
when the system monitoring data for nominal and degraded
conditions is available. Neural network and statistical
classification methods are illustrative of data-driven
techniques. The knowledge-based approach uses graphical
models such as dependency graphs (digraphs), Petri nets,
multi-signal (multi-functional) flow graphs, and Bayesian
networks for diagnostic knowledge representation and
inference [3][4][5].
In this paper, we develop a systematic data-driven fault
detection and diagnosis (FDD) process for diagnosing faults
in a regenerative braking system. For FDD analysis,
Powertrain System Analysis Toolkit (PSAT) [6], a vehicle
simulation software tool, was used to create a
Matlab/Simulink® model of RBS with series-parallel
drivetrain configuration. The fault diagnosis process
involves data reduction techniques, such as multi-way partial
least squares, multi-way principal component analysis [7],
Fig. 1: Regenerative Braking System - Energy Flow
Diagram in HEVs
2
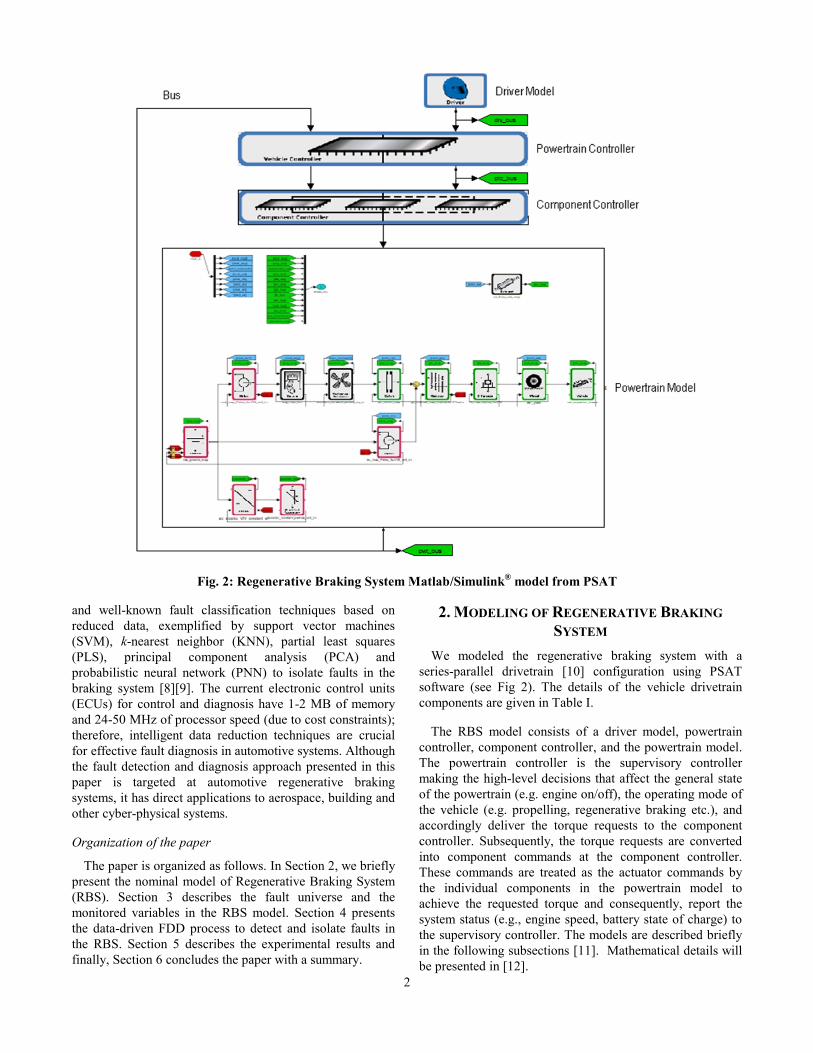
Fig. 2: Regenerative Braking System Matlab/Simulink® model from PSAT
and well-known fault classification techniques based on
reduced data, exemplified by support vector machines
(SVM), k-nearest neighbor (KNN), partial least squares
(PLS), principal component analysis (PCA) and
probabilistic neural network (PNN) to isolate faults in the
braking system [8][9]. The current electronic control units
(ECUs) for control and diagnosis have 1-2 MB of memory
and 24-50 MHz of processor speed (due to cost constraints);
therefore, intelligent data reduction techniques are crucial
for effective fault diagnosis in automotive systems. Although
the fault detection and diagnosis approach presented in this
paper is targeted at automotive regenerative braking
systems, it has direct applications to aerospace, building and
other cyber-physical systems.
Organization of the paper
The paper is organized as follows. In Section 2, we briefly
present the nominal model of Regenerative Braking System
(RBS). Section 3 describes the fault universe and the
monitored variables in the RBS model. Section 4 presents
the data-driven FDD process to detect and isolate faults in
the RBS. Section 5 describes the experimental results and
finally, Section 6 concludes the paper with a summary.
2. MODELING OF REGENERATIVE BRAKING
SYSTEM
We modeled the regenerative braking system with a
series-parallel drivetrain [10] configuration using PSAT
software (see Fig 2). The details of the vehicle drivetrain
components are given in Table I.
The RBS model consists of a driver model, powertrain
controller, component controller, and the powertrain model.
The powertrain controller is the supervisory controller
making the high-level decisions that affect the general state
of the powertrain (e.g. engine on/off), the operating mode of
the vehicle (e.g. propelling, regenerative braking etc.), and
accordingly deliver the torque requests to the component
controller. Subsequently, the torque requests are converted
into component commands at the component controller.
These commands are treated as the actuator commands by
the individual components in the powertrain model to
achieve the requested torque and consequently, report the
system status (e.g., engine speed, battery state of charge) to
the supervisory controller. The models are described briefly
in the following subsections [11]. Mathematical details will
be presented in [12].

3
Fig. 3: Vehicle Powertrain Model with Series-Parallel Configuration
Driver Model:
The driver model simulates the drive cycles (e.g., Urban
Dynamometer Driving Schedule (UDDS) [13]), by setting
accelerator and brake pedal positions to achieve the desired
vehicle speed. The output from this block is the driver’s
torque demand at the wheels, which constitutes the input to
the powertrain controller (PTC).
Powertrain Controller:
The key functionality of the PTC is to send commands to
the component controller so that the desired torque demands
are met. The PTC has the control strategies for (a)
propelling, when torque at the wheels is positive, (b)
shifting, i.e., gear selection strategy, and (c) braking, when
torque at the wheels is negative. In addition, PTC also
computes the physical limits for each of the components, for
instance, the maximum available torque for the engine and
the maximum propelling torque for the generator.
Component Controller:
In the component controller, the desired torque demands
from the PTC are converted into component commands,
e.g., the desired torque from the engine is converted into
percentage throttle command. These commands are
processed by the component blocks in the powertrain model.
Powertrain Model:
This model comprises all the components that mimic the
behavior of hardware components, such as the engine, the
battery and the motor. Fig 3 shows the individual
component blocks in the powertrain model (with a series-
parallel drivetrain configuration).
Table I. Series-Parallel Drivetrain Configuration
COMPONENT SPECIFICATIONS
Motor1 Permanent Magnet (PM)
Electric Motor with
Continuous Power = 25KW
Peak Power = 50 KW
Motor2 UQM Power-phase PM
motor
Continuous Power = 55KW
Peak Power = 100 KW
Engine Gasoline Engine
1.497 liter
57 KW
Energy Storage SAFT Li-ion Battery
Capacity = 6 Ah
Number of cells = 75
Gearbox 2 Gear Manual Transmission
Gear ratios = 1.86 and 1
Wheel Axle 2 Wheel drive
Vehicle Vehicle body mass = 800 Kg
Frontal area = 1.8 m2
Drag coefficient = 0.38
3. FAULT UNIVERSE AND MONITORED SIGNALS
The RBS model is subjected to 12 sensor and parametric
faults listed in Table II. There are 25 signals that are
monitored in the braking system including (a) sensor
signals, such as temperature, speed, and current
measurements from the hardware components in the
powertrain model; (b) motor, wheel, and engine torque
demands sent from the powertrain controller to the
component controller; and (c) component commands sent
from the component controller to the hardware components
in the powertrain model. Table III shows the list of
4
monitored signals in the Regenerative Braking System.
The sensor and parametric faults are injected via
simulation-based fault injection experiments. The most
common faults in the sensors are additive faults; these are
the discrepancies between the measured and the true values
of the monitored signals. Therefore, the sensor faults (F1,
F2, and F4-F9) are simulated as additive biases on the
measured signals. For instance, a 10% increase in the engine
speed is used to model the engine speed sensor fault.
Similarly, the parametric faults F3 and F10 are simulated as
10% increase in their nominal values, whereas 10% decrease
in the wheel radius is considered as wheel radius fault (F12).
Mathematically, the fault scenarios are simulated using the
following equation,
(1 ).faulty nominalX X (1)
In (1), Xfaulty is the parameter value under faulty condition,
Xnominal is the nominal parameter value and Δ is the percent
change in the parameter value (fault severity). Our approach
is generic and does not preclude more sophisticated fault
models (e.g., coupling faults, multiplicative faults, stuck
with constant bias fault, abrupt/incipient faults,
persistent/intermittent faults and so on [14]).
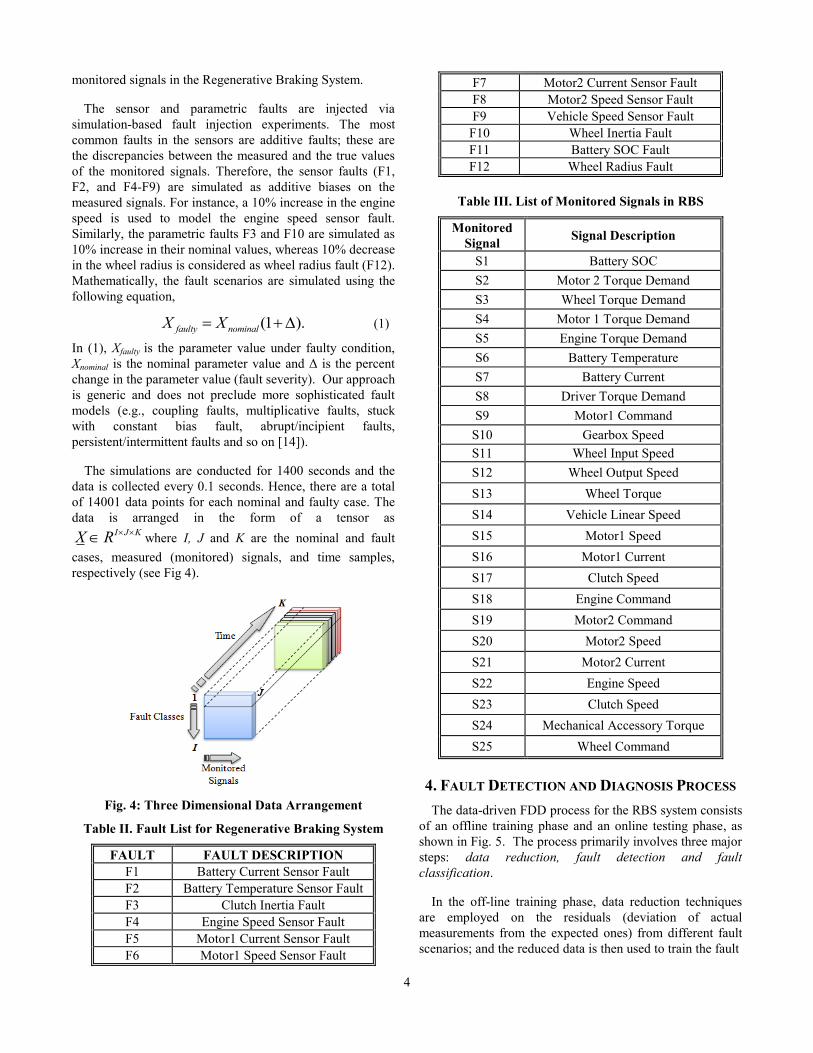
The simulations are conducted for 1400 seconds and the
data is collected every 0.1 seconds. Hence, there are a total
of 14001 data points for each nominal and faulty case. The
data is arranged in the form of a tensor as I J KX R where I, J and K are the nominal and fault
cases, measured (monitored) signals, and time samples,
respectively (see Fig 4).
Fig. 4: Three Dimensional Data Arrangement
Table II. Fault List for Regenerative Braking System
FAULT FAULT DESCRIPTION
F1 Battery Current Sensor Fault
F2 Battery Temperature Sensor Fault
F3 Clutch Inertia Fault
F4 Engine Speed Sensor Fault
F5 Motor1 Current Sensor Fault
F6 Motor1 Speed Sensor Fault
F7 Motor2 Current Sensor Fault
F8 Motor2 Speed Sensor Fault
F9 Vehicle Speed Sensor Fault
F10 Wheel Inertia Fault
F11 Battery SOC Fault
F12 Wheel Radius Fault
Table III. List of Monitored Signals in RBS
Monitored
Signal Signal Description
S1 Battery SOC
S2 Motor 2 Torque Demand
S3 Wheel Torque Demand
S4 Motor 1 Torque Demand
S5 Engine Torque Demand
S6 Battery Temperature
S7 Battery Current
S8 Driver Torque Demand
S9 Motor1 Command
S10 Gearbox Speed
S11 Wheel Input Speed
S12 Wheel Output Speed
S13 Wheel Torque
S14 Vehicle Linear Speed
S15 Motor1 Speed
S16 Motor1 Current
S17 Clutch Speed
S18 Engine Command
S19 Motor2 Command
S20 Motor2 Speed
S21 Motor2 Current
S22 Engine Speed
S23 Clutch Speed
S24 Mechanical Accessory Torque
S25 Wheel Command
4. FAULT DETECTION AND DIAGNOSIS PROCESS
The data-driven FDD process for the RBS system consists
of an offline training phase and an online testing phase, as
shown in Fig. 5. The process primarily involves three major
steps: data reduction, fault detection and fault
classification.
In the off-line training phase, data reduction techniques
are employed on the residuals (deviation of actual
measurements from the expected ones) from different fault
scenarios; and the reduced data is then used to train the fault

5
Fig. 5: Fault Detection and Diagnosis Process for Regenerative Braking System
classifiers (SVM, KNN, PLS, PCA, and PNN). In the online
testing phase, the trained classifiers are used to classify the
faults based on reduced data. The following subsections
describe briefly the steps involved in the FDD process.
Data Reduction Techniques
Data reduction techniques are of significant importance in
real world applications to overcome the issue with high-
dimensional datasets (due to multiple modes of system
operation and sensor data collected over time) [15][16].
Often, all the measurements are not salient for understanding
the essential phenomena of interest, and features extracted
using the data reduction techniques enable real-time
implementation of data-driven diagnostic algorithms via
compact memory footprint, improved computational
efficiency and generally enhanced diagnostic accuracy [17].
Statistical data reduction techniques, such as multi-way
principal component analysis (MPCA) and multi-way partial
least squares (MPLS), are among the widely investigated
data reduction techniques [17][18]. These techniques reduce
the dimensionality of datasets by transforming the data to a
lower-dimensional feature space, and this reduced space
often gives information about the salient structure of the
high-dimensional data space. In other words, a number of
correlated variables in the original data are transformed into
a smaller number of uncorrelated new variables in the
reduced space, called principal components or the score
vectors. These reduced variables capture good amount of
variation in the data. The MPCA is used to reduce the
dimensionality of data, and produces a representation that
preserves the correlation structures among the monitored
variables. The PCA is optimal in terms of capturing the
variation in data. The MPLS is another dimensionality
reduction technique that considers both pattern (independent
data) and class (response) information. MPLS technique is
widely used for its ability to enhance classification accuracy
on high-dimensional datasets, and its computational
efficiency. The reduced data can be processed with
classifiers for categorizing the various fault classes.
Furthermore, both MPLS and MPCA techniques can be used
for fault detection. For example, in the MPLS technique, if
the distance of the score vectors is close to the origin of the
new reduced feature space, then the system is judged to be
in the nominal state. The distance to these score vectors
from the origin is computed via Hotelling statistic [7]. In this
paper, we employed the MPLS technique on the residuals
primarily for data reduction (from 559 MB to 12 KB).
Fault detection Techniques
Fault detection is performed by monitoring the
amount/rate of deviation of a parameter from its nominal
value, also known as residuals. We employ cumulative sum
(CUSUM) test [19], and simple thresholds for the detection
of faults. Here, the residuals of monitored variables are
computed at each measurement time, and the cumulative
sum of squared residuals is calculated. Let Sik be the
cumulative sum of squared residual of monitored signal i at
time k, mathematically written as,
6
2
1
k
ik ij
j
S r
(2)
where rij is the residual of the signal i at jth
time instant, and,
is the measurement difference between the actual sensor
output and nominal no-fault output. In the no-fault case, the
expected value of rij is zero, whereas in the presence of a
fault, the rij does not have zero mean. Hence, a simple
threshold test on the cumulative sum of the squared residuals
can determine whether the system is in a faulty state or
nominal state i.e., if Sik exceeds a threshold T then a fault is
detected (see equation (3)).
fault detected
no fault detected
ik
ik
S T
S T
(3)
Fault Classification
Statistical and pattern classification techniques such as
support vector machines, k-nearest neighbors, principal
component analysis, partial least squares, and probabilistic
neural networks are employed for isolating faults in the RBS
model. A brief explanation of these techniques is given in
the following subsections.
Support Vector Machine—Support vector machine is one of
the most widely used supervised learning algorithms for
classification. Given a set of training samples belonging to
different classes, support vector machines find an optimal
decision boundary (also called hyperplane) that maximizes
the margin between the classes [20]. Therefore, SVM is also
known as the maximum-margin classifier. The vectors that
define the optimal separating hyperplane are known as the
support vectors. These support vectors lie closest to the
decision surface and can be used to estimate the fault class
of a test feature vector. In the case of non-linear
classification, where a linear boundary is not appropriate, a
kernel function is used for mapping the data onto a higher
dimensional space and the optimal hyperplane is then
constructed. Some of the kernel functions that are commonly
used are polynomial, Gaussian, radial basis functions, and
hyperbolic tangent.
k - Nearest Neighbor—The KNN classifier is a simple non-
parametric method that classifies test vectors based on the
samples from the training data [8]. The classifier finds the k-
nearest points to a test vector from the training data, and the
class with the maximum a posteriori probability within those
k points is declared as the most-likely class. Normally, k is
chosen as an odd number to avoid ties. Mathematically, the
posterior class probabilities P(ci|xnew) are given by,
| ii inew
kP c x p c
k (4)
where ki is the number of vectors belonging to class ci within
the k-nearest points. P(ci) is the prior probability of class ci.
A new test sample xnew is assigned to the class ci with the
highest a posteriori class probability P(ci|xnew).
Principal Component Analysis—PCA is a multivariate
statistical procedure that transforms the training data into a
lower-dimensional space by transforming a number of
correlated variables into a smaller number of uncorrelated
new variables called principal components. These
components represent the selection of a new coordinate
system obtained by rotating the original variables and
projecting them onto the reduced space defined by the first
few principal components. Here, the first principal
component describes the largest amount of variation in the
data, the second one the second largest amount of variation
in the data and so on. Each principal component is
represented as a linear combination of the columns (J), and
has a specific numerical value for each of the rows (I). In
matrix form, the PCA model can be written as,
1
, L
T
s f ff
X i j t p E
(5)
where L is the number of principal components. The loading
vectors (pf) are orthonormal and provide the directions with
maximum variability. The score vectors (tf) from the
different principal components are the coordinates for the
objects in the reduced space. A classification of a new test
pattern is done by obtaining its predicted scores and
residuals. If the test pattern is similar to a specific class in
the training network, the scores will be located near the
origin of the reduced space, and the residual should be
small. The distance of test data from the origin of the
reduced space can be measured by Hotelling statistic [7].
Partial Least Squares—PLS is a regression technique used
to find a set of components that explain the covariance
between the independent training data matrix (sensor data)
X, and the dependent matrix (fault classes) Y. The goal of
the PLS algorithm is to determine highly correlated latent
variables (or the score vectors) that not only capture the
variations in the input data X, but also the variations that are
most predictive of the output data Y. Once the latent
variables are extracted, a least squares regression is
performed to estimate the fault class. The score vectors are
determined using nonlinear iterative partial least squares
(NIPALS) algorithm [21].
Probabilistic Neural Network—PNN is a supervised method
that computes the likelihood of an input vector belonging to
a specific class based on the learned probability distributions
of each class. The learned patterns can also be weighted
with a priori probability (relative frequency) of each
category and misclassification costs to determine the most
likely class for a given input vector. If the relative frequency
of the categories is unknown, then all the categories can be
assumed to be equally likely and the determination of
category is solely based on the closeness of the input feature
vector to the distribution function of a class [8].

7
Fig. 6: Driver Profile (Profile 1) Fig. 7: Driver Profile (Profile 2)
Fig. 8: Battery SOC with and without Noise (Profile 1)
Fig. 9: Cumulative Sum of Squared Residuals from 25 Monitored Signals for Battery Current Sensor Fault (F1)

8
Fig. 10: Cumulative Sum of Squared Residuals from Battery SOC Signal (S1) for all the Faults
Table IV. Classification Accuracy of each Classifier for each Fault
Classifier
Fault
SVM KNN
(k=1)
KNN
(k=2)
KNN
(k=3)
PLS PCA PNN
F1 100 100 100 100 100 100 100
F2 100 100 100 100 100 100 100
F3 100 100 100 100 83.33 100 100
F4 100 100 100 100 100 100 100
F5 100 100 100 100 100 100 100
F6 100 100 100 100 100 100 83.33
F7 100 100 100 100 100 100 83.33
F8 100 100 100 100 100 100 100
F9 100 100 100 100 100 100 100
F10 100 100 100 100 100 100 100
F11 100 100 100 100 100 100 100
F12 100 100 100 100 50 100 100
5. EXPERIMENTAL RESULTS
The RBS model was simulated under nominal and 12
faulty scenarios with two driver profiles: Profile1 and
Profile2 shown in Figures 6 and 7. These driver profiles
(drive cycles) are collected from a Chevy 2007 model year
vehicle and acts as input to the driver block of the RBS
model. The duration of the driver profile is 1400 seconds
and the data is sampled every 0.1 seconds. We monitored 25
signals for each fault case; hence, the total data collected
from the fault simulations is 13x25x14001 for each profile.
A Gaussian measurement noise with random seed is added
to the signals with a variance of 0.6% of the squares of the
magnitude of the signals (this corresponds to a signal-to-
noise (SNR) ratio of 22.2dB). Fig 8 is a snapshot of a
sample signal with and without noise added to the signal.
Fault Detection
Here, CUSUM test is employed for fault detection. For
CUSUM, the cumulative sum of the squared residuals for
the 25 monitored variables is collected. A threshold is
defined and the cumulative sum of the squared residual is
compared against this threshold to determine whether the
system is in faulty state or in the nominal state. Fig. 9 shows
the cumulative sum of the squared residuals for battery
current sensor fault. Here, x-axis represents the sample
number and y-axis represents the cumulative sum of squared
residuals from 25 monitored signals. A suitable threshold on
the residuals detects the presence of fault(s), for instance, a
threshold of 500 on signal S22 indicates the presence of a
fault at t = 89.4 seconds. Similarly, a threshold of 5 on S1
detects F11, the battery SOC fault (see Fig 10). Once a fault
is detected, data reduction techniques and classification
techniques can be employed to isolate the fault.
Data Reduction and Fault Classification Results
MPLS technique is employed to reduce the data into
fewer components. Here, the data is reduced to 10 score
vectors (559 MB → 12 KB) and this reduced data is used
for fault isolation. As mentioned earlier, the classifiers
SVM, KNN, PLS, PCA and PNN are employed to isolate

9
the sensor and parametric faults. Here, the number of
patterns available is 156 (26 patterns from Profiles 1 and 2
and 130 patterns by adding noise to the measured signals).
This data is divided into two equal subsets, i.e., 50% for the
training of classification algorithms and the remaining 50%
of the data is used for validating the trained classification
algorithms. Table IV presents the individual classification
accuracies of each classifier for each fault. It is seen that
SVM, KNN and PCA performed best by achieving 100%
accuracy on each fault. Table V summarizes the overall
classification accuracy achieved by each of the individual
classifiers. Here, all the classifiers performed well with
greater than 97% accuracy, except for PLS. The sample of
faults and signals considered in this paper are to test the
viability of the presented approach. It is necessary to explore
more realistic scenarios, such as different driving conditions,
road scenarios, a variety of fault types, etc. and validate the
proposed approach. However, the preliminary experimental
results are very promising.
The systematic FDD process presented in this paper
featuring fault detection, multivariate statistical data
reduction and fault classification techniques is a generic
approach for fault analysis and can be easily applied to any
real-world engineering system. Indeed, variants of this
process have been applied to a number of engineering
systems [17][18] [22]-[27].
Table V. Overall Classification Accuracy
Classification
Algorithm
Classification
Accuracy (%)
SVM 100
KNN (k=1) 100
KNN (k=2) 100
KNN (k=3) 100
PLS 94.87
PCA 100
PNN 97.44
6. CONCLUSIONS
In this paper, a systematic data-driven fault detection and
diagnosis approach for an automotive regenerative braking
system is presented. The RBS system is modeled using
PSAT software and simulated under nominal and faulty
scenarios. We employed MPLS technique for data
reduction, and statistical and pattern recognition techniques
for fault isolation. The approach presented here
demonstrated high diagnostic accuracy (100% fault
classification accuracy with SVM, KNN and PCA
classifiers) and can be used for fault analysis in any vehicle
systems. It has the potential for real-time implementation in
automotive and aerospace systems due to the significant
reduction of the data size without compromising on the fault
classification accuracy at a reduced computational load/
time. In future, we plan to investigate the robustness of the
FDD scheme with varying driver profiles. In addition, we
plan to model the RBS with multiple ECUs and CAN bus
communication, and investigate the application of our FDD
scheme for isolating software and communication-related
faults. Finally, we will also predict the degradation of RBS
parameters and estimate its remaining useful life.
ACKNOWLEDGMENTS
The work reported in this paper was supported by
National science foundation (NSF) under grants ECCS-
0931956 (NSF CPS) and ECCS-1001445 (NSF GOALI).
We thank GM R&D and NSF for their support of this work.
Any opinions expressed in this paper are solely those of the
authors and do not represent those of the sponsor.
REFERENCES
[1] J. K. Ahn, K. H. Jung, D. H. Kim, H. B. Jin, H. S. Kim
and S. H. Hwang, ―Analysis of a regenerative braking
system for hybrid electric vehicles using an electro-
mechanical brake‖, International Journal of Automotive
Technology, vol. 10, no. 2, pp. 229-234, 2009.
[2] http://www.cvel.clemson.edu/auto/systems/regenerative
_braking.html, accessed on October 10th
, 2011.
[3] K. R. Pattipati, A. Kodali, K. Choi, S. Singh, C.
Sankavaram, S. Mandal W. Donat, S.M. Namburu, S.
Chigusa, L. Qiao and J. Luo, "An integrated diagnostic
process for automotive systems," in D. Prokhorov, (ed.)
Studies in Computational Intelligence (SCI), Vol. 132,
pp. 191-218, 2008.
[4] C. Sankavaram, A. Kodali, D. F. M. Ayala, K. Pattipati,
S. Singh, and P. Bandyopadhyay, ― Event-driven data
mining techniques for automotive fault diagnosis‖, 21st
International Workshop on Principles of Diagnosis,
Portland, OR, October 2010.
[5] C. Sankavaram, B. Pattipati, A. Kodali, K. Pattipati, M.
Azam, and S. Kumar, "Model-based and data-driven
prognosis of automotive and electronic systems", 5th
Annual IEEE Conference on Automation Science and
Engineering, Bangalore, India, August 22-25, 2009.
[6] http://www.transportation.anl.gov/modeling_simulation/
PSAT/index.html, accessed on October 10th
, 2011.
[7] P. Nomikos, ―Detection and diagnosis of abnormal
batch operations based on multi-way principal
component analysis,‖ ISA Transactions, Vol. 35, pp.
259–266, 1996.
[8] R. 0. Duda, P. E. Hart, and D. G. Stork, Pattern
Classification, second edition, New York: Wiley
lnterscience, 2001.
[9] C. M. Bishop, Pattern Recognition and Machine
Learning, Springer, 2006.
10
[10] M. Ehsani, Y. Gao, and J. M. Miller, ―Hybrid electric
vehicles: architecture and motor drives‖, Proceedings of
the IEEE , vol.95, no.4, pp.719-728, April 2007.
[11] http://www.transportation.anl.gov/pdfs/HV/412.pdf,
accessed on October 10th
, 2011.
[12] C. Sankavaram, K. Pattipati, Y. Zhang, M. Howell, and
M. Salman, ―Fault Diagnosis and Prognosis in Cyber-
Physical Systems with an Application to Hybrid Electric
Vehicle Regenerative Braking System‖, to be submitted
to IEEE transactions on SMC – Part C.
[13] http://www.epa.gov/nvfel/testing/dynamometer.htm,
accessed on October 11th
, 2011.
[14] T. Kurtoglu, S. Narasimhan, S. Poll, D. Garcia, L.
Kuhn, J. D. Kleer, A. Gemund, and A. Feldman,
―Towards a Framework for evaluating and comparing
diagnosis algorithms‖, in Proceedings of the Twentieth
International Workshop on Principles of Diagnosis
(DX’09), Stockholm Sweden, pp. 373-382, 2009.
[15] I. K. Fodor, "A survey of dimension reduction
techniques," [Online]. Available: http://www.llnl.
gov/CASC/sapphire/pubs/1 48494. pdf.
[16] R. E. Bellman, Adaptive Control Processes, Princeton
University Press, Princeton, NJ, 1961.
[17] K. Choi, J. Luo, K. Pattipati, S.M. Namburu, L. Qiao,
and S. Chigusa, ―Data Reduction Techniques for
Intelligent Fault Diagnosis in Automotive Systems‖,
Proceedings of the IEEE Autotestcon, Anaheim, CA,
September, 2006.
[18] K. Choi, S. M. Namburu, M. S. Azam, Jianhui Luo, K.
R. Pattipati and A. Patterson-Hine, "Fault diagnosis in
HVAC chillers," Instrumentation & Measurement
Magazine, IEEE, vol. 8, pp. 24-32, 2005.
[19] J. Chen and R. Patton, Robust Model-based Fault
Diagnosis for Dynamic Systems, Kulwer Academic,
Norwell, MA, 1999.
[20] C. J. C. Burges, ―A tutorial on support vector machines
for pattern recognition,‖ Data Mining and Knowledge
Discovery, vol. 2, pp. 121-167, 1998.
[21] P. Geladi, and B. R. Kowalski, ―Partial least-squares
regression: a tutorial‖, Analytica, Chemica, Acta, 1986.
[22] S. M. Namburu, M. Azam, J. Luo, K. Choi, and K. R.
Pattipati, ―Fault detection, diagnosis and data-
driven modeling in HVAC Chillers,‖ in Proc. SPIE
Conf., Orlando, FL, March 2005.
[23] W. Donat, K. Choi, W. An, S. Singh, and K. R.
Pattipati, ―Data Visualization, Data Reduction, and
Classifier Fusion for Intelligent Fault Detection and
Diagnosis in Gas Turbine Engines‖, ASME Journal of
Engineering for Gas Turbines and Power, June 2007.
[24] K. Choi, S. Singh, K. R. Pattipati, J. W. Sheppard, S.
M. Namburu, S. Chigusa, D. V. Prokhorov, and L.
Qiao, ―Novel classifier fusion approaches for fault
diagnosis in automotive systems,‖ IEEE Transactions on Instrumentation and Measurements, Vol. 57, No. 3,
pp. 602-611, March 2009.
[25] A. Kodali, W. Donat, S. Singh, K. Choi, and K. R.
Pattipati, ―Dynamic fusion and parameter optimization
of multiple classifier systems,‖ ASME Turbo Expo
2008: Power for Land, Sea and Air, Berlin, Germany,
June 2008.
[26] A. Kodali, S. Vemana, K. Choi, K. R. Pattipati,
―Diagnostic ambiguity and parameter optimization in
classifier fusion: Application to gas turbine engine
data,‖ IEEE Autotestcon Conference, Salt Lake City,
Utah, pp. 433-438, September 2008.
[27] R. Ghimire, C. Sankavaram, A. Ghahari, K. Pattipati, Y.
Ghoneim, M. Howell, and M. Salman, ―Integrated
Model-based and Data-driven Fault Detection and
Diagnosis Approach for an Automotive Electric Power
Steering System‖, IEEE Autotestcon Conference,
Baltimore, MD, September 2011.
BIOGRAPHIES
Chaitanya Sankavaram received the B.Tech. degree in
Electrical and Electronics Engineering from Sri
Venkateswara University, Tirupathi, India, in 2005. She
is currently working toward the Ph.D. degree in
Electrical and Computer Engineering at the University of
Connecticut, Storrs. She was a Project Engineer with
Wipro Technologies, Bangalore, India, for two years. Her
current research interests include fault diagnosis and
prognosis, reliability analysis, data mining, pattern
recognition, and optimization theory.
Bharath Pattipati received the B.E. degree in Electrical
and Electronics engineering from M.S. Ramaiah Institute
of Technology, Bangalore, India, in 2005 and the
Master’s degree in Electrical and Computer Engineering
from the University of Connecticut, Storrs, in 2009, where
he is currently working toward the Ph.D. degree in
Electrical and Computer Engineering. His current
research interests include the application of systems
theory and optimization techniques to complex large-
scale systems, application-driven analysis of neural
networks, pattern recognition, and fault diagnosis and
prognosis.
Krishna R. Pattipati (S’77-M’80-SM’91-F’95) received
the B.Tech. degree in Electrical Engineering with highest
honors from the Indian Institute of Technology,
Kharagpur, India, in 1975 and the M.S. and Ph.D.
degrees in Systems Engineering from the University of
Connecticut, Storrs, in 1977 and 1980, respectively.
From 1980 to 1986, he was with ALPHATECH, Inc.,
Burlington, MA. Since 1986, he has been with the
University of Connecticut, where he is currently the UTC
Professor in Systems Engineering in the Electrical and
Computer Engineering Department. He was a Consultant
to Alphatech, Inc., Aptima, Inc., and IBM Research and
Development. He is a Co-Founder of Qualtech Systems,
Inc., which is a small business specializing in intelligent
diagnostic software tools. His research interests include
the areas of adaptive organizations for dynamic and

11
uncertain environments, multiuser detection in wireless
communications, signal processing and diagnosis
techniques for complex system monitoring, and multi
object tracking. He is a Fellow of IEEE.
Yilu Zhang received his B.S., and M.S. degrees in
Electrical Engineering from Zhejiang University, China,
in 1994, and 1997, respectively; and his Ph.D. degree in
Computer Science from Michigan State University in
2002. He joined the R&D center of General Motors Co.
at Warren, Michigan in 2002, and currently holds a
position of Senior Researcher. Dr. Zhang’s research
interests include integrated system health management,
human machine interactions, statistical pattern
recognition, machine learning, speech/image processing,
and their applications. Dr. Zhang is a Senior Member of
IEEE, and a member of SAE. He is a winner of 2008
“Boss” Kettering Award – the highest technology award
in GM – for his contribution to Connected Vehicle
Battery Monitor, a remote vehicle diagnostics technology.
Mark Howell is a Staff Researcher with the Electrical
and Controls Lab at General Motors Research,
specializing in Fault Tolerant Vehicle Control and
Prognostic Systems. He previously worked as a Research
Fellow in Automotive Engineering at Loughborough
University, pursuing research on intelligent active
suspension control and integrated chassis control
systems. He has a MSc and PhD in Control Systems from
the University of Sheffield, England, and a Bachelors
degree in Cybernetics from the University of Reading,
England.
Mutasim Salman received his bachelor’s degree in
Electrical Engineering from University of Texas at
Austin; M.S. and PhD in Electrical Engineering with
specialization in Systems and control from University of
Illinois at Urbana- Champaign. He also has an Executive
MBA. He holds sixteen patents and has coauthored more
than 36 refereed technical publications and a book. He
joined the GM R&D staff in 1984. He is currently a group
manager and a Technical Fellow. He is a senior member
of IEEE. His research interest includes performance
monitoring, diagnosis and prognosis as well as fault
tolerant control as applied to Energy and Automotive
Systems.