Drømmeløftet Moonwalk + Innovation Norway: Norway beyond Oil & Gas

Deliverable 2 - Data Collection & Statistics 1
Deliverable 2
Data collection & Statistics
Please refer to this report as follows:
Delhaye, A., Marot, L. (2015), Data Collection & Statistics, Deliverable 2 of the EC/MOVE/C4
project RIDERSCAN.
GRANT AGREEMENT NUMBER MOVE/C4/SUB/2010-125/SI2.603201/RIDERSCAN
Project Coordinator: Aline Delhaye, Federation of European Motorcyclists’ Associations
(FEMA), Rue des champs, n°62, 1040, Etterbeek (Brussels), Belgium
Project Start date: 01/11/2011 Duration 42 months
Organisation name of lead contractor for this deliverable:
Federation of European Motorcyclists’ Associations (FEMA), Belgium
Report Author(s):
Aline Delhaye, Federation of European Motorcyclists’ Associations (FEMA), Belgium
Laura Marot, Federation of European Motorcyclists’ Associations (FEMA), Belgium
Report Reviewer:
George Yannis, National Technical University of Athens (NTUA), Greece
Due date of deliverable: 30/04/2015 Submission date: 30/04/2015
Project co-funded by the European Commission
Dissemination Level: public

Deliverable 2 - Data Collection & Statistics 2
Deliverable Overview
Table of contents
Deliverable Overview ........................................................................................................... 2
Glossary ................................................................................................................................. 4
Executive Summary ............................................................................................................. 6
1. Introduction ................................................................................................................ 10
2. Project activities and work overview ........................................................................ 12
2.1. EU Research main conclusions .......................................................................... 12
2.2. RIDERSCAN pan-European surveys ................................................................. 30
2.3. Summary of accessible data on motorcycling and motorcycle accidents in the
EU ....................................................................................................................... 49
2.4. Data harmonisation needs ................................................................................... 57
Overview of variables collected per country in public statistics on
motorcycles ................................................................................................ 60
2.5. Data collection priorities ..................................................................................... 63
Stakeholders Safety Priorities – Data Collection and Statistics ................ 63
The Motorcycling Community ................................................................. 63
Member States .......................................................................................... 65
2.6. Other stakeholders’ feedback ............................................................................. 65
Stakeholders workshops’ comments ......................................................... 65
Pan-EU stakeholders feedback .................................................................. 67
2.7. Data collection key challenges ............................................................................ 69
3. Deliverable conclusions .............................................................................................. 70
List of Figures
Figure 1 Rate of PTWs per 1000 inhabitants, 2009 (Source CARE Database/EC) ________________________________ 12
Figure 2 Motorcyclist Profiles (SARTRE4) ______________________________________________________________ 16
Figure 3 Percentage of mopeds and motorcycles in PTW fatalities, 2010 (DACOTA) _____________________________ 17
Figure 4 Percentage of motorcycle and moped rider fatalities by age group, 2010 (DACOTA) ______________________ 18
Figure 5 Motorcycle and moped fatalities per million inhabitants by age group - EU-24, 2010 (DACOTA) ____________ 19
Figure 6 – Percentage of PTW rider fatalities by area type, 2010 (DACOTA) ___________________________________ 20
Figure 7 Injury accident involvement by country for motorcycle type (in % of accident involved motorcyclists) (SARTRE4) 21
Figure 8 Fatalities by junction type and mode of transport - EU-24, 2010 (DACOTA) _____________________________ 21
Figure 9 Moped fatalities by month - top 5 countries and other EU-24, 2010 (DACOTA) __________________________ 22
Figure 10 Motorcycle fatalities by month - Top 5 countries and other EU-24, 2010 (DACOTA) _____________________ 22
Figure 11 Ten most frequent links between causes - PTW riders (DACOTA) ____________________________________ 23
Figure 12 Motorcycle accidents by injury severity and injury causation (Source: Honda, 2006) _____________________ 25
Figure 13 Most frequent Accident Scenarios - In-depth accident analysis comparison _____________________________ 27
Figure 14 Summary of CARE Data Analysis - PTWs (VRUITS) ______________________________________________ 27
Figure 15 Figure 15 ISO 13232 Crash Test scenarios (PISA) ________________________________________________ 28
Figure 16 Interrelationship between motorcycle accidents, causes, and preventive measures (Huang and Preston, 2004)
(SIM) ___________________________________________________________________________________________ 29
Figure 17 Number of powered two-wheelers owned by the respondent (EU dataset) ______________________________ 31
Figure 18 Engine size breakdown of PTWs owned in Europe (Merged answers) (EU dataset) _______________________ 32
Figure 19 Breakdown by engine size for PTWs in the Czech Republic (Merged answers) __________________________ 33

Deliverable 2 - Data Collection & Statistics 3
Figure 20 Breakdown by engine size for PTWs in Belgium (Merged answers) ___________________________________ 33
Figure 21 Repartition of vehicle type in Europe (Merged answers) (EU dataset) _________________________________ 33
Figure 22 Breakdown by vehicle type in Greece (Merged answers) (Greece) ____________________________________ 34
Figure 23 Top 5 brands owned in Europe (Merged answers) (EU dataset) ______________________________________ 35
Figure 24 Most used means of transport (EU dataset) ______________________________________________________ 35
Figure 25 Car and PTW usage per country (answer per country) _____________________________________________ 36
Figure 26 Approximate annual mileage by car (EU dataset) _________________________________________________ 37
Figure 27 Percentage of respondents driving more than 10,000 km per year (answer per countries) __________________ 37
Figure 28 Approximate annual mileage on a motorcycle (EU dataset) _________________________________________ 38
Figure 29 PTW usage (EU dataset) ____________________________________________________________________ 39
Figure 30 Evaluation of PTW usage for leisure/hobby/sport (short rides) per country >< for going to work/school/university
(commuting) per country ____________________________________________________________________________ 39
Figure 31 Frequency of PTW use (EU dataset) ___________________________________________________________ 40
Figure 32 Riding habits and group riding (EU dataset) ____________________________________________________ 40
Figure 33 Riding and weather conditions (EU dataset) _____________________________________________________ 41
Figure 34 Have you been involved in an accident in any form during the last twelve months? (Merged answers) (EU dataset)
________________________________________________________________________________________________ 41
Figure 35 Have you been involved in an accident in any form during the last twelve months? (Merged answers) (Answer per
country) _________________________________________________________________________________________ 42
Figure 36 Have you been involved in an accident in any form during the last twelve months? (Area of Europe) _________ 42
Figure 37 Number of accidents during the last twelve months (EU dataset) _____________________________________ 43
Figure 38 Accident type (merged answers) (EU dataset) ____________________________________________________ 43
Figure 39 Guilty part (merged answers) (EU dataset) ______________________________________________________ 44
Figure 40 Consequences of the accidents (merged answers) (EU dataset) ______________________________________ 44
Figure 41 Party responsible for the accident per country (answer per countries) _________________________________ 45
Figure 42 Have you experienced a near collision (that did not result in an accident) in the last 12 months, due to another
driver's error? (EU dataset) __________________________________________________________________________ 45
Figure 43 What was the (most frequent) causation factor(s) of your near-miss accident(s)? (Merged answers) (EU dataset).
________________________________________________________________________________________________ 46
Figure 44 Rate of infrastructure problems in causing near-miss accidents (answer per country) _____________________ 46
Figure 45 Most often used means of transport vs PTW usage (European dataset) – data add up to 100% for the most often
used means of transport _____________________________________________________________________________ 48
Figure 46 PTW usage by country (European dataset) – data add up to 100% for each country ______________________ 49
Figure 47 PTW circulating park (Source: ACEM) _________________________________________________________ 50
Figure 48 PTW Fatality rates (CARE, 10.10.2014) ________________________________________________________ 51
Figure 49 Overview of accident causation in-depth knowledge per EU country __________________________________ 53
Figure 50 Overview of PTW accident causation factors - In-depth studies comparison ____________________________ 57

Deliverable 2 - Data Collection & Statistics 4
Glossary
2BESAFE 2-Wheeler Behaviour and Safety (research project)
ABS Anti-lock Braking System
ACEM The Motorcycle Industry in Europe
AMVIR Association of Motor Vehicles Importers Representatives (Greece) - Σύνδεσμος Εισαγωγέων
Αντιπροσώπων Αυτοκινήτων
ANCMA Associazione Nazionale Ciclo Motociclo Accessori (Italy)
APROSYS Advanced Protection Systems (research project)
AT Austria
BASt The Federal Highway Research Institute (Germany) - Bundesanstalt für Straßenwesen
BE Belgium
BG Bulgaria
BIVV-IBSR Belgian Road Safety Institute (Belgium) - Belgisch Instituut voor de Verkeersveiligheid-Institut
Belge pour la Sécurité Routière
BMF British Motorcyclists Federation (United Kingdom)
BU Biker Union (Germany)
BVDM Bundesverband der Motorradfahrer (Germany)
CADaS Common Accident Data Set
CARE Community database on road accidents resulting in death or injury
CH Switzerland
DACOTA Data Collection Transfer & Analysis (research project)
DG MOVE Directorate-General for Mobility and Transport
EC European Commission
EMF European Motorcyclists Forum
ES Spain
eSUM European Safer Urban Motorcycling (research project)
ETSC European Transport Safety Council
EU European Union
FEBIAC Fédération Belge de l'Automobile & du Cycle (Belgium)
FEMA Federation of European Motorcyclist's Associations
FERSI Forum of European Road Safety Research Institutes
FFMC Fédération Française des Motards en Colère (France)
FI Finland
FMI Federazione Motociclistica Italiana (Italy)
FR France
IDAF In-depth Analysis of accidents with fatalities (Austria)
IE Ireland
IFSTTAR The French institute of science and technology for transport, development and networks (France) -
Institut français des sciences et technologies des transports, de l'aménagement et des réseaux
IFZ Institut für Zweiradsicherheit (Germany)

Deliverable 2 - Data Collection & Statistics 5
iGLAD Initiative for the global harmonisation of accident data
ISTAT The National Institute for Statistics (Italy)
IT Italy
ITF International Transport Forum
IVM The German Motorcycle Industry Association (Germany) - Industrie-Verband Motorrad
KFV Austrian Road Safety Board (Austria) - Kuratorium für Verkehrssicherheit
Lillehm. Workshop on Motorcycling Safety, Lillehammer
LMI Lëtzebuerger Moto-Initiativ (Luxembourg)
LU Luxembourg
LV Latvia
MAG Belgium Motorcycle Action Group (Belgium)
MAG Ireland Motorcyclists Action Group (Ireland)
MAG NL Motorrijders Actie Groep (the Netherlands)
MAIDS In-Depth investigation of motorcycle accidents (research project)
MCTC MC Touring Club (Denmark)
MS Member State
NL The Netherlands
NMCU The Norwegian Motorcycle Union (Norway) - Norsk Motorcykkel Union
NO Norway
NTUA National Technical University of Athens (Greece)
OECD Organisation for Economic Co-operation and Development
PISA Powered Two Wheeler Integrated Safety (research project)
PROMISING Promotion of mobility and safety of vulnerable road users (research project)
PTW Powered two-wheelers
ROWVs Right of way violations
RSA Road Safety Authority (Ireland)
SARTRE Social Attitudes to Road Traffic Risk in Europe (research project)
SE Sweden
SIM Safety In Motion (research project)
SMC Sveriges MotorCyklister (Sweden)
SWOV Institute for Road Safety Research (the Netherlands) - Stichting Wetenschappelijk Onderzoek
Verkeersveiligheid
TRACE Traffic Accident Causation in Europe (research project)
Trafficpol Traffic Police Department (Bulgaria)
TRAFI Finnish Transport Safety Agency (Finland) - Liikenteen turvallisuusvirasto
UK United Kingdom
VRUITs Improving the safety and mobility of Vulnerable Road Users through ITS applications (research
project)

Deliverable 2 - Data Collection & Statistics 6
Executive Summary
This deliverable reports on the work performed during the project and the main outcomes of
the activities undertaken in relation to data collection and statistics needs. It focuses mainly
on:
Identifying missing data at European level
Making recommendations on data collection harmonisation
With the objective of gathering as much expertise as possible, the project collected feedback
and information from different sources. Part of the work consisted of identifying and
summarising the main outcomes of EU co-financed projects of relevance to data collection
and statistics. These projects, available on the ERSO website, include 2BESAFE, APROSYS,
DACOTA, eSUM, MAIDS, PISA, PROMISING, SAFETYNET, SARTRE1-4, SIM,
SMARTRRS, SUNFLOWER+6, TRACE, VRUITS.
The project then worked at identifying priority areas for EU action according to the different
stakeholders. This feedback collection took several forms:
a literature review of the main policy documents: Annex 14
a questionnaire (Amplifying Questions) designed to survey the different categories of
stakeholders directly involved into the policy making (Member States, the European
Union, the Motorcycling Community representatives, EU stakeholders). Answers to
the questionnaire were collected via phone interviews, written answers or face-to-face
meetings and are summarised in Annex 4/ annex 5/ annex 6/ annex 7
input from project workshops: Annex 11, annex 12 and annex 13
Views listed in this report come from:
Member States’ National Authorities:
Austria: Statistics Austria
Bulgaria: Trafficpol
Finland: TRAFI
France: Conseil National de Sécurité Routière
Hungary: Hungarian Central Statistical Office
Ireland: Road Safety Authority; National Roads Authority
Italy : Italian Automobil Club, statistical department; ISTAT
Latvia: Road Traffic Safety Directorate
Luxembourg: Statec

Deliverable 2 - Data Collection & Statistics 7
Netherlands: Department of Road Safety, Ministry of Infrastructure and
Environment
Romania: Romanian Traffic Police Directorate
Slovenia: Slovenian Traffic Safety Agency
Spain: Directorate General for Traffic (DGT), Ministry of Interior
Sweden: Swedish Transport Administration
UK: Road User Licensing, Insurance and Safety
Research community
Austria: KFV (Austrian Road Safety Board)
Belgium: BIVV-IBSR
Czech Republic: Transport Research Centre
France: IFSTTAR
Germany: Federal Highway Research Institute (BASt)
Greece: National Technical University of Athens
Netherlands: SWOV Institute for Road Safety Research
iGLAD Consortium
EU stakeholders: BAST/FERSI - PROS
European Commission: Maria-Teresa Sanz Villegas, Casto Lopez Benitez from the
DG MOVE, Dir. C Innovative and Sustainable Mobility, Unit 4 Road safety.
Motorcycling Community (Industry/users)
Belgium: FEBIAC; MAG Belgium
Denmark: MCTC
France: FFMC
Germany: BMW; IVM; IFZ; BU; BVDM
Greece: AMVIR
Ireland: MAG Ireland
Italy: ANCMA; Ducati; FMI
Luxembourg: LMI
Netherlands: Kawasaki; Yamaha; MAG NL
Norway: NMCU
Sweden: SMC

Deliverable 2 - Data Collection & Statistics 8
UK: BMF
In addition, the project summarised the main outcomes of available in-depth PTW accident
causation studies. This work enabled the identification of methodological differences, along
with missing countries where national in-depth studies would be necessary as preliminary
data collection work. The project also compared available national variables in public
statistics and identified further harmonisation needs with regard to the CADaS protocol.
The data collection and analysis performed within the various research projects and the limits
identified by involved researchers, were then summarised. Together with the
recommendations received in interviews held with Member State experts, motorcycling
community representatives, the European Commission and pan-European stakeholders, the
summary was used as a basis to address the CARE initiative related to the CADaS protocol.
Recommendations for specific data harmonisation steps and better data collection processes
for PTW safety and mobility were issued.
Finally, as part of the data collection and validation process, the project organized 3 forums
and discussed the deliverable outcomes with pan-EU stakeholders.
The deliverable concludes by identifying PTW safety data collection priorities and
recommendations for a European data collection strategy.
The project Deliverable 2 on Data collection & Statistics provides the following outcomes:
A summary of EU research work and main conclusions for the past decade on data
collection and statistics related to motorcycling (Annex 21);
An overview of the main accident causation factors based on 7 EU/national Powered
Two Wheelers (PTW) in-depth accident studies;
A table of variables recommended by the CADaS protocol;
An overview of variables collected per country in public statistics reports on
motorcycling;
A summary of accessible data on motorcycle accidents in the EU;
A summary of missing data in the EU and recommendations on needs for
harmonization;
A summary of Recommendations for Action gathered from PTW safety political
priorities main references (Annex 14), Amplifying Questions Member States (Annex
4), Motorcycling Community (Annex 5), EU Stakeholders (Annex 6), EMF2015
discussions (Annex 13).

Deliverable 2 - Data Collection & Statistics 9
Based on these inputs and a comprehensive review of needs, the project team identified a List
of recommendations and priority actions for European and national levels, summarized in the
report on Needs for Policy Action.
The mid-term review of the EC Communication on Road Safety 2011-2020 provides
opportunities to address the PTW data collection and statistics challenges, including the
integration of PTW-specific variables into the CADaS protocol.
This project report was reviewed by Deliverable 2 Reference Expert George Yannis from
NTUA for the latest comments.

Deliverable 2 - Data Collection & Statistics 10
1. Introduction
Powered two-wheelers (PTW) are a popular form of transport providing mobility to millions
of people worldwide. However, unlike other forms of motorised transport, PTW users, like
cyclists, remain more vulnerable due to the intrinsic characteristics of the vehicle.
Over the past decade, collision records highlighted a substantial decrease in PTW casualties
(motorcycles and mopeds). This decrease, albeit less pronounced than for other means of
transport, is taking place against a substantial increase in the number of PTWs on the roads.
In 2004, the MAIDS study1 highlighted the lack of comparative data in Europe and the limits
of the CARE dataset.
Since then, several EU research
projects have started to address PTW
safety issues (cf. Annex 21), all of
them similarly concluding that there is
a lack of comparable and accessible
datasets.
Where do we go from now?
While everyone agrees that data
collection and the harmonization of
data collection processes throughout
Europe is a difficult subject to tackle,
all safety experts, and in particular
those focusing on PTW safety, will
agree that this is a critical issue when
addressing today’s PTW safety issue.
More data is needed, but above all
more comparable data is needed to
start tackling PTW safety in a
sustainable way.
As highlighted by the PROMISING
project, data collection and research
are not safety measures by themselves,
but serve to study the need for and the
effects of such measures. In the case of
mopeds and motorcycles there is a
strong need for more reliable data and
more and better research.
1 http://www.maids-study.eu/
PTW casualties in Europe (Source: OECD/ITF
report on motorcycle safety, 2015 – to be published)
Number of PTWs on the roads (Source: OECD/ITF report on
motorcycle safety, 2015 – to be published)
PTW diversity(Source: OECD/ITF report on motorcycle safety, 2015 – to
be published)

Deliverable 2 - Data Collection & Statistics 11
As concluded by the DACOTA project in 2012, the systematic efforts to gather and
harmonise road accident data at a European level over the last two decades have led to a
significant upgrading and enhancement of the CARE database. Moreover, important data
collection and harmonization efforts have provided very useful results as regards exposure
data and safety performance indicators. Unfortunately, PTW riders have only benefited
marginally from these efforts and altogether, the availability, completeness and level of
harmonization of this data vary significantly.
Similarly, while additional data and related information sources have been established at EU
level, including in-depth data, behaviour/attitude data, data on programmes and measures,
social cost data etc., mainly within the context of European research projects, these data
sources are still not of sufficiently comparable quality, are still not sufficiently linked, and the
aggregate data are not always accessible. Finally, an high amount of national data remains
unexploited at European level.
With the aim of contributing to the effort to improve data collection and knowledge on PTW
safety in Europe, the RIDERSCAN project has focused on:
Identifying missing data at European level
Making recommendations on data collection harmonisation

Deliverable 2 - Data Collection & Statistics 12
2. Project activities and work overview
This section compiles a selection of relevant extracts from EU-financed research projects in
relation with PTW data and statistics. These projects are available on the ERSO website
(latest consulted on 15/03/2015).
The comprehensive list of selected extracts is available in Annex 21.
2.1. EU Research main conclusions (Annex 21)
Market
In Western Europe the absolute number of mopeds is 13-14 million. This number has
not changed much over the last ten years, though was previously higher. France has
seen a major decline in the number of mopeds from over 5 million in 1980 to less than
2 million in recent
years. At almost 10
million, the absolute
number of motorcycles
in Western Europe is
lower than that of
mopeds. This number
is slowly but steadily
increasing. Great
Britain is an exception
with decreasing
numbers of
motorcycles and mopeds. (PROMISING)
The trends for motorcycles are quite different. Almost all countries experienced an
increase in motorcycle ownership rates between 1990 and 1995, some with a marked
increase (e.g. Austria, Germany and Greece), and some less so (e.g. France and
Portugal). By contrast the available information from middle European countries
indicates a continuing downward trend in motorcycle ownership rates. Information on
ownership per age group per country is not generally available, but it is likely that the
age distribution of moped and motorcycle owners varies between countries.
(DACOTA)
Motorcycle types:
There are large country differences concerning motorcycle types. Scooters are most
frequently used in Greece, Italy and Spain. The sport style is found most frequently in
Serbia, the Czech Rep, Sweden and Estonia. Conventional street motorcycles are most
frequently used in Poland, Ireland and Austria. Enduro or offroad motorcycles will
mainly be found in Cyprus, Greece, Italy and Slovenia. Touring style motorcycles are
typical for the Netherlands, France, and Hungary. Choppers are most frequently used
in Finland, the Netherlands and Sweden. In general there is a high proportion of
Figure 1 Rate of PTWs per 1000 inhabitants, 2009 (Source CARE Database/EC)

Deliverable 2 - Data Collection & Statistics 13
scooter riders in Mediterranean countries and high proportions of conventional street
machines in Northern European countries. (SARTRE4)
Engine size
There are large country differences concerning engine size. Bikes with less than 126cc
are most frequently used in Greece, Spain, and France. 126-250 cc bikes are most
frequently used in Italy, Serbia and Hungary. 251-500cc is typical for Austria and the
Czech Rep, while 501-750cc will be most frequently seen in Serbia, Estonia, the
Netherlands and Sweden. 751+cc is most frequently used in Finland, Sweden and
Belgium. In general, smaller engine sizes up to 250cc are more typical for
Mediterranean countries. In Northern European countries engine sizes above 750cc are
used (SARTRE4)
Riding frequency
Near-daily use of motorcycles occurs most frequently in Greece, Cyprus and Ireland.
Near-daily use is seen more often in Southern European countries than in Northern
ones. The lowest riding frequency is found in the Netherlands, Poland and Germany.
(SARTRE4)
Rider location
The largest proportion of motorcyclists living in a rural area is found in Slovenia,
followed by Germany, Belgium, Poland and the Netherlands. The lowest proportion of
this group lives in Sweden and Serbia. In Sweden most motorcyclists live in urban
areas. (SARTRE4)
Gender and age
There are major differences in the proportion of male or female riders. The largest
proportions of male riders are found in Hungary and Serbia. The largest proportions of
female riders are in Italy, France and the Netherlands. The largest proportions of
younger riders are in Serbia and Israel, while the largest proportions of older riders are
found in Italy and Germany. (SARTRE4)
Education
There are large differences concerning motorcyclists’ level of education. Primary
school level was most frequently found in Austria, Hungary, Germany and Spain.
Further education level is more often in Israel, Cyprus and the Netherlands than in the
other countries. (SARTRE4)
Family status
A motorcyclist’s family status differs a lot between countries. At a country-by-country
level the highest rate of singles is found in Israel, Cyprus and Serbia. Motorcyclists
living with a partner are most often found in Estonia, Sweden and Austria, while
married motorcyclists mostly live in Poland, Italy, Germany and the Netherlands. Half

Deliverable 2 - Data Collection & Statistics 14
of motorcyclists have at least one child. Belgium, Poland and Netherlands have the
highest rates of motorcyclists with children. (SARTRE4)
Motivations
A detailed analysis of the motives for riding a motorcycle showed that overall, the
pleasure of motorcycling, the feeling of freedom and the easiness to find parking are
the most important motives. Motives regarding motorcycling advantages for mobility
and biking spirit turned out to be important secondary motives. On the basis of an
international comparison of high and low national scores on the different motives, two
opposite groups of countries, generally having opposite motives, were identified: a
group of 4 Mediterranean countries (Greece, Cyprus, Spain and Italy) and a group of
four Northern and Central European countries (Finland, Sweden, Germany and
Slovenia). Motorcycling advantages for mobility appeared to be crucial reasons for
using a motorbike in the Mediterranean group, but less important for the Northern
group. Similarly, imposed constraints like not having a car or having no choice turned
out to be more decisive for the Mediterranean group than for the others. Northern and
Southern European countries proved partially mixed concerning biking spirit and
speed enjoyment. (SARTRE4)
Profiles
Commuters Sport Riders Ramblers Travellers
Bike types Scooters and less
powerful
motorbikes.
Sport style
powerful
motorbikes.
Conventional
Street Power full
motorbikes,
Sport Style
motorbikes,
Touring
motorbikes,
Choppers.
Conventional
Street
motorbikes,
Touring
motorbikes,
Choppers, Off-
Road bikes.
Training Less interested
by advanced
motorcycle skill
courses.
Keener towards
advanced
motorcycle skill
courses.
They have
completed
advanced
motorcycle skill
courses.
Highest level of
motorcycling
experience.
Highest number
of motorcyclists
having
completed
advanced
motorcycle skill
courses.
Motorcycle
use
Use their
motorbike
during all the
year.
Use their
motorbike
during all the
year.
Significantly use
less their
motorbike during
the year.
Use their
motorbike during
all the year.
Motivations
for driving a
Motorcycling
advantages for
Pleasure of
riding, freedom
Fun and pleasure
of riding and
Pleasure of
riding and

Deliverable 2 - Data Collection & Statistics 15
motorbike mobility
(avoiding traffic
jam, saving time,
easiness for
parking, cheaper
mean of
transport and
lastly, reduce
CO2 pollution)
or because of
imposed
constraints (i.e.
having no car or
not any other
choice for
mobility).
feeling and
acceleration
sensations.
Even if less
essential,
motorcycling
advantages for
mobility are also
very important
motivations.
Imposed
constraints are
not relevant.
freedom feeling.
Motorcycling
advantages for
mobility are
clearly not
important
motivations.
Imposed
constraints are
totally marginal
motivations.
Economical
motivations (i.e.
cheaper mean of
transport) are
clearly less
important for
this group than
for the others.
freedom feeling
and Biking spirit.
Motorcycling
advantages for
mobility are also
important
motivations for a
large part of
them
Imposed
constraints are
not relevant.
Motorcycling
spirit
Pleasure of
riding is
significantly less
important for
this group of
motorcyclists.
They are clearly
not interested in
biking spirit or
acceleration
feeling.
Biking spirit is
very important.
Biking spirit and
Acceleration
enjoying are
important
They ride above
all because they
like it.
Biking spirit and
freedom are
important.
Law
infringement
Have lower
number of speed
tickets.
Like speed and
acceleration
when riding, and
they have had a
significantly
highest number
of speed tickets.
Aware of alcohol
risk when riding,
and like the
other groups,
they generally
not ride their
bike when they
have drunk.
They have had a
lower number of
speed tickets
than Sport
Riders and
Travellers.
Seemed more
aware than
Commuters of
speed risk in
urban area.
Very careful
attitude towards
alcohol when
riding.
Seemed less
interested by
speed than other
groups.
Seemed globally
aware of alcohol
risk when riding.
Protective Generally wear a Generally wear a Highest positive Very positive

Deliverable 2 - Data Collection & Statistics 16
equipment helmet when
they drive a
motorbike.
Well aware of
helmet positive
effect for their
safety in case of
accident.
Sometime ride a
passenger
without helmet.
They
significantly less
frequently used
other safety
equipment when
riding (like
jackets, back
protections and
motorbike shoes)
helmet when
they ride.
Well aware of
helmet positive
effect for their
safety in case of
accident.
They frequently
used specific
jackets, back
protections and
motorbike shoes
when riding.
attitude towards
helmet wearing
when they drove
a motorbike.
Very aware of
helmet interest
for riders’ safety,
for themselves as
well as for their
passenger.
attitude towards
helmet wearing.
Fully aware of
helmet interest in
case of accident.
Frequently used
specific jackets,
back protections
and motorbike
shoes when
riding.
Risky
behaviour
Risky
manoeuvres
include too close
car-following
distance keeping
and critical
overtaking.
Very aware of
the
dangerousness of
riding
manoeuvres like
weaving or
overtaking cars
between lines.
Have more risky
practices.
Less aware of
the
dangerousness of
weaving
manoeuvres (in
urban area or on
motorway) and
overtaking
vehicles on the
right.
Very aware of
the
dangerousness of
weaving
manoeuvres, and
overtaking
vehicles on the
right as well as
between lines.
They less often
followed vehicle
with a too close
distance.
They less often
implemented
critical
overtaking
manoeuvres.
Aware of the
dangerousness of
weaving
manoeuvres (in
urban area or on
motorway) and
overtaking
vehicles on the
right.
Figure 2 Motorcyclist Profiles (SARTRE4)
Fatality rate
As there is no reliable data available about the exposure of PTWs (vehicle kilometres
or fleet numbers) in each of the countries on Map 1, it is difficult to interpret the
numbers of fatalities in the group of PTWs or the difference in the distribution
between mopeds and motorcycles. (DACOTA)
Deliverable 2 - Data Collection & Statistics 17
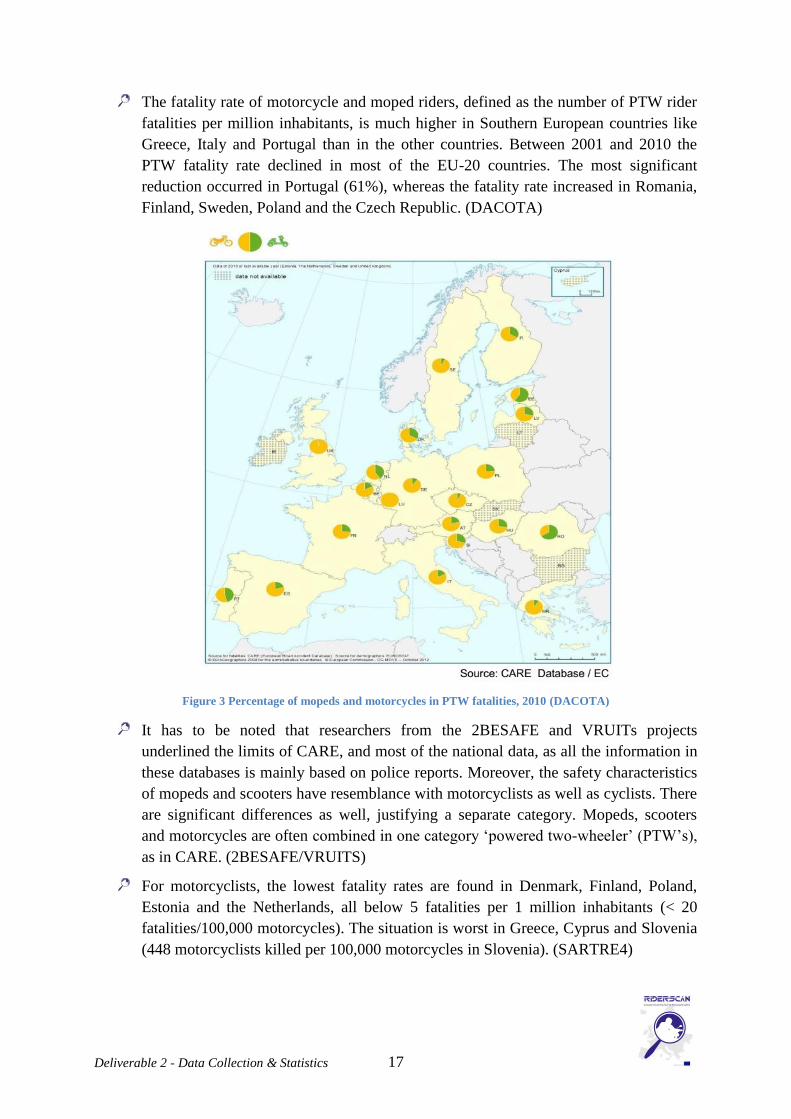
The fatality rate of motorcycle and moped riders, defined as the number of PTW rider
fatalities per million inhabitants, is much higher in Southern European countries like
Greece, Italy and Portugal than in the other countries. Between 2001 and 2010 the
PTW fatality rate declined in most of the EU-20 countries. The most significant
reduction occurred in Portugal (61%), whereas the fatality rate increased in Romania,
Finland, Sweden, Poland and the Czech Republic. (DACOTA)
Figure 3 Percentage of mopeds and motorcycles in PTW fatalities, 2010 (DACOTA)
It has to be noted that researchers from the 2BESAFE and VRUITs projects
underlined the limits of CARE, and most of the national data, as all the information in
these databases is mainly based on police reports. Moreover, the safety characteristics
of mopeds and scooters have resemblance with motorcyclists as well as cyclists. There
are significant differences as well, justifying a separate category. Mopeds, scooters
and motorcycles are often combined in one category ‘powered two-wheeler’ (PTW’s),
as in CARE. (2BESAFE/VRUITS)
For motorcyclists, the lowest fatality rates are found in Denmark, Finland, Poland,
Estonia and the Netherlands, all below 5 fatalities per 1 million inhabitants (< 20
fatalities/100,000 motorcycles). The situation is worst in Greece, Cyprus and Slovenia
(448 motorcyclists killed per 100,000 motorcycles in Slovenia). (SARTRE4)

Deliverable 2 - Data Collection & Statistics 18
In most European countries, the absolute number of moped fatalities under 25 years of
age is about the same as for older riders. Nevertheless, there are more motorcycle
fatalities involving riders older than 25. This does not apply to Greece, Spain and
Italy, where the numbers are about equal for both age groups. Ten to fifteen years ago
most countries used to have many more young rider fatalities, but the age distribution
of the motorcycle rider population has changed to more older riders. (PROMISING)
Figure 4 Percentage of motorcycle and moped rider fatalities by age group, 2010 (DACOTA)

Deliverable 2 - Data Collection & Statistics 19
Figure 5 Motorcycle and moped fatalities per million inhabitants by age group - EU-24, 2010 (DACOTA)
Several factors contribute to the wide variation between countries in fatality rates for
mopeds and motorcycles. The characteristics of the rider population may be different.
As a consequence of differences in legislation, the age distribution and level of
training will vary. The conditions of riding in terms of type of road, other traffic etc.
may also differ between countries. But to what extent these factors actually contribute
in the case of each country is not known. (PROMISING)
Road type
Most PTW accidents occur within urban areas. Based on MAIDS, APROSYS and
other, national studies, the TRACE programme concluded that in urban areas most
accidents occur at intersections, while in non-urban areas they occur mainly on
straight sections. Moped/mofas are more likely to be involved in urban accidents than
motorcycles. (PISA)

Deliverable 2 - Data Collection & Statistics 20
Figure 6 – Percentage of PTW rider fatalities by area type, 2010 (DACOTA)
Accidents/Vehicle type
With regard to engine size there are differences between the Southern and the
Northern European countries. While in the Southern European countries a high
proportion of small-sized motorcycles up to 250 cc are involved in accidents, in
Northern European countries the highest proportion of accidents involved motorcycles
with an engine size of more than 750 cc. (SARTRE4)

Deliverable 2 - Data Collection & Statistics 21
Figure 7 Injury accident involvement by country for motorcycle type (in % of accident involved motorcyclists)
(SARTRE4)
Junctions
Close to a third of all motorcycle and moped rider fatalities occur at a junction (28%).
The respective figure for car occupant fatalities is just 18%. Crossroads are the most
dangerous type of junction for motorcycles and mopeds, with 51% of the overall
respective fatalities recorded at such junctions. The majority of fatalities occur away
from junctions for all transport modes. The highest proportions of fatalities at
junctions are found for bicycles and powered two-wheelers. (DACOTA)
Figure 8 Fatalities by junction type and mode of transport - EU-24, 2010 (DACOTA)
Weather conditions
There are relatively few fatalities in the winter, and relatively more in the summer.
This reflects the seasonal pattern of moped and motorcycle use. The number of moped
fatalities does not vary over the months as much as that of motorcycle fatalities;

Deliverable 2 - Data Collection & Statistics 22
however in all countries there are more fatalities per month in the period April –
October. A large number of motorcycle fatalities occur in good weather, especially
from May to September. (DACOTA)
Figure 9 Moped fatalities by month - top 5 countries and other EU-24, 2010 (DACOTA)
Figure 10 Motorcycle fatalities by month - Top 5 countries and other EU-24, 2010 (DACOTA)
Predicting the number of motorcycle rider injuries based on the weather characteristics
of a particular year, average weather conditions and the relation between weather and
accidents is possible with an error less than 3. (2BESAFE)
Accident causation
o Failed to see, faulty decisions (PTW rider)
o Loss of control (related to excessive speed, alcohol impairment, lack of
judgement and careless/thoughtless/reckless behaviour) (PTW rider)
o Loss of control (related to excessive speed, lack of judgement in own path)
(PTW rider)
o Failed to see (lack of attention, visual obstruction, reduced PTW visibility)
(Other Driver)

Deliverable 2 - Data Collection & Statistics 23
o Failed to give way and poor turn/manoeuvre (related to failure to observe
satisfactorily, careless/thoughtless/reckless behaviour and failure to judge the
rider’s path or speed) (Other Driver)
o Failed to give way, poor turn/manoeuvre (related to “looked but did not see”,
failure to judge other person’s path) (Other Driver) (PISA)
Faulty diagnosis, inadequate foresight and
failure to see are frequently recorded
causes. These are linked to both an
information failure (for example, a rider
thinking another vehicle was moving
when in fact it was stopped and colliding
with it) and a communication failure (for
example, pulling out into the path of a
driver who had indicated a turn too early).
The main cause leading to inadequate
foresight (a lack of all the required details
or that a driver’s ideas not corresponding
to reality) is lack of knowledge (for example, not understanding a complex junction
layout), followed by psychological stress. The causes leading to a failure to see fall
into two categories, physical ‘obstruction to view’ type causes (for example, parked
cars at a junction) and human factors (for example, not seeing a red light due to
distraction or inattention). (DACOTA)
Vehicle control
Accident avoidance manoeuvres are identifiable in 70% of cases; manoeuvres
consisted mostly of emergency braking, partly swerving and/or braking; High
percentage of “loss of control” before impact. (SIM)
PTW riders involved in urban accidents were found to be less trained and skilled than
other riders, having less official training and more control unfamiliarity and skill
deficiencies. (eSUM/MAIDS-Urban)
A different pattern was found when single-vehicle and fatal urban accidents were
analysed separately. These accidents turned out to be less related to commuting and
more to recreational activities: they occurred more during the evening or at night and
the PTW rider was more prone to take risks, such as exceeding the posted speed limit,
improperly wearing a helmet or being alcohol impaired. (eSUM/MAIDS-Urban)
Differences in classifications for serious injury data are noted along with possible
under-reporting of PTW serious injury collisions. (eSUM)
Figure 11 Ten most frequent links between causes
- PTW riders (DACOTA)

Deliverable 2 - Data Collection & Statistics 24
Common accident types
o Right of way violations –Young riders (16-20) were more likely to be at fault.
Mostly associated with other drivers where the most common failure was
incorrect observation of the scene. Clustered around peak time traffic flows.
o Bends –Those aged 26-30 had an increased propensity to lose control in bends.
These are nearly always regarded as the fault of riders who are nearly three
times as likely to be rated as ‘inexperienced’. Their occurrence was spread
more evenly throughout the day and was more often on a Sunday, suggesting
that these accidents may be associated with recreational riding.
o Overtaking/filtering – Those aged 51-55 were under-represented whilst those
aged 56-60 were over-represented but these results may have been influenced
by small sample sizes. Only 5% of such accidents were considered solely the
fault of the motorcyclist and there was an increased tendency for these
accidents to be classified as ‘combined fault’. Overtaking/filtering accidents
were clustered around peak time traffic flows. (PISA)
For both moped and motorcycle riders, more than two-thirds of the serious accidents
involved collisions with a car, many of these at intersections where the car driver
entered from a side road or turned in front of the rider. Of course there are some
differences between moped and motorcycle accidents related to their use (lower speed
and more short trips in urban areas for mopeds). (PROMISING)
Risk factors
Overall the most important factors when comparing accidents involving and not
involving motorcyclists are age, high-risk riding behaviour, and drink driving. On the
other hand, motorcyclist attitudes, motives to ride a motorcycle and risk perception do
not highly affect their accident risk. (SARTRE4)
Infrastructure
MAIDS and UK data refer to poor quality road surfaces as a causal or contributory
factor in up to 5% of accidents, although Greek data cited it as a major cause. Crash
barriers can cause serious head, spinal and lower extremity injuries and increase the
incidence of serious injuries by two times and of a fatal injury by five times. Cable
barriers can lead to additional cutting injuries. (PISA)
Other vehicles
Both MAIDS and APROSYS indicate a car on the roadway as the most frequent
offending object. UK data suggests that these accidents account for a significant
number of PTW fatalities and serious injuries. MAIDS and national studies indicate
that single-vehicle PTW accidents account for approximately 15% of all PTW
accidents. (PISA)

Deliverable 2 - Data Collection & Statistics 25
Figure 12 Motorcycle accidents by injury severity and injury causation (Source: Honda, 2006)
Interactions between rider/drivers/infrastructure
PTW accidents present several complex interactions with the way riders or drivers
behave on the road. These interactions increase greatly in certain accident
configurations, such as at an intersection or during an overtaking manoeuvre. Further
causes are right of way violations (ROWVs), most frequently by a party other than the
motorcyclist, loss of control and speeding, all of which greatly influence the severity
of PTW injuries. (2BESAFE)
Traffic management
Trials in the UK indicate no safety disadvantages in the restricted use of bus lanes by
motorcyclists. (PISA)
From the extensive analysis of the literature on driver/rider interactions in PTW
accidents, several critical factors have emerged:
o Riding/driving attitudes and patterns (such as sensation-seeking, risk-taking,
speeding and so on)
o Age, gender and experience
o Licencing, education and training
o Type of PTW (related to engine power, type of use, tuned PTWs)
o Perception of drivers/riders and human errors (from the point of view of the
PTW or the passenger car)
o Collision type (rural or urban, single-vehicle or multi-vehicle accident, front-
side crash, side-side and so on)
o Rider visibility, perception of motorcycles by drivers.
o Alcohol and other impairments (medication, drugs, fatigue, etc.) Personal
protective equipment (helmets and other PTW gear). (2BESAFE)

Deliverable 2 - Data Collection & Statistics 26
Accident scenarios
For Powered Two Wheelers, the most common scenario in the CARE accident
analysis was found to be the PTW being hit by a vehicle (mainly passenger car)
initially heading in the same direction and then turning across the path of the PTW.
This was not consistent with the national database analyses which suggest that the
most common scenario involves vehicles pulling out from intersections into the path
of the PTW. Most accidents occurred within urban environments. It is thought that the
majority occurred on roads with low speed limits (<50km/h). The majority of
accidents occurred in fine and dry weather conditions during daylight hours. The
majority occurred during the‘summer months’ (May to September). A limitation of
CARE, and most of the national data, is that they mainly based on police recordings,
which have an underreporting of single accidents. (VRUITS)
The ISO configurations are diverse and no clear main scenario can be distinguished.
(2BESAFE, APROSYS, SIM)
Sce
na
rio
s
Finland
France
Greece
Italy
UK (2BESAFE)
Spain (APROSYS)
Germany
Italy
Netherlands
Spain (PISA)
1 moped /
passenger car
accident
outside urban
area
intersection
X
2 moped /
passenger car
accident
inside urban area no intersection
X X
3 moped /
passenger car
accident
inside urban
area
intersection
X X X
4 motorcycle /
passenger car
accident
outside urban
area
intersection
X X X
5 motorcycle /
passenger car
outside urban
area
no
intersection X X X
6 motorcycle /
passenger car
accident
inside urban
area
intersection
X X X
7 motorcycle /
passenger car
accident
inside urban area no intersection
X X
8 single moped
accident
outside urban
area
no intersection X
9 single moped
accidents
inside urban area no intersection X
10 single
motorcycle
accident
outside urban
area
no
intersection X X X
11 single
motorcycle
accident
inside urban area intersection
X
12 single inside urban area no intersection X

Deliverable 2 - Data Collection & Statistics 27
motorcycle
accident
Figure 13 Most frequent Accident Scenarios - In-depth accident analysis comparison
Figure 14 Summary of CARE Data Analysis - PTWs (VRUITS)
Single vehicle accidents
The issue of single vehicle accidents is thought to be somewhat greater than that
reported in the European CARE data and national statistics. According to CARE,
single vehicle accidents account for 8.3% of total moped (up to 50 cc) accidents, 28%
of total accidents of PTWs up to 125cc and 37% of total accidents of PTWs over
125cc. The issue was first highlighted in Hurt et al (1981) in which approximately
one-quarter of cases investigated in an in-depth study were found to be single-vehicle
accidents whereby the motorcycle collided with the roadway of some fixed obstacle in
the road environment. In these single vehicle accidents, motorcycle rider error was
present as the accident precipitating factor in about two-thirds of the cases, with the
typical error being a slide-out and fall due to over-braking or running wide on a curve
due to excess speed or under-cornering. Only a small minority of cases were
attributable to road or motorcycle defects. (VRUITS)
Impact
The object primarily hit is a car, then the road and the PTW itself; in most collisions
the PTW is still upright and the rider is not separated from the PTW at the moment of
impact. (SIM)
Injuries
Impact primarily affects the lower extremities, followed by the head, upper extremities
and chest; the severity of injuries reported for certain body areas shows a marked
increase in line with increased speed; whereby the wearing of protective clothing
reduces the severity of injuries. (SIM)

Deliverable 2 - Data Collection & Statistics 28
Crash test scenarios
ISO13232 specifies seven
impact scenarios for
assessment purposes, but
does not take account of a
PTW overtaking a car
turning left – a clear
accident scenario found
within the ARPOSYS
literature review.
Honda, in developing its
motorcycle airbag, has
added four further factors:
Influence of a
rider’s size
Influence of the rider’s forward tilted posture
Influence of high-impact collision at speed whilst carrying a passenger
Front wheel non-impact collision. (PISA)
Protective equipment
The results of the survey revealed important differences between various groups of
motorcyclists and also various countries in their use of helmets and other safety
devices. Besides general safety awareness in individual countries, there are complex
factors affecting wearing rates. (SARTRE4)
Design implication
The greatest potential for further reducing casualties is through improved primary
and/or secondary safety rather than through medical intervention. Studies from the UK
and the USA point to the role of: reduced forces, reduced speed, improved secondary
safety and sympathetic traffic control in future casualty reduction while another study
notes the importance of reaching riders of large machines in reducing casualty figures
due to their increased number, higher exposure and fatality rate. A variety of measures
are required to address the variety of causal factors. (PISA)
ABS and traction control seems to be the main appropriate countermeasures. (SIM)
Figure 15 Figure 15 ISO 13232 Crash Test scenarios (PISA)

Deliverable 2 - Data Collection & Statistics 29
Figure 16 Interrelationship between motorcycle accidents, causes, and preventive measures (Huang and Preston,
2004) (SIM)
CARE limits
There are a number of limitations that need to be taken into account from the data
analysis. These are as follows:
o The CARE data only represents EU-25 and therefore overall representativeness
and abstraction to the whole of the EU is not possible.
o The CARE data contains limited detail relating to individual accidents so it is
not possible to determine accident characteristics an in-depth level.
o However, there are no available in-depth databases with sufficient numbers of
cases which can be used to determine ‘representative scenarios’ within the EU.
o For the reasons stated, there may be scenarios in individual Member States that
cannot be determined from the accident analysis and therefore the ITS
solutions that may follow on from this analysis may not applicable across the
whole of the EU.
o For the same reason, there may be unique accident scenarios in some EU
Member States that may not be taken into account through ITS
countermeasures and future work may need to be conducted to look more
specifically at these individual situations.
o Limited capability for discrimination between mofa/moped and motorcycle
accidents makes it difficult to generalise about ITS countermeasures –
technologies that may be suitable for larger PTW’s (those over 50cc’s) may
not be suitable for smaller PTW’s since the capacity for installing new
technologies on either classification will be different.
o The CARE database does not allow discriminating between the different types
of urban roads. In urban areas at least three classes of roads can be
distinguished: trunk roads (only motorized traffic), collector (main) roads
(connecting districts) and residential/traffic calmed roads. Most VRU accidents

Deliverable 2 - Data Collection & Statistics 30
happen on collector roads, where traffic is heterogeneous and mixed functions
apply.
o It is acknowledged that overall national datasets are not detailed enough to
allow discrimination of specific circumstances and causal factors that are
evident in VRU accidents. Therefore more analysis is required to look at these
circumstances and this will involve data which were collected at a more in-
depth level. However, it has to be remembered that the data that are gathered
using an in-depth approach are rarely if ever representative therefore caveats
will be required for these analyses as well. This follow-up analysis will be
undertaken for all VRU groups.
o A major limitation of the data analysis in its present format is that the data are
not sufficient to address the issue of ‘single vehicle VRU accidents’. Further
analysis of this important issue will follow in an addendum report focussing
specifically on accidents where no second vehicle is involved. For this
analysis, different data sets will be used that are at a more in-depth level.
o However, the caveats that will apply in the point above will also apply to this
addendum analysis. The issue of exposure needs to be taken into account. It is
not surprising that there are more VRU accidents in daylight, in good weather,
and in the summer months, because that is when the exposure is at its highest
and thereby the high numbers do not indicate higher accident risks. However,
overall, the VRUITS project will aim to develop solutions for accidents which
occur with greatest frequency (and hence where the exposure is
correspondingly much hig her) as opposed to high-risk situations whereby the
risks of accident involvement are highly significantly enhanced but where the
absolute numbers of cases are relatively small in number. (VRUITS)
2.2. RIDERSCAN pan-European surveys
The European Motorcyclists Survey (Annex 1)
A survey targeting European riders was designed to collect information on the motorcycling
community around Europe and to gain a better overview of similarities and differences in
terms of riding, attitudes and safety needs.
The survey was conducted as an open participation survey, open to the general public in each
participating country for 6 months. It was available in the following languages: Czech,
Danish, Dutch, English, Finnish, French, German, Greek, Hungarian, Italian, Norwegian,
Polish, Portuguese, Slovenian, Spanish and Swedish. The survey was advertised through rider
clubs and the national press. The Pan-European survey was disseminated at national level via
riders’ groups and the motorcycling press as well as via Internet. It collected over 17,000
usable answers from 18 European countries (more methodological details in Annex 1).
It consisted of 4 parts:

Deliverable 2 - Data Collection & Statistics 31
I. General information: this part of the survey aimed at segmenting motorcyclists per
country according to basic socio-economic information.
II. Mobility habits: This part of the survey aimed at understanding what kind of
journeys motorcyclists undertake in general and more specifically with their
powered two-wheelers.
III. Riding habits: This part of the survey aimed at gaining more details on riding
habits.
IV. Safety habits: This part of the survey aimed at gaining more details on safety
habits.
The analysis of the answers included the creation of a normalised European dataset and
national datasets.
Vehicle use - Number of motorcycle(s) by rider
Figure 17 Number of powered two-wheelers owned by the respondent (EU dataset)
o The European dataset shows that the vast majority of riders own just one powered
two-wheeler (Figure 17). However, geographical differences can be observed.
Motorcyclists from Southern European countries tend to own just one PTW, as is
the case in France (68.6%), Spain (68.1%) and Portugal (67.9%). By contrast,
riders from Northern European countries tend to own several bikes. Riders from
Norway, Sweden and Switzerland owned the highest number, with 9.2%, 9.6% and
9.6% of them respectively owning more than 3 powered two wheelers.
Engine size
o The European dataset shows that the majority of bikes owned have engine sizes
exceeding 400 cm3, with a reasonably equal share between bikes above 400 cm
3,
above 700 cm3, and above 1000 cm
3.

Deliverable 2 - Data Collection & Statistics 32
Figure 18 Engine size breakdown of PTWs owned in Europe (Merged answers) (EU dataset)
A national analysis shows that:
o The Czech Republic is the country with the largest number of PTWs with an
engine size below 125 cm3
(16.8%). This smallest engine size is least represented
in Switzerland, where such PTWs constitute just 2% of all PTWs owned by
respondents.
o Greece has the highest number of 125-400 cm3
PTWs (representing 29.2% of all
PTWs).
o 401-700 cm3
is the most popular engine size in the Czech Republic, France,
Greece, Portugal and Spain. In Portugal, 37.4% of PTWs have this engine size.
o 701-1000 cm3 is the most popular engine size in Germany, Italy, though the
Netherlands has the highest percentage of this engine size (32.2% of PTWs).
o Finally, motorcycles exceeding 1000 cm3
are the most popular in Belgium,
Denmark, Finland, the Netherlands, Norway, Sweden, Switzerland and the United
Kingdom. In Belgium, motorcycles exceeding 1000 cm3
represent 45.3% of all
PTWs!
o It should be noted that the breakdown of engine size is quite homogeneous in
Czech Republic (Figure 19). By contrast, the breakdown in Belgium is quite
unbalanced, with 3 engine size representing more than 88% of PTWs owned by
respondents. Moreover, the most popular engine size accounts for approximately
45% of vehicles, while the second most popular size accounts for just 22%.
(Figure 20).

Deliverable 2 - Data Collection & Statistics 33
Figure 19 Breakdown by engine size for PTWs in the Czech Republic (Merged answers)
Figure 20 Breakdown by engine size for PTWs in Belgium (Merged answers)
Type of vehicle
Figure 21 Repartition of vehicle type in Europe (Merged answers) (EU dataset)

Deliverable 2 - Data Collection & Statistics 34
o The preferred type of vehicle varies greatly from one country to another without
any real geographical trend: Standard motorcycles are the most popular type of
PTW in the Czech Republic, France (33.3%), Germany, Italy, Portugal and
Switzerland. Sport Touring motorcycles are the most popular type in Denmark,
the Netherlands, Norway, Spain and the United Kingdom. In Denmark, they
account for 32.7% of all PTWs. On/off road bikes are the most popular type in
Greece and Sweden. In Greece, they represent 30.7% of all PTWs. Touring bikes
are the most popular type in Belgium, representing 24.1% of PTWs. Custom bikes
are the most popular type in Finland, representing 21.1% of PTWs. Greece has the
highest rate of scooters (27.7%) and electric (0.5%) PTWs declared by survey
respondents. (Figure 22).
Figure 22 Breakdown by vehicle type in Greece (Merged answers) (Greece)
Brand

Deliverable 2 - Data Collection & Statistics 35
Figure 23 Top 5 brands owned in Europe (Merged answers) (EU dataset)
o (Figure 23) These are the top 5 brands in most surveyed countries (Belgium, the
Czech Republic, Denmark, France, Germany, the Netherlands, Norway, Portugal,
Spain and Sweden). Harley Davidson enters the top 5 in Finland (10.5% of PTWs
owned by respondents) and Switzerland (7.6%). In Greece, Piaggio accounts for
6.5% of PTWs, as can be expected when we recall that 27.7% of Greek
respondents are scooter owners.
o Italian and UK riders show a certain national preference in their choices: in Italy,
Ducati is the third most popular brand (11.2%), while in the United Kingdom,
Triumph is the fourth brand (12.7%). This preference for national brands is also
confirmed in the German answers, with BMW taking top place (18.1%).
Transport use – Preferred means of transport
Figure 24 Most used means of transport (EU dataset)

Deliverable 2 - Data Collection & Statistics 36
o The EU sample of answers shows a fairly balanced share between cars and PTWs;
both are declared by over 40% of respondents as the most used means of transport.
(Figure 24)
Figure 25 Car and PTW usage per country (answer per country)
o Car and PTW usage is more or less balanced in Belgium, France, Italy, the
Netherlands, Portugal, Spain and the United Kingdom. In the Czech Republic,
Denmark, Finland, Germany, Norway, Sweden and Switzerland car usage is higher
than PTW use, while in Greece, the reverse is true, with car usage at 26.7% and
PTW usage at 66.4%. Cleary, a geographical trend can be seen, with the
proportion of PTW usage dropping in Northern European countries where the
weather makes riding more difficult throughout the year. (Figure 25)
0%
10%
20%
30%
40%
50%
60%
70%
Car PTW
Belgium
Czech Republic
Denmark
Finland
France
Germany
Greece
Italy
Netherlands
Norway
Portugal
Spain
Sweden
Switzerland
United Kingdom

Deliverable 2 - Data Collection & Statistics 37
Mileage
Figure 26 Approximate annual mileage by car (EU dataset)
o The EU sample shows that half of the respondents clock up over 10,000km/year by
car, and close to 30% over 15,000km. (Figure 26)
Drive more than
10,000km/year
Drive more than
15,000km/y
Belgium 55,8% 36%
Czech Republic 50,3% 32.3%
Denmark 68.2% 46.2%
Finland 68.5% 48.5%
France 50.9% 30.1%
Germany 56.2% 34.9%
Greece 21.4% 10.4%
Italy 49.5% 29.1%
Netherlands 50% 34.3%
Norway 63.9% 33.9%
Portugal 43.7% 28.3%
Spain 37.4% 19.8%
Sweden 39.4% 24.8%
Switzerland 51.8% 28.5%
United Kingdom 46.4% 21.6%
Figure 27 Percentage of respondents driving more than 10,000 km per year (answer per countries)
o A country comparison shows that this proportion is quite similar in every country
selected except Greece, Spain and Sweden where respondents drive less than in
other European countries: In Greece, more than 50% of respondents drive less than
5,000 km per year by car. In Sweden, more than 50% of the respondents drive less
than 7,000 km per year by car. In Spain, more than 53% of the respondents drive

Deliverable 2 - Data Collection & Statistics 38
more than 7,000 km per year by car, though less than 38% drive more than 10,000
km.
Figure 28 Approximate annual mileage on a motorcycle (EU dataset)
o The EU sample shows that average mileage by PTW is generally between 3,000
and 10,000km/year. (Figure 28)
o A country comparison shows that no specific geographical trend:
in Sweden, the largest group of riders (24.3% of our respondents) rides
between 1,000 to 3,000km a year;
the largest group of riders in the Czech Republic (26.6% of respondents),
Germany (22.6%), Portugal (19.9%) and the United Kingdom (22.3%) ride
between 3,001 and 5,000km a year;
the largest group of riders in Denmark (20.3% of respondents), Finland
(20.8%), Greece (23.1%), Italy (20.6%), Spain (20.1%) and Switzerland
(22.1%) ride between 7,001 and 10,000km a year;
the largest group of riders in Belgium (23.1% of respondents), France
(20.7%) and Norway (21.1%) ride between 10,001 and 15,000km a year;
in the Netherlands, the largest group of riders (22.3% of respondents) rides
more than 15,000km a year.
Motorcycle usage

Deliverable 2 - Data Collection & Statistics 39
Figure 29 PTW usage (EU dataset)
Respondents had to evaluate their use of their powered two-wheelers in percent (question 74).
o In almost all our country panel, the first use of powered two wheelers is leisure. In
Germany, Czech Republic, Switzerland, Sweden and Italy, this proportion exceeds
50% of the total use of their PTW by our respondents (Figure 30). Greece and
Portugal are the only countries from our panel where the first use of the PTW is for
commuting purpose. (Figure 30).
Country Percentage of
use
Country
Percentage
of use
Germany 60.52% Greece 51.25%
Czech Republic 58.72 Portugal 43.40%
Switzerland 55.87% Spain 39.11%
Sweden 55.25% France 36.27%
Italy 52.30% Belgium 32.27%
United
Kingdom 48.83%
United
Kingdom 30.20%
Netherlands 48.14% Italy 29.94%
Denmark 47.46% Netherlands 29.06%
Belgium 46.98% Norway 27.32%
France 46.31% Denmark 23.33%
Finland 46.12% Czech Republic 19.98%
Norway 42.64% Sweden 19.30%
Spain 40.73% Finland 19.15%
Portugal 40.67 % Germany 19.06%
Greece 28.72% Switzerland 18.43%
Figure 30 Evaluation of PTW usage for leisure/hobby/sport (short rides) per country >< for going to
work/school/university (commuting) per country

Deliverable 2 - Data Collection & Statistics 40
Figure 31 Frequency of PTW use (EU dataset)
o A national comparison tells us that the countries where riders use their PTW every
day - Greece (73.4%), Spain (37.4%), Portugal (37.2%) and Italy (32.1%) - are all
Southern European countries where weather conditions are mild enough to allow
riding throughout the year. This is also in line with the fact that Greece, Portugal
and Spain have the highest rates of PTW commuting (Figure 30). It should also be
noted that Greece has the highest percentage of scooters – a typical urban vehicle –
among the PTWs owned by respondents (Figure 22).
o Countries where riders use their PTW only during the summer - Norway (80.2%),
Denmark (73.0%), Sweden (70.4%) and Finland (69.1%) - are logically Nordic
countries where weather conditions make riding difficult outside summer.
Riding habits
Figure 32 Riding habits and group riding (EU dataset)
o The vast majority of riders in Europe generally ride alone (67.8%), while a tiny
minority rides in groups of over 10 riders (1.7%) (Figure 32).
o A country analysis further illustrates that group (>10) riding is more common in
Denmark where 6.6% of riders ride most of the time with many other
motorcyclists, followed by Belgium at 4.1%. For the other selected countries, this
proportion drops below 3%.

Deliverable 2 - Data Collection & Statistics 41
Figure 33 Riding and weather conditions (EU dataset)
o Not surprisingly, answers about riding in specific weather conditions were strongly
influenced by the respondent’s country.
o Riders have no problem riding in the rain in the Netherlands (65.1%), the United
Kingdom (62.2%) and Norway (61.5%). Conversely, 25.6% of riders in Italy,
Portugal (24.9%), in Czech Republic (24.5%) and Greece (24.5%) avoid riding in
the rain. This difference is certainly linked with a country’s rain frequency and
whether or not people are used to dealing with rain.
o Moreover, 68.7% of Greek riders and 62.1% of Portuguese riders have no problem
riding in wintry conditions and only 13.1% of Greeks and 16.3% of Portuguese try
to avoid it. By contrast, in Norway 87% of riders try to avoid riding in wintry
conditions, in Finland 86.7% of riders, in Denmark 84.9% of riders, and in Sweden
82% of riders. It is easy to see that this is linked to the fact that “wintry
conditions” in Southern European countries are less harsh for motorcyclists than in
the Nordics.
Accidents - Accident involvement
Figure 34 Have you been involved in an accident in any form during the last twelve months? (Merged answers) (EU
dataset)
o The vast majority of riders in Europe stated not having been involved in any kind
of accident in the twelve months preceding the survey (Figure 34);

Deliverable 2 - Data Collection & Statistics 42
o A national analysis of answers shows that there are regional patterns to be
considered (Figure 35 and Figure 36).
Figure 35 Have you been involved in an accident in any form during the last twelve months? (Merged answers)
(Answer per country)
Figure 36 Have you been involved in an accident in any form during the last twelve months? (Area of Europe)
Number of accidents (merged)
6,4%
6,8%
7,1%
8,4%
8,8%
8,9%
10,0%
10,1%
10,6%
11,0%
12,3%
12,8%
13,8%
14,0%
14,1%
16,8%
16,9%
0,0% 5,0% 10,0% 15,0% 20,0%
Denmark
Finland
Norway
Switzerland
Poland
Sweden
France
Netherlands
United Kingdom
Spain
Belgium
Germany
Czech Republic
Portugal
Italy
Austria
Greece
Have you been involved in an accident in any
form during the last twelve months?
Yes

Deliverable 2 - Data Collection & Statistics 43
Figure 37 Number of accidents during the last twelve months (EU dataset)
Accident type (merged)
Figure 38 Accident type (merged answers) (EU dataset)
To be noted: respondents were allowed to tick more than one answer (for example “tilting
standing still” is considered as a single accident; therefore, both cases could be ticked
without being inconsistent).
o Of the 12.4% of respondents stating they had had an accident in the last twelve
months, somewhat more than 10% declared having had more than one accident
(Figure 37).
o Crossing these results with the age of the respondents, we can conclude that young
riders are more involved in accidents that older ones. The two age groups more
involved in accidents are the under-25s and the 25-34 age group. In every country,
under-25s constitute the group most involved in accidents, except in Belgium, the
Netherlands and Spain. The record was held by Portugal where 43.8% of under-25
riders had been involved in an accident during the last 12 months, followed by the
United Kingdom (43.5%) and Switzerland (37.5%). The lowest numbers were for
Belgium (16.7%), the Netherlands (12.5%) and Spain (10%), countries in which
the 25-34 age group had a higher percentage of riders involved in an accident
(22.9% for Belgium, 18.5% for the Netherlands and 18.4 for Spain).

Deliverable 2 - Data Collection & Statistics 44
o In almost every country, the most common type of accident stated was a collision
with another vehicle (54.9%), followed by a single accident (29%). Finland was
the exception, with the order being reversed: of the 109 accidents declared (during
the twelve last months), 44% were single accidents and 33.9% involved a collision
with another vehicle.
o Greece in turn had the highest rate of collisions with another vehicle (72.8%).
o The highest rates of collisions with road infrastructure are to be found in Finland
(19.3%), Spain (12.3%) and Belgium (11.8%). By contrast, Danish riders declared
no accidents with road infrastructure.
Guilty part (merged)
Figure 39 Guilty part (merged answers) (EU dataset)
o The EU sample of those having been involved in an accident in the last twelve
months comes up with the other road user as being responsible for the accident
(45.4%), followed by own fault (34.1%) (Figure 21). 63.8% of accidents resulted
in some form of physical harm with or without hospital treatment (Figure 22).
Figure 40 Consequences of the accidents (merged answers) (EU dataset)
o A comparison of national answers showed that the party responsible for the
accident is the other road user in Greece, Belgium, France, the Czech Republic, the
United Kingdom, Italy, Spain, Denmark, Portugal and the Netherlands; while in
Norway, Germany, Finland, Sweden and Switzerland it is the rider himself (Figure
41).

Deliverable 2 - Data Collection & Statistics 45
Figure 41 Party responsible for the accident per country (answer per countries)
Near-misses
Figure 42 Have you experienced a near collision (that did not result in an accident) in the last 12 months, due to
another driver's error? (EU dataset)
o When asked about near-misses, 27.9% of the EU sample stated not having
experienced a near collision (Figure 42). All others stated having had at least one,
due in the vast majority of cases (94,4%) to another driver’s error) (Figure 43).
0,00% 20,00% 40,00% 60,00% 80,00%
Greece
Belgium
France
Czech Republic
United Kingdom
Italy
Spain
Denmark
Portugal
Netherlands
Norway
Germany
Finland
Sweden
Switzerland
You
Other road user

Deliverable 2 - Data Collection & Statistics 46
Figure 43 What was the (most frequent) causation factor(s) of your near-miss accident(s)? (Merged answers) (EU
dataset).
o The issue of infrastructure is particularly striking in Greece, Spain, Belgium, Italy
and France were infrastructure problems were the causation factor in more than
30% of the near-missed accident experienced by our respondents (Figure 25).
Greece 40.9%
Spain 38.6%
Belgium 37.7%
Italy 36.9%
France 36.5%
Finland 28.4%
Czech Republic 21.5%
Sweden 18.3%
Switzerland 17.6%
Portugal 15.7%
Germany 13.8%
Norway 12.9%
Netherlands 11.7%
UK 8.9%
Denmark 6.2%
Figure 44 Rate of infrastructure problems in causing near-miss accidents (answer per country)
Intelligent Transport System for PTWs User Survey (Annex 3)
The RIDERSCAN ITS survey aimed to capture the attitude of riders towards safety systems
at large. More specifically, the objectives of the survey included the identification of:
rider subgroups with different attitudes towards safety and safety systems/devices;
systems/devices evaluation by riders;
national differences within Europe with reference to an average European sample.
The survey was available for a period of 3 months in the following national languages:
Bulgarian, Czech, Danish, Dutch, English, Estonian, Finnish, French, German, Greek,
Hungarian, Italian, Lithuanian, Norwegian, Polish, Portuguese, Rumanian, Slovakian,

Deliverable 2 - Data Collection & Statistics 47
Slovenian, Spanish and Swedish. The survey was advertised in all European countries through
rider clubs and the national press.
The survey was composed of 2 parts: a first part segmenting riders according to their location,
riding profile and background, and their attitude towards safety and technology; the second
part offered a list of systems/functions (cf. 5.Classification of ITS Systems/Functions) for
which riders were asked to rate from 0 to 4 the estimated safety potential, whereby a rating of
0 clearly underlined the identified potential danger and the implicitly recommended not
pursuing such technology.
Riders profiles
On average, the European dataset (comprised of Belgium, Denmark, Finland, France,
Germany, Greece, Italy, Luxembourg, the Netherlands, Sweden and the United Kingdom -
duly corrected with park and accident rates) is mainly representative of riders 26 and older
and essentially male riders.
The majority of riders (65.3%) have more than 10 years of experience, and 89.1% more than 3
years, while annual mileage with PTW(s) is pretty uniform, being above 3000 km/year.
The results show a strong polarization of usage between commuting (i.e. going to
work/school/university) and leisure/hobby/sport/short rides (88.0% overall), to be correlated
with the main mean of transport: 66.1% of car users use their PTW for
leisure/hobby/sport/short rides, while 67.0% of respondents using a PTW as their preferred
means of transport are commuters (Figure 45).

Deliverable 2 - Data Collection & Statistics 48
Figure 45 Most often used means of transport vs PTW usage (European dataset) – data add up to 100% for the most
often used means of transport
Within the European dataset commuters and leisure riders (i.e. leisure/hobby/sport/short rides)
are differently represented at national level (Figure 46): Germany represents the country with
the highest percentage of leisure riders (almost 70%), while at the opposite end Greece has a
share of almost 70% of commuters and only 20% of leisure riders.

Deliverable 2 - Data Collection & Statistics 49
Figure 46 PTW usage by country (European dataset) – data add up to 100% for each country
2.3. Summary of accessible data on motorcycling and motorcycle
accidents in the EU
As part of the preliminary activities the project undertook to collect available mobility and
safety data on PTW use from accessible European or national databases &/or project work.
Figures on motorcycling and motorcycle accidents in the EU
Estimated numbers of PTWs on the roads in Europe in 2013
Mopeds Motorcycles Total PTWs
Austria 300 000 456 000 755 000
Belgium 200 000 451 000 651 000
Bulgaria
Croatia 96 000 58 000 155 000
Cyprus 40 000
Czech Republic 482 000 513 000 995 000
Denmark 48 000 150 000 198 000
Estonia 14 000 25 000 38 700
Finland 300 000 250 000 550 000
France (2012) 1 415 000 1 674 000 3 089 000
Germany 2 025 000 3 852 000 5 877 000
Greece 210 000 1 569 000 1 779 000
Hungary 157 000
Ireland (2012) 35 000

Deliverable 2 - Data Collection & Statistics 50
Italy 2 050 000 6 482 000 8 532 000
Latvia 19 000
Lithuania (2012) 21 000 44 000 64 000
Luxembourg 9 000 17 000 26 000
Malta 17 000
Netherlands 521 000 714 000 1 235 000
Norway 176 000 162 000 338 000
Poland 1 163 000 1 153 000 2 317 000
Portugal 277 000 231 000 508 000
Romania 102 000
Slovakia 74 000
Slovenia 41 000 52 000 93 000
Spain 2 107 000 2 891 000 4 998 000
Sweden 73 000 285 000 358 000
Switzerland 175 000 688 000 863 000
United Kingdom 111 000 1 109 000 1 219 000
Figure 47 PTW circulating park (Source: ACEM)
Road safety data: number of PTW riders killed in road accidents in 2012 in Europe
SafetyNET, followed by Dacota provide an overview of fatalities by transport mode in EU
countries
Moped
fatalities
Motorcycle
fatalities
PTW fatalities PTW rider
fatalities as
percentages of the
total number of
road accident
fatalities (2010)
Austria 19 68 87
Belgium
(2011)
20 127 147 15%
Bulgaria
Croatia 16 62 78
Cyprus 3 11 14
Czech
Republic
7 86 93 12%
Denmark 14 10 24 13 %
Estonia
(2009)
3 2 5 5 %
Finland 7 21 28 10 %
France 179 692 871 25 %
Germany 93 586 679 19 %
Greece 35 282 317 32 %
Hungary 25 39 64 9 %
Iceland
(2010)
1 13 %
Ireland 19 8 %

Deliverable 2 - Data Collection & Statistics 51
Italy 122 822 944 28 %
Latvia 3 7 10 6 %
Lithuania
Luxembourg 0 5 5 3%
Malta
(2010)
3 23 %
Netherlands 53 40 93 18 %
Norway
Poland 82 621 343 9 %
Portugal 57 104 161 18 %
Romania 99 62 161 7 %
Slovakia
(2010)
27 7 %
Slovenia 3 18 21
Spain 63 293 356 20 %
Sweden
(2010)
8 37 45 16 %
Switzerland
(2010)
4 68 72 22 %
United
Kingdom
12 320 332 21 %
Figure 48 PTW Fatality rates (CARE, 10.10.2014)
In-depth studies comparison (Annex 17)
The RIDERSCAN project team compared the outcomes of available in-depth analysis and
main accident causation factors collected2.
2 Austrian in-depth study: IDAF: KfV, Press release Motorrad: Hälfte der tödlichen Unfälle wegen nicht
angepasstem Tempo,
http://www.fema-online.eu/riderscan/IMG/pdf/in_depth_-_austria_-_idaf.pdf
French in-depth study: INRETS and LAB, Rapport de synthèse final du projet « 2RM » (R 7.2), Accidentologie,
Usage et Représentations des Deux-Roues Motorisés, August 2008
http://www.fema-online.eu/riderscan/IMG/pdf/in_depth_-_france_-_2rm_rapport.pdf
Norwegian in-depth study: Statens vegvesen, Special Analysis - Fatal Motorcycle Accidents 2005-2009,
November 2011
http://www.fema-online.eu/riderscan/IMG/pdf/norway_fatal_motorcycle_accidents_2005-2009_report.pdf
[Spain] Smart RRS project, D.2.1a – Report on revision of regulation UNE135900, http://www.transport-
research.info/Upload/Documents/201204/20120405_222142_80390_D_2_1a_version2.pdf
Swedish in-depth study: VTI, Skaderisker för motorcyklister, 2007
http://www.vti.se/en/publications/the-risk-of-injury-to-motorcyclists/
UK in-depth study: Department for Transport, In Depth Study of Motorcycle Accidents, November 2004
http://www.fema-online.eu/riderscan/IMG/pdf/dft_indepth_mc_accident_study.pdf
[Germany, Italy, the Netherlands and Spain] In-depth study: APROSYS, project, SP4, Motorcyclists: Accident
National Data, Deliverable AP-SP41-0001-C, 2005,
http://www.fema-online.eu/riderscan/IMG/pdf/74617874.pdf
European in-depth study: ACEM, MAIDS Final report 2.0, April 2009
http://www.maids-study.eu/
[Finland, France, Greece, Italy and The United Kingdom] In-depth study: 2-BE-SAFE project, CEESAR, D1:
Rider / Driver behaviours and road safety for PTW, 24/09/2010,
http://www.2besafe.eu/sites/default/files/deliverables/2BES_D1_RiderDriverBehavioursAndRoadSafetyForPT
W.pdf

Deliverable 2 - Data Collection & Statistics 52
Available national In-Depth studies
Austria Yes: IDAF
Within VRUITS
Belgium No
Bulgaria Not known
Czech Republic No
Denmark Not known
Estonia Not known
Finland Within 2-BE-SAFE
Within VRUITS
France Yes: 2RM Rapport
Within MAIDS
Within 2-BE-SAFE
Germany Within APROSYS
Within MAIDS
Greece Within 2-BE-SAFE
Hungary Not known
Ireland Partly: see RSA national strategy technical report
Italy Within APROSYS
Within MAIDS
Within 2-BE-SAFE
Latvia Not known
Lithuania Not known
Luxembourg No
Malta Not known
Netherland Within APROSYS
Within MAIDS
Norway Yes: Norway fatal motorcycle accidents 2005-2009 report
Poland Not known
Portugal Not known
Romania Not known
Slovakia Not known
Slovenia No
Spain Within APROSYS
Within MAIDS
[Austria, Finland, Spain, Sweden and the United Kingdom] In-depth study: VRUITS project, Deliverable 2.1
Technology potential of ITS addressing the needs of Vulnerable Road Users, Ongoing,
http://www.vruits.eu/themes/bamboo/deliverables/vruits_D21_v10_131219_draft.pdf

Deliverable 2 - Data Collection & Statistics 53
Within VRUITS
Sweden Yes: The risk of injury to motorcyclists
Within VRUITS
Switzerland Not known
UK Yes: In Depth Study of Motorcycle Accidents
Within 2-BE-SAFE
Within VRUITS
Figure 49 Overview of accident causation in-depth knowledge per EU country
Accident responsibility
In-depth studies from France, the UK and the MAIDS study supply evidence that in the
majority of cases the motorcyclist is not primarily responsible for an accident involving a
PTW and other parties.
The APROSYS in-depth study found that for Italy, the Netherlands and Spain, the most
common accident scenario for both mopeds and motorcycles inside or outside urban areas
involves a PTW colliding with a car. However accident responsibility is not indicated.
According to the MAIDS study, the primary contributing factors were misjudgements on the
part of PTW riders (37.1%) and the other vehicle driver (50.4%).
According to the VRUITS project, for Powered Two Wheelers, the most common scenario in
the CARE accident analysis was found to be the PTW being hit by a vehicle (mainly
passenger car) initially heading in the same direction and then turning across the path of the
PTW. This was not consistent with the national database analyses which suggest that the most
common scenario involves vehicles pulling out from intersections into the path of the PTW.
The French study states that 21% of PTW accidents are caused by a loss of control. In 79% of
the cases, the accident involved interaction with another vehicle. In 67.1% of accidents
involving a PTW and another vehicle, the motorcyclist was not primarily responsible for the
accident, but in 48.2% his behaviour had contributed to a deterioration of the situation. As
regards moped riders, they were responsible in 53.6% of the cases, and they had indirect
responsibility in 28.7% of the cases.
In the In-Depth Study of Motorcycle Accidents from the UK, we find that of the total cases,
38% involved right-of-way violations. However, less than 20% of these involved a
motorcyclist rated as either fully or partly to blame for the accident. The majority of
motorcycle right-of-way violation accidents were found to be primarily the fault of other
motorists.
According to the VRUITS project, for Powered Two Wheelers, the most common scenario in
the CARE accident analysis was found to be the PTW being hit by a vehicle (mainly
passenger car) initially heading in the same direction and then turning across the path of the
PTW. This was not consistent with the national database analyses which suggest that the most
common scenario involves vehicles pulling out from intersections into the path of the PTW.
Traffic scan errors

Deliverable 2 - Data Collection & Statistics 54
In cases where the riders were responsible for an accident with another party, in-depth studies
from Austria, France, Norway, the United Kingdom, as well as the MAIDS and 2-BE-SAFE
studies, found out that riders’ misjudgements of the traffic situation led to accidents.
The Austrian studies conclude that in half of the cases motorcyclists are responsible for fatal
their accidents, with misjudgements of traffic conditions, overconfidence and carelessness
resulting in fatal accidents.
In France, motorcycle accidents are often provoked by overconfidence on the part of riders,
leading them to misjudge a situation. As regards moped accidents, the main issue seems to be
the decision to execute a manoeuvre in contradiction to the road code.
One of the conclusions of the Norwegian analysis was that incorrect judgements (62%) are
more often the cause than inadequate machine control skills (47%) in case of fatal accidents.
The in-depth UK study showed that there are accidents specifically related to the way
motorcyclists are able to manoeuvre their vehicles in ways that are frequently not appreciated
by other motorists. Also, 5% of PTW accidents involve a rider filtering, possibly ‘subverting’
other drivers’ expectations of how traffic should behave.
The MAIDS study found out that in 27.7% of cases PTW riders and in 62.9% of cases other
vehicle drivers made a traffic-scan error which contributed to the accident; while 32.2% of
PTW riders and 40.6% of other vehicle drivers engaged in faulty traffic strategies.
For the 2-BE-SAFE study, moped accidents where the rider is responsible for the accident are
often due to an incorrect position of the rider on the road.
Perception failure by the other vehicle
Results from in-depth studies in France, Norway and the UK, as well as the MAIDS and 2-
BE-SAFE studies, show that a perception failure on the part of the other vehicle driver is a
decisive factor in accident with PTWs.
In France, when it comes to a car driver’s responsibility in an accident involving a PTW, a
perception failure on the part of the driver occurred in 60% of accidents (only 45% in the case
of car-car accident).
In Norway, 11% of the fatal accidents were triggered by cars failing to see the motorcyclist
when turning or entering on a road.
One conclusion of the UK in-depth study is that there is a particular problem surrounding
other road users’ perception of motorcycles, particularly at junctions. This is often the case
with older drivers.
According to MAIDS, in 36.6% of all cases the primary contributing factor was a perception
failure on the part of the other vehicle driver.
The 2-BE-SAFE study found out that, with regard to moped and motorcycle accidents, when
the rider is not responsible, the origin of the accident is often the failure of a car driver to see
the rider (he fails to look or he looks but does not see).

Deliverable 2 - Data Collection & Statistics 55
Riders’ lack of experience
Results from in-depth studies in Austria, Norway, Sweden and the United Kingdom, as well
as the 2-BE-SAFE study, show that a lot of PTW accidents are related to a rider’s lack of
experience.
In Austria, situations of inappropriate speed are particularly the case for fatal accidents
involving young and/or inexperienced motorcyclists.
In Norway, the rider did not have a licence in 25% of the fatal accidents where inadequate
skills were a triggering factor. Only 13% of the fatal accidents involved a motorcycle rider
with more than 10 years of experience, while in 50% of the fatal accidents the rider had less
than two years of experience. The study concludes that younger people are the most
vulnerable group when it comes to motorcycles and that most of those killed in a motorcycle
accident were under 34 years of age.
The main conclusions of the Swedish study are that the accident and injury risk is greatest for
young riders with limited experience. The risk is especially high if they ride a motorcycle of
very high engine power in relation to its weight.
In the United Kingdom, 11% of the motorcycle accident are rear-end shunts, and ‘at fault’
riders in shunt accidents tend to be younger, more inexperienced riders on smaller capacity
machines.
According to the 2-BE-SAFE study, this is particularly the case for moped accidents which
involve young and inexperienced riders. Moreover, Single motorcycle accidents involve users
who do not ride a lot each year.
Speed and extreme behaviour
The issues of speed and extreme behaviour were highlighted in studies from Austria and
Norway, as well as in the MAIDS and 2-BE-SAFE studies.
According to the Austrian study, speed plays a main role in motorcycle accidents: in a quarter
of the cases studied (fatal accidents), the local speed limit had been exceeded, and in 29% of
cases, speed was not adapted to the seasonal conditions.
In Norway, in 42% of the 153 fatal accidents, the motorcyclist showed normal behaviour
(observing current regulations), in 16%, he committed minor infractions (infractions, but no
high-risk behaviour), in 10%, he showed reprehensible behaviour (infractions and high-risk
behaviour), while extreme behaviour (driving without a licence, and/or driving under the
influence, and/or irresponsible and excessive speed and /or aggressive behaviour) was at the
origin of 33%. Excessive speed is also often associated with accidents where the rider is under
the influence of drugs or alcohol.
The MAIDS study states that a difference in speed compared to the surrounding traffic was
identified as a contributing factor for PTWs in 18.0% of all cases and a contributing factor for
the other vehicle in 4.8% of all cases.

Deliverable 2 - Data Collection & Statistics 56
According to the 2-BE-SAFE study, the main human functional failures for single motorcycle
accidents were a loss of control as a result of a steering problem or poor control of an external
disruption because of excessive or inappropriate speeds, risk taking, etc.
Road environment and infrastructure
The impact of the road environment and infrastructure was analysed in the in-depth study
from Norway and in the MAIDS study.
According to the Special Analysis from Norway, roads and the road environment were the
cause or a contributing factor in only 6% of the fatal accidents. Gravel or diesel spills on the
road are often the causes that are attributed to the road environment. But in 22% (34 out of
153 fatal accidents) of the cases, the road environment was a cause or contributing factor to an
increase in the scope of injury. In half of these fatal accidents, the victim had hit a crash
barrier post.
In MAIDS, we see out that the environment was considered to be the primary contributing
factor in 7.7% of all cases. In 4 cases, the design defect triggered the accident; in 7 cases the
design defect was the primary contributing factor causing the accident; in 19 cases the
roadway design defect was a contributing factor. In 34 cases (out of 921), the traffic hazard
contributed to the accident in some way: as its trigger (10 cases), as its primary contributing
factor (6 cases) or as a contributing factor (18 cases). Weather conditions were a contributing
factor or trigger in 7.4% of cases.
According to the smart RSS in-depth study of motorcycle accidents in Spain, in urban areas a
motorcycle hitting a tree or a post is an accident scenario with the higher fatality risk (17%),
while a collision with another vehicle represents a fatality risk of just 0.7%. In rural areas, the
accident scenarios with the higher fatality risk are a motorcycle hitting a tree or a post
(19.57%), hitting a safety barrier (11.5%), hitting a gutter or kerb (10.47%), and hitting a wall
or a building (9.43%). A collision with another vehicle represents a fatality risk of 6.9%.
Technical fault and vehicle failure
Finally, both the Norwegian study and MAIDS conclude that technical faults and vehicle
failure are rare. When occurring, they are often related to tyre issues.
The Norwegian study stated that technical faults were registered as a cause or contributing
factor in only 3% of the fatal accidents, often in association with worn tyres or incorrect air
pressure.
In MAIDS, 47 cases were reported where a PTW component failed or didn’t function
correctly and this component failure or lack of function contributed to the accident. And 72%
of these failures were related to the tyre or wheel.
PTW accident
causation
factors
MAI
DS*
2BE
SAF
E**
VRU
ITS*
**
AT
****
ES FR NO
****
SE
****
UK
OV driver
responsibilit
X X X

Deliverable 2 - Data Collection & Statistics 57
y
Traffic scan
errors
X X X X X X
Perception
failure by the
OV
X X X X X
Riders’ lack
of experience
X X X X X
Speed and
extreme
behaviour
X X X X
Road
environment
and
infrastructure
X X X
Technical
fault and
vehicle
failure
X X
Figure 50 Overview of PTW accident causation factors - In-depth studies comparison
* MAIDS = France, Germany, Italy, The Netherlands, Spain
** 2BESAFE = Finland, France, Greece, Italy, UK
*** VRUITS = Austria, Finland, Spain, Sweden, UK
**** For Austria, Norway and Sweden, only fatal PTW accidents were studied
As illustrated above, few countries undertook single national in-depth accident causation
studies aside from EU research projects. This is the case of Austria, France, Norway, UK, to
some extent Sweden and Ireland, all countries recognized for their progressive approach to
road safety.
The comparison of accident causation factors identified within the in-depth study reports,
illustrated in the table below, underlines the critical need to define/use common methodology
to guarantee that the public money spent is such expensive research activities is useful for
more than one research project. This also underlines the role played by EU funding in
expensive research activities.
2.4. Data harmonisation needs
This section studied data harmonization needs for PTWs crossing collected variables at
national levels with the CADaS protocol and the CARE database requirements.
CARE database and the CADaS protocol
CARE is a Community database on road accidents resulting in death or injury (no statistics on
damage - only accidents). The major difference between CARE and most other existing
international databases is the high level of disaggregation, i.e. CARE is made up of detailed
data on individual accidents as collected by the Member States. This structure allows for

Deliverable 2 - Data Collection & Statistics 58
maximum flexibility and potential with regard to analysing the information contained in the
system and opens up a whole set of new possibilities in the field of accident analysis.
The purpose of the CARE system is to provide a powerful tool which would make it possible
to identify and quantify road safety problems throughout Europe, evaluate the efficiency of
road safety measures, determine the relevance of Community actions and facilitate the
exchange of experience in this field.
The Council decided on 30 November 1993 to create a Community database on road
accidents (Council Decision 93/704/EC, OJ No L329 of 30.12.1993, pp. 63-65).
National data sets should be integrated into the CARE database in their original national
structure and definitions, with confidential data blanked out. The Commission provides a
framework of transformation rules allowing CARE to provide compatible data.
The CARE database currently contains 55 common road accident variables. However, it is
acknowledged that more variables and values are necessary to better describe and analyse
road accident phenomena at EU level.
Due to differences in the collected data variables and values, their definitions, differences in
the structure of accident report forms and the relevant data formats among the existing
national databases, both accident data quality and availability are affected. Consequently, lack
of accident data uniformity among and within EU countries hinders the exploitation of the
CARE potential and limits data analyses and comparisons at EU level.
From this perspective, the European Commission (Directorate General for Transport and
Mobility Road Safety, responsible for CARE) recommended that EU countries adopt the

Deliverable 2 - Data Collection & Statistics 59
CADaS (Common Accident Data Set) protocol as the format for making data available each
year.
The Common Accident Data Set (CADaS) consists of a minimum set of standardized data
elements, allowing comparable road accident data to be available in Europe. In this way, more
variables and values with a common definition will be added to those contained in the CARE
database, maximising the potential of the CARE database and allowing for more detailed and
reliable analyses at European level.
CADaS can be implemented on a voluntary basis in the national accident data collection
systems and will be gradually adopted by EU countries, with the result that increasing
amounts of common road accident data will be available from the various countries in a
uniform format.
Variables recommended by the CADaS protocol
The CADaS variables are divided into four basic categories: accident-related, road-related,
traffic unit (vehicle and pedestrian) related and person-related:

60
Overview of variables collected per country in public statistics on motorcycles
In the different national statistical reports, some variable are differs from a country to another, making impossible any comparison.
AU BE BG FI FR IE IT LV LU NL NO ES SE SZ UK
Age
Alcohol and/or drugs
Behaviour
Cause of death
Crossroads
Day of week
Degree of injury
Engine power
Focus on a particular age group
Frequency of use of PTW
Gender
Helmet use
Infrastructure
Junction type
Light condition
Location
Location of injuries
Months
Period
Responsibility
Ridden km
Road environment
Road surface condition
Speed limit
Technical faults
Time of day
Type of accident
Type of motorcycle
Type of occupants
Type of road
Use of PTW
Use of transport mode
Vehicle fleet
Weather condition

61
Data to be collected and harmonised: variables
The RIDERSCAN project identified potential variables to be harmonised in order to facilitate
pan-European comparisons.
Accident data
Age: the CADaS protocol recommends collecting the year of birth. But in the
national statistical reports publicly available, the age of victims is recorded via age
brackets which vary greatly from one country to another:
Recommendation: set harmonized age brackets for the EU.
Details about the variable
Austria 0-14; 15-19; 20-24; 25-29; 30-34; 35-39; 40-44: 45-49; 50-54; 55-59;
60-64; 65-69; 70-74; 75+
Belgium -18; 18-24; 25-34; 35-44; 45-54; 55-64; 65+
0-4; 5-9; 10-14; 15-19; 20-24; 25-29; 30-34; 35-39; 40-44; 45-49; 50-54;
55-59; 60-64; 65-69; 70-74; 74+
Bulgaria -6; 6-9; 10-14; 15-17; 18-20; 21-24; 25-64; 65+; total
Finland 0-14; 15-24; 25-34; 35-44; 45-54; 55-64; 65-74
0-5; 6-9; 10-14; 15-17; 18-20; 21-24; 25-34; 35-44; 45-54; 55-64; 65-74;
75+; total
France -18; 18-24; 25-34; 35-44; 45-64; 65+
0-14; 15-17; 18-24; 25-44; 45-64; 65+; Total
Ireland 0-5; 6-9; 10-14; 15-17; 18-30; 21-24; 25-34; 35-44; 45-54; 55-64; 65+;
unknown; total
Italy 1-13; 14-29; 30-45; 46-64; 65+; Unknown; Total
Latvia -6; 6-9; 10-14; 15-17; 18-20; 21-24; 25-34; 35-44; 45-54; 55-64; 64+;
Total
Luxembourg 7-14; 15-17; 18-24; 25-34; 35-44: 45-54; 55-64; 65+; unknown; total
0-14; 15-17; 18-24; 25-44: 45-64; 65+; unknown; total
Netherlands 0-5; 6-11; 12-14; 15-17; 18-19; 20-24; 25-29; 30-34: 35-39; 40-44; 45-
49; 50-54; 55-59; 60-64; 65-69; 70-74; 74-79; 80+
Norway 15-18; 18-19; 20-24; 24-34; 35-44; 45-54; 55-64; 65-74; 75+
Sweden 10-19; 20-29; 30-39; 40-49; 50-59; 60-69; 70+
Switzerland 0-6; 7-14; 15-17; 18-24; 25-44; 45-64; 65-74; 75+; Total
UK -16; 17; 18; 19; 20-24; 25-29; 30-39; 40-49; 50-59; 60+; age not
reported; total
Type of motorcycle: the CADaS protocol does not go into the details of the
vehicle except for the brand or model of the vehicle. Within national statistical
reports on accidents involving a motorcycle, some countries specify the
motorcycle type, though in a non-harmonised way.
Recommendation: harmonise the classification of the type of motorcycle.
Details about the variable
Norway Light motorcycle; R-bike; Street fighter; Off-road; Touring ; Custom
Sweden Standard; Touring; Supersport; Sporttouring; Custom; Off-road;
Scooter

62
Responsibility: the CADaS protocol does not recommend specifying who was
responsible for an accident. But it would be really useful to be able to compare the
share of responsibility in an accident between the different countries in Europe.
Recommendation: although usually useful, it is very difficult to define
responsibility. But in the case of this being possible, data on the
responsibility of different road users in an accident should be exchanged at
European level.
Details about the variable
France Total; Responsible; % of responsible
Luxembourg Cars; PTW
Norway Motorcyclist; Other party; Shared; Wildlife, etc.
Other mobility data
The CADaS protocol refers solely to accident data. However non-accident data such as
mobility data can be really useful when it comes to comparing motorcycle use in Europe.
Vehicle fleet: at present, it is possible to compare the number of powered two-
wheelers on the roads in the different countries of Europe. However, different
ways are used to measure the numbers.
Recommendation: establish a harmonised way of measuring vehicle
numbers.
Details about the variable
Austria Vehicle numbers; new registrations
France Registration of new motorcycles; Number of PTWs on 31 December;
Number of motorcycle licences
Italy Vehicle numbers
Frequency of PTW use: knowing the use frequency of PTWs would allow us to
understand the different types of motorcyclists that exist. Moreover, the ability to
compare such data at EU level would be very advantageous for understanding
fundamental differences in PTW use in the different countries of Europe.
Recommendation: establish common use frequency categories for Europe
and define other mobility variables
Details about the variable
Belgium 5 days a week; 1 to a few days a week; 1 to a few days a month; 1 to a few
days a year; never
France Every day or almost every day; 4-5 days a week; 1-3 days a week; Only on
weekends; Almost never; Total
Other variable Details
Belgium Use of transport mode % of use for each transport mode
France PTW use Commuting; professional use;

63
leisure/hobby/sport; long-distance travelling;
shopping; other
2.5. Data collection priorities
Collecting the views and information of the various stakeholders involved into the areas of
work covered by the project was part of the key activities to have a better understanding of
priority actions. This collection of feedback and information took several forms:
• a literature review from the main related policy documents: Annex 14
• a questionnaire (Amplifying Questions) designed to survey the different categories of
stakeholders directly involved into the policy making (Member States, the European
Union, the Motorcycling Community representatives, EU stakeholders). Answers to
the questionnaire were collected either from phone interviews, written answers, or
face-to-face meetings and are summed up in the Annex 4/ annex 5/ annex 6/ annex 7;
• inputs from project workshops: Annex 11 and annex 13.
Following this structured approach, the project team worked at identifying priority areas for
EU action according to the different stakeholders.
Stakeholders Safety Priorities – Data Collection and Statistics
With the objective of gaining a preliminary overview of the key safety aspects to be
considered in the PTW safety debate, and of the project safety areas in particular, the project
team undertook a detailed comparison of the PTW safety policies of key influencing
PTW/road safety stakeholders.
The table below summarizes the identified key safety aspects for each key influencing
stakeholder.
It should be noted that the documents were not written at the same time, meaning that some of
them are more up-to-date than others. For a complete overview of PTW safety policies and
reference details, please refer to Annex 14.
D2 – Data collection & statistics ETSC Lillehm. FEMA EC ACEM ITF
- Need for common statistical/crash
causation data collection
methodologies and variables at EU
level
Yes Yes
The Motorcycling Community (Annex 5, annex 14)
Following the analysis and comparison of the key stakeholders’ priorities, it was important to
collect the views of those closely involved and affected, i.e. the motorcycle industry and
national representatives from the riders’ community.

64
Industry representatives
At national level:
o Allow experts to investigate PTW accidents right after the event and on the
spot in order to better understand accident circumstances and causation
factors (FEBIAC Belgium)
o Collect more specific data on the L-category (BMW Germany, ANCMA
Italy)
o Improve the collection of vehicle fleet data (IVM and IfZ Germany, Ducati
Italy)
o Collect data on PTW mileage (Ducati Italy)
o Collect more detailed data on accidents involving PTWs (Kawasaki
Netherlands)
At EU level:
o Collect and exchange more specific data on the L-category (BMW
Germany)
o Have more consistent data collection standards to gain comparable data
across Europe (IVM and IfZ Germany, ANCMA Italy, Ducati Italy)
Riders’ representatives
At national level:
o Conduct more in-depth studies om a more regular basis (MAG Belgium,
Biker Union Germany)
o Improve the collection of vehicle fleet data (FFMC France)
o Make data more open and transparent (MAG Ireland)
o Improve accident statistics (MAG Netherlands)
o Take into account the expertise of the motorcycling community when it
comes to the collection and analysis of PTW data (NMCU Norway)
o Distinguish between non-licence holders and actual motorcyclists in
accident statistics (SMC Sweden)
o Have data collected more promptly (FMI Italy)
At EU level:
o Improve accident statistics comparability across the EU (MAG
Netherlands)
o Harmonise alcohol and drugs tests at EU level (SMC Sweden)

65
Member States (Annex 4, Annex 14)
Following the analysis and comparison of the key stakeholders’ priorities, it was deemed
important to collect the views of those working on safety policies at national level and
responsible for the overall safety of the national transport system, namely national road
authorities.
Depending of the country’s road safety management approach, road authorities could be
national research institutes, road safety and/or transport officers, all of them addressing PTW
matters in one way or another.
Exchange comparable data at EU level:
o Number of PTWs on the roads (MS Austria)
o Number of PTW accidents with personal injury (MS Austria, MS Netherlands)
o Number of PTW users killed by age (MS Austria)
o PTW mileage (MS Finland, MS Greece, MS Netherlands)
o Accident rates (MS Finland)
o Helmet wearing and safety equipment (MS Greece, MS Italy)
o PTW speeding (MS Greece)
o Alcohol and drugs use (MS Greece)
Exchange the results of in-depth studies between EU countries (MS Belgium, MS
Hungary, MS Netherlands)
Use the IRTAD database at EU level (MS Czech Republic)
Exchange non-statistical information between EU countries: on infrastructure,
roadside barriers, final position of the vehicle after an accident (MS Italy)
Exchange hospital data with injury diagnosis between EU countries (MS Sweden)
2.6. Other stakeholders’ feedback (Annex 6, Annex 11, Annex 13, Annex 14)
As part of the data collection and validation processes, the project organized 3 forums, and
discussed the deliverable outcomes with pan-EU stakeholders. The memorandums of the
workshops can be read in Annexes 11, 12 and 13. Below is a compilation of interesting
comments made by participants and/or speakers in relation to data collection activities.
Stakeholders workshops’ comments
The RIDERSCAN project held 3 stakeholder forums to discuss the various safety topics and
the information collected. The memoranda of the workshops can be read in Annexes 11, 12
and 13. Below is a compilation of interesting comments made by participants and/or speakers
in relation to data collection activities.

66
Accident data:
o When collecting data you always have to keep in mind what questions are
relevant. Data as such won’t give you any information at all. For example,
someone might be 40 years old and
riding a 750 cc motorcycle on a sunny
day. This data is not valid for
anything. The question is whether he
is able to ride such a motorcycle in
these circumstances.
o The issue of single-vehicle accidents
often appears. In France they account
for 35% of motorcycle accidents, and
the authorities were using this statistic to say that one-third of motorcycle
accidents were caused by the motorcyclists themselves. Then we asked for the car
figures, and it turned out that 45% of all car accidents were single-vehicle
accidents.
Injury data:
o In the UK we have never been able to match up hospital data with accident data.
For example, it’s difficult to compare the severity of an injury as classified by the
police to that classified by the medical team.
o In Sweden from 1 January 2015, all hospitals report injuries from traffic accidents.
It’s been a law for the police forces for 10-15 years but they are not medically
trained. Now we can get the correct information from the hospital.
o The Commission expects Member States to provide data on the severity of
accidents according to the MAIS scale. Regarding some previous comments, I
don’t see the need to harmonize everything to the smallest detail, but there is a
need for harmonized EU data to inform legislative decisions taken by the Council
and Parliament.
Exposure and mobility data:
o The Commission agrees that in Europe we need mobility data and some of it is
being provided by Member States, although ongoing work is needed to improve
procedures. But according to the European Commission, there is no need to come
up with a standard, to oblige Member States to apply a certain methodology. As
we move forward with the CARE database, we can also move forward with these
aspects too.
o In Germany, there is no data on mobility. We don’t really know how many km
riders travel per year.
When we look at the data we should do this in a similar way throughout Europe. In

67
Sweden, extreme motorcycling means speeding, riding without a licence, and riding with
stolen bikes. Nearly 60% of fatalities are caused by this extreme behaviour. In the
Netherlands the use of alcohol is totally different to Sweden. Also when it comes to
extreme speeding we see an experience gap, which means that new riders have to be
trained in a different way. Today we train them to be ‘circus artists’ on the parking lot but
don’t train them in dangerous situations on public roads. We have created a tremendous
training facility dedicated to this type of rider, and in the last two years have increased the
number of road racers in the sport by 20% because we have taken them off the roads and
put them into motorcycling sport. Strong riders’ federations are important because they
are the ones who have to conduct this training.
According to the Dutch Ministry of Infrastructure and the Environment, in an ideal world,
data should always be available, and as policymakers we try to make evidence-based
policies. We see practical problems. We are putting 4 million euros a year into data
acquisition for road safety purposes, but still face the fact that hospitals’ primary role is to
cure people and not to fill out a form. So it’s difficult to get the data. Also, the numbers
are too small. We had 50 riders killed last year. For policy issues these numbers are too
small to base a policy on. So we are looking at in-depth studies, educated guesses by real
experts, and studies on types of accidents that we think are very typical motorcycle
accidents. And we need PTWs in the cities to keep the cities available to people, so are
trying to focus on the positive aspects of motorcycling. We are also including data on
congestion, pollution and economics which might be useful to stimulate the use of PTWs
in cities. And we can already look for safer vehicles and implement better training without
waiting for the data.
Pan-EU stakeholders feedback
The RIDERSCAN project also collected the views of pan-European stakeholders whose
work relates to the safety area covered.
• iGLAD
IGLAD is a consortium where data from different countries/projects is recoded
according to a harmonised data scheme and shared between members. The only
way to have access to the data is to become a member.
The data includes all kind of vehicle accidents with at least one injured person.
This means that motorcycle accidents are included. Within iGLAD, information is
available on motorcycles but there is no specific section thereon. In the dataset
already available, there are 285 PTW records and 54 trike records.
Each organisation collects the data using their own methodology, with the data
then being merged. There is no link between the CARE database and iGLAD.
There has not yet been any analysis on priority actions and statistical needs. But
according to Li Hagström, a harmonised PTW accident report would be a good
way to proceed.

68
• BAST-FERSI
There is clearly room for improvement when it comes to data collection and data
exchange:
o Need to exchange more data
o Need of a harmonised data collection strategy as a basis for data exchange.
But this is currently difficult at EU level as CARE is quite recent.
o The user perspective should be taken into account
o Huge need to improve accident reports. For example, in Germany, with the
introduction of eBikes, there was a need to gain objective information on
accidents involving them. This took 4 years to achieve.
o The CADAS protocol could be contain more PTW data, but it needs to be
pre-formulated by someone from CARE.
• European Commission
About police accident reports: the police fill a report, which is more or less the
same throughout the EU. These reports provide a lot of information about accident
conditions, but not about accident causation. It would be interesting to have
distinct information collected on the road type (motorway, trunk road, secondary
road or urban area); to have more information on accident conditions; and on
social and societal factors (traffic, mileage, usage data and weather conditions).
Certain other data cannot be exchanged at EU level due to data protection
legislation.
About CARE: Member States are free to use or not use the CADAS structure.
Generally speaking, national police accidents reports have adopted more or less the
same structure. And it’s up to the European Commission to organise the
information gathered in a homogeneous way to allow comparison.
One solution for fatal accidents would be to have in-depth reports with much more
information collected to be able to establish accident causation. But it is expensive
and difficult to make them mandatory.
A good point would be also to cross information about injuries (following the AIS
structure) with hospital data.

69
2.7. Data collection key challenges
As highlighted by DACOTA, aggregate road safety data concern road accident data, risk
exposure data and road safety performance indicators, but also causation indicators (as
those resulting from in-depth data) and health indicators (as those resulting from
epidemiological data). These indicators, combined with additional information on other
important road safety aspects such as those related to behavioural, social and political aspects,
enable work on an integrated approach.
Supporting road safety decision-making requires having quantitative information on road
users' attitudes and behaviour, on road safety measures implemented, rules and
programmes (including enforcement), and on their social costs and benefits.
As regards PTW use and safety aspects,
None of these data and other statistical elements have yet been properly designed and
accepted at international level to enable proper benchmarking between countries.
Since the first pan-European in-depth study on PTW accidents (MAIDS, 2004), data
collection has expanded and several countries have undertaken in-depth studies to gain
a better understanding of PTW accident causation factors. However, often due to the
lack of exposure data and methodological differences, the information collected is
difficult to use for policymaking and further research.
The analysis of fatality or injury numbers, though indicative of trends, is not
sufficient to understand accident causation factors and relative risk levels.
Collecting and analysing reliable exposure data is indispensable.
In 2002, the OECD Road Transport Research Programme developed a common methodology
to collect on-the-scene detailed data from motorcycle accidents. Unfortunately, as underlined
by numerous research projects investigating EU and national accident databases, in-depth data
collection methodologies still widely vary from one country to another.
The private iGLAD initiative is an interesting way forward to be considered. IRTAD work is
of course to be included in the overall effort to guarantee a sustainable approach to data
collection in the field of road safety.

70
3. Deliverable conclusions
In 2015, the OECD/ITF Motorcycle safety report3 (to be published) further highlights the
need to develop and apply relevant methods, tools and indicators to measure PTWs in traffic
flows and analyse their mobility and behaviour (exposure data), completing this
recommendation with the statement that more in-depth investigations will allow a better
understanding of fatal and serious injury crash patterns and causes.
Aware of the need for more reliable data in general, the European Commission has already
financed several projects and taken the initiative to address this issue, but projects are not
enough and there is a major need to encourage Member States to join the effort. To this end,
the mid-term review of the EC Communication on Road Safety 2011-2020 is an opportunity
to work at:
harmonising data collection methodologies
engaging in naturalistic riding studies, to collect information on exposure and users'
attitudes and behaviour, road safety measures implemented, rules and
programmes, and their social costs and benefits
3 IMPROVED SAFETY FOR MOTORCYCLES, SCOOTERS AND MOPEDS © OECD 2014 (to be published)