Data Centre Energy Efficiency Product Profile - Energy … · Data Centre Energy Efficiency ......
28
pitt&sherry Ref: DV08404d001 Rep 31P Rev 04/PLJ/tn Data Centre Energy Efficiency Report No 2009/05 Product Profile Prepared for Equipment Energy Efficiency Committee (E3) April 2009 Prepared by: Peter Johnson and Tony Marker
Transcript of Data Centre Energy Efficiency Product Profile - Energy … · Data Centre Energy Efficiency ......

pitt&sherry Ref: DV08404d001 Rep 31P Rev 04/PLJ/tn
Data Centre Energy Efficiency
Report No 2009/05
Product Profile
Prepared for Equipment Energy Efficiency Committee (E3)
April 2009 Prepared by: Peter Johnson and Tony Marker

pitt&sherry Ref: DV08404d001 Rep 31P Rev 04/PLJ/tn
Table of Contents 1. Scope .......................................................................................................1 2. Introduction ...............................................................................................1 3. Technical Background ...................................................................................3
3.1 What is a Data Centre? .........................................................................3 3.2 Data Centre Categories.........................................................................4 3.3 Data Centre Equipment.........................................................................5
4. Data Centre Energy Use.................................................................................7 4.1 Energy Efficiency Metrics for Data Centres .................................................8 4.2 Current Server Energy Efficiency Trends....................................................9 4.3 Building Energy Efficiency Trends .......................................................... 10
5. International Background............................................................................. 10 5.1 Data Centre Energy Consumption and Potential Growth ............................... 10 5.2 U.S. EPA Report to Congress on Server and Data Center Energy Efficiency......... 11 5.3 U.S. EPA ENERGY STAR® Program for Computer Servers Specification............... 14 5.4 ENERGY STAR Rating for Data Centres..................................................... 15 5.5 Energy Efficient Servers in Europe ......................................................... 16 5.6 European Code of Conduct for Energy Efficiency in Data Centres.................... 17
6. Australian Context ..................................................................................... 17 6.1 First Pass Estimates of Energy Consumption and Potential Efficiency Savings in Australia ................................................................................................. 17 6.2 Australian Government ICT Policy Context ............................................... 18
7. Summary of Data Centre Energy Efficiencies Issues ............................................. 19 8. Options for Australian Strategy Development..................................................... 21
8.1 Further Work on Australian Data Centre Energy Consumption, Growth and Potential Efficiency Savings .......................................................................... 21 8.2 Adoption of U.S. EPA ENERGY STAR Specifications...................................... 21 8.3 Incorporation of ENERGY STAR Data Centre Rating into the Green Lease Specification ............................................................................................ 22 8.4 Data Centre Facilities and Associated Equipment Energy Efficiency Regulation... 22
Appendix A Appendix B
European Code of Conduct for Energy Efficiency in Data Centres (Summary) References
© 2009 pitt&sherry This document is and shall remain the property of pitt&sherry. The document may only be used for the purposes for which it was commissioned and in accordance with the Terms of Engagement for the commission. Unauthorised use of this document in any form is prohibited.
Name Signature Date
Authorised by: Phil Harrington 7 April 2009
pitt&sherry Ref: DV08404d001 Rep 31P Rev 04/PLJ/tn 1
1. Scope The Australian Government Department of the Environment, Water, Heritage and the Arts (DEWHA) is currently implementing a strategy for energy efficiency of Information and Communication Technology (ICT) products. Significant progress has already been made in relation to personal computers (PCs), laptops and monitors and the next major sector to be considered in this strategy is data centres. This paper has been commissioned to explore the situation regarding energy efficiency of data centres in Australia, with particular consideration of the related ICT equipment, and to determine if sufficient evidence is available to support a more detailed study incorporating a regulatory impact statement on data centre energy efficiency. The paper provides a current snap-shot of the issues associated with energy efficiency in data centres. Section 3 outlines some technical background relating to data centres. Section 4 outlines data centre energy use and efficiency issues and provides an overview of the key concepts and terminology involved. Section 5 provides some international background including worldwide data centre energy consumption and growth trends and an outline of key initiatives underway in the U.S. and Europe. Section 6 provides an Australian context overview including some first pass (order of magnitude) estimates for energy consumption and potential efficiency savings along with discussion relating to government policy context. Section 7 provides a summary of the data centre energy efficiency issues covered and the conclusions that may be drawn. Finally, Section 8 outlines some potential options for consideration in the development of Australian data centre energy efficiency strategy in the context of overall ICT energy efficiency.
2. Introduction In the half century since computers emerged from research laboratories and began their march into the incredible range of applications found at the beginning of the 21st Century, the cost of energy to power them has never been a significant economic or environmental issue. In terms of the total cost of ownership (TCO), consisting of capital expenditure (capex) and operational expenditure (opex) over the economic life of computers, the energy cost of computers has not been a major concern. However, this situation is changing rapidly due to the co-incidence of a range of technical, economic and environmental considerations. With the increasing performance and power density of ICT equipment, heat dissipation has become a major determinant of availability and reliability and cooling costs can account for more than 30-40% of a data centre’s total energy demand. Secondly, with the proliferation of data centres with high energy densities, energy costs are becoming an important element of the TCO for the centre operators, as well as a major driver of network enhancement and reinforcement for the energy distribution and supply industry, particularly in urban centres. Finally, with an increasing focus on climate change globally and in Australia, there is recognition of the need to limit energy demand, while climate change mitigation measures such as emissions trading will further increase the cost of energy, providing an additional financial incentive to do so. As a result of all these factors, energy efficiency is starting to be recognized as a major determinant of data centre and ICT equipment design.
Kenneth Brill of the Uptime Institute has termed the current crisis facing data centres as the economic meltdown of Moore’s Law.1 Moore’s Law forecasts a doubling of the number of transistors on a chip every 18 months, and this means the power density increase in chips is causing an inevitable increase in heat which needs to be dissipated. In addition, the manufacturers are packing increasing numbers of chips into the same or smaller “footprints” within equipment.

pitt&sherry Ref: DV08404d001 Rep 31P Rev 04/PLJ/tn 2
The “economic meltdown” is a result of the increasing divergence between computing efficiency (smaller, faster, higher energy) and energy efficiency (no change to the laws of thermodynamics that govern cooling). Brill notes that the “economic meltdown” occurs when the costs of electricity and site infrastructure TCO greatly exceed the cost of the Information Technology (IT) equipment itself. A recent paper by Jonathon Koomey (Lawence Berkeley National Laboratory) has identified the wide range of studies on electrical power and energy consumption for IT equipment over the past 20 years – from PCs to data centres.2 Koomey himself has been a major contributor to such studies.3 Governments and industry recognised IT energy efficiency issues in 1992 with the release of the first ENERGY STAR specification for PCs, and all types of computers and computer peripherals now have ENERGY STAR specifications. The voluntary ENERGY STAR standard has become a de facto mandatory world minimum energy performance standard because the US Government will only purchase computer equipment that meets the ENERGY STAR specification.
The ENERGY STAR specification heralded the transition of computers from specialized equipment to business and consumer commodities. As for household refrigerators, the case for ICT equipment efficiency regulation – albeit on a voluntary basis – was based on the recognition that ICT purchasers failed to account for the externalities associated with their energy consumption in the absence of appropriate information, labeling or incentives. There is currently rapid growth in data centres worldwide, and the individual servers and related ICT equipment associated with data centres are becoming regarded as commodities. The incredible growth of the world’s dependence on computers and on-line services means that the growth of the demand for electricity by data centres, the cost of this electricity, and the environmental imperatives of climate change are driving industry and government interest in better efficiency practices and possible standards and regulation. The first real studies on data centre electricity use grew out of dubious claims about their electricity use in the USA, which was further exaggerated at the height of the Californian electricity crisis of 2001. Work by Koomey et al4 at the US DOE Lawrence Berkeley National Laboratory provided the snapshot of US office equipment used in 1999. This study followed earlier work published in 1995, just prior to the boom in the Internet. In 1999, office equipment demand amounted for 2.1 percent of total US retail electricity demand.
To put recent trends in data centre energy use in perspective, in 2006 in the U.S., servers alone in data centres used around 22.5TWh, or 0.6 percent of total electricity demand5. Total US data centre electricity use (including all IT and facilities equipment) was 56TWh, or 1.5 percent of total demand. By 2001, residential electricity demand by computers and peripherals had reached 23TWh6. In the US, the total electricity demand for data centres and home computers has reached the levels associated with home appliance commodities sold in the millions (refrigerators – 156TWh, TV – 33TWh in 2001), the energy performance of which is regulated or subject to ENERGY STAR labeling. PCs have joined refrigerators and TVs as commodities and volume servers used in data centres are now becoming regarded in the same way. As a result of the current growth in demand for data centre services, governments around the world are starting to implement initiatives to maximize the energy efficiency of data centres in order to reduce energy use (and cost), mitigate the resulting greenhouse gas emissions and minimize the resulting strain on electricity infrastructure.

pitt&sherry Ref: DV08404d001 Rep 31P Rev 04/PLJ/tn 3
3. Technical Background
3.1 What is a Data Centre? In general, data centres may be considered to be any dedicated facility (including complexes, buildings or rooms) whose primary function is to house computer servers and provide some form of data service. In the European Code of Conduct on Data Centres Energy Efficiency7, data centres are defined as including “all buildings, facilities and rooms which contain enterprise servers, server communication equipment, cooling equipment and power equipment, and provide some form of data service”. This encompasses large scale mission critical facilities down to small server rooms located in office buildings.
The United States (U.S.) Environmental Protection Agency (EPA) defines data centres as “facilities that primarily contain electronic equipment used for data processing (servers), data storage (storage equipment), and communication (network equipment)”8. With the convergence of voice and data services, the delineation of data centres and telecommunication facilities is becoming blurred. For example, the above definitions for data centres would exclude parts of telecommunication facilities whose primary function is to house telephone switches and exchange network equipment but may include rooms in such facilities dedicated to housing standard servers for processing Voice Over Internet Protocol (VOIP) applications. The classic data centre layout comprises multiple vertical racks of IT equipment (servers, storage devices and networking equipment) arranged in rows with aisles in between. A raised floor usually provides a common space underneath for cabling distribution to the rack equipment and/or for cooling air distribution. The IT equipment in a data centre generates a significant amount of heat and the physical environment needs to be carefully controlled within an acceptable temperature and humidity range. Cooling and air conditioning equipment are thus critical elements of a data centre. Reliability and availability of data centre services are critical performance criteria for most data centres and these criteria are often “guaranteed” in specific service level agreements. As a result, redundant equipment, Uninterruptiuble Power Supplies (UPS) and, in most cases, backup power generation are also critical elements of a typical data centre.
3.1.1 Data Centre Functions and Importance Data centres provide critical services across a number of sectors including; • Government (internal and external services) • Private sector (business systems and electronic trading) • Financial institutions • Internet and communication services • Media • Academic and research institutions • Emergency, health and safety services

pitt&sherry Ref: DV08404d001 Rep 31P Rev 04/PLJ/tn 4
The rapidly increasing demand for high performance computer and communications resources, on-line services and digital data storage and availability is driving major growth in data centre facilities. This rapid growth has seen the energy consumed by data centres approximately double over a five 5 year period in the U.S. and the underlying rate of growth in data centres is expected to continue for the next five years. Given the increasing demand for essential on-line data services, data centres clearly have a vital role in the modern world. The current high growth in data centres and the energy they consume has now brought energy efficiency considerations for these facilities into focus both from an energy cost and an energy sustainability point of view.
3.2 Data Centre Categories Data Centres are often categorised in terms of the required reliability of the services they provide. Based on information from the Uptime Institute, the U.S. Telecommunications Industry Association (TIA) references four reliability tiers for categorising Data Centres9. Tier 1 – Basic Tier 2 – Redundant Components Tier 3 – Concurrently Maintainable Tier 4 – Fault Tolerant As the reliability requirements increase from Tier 1 to Tier 4, so do the equipment and infrastructure redundancy requirements and this has implications for both the capital cost and energy demands of the facility. Data centres may also be categorized by size. This has traditionally been done on a floor area basis although the associated IT equipment densities also need to be considered. The U.S. EPA makes reference to the following Data Centre size classifications:
• Server Closet -: < 200 ft2 (18.6m2), 1-2 servers, no external storage, typically use a common office Heating, Ventilation and Air Conditioning (HVAC) system
• Server Room -: < 500 ft2 (46.4m2), a few to dozen(s) of servers, no external storage, typically use a common office HVAC system with additional cooling capacity via a split system. Note: Server closets are sometimes lumped in with Server Rooms in an “Entry Level Data Centre” category
• Localized Data Centre (Small) -: < 1000 ft2 (92.9m2), dozens to hundreds of servers, moderate external storage, dedicated HVAC system typically with a few in-room Computer Room Air Conditioner (CRAC) units with fixed speed fans.
• Mid-tier Data Centre (Medium) -: < 5000 ft2 (464.5m2), hundreds of servers, extensive external storage, typically use under floor air distribution and in room CRAC units with a central chilled water plant and central air handling units with variable speed fans.
• Enterprise Class Data Centre (Large) -: > 5000 ft2 (464.5m2), hundreds to thousands of servers, extensive external storage, typically utilize the most efficient cooling along with energy and airflow management systems.

pitt&sherry Ref: DV08404d001 Rep 31P Rev 04/PLJ/tn 5
3.3 Data Centre Equipment For energy use and efficiency considerations, the equipment associated with a data centre may be divided into two categories: 1. IT equipment 2. Facilities equipment
3.3.1 IT Equipment IT equipment encompasses all equipment involved with providing the primary data centre functions and may include • Servers • Storage devices • Networking equipment • Monitoring and control workstations In a data centre, the IT equipment responsible for the greatest energy consumption are the servers (typically servers account for more than 75% of the total IT equipment load). Servers are often split into three classes according to capability (and cost) as follows: • Volume servers • Mid-range servers • High-end servers One recent development in server configuration, the blade server, has given rise to extremely high server densities (and corresponding power consumption densities) in data centre equipment racks. A blade server consists of multiple compact single servers (or blades) each representing a separate volume server, installed in a single enclosure which provides common power, ancillary and connection services. The blade enclosure is installed in a standard rack and such configurations can potentially increase rack server densities from 42 to 128 servers per rack. A fully populated blade server rack could require up to 20-25kW of power to operate. With their increasing capabilities, the low end, volume servers (including blade server configurations) represent the largest growth sector in the server market. Behind servers, the next most significant IT equipment class in terms of energy consumption is storage devices (accounting for as much as 10-15% of the total IT equipment load in a data centre). Currently this equipment represents a relatively small consumer of energy in data centres compared to servers. However, rapidly increasing demands for data storage is driving the growth of storage device installation (in particular external Hard Disk Drive arrays) at as much as 3 to 4 times the growth rate of server installation (based on growth trend data referenced in 8). As a result, this class of equipment is expected to become a more significant consumer of energy in data centres in the future.
3.3.2 Facilities Equipment Facilities equipment encompasses the mechanical and electrical systems that are required to support the IT equipment and may include: • Power distribution equipment • Uninterruptible Power Supplies (UPS) • Standby generators • Cooling systems (chillers, fans, pumps etc.) • Computer Room Air Conditioner (CRAC) units (including their associated Close
Control Units, CCU)
pitt&sherry Ref: DV08404d001 Rep 31P Rev 04/PLJ/tn 6
• Lighting • Ancillary services In a data centre, the facilities equipment responsible for the greatest energy consumption is the cooling system and air-conditioning equipment and this can account for more than 30-40% of the total energy consumption of a data centre. In the electrical power delivery chain to IT equipment in a data centre, utility power (or standby generator power) is typically supplied via a distribution transformer, distribution switchgear and suitable bus bar and cabling systems. Some losses are experienced in this part of the supply chain however these are generally very minor compared to the energy consumption of other facilities equipment. Due to the required reliability of the services being provided by the IT equipment, the utility (or standby generator) electricity is fed to Uninterruptible Power Supply (UPS) systems which provide both power conditioning and battery backup functions in order to prevent the IT equipment from experiencing any power disruptions. UPS equipment includes power electronic modules which modify the incoming power typically with front end AC to DC conversion (with associated battery charging) and provision of the required conditioned AC power via DC to AC conversion. In the event of a power disruption, electrical energy is supplied from the batteries via the DC to AC inverter modules in the UPS equipment with no break or interruption seen by the IT equipment. Each power conversion stage within a UPS system has associated losses and the efficiency of such systems is an important consideration when addressing data centre energy efficiency. As UPS battery capacity is usually sized for short breaks in the utility supply, a standby generator is often installed to provide longer term backup power via the UPS system. Efficiencies associated with standby generator systems (including power monitoring and automatic changeover systems) are not a major consideration due to their low power standby status in normal operation. However, energy efficient data centres have lower total power demands and this can translate into a capital cost saving because a smaller back up generator is required (in addition to a reduction in the installed capacity of power distribution and UPS equipment). UPS power is distributed to the IT equipment in racks via Power Distribution Units (PDUs). With the increasing focus on energy use and energy efficiency, this PDU equipment is increasingly being fitted with power monitoring facilities. Lighting and other ancillary services such as fire detection systems, security systems and staff support equipment combine to make up the balance of the facilities equipment load. Lighting and these other ancillary services generally represent a small percentage of overall data centre energy consumption.
pitt&sherry Ref: DV08404d001 Rep 31P Rev 04/PLJ/tn 7
[
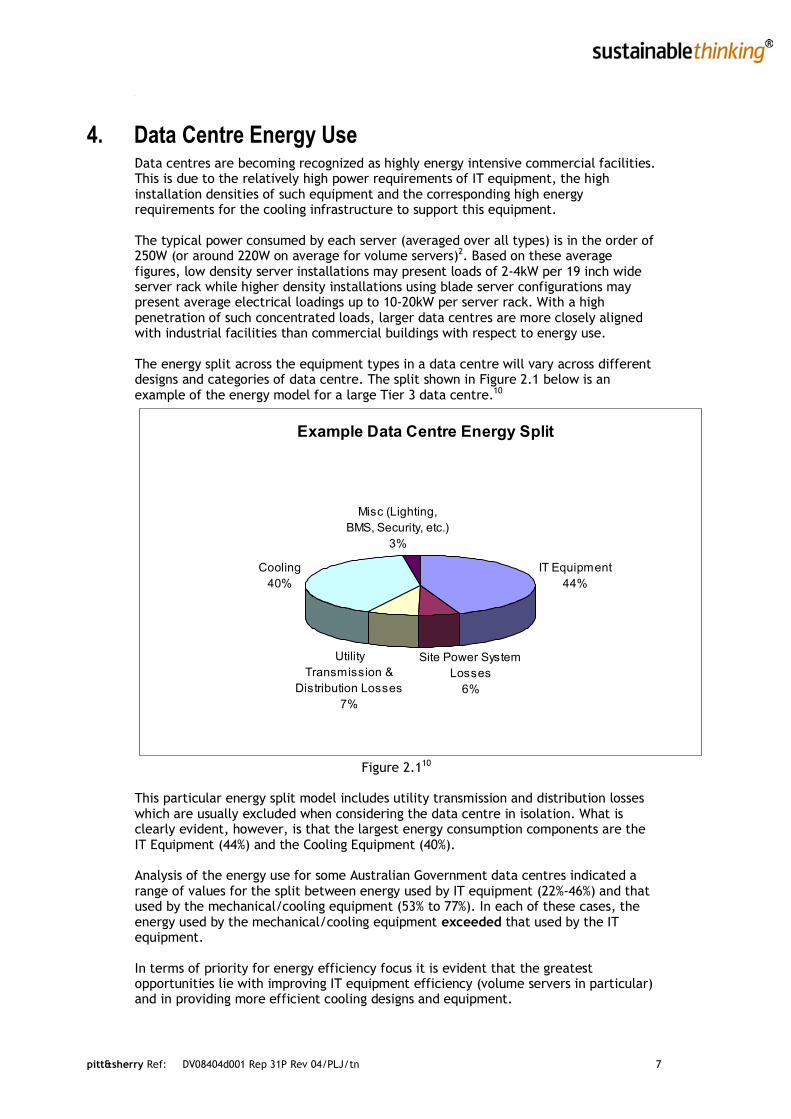
4. Data Centre Energy Use Data centres are becoming recognized as highly energy intensive commercial facilities. This is due to the relatively high power requirements of IT equipment, the high installation densities of such equipment and the corresponding high energy requirements for the cooling infrastructure to support this equipment. The typical power consumed by each server (averaged over all types) is in the order of 250W (or around 220W on average for volume servers)2. Based on these average figures, low density server installations may present loads of 2-4kW per 19 inch wide server rack while higher density installations using blade server configurations may present average electrical loadings up to 10-20kW per server rack. With a high penetration of such concentrated loads, larger data centres are more closely aligned with industrial facilities than commercial buildings with respect to energy use. The energy split across the equipment types in a data centre will vary across different designs and categories of data centre. The split shown in Figure 2.1 below is an example of the energy model for a large Tier 3 data centre.10
Example Data Centre Energy Split
IT Equipment44%
Site Power System Losses
6%
Utility Transmission &
Distribution Losses 7%
Cooling 40%
Misc (Lighting, BMS, Security, etc.)
3%
Figure 2.110
This particular energy split model includes utility transmission and distribution losses which are usually excluded when considering the data centre in isolation. What is clearly evident, however, is that the largest energy consumption components are the IT Equipment (44%) and the Cooling Equipment (40%). Analysis of the energy use for some Australian Government data centres indicated a range of values for the split between energy used by IT equipment (22%-46%) and that used by the mechanical/cooling equipment (53% to 77%). In each of these cases, the energy used by the mechanical/cooling equipment exceeded that used by the IT equipment. In terms of priority for energy efficiency focus it is evident that the greatest opportunities lie with improving IT equipment efficiency (volume servers in particular) and in providing more efficient cooling designs and equipment.

pitt&sherry Ref: DV08404d001 Rep 31P Rev 04/PLJ/tn 8
4.1 Energy Efficiency Metrics for Data Centres A variety of metrics are currently under consideration for quantifying and comparing efficiencies relevant to data centres. One of the more established overall infrastructure efficiency metric is the Power Usage Effectiveness (PUE) and, more recently, its reciprocal, the Data Centre infrastructure Efficiency (DCiE). These metrics, originally proposed by The Green Grid11, provide a measure for the overall efficiency of a data centre facility. The U.S. EPA is currently working to develop an ENERGY STAR Data Center Infrastructure Rating using PUE as an initial key metric (refer to Section 5.4 for details) The Power Usage Effectiveness (PUE) is defined as the ratio of the total power drawn by a data centre facility to the power used by the IT equipment in that facility.
i.e. PowerEquipmentITPowerFacilityTotalPUE....
=
The total facility power is the total power consumed by the data centre (typically as measured at the facility utility meter but may need to be measured at a sub-meter in mixed use buildings housing a data centre). This is the sum of the power consumed by the IT equipment and the facilities equipment as defined in section 2.3 above. The IT equipment power is the power drawn by the equipment used to manage, process, store or route data within the data centre (as defined in section 2.3.1 above). Measuring the IT power requires sub-metering of the rack distribution power and this is often incorporated in PDU equipment. The PUE has received broad industry adoption as an overall facility efficiency metric (the closer to 1 the better). Historically, data centre PUE figures of 2.4 to 3 (and higher) were not uncommon indicating that as much as twice the power consumed by the IT equipment was required for the supporting facilities equipment. One recent U.S. benchmarking study12 indicates that the current data centre benchmark is for a PUE of less than 2.0 and that under the alternative efficiency scenario assumptions proposed by the EPA it may be feasible to reduce this PUE Benchmark as follows; Improved Operations Scenario: PUE Benchmark = 1.7 Best Practice Scenario: PUE Benchmark = 1.3 State-of-the-art Scenario: PUE Benchmark = 1.2 An alternative to the PUE metric is the Data Centre Infrastructure Efficiency (DCiE) which is defined as follows;
%1001
%100....
xPUE
DCiE
or
xPowerFacilityTotalPowerEquipmentITDCiE
=
=
The DCiE is a more intuitive measure of the overall efficiency of a data centre. Expressed as a percentage, this metric is similar to traditional efficiency measures and indicates the percentage of the total energy drawn by a facility that is used by the IT equipment.

pitt&sherry Ref: DV08404d001 Rep 31P Rev 04/PLJ/tn 9
Similar metrics to the PUE are referenced in the literature to quantify the energy efficiency of the infrastructure part of a data centre. These include the Site Infrastructure Energy Efficiency Ratio, SI-EER proposed by Brill (2007) or the Site Infrastructure Energy Overhead Multiplier, SI-EOM (Uptime Institute). While the PUE is a metric that has historically been widely referenced in industry, the more intuitive DCiE has been adopted as the key metric for infrastructure efficiency in the European Code of Conduct on Data Centres Energy Efficiency and is expected to gain wider adoption in the future. There are a number of issues with how to measure, apply and compare these overall infrastructure efficiency metrics. Ambient temperature has an impact on the possible PUE (or DCiE) performance achievable due to the varying potential to utilise “free air” cooling. This also means that efficiency performance needs to averaged over the annual seasonal cycle. Also, neither PUE nor DCiE is strictly an indicator of energy efficiency, as both lack a reference to useful output (such as the work performed by the data centre). Reflecting this, other energy performance metrics are currently under development to provide standard productivity measures of how efficiently IT services are delivered at an equipment level and at an overall data centre level. Such future metrics may include: • An IT productivity metric to indicate how efficiently IT equipment provides useful
IT services (i.e. power consumed for a certain computing work load) • A total energy productivity metric relating useful IT services to the total energy
consumption of a data centre facility.
In the US, the Standard Performance Evaluation Corporation (SPEC) is developing standard specifications for evaluating power consumed by individual computer servers at different computing loads. A current example is the SPECpower-ssj2008™ benchmark which provides a specification for evaluation of the power and performance characteristics of volume server class computers using a Java workload. The aim of such specifications is to enable standard workload states (e.g. idle states and benchmark work loads) to be defined for testing the power consumption of a range of servers in order to assess their relative efficiencies.
4.2 Current Server Energy Efficiency Trends A number of key technology trends have been identified in the development of energy efficient servers. These energy efficient features include:
• Multiple core microprocessors. These contain multiple processing cores on a single integrated circuit die (chip). Operating at lower clock speeds and lower voltages, these multiple cores consume less energy but can handle more work in parallel than a comparable single core chip.
• Dynamic frequency and voltage scaling. This feature allows the microprocessor operating frequency and voltages to ramp up or down to match the required computational workload. Thus energy consumption (and heat generation) can be minimised when processor utilisation is low
• Virtualisation. The concept of virtualisation allows multiple virtual servers to be configured on a single physical server. This enables savings in energy (and physical equipment requirements) by replacing multiple physical servers which typically run at low utilization rates. Virtualisation is a current hot topic in the data centre sector with much debate regarding the predicted rate of implementation and the impact that this will have.
• High efficiency power supplies for server products
• On demand cooling using internal variable speed fans

pitt&sherry Ref: DV08404d001 Rep 31P Rev 04/PLJ/tn 10
4.3 Building Energy Efficiency Trends A further important trend is the progressive tightening of energy efficiency provisions relating to the buildings in which data centres are housed. First, Section J of the Building Code of Australia (BCA) sets out core efficiency requirements for different building types, and these requirements are currently being reviewed with the prospect of new provisions applying in the 2010 version of the BCA, and are likely to be progressively tightened over time. Second, voluntary building rating tools, such as GreenStar and NABERS, are becoming a central feature of the commercial building market. With data centres being a major energy load, the presence of a data centre in a building can significantly affect the overall building ratingi, in turn affecting the market value of the building. In the United States, the LEED rating tool recognises data centres as a separate building class (given their energy intensity). While there is the prospect that NABERS, GreenStar or other rating tools may offer this feature in Australia in the future, it is not currently the case. Finally, the Australian Government is currently consulting stakeholders with respect to the mandatory disclosure of commercial office energy efficiency, building on the voluntary initiatives already in place. This regime, which will use NABERS Energy as its core rating tool, will further enhance the market value of energy efficient (and penalise the market value of inefficient) commercial office buildings.
5. International Background
5.1 Data Centre Energy Consumption and Potential Growth A recent study on the worldwide use of electricity in data centres (Koomey, 2008)2, estimated that the electricity consumed by data centres (IT equipment and Facilities Equipment combined) was about 1% of the total world electricity consumption in 2005, equivalent (in capacity terms) to about seventeen 1000MW power plants. This study also estimated that the electricity used by data centres doubled over the five year period from 2000 to 2005 and that from 2005 to 2010, further growth of around 76% is expected. On a regional basis, the U.S. was the greatest consumer of electricity in data centres in 2005 accounting for around 37% of the world wide total followed by Europe at around 27% and the Asia Pacific region (excluding Japan) at around 13%. It was also noted that the Asia Pacific region (excluding Japan) experienced the greatest average annual growth rate of 23% from 2000 to 2005 (compared to the world average of 16.7%). In the U.S. EPA’s Report to Congress on Server and Data Center Energy Efficiency it was estimated that the electricity consumed by U.S. data centres was about 1.5% of the national electricity consumption in 2006. This is more than the electricity consumed by that nation’s colour televisions and similar to the consumption of about 5% of the nation’s building stock. In absolute terms, U.S. data centres were estimated to have consumed about 61 billion kWh of electricity in 2006 and presented a peak load of 7 GW. If current trends continue these figures could rise to more than 100 billion kWh of electricity and a demand of 12 GW in 2011.
i Under NABERS Energy, data centres that are primarily providing ‘external’ services (not for building occupants) will be excluded from the rating calculation, while ‘internal’ server rooms and facilities will be included.

pitt&sherry Ref: DV08404d001 Rep 31P Rev 04/PLJ/tn 11
The European Commission has estimated the Western European data centre electricity consumption at 56 billion kWh in 2007 (for servers, ICT equipment, cooling and power equipment), and forecast a potential increase to 104 billion kWh by 2020. The 2007 estimate is an upper limit based on PUE=3, whereas a lower limit is 37 billion kWh based on a PUE=2. IDC, global market analysts for ICT, estimated 35.9TWh in 2006 and 40.7TWh in 200713, noting that the 2007 electricity cost (€4.4billion) amounted to 40 percent of new hardware capital expenditure in Western Europe. From the estimates provided in such studies, the current energy consumption and potential for growth in data centre electricity demand can be seen to be significant. Consequently, both the U.S. EPA and the European Commission have recognized that the energy efficiency of data centres should be maximized to reduce energy use (and cost), mitigate the resulting greenhouse gas emissions and minimize the resulting strain on electricity infrastructure.
5.2 U.S. EPA Report to Congress on Server and Data Center Energy Efficiency In August, 2007, in response to a request from Congress stated in Public Law 109-431, the United States (U.S.) Environmental Protection Agency (EPA) published a Report to Congress on Server and Data Center Energy Efficiency. The scope of this report included; • Current trends in energy use and energy use and energy costs of data centres and
servers in the U.S. • An outline of existing and emerging opportunities for improved energy efficiency in
U.S data centres • Specific information on the costs of data centres to the U.S. federal government
and opportunities to reduce those costs through improved efficiency • Recommendations for pursuing energy efficiency opportunities broadly across the
U.S. through information and incentive programs. The report provides estimates of the anticipated energy use in U.S. data centers through to 2011. Two baseline scenarios are considered to estimate future data energy use in the absence of any expanded efficiency efforts. The first of these was a simple “historical trends” scenario which does not consider any of the current efficiency improvements that are expected to occur as a matter of course for IT equipment and site infrastructure systems. The second (and more appropriate) baseline consideration is the “current efficiency trends” scenario which predicts the future data centre energy use based on observed current efficiency trends including some limited implementation of the following measures: • Server virtualization (physical server reduction ratio of 1.04 to 1.08 by 2011) • Energy efficient server implementation (increasing from 5 to 15% of shipments by
2011) • Server Power management enabling (on 10% of applicable servers) • Energy use reductions in enterprise storage devices (anticipated 7% average drop
by 2011) The “current efficiency trends” scenario is probably the most realistic “business-as usual” baseline and is reflected in the current trends potential growth figures for the U.S. summarized in section 3.1 above. The report then considered the effect of three energy efficiency improvement scenarios (beyond the current trends baseline) in order to quantify the potential for improved energy savings in data centres. These alternative efficiency scenarios are summarized below: “Improved Operation” Scenario: • Current server consolidation trends and elimination of unused servers
pitt&sherry Ref: DV08404d001 Rep 31P Rev 04/PLJ/tn 12
• Modest level of adoption of “energy efficient” servers • 100% adoption of power management on applicable servers • Modest decline in energy use of enterprise storage • Improved airflow management (30% improvement in infrastructure energy
efficiency) “Best Practice” Scenario: All the “Improved Operation” scenario measures plus; • Moderate server consolidation • Aggressive adoption of energy efficient servers • Moderate storage consolidation • Improved power supply and distribution efficiencies, improved cooling equipment
efficiencies and increased use of free cooling to provide 70% improvement in infrastructure energy efficiency
“State-of-the-art” Scenario: All the “Best Practice” scenario measures plus; • Aggressive server consolidation • Aggressive storage consolidation • Enable power management at all applicable levels • Implementation of direct liquid cooling and combined heat and power applications
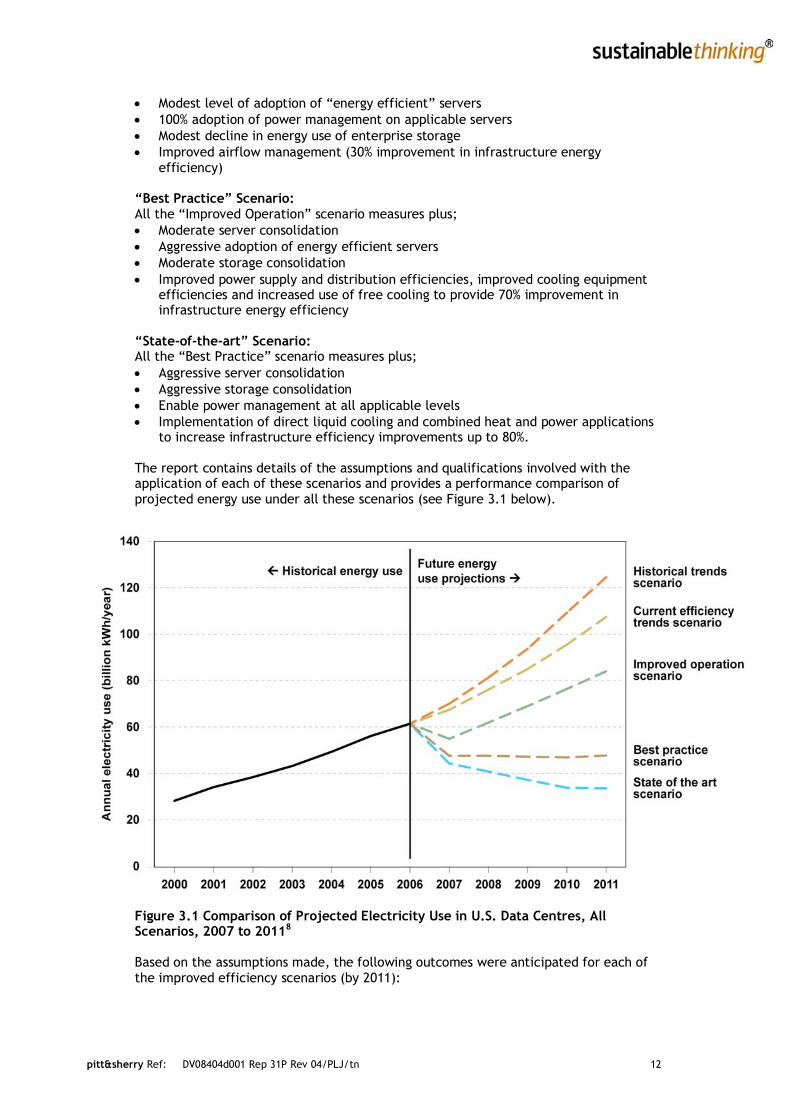
to increase infrastructure efficiency improvements up to 80%. The report contains details of the assumptions and qualifications involved with the application of each of these scenarios and provides a performance comparison of projected energy use under all these scenarios (see Figure 3.1 below). Figure 3.1 Comparison of Projected Electricity Use in U.S. Data Centres, All Scenarios, 2007 to 20118
Based on the assumptions made, the following outcomes were anticipated for each of the improved efficiency scenarios (by 2011):

pitt&sherry Ref: DV08404d001 Rep 31P Rev 04/PLJ/tn 13
• Improved Operation Scenario Savings: Up to 22% less electricity use in 2011 compared to current trends (and more than 20% cumulative savings over the five years 2007-2011) by using energy efficiency improvements requiring little or no capital investment (low cost, “low hanging fruit” opportunities).
• Best Practice Scenario Savings: Up to 56% less electricity use in 2011 compared
to current trends (45% cumulative savings over the five years 2007-2011) via more widespread adoption of the best practice technologies available today.
• State-of-the-art Scenario Savings: Up to 69% less electricity use in 2011
compared to current trends (up to 56% cumulative savings over the five years 2007-2011) by using only the most efficient technologies and best management practices available today (representing the maximum technical potential).
It is important to note that these anticipated efficiency gains appear to be possible without compromising product or data centre performance and they would be considered as a secondary attribute to the primary drivers of performance and availability in the design and operation of data centres. The report also considers the use of distributed generation (DG) technologies (including fuel cells) and combined heat and power (CHP) systems which use waste heat energy from power generation to provide data centre cooling. While some of these more established technologies may offer attractive payback periods and environmental benefits, the need for conservative design to ensure high reliability and availability of power and cooling in data centres means that such technologies need further proving before gaining widespread acceptance in the risk averse field of data centre design. Some of the barriers to adopting energy efficiency measures in U.S. data centres are highlighted and these include; • Lack of efficiency definitions (including standard measures of productivity and
suitable metrics) • Split incentives in that those responsible for purchasing and operating IT
equipment are often separated from those responsible for power and cooling infrastructure and paying the electricity bills.
• Risk aversion to adopting energy efficiency changes which have uncertain value and are (unjustifiably) perceived to have the potential to increase the risk of downtime
Some potential incentives and voluntary program measures to promote energy efficiency are discussed in the report including; • Product labeling (e.g. suitable ENERGY STAR programs) • Commercial building technical assistance programs • Financial incentives (e.g. from electricity utilities and government) • Government procurement (setting the standard, creating demand and raising
awareness) A list of specific near term recommendations is also made in the report including details on the following initiatives; • Standardized performance measurement in data centres - metric development for
IT equipment and facilities as a whole • Federal leadership - government agencies to lead the way and publicize results • Private sector challenge – encourage self evaluation and implementation of
improvements through the provision of suitable protocols and tools (e.g. suitable Department of Energy, DOE Save Energy Now energy efficiency assessments)
• Information availability on best practices – inform the industry on the effectiveness of energy efficiency measures and reduce the perception of the associated risk

pitt&sherry Ref: DV08404d001 Rep 31P Rev 04/PLJ/tn 14
• Research and Development – initiate programs to investigate new energy efficiency measures in the fields of computing software, IT hardware, power conversion, heat removal technologies, controls and management, etc.
• Public/private partnership – formulate a common initiative including public policies and private sector actions to promote and continue to develop energy efficiency in data centres
The conclusion to the report highlights that there are large opportunities for energy efficiency savings in U.S. data centres but these opportunities are not without barriers which will require suitable policy initiatives to overcome. However the outlook is encouraging as the industry is already very engaged with the issues and customers are already demanding solutions to reduce the growing energy use in data centres (primarily to reduce costs and overcome capacity limitations). Finally the important role the U.S. federal government has to play is highlighted both in providing objective, credible information and facilitating change by example in the way it designs and operates its own data centre facilities.
5.3 U.S. EPA ENERGY STAR® Program for Computer Servers Specification One priority identified in the U.S. EPA’s report to congress was the development of objective measurements of server energy performance. This priority has since been progressed and the U.S. EPA is currently developing an ENERGY STAR® program to identify energy efficient enterprise computer servers. The program requirements comprise Eligibility Criteria for qualifying server products along with general Partner Commitments (including labeling requirements). The current product specification for ENERGY STAR qualified Computer Servers (Version 1.0 DRAFT 3) identifies eligible products and the corresponding efficiency requirements to qualify as ENERGY STAR. Two phases of the specification are identified (Tiers 1 and 2) with Tier 1 to become effective form 1 February 2009 and Tier 2 becoming effective on 1 October 2010. The current specification includes proposed detailed Tier 1 requirements and a general reference to the future Tier 2 requirements which will be developed after the Tier 1 requirements are finalized. (Note that these Tier levels refer to progressive versions of ENERGY STAR product specifications and should not be confused with the reliability Tier classifications for data centres outlined in Section 3.2). Eligible products under the Tier 1 requirements are limited to Computer Servers with 1 to 4 processor sockets. A detailed definition (including required characteristics) of a qualifying computer server is provided in the specification. The following equipment types are specifically excluded for ENERGY STAR qualification under this specification; • Blade Systems (including Blade Chassis, Blade Servers and Blade Storage) • Network Equipment • Server Appliances • Storage Equipment Computer servers with more than 4 processor sockets will be considered for eligibility under the Tier 2 specification. Blade server systems present problems related to how idle power should be measured. Once a suitable benchmark is established, work will be undertaken to include Blade Systems under future versions of the Tier 1 specification. The Tier 1 requirements include minimum power supply efficiency requirements (a qualifying server must be packaged and sold with one or more AC-DC or DC-DC power supplies), maximum idle power requirements (using the SPECpower_ssj2008™ benchmark) and, standard information reporting, data measurement and output requirements.

pitt&sherry Ref: DV08404d001 Rep 31P Rev 04/PLJ/tn 15
The future Tier 2 requirements are expected to qualify products based on their consumption of energy for a given amount of work completed (i.e. based on an energy efficiency performance metric and suitable benchmark performance levels).
5.3.1 Implementation Timeline The proposed implementation sequence for the Computer Servers ENERGY STAR Program is as follows; 1. Specification Document with final Tier 1 requirements to be published with an
effective date of February 1, 2009 2. Manufacturers to qualify applicable products and label and promote as ENERGY
STAR from 2009 onwards. 3. EPA to commence developing the proposed Tier 2 requirements that are intended
to take effect on 1 October 2010. 4. Approval of the Tier 1 specification for use by EU member governments is
expected during 2009 5. On 1 October 2010 the EPA will sunset the Tier 1 specification and replace it with
the new Tier 2 criteria and performance levels. All existing ENERGY STAR qualified models will need to meet the new Tier 2 requirements or will no longer be ENERGY STAR qualified.
5.4 ENERGY STAR Rating for Data Centres In addition to the implementation of ENERGY STAR ratings for servers, the U.S. EPA is planning to introduce an ENERGY STAR rating for data centres themselves (ENERGY STAR Rating for Data Centre Infrastructure) from January 2010. To this end U.S. EPA is currently surveying a range of data centres to develop the necessary benchmarking data. The methodology will cover stand-alone data centres and those incorporated in other buildings, and will follow the usual ENERGY STAR building methodology that awards an ENERGY STAR rating to the top 25 percent of data centres in terms of energy efficiency. About 240 data centres have indicated preparedness to participate in the data collection phase, with all required data provided by 90 data centres, and partial data provided by 25 data centres. Data acquisition is ongoing, with data from at least 125 data centres required to develop a rating scale. The development of a draft rating tool is expected by mid-2009. The goal is to assess performance at a building level, and measure how the building performs, but not why. The overall data centre rating will complement the ENERGY STAR rating for the servers within the data centre. This approach is intended to provide a mechanism to identify data centres that use energy efficient servers and ensure their overall energy efficiency is high, particularly their approach to cooling. The initial source metric will be PUE (= Total Energy/IT Energy) which captures the impact of cooling and other support systems, but not IT energy efficiency. While industry is still developing more sophisticated metrics, this is the best available whole building metric at this time. The intent is to use the PUE with adjustment factors for operating constraints which are outside of operator control (e.g. local climate or required data centre Tier level) to calculate an ENERGY STAR rating on a 1-100 scale. The EPA contends that it is critical to start tracking and measuring energy consumption – measurement is essential for energy management. ENERGY STAR rates the whole building and must account for a mix of fuels – energy from external suppliers (e.g. electricity supply, chilled water) and on-site energy (e.g. natural gas, diesel). In order to provide a common energy metric, the primary and secondary energy must be calculated on the basis of primary energy inputs to account for conversion and distribution losses. This “source” energy approach is consistent with other EPA building ratings, provides a fair comparison between data centres with different fuel mixes, and allows clearer links with energy costs and emissions.

pitt&sherry Ref: DV08404d001 Rep 31P Rev 04/PLJ/tn 16
5.5 Energy Efficient Servers in Europe In 2007, a report on energy consumption and savings potential for energy efficient servers in Europe was published as part of a project conducted within the EU programme Intelligent Energy Europe14. The project’s central objective was to support market development for energy efficient servers and exploit energy and cost saving potentials. The study used market data from International Data Corporation (IDC) and the methodology followed the approach of Koomey used for the total energy consumption for the U.S. server market as referenced in the EPA’s report to Congress with some modifications. In this study, three market development scenarios were considered as follows; • “Business as usual” (similar to the “current efficiency trends” benchmark
scenario in the U.S. EPA report) • “Moderate efficiency” scenario – incorporating moderate degrees of
virtualization, implementation of energy efficient hardware and power management. The associated PUE improvement for this scenario ranged from 2.0 in 2007 to 1.7 in 2011.
• “Forced efficiency” scenario – incorporating higher degrees of virtualization, implementation of energy efficient hardware and power management. The associated PUE improvement for this scenario ranged from 2.0 in 2007 to 1.5 in 2011 (noting that highly efficient infrastructures will operate at PUE figures of 1.2-1.3 but this level will not be reached on average).
Detailed definitions of these scenarios and the underlying assumptions for the study are contained in the report. Results of the study included the following; • The volume server market segment accounted for 78% of the total server electric
power consumption in Europe and represents the fastest growing server market segment.
• In the business as usual scenario, electricity consumption of data centres in Western Europe would more than double from around 36.9TWh (36.9 billion kWh) in 2006 to around 77 TWh (77 billion kWh) in 2011.
• Under the moderate efficiency scenario, a 35% saving could be achieved in annual data centre energy usage in 2011.
• In the forced efficiency scenario, data centre electricity consumption could actually drop by 13.5% compared to the 2006 level which represents a 58% saving in 2011 compared to a business as usual approach.
• The savings estimated under the forced efficiency scenario would lead to annual electricity cost reduction of around €5.5 billion in 2011 and a total cumulative cost savings of €12.1 billion between 2008 and 2011.
When comparing the results with the various U.S. study efficiency scenarios, the report suggests good correlation in the overall savings predicted (22%, 56% and 69% savings in 2011 for the three U.S. efficiency scenarios compared to 35% and 58% for the two EU efficiency scenarios). It was noted however that the US and EU approaches differed significantly in the prediction of short term savings trends (i.e. for 2008-2009). The report suggested that this was due to very optimistic assumptions in the U.S. scenarios with respect to potential “quick wins” and correspondingly more conservative assumptions for the EU scenarios. Overall it was concluded that both the US and the EU scenarios suggest high energy savings may be achieved by 2011 if a mix of supportive measures is applied.
pitt&sherry Ref: DV08404d001 Rep 31P Rev 04/PLJ/tn 17
5.6 European Code of Conduct for Energy Efficiency in Data Centres In November 2008 the European Commission publicly launched a Code of Conduct on Data Centres Energy Efficiency (Version 1)15. More details of this voluntary program tailored to European conditions can be found in Appendix A. Such codes can play an important role in complementing regulatory approaches by facilitating a wider understanding of the range of factor involved in data centre energy efficiency and encouraging best practices.
6. Australian Context
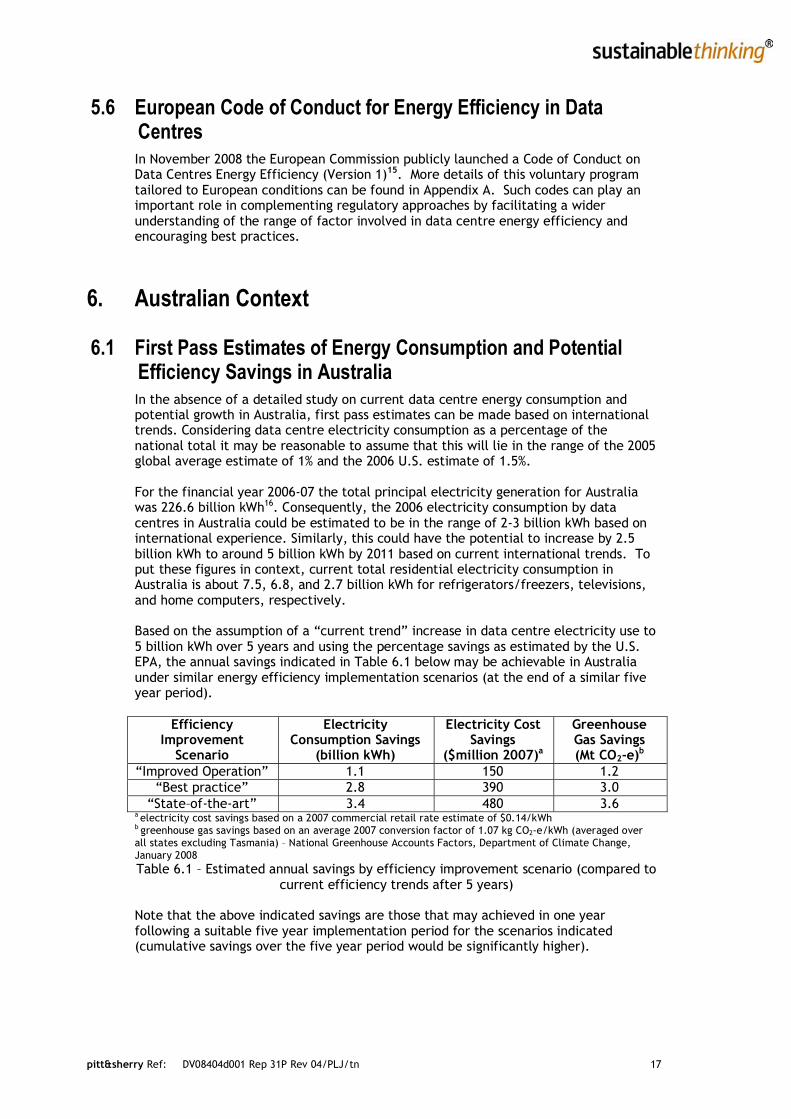
6.1 First Pass Estimates of Energy Consumption and Potential Efficiency Savings in Australia In the absence of a detailed study on current data centre energy consumption and potential growth in Australia, first pass estimates can be made based on international trends. Considering data centre electricity consumption as a percentage of the national total it may be reasonable to assume that this will lie in the range of the 2005 global average estimate of 1% and the 2006 U.S. estimate of 1.5%. For the financial year 2006-07 the total principal electricity generation for Australia was 226.6 billion kWh16. Consequently, the 2006 electricity consumption by data centres in Australia could be estimated to be in the range of 2-3 billion kWh based on international experience. Similarly, this could have the potential to increase by 2.5 billion kWh to around 5 billion kWh by 2011 based on current international trends. To put these figures in context, current total residential electricity consumption in Australia is about 7.5, 6.8, and 2.7 billion kWh for refrigerators/freezers, televisions, and home computers, respectively. Based on the assumption of a “current trend” increase in data centre electricity use to 5 billion kWh over 5 years and using the percentage savings as estimated by the U.S. EPA, the annual savings indicated in Table 6.1 below may be achievable in Australia under similar energy efficiency implementation scenarios (at the end of a similar five year period).
Efficiency
Improvement Scenario
Electricity Consumption Savings
(billion kWh)
Electricity Cost Savings
($million 2007)a
Greenhouse Gas Savings (Mt CO2-e)b
“Improved Operation” 1.1 150 1.2 “Best practice” 2.8 390 3.0
“State–of-the-art” 3.4 480 3.6 a electricity cost savings based on a 2007 commercial retail rate estimate of $0.14/kWh b greenhouse gas savings based on an average 2007 conversion factor of 1.07 kg CO2-e/kWh (averaged over all states excluding Tasmania) – National Greenhouse Accounts Factors, Department of Climate Change, January 2008 Table 6.1 – Estimated annual savings by efficiency improvement scenario (compared to
current efficiency trends after 5 years)
Note that the above indicated savings are those that may achieved in one year following a suitable five year implementation period for the scenarios indicated (cumulative savings over the five year period would be significantly higher).

pitt&sherry Ref: DV08404d001 Rep 31P Rev 04/PLJ/tn 18
The accuracy of such estimates is clearly dependent on the actual installed server base and projected growth rate for data centres in Australia. However, the above figures are indicative of the potential savings that may be achieved under the different energy efficiency scenarios in Australia. More accurate estimates can only be made via more accurate data on the current data centre energy consumption and potential growth in Australia, which can be obtained from industry surveys or through the purchase of market data analogous to studies previously conducted for the U.S., Europe and other international regions.
6.2 Australian Government ICT Policy Context In August 2008, Sir Peter Gershon published a Review of the Australian Government’s Use of Information and Communication Technology (ICT) for the Minister of Finance and Deregulation17. Within this review, a number of issues and recommendations are outlined regarding the Australian Government’s future data centre requirements. In particular, eighteen of the largest agencies based in the ACT have identified that they currently have 10m2 or less available floor space for data centre capacity growth and a significant number of agencies indicated that they would need significant new or upgraded data centre facilities over the next 10-15 years. Gershon noted the disconnect between the overall sustainability agenda and the ability to understand and manage energy costs and carbon emissions. Addressing this issue provides significant support for moves to address energy efficiency issues in data centres in Australia.
Two of the key recommendations of the Gershon Review are to; • Develop a whole-of-government approach for future data centre requirements over
the next 10-15 years. • Develop a whole-of-government ICT sustainability plan (in conjunction with the
Department of the Environment, Water Heritage and the Arts) to manage the energy costs and carbon footprint of the Government’s ICT activities.
In order to implement these recommendations, data centre energy efficiency issues and options will need to be well understood and a strategy for consideration and implementation of suitable efficiency measures will be required. The review notes that the Government will be under increasing pressure to articulate a viable strategy to make ICT environmentally sustainable. DEWHA is developing a national ICT energy efficiency strategy focused on personal computers, data centres and ICT peripherals. Minimum Energy Performance Standards (MEPS), based on ENERGY STAR V4.0 (computers) and V4.1 (monitors) standards will be introduced in October 2010 with the next priority area being data centres. This work will complement the wider response to Gershon on government ICT.

pitt&sherry Ref: DV08404d001 Rep 31P Rev 04/PLJ/tn 19
7. Summary of Data Centre Energy Efficiencies Issues Data centres represent an already large and rapidly growing energy consumption sector of the Australian economy, and are a significant source of CO2 emissions. The digital economy is growing at a faster pace than the overall economy and this will result in an increasing reliance of economic growth on the myriad of operations in data centres. Against this background, it will be necessary in a carbon-constrained future to deliver the services of data centres at the lowest economic and environmental cost. As already noted, the electricity consumption and emissions associated with data centres are already of the same order of magnitude as major appliance groups subject to minimum energy performance standards and labeling (and exceed those of other white goods subject to labeling). It is clear from activities in the US and Europe that significant technological scope exists to reduce data centre energy use and emissions, but that the Australian market has not realized these opportunities. While there is growing interest from manufacturers in competing on the basis of energy efficiency, the relatively small and fragmented Australian market has not adopted an approach based on reduced energy use. The introduction of emissions trading, expected electricity price increases, and increasing environmental commitments among market participants provides an opportunity for government to take a leading role in driving energy efficiency. COAG, at its October 2008 meeting, agreed to develop a National Strategy for Energy Efficiency, to accelerate energy efficiency efforts across all governments and to help households and businesses prepare for the introduction of the Commonwealth Government’s Carbon Pollution Reduction Scheme (CPRS). Activities by governments and the private sector in the US and Europe demonstrate that that there is very low risk to the Australian Government in partnering with these developments and delivering energy and economic savings through regulatory and non-regulatory mechanisms. The ENERGY STAR standards being set by the US EPA (under which the US Government purchases only ENERGY STAR compliant products) will deliver a global minimum energy performance standard for servers. All Australian Governments could support an appropriately timed introduction of such standards in Australia to assist industry to invest in products which deliver such savings. Moreover, such standards will avoid Australia becoming a dumping ground for poorer performing products. Australia sources most of its ICT products from manufacturers competing for US markets. Consequently, adoption of US standards would not act as a barrier to the latest technology. In addition, governments could complement technology standards for servers with support for data centre ENERGY STAR goals. Government leadership through investing in its own energy efficient data centres or requiring commercial data centre business partners to be energy efficient would deliver energy savings to the whole sector as it competes for government business. The ENERGY STAR benchmark for data centres could be used analogously to the Green Lease requirement that leased commercial buildings meet a 4.5 star NABERS Energy standard. It should be noted that Australia has a close relationship with US agencies in driving the global energy efficiency agenda. The recent change of government in the US and its expected greater commitment to addressing global warming mean that the opportunity to work with the US in a variety of forums should expand. Cooperation on data centre energy efficiency should lead to other opportunities to drive the energy efficiency agenda in Australia and internationally.

pitt&sherry Ref: DV08404d001 Rep 31P Rev 04/PLJ/tn 20
The conclusion to the U.S. EPA Report to Congress on Server and Data Center Energy Efficiency highlights that there are large opportunities for energy efficiency savings in U.S. data centres but these opportunities are not without barriers which will require suitable policy initiatives to overcome. However the outlook is encouraging as the industry is already engaged with the issues and customers are already demanding solutions to reduce the growing energy use in data centres (primarily to reduce costs and overcome capacity limitations). The important role the U.S. federal government has to play is highlighted in the conclusion to this report both in providing objective, credible information and facilitating change by example in the way it designs and operates its own data centre facilities. These conclusions appear to be equally relevant in the Australian context and provide a challenge for the implementation of similar federal government policies and initiatives. Considering the indicated energy consumption and projected growth of data centres in developed and developing countries worldwide along with the range of technical, economic and environmental drivers reviewed earlier in this paper, the need for a suitable Australian strategy to drive data centre energy efficiency is apparent. Australia is also well placed to act as an “early follower” in adopting suitable elements of the data centre energy efficiency initiatives currently being implemented both in the U.S. and Europe. In summary, considering both current international activities and the Australian context there is clear evidence to support further work on an Australian strategy for data centre energy efficiency including a regulatory impact analysis.

pitt&sherry Ref: DV08404d001 Rep 31P Rev 04/PLJ/tn 21
8. Options for Australian Strategy Development Some options for progressing a suitable Australian data centre energy efficiency strategy are discussed below.
8.1 Further Work on Australian Data Centre Energy Consumption, Growth and Potential Efficiency Savings While broad estimates can be made based on international experience, more accurate and relevant figures would be obtained from a suitable Australian study into current data centre energy consumption and potential growth. This could be along the lines of similar studies conducted for the U.S., European and other international regions. Such a study would typically utilize server market historical and forecast data for Australia sourced from an organization such as IDC and employ methodologies similar to those used in U.S. and/or European studies. It is likely that purchase of market data would be more cost effective than an industry survey, but dialogue with industry would be an essential element of such a study. The output from such a study would include; • estimates of historical and current data centre energy consumption in Australia • forecast estimates for data centre growth and energy consumption increases based
on assumptions for a “business as usual” approach • potential savings under one or more energy efficiency improvement scenarios for
Australia Such a study with economic modeling would explore all regulatory and non-regulatory options and be an essential component of a regulatory impact study ahead of any regulatory proposal. Should DEWHA wish to commission such a study, it is recommended that it be conducted by a suitable independent organization or institution and published as a peer reviewed paper, in order to provide credible public domain reference data.
8.2 Adoption of U.S. EPA ENERGY STAR Specifications The current U.S. EPA ENERGY STAR program for computer servers could provide a suitable reference for specifying energy efficient servers for any future voluntary or regulatory program in Australia. As noted previously, as the ENERGY STAR specification for ICT is effectively an entry level performance requirement for access the large US Government market, these specifications become the de facto global minimum energy performance standard for ICT equipment. Australia sources ICT equipment from manufacturers which seek to have their products identified as suitable for purchase by the US Government. Thus, use of this specification as a standard for Australia means the debate is about the timing of introduction rather technical feasibility or availability. The ENERGY STAR Tier 1 specification for computer servers (with 1 to 4 processor sockets) is due to be finalized by 1 February 2009. From 2009 the majority of applicable new server products developed would be expected to meet the ENERGY STAR Tier 1 standard. Consequently, this Tier 1 specification could be referenced in an initial voluntary program for efficient server purchasing as qualifying products become available. Blade server systems could also be included in such a voluntary program once they are included in the Tier 1 specification (timing to be confirmed).

pitt&sherry Ref: DV08404d001 Rep 31P Rev 04/PLJ/tn 22
8.2.1 Relevance of US Implementation Timeline to Australia Given the time frame for introduction of any regulatory program in Australia, it is expected that any future regulatory program for Computer Servers would be based on the future Tier 2 ENERGY STAR specification which is intended to take effect on 1 October 2010 (the details of which have not yet been finalized). There could be parallel development of a mandatory standard with a best practice voluntary program. Given lead times for industry consultation and development of the regulatory processes for mandatory minimum energy performance standards, it is suggested that that the Tier 2 mandatory standard be introduced in Australia in January 2012, some 15 months after its proposed introduction as the ENERGY STAR standard in the US. At future times, when further US ENERGY STAR specifications are introduced, they would also be introduced into Australia as mandatory standards with an appropriate lag. This approach could apply to future ENERGY STAR specifications on data centre storage devices and other data centre ICT equipment as well as future computer server specifications In the interim, the Tier 1 Computer Server specification would remain the basis of a voluntary program, which clearly foreshadowed future change. From October 2010, the voluntary program would allow the Tier 2 specification to be designated as ‘high efficiency’ until such time as Tier 2 was mandated as a minimum energy performance standard in Australia. Any future ‘Tier 3’ standard could then be designated as ‘high efficiency’ until such time as it became a mandatory standard. With such a structure Australia would be plugged into the global standard and industry would have clear expectations of ongoing regulatory change.
8.3 Incorporation of ENERGY STAR Data Centre Rating into the Green Lease Specification The development of an ENERGY STAR rating for data centres would provide a metric for incorporating data centres into the Commonwealth’s Green Lease program. This is a voluntary program, but provides a clear signal to the market that companies wishing to do data centre business with the Commonwealth need to focus on energy efficiency. Such a program could also be adopted by other governments and industry. This approach has some analogies with the European Code of Conduct on Data Centres Energy Efficiency. The details of an Australian data centre efficiency rating, while based on the US ENERGY STAR approach, may need adjustment to account for Australian factors.
8.4 Data Centre Facilities and Associated Equipment Energy Efficiency Regulation As identified in Section 4, the greatest opportunities for data centre energy efficiency improvement lie with improving IT equipment efficiency (volume servers in particular) and in providing more efficient cooling designs and equipment. The continued progression of minimum energy performance standards (MEPS) and associated regulation for equipment associated with data centre cooling (e.g. CCU/CRAC units and chillers) should thus be a priority. Consideration of building shell performance and overall data centre design issues should also be given high priority. Specific building energy issues for data centres could be addressed in the Building Code of Australia. This approach has an obvious link to incorporating a data centre energy standard in the Green Lease Scheme, and would lead naturally to developing minimum performance benchmarks for new or upgraded data centres in terms of accepted infrastructure efficiency metrics such PUE or DCiE.

pitt&sherry Ref: DV08404d001 Rep 31P Rev 04/PLJ/tn 23
Such measures would also require specification of suitable energy metering for data centres to enable monitoring and validation. Consideration could also be given to developing a data centre version of key Australian building rating tools, such as NABERS Energy or GreenStar, as noted in Section 4.3. Furthermore, once such tools are available, consideration could be given to the inclusion of data centres within mandatory disclosure requirements now being developed for both commercial and residential buildings in Australia. Applicable MEPS and associated regulation for other key data centre facility equipment, such as UPS systems could also be considered.
pitt&sherry Ref: DV08404d001 Rep 31P Rev 04/PLJ/tn 1
Appendix A - European Code of Conduct for Energy Efficiency in Data Centres (Summary) In November 2008, following a series of meetings over 2007 and 2008, the European Commission publicly launched a Code of Conduct on Data Centres Energy Efficiency (Version 1)i, first published in October 2008. The development involved the European Commission, officials from various European governments, and representatives of industry (both users and equipment vendors) with essentially the same cross-section as was involved in the US developments. A data centre industry speaker noted at the launch that the industry had been waiting for a ‘neutral’ benchmarking tool. The development of the code has been driven by CO2 reduction commitments, the rising energy use (and cost) in data centres and energy security issues. The European Code of Conduct is a voluntary program tailored to EU conditions which builds awareness and develops practical voluntary commitments to support effective decision making, reducing TCO and CO2 emissions. The code covers data centres of all sizes (server rooms to dedicated buildings) and has been designed to facilitate “self-benchmarking”, recognizing that many existing data centres were designed with large tolerances for change and expansion with outdated design practices and considerable redundancy to deliver higher levels of reliability. For these reasons there are significant energy inefficiencies in existing data centres, and sometimes confusing messages from industry on the best solutions for new data centres. The much higher energy densities in servers, the fact that energy costs tend to be higher in Europe than elsewhere, the presence (since 2005) of emissions trading schemes further raising energy prices in many European countries, and more stringent building and climate regulation, have all contributed to the focus on energy efficiency in European data centres. Equipment suppliers are competing for data centre business on the basis of energy efficiency, but a wide range of factors needs to be considered to deliver the lowest TCO. The code is designed to help all parties address energy efficiency by reducing confusion as well as addressing particular EU factors (e.g. climate, energy market regulation etc.). The code has both an equipment level and system level scope and will initially use the DCiE as the key metric in assessing infrastructure efficiency. The code is addressed primarily to Data Centre Owners and Operators who may become “Participants” and secondly to supply chain and service providers who may become “Endorsers” of the code. General commitments and monitoring obligations are outlined for both new and existing data centres. Specific guidelines as to the coverage and nature of the commitment to the code are also specified. For example, a Participant is expected to commit to having at least 40% of its data centre floor space (or 40% of its total number of servers) compliant within a given time frame and provide plans and monitoring documentation for assessment by the Code of Conduct Secretariat. Each Participant is also expected to make reasonable efforts to abide with the General Principals as detailed in Annex A of the code and summarized below; Participants of this Code of Conduct should endeavour and make all reasonable efforts to ensure: 1. Data centres are designed so as to minimise energy consumption whilst not impacting
business performance. 2. Data centre equipment is designed to allow the optimisation of energy efficiency while
meeting the operational or services targets anticipated. 3. Data centres are designed to allow regular and periodic energy monitoring. 4. Energy consumption of data centres is monitored; where data centres are part of larger
facilities or buildings, the monitoring of the specific data centre consumption may entail the use of additional energy and power metering equipment.

pitt&sherry Ref: DV08404d001 Rep 31P Rev 04/PLJ/tn 2
5. Data centres and their equipment are designed, specified and procured on the basis of optimising the Total Cost of Ownership(TCO) within the requirements for reliability, availability and serviceability.
6. When the Energy Star programme has set specification for servers and other IT equipment, these specifications should be followed by Participants when procuring equipment. For UPS the specifications of the European Code of Conduct on Energy Efficency and Quality of AC Uninterruptible Power Systems (UPS).
7. Data centres should be designed to minimise the energy used, if any, to remove heat from the facility.
In summary, this code appears to provide a sound framework for promoting energy efficiency in data centres while maintaining vendor and technology neutrality. It is well structured without being overly technical and provides both general and specific minimum commitments for voluntary participants.
pitt&sherry Ref: DV08404d001 Rep 31P Rev 04/PLJ/tn
Appendix B - References 1 Brill, K.G. 2007, The Invisible Crisis in the Data Centre: The Economic Meltdown of Moore’s
Law, Uptime Institute, www.uptimeinstitute.com 2 Koomey, J.G. 2008, Worldwide electricity used in data centres, Environ.Res. Lett. 3 (2008)
034008 3 http://www.koomey.com 4 http://www.lbl.gov/Science-Articles/Archive/net-energy-studies.html 5 http://www.eia.doe.gov/cneaf/electricity/epa/epa_sum.html 6 http://www.eia.doe.gov/emeu/reps/enduse/er01_us.html 7 Code of Conduct on Data Centres Energy Efficiency – Version 1.0, 30 October 2008, European
Commission Directorate-General Joint Research Centre 8 Report to Congress on Server and Data Centre Energy Efficiency – Public Law109-431, U.S
Environmental Protection Agency, ENERGY STAR Program, August 2, 2007 9 TIA-942 Data Center Standards Overview 10 Pointon, D, 2008, Cogeneration Demystified, Data Centre Dynamics ANZ 2008 11 The Green Grid Data Center Power efficiency Metrics: PUE and DCiE, White Paper, The green
Grid, 2007 12 Data Centre Energy Forecast Final Report, July 29, 2008, Silicon Valley Leadership Group 13 http://www.idc.com/getdoc.jsp?containerId=GE06Q 14 Schäppi, B. et al “Energy efficient servers in Europe Part I: Energy consumption and savings
potentials”, The Efficient Servers Consortium, October 2007 15 http://re.jrc.ec.europa.eu/energyefficiency/ 16 http://www.esaa.com.au/the_energy_industry:_facts_in_brief.html 17 Gershon, P., Review of the Australian Government’s Use of Information and Communication
Technology, August 2008