Data Center Proposal V1 2-10-15 Final
16
Nucleus Data Solutions, LLC Contact: Eric Mulata 202-701-9290 [email protected] Private Offering Memorandum
-
Upload
eric-mulata -
Category
Documents
-
view
89 -
download
5
Transcript of Data Center Proposal V1 2-10-15 Final

Nucleus Data Solutions, LLC
Contact:
Eric Mulata
202-701-9290
Private Offering Memorandum

TABLE OF CONTENTS
Executive Summary 1
Introduction 2
Development Team
3
Macroeconomic Environment
4
Austin Data Center Market
5
AU-1 Project
9
Financials
11
Glossary of Terms
14

1 Investors should be aware that any projections concerning potential rates of return and future performance of the investment described herein represent an estimate prepared on the basis
of assumptions which are considered fair and reliable by Nucleus Data Solutions.
EXECUTIVE SUMMARY
Project: Development & Operation of a Colocation Data Center
Developer: Nucleus Data Solutions, LLC
Location: Met Center; Austin, Texas
Property Size: 8.4 Acres (6.04 Net Usable Space)
Gross Building Size: 20,000 Sq Ft (Expandable to 40,000 Sq Ft)
Size of Computing Room: 11,000 Sq Ft
Critical Load (See Glossary): 2.1 MW (200 W/Sq Ft)
Number of Server Racks: 492
Targeted Availability: Tier 3 (See Glossary)
Duration: Approvals & Construction 12 Months
Lease-Up Period 12 Months
Holding Period 48 Months
Total 72 Months
Investment Size: Unleveraged: $12.4 million; Leveraged: $4.4 million
Nominal Income: Unleveraged: $18.3 million; Leveraged: $15.6 million
Preferred Dividend: 10% on Invested Capital
Internal Rate of Return (IRR): Unleveraged: 24%; Leveraged: 44%
Net Present Value (NPV): Unleveraged: $4.4 million; Leveraged: $6.5 million
Residual Proceeds Split: 70% Investor; 30% Developer
2 Investors should be aware that any projections concerning potential rates of return and future performance of the investment described herein represent an estimate prepared on the basis
of assumptions which are considered fair and reliable by Nucleus Data Solutions.
INTRODUCTION
In simple terms, a colocation data center is a commercial building that is purpose-built to house enterprise computing
equipment for other companies. Colocation data centers lease physical space, electricity and internet connectivity, not
computing equipment. This allows colocation data centers to avoid the perils of obsolescence and instead focus on
providing robust infrastructure and key technology services. Ultimately, colocation data centers are driving many of
today’s most innovative technologies. For instance, most mobile applications use the storage and processing power of
networked servers housed in colocation data centers—commonly known as cloud computing.
Although technology companies are major colocation customers, firms from other industries have increased their use of
data center space. From transcontinental shipping to advertising, computer automation and big data analytics have
infiltrated virtually every industry. As a result, many firms have outgrown their existing IT facilities and have turned to
3rd party data centers (colocation providers) to house their critical IT assets. By leasing space, firms can reallocate
capital to more strategic resources and avoid the distraction of maintaining and securing sophisticated data center
infrastructure. Moreover, the secular migration of IT real estate off of corporate balance sheets and into data centers
should continue well into the future.
Today the data center asset class makes up only 2% of the $561 billion real estate investment trust (REIT) marketplace,
yet the sector is poised for rapid expansion. According to 451 Research—the preeminent data center research firm—
North American data centers are expected to grow their revenues at a compound annual growth rate (CAGR) of
over 18% through 2014. What’s more, many data centers produce operating margins in excess of 18%. With
exceptional revenue growth and strong margins, the data center sector is expected to produce outsized returns well into
the future.
Considering the strength of the data center industry, there is a considerable opportunity to build and operate colocation
data centers. Although there are a few large players—namely REITs such as Dupont Fabros Technology and Digital
Realty Trust—their target customers are large fortune 100 companies and government agencies. As such, the larger
players build facilities with cost and service profiles that may not be suitable for the average small to medium sized
customer. Conversely, companies that target small to medium sized customers are often small tech companies that
vertically integrated into the data center business. These companies’ core strategic resource is their IT expertise, therefore
they focus on maximizing margins within their existing data centers rather than growing their company’s market share.
As a result, there are few data centers developers that focus on small to medium sized businesses.
Our goal is to build colocation data centers for the small to medium sized customer. By leveraging our real estate
expertise we will be able to drive down development costs and reallocate resources to a best-in-class customer service
and security program. Our data center model, based on a new state of the art design developed for Intel Corp, is
considerably cheaper to build than those of our competitors. In fact, the design is 43% more efficient and costs
less than traditional designs. In regards to customer acquisition, we plan to create a number of strategic partnerships
with managed IT services firms. An example of a managed IT services firm is GoDaddy.com. Typically, a managed
service firm assists its customers in establishing and growing their web presence. As an internet gatekeeper of sorts,
managed services firms have hundreds of customers, ranging from nail salons to internet startups, which collectively use
a considerable amount of data center space. By partnering with managed service firms we will gain a pipeline of new
customers and the ability to offer a host of bespoke IT services. In return, our partners will be able to market their services
to our other customers, as well as gain discounted data center space. In addition to being cost effective and service
oriented, our data centers will be equipped with both the physical and virtual security necessary to maintain HIPAA,
SAEE and PCI compliances. This will allow us to attract data storage clients from the ever growing healthcare and
financial services sectors. Ultimately, we see bespoke IT services and best-in-class security solutions as the
foundation of our customer acquisition strategy. Unlike other small data center developers, we expect to develop
multiple data centers around the country, eventually expanding our company’s footprint nationally. Our first data center
will be located in Austin, TX, but we believe that Nashville, TN and Minneapolis, MN are also well positioned for data
center development.

3 Investors should be aware that any projections concerning potential rates of return and future performance of the investment described herein represent an estimate prepared on the basis
of assumptions which are considered fair and reliable by Nucleus Data Solutions.
DEVELOPMENT TEAM
THE COMPANY
Nucleus Data Solutions is a unique partnership formed by long time collaborators with the intention of penetrating the
growing data center market. Currently, the company is operating out of Washington, DC. Starting with our Austin
project, we intend to expand into multiple tier one and tier two cities that are currently underserved by the large data
center players. Ultimately, we believe that our real estate expertise and our experience collaborating with a diverse range
of partners will give us a considerable competitive advantage in the data center market.
MANAGEMENT STRUCTURE
The development of colocation data centers presents a unique set of challenges. Unlike traditional brick and mortar, data
center development requires both real estate and information technology expertise. To ensure the success of the
development, we have engaged consultants to assist us with the data center’s IT infrastructure, design, engineering,
leasing and sales. Collectively, the team we have assembled has over 85 years of construction experience, assisted with
the development of 10 data centers and has leased and sold hundreds of data center developments over the past 10 years.
REAL ESTATE DEVELOPMENT & CONSTRUCTION: NUCLEUS DATA SOLUTIONS
Thomas Joseph is the construction license holder and has 45 years of experience in all aspects of real estate development
and construction. Mr. Joseph has developed over 34 multifamily communities, 24 commercial properties, including a
265,000 square foot project covering an entire city block in Anchorage Alaska, and over 5,000 residential lots for single
family construction. With ten years in the development industry Gabriel Joseph and Thomas A Joseph will coordinate
project design, entitlements and project delivery. Managing Nucleus’ financial operations is Eric Mulata. Mr. Mulata
has a degree in Finance from Rochester Institute of Technology and over nine years of experience managing hundreds of
millions of dollars in funds and helping make investment decisions for leading institutions within the real estate and
healthcare industries. Mr. Mulata has held financial management positions with KB Home, AARP and Howard
University.
ARCHITECTURE: SCOTT ANDERSON & ASSOC. ARCHITECTS
With a focus on quality and value, Scott Anderson and his team provide state of the art design, engineering and
architectural services. Their team has designed numerous commercial, industrial and multifamily facilities throughout
the Western United States. Currently, Mr. Anderson and his team are working with Intel Corporation on the design and
implementation of a number of modular data centers. The design they have created for Intel has greatly reduced the cost
of Intel’s data centers. To date, Mr. Anderson and his team have assisted Intel with the development of 10 new data
centers.
IT / DATA INFRASTRUCTURE MANAGEMENT: CSTOR
Custom Storage Inc. (cStor) is headquartered in Scottsdale, AZ with additional offices throughout the Southwest. cStor
is led by Bill Nowlin, an IT professional who has decades of experience managing data center facilities. Over the past
12 years cStor has consulted on the development of 10 top tier data centers. In fact, early this year cStor assisted Cobalt
Data Centers with the development and staffing of its 34,000 sq ft state of the art data center in Las Vegas, NV.
LEASING & SALES: BO BOND, JONES LANG & LASALLE CRITICAL SOLUTIONS GROUP
With 16 years of experience in the commercial real estate industry, Bo Bond has successfully negotiated over 15 million
square feet of real estate transactions in multiple states. Mr. Bond’s knowledge of data center infrastructure and
operations has also allowed him to develop the unique skill set required to lease and sell data center facilities. Mr. Bond
is a co-leader of Jones Lang LaSalle’s Mission Critical Solutions Group.

4 Investors should be aware that any projections concerning potential rates of return and future performance of the investment described herein represent an estimate prepared on the basis
of assumptions which are considered fair and reliable by Nucleus Data Solutions.
MACROECONOMIC ENVIRONMENT
DEMAND
Every day, we create 2.5 quintillion bytes of data—that's roughly equivalent to over half a billion HD movie downloads—
and it’s growing at a rapid pace. In fact, over 90% of the world’s data was created in the last two years. According to
Cisco’s 2011 study, data storage is expected to increase at a compound annual growth rate (CAGR) of 31% through 2016.
Certainly a staggering trend, and considering the host of technological advancements that have gained momentum, such
as big data analytics and cloud computing, it is likely to continue well in the future. Further driving this trend is the
digitization of patient medical records mandated by the Centers for Medicare & Medicaid Services (CMS). Under the
mandate, healthcare providers are required to demonstrate meaningful use of electronic medical records by 2014 to avoid
significant reductions to their payment rates. Of course, these trends have implications for many industries, but none more
than the industry that makes up the backbone of the virtual world, data centers.
SUPPLY
The growth in demand for data center space is expected to outpace the growth in supply giving rise to increased occupancy
rates in the sector. This phenomenon is the result of a number of confluent factors. First, in the early 2000s many data
centers were being constructed to meet the IT demands of the dot-com boom. When the boom turned to bust, the data
center industry was hit hard. Subsequently, many national data center developers scaled back expansion often preferring
to complete one data center before starting the next. Second, the speed of technological innovation has given rise to
exponential growth. It’s difficult for data center developers to keep pace with demand when one innovation can quadruple
demand overnight. Lastly, there are few established capital pipelines for the data center industry making it difficult for
new entrants to establish themselves in the sector. In closing, these trends present a significant opportunity to carve out
a niche in a rapidly expanding marketplace.
0
1
2
3
4
5
6
7
2011 2012 2013 2014 2015 2016
Traditional Traffic
Cloud Traffic
2011 - 2016 31% CAGR
Global Data Center IP Traffic
64%
36%
39%
71%
Zetta b
ytes/Y
ear
70%
75%
80%
85%
90%
95%
100%
2011 2012 2013 2014
Average Multi-Tenant Data Center Occupancy Top US 10 Markets
Source: 451 Group; Dec 2012
0%
5%
10%
15%
20%
2011 2012 2013 2014Global Supply Growth Global Demand Growth
Global Markets Multi-Tenent Data Center Supply/Demand Growth
Source: 451 Group; Dec 2012

5 Investors should be aware that any projections concerning potential rates of return and future performance of the investment described herein represent an estimate prepared on the basis
of assumptions which are considered fair and reliable by Nucleus Data Solutions.
DATA CENTER SECTOR IN AUSTIN
DRIVERS OF THE DATA CENTER SECTOR IN AUSTIN
The Austin metro region is recognized across the globe for its dynamic high-tech economy. Located in the central time
zone with a low risk for natural disasters, abundant telecom and low electric rates, the region has attracted key data center
customers including AMD, IBM, Cisco, Dell, Hewlett-Packard, Intel, Oracle and Sun Microsystems. As well, Austin’s
healthy population growth and robust economy are organically driving Austin’s data center market. Notably, Austin’s
primary industries—biotech and technology—are the industries that use the most data center space.
The drivers of the data center market in Austin include:
1. Population Demography
2. Business Environment
3. Key Growth Sectors
4. Energy & Connectivity
1. Population Demography
Austin’s population grew to nearly 1.8 million in 2011. The decade ending 2010 saw a 37% increase in population, and
growth was 3.2% for the year ending July 2011. Census Bureau estimates show that Austin remains one of the top
destinations for migrating talent. Austin ranked first among the 50 largest U.S. metros based on net migration as a percent
of total population in 2011. In addition, 7% of Austin residents in 2011 lived elsewhere one year earlier. That is also the
largest rate among the top 50 U.S. metros. In the end, increases in an area’s population can increase data usage, as well
as the demand for data center space.
FASTEST GROWING METRO AREAS
Population 2001 – 2011
2011 Difference % Change Rank
Raleigh MSA 1,163,515 330,415 39.70% 1
Austin MSA 1,783,519 462,203 35.0 2
Las Vegas MSA 1,969,975 509,475 34.9 3
Charlotte MSA 1,795,472 421,097 30.6 4
Riverside MSA 4,304,997 927,632 27.5 5
Orlando MSA 2,171,360 461,001 27.0 6
Phoenix MSA 4,263,236 899,500 26.7 7
Houston MSA 6,086,538 1,245,826 25.7 8
San Antonio MSA 2,194,927 446,804 25.6 9
Dallas-Fort Worth MSA 6,526,548 1,194,282 22.4 10
Source: US Bureau of Economic Analysis
POPULATION GROWTH RATES
2010-2020 2020-2030 2030-2040 2040-2050
Austin MSA 35.3% 32.5% 31.50% 31.80%
Texas 21.8 22.0 21.5 21.6
Source: Texas State Data Center, 2012 Population Projections

6 Investors should be aware that any projections concerning potential rates of return and future performance of the investment described herein represent an estimate prepared on the basis
of assumptions which are considered fair and reliable by Nucleus Data Solutions.
2. Business Environment
Greater Austin is a region defined by stunning growth, lower business and living costs, a youthful, well-educated
workforce and an economy that is ranked as one of the strongest in the country. Brookings’ December 2012 Metro
Monitor update puts Austin first among the nations’ top 100 metros for economic performance since the pre-recession
peak. The latest edition of the Milken Institute’s annual Best-Performing Cities report looks at cities that are positioned
well for the future and notes that Austin is “a perennial among the top performers” and points to how the metro’s well-
educated workforce has attracted companies from outside the region, citing new investments from Apple, Samsung,
General Motors, and eBay. Below is a snapshot of how Austin’s economy preformed against its peers.
GROSS DOMESTIC PRODUCT BY METRO
BEST PREFORMING AMONG THE TOP 50 METROS
REAL GDP (In Millions)
2010 2011 % Change Rank
San Jose 147,860 167,661 13.40% 1
Austin 76,698 82,043 7.0 2
Raleigh 49,078 51,629 5.2 3
Boston 271,584 284,564 4.8 4
Portland 116,182 121,680 4.7 5
New York 1,096,869 1,147,917 4.7 6
Nashville 70,026 73,255 4.6 7
Pittsburgh 99,039 103,145 4.1 8
Hartford 75,969 78,880 3.8 9
Indianapolis 89,562 92,804 3.6 10
Source: US Bureau of Economic Analysis
3. Key Growth Sectors
Technology
The Greater Austin region is a hotbed of innovation, supporting more than 4,000 technology companies and 100,000
workers. The region supports tech company growth through a geo-central location in a business-friendly state, low tax
burden (including no state income tax), and living costs below the national average. Austin offers an established high-
tech community, unparalleled standard of living, and a highly educated workforce. A strong and growing tech industry
is a good sign for area data center operators.
Green Energy
Austin is leading the clean energy revolution. Austin’s vibrant region is home to industry-leading wind turbine and
photovoltaic manufacturers. It also supports clean energy research and development, biofuels and energy storage with its
highly educated workforce, globally respected research institutions and top-tier infrastructure. In the end, energy research
is data storage and calculation intensive; both require robust data center operations.
Bio-Technology
Collaboration between Greater Austin's research facilities and educational institutions provides bench-to-bedside
research and training, leading to solutions for today's health issues. Currently, there are more than 160 companies with
over 8,200 employees operating in the areas of biotechnology, diagnostics, medical device, clinical research operations,
pharmaceuticals, biosecurity, and agricultural biotech. Biotech firms are very high utilizers of data center space as their
core business requires heavy data computations.

7 Investors should be aware that any projections concerning potential rates of return and future performance of the investment described herein represent an estimate prepared on the basis
of assumptions which are considered fair and reliable by Nucleus Data Solutions.
4. Energy & Connectivity
Electric
Texas operates with a separate electric grid from the rest of the country, providing additional coverage from national
power failures. There are a variety of electric providers serving the Austin region with competitive rates and high
reliability ratings. A large portion of the region lies in a deregulated electric area. Customers have the ability to choose
providers and negotiate rates with a variety of electric utilities. With low rates and high reliability, Austin’s electrical
infrastructure is perfectly aligned with the needs of data centers.
Telecom
The Austin region enjoys one of the world’s most advanced, robust, and redundant telecommunications networks. Fiber
is virtually universal through the region. Fiber optic connections are available to most major buildings and industrial
sites. Primary fiber providers in the Austin area include Google Fiber, AT&T, TW Telecom, Grande Communications,
Qwest, Verizon, Above-Net, XO Communications, and Level 3. With over 25 interexchange carriers (IXC), the region
is well equipped to handle multiple redundancy needs of data center customers.
Austin Colocation Data Centers
Design Features
Austin’s data centers feature dual electrical feeds, redundant telecom, 24 x 7 bio-metric security and other N+1 (see
glossary) redundant design features. Most of Austin’s data centers are found in the southeast and northeast regions of
the city because those regions have the most abundant and advanced utility infrastructure. An important feature of a data
center is its power usage effectiveness (PUE). PUE evaluates the efficiency of a facility’s electrical system. A lower
PUE is a sign of higher relative efficiency. Ranging from 1.9 to 1.4, the PUE of Austin’s data centers average
approximately 1.6 (2.0 is considered average for the industry). This suggests that Austin’s data centers are using state of
the art power and cooling infrastructure and are ultimately supplying a cost effective product to their clients.
Pricing & Availability
Lease rates in the Austin area are quoted in dollars per rack of servers. A server rack takes up approximately 12 sq ft and
consists of a series of shelves upon which computing equipment is stacked. The cost of leasing space in Austin data
centers ranges from approximately $600/per rack to $1,600/per rack with an average of approximately $1,042/per rack.
This price includes amortized installation charges and all costs associated with running the IT equipment including
electricity, connectivity (excluding monthly bandwidth charges) and space. Data center lease rates can vary substantially
based on various design attributes and the level of service a data center provides its customers. Although Digital Realty
Facility Name
Data Center
Footprint
(Sq Ft)
Whitespace/
Computing
Room (Sq Ft)
Critical
Load/Power
Available to
IT
Equipment
(kW)
Power
Utilization
Efficiency
(PUE)
Tier LevelLease Cost
(Per Rack/Mo)
Install Charge
(Per Rack)
Total Effective
Lease Cost
(Per Rack/Mo)
Data Foundry 250,000 110,000 8,000 1.9 Tier 3 819$ 500$ 833$
Digital Realty 75,000 40,000 4,650 N/A Tier 2 1,550$ 1,300$ 1,586$
Cyrus One (Phase 2) 70,000 41,000 10,250 1.6 Tier 3 670$ 916$ 695$
Cyrus One (Phase 1) 45,000 17,000 4,250 1.6 Tier 3 670$ 916$ 695$
On Ramp (Phase 2) 40,000 22,000 11,000 1.4 Tier 3 1,287$ 178$ 1,292$
On Ramp (Phase 1) 20,000 15,000 4,500 1.5 Tier 3 1,287$ 178$ 1,292$
Via West 15,000 7,500 1,400 N/A Tier 2 604$ 430$ 616$
XO Austin 7,800 3,900 624 1.8 Tier 2 1,327$ 531$ 1,327$
Average 65,350 32,050 5,584 1.6 N/A $ 1,027 $ 619 $ 1,042
Nucleus 20,000 11,000 2,143 1.6 Tier 3 $ 980 $ 619 $ 997
Austin Texas Data Center Market Study

8 Investors should be aware that any projections concerning potential rates of return and future performance of the investment described herein represent an estimate prepared on the basis
of assumptions which are considered fair and reliable by Nucleus Data Solutions.
and XO Communications are two of the largest companies in the data center space, their facility’s antiquated
infrastructure has priced both companies at the top of the market. Both Cyrus One and Data Foundry are the price leaders
in the Austin market given the economies of scale their facilities enjoy, yet both companies lose price flexibility as order
sizes decrease. Despite our smaller relative size, our cost efficient data center design allows us to offer prices that can
compete with both of these companies. Conversely, On Ramp’s lease rates are above average because they provide high
touch services with a focus on smaller customers. Lastly, Via West’s current pricing is extremely competitive because
the company is liquidating its few remaining racks of space in the Austin market. We expect Via West’s small facility
to be completely filled by the time the AU-1 project begins leasing. Nonetheless, we will offer competitive pricing for
each market segment e.g. large customers $800/rack/mo, small customers $1,200/rack/mo.
Austin’s colocation providers are struggling to keep pace with demand. There are three key factors that are making it
difficult for data centers to keep pace with demand. First, firms are becoming more comfortable with moving their IT
assets to colocation facilities. If all the firms in Austin chose to move to colocation facilities then Austin would need
over 2,000,000 sq ft of data center space. Second, technological innovation can change the market’s demand profile
overnight. For example, a small life sciences company—of which Austin has many—calculating gene sequences, could
fill an entire 20,000 sq ft data center by itself. Lastly, a data center’s existing tenants are increasing their data footprint
daily. Many data centers purposely maintain excess capacity to meet the ongoing demands of their existing customers.
Austin Competitive Landscape
The Austin data center market has a number of large multinational and regional players. Digital Realty—the world’s
largest data center REIT—has a few legacy facilities in Austin, but no facilities that can handle the power requirements
of the modern data center customer. Cyrus One and Data Foundry are the largest players in the region. Often relying on
a few large anchor tenants to fill their data centers, these companies build their data centers with service and cost profiles
better suited to larger customers. In fact, only 6% of Cyrus One’s customers lease less than 1,000 net square feet (NSF)
of space and over 75% of their customers lease over 10,000 NSF. Given the size and specifications of Data Foundry’s
facility we expect their customer profile to look similar. Naturally the larger players have the ability to offer lower prices,
yet their price flexibility diminishes with their customer’s order size because their facility’s infrastructure is built for the
high density computing requirements of larger firms. By focusing on larger customers, these companies have a tendency
to ignore the higher service needs of smaller companies. As such, both Cyrus One and Data Foundry may have difficulty
attracting small to medium sized customers because they don’t provide high touch customer service to smaller companies
and they can’t offset their lack of service with extremely low prices.
Our intention is to provide flexible, customer service driven, data center space to small and medium sized businesses. In
the Austin market, XO Communications, Via West and On Ramp have business models that are most closely aligned to
Data Foundry
On Ramp
Cyrus One
Digital Realty
XO Austin
Via West
Nucleus
PR
ICE
SIZE OF CUSTOMER

9 Investors should be aware that any projections concerning potential rates of return and future performance of the investment described herein represent an estimate prepared on the basis
of assumptions which are considered fair and reliable by Nucleus Data Solutions.
our own. With only two facilities in Austin, one of which being an old facility that can’t compete for new clients, XO
Communications has a very small footprint (3,900 sq ft of competitive space). This makes On Ramp and Via West our
only true competitors in the Austin market. As stated, Via West is currently liquidating space in their Austin facility,
therefore we expect their facility to be fully leased by the time AU-1 is operational. That leaves On Ramp as our only
competitor in the Austin market. We can differentiate ourselves from On-Ramp by not only increasing the flexibility of
our services, but also by leveraging our real estate expertise to drive down the cost profile of our data center. Our target
market is private companies with less than 1,000 employees, as well as local, state and federal institutions. Within Austin
there are 40,000 organizations that fit this profile. We would only need 1% of these companies to fill our entire data
center. Nevertheless, considering both the macroeconomic trends and those of the Austin market, we believe there is
enough demand for all companies to exist.
THE AU-1 PROJECT
An Overview
The AU-1 project will be the first data center project executed by Nucleus. The project will be 20,000 gross square feet
(GSF) and have the ability to house almost 500 server racks. We will equip the site with enough power to support another
20,000 GSF building. This will allow us to continue to expand our footprint on the existing site. If we decide not to
expand we will have the opportunity to sell the adjacent parcel (3.02 acres) to another developer. Also, the building will
be evaluated for LEED certification during the design and construction process. Once the project begins leasing we will
use cStor as our IT operations partner. They will be responsible for coordinating the installation and maintenance of the
IT equipment and facility infrastructure, as well as, managing IT staff and providing customer service.
Project Location
The project will be located at 8303 Metropolis Dr. in a business park known as the Met-Center. Located in Southeast
Austin, the Met Center is within two minutes of the airport and less than 10 minutes from downtown and the University
of Texas. Further, with advanced electrical and fiber optic infrastructure, the Met Center is the perfect location to build
a data center. Not surprisingly, the Met Center is home to a number of data centers including facilities operated by Cyrus
One, Data Foundry and Digital Realty. The site is already zoned for data center development, which will reduce the
amount of time it will take to obtain development approvals.
10 Investors should be aware that any projections concerning potential rates of return and future performance of the investment described herein represent an estimate prepared on the basis
of assumptions which are considered fair and reliable by Nucleus Data Solutions.
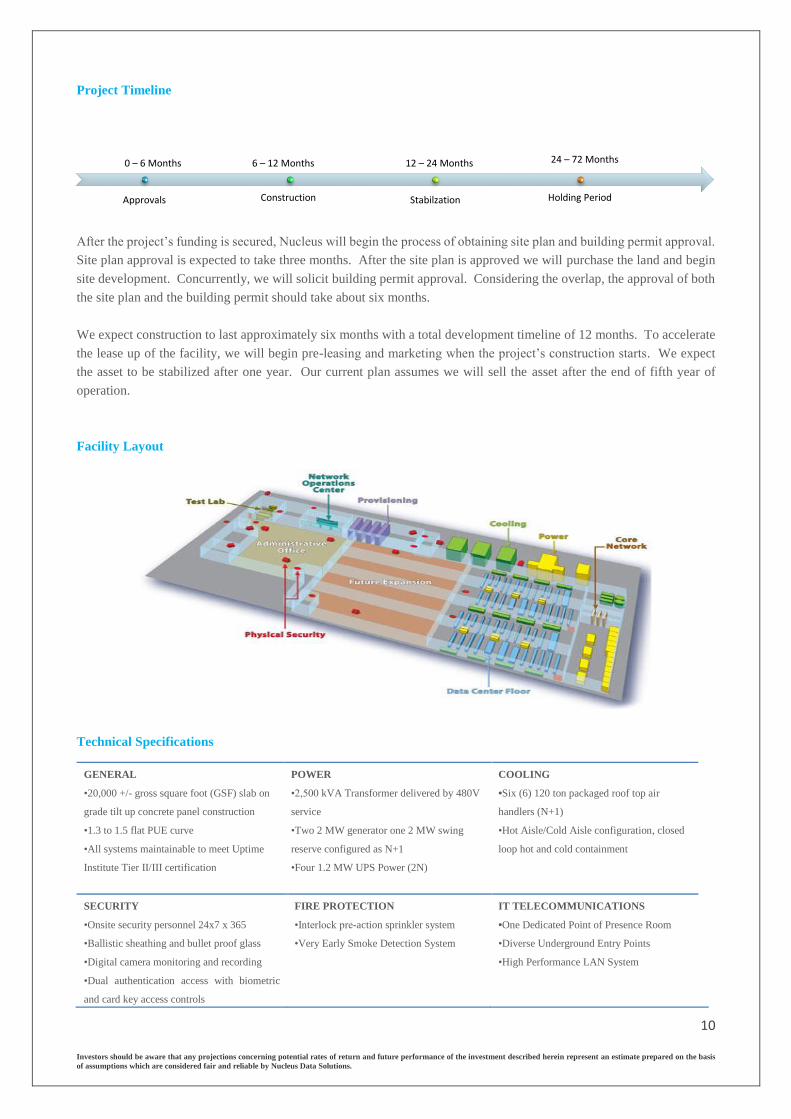
Project Timeline
After the project’s funding is secured, Nucleus will begin the process of obtaining site plan and building permit approval.
Site plan approval is expected to take three months. After the site plan is approved we will purchase the land and begin
site development. Concurrently, we will solicit building permit approval. Considering the overlap, the approval of both
the site plan and the building permit should take about six months.
We expect construction to last approximately six months with a total development timeline of 12 months. To accelerate
the lease up of the facility, we will begin pre-leasing and marketing when the project’s construction starts. We expect
the asset to be stabilized after one year. Our current plan assumes we will sell the asset after the end of fifth year of
operation.
Facility Layout
Technical Specifications
GENERAL
•20,000 +/- gross square foot (GSF) slab on
grade tilt up concrete panel construction
•1.3 to 1.5 flat PUE curve
•All systems maintainable to meet Uptime
Institute Tier II/III certification
POWER
•2,500 kVA Transformer delivered by 480V
service
•Two 2 MW generator one 2 MW swing
reserve configured as N+1
•Four 1.2 MW UPS Power (2N)
COOLING
•Six (6) 120 ton packaged roof top air
handlers (N+1)
•Hot Aisle/Cold Aisle configuration, closed
loop hot and cold containment
SECURITY
•Onsite security personnel 24x7 x 365
•Ballistic sheathing and bullet proof glass
•Digital camera monitoring and recording
•Dual authentication access with biometric
and card key access controls
FIRE PROTECTION
•Interlock pre-action sprinkler system
•Very Early Smoke Detection System
IT TELECOMMUNICATIONS
•One Dedicated Point of Presence Room
•Diverse Underground Entry Points
•High Performance LAN System
Approvals Construction Stabilzation Holding Period
0 – 6 Months
6 – 12 Months
12 – 24 Months
Months
24 – 72 Months
Months

11 Investors should be aware that any projections concerning potential rates of return and future performance of the investment described herein represent an estimate prepared on the basis
of assumptions which are considered fair and reliable by Nucleus Data Solutions.
NUCLEUS DATA SOLUTIONS AU-1 – FINANCIAL PROJECTIONS
Notes:
$/Amount % of Total
LAND
Land (1)
2,744,473 22%
Land Closing Costs 20,000 0%
Impact Fees 25,000 0%
Total Land Costs 2,789,473$ 23%
Civil Engineering 40,000 0%
Title Insurance 30,000 0%
Work Comp/Property/Gen. Liab 40,000 0%
Sales Taxes 4,000 0%
Add Proc. And Tap Fees 20,000 0%
Development Fee 350,000 3%
Project Overhead (2)
400,000 3%
Testing (Inc'l Concrete) 30,000 0%
Legal 30,000 0%
Inspection Fees 20,000 0%
Acctg/Repro/Misc 20,000 0%
Marketing Cost/FF&E 100,000 1%
Temp Utilities 20,000 0%
Acquisition Fee 100,000 1%
Construction Loan Fee 100,000 1%
Temp Labor 25,000 0%
Cleanup/Dumpsters 20,000 0%
Architecture (3)
250,000 2%
Temp Facilities 12,000 0%
Construction Office 12,000 0%
Temp Security/Fencing 30,000 0%
Equipment Rental 20,000 0%
Appraisals 20,000 0%
Small Tools 10,000 0%
Site Inspection/Travel Reinbur. 25,000 0%
Soft Cost Contingency 87,200 1%
Total Soft Costs 1,831,200$ 15%
HARD COSTS
Infrastructure (4)
1,301,047 11%
Base Building (5)
2,800,000 23%
Computing Infrastructure (6)
3,200,000 26%
Hard Costs Contingency 365,052 3%
Total Hard Costs 7,666,099$ 62%
Total Costs (7)
12,286,772$ 100%
Development Cost Summary
1. Land cost at $10.43/sq ft of useable space includes an additional 3.02 acres of land that will be available for expansion or sale at the
end of the project.
2. Project overhead includes funds for bookkeeping, construction oversight and project management.
3. Based on a preliminary quote from Scott Anderson and Associates.
4. Infrastructure costs include grading, utilities, curb & gutter, privacy walls, security gate and parking lots.
5. Base building cost of $140/sq ft is based upon parametric cost data provided by Scott Anderson & Associates. The empirical data
used in the analysis includes the evaluation of six previously built data centers and RS Means 2013 Construction Cost Data.
6. Computing room infrastructure at $160 per sq ft. Extrapolated from parametric cost data provided by Scott Anderson & Associates.
7. Assumes construction interest is capitalized.
Project Costs

12 Investors should be aware that any projections concerning potential rates of return and future performance of the investment described herein represent an estimate prepared on the basis
of assumptions which are considered fair and reliable by Nucleus Data Solutions.
Notes:
Yr 1 Stabilized Total $/Amount
Income
Base Rental Revenue (1)
5,809,681 26,445,286
Rental Abatement (2)
0 (579,361)
General Vacancy (3)
(580,968) (2,386,723)
Uncollectible (4)
(52,287) (234,792)
Installation Revenue (5)
0 365,943
Total Income 5,176,426$ 23,610,353$
Expenses
Salary & Related (6)
701,167 3,333,614
Marketing (7)
173,856 870,004
Maintenance 28,976 131,731
Cleaning (8)
115,904 526,925
Management Fee (9)
227,178 1,032,802
Admin Costs (10)
57,952 263,462
Utilities (11)
721,994 3,282,341
Insurance (12)
173,856 870,004
Real Estate Taxes (13)
312,520 1,563,904
Other 28,976 131,731
Total Expenses 2,542,379$ 12,006,519$
Net Operating Income 2,634,047$ 11,603,834$
Leasing Commissions (14)
(209,149)$ (625,959)$
Replacement Reserve (116,194)$ (528,906)$
Total Rental Income 2,308,705$ 10,448,970$
Total Property Sales Proceeds (15)
-$ 20,172,470$
Total Income 2,308,705$ 30,621,440$
Income Proforma 5-Year Hold
1. Base rental revenue assumes avg. per rack market lease rates of $980/month. This figure is consistent with the average per
rack rate charged by competitors in the Austin market. Further, the rack lease rate includes both electrical usage and bandwidth
cross connect fees. Lastly, the analysis assumes that the property will stabilize its rents within 12 months of the completion of
construction.
2. The analysis provides one month of rents for incentives and promotions. The abatement is only applied to new leases. After
the first lease term of three years, we assume that the likelihood of renewal is 80%.
3. The analysis assumes a vacancy rate of 10%, which is consistent with 2014 industry projections provided by 451 Research.
4. Although we will perform a thorough analysis of our lessees’ solvency, the analysis assumes that 1% of rents will be
uncollectable.
5. After evaluating the installation charges of our competitors in the Austin market, we have determined that the average install
charge for one rack of equipment is $619. This is the rate assumed in the analysis.
6. The facility's staffing model assumes a hybrid of both consulting services and dedicated staff. During business hours dedicated
staff will maintain the facilities IT infrastructure and manage customer service requests. During off business hours we will utilize
the services of consultants. Dedicated staff includes an operations manager, assistant manager, on-site support engineer, on-
site facilities engineer, sales engineer, sales associate, security officer and secretary. Some customer service requests are
reimbursable at a rate of $150 to $225 per hour. The model doesn’t assume reimbursement for these services.
7. Although the facility will use outside leasing consultants to acquire new customers, it will still maintain some internal marketing
and sales activities to retain current customers and to acquire new customers.
8. The facility will outsource specialized cleaning for the computing room.
9. The management fee includes all costs associated with after hours and weekend IT operations and security. Also, the fee will
cover supplemental management of dedicated staff.
10. Administration costs include ongoing bookkeeping, tax preparation, legal and other administrative costs.
11. Utilities assume that the facility will operate at 40% of its maximum electrical draw. Assumption based on electrical engineer’s
estimates. Austin's utility rate is $.077/kWh.
12. Insurance costs include property, general liability, and workmen's comp insurance. Property insurance for housed IT equipment
must be held by customers.
13. After speaking with the Austin property tax assessment division we have determined the assessed value of the property to be
at cost. The property tax will be levied at approximately 2.71% of the assessed value.
14. Leasing costs assume commissions paid at 4% of gross rents amortized over the course of the lease. We don't expect to pay
leasing costs on renewals.
15. The sale of the asset assumes a 12% cap rate on year 5 revenues. Cap rate is consistent with Q2 2013 National Realtor
Association’s (NAR) industrial sales report. The sale includes 4% for broker commissions and 4% for closing costs.
Project Income

13 Investors should be aware that any projections concerning potential rates of return and future performance of the investment described herein represent an estimate prepared on the basis
of assumptions which are considered fair and reliable by Nucleus Data Solutions.
Project Financing
To ensure that investors receive the highest level of returns and that the project conservatively allocates investor’s capital,
we propose that the investors augment their investment with both construction and permanent financing. Our preliminary
research outlines the terms of both construction and permanent financing. Of course, the decision to use a debt is entirely
up to the investors, but given the obvious benefits to both capital outlays and returns, we believe it to be the most prudent
capital strategy.
Project Cash Flows
The company’s revenue stream will start from Year 1 when we begin to lease the data center space. The cash flow
stream assumes the asset is sold at the end of year 5. The cash flow schedule is as follows:
Preferred Dividend and Residual Proceeds Split
We are proposing a preferred dividend on invested equity of 10% a year with dividends accumulating in arrearage from
the 1st month of the project. All residual proceeds will be used to draw down the arrearage until such a time when the
arrearage balance is zero. Subsequent post dividend cash flows will be split in a 70/30 ratio with the investor receiving
the larger portion of the residual cash flows. Internal Rate of Return
Based on an initial cash outflow (including operating deficit) of $12.4 million ($4.4 million leveraged), a 5-year cash
flow stream and a fifth year terminal value at NOI/Cap Rate (12%), the internal rate of return (IRR) for AU-1 is expected
to be 24% (44% leveraged).
Construction Loan
Interest Rate 7.00% Interest 158,075$
LTC 65% Equity 4,300,370$
Loan Term 12 month(s) Debt 7,986,402$
Permanent Loan
Interest Rate 6.50% Monthly PMT 54,992$
Start Month 1/1/2015 Balloon PMT (Year 5) 7,390,773$
Debt Financing
Total Cash Flow Schedule Year 0 Year 1 Year 2 Year 3 Year 4 Year 5
Unleveraged CF (12,286,772)$ 864,607$ 2,308,705$ 2,316,693$ 2,457,872$ 22,673,563$
Unleveraged IRR 23.76%
NPV $4,412,100
Leveraged CF (4,300,370)$ 204,702$ 1,648,800$ 1,656,788$ 1,797,967$ 14,637,844$
Leveraged IRR 43.78%
NPV $6,519,315

14 Investors should be aware that any projections concerning potential rates of return and future performance of the investment described herein represent an estimate prepared on the basis
of assumptions which are considered fair and reliable by Nucleus Data Solutions.
Glossary of Terms
2N - power distribution design provides two separate and independent sources of power (A and B) to the datacenter. With no interconnections or
interdependencies, there are no single points of failure that could impact both sources.
A - Amp, a unit of electrical current.
Cold Aisle - An aisle where rack fronts face into the aisle. Chilled airflow is directed into this aisle so that it can then enter the fronts of the racks in a
highly efficient manner.
Colocation - A colocation (colo) is a facility in which businesses can rent space for servers and other computing hardware.
CRAC - Computer room air conditioner (pronounced crack) which uses refrigerant and a compressor. Cooling of the air in the data center is accomplished by airflow over the evaporation coils where the refrigerant is being "directly expanded" (see DX).
Critical Load - Computer equipment whose uptime is critical, typically supported by a UPS.
Cross-Connect – Connection from a customer’s server rack to ISP rack or POP room.
Hot Aisle - An aisle where rack backs face into the aisle. Heated exhaust air from the equipment in the racks enters this aisle and is then directed to
the CRAC return vents.
In-Row Cooling - Cooling technology installed between racks in a row that draws warm air from the hot aisle and delivers cool air to the cold aisle,
minimizing the path of the air (see close coupled cooling).
ISP - Internet Service Provider is a business or organization that offers its customers access to the Internet and related services.
IXC - Interexchange carrier is a U.S. legal and regulatory term for a telecommunications company, commonly called a long-distance telephone company
KVA - is simply 1,000 volt amps. A volt is electrical pressure while an amp is electrical current. A term called apparent power (the absolute value of complex power, S) is equal to the product of the volts and amps.
kW - Kilowatts, one thousand watts (see W).
Load - The demand placed on a system, typically used to describe the electrical demand on the electrical supply system or the cooling demand on the
cooling system. Units are power such as kW, BTU/hr, Tons, etc.
MW - Mega Watt, a measure of power equal to one million watts. Often used to describe the size of data centers in terms of power capacity.
N+1 - Need plus one, a redundancy concept where capacity is configured to include used capacity plus one additional device to enable continued
operations with the failure of one system in the configuration.
PDU - Power Distribution Unit, this typically refers to one of two pieces of equipment in the power delivery chain. One is the combination
transformer/breaker panel that is often used between a UPS supplying voltage higher than that used by the IT equipment and the cabinets. The other
is the smaller "power strip" like device that is used inside the rack to distribute power to the IT equipment.
POP - Point of Presence Room is a location where internet service providers (ISP) connect with clients
PUE - Power Usage Effectiveness, a metric defined by the Green Grid, which is a measure of data center efficiency calculated by dividing the total
data center energy consumption by the energy consumption of the IT computing equipment.
Rack - Device for holding IT equipment, also called a cabinet.
Tier 3 - 99.982% uptime
U - A unit of space in a rack, equal to 1.75". The vertical dimension of racks and IT equipment is often specified in "Us" such as 42U.
Uptime – the amount of time computing equipment is operational
Uptime Institute Tier Rating - Data center tier standards exist to evaluate the quality and reliability of a data center's server hosting ability. The
Uptime Institute uses a somewhat mysterious four-tier ranking system as a benchmark for determining the reliability of a data center. This proprietary
rating system begins with Tier I data centers, which are basically warehouses with power and ends with Tier IV data centers, which offer 2N redundant power and cooling in addition to a 99.99% uptime guarantee.
UPS (Uninterrupted Power Supply) - is an electrical apparatus that provides emergency power to a load when the input power source, typically mains power, fails.
W - Watt, a unit of power, commonly used in electrical discussion, watts are the product of potential (volts, see V) and current (amps, see A). If the current and voltage are AC, the relationship between watts, volts and amps includes power factor (see PF), watts = volts x amps x PF.
W/SF - Watts per Square Foot, a unit of power density. In a data center this is a bulk term that refers to the total load in a particular space divided by the total area of that space. This is a design parameter for total capacity of the cooling and power systems and is used in conjunction with point load
(the amount of load in a small space such as a rack).