Data Center Optimization Playbook
20
DATA CENTER OPTIMIZATION A Playbook on Achieving a Higher Level of Energy Efficiency and Performance Improvement within the IT Facility
Transcript of Data Center Optimization Playbook
DATA CENTEROPTIMIZATIONA Playbook on Achieving a Higher Level
of Energy Eff iciency and Performance
Improvement within the IT Facility
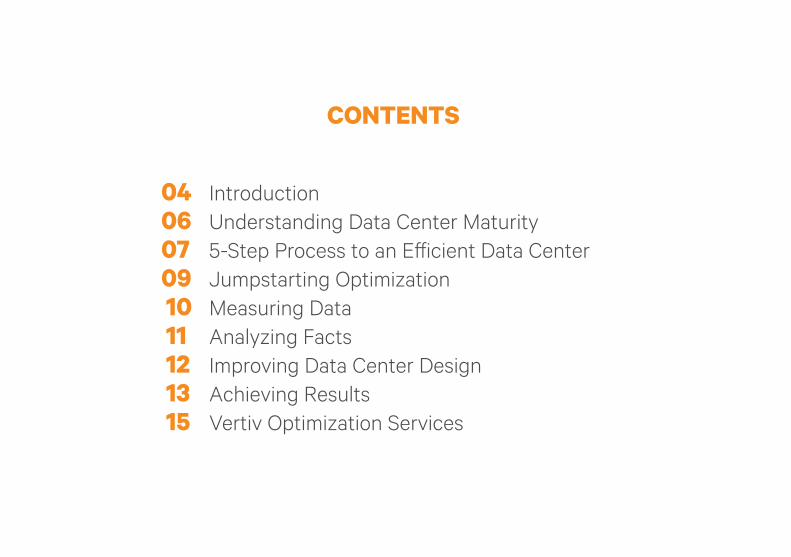
CONTENTS
04 Introduction
06 Understanding Data Center Maturity
07 5-Step Process to an Eff icient Data Center
09 Jumpstarting Optimization
10 Measuring Data
11 Analyzing Facts
12 Improving Data Center Design
13 Achieving Results
15 Vertiv Optimization Services
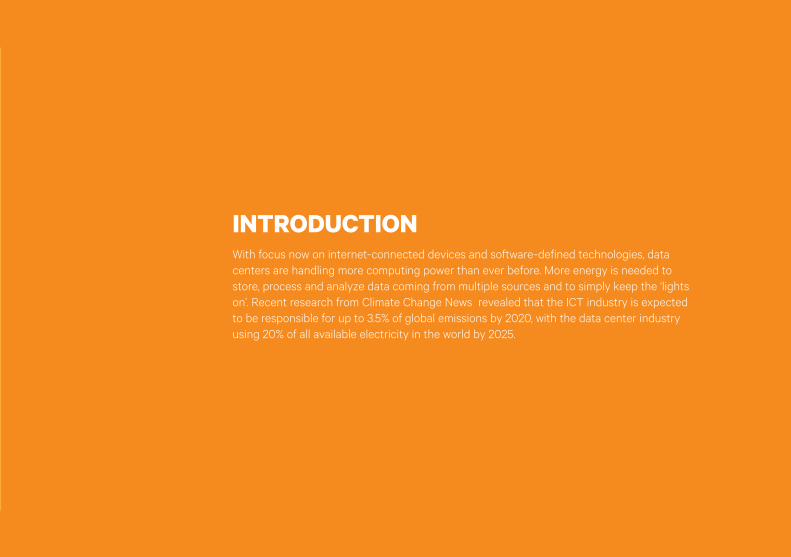
With focus now on internet-connected devices and software-defined technologies, data
centers are handling more computing power than ever before. More energy is needed to
store, process and analyze data coming from multiple sources and to simply keep the ‘lights
on’. Recent research from Climate Change News revealed that the ICT industry is expected
to be responsible for up to 3.5% of global emissions by 2020, with the data center industry
using 20% of all available electricity in the world by 2025.
INTRODUCTION
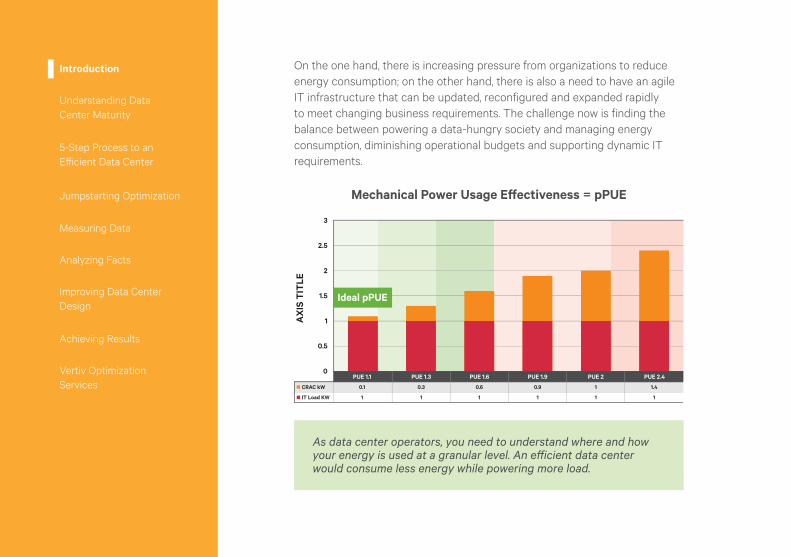
On the one hand, there is increasing pressure from organizations to reduce
energy consumption; on the other hand, there is also a need to have an agile
IT infrastructure that can be updated, reconfigured and expanded rapidly
to meet changing business requirements. The challenge now is finding the
balance between powering a data-hungry society and managing energy
consumption, diminishing operational budgets and supporting dynamic IT
requirements.
As data center operators, you need to understand where and how your energy is used at a granular level. An eff icient data center would consume less energy while powering more load.
Introduction
Understanding Data
Center Maturity
Mechanical Power Usage Eff ectiveness = pPUE
5-Step Process to an
Eff icient Data Center
Jumpstarting Optimization
Measuring Data
Analyzing Facts
Improving Data Center
Design
Achieving Results
Vertiv Optimization
Services
3
PUE 1.1
CRAC kW 0.1
PUE 1.3 PUE 1.6 PUE 1.9 PUE 2 PUE 2.4
2.5
2
1.5A
XIS
TIT
LE
0.5
1
0
IT Load KW
Ideal pPUE
1
0.3
1
0.6
1
0.9
1
1.4
1
1
1
http://www.climatechangenews.com/2017/12/11/tsunami-da ta-consume-one-fifth-global-electricity-2025/
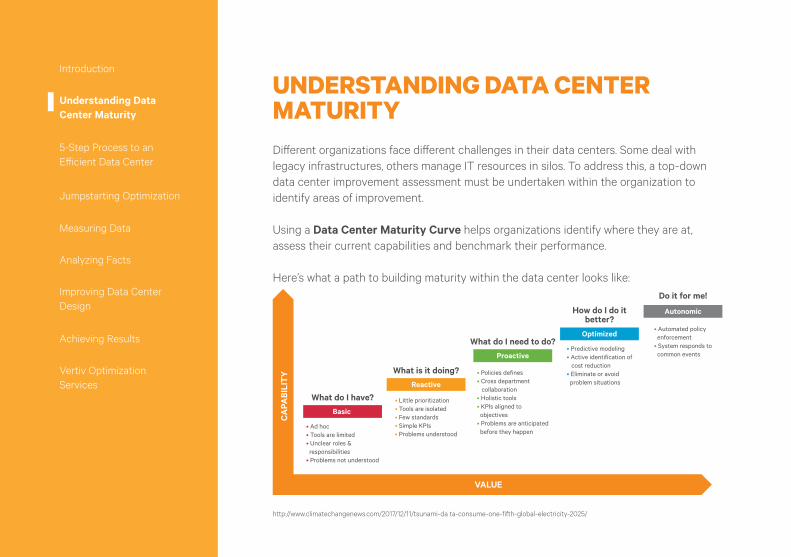
UNDERSTANDING DATA CENTER MATURITYDiff erent organizations face diff erent challenges in their data centers. Some deal with
legacy infrastructures, others manage IT resources in silos. To address this, a top-down
data center improvement assessment must be undertaken within the organization to
identify areas of improvement.
Using a Data Center Maturity Curve helps organizations identify where they are at,
assess their current capabilities and benchmark their performance.
Here’s what a path to building maturity within the data center looks like: C
AP
AB
ILIT
Y
VALUE
What do I have?
• Ad hoc
• Tools are limited
• Unclear roles &
responsibilities
• Problems not understood
Basic
• Little prioritization
• Tools are isolated
• Few standards
• Simple KPIs
• Problems understood
What is it doing?
Reactive
• Policies defines
• Cross department
collaboration
• Holistic tools
• KPIs aligned to
objectives
• Problems are anticipated
before they happen
What do I need to do?
Proactive• Predictive modeling
• Active identification of
cost reduction
• Eliminate or avoid
problem situations
How do I do itbetter?
Optimized• Automated policy
enforcement
• System responds to
common events
Do it for me!
Autonomic
Introduction
Understanding Data
Center Maturity
5-Step Process to an
Eff icient Data Center
Jumpstarting Optimization
Measuring Data
Analyzing Facts
Improving Data Center
Design
Achieving Results
Vertiv Optimization
Services
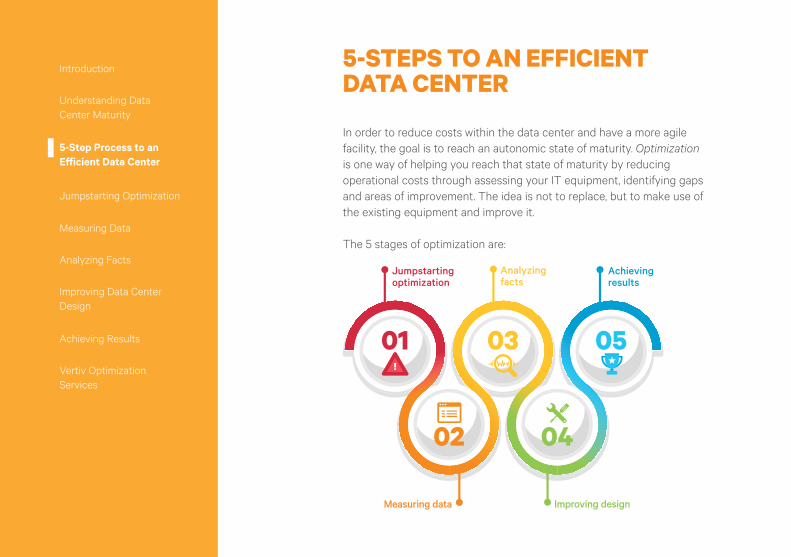
In order to reduce costs within the data center and have a more agile
facility, the goal is to reach an autonomic state of maturity. Optimization
is one way of helping you reach that state of maturity by reducing
operational costs through assessing your IT equipment, identifying gaps
and areas of improvement. The idea is not to replace, but to make use of
the existing equipment and improve it.
The 5 stages of optimization are:
5-STEPS TO AN EFFICIENT DATA CENTER
01 03
02 04
05
Jumpstartingoptimization
Achievingresults
Improving design
Analyzingfacts
Measuring data
Introduction
Understanding Data
Center Maturity
5-Step Process to an
Eff icient Data Center
Jumpstarting Optimization
Measuring Data
Analyzing Facts
Improving Data Center
Design
Achieving Results
Vertiv Optimization
Services

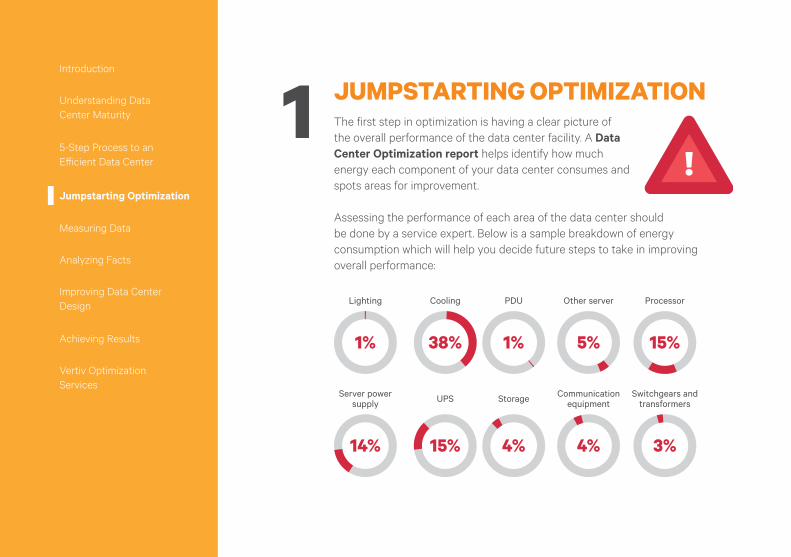
The first step in optimization is having a clear picture of
the overall performance of the data center facility. A Data
Center Optimization report helps identify how much
energy each component of your data center consumes and
spots areas for improvement.
Assessing the performance of each area of the data center should
be done by a service expert. Below is a sample breakdown of energy
consumption which will help you decide future steps to take in improving
overall performance:
JUMPSTARTING OPTIMIZATION
1%1%
Lighting PDU Other server Processor
Switchgears andtransformers
3%
Server powersupply
14%
5%
Cooling
38% 15%
UPS
15%
Storage
4%
Communicationequipment
4%
Introduction
Understanding Data
Center Maturity
5-Step Process to an
Eff icient Data Center
Jumpstarting Optimization
Measuring Data
Analyzing Facts
Improving Data Center
Design
Achieving Results
Vertiv Optimization
Services
1
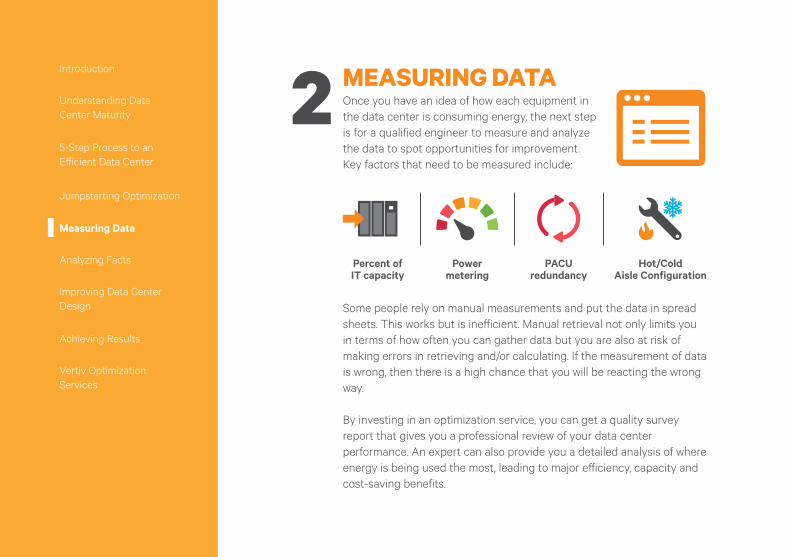
Once you have an idea of how each equipment in
the data center is consuming energy, the next step
is for a qualified engineer to measure and analyze
the data to spot opportunities for improvement.
Key factors that need to be measured include:
Some people rely on manual measurements and put the data in spread
sheets. This works but is ineff icient. Manual retrieval not only limits you
in terms of how often you can gather data but you are also at risk of
making errors in retrieving and/or calculating. If the measurement of data
is wrong, then there is a high chance that you will be reacting the wrong
way.
By investing in an optimization service, you can get a quality survey
report that gives you a professional review of your data center
performance. An expert can also provide you a detailed analysis of where
energy is being used the most, leading to major eff iciency, capacity and
cost-saving benefits.
MEASURING DATA
Percent ofIT capacity
Powermetering
PACUredundancy
Hot/ColdAisle Configuration
Introduction
Understanding Data
Center Maturity
5-Step Process to an
Eff icient Data Center
Jumpstarting Optimization
Measuring Data
Analyzing Facts
Improving Data Center
Design
Achieving Results
Vertiv Optimization
Services
2
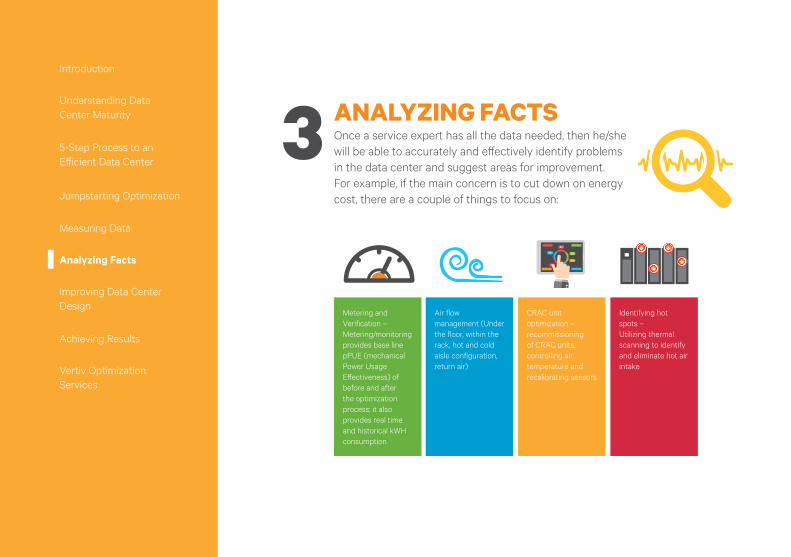
Once a service expert has all the data needed, then he/she
will be able to accurately and eff ectively identify problems
in the data center and suggest areas for improvement.
For example, if the main concern is to cut down on energy
cost, there are a couple of things to focus on:
ANALYZING FACTS
Metering and
Verification –
Metering/monitoring
provides base line
pPUE (mechanical
Power Usage
Eff ectiveness) of
before and after
the optimization
process; it also
provides real time
and historical kWH
consumption
Air flow
management (Under
the floor, within the
rack, hot and cold
aisle configuration,
return air)
CRAC unit
optimization –
recommissioning
of CRAC units,
controlling air
temperature and
recalibrating sensors
Identifying hot
spots –
Utilizing thermal
scanning to identify
and eliminate hot air
intake
Introduction
Understanding Data
Center Maturity
5-Step Process to an
Eff icient Data Center
Jumpstarting Optimization
Measuring Data
Analyzing Facts
Improving Data Center
Design
Achieving Results
Vertiv Optimization
Services
3
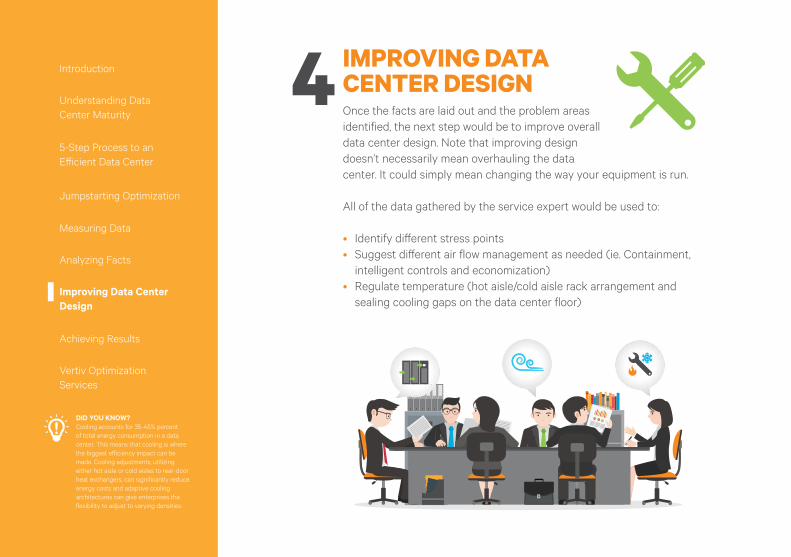
Once the facts are laid out and the problem areas
identified, the next step would be to improve overall
data center design. Note that improving design
doesn’t necessarily mean overhauling the data
center. It could simply mean changing the way your equipment is run.
All of the data gathered by the service expert would be used to:
• Identify diff erent stress points
• Suggest diff erent air flow management as needed (ie. Containment,
intelligent controls and economization)
• Regulate temperature (hot aisle/cold aisle rack arrangement and
sealing cooling gaps on the data center floor)
IMPROVING DATA CENTER DESIGN
DID YOU KNOW?
Cooling accounts for 35-45% percent
of total energy consumption in a data
center. This means that cooling is where
the biggest eff iciency impact can be
made. Cooling adjustments, utilizing
either hot aisle or cold aisles to rear-door
heat exchangers, can significantly reduce
energy costs and adaptive cooling
architectures can give enterprises the
flexibility to adjust to varying densities.
Introduction
Understanding Data
Center Maturity
5-Step Process to an
Eff icient Data Center
Jumpstarting Optimization
Measuring Data
Analyzing Facts
Improving Data Center
Design
Achieving Results
Vertiv Optimization
Services
4
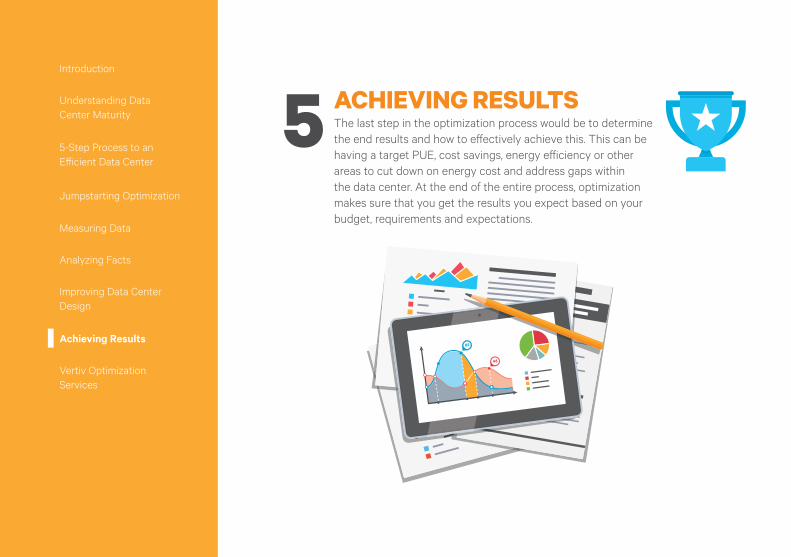
The last step in the optimization process would be to determine
the end results and how to eff ectively achieve this. This can be
having a target PUE, cost savings, energy eff iciency or other
areas to cut down on energy cost and address gaps within
the data center. At the end of the entire process, optimization
makes sure that you get the results you expect based on your
budget, requirements and expectations.
ACHIEVING RESULTSIntroduction
Understanding Data
Center Maturity
5-Step Process to an
Eff icient Data Center
Jumpstarting Optimization
Measuring Data
Analyzing Facts
Improving Data Center
Design
Achieving Results
Vertiv Optimization
Services
5
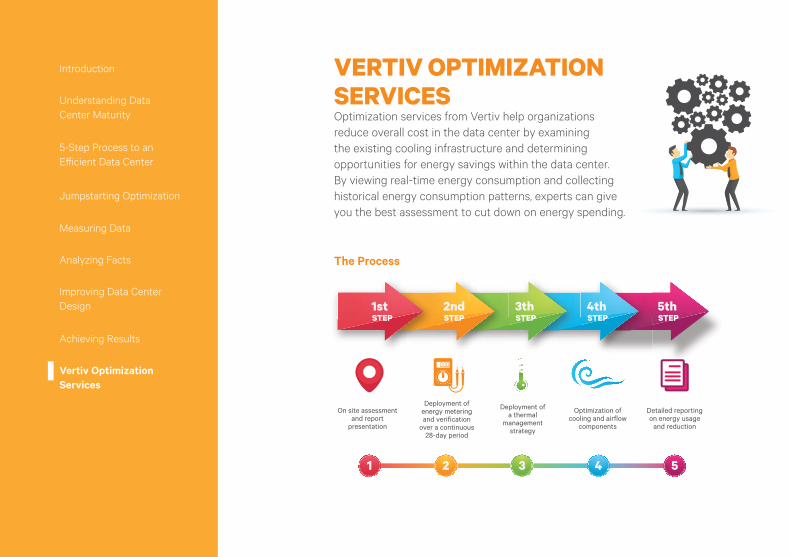
VERTIV OPTIMIZATION SERVICESOptimization services from Vertiv help organizations
reduce overall cost in the data center by examining
the existing cooling infrastructure and determining
opportunities for energy savings within the data center.
By viewing real-time energy consumption and collecting
historical energy consumption patterns, experts can give
you the best assessment to cut down on energy spending.
The Process
5
5thSTEP
4thSTEP
3thSTEP
2ndSTEP
1stSTEP
3 41 2
On site assessmentand report
presentation
Detailed reportingon energy usage
and reduction
Deployment ofenergy meteringand verification
over a continuous28-day period
Deployment ofa thermal
managementstrategy
Optimization ofcooling and airflow
components
Introduction
Understanding Data
Center Maturity
5-Step Process to an
Eff icient Data Center
Jumpstarting Optimization
Measuring Data
Analyzing Facts
Improving Data Center
Design
Achieving Results
Vertiv Optimization
Services
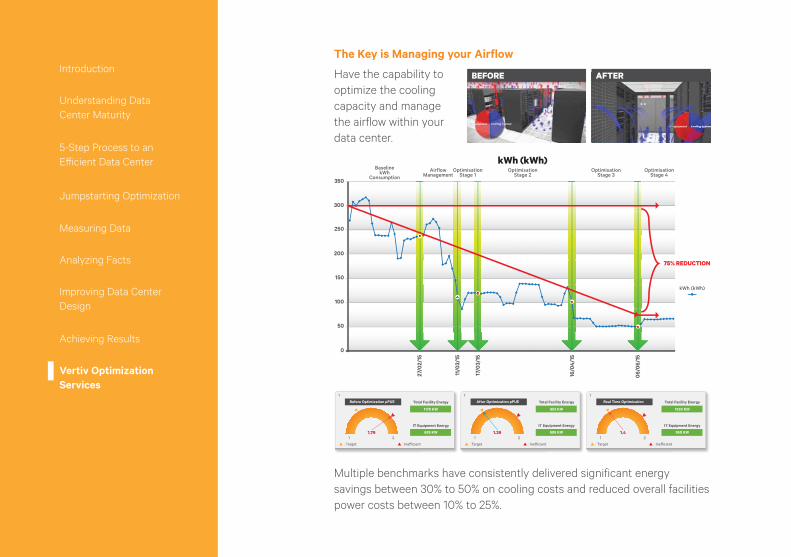
Have the capability to
optimize the cooling
capacity and manage
the airflow within your
data center.
The Key is Managing your Airflow
Multiple benchmarks have consistently delivered significant energy
savings between 30% to 50% on cooling costs and reduced overall facilities
power costs between 10% to 25%.
27/
02
/15
350
300
250
200
150
100
50
0
11/0
3/1
5
17/0
3/1
5
16/0
4/1
5
06
/06
/15
BaselinekWh
ConsumptionAirflow
ManagementOptimisation
Stage 1Optimisation
Stage 3Optimisation
Stage 4Optimisation
Stage 2
kWh (kWh)
kWh (kWh)
75% REDUCTION
BEFORE AFTER
: Target
Before Optimization pPUE
1
1 2
Total Facility Energy
IT Equipment Energy
1170 KW
: Inefficient
685 KW1.79
: Target
After Optimization pPUE
1
1 2
Total Facility Energy
IT Equipment Energy
953 KW
: Inefficient
685 KW1.39
: Target
Real Time Optimization
1
1 2
Total Facility Energy
IT Equipment Energy
1330 KW
: Inefficient
950 KW1.4
Introduction
Understanding Data
Center Maturity
5-Step Process to an
Eff icient Data Center
Jumpstarting Optimization
Measuring Data
Analyzing Facts
Improving Data Center
Design
Achieving Results
Vertiv Optimization
Services
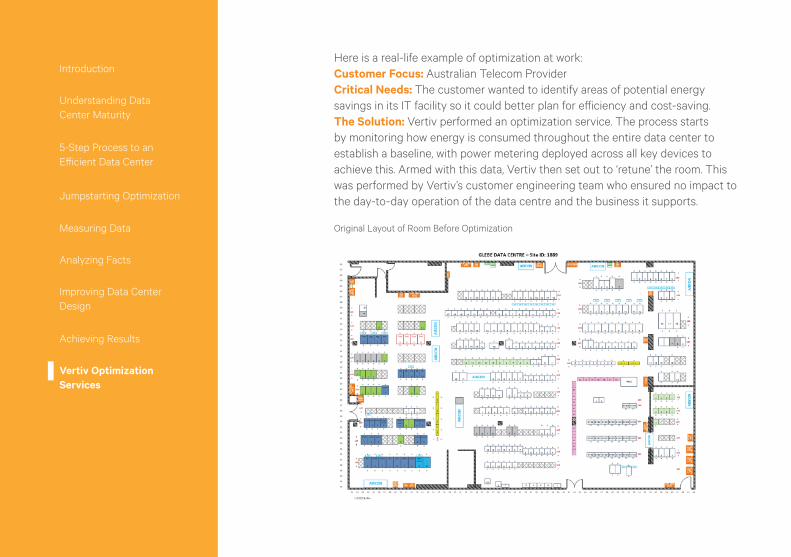
Here is a real-life example of optimization at work:
Customer Focus: Australian Telecom Provider
Critical Needs: The customer wanted to identify areas of potential energy
savings in its IT facility so it could better plan for eff iciency and cost-saving.
The Solution: Vertiv performed an optimization service. The process starts
by monitoring how energy is consumed throughout the entire data center to
establish a baseline, with power metering deployed across all key devices to
achieve this. Armed with this data, Vertiv then set out to ‘retune’ the room. This
was performed by Vertiv’s customer engineering team who ensured no impact to
the day-to-day operation of the data centre and the business it supports.
Original Layout of Room Before Optimization
Introduction
Understanding Data
Center Maturity
5-Step Process to an
Eff icient Data Center
Jumpstarting Optimization
Measuring Data
Analyzing Facts
Improving Data Center
Design
Achieving Results
Vertiv Optimization
Services
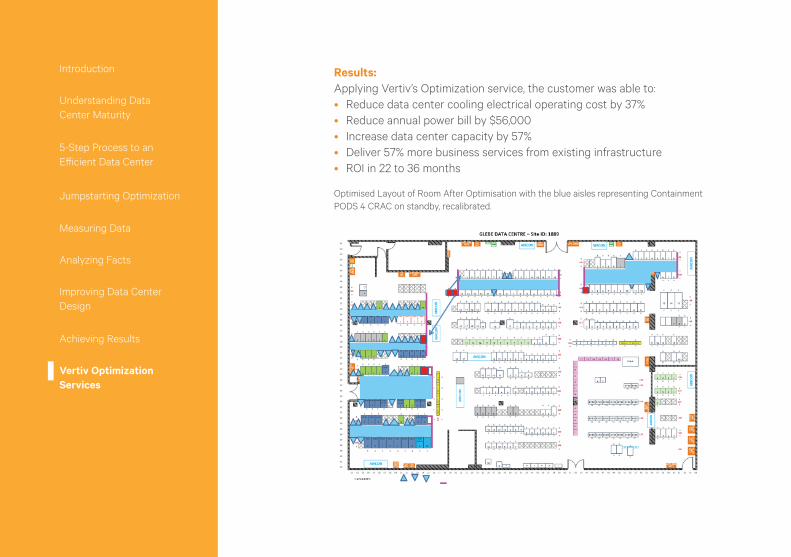
Optimised Layout of Room After Optimisation with the blue aisles representing Containment
PODS 4 CRAC on standby, recalibrated.
Results:
Applying Vertiv’s Optimization service, the customer was able to:
• Reduce data center cooling electrical operating cost by 37%
• Reduce annual power bill by $56,000
• Increase data center capacity by 57%
• Deliver 57% more business services from existing infrastructure
• ROI in 22 to 36 months
Introduction
Understanding Data
Center Maturity
5-Step Process to an
Eff icient Data Center
Jumpstarting Optimization
Measuring Data
Analyzing Facts
Improving Data Center
Design
Achieving Results
Vertiv Optimization
Services
Learn more about our Optimization Services, visit www.VertivCo.com

VertivCo.com© 2018 Vertiv Co. All rights reserved. Vertiv and the Vertiv logo are trademarks or registered
trademarks of Vertiv Co. All other names and logos referred to are trade names, trademarks
or registered trademarks of their respective owners. While every precaution has been taken
to ensure accuracy and completeness herein, Vertiv Co. assumes no responsibility, and
disclaims all liability, for damages resulting from use of this information or for any errors or
omissions. Specifications are subject to change without notice.
Vertiv-Optimization-Playbook-BR-EN-Asia