Data and Policy Consultant – DPI – Healthy Schools Hope E. White, Ph.D.
36
Data and Policy Consultant – DPI – Healthy Schools Hope E. White, Ph.D. 2013 Youth Risk Behavior Survey (YRBS) Results: North Carolina
-
Upload
quynn-branch -
Category
Documents
-
view
31 -
download
4
description
2013 Youth Risk Behavior Survey (YRBS) Results: North Carolina. Data and Policy Consultant – DPI – Healthy Schools Hope E. White, Ph.D. What is the YRBS?. - PowerPoint PPT Presentation
Transcript of Data and Policy Consultant – DPI – Healthy Schools Hope E. White, Ph.D.

Data and Policy Consultant – DPI – Healthy SchoolsHope E. White, Ph.D.
2013 Youth Risk Behavior Survey (YRBS) Results:
North Carolina
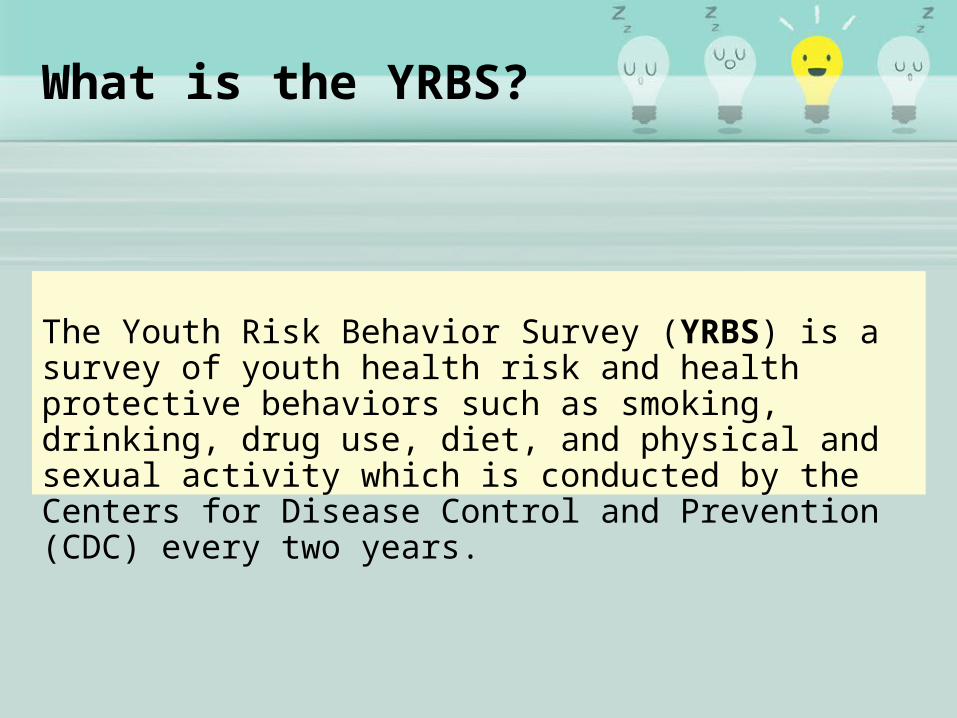
What is the YRBS?
The Youth Risk Behavior Survey (YRBS) is a survey of youth health risk and health protective behaviors such as smoking, drinking, drug use, diet, and physical and sexual activity which is conducted by the Centers for Disease Control and Prevention (CDC) every two years.

What is the YRBS?
• NC conducted at middle and high school levels
• 1993 first year administered in NC• All self reported data• All schools and classes are randomly
selected• Participation is voluntary at each level• Parental consent is required

What is the YRBS?
• Unintentional injury and violence• Mental health• Substance use• Sexual behavior• Weight, physical activity, and dietary
behavior
Survey covers risk and protective behavior:
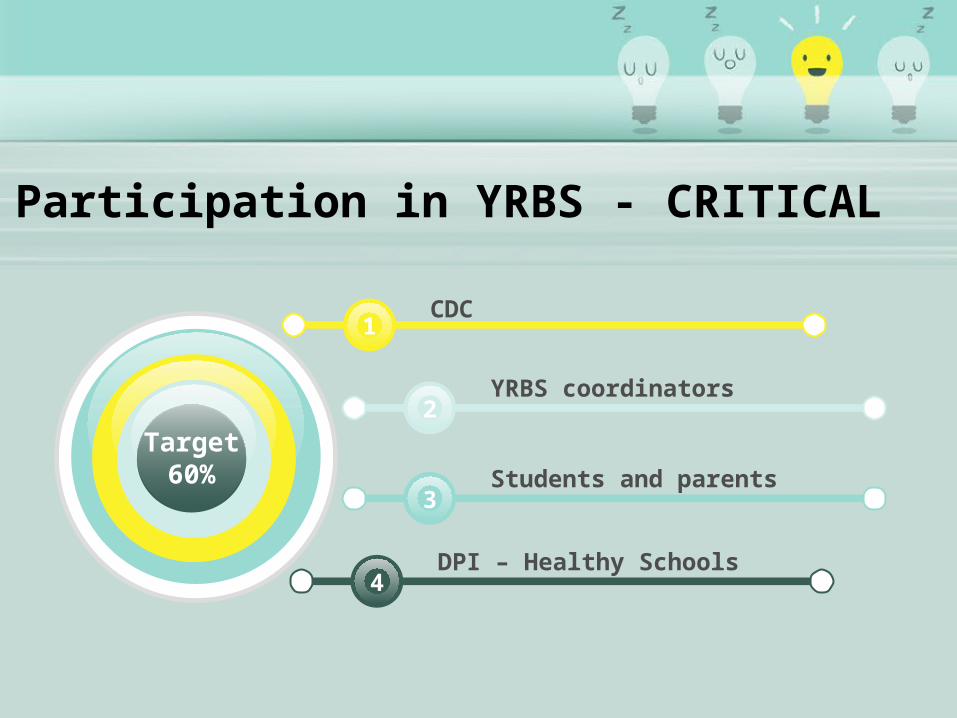
CDC
YRBS coordinators
Students and parents
DPI – Healthy Schools4
3
2
1
Target60%
Participation in YRBS - CRITICAL

National Map of Participation

YRBS Results
Compare
trends at state
and nation
Evaluate interventions
Why conduct YRBS?
PoliciesHAC/Healthy
2020

Activity
Year started in NC?
How often conducted?
Which agency conducts YRBS?
Do you recall?

Unintentional Injury and Violence
High School

Bullying
Bullied on school property Cyber - Bullying0%
5%
10%
15%
20%
25%
19%
13%
20%
15%
NCNation

41% of students admitted to emailing and texting while driving - Nationally

What do you think the percentage is for NC? (not a
prize question)

60% 25%50% 34%
34% of students admitted to emailing/texting while driving
Emailing and Texting while driving…

Mental Health

0%
5%
10%
15%
20%
25%
30%
35%
29%
13%
5%
30%
13%
3%
NCNation
Depression/Suicide

Tobacco AlcoholOther drugs
Substance Use

Tobacco
Smoke ciga-rettes for first time before 13
Smoke 1 or more past 30
days
Smoke 20 or more past 30
days
Did not try to stop smoking
0%
10%
20%
30%
40%
50%
60%
9%15%
5%
48%
9%
16%
6%
52%
NCNation

Drink alcohol before 13
At least 1 drink in past 30 days
5 or more drinks in a couple of
hours in past 30 days
Got alcohol from someone who gave it to
them
0%5%
10%15%20%25%30%35%40%45%
14%
32%
15%
38%
19%
35%
21%
42%
NCNation
Alcohol

0%
10%
20%23%
5%8%
23%
6%9%
NCNation
Other Drugs

Prescriptions (il-legal)
Steroids (illegal) Offer, sold, or given illegal drugs
0%
5%
10%
15%
20%
25%
30%
17%
2%
24%
18%
3%
22%
NCNation
Other Drugs

Sexual Activity
47% has had sex - Nationally

What do you think the percentage is for NC? (not a
prize question)

10% 30%47% 20%
47% of students has had sex
Has had sex…
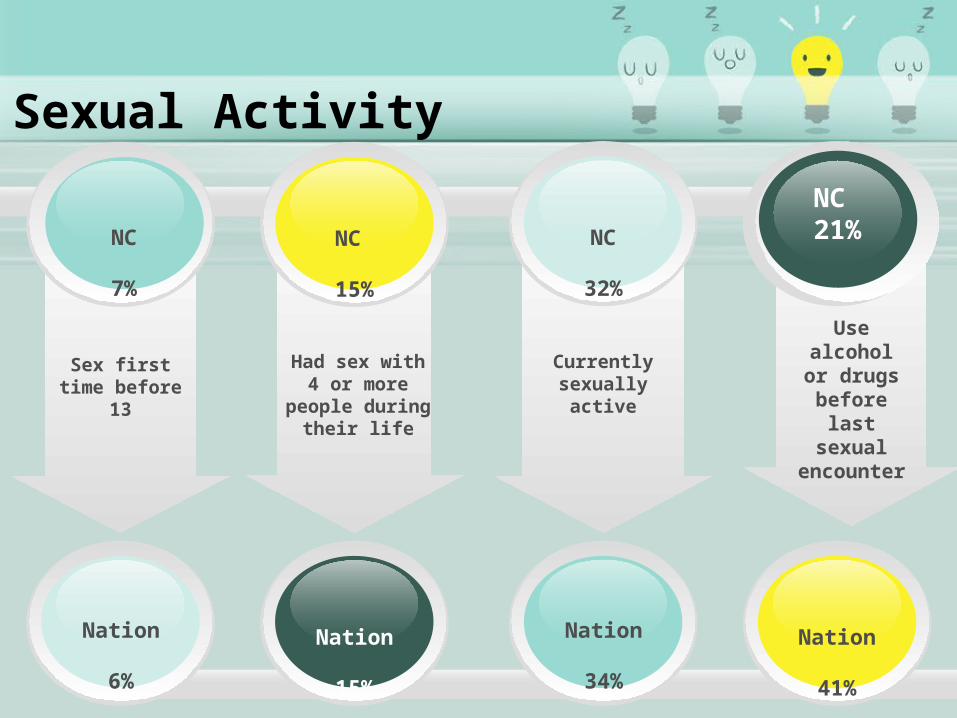
Sex first time before 13
Had sex with 4 or more
people during their life
Currently sexually active
NC
15%
NC 21%
Use alcohol or
drugs before
last sexual
encounter
NC
7%
NC
32%
Nation
41%
Nation
15%
Nation
34%
Nation 6%
Sexual Activity

NC
39%
Nation
41%
Sexual Activity
Did not use a
condom
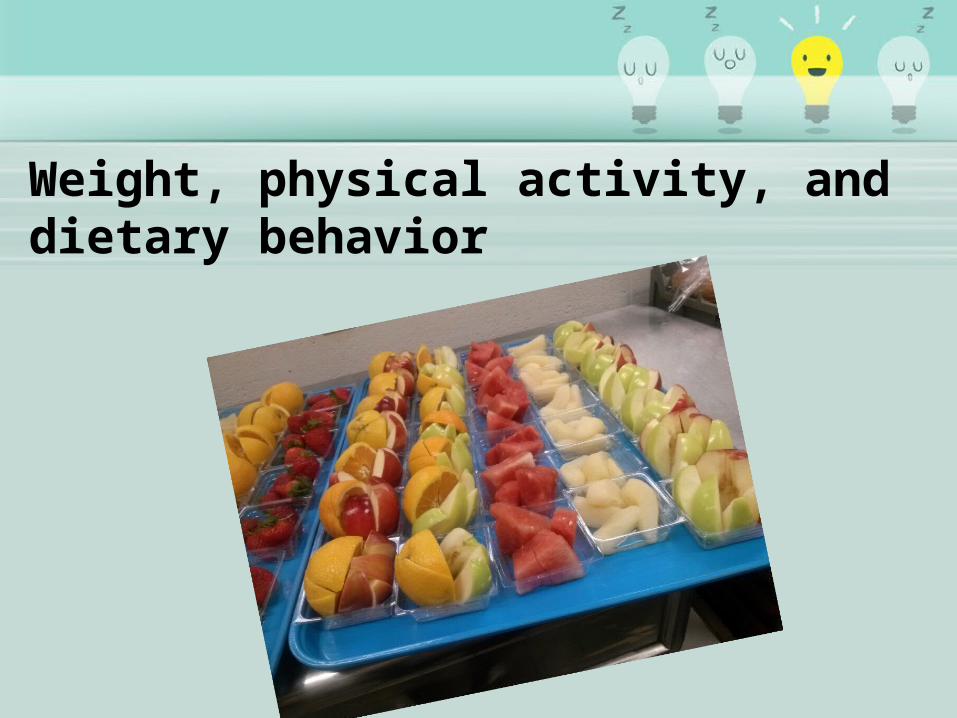
Weight, physical activity, and dietary behavior

Slightly or very
overweight
Did not eat breakfast on
all 7 days
Were not physically
active for 60 minutes per day during past 7 days
NC
65%
NC 42%
NC
29%
NC
74%
Nation
41%
Nation
62%
Nation
73%
Nation
31%
Played video or computer
games or used
computer 3 or more hours
Weight, physical activity, and dietary behavior

Do you recall?In NC % attempted suicide and needed medical attention was
higher, lower, or same than nation
Higher Lower Same
In NC % consume marijuana in past 30 days was higher, lower,
or same than nation Higher Lower Same
In NC % not physically active for 60 minutes during 7 days was
higher, lower, or same than nation
Higher Lower Same
Activity

Middle School Highlights
Bullying
Bullied
on
scho
ol pr
oper
ty
Cyber
- Bull
ying
0%
15%
30%
45% 43%
19%
NC
Suicide
0%4%8%
12%16% 14%
11%
NC

Middle School Highlights
Risk Behaviors
Ever d
rank
alco
hol
Ever u
sed
mar
ijuan
a
Ever h
ad se
x0%
10%
20%
30% 26%
13% 11%
NC
Diet and Physical Activity
0%
10%
20%
30%
40%
50%
60%
70%
80%
52%
68%
41%
NC

Personal
safety and
violence
Less likely to carry weapon
on school property
Less likely to ride in a car
with someone drunk
Increase in
seat belt
use
Less
physical
fighting
Positive Trend Changes
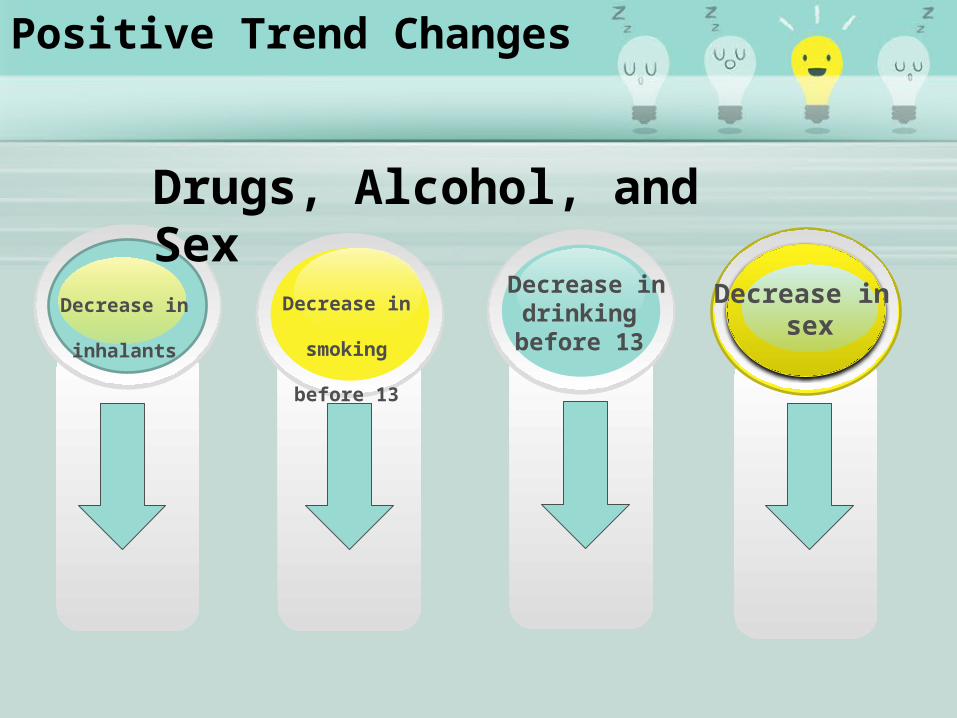
Decrease in
smoking
before 13
Positive Trend Changes
Decrease in drinking before 13
Decrease in sex
Decrease in
inhalants
Drugs, Alcohol, and Sex

Increase in
marijuana use
Bullying
on school
property
Eating less to
loss weight
Hours playing
video
games
Negative Trend Changes

Activity
Having heard the current YRBS trends discuss within your some of the highlights
of the data and how the data could be use to impact or enhance policies within your LEA.
Also discuss examples of success stories recognized by the CDC including one of our
own!!!

For More Information:http://www.nchealthyschools.org/data/yrbs/http://www.cdc.gov/HealthyYouth/yrbs/
Hope E. White, [email protected]
Resources