DATA ANALYTICS - APLU
13
DATA ANALYTICS: USES, CHALLENGES, AND BEST PRACTICES AT PUBLIC RESEARCH UNIVERSITIES MAY 2021
Transcript of DATA ANALYTICS - APLU
DATA ANALYTICS: USES, CHALLENGES, AND BEST PRACTICES AT PUBLIC RESEARCH UNIVERSITIESMAY 2021
2
AUTHORSDenise Nadasen, D.M., Assistant Vice President, Data and Policy Analysis, Association of Public and Land-grant UniversitiesJulie Alig, Ph.D., Founder and CEO, JLA Analytics, LLC
SUGGESTED CITATION Nadasen, D., & Alig, J. (May 2021). Data Analytics: Uses, Challenges, and Best Practices at Public ResearchUniversities. Association of Public and Land-grant Universities. www.aplu.org/library.
ACKNOWLEDGMENTS This report was completed with significant support from Bryan Cook, Ph.D., Vice President for Data andPolicy Analysis, Association of Public and Land-grant Universities. The vision and guidance for the studywas provided by the Commission on Information, Measurement, and Analysis (CIMA) Chairs: Roy Wilson,President of Wayne State University; Tim Sands, President of Virginia Tech; Rita Cheng, President ofNorthern Arizona University; and Lisa Freeman, President of Northern Illinois University. The followingmembers of the CIMA Executive Committee contributed to and edited the paper: Rick Burnette, Florida StateUniversity; Bob Carpenter, University of Maryland Baltimore County; Thulasi Kumar, Virginia Tech; SusannahLivingood, University of Oklahoma; Julia Matuga, Bowling Green State University; Jocelyn Milner, Universityof Wisconsin-Madison; Richard Reeves, University of Delaware; and Stephen Wisniewski, University ofPittsburgh. The Center for Predictive Analytics at Morgan State University conducted the interviews. JLAAnalytics analyzed and synthesized the results.
THE ASSOCIATION OF PUBLIC AND LAND-GRANT UNIVERSITIES APLU is a research, policy, and advocacy organization dedicated to strengthening and advancing the work of public universities in the U.S., Canada, and Mexico. With a membership of 244 public research universities, land-grant institutions, state university systems, and affiliated organizations, APLU's agenda is built on the three pillars of increasing degree completion and academic success, advancing scientific research, and expanding engagement. Annually, member campuses enroll 5.0 million undergraduates and 1.3 million graduate students, award 1.3 million degrees, employ 1.3 million faculty and staff, and conduct $49.2 billion in university-based research.
THE COMMISSION ON INFORMATION, MEASUREMENT, AND ANALYSIS (CIMA)The Commission on Information, Measurement, and Analysis (CIMA) is one of the operational commissions of the Association of Public and Land-grant Universities (APLU). CIMA creates space for APLU institutions to come together to create communities of practice around effective and efficient use of data and fiscal resources to guide campus planning and decision making. Given the dispersion of activities and responsibilities within an institution that rely on the use of a vast array of data sources, CIMA provides opportunities for cross-functional discussions on how to more systematically create and improve the data infrastructure and the strategic analysis capacity, and fiscal and administrative management on campuses.
3
EXECUTIVE SUMMARYThe Association of Public and Land-grant Universities’ Commission on Information, Measurement and Analysis (CIMA) requested a study examining the landscape of data analytics at public 4-year institutions to focus on addressing challenges to campus leaders who want to use data effectively to improve student success. From interviews with individuals in varied roles across different campuses, current practices and common challenges were identified.
The study explored several major themes:
y Infrastructure related to the access to and the integration of various data systems y Data issues focused on data quality and a common understanding of the data y Culture around transparency, the timing of getting actionable data, and data literacy y Resources needed for robust analytical tools, data quality, and comprehensive training y Ethical considerations embedded in predictive analyses
Key challenges facing institutions:
1. Technology infrastructure is made up of disparate, disconnected systems. 2. Data integration is limited and/or managed without input from key stakeholders. 3. Access to data is decentralized; individuals in each unit decide who gets access.4. Access to data are limited; individual offices may protect data by limiting availability.5. Training on the use of data and reporting tools is limited or non-existent; users may not
understand the data they receive or know how to use it effectively.6. Institutional leaders must seriously consider ethical or privacy concerns around data analysis.
The following best practices are offered and consistent with most data governance strategies.
1. Identify senior leaders responsible for strategic decision-making who can champion appropriate resources and support a cross-campus data-informed culture.
2. Pinpoint a Data Governance Office or a Chief Data Officer who can develop an institution-wide strategy to increase the use of and trust in data and manage a data-informed culture change.
3. Create a long-term strategy to develop sustainable internal resources (tools and staff). 4. Form a cross-functional group of stakeholders to evaluate institutional policies and practices
around data use.5. Identify data stewards who will take responsibility for the quality of the data. 6. Build and maintain an integrated, central repository with standardized data definitions. 7. Implement a sophisticated, institution-wide reporting solution with just-in-time analytics that
disaggregate data within an ethical framework.8. Require data training and provide comprehensive support to all faculty and staff.
4
INTRODUCTION The Association of Public and Land-grant Universities’ Commission on Information, Measurement and Analysis (CIMA) requested a study examining the landscape of data analytics at public 4-year institutions to focus on addressing challenges that prevent campus leaders from using data effectively to improve student success. APLU formed CIMA to encourage institutions to collaboratively create communities of practice around the effective and efficient use of data and fiscal resources to guide campus planning and decision making.
Student success is critical to the success of public institutions. Public higher education institutions are committed to improving student outcomes – particularly for low-income and marginalized populations. APLU believes a key first step is transforming how institutions use data to inform decisions. CIMA, as a community of learners, shares best practices around turning data into actionable information members can use to identify and support student needs. To be successful, we must identify obstacles institutions face when attempting to increase the strategic use of data.
Data use is critical to making improvements in higher education. As experienced data practitioners, CIMA members have seen firsthand how well-presented, actionable information can advance campus discussions beyond well-worn anecdotes and guesswork as we move into more evidence-based practices.We know that data problems exist within higher education institutions. By conducting a more systematic analysis of what those issues might be, this paper identifies common challenges institutions face in using data analytics to improve the data capacity. This will enable leaders to make better decisions that support students. This analysis is intended to highlight barriers to, and the need for, a robust data culture. It is not intended to make recommendations on tools or specific data elements.
This paper begins with a brief overview of data analytics in higher education. The results of the study will present key challenges that were identified during the interviews. These may include:
y Infrastructure-Centered Challenges – systems and tools y Data-Centered Challenges – data quality and data definitions y Culture-Centered Challenges – training and usability y Limited Resources – dedicated personnel and resources to purchase and maintain systems y Ethical Considerations – using the data to both serve and protect students
While many barriers may be challenging for some institutions to overcome, this paper offers some strategies to help mitigate these barriers. Key themes are presented as a framework to explore data capacity. Institutional leaders are invited to review the results, conclusions, and strategies and share their experiences and reactions to improving data capacity.
THE STUDY This study identifies the challenges institutions face in creating an evidence-informed culture; that is, using data analytics to better support students. By working together to identify common challenges, we can develop strategies for overcoming these challenges to help institutions reach their goals of enhancing data use and improving student success.
5
In this study, we examine data analytics infrastructures among a small group of CIMA members, documenting current practices and identifying common data challenges. As a cross-functional community of practice, CIMA members are committed to sharing best practices and working collaboratively to transform how we use data. In 2019, 24 CIMA members responded to a survey about data analytics on their campuses and their perceived data maturity level. On a scale from 1 to 4 (where 1 is the lowest maturity level and 4 if the highest maturity level), most respondents indicated that their institutions’ maturity level was at or above level 3. Respondents provided examples of the positive use of data as well as potential challenges in the use of data. Most respondents indicated that their institution had a dedicated staff person or office to champion the data; however, perceived maturity levels were varied across the roles and respondents. Inconsistent data was considered one of the common challenges in using the data. To explore these concepts more fully, IT, IR, and academic leaders were interviewed to further examine challenges with using data to inform decisions at their institutions.
This study consisted of 12 interviews across six different institutions. The six institutions were: Arizona State University, Montana State University, North Carolina A&T University, Northern Illinois University, Northern Arizona University, and Virginia Tech. The interviewS focused on the institutions’ data infrastructure, the overall use of data analytics across campus, specific practices, and perceived challenges and opportunities. The synthesized results are presented below.
THE RESULTS Data analytics at public higher education institutions is discussed at multiple levels, from the president/chancellor and leadership teams downwards. From the interviews conducted for this study, we found that “data analytics” means different things to different individuals on campus. Despite varying perceptions of what data analytics means, participants’ remarks led to some common themes, including challenges relating to the adoption and implementation of data analytics.
When asked, each institution in our study reported that they currently use data analytics at their institution and, moreover, that the highest levels of their administration use them. Several made general statements asserting that analytics is important and widely used. However, institutions were by and large silent as to the details of what this meant. Some participants provided more information and described analytics reports shared regularly with the president/chancellor and other executives. But it was unclear what comprised those reports, whether they were largely descriptive statistics or whether they employed more
sophisticated predictive and prescriptive analytics. One institution reported utilizing what they refer to as data analytics in the 1990s - when it created its first data warehouse.
6
CHALLENGES Institutions described a variety of barriers or challenges that need to be overcome in order to effectively use data analytics in their campus decision-making. These have been grouped into three categories below: infrastructure-related, data-centered, and culture-centered.
Infrastructure-Centered Challenges
Data infrastructure challenges relate to the access and integration of various data systems. Every institution we spoke with commented on the existence of data silos across its campus. These act as a strong impediment to enhancing the use of data for decision-making. Sometimes the required data is “held captive” or “owned” by a certain office, limiting its use by others. Respondents also identified data that are siloed because of technical infrastructure limitations that do not link disparate data sources together. In these cases, respondents noted that constructing the required infrastructure would require additional resources. Of note, each institution interviewed mentioned having significant difficulties accessing data that resides in different computer systems. Several institutions mentioned that even if data isn’t siloed, users cannot acquire the level of access to the data which would allow them to run the queries needed for their own analyses. These institutions reported that security measures implemented by IT are sometimes perceived as “barriers” to keep users from accessing the data itself, when in fact IT’s mission is to secure the privacy of student data. In the end, however, this leaves key users unable to develop the rich insights of the institution’s data and ultimately bring data to bear on decision-making. Sometimes, the only avenue open to an institution is to distribute reports in PDF format, with the audience unable to query and explore questions in a timely manner. A robust, cross-functional data governance strategy and a well-resourced program would help to put into practice business changes and address some of these issues.
Even when users can access data, the software and tools that are available to them often don’t allow for deep inquiry. Dashboards might be delivered in such a way that users aren’t able to collect, sort, and disaggregate the data in the way(s) needed, for example.
Along the same lines, smaller institutions are challenged to find affordable software solutions. This does not account for the cost of implementing the software solution or training users on how to use the tools. One institution shared the hope that smaller institutions would be able to band together and jointly purchase expensive data analytics software. This creates an opportunity for CIMA to explore broader-scale solutions.
Data-Centered Challenges
Data-centered challenges focus on data quality and a common understanding of the data. Even if data silos are bridged, there is often a lack of consistency in the definitions and processes for the data contained in the various systems. It is a challenge to use data that’s not been standardized or cleaned in any subsequent analyses.
Surfacing data from a data warehouse or a central repository that supports standard sourcing or implementing data governance practices can improve the quality and consistency of interpretations of the data. Data governance often supports the practice of having a single office or individual that support data consistency.

7
Basic data integrity was mentioned by one institution as a barrier to using analytics more widely. One respondent from a large research university reported “find[ing] areas where data is just not correct....[I]t was entered over the years [and] has not always been done properly for a variety of reasons, I’m sure....[W]orking through the data integrity issues [is important] both just to make data integrations possible as well as then to really believe the results.” Data quality is important to the users. If the data cannot be trusted, how can the results based on it be trusted?
Culture-Centered Challenges
Creating an evidence-informed culture is an important step in implementing analytics. One institution explained that the transparency inherent in using and sharing data more widely was “scary” to many on campus. Changing an organization’s culture is widely acknowledged to be a long, involved process. Undertaking such an initiative requires consistency and support from the institution’s leadership.
The time lag between asking a question and seeing data that will help answer it was mentioned several times as a challenge in the present study. Data and analysis can be time-consuming if data are not readily available. Without the complete picture, institutional leaders may not make the best decisions possible. Decision-making and action can be improved by making recent data available to those who need it when they need it.
One institution voiced frustration at the time lag between data being available and data needed for decision-making. Another institution appears to have overcome this challenge, explaining that their data infrastructure delivers “just-in-time” data to campus users and has a positive impact on decision-making. Just-in-time is the concept of reducing flow times in the distribution of data, making data available faster for analysis.
Training is an important element of a data literacy and data culture. While there may be training available on how to use the tool, the institutions in this study did not indicate that training in how to analyze the data was widely available. Just one institution offered any explanation for this. First, in their view, that sort of training is best conducted in the classroom; second, adults learn best by experiential learning (learning while doing), and so people are best trained on analytics when they use it together on a common task. Repetition is also important for information retention; a user needs to be in the data frequently to remember how to effectively use and analyze dashboards and analyses.
Limited Resources
A common theme throughout all the interviews is the lack of resources. Resources – which can be finances and human capital to support a robust data infrastructure, technology to support data management and reporting, or expertise to provide training and support – may vary from institution to institution and are necessary to build a data culture and use data more broadly in decision-making. Many types of resources were mentioned. Institutions do not have enough individuals with the requisite analytical skills to answer the questions, and resources are in short supply to offer continuous, comprehensive training to staff.
8
Ethical Considerations
Each institution related that shortly after beginning to use their data for analytics, they quickly realized they would not be able to proceed very far without considering the privacy aspects of using data or the ethics of conducting certain analyses and staging interventions (no matter how well-intentioned). Respondents acknowledge the need for appropriate data use. This is where IT barriers clash with increased access. A strong data governance model can address these issues and offer a path forward.
Many respondents also mentioned maintaining privacy of individual students and the ethics of conducting analyses on student data and then basing decisions on them. One respondent noted the critical importance that institutions use student data appropriately.
MAJOR THEMESThe major themes found in this study are presented across five broad areas to assess data analytics maturity: Data Collection, Data Quality, Data Analysis, Data Dissemination, and Data Culture. These categories align with the APLU’s Powered by Publics’ Data Integration Cluster’s Data Maturity Matrix (DMM).
Data Collection
Just one institution among those interviewed reported a fully built central data repository. Other institutions clearly see the value in a centralized data resource and are moving in that direction on their own campus. However, several challenges stymie this initiative. First and foremost, many of the various IT systems that are implemented across a campus are not easily compatible with one another. The same comment was heard from each respondent: IT systems “don’t talk to each other.” The solution to this problem requires an institution to expend resources to integrate disparate systems. The cost of this type of integrative project is another obstacle to the overall initiative.
Typically to gather data, operational units (such as Admissions, HR, Finance, and the Registrar) are responsible for data that their offices collect. One challenge pointed out was data territoriality on the part of offices that collect the data. These offices were described by respondents as “islands” or “data silos”. It is sometimes the case that access to data was not granted to individuals outside the office that gathers the data, including offices that do institutional reporting, such as Institutional Research (IR). Many institutions have an official Chief Data Officer or a University Data Administrator who oversees the management of institutional data. Finally, just one of the respondents mentioned having created a data dictionary to standardize definitions and facilitate data usage across their campus. In the absence of a common understanding of the data, institutional leaders run a very real risk of making erroneous interpretations and potentially incorrect decisions.
Data Quality
Data quality is highly dependent on the fidelity of the business processes in which the records are created and the meticulousness of audits. Institutions reported that data quality is a significant challenge. That is one of the most important pieces of the data life cycle. One respondent specifically called out data integrity as a particular challenge for their institution. Institutions that allow unverified or unvalidated data to live in their data systems run the risk of using those data to make erroneous decisions. An example might be if participating institutions did not describe processes that ensure the reliability and quality of their data. Data quality is often dependent on a data governance strategy, which only a few respondents mentioned being in place at their institution.
9
Data Analytics
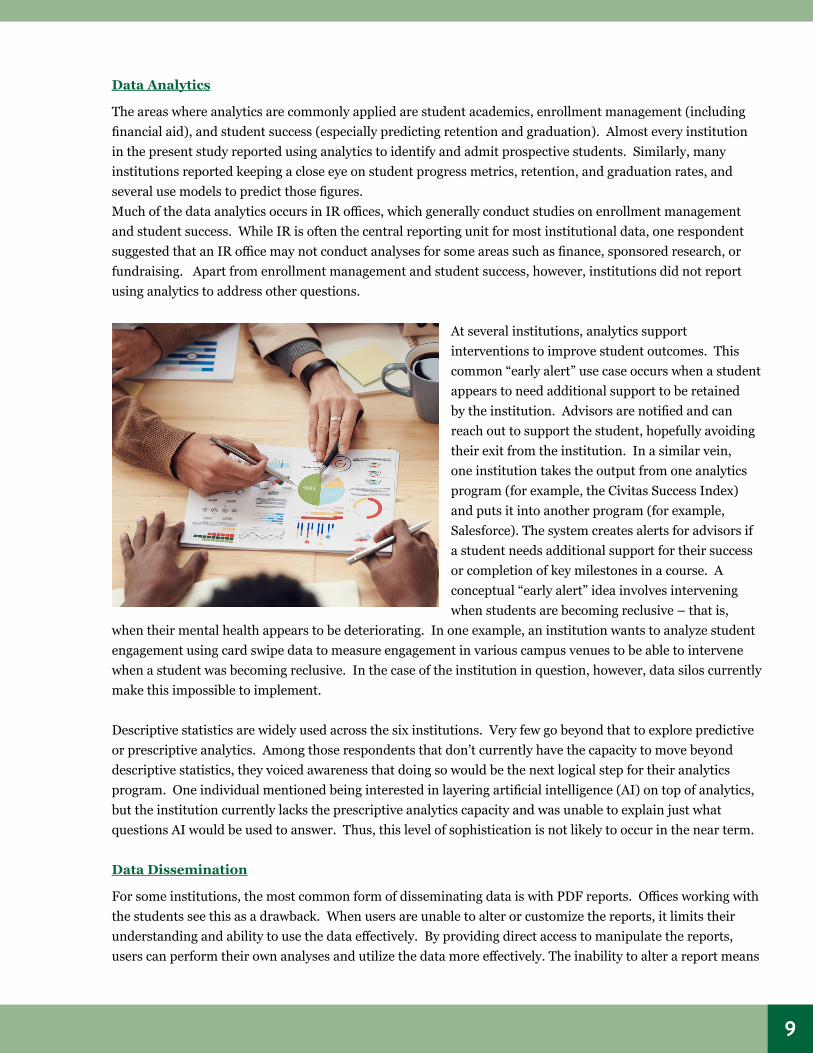
The areas where analytics are commonly applied are student academics, enrollment management (including financial aid), and student success (especially predicting retention and graduation). Almost every institution in the present study reported using analytics to identify and admit prospective students. Similarly, many institutions reported keeping a close eye on student progress metrics, retention, and graduation rates, and several use models to predict those figures. Much of the data analytics occurs in IR offices, which generally conduct studies on enrollment management and student success. While IR is often the central reporting unit for most institutional data, one respondent suggested that an IR office may not conduct analyses for some areas such as finance, sponsored research, or fundraising. Apart from enrollment management and student success, however, institutions did not report using analytics to address other questions.
At several institutions, analytics support interventions to improve student outcomes. This common “early alert” use case occurs when a student appears to need additional support to be retained by the institution. Advisors are notified and can reach out to support the student, hopefully avoiding their exit from the institution. In a similar vein, one institution takes the output from one analytics program (for example, the Civitas Success Index) and puts it into another program (for example, Salesforce). The system creates alerts for advisors if a student needs additional support for their success or completion of key milestones in a course. A conceptual “early alert” idea involves intervening when students are becoming reclusive – that is,
when their mental health appears to be deteriorating. In one example, an institution wants to analyze student engagement using card swipe data to measure engagement in various campus venues to be able to intervene when a student was becoming reclusive. In the case of the institution in question, however, data silos currently make this impossible to implement.
Descriptive statistics are widely used across the six institutions. Very few go beyond that to explore predictive or prescriptive analytics. Among those respondents that don’t currently have the capacity to move beyond descriptive statistics, they voiced awareness that doing so would be the next logical step for their analytics program. One individual mentioned being interested in layering artificial intelligence (AI) on top of analytics, but the institution currently lacks the prescriptive analytics capacity and was unable to explain just what questions AI would be used to answer. Thus, this level of sophistication is not likely to occur in the near term.
Data Dissemination
For some institutions, the most common form of disseminating data is with PDF reports. Offices working with the students see this as a drawback. When users are unable to alter or customize the reports, it limits their understanding and ability to use the data effectively. By providing direct access to manipulate the reports, users can perform their own analyses and utilize the data more effectively. The inability to alter a report means
10
that the user is neither able to perform his/her own analyses of the data, nor customize the report to answer unique questions that arise from examining the data. The user’s only option when presented with static reports is to request additional analyses from the source. This may be feasible but usually takes additional time and resources, impeding the efficient use of data to make decisions.
A better method for disseminating data is to maintain an institutional data warehouse and use analytical tools to create dashboards and other reports that empower users to answer their own questions by allowing them to drill down into the data using filters such as student and program characteristics. Some respondents reported that dashboards are more flexible, and one institution developed its IT capacity to the point that their dashboards are “just in time”. However, other institutions reported similar issues of static vs. dynamic reports for some dashboards as well. Depending on the way the dashboard was built, or what software was employed, respondents may or may not be able to drill down into the underlying data to answer specific questions.
At each institution, the president/chancellor and their leadership team were the recipients of these analytics, be it PDF reports or visualization dashboards. Respondents commonly included the academic leadership (deans or department chairs) and functional managers in this distribution list. However, below that level in the institutional hierarchy, access to analytics was uneven. A common refrain in the interviews was that many staff and faculty who have access to the reports and dashboards don’t realize they have access, let alone take advantage of and using them. This speaks to issues around training and data culture more broadly.
Data Culture
Institutions generally stated that data analytics helps make better decisions, but only a couple of respondents were able to provide details. Most institutions simply asserted this to be the case. Just one institution spoke about having implemented a data governance initiative. Led from the top of the institution, this initiative has regular meetings and has identified “trustees” for the overall effort.
Acceptance of analytics is reportedly high among executive-level administrators and faculty administrators (Deans and department chairs). As for the rest of the faculty, acceptance is commonly acknowledged to be inconsistent, with higher acceptance tending to be associated with disciplines that are more quantitatively oriented. One institution has implemented incentive-based budgeting, and that has been a strong driver for the increased use of analytics across the campus.
Five of the six institutions reported that training in tools is offered. This includes training on how to access and query data kept within a data lake or data warehouse. It also includes training on any software that is used for reporting and on the reports that are produced. For most of the institutions interviewed that have dashboards, training on those dashboards is offered. Institutions sometimes require training for users to gain access to the dashboards and the data training topics might include data security, ethics and confidentiality, and cybersecurity. However, no institution reported offering any training on how to analyze or interpret the data or enhance data literacy.
Several institutions mentioned the existence of user groups on their campus, either formal or informal. One suggested that the building of a community of practice would be helpful, but none exists at the institution.
11
CONCLUSIONSThis paper highlights a few key challenges associated with advancing an institution’s data capacity. These are summarized below:
1. Using data to make decisions is decentralized and up to individuals to decide how to make decisions.
2. Data integration is non-existent or managed by one unit without input from key stakeholders. There are few resources for improved data infrastructure.
3. Access to data is limited. Data are perceived as being owned by an individual unit. Individuals may protect the data by limiting its availability.
4. Training for the use of data or on reporting tools is limited or non-existent.5. It is imperative that institutions identify and address ethical and privacy concerns as they
leverage data. 6. Technology systems are comprised of disparate systems that do not connect with one another.
Based on these conclusions, the following best practices are offered. These practices can be part of a broader data governance strategy.
1. Identify senior leaders who will lead the community in strategic decision-making, champion appropriate resources, and develop a cross-campus data-informed culture.
2. Pinpoint a Data Governance Office or a Chief Data Officer who can develop an institution-wide strategy to increase the use of and trust in the data.
3. Create a long-term strategy to develop internal resources (tools and staff) that will sustain sophisticated systems in changing environments.
4. Form a cross-functional group of stakeholders who will have input on policies and practices that focus on the broader needs of the institution.
5. Identify data stewards who will take responsibility for the quality of data that are collected by their units and integrated with other data systems.
6. Develop and maintain an integrated, central repository where data definitions are standardized. 7. Implement an institution-wide reporting solution that provides access to reports, visualizations,
and predictive analytics with real-time data where users can disaggregate and examine the data in more detail.
8. Require training to all faculty and staff to understand the data, definitions, how to interpret it, how to access predictive analytics, and how to spot and report issues with the data. In addition, individuals who work with students should learn how to ask the questions that would protect student privacy and how to recognize bias in data analytics.
9. Provide data support to anyone who needs it.
The experience of those interviewed for the study suggests that improving data capacity requires a long-term commitment. As institutions move toward creating a data-informed culture, there are a few things to be cautious about.
12
Without significant resources, institutions may not be able to bridge silos, integrate disparate data sources, or provide clean, reliable data. This will affect their ability to create the expected changes necessary in practices that will lead to improved outcomes.
It may be important to manage the expectations of the anticipated culture change and its impact on improved student success metrics. Establish data analytics goals before setting student success goals. The strategy can outline how improvements are being made but be realistic about how quickly student outcomes will change. That is, six-year graduation rates will not change after a two-year commitment.
IMPLICATIONS/RECOMMENDATIONSInstitutions face real challenges in improving student success. The use of data to improve student outcomes is paramount. However, data is only one step in the path to improving institutional effectiveness, helping students succeed, and increasing key student success metrics such as retention or graduation rates. To achieve these desired outcomes, institutional professionals need to understand and interpret data to gain key insights. Through the effective use of data, they can make more effective decisions, create appropriate interventions, and improve both institutional practices and student outcomes. This type of culture change will move us closer to solving problems and removing systemic barriers to student success.
It is critical for senior institutional leaders to create an evidence-informed culture, where staff routinely practice using data to inform decision-making in order to increase student success. This culture creates a continuous cycle of improvement that results in better student experiences and institutional decision-making. Institutional leaders must collectively commit time and resources to improve the ecosystem around the use of data for institutional effectiveness.
However, there are significant barriers institutions face in improving the data culture. This study has identified several challenges related to institutional data capacity. The challenges suggest that collaboration, data quality, data dissemination, data literacy, and the allocation of resources is needed to address these challenges. A data governance framework can address most of these challenges to support an evidence-informed culture. The recommendations in this paper suggest creating an internal community of practice around data management, organizing robust systems and tools that support the distribution of meaningful information in a timely manner, and supporting data literacy to create an environment that allows faculty and staff at all levels to utilize data effectively.
CIMA, the APLU Commission on Information, Measurement, and Analysis, is group of public higher education leaders from all aspects of the institution that share best practices within the organization to address the issues presented in the paper. We invite you to join us to advance the use of data in higher education by sharing your experiences at your own institution.
1220 L ST, N.W., SUITE 400 WASHINGTON, D.C. 20005
(202) 478-6040 WWW. APLU.ORG
@APLU_NEWSFACEBOOK.COM/APLUNEWS YOUTUBE.COM/APLUNEWS