Data Analysis for Refraction Tomography
29
12.12.2007 1 Data Analysis for Refraction Tomography Data Conversion Data Conversion Killing Signal Picking Approaches SeisOptPicker Model Geometry Senior Project-Geop402 Dr.Ali o.Oncel First Break Picking Module 4 copy of SeisOptPicker is uploaded to PC in Computer Lab of ESD.
-
Upload
ali-osman-oencel -
Category
Education
-
view
408 -
download
2
Transcript of Data Analysis for Refraction Tomography

12.12.2007
1
Data Analysis for Refraction Tomography
Data ConversionData ConversionKilling SignalPicking ApproachesSeisOptPickerModel Geometry
Senior Project-Geop402Dr.Ali o.Oncel
y
First Break Picking Module
4 copy of SeisOptPicker is uploaded to PC in Computer Lab of ESD.

12.12.2007
2
Data Conversion
MAKE SURE you name the converted SEG2 files sequentially. That is, name them P1_S01, P1_S02 etc (see above showed SEG-2 files). If you do this, you can be sure that the SU file will also show the shots in sequence. Otherwise you will see shot 1 first then shot10 11, and so on

12.12.2007
3
Some Pitfalls and Solution
• Differences in the Recording Length canh ki d f diff Thcause such kind of differences. Thus, one
is asked to checked.• Recorded Length for first data is 2 ms
while others have a shorter record length,which is 1.5 ms.which is 1.5 ms.
• Solution: Ignore those data havingdifferent length and later combine.
Header Edit
This year, we have recorded 96 traces with 3D geophones, kept 32 of those and deletedother horizontal components based traces (64). Then, Header Edit is required to fixHeader Size to number of data. This is an example for converted data from SEG2 toSU.

12.12.2007
4
Header Edit
TRACF
E t lEnter values as1,2,3,4,5,…….32
Senior Project-Geop402
Data ConversionKilling SignalPicking ApproachesSeisOptPickerM d l G tModel Geometry

12.12.2007
5
Signal Killing on DISPLAY by SEISOPTPIC
PERMANENT Killing by INTERPEX

12.12.2007
6

12.12.2007
7
S1 Deleted. Now, you want to delete S2 to keep V1
S2 Deleted. You have only traces of V1

12.12.2007
8
Compare Traces: How it worked well?
Selected Traces by INTERPEX by component
Traces by TSPRO by one to one deleting signals.
CONVERT FILE to SEG-2
From what I have experienced, If click EXPORT SEG2, it may not be read by other programs in case one modified the data

12.12.2007
9
Senior Project-Geop402
Data ConversionData ConversionKilling SignalPicking ApproachesSeisOptPickerModel GeometryModel Geometry

12.12.2007
10
Seismic Record
Fi b kFirst breakFirst departureFirst Kick
Source: Lie, M., 2000, , Master Thesis, University of Sydney.
Time
DC ShiftNo DC Shift
Corrections on Seismic Record
Well-known seismic softwarehas such kind of tool to make acorrection.

12.12.2007
11
Manually PickingConsistency is veryimportant for manuallypicking. Then, it is betterto select one model ofto select one model ofpicked seismic waves.
Source: Lie, M., 2000, Seismic Applications of Interactive Computational Methods, Master Thesis, University of Sydney.
Model Signal is assigned as a Reference
Signal and kept as a fixed.
Selected signal
One Approach for Manually Picking
Selected signal There is no matching since timedelay due to changes indistance makes a changes inwaveform overlapping.
Overlapping signal Signals are overlapped and sameSignals are overlapped and samelocation as picked on referencesignal is aimed to pick. Thesimilarity between two signals aregiven by value of ratio as As/Ar.
One Approach for Manually Picking Signal Such option you can find under theprogram of TSPRO. Visit to class page.

12.12.2007
12
Automated Picking Methods
I suggest you to read a couple of papers for pickingFirst Arrivals since it is an important part of dataFirst Arrivals since it is an important part of datapreparation. A couple of papers you can easily find:
http://scitation.aip.org/geophysics/

12.12.2007
13

12.12.2007
14
Automated Picking Methods by Interpex
Easy to download from Class Page
http://faculty.kfupm.edu.sa/ES/oncel/geop402software.html

12.12.2007
15
Truncate Traces: Enlarging Signal
I have cut the signals for time larger than 125 Milliseconds since First Arrivals were appeared before.
Trace Plotting Parameters
Automated Gain Control is nice option to strength the signal which can be easily detected.

12.12.2007
16
Picked Examples
Picked Examples

12.12.2007
17
Picked Examples
Picking Experiences: Clean Record
30
40
50
60
70
Tim
e (m
s)
0
10
20
0 5 10 15 20 25 30 35
40
50
60
Ts)
The clear data makes picking arrivals easy and observed slight differences on picked data made by two different person.
0
10
20
30
0 5 10 15 20 25 30 35
Tim
e (m
s

12.12.2007
18
Picking Experiences: Noisy Record
me
(ms)
40
50
60
70
80
90
100
60
70
80
90
Tim
s)
0
10
20
30
0 5 10 15 20 25 30 35
Distance (meter)
0
10
20
30
40
50
60
0 5 10 15 20 25 30 35
Tim
e (m
s
The noisy data makes picking arrivals difficult and observed slight differences onpicked data made by two different person.
Picked Examples on Good Records
60
70
60
70
0
10
20
30
40
50
0 10 20 30 40
0
10
20
30
40
50
60
0 10 20 30 40
Tim
e (m
s)
Tim
e (m
s)
It is an average data makes picking arrivals easier than noisy data.Distance (meter) Distance (meter)

12.12.2007
19
Concluded Remarks• It seems that Hatherly Picking Technique
makes a good job for initial picking but it isbetter to check one to one for each signal.
• Filtering is difficult for areas of higher noisesince following filtering data is out, one facesup another noise of different frequencies.Traces Plotting Parameter for example AGC• Traces Plotting Parameter, for example AGC,provides strength traces
• Noisy data requires a significant time to findtrue picked values of arrival times.
Senior Project-Geop402
Data ConversionData ConversionKilling SignalPicking ApproachesSeisOptPickerModel GeometryModel Geometry

12.12.2007
20
Read Converted Data
12.12.2007
21
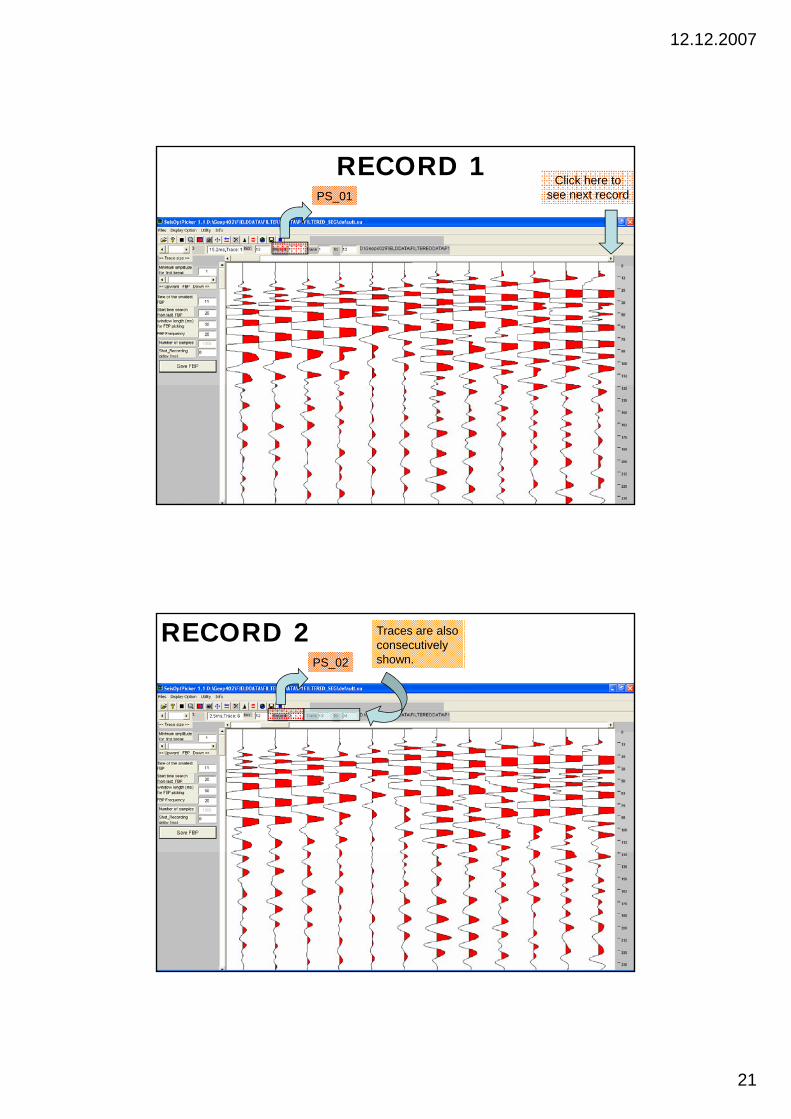
PS_01Click here to
see next record
RECORD 1
PS_02
RECORD 2 Traces are also consecutively shown.

12.12.2007
22
PS_13
RECORD 13 Traces are also consecutively shown.
2006-2007: We had records on material with relatively fast velocities through Profile1 which is only about 10m. So the arrival times appeared to be very small Unfortunately the
Factors Affecting Arrival Times
arrival times appeared to be very small. Unfortunately, the resolution of the traces became poor (lower frequency). Because sample interval of seismic interval was smaller than 0.25 milliseconds, due to old instrument,.
2007-2008: We made seismic survey with state of art seismometer which provided high quality of records withseismometer which provided high quality of records with 0.125 milliseconds. Now, we could see better resolution of these picks.

12.12.2007
23
PICKING DATAZoomed inWindow time display
Type 50 ms
Set trace size=20Window time displayNo equalizationClip amplitude
I used the tool "zoomed in" to the top part of the traces for picking You do this by selecting "window time display" under the "Display option" menu. Type in 50 (for 50 milliseconds) and the top 50 milliseconds will be shown. You can see the first-break clearer now.
I also set trace size to 20 (top left scroll bar all the way to the right). I selected "No equalization" under Display Option->Trace Equalization and Selected "Clip Amplitude" also.
Saving Pick File
Next step is theNext step is the enter geometry.
After picking all the traces, make sure to click "Save FBP" button. This will turn the redpicks to blue color. I tried auto picking but gave up since it doesn't work well for this data. I picked each trace manually the best I could. You will notice all the picks are almost same arrival time –
Once again so to say, it is a combination of short distances and the sampling rate used not being high enough.

12.12.2007
24
Senior Project-Geop402
Data ConversionData ConversionKilling SignalPicking ApproachesSeisOptPickerModel GeometryModel Geometry

12.12.2007
25
S_02
S_01
S_03S_04S_05S_06S_07S_08S_09S_10S_11S_12
S_139.9 M
G_1 G_2 G_3 G_4 G_5 G_6 G_7 G_8 G_9 G-10 G_11 G_12
Shots Data Distance (m)Shot X and First Receiver
4.5 m
0.0m 9.9m
Shot X and First ReceiverS_1 P1_01 10.35S_2 P1_02 9.45S_3 P1_03 8.55S_4 P1_04 7.65S_5 P1_05 6.75S_6 P1_06 5.85S_7 P1_07 4.95S_8 P1_08 4.05S_9 P1_09 3.15S_10 P1_10 2.25S_11 P1_11 1.35S 12 P1 12 0 45S_12 P1_12 0.45S_13 P1_13 -0.45
Receiver Spacing= 0.9 mShot Spacing= -0.9 m
First Receiver X = 0.0Shot X = 10.35S= Shoot locationG= Geophone location
Profile GeometryShot 13 Shot 1
"Record SHot" before going to "Next Record”. And, make sure the receiverspacing is changed to 0.9 and check the coordinates in the row below.
Make sure First Receiver X = 0.0
Shot X for “Shot 1” is 10.35
Shot X for “Shot 13” is -0.45
Things seems working on the Model Geometry regarding the Off-profile Shot Locations
Now, check it again by touching “?”, then exit .

12.12.2007
26
Save and Export
Following the tasks of entering the data for profile geometry and picking the data of first arrival, then it is time to save and export the file for SEIS-OPT for constructing 2D model of refraction velocity.
Data ControlShow files
The data is ready for a final check before saving Check it clearly till you are satisfiedThe data is ready for a final check before saving. Check it clearly till you are satisfied with the entered data on their correctness since the present data is input for modeling software of refraction velocity (Seis-OPT). Then, Save Pick Files if nothing seems wrong.
That is a final reminder for data. If it is true, click “Save SeisOptPick files” and then “Show files”.

12.12.2007
27
F= Display First break time (s) G= Display Receiver X and Z
S= Display Shot Coordinates
Check the file for each of above those inputs, the Save them individually under the FILE. Then, you are suggested to open saved files one more time from where the files are saved. If files on data are saved truly, now it is time to work with the other program (Seis-OPT) for modeling 2D velocity.
Problem: Missing Data

12.12.2007
28
Suggestions
What you do is click "Yes" in the dialog boxth t k "Fi ld b i i tthat asks "Field number missing correctnow". Then you enter "1" when it asksenter first field id number. Click ok. Thefirst time you will see empty box in theexport window as in slide 2. Do the exportagain and now you should see the values

12.12.2007
29
Further Reading: Manual