Data Aggregation in Time Sensitive Multi-Sensor...
62
INOM EXAMENSARBETE DESIGN OCH PRODUKTFRAMTAGNING, AVANCERAD NIVÅ, 30 HP , STOCKHOLM SVERIGE 2017 Data Aggregation in Time Sensitive Multi-Sensor Systems Study and Implementation of Wheel Data Aggregation for Slip Detection in an Autonomous Vehicle Convoy HANNA HELLMAN KTH SKOLAN FÖR INDUSTRIELL TEKNIK OCH MANAGEMENT
Transcript of Data Aggregation in Time Sensitive Multi-Sensor...

INOM EXAMENSARBETE DESIGN OCH PRODUKTFRAMTAGNINGAVANCERAD NIVAring 30 HP
STOCKHOLM SVERIGE 2017
Data Aggregation in Time Sensitive Multi-Sensor SystemsStudy and Implementation of Wheel Data Aggregation for Slip Detection in an Autonomous Vehicle Convoy
HANNA HELLMAN
KTHSKOLAN FOumlR INDUSTRIELL TEKNIK OCH MANAGEMENT
Acknowledgements
Thank you to Alten for patiently housing our sometimes messy and noisy project and super-visor Detlef Scholle for providing us with a project on the leading edge of system safety andtransportation
A warm thank you is also directed to my KTH supervisor Didem Gurdur for being aninspiration as well as providing concrete and stalwart guidance in the sometimes overwhelmingresearch process
Finally a big thank you to the team for invaluable support during both good and bad times
i
Master of Science Thesis MMK 2017 160 MDA 617
Data Aggregation in Time Sensitive
Multi-Sensor Systems
Study and Implementation of Wheel Data Aggregation for Slip Detection in an Autonomous Vehicle Convoy
Hanna Hellman
Approved
2017-09-01
Examiner
De-Jiu Chen
Supervisor
Didem Guumlrdur
Commissioner
Alten Sverige
Contact person
Detlef Scholle
Abstract With an impending shift to more advanced safety systems and driver assistance (ADAS) in the
vehicles we drive and also increased autonomousity comes increased amounts of data on the
internal vehicle data bus There is a need to lessen the amount of data and at the same time
increase its value Data aggregation often applied in the field of environmental sensing or small
mobile robots (WMRrsquos) could be a partial solution This thesis choses to investigate an
aggregation strategy applied to a use case regarding slip detection in a vehicle convoy The
approach was implemented in a physical demonstrator in the shape of a small autonomous
vehicle convoy to produce quantitative data
The results imply that a weighted adaptive average can be used for vehicle velocity estimation
based on the input of four individual wheel velocities Thereafter a slip ratio can be calculated
which is used to decide if slip exists or not Limitations of the proposed approach is however the
number of velocity references that is needed since the results currently apply to one-wheel slip
on a four-wheel vehicle A proposed future direction related to the use case of convoy driving
could be to include platooning vehicles as extra velocity references for the vehicles in the
convoy thus increasing the accuracy of the slip detection and merging the areas of CO-CPS and
data aggregation
Keywords slip detection cooperative CPS (CO-CPS) data aggregation wheel data
aggregation vehicle velocity estimation platooning weighted adaptive average
ii
Master of Science Thesis MMK 2017 160 MDA 617
Data Aggregation in Time Sensitive
Multi-Sensor Systems
Study and Implementation of Wheel Data Aggregation for Slip Detection in an Autonomous Vehicle Convoy
Hanna Hellman
Godkaumlnt
2017-09-01
Examinator
De-Jiu Chen
Handledare
Didem Guumlrdur
Uppdragsgivare
Alten Sverige
Kontaktperson
Detlef Scholle
Sammanfattning En oumlvergaringng till bilar utrustade med avancerade automatiska saumlkerhetssystem (ADAS) och aumlven
utvecklingen mot sjaumllvkoumlrande fordon innebaumlr oumlkad trafik paring den lokala databussen Det finns
saringledes ett behov av att baringde minska den faktiska maumlngden data som oumlverfoumlrs samtidigt som
vaumlrdet paring datat oumlkas Data aggregation tillaumlmpas i dagslaumlget inom omraringden saringsom traringdloumlsa
sensornaumltverk och mindre mobila robotar (WMRrsquos) och skulle kunna vara en del av en loumlsning
Denna rapport avser undersoumlka aggregation av sensordata i ett tidskaumlnsligt system Foumlr ett
anvaumlndarfall gaumlllande halka under konvojkoumlrning testas en aggregationsstrategi genom
implementation paring en fysisk demonstrator Demonstratorn bestaringr av ett autonomt fordon i mindre
skala som befinner sig i en konvoj med ett annat identiskt fordon
Resultaten pekar mot att ett viktat medelvaumlrde som i realtid anpassar sin viktning baserat paring
specifika sensorers koherens med foumlrdel kan anvaumlndas foumlr att estimera fordonshastighet baserat
paring individuella hjuls sensordata Daumlrefter kan en slip ratio beraumlknas vilket avgoumlr om
fordonet befinner sig i ett tillstaringnd av halka eller ej Begraumlnsningar foumlr den undersoumlkta strategin
inkluderar antalet icke-halkande hjul som behoumlvs foumlr tillfoumlrlitliga resultat Simulerade resultat
antyder att extra hastighetsreferenser behoumlvs foumlr tillfoumlrlitliga resultat Relaterat till anvaumlndarfallet
konvojkoumlrning foumlreslarings att andra fordon anvaumlnds som hastighetsreferens Detta skulle innebaumlra
en oumlkad precision foumlr estimeringen av fordonshastigheten samt utgoumlra en intressant
sammanslagning av omraringdena samarbetande cyberfysiska system (CO-CPS) och data
aggregation
iii
Abbreviations
Abbreviation Description
ECU Electronic Control UnitCPS Cyber-physical SystemCO-CPS Cooperating Cyber-physical SystemsM2M Machine-to-machine (-communication)V2V Vechicle-to-vehicle (-communication)V2I Vehicle-to-infrastructure (-communication)V2x Vehicle-to-x (refers to V2V or V2I)ADAS Advanced Driver Assistance SystemABS Anti-lock Braking SystemTCS Traction Control SystemESC Electronic Stability ControlDBMS Database Management SystemRTDBMS Real-time database Management SystemFPGA Field Programmable Gate ArrayRTOS Real-time Operative SystemGPOS General Purpose Operative SystemLIDAR Light Imaging Detection And Ranging (the term LIDAR is a combination of rdquoLightrdquo and rdquoRadarrdquo)SHAPE Self-configurable High Availability and Policy based platform for Embedded systems
iv
Contents
1 Introduction 111 Background 112 Problem Statement 1
121 Thesis Objective 2122 Thesis outline 2
13 Related work 314 Purpose and goal 315 Ethics and sustainability considerations 416 Delimitations 5
2 Methodology 621 Methodology of the literature review 622 Methodology of the implementation phase 6
3 Literature Review 731 Data aggregation 7
311 Data Aggregation Theory 7312 Data Aggregation in Multi-sensor Systems 8
32 Advanced Driver Assistance Systems (ADAS) 10321 Slip detection and control 11
33 Cooperation between CPS 12331 Concurrency and Isolation 13
34 Conclusions from Literature Review 13
4 Implementation 1541 Implications of convoy driving 1542 Use Case Vehicle Control Loss Warning 1543 Requirements 16
431 Requirements for Use Case 16432 Requirements for Convoy Driving 16
44 Hardware 16441 Board 17442 Field Programmable Logic - FPGA 17443 Car platform 17444 Sensors 17
45 Software 18451 RTOS ToppersFMP and SafeG 18452 GPOS Linux Digilent 19453 Dual-OS communication 19454 SoA and SHAPE 19
46 Software design of demonstrator 1947 Slip detection on the demonstrator 20
471 Related works for slip detection 20472 Proposed approach for slip detection on the demonstrator 22
48 Initial simulations 26481 One- and two wheel stall 26
49 Real-time implementation on the Demonstrator 26491 Demonstrator Architecture 26492 Real time data aggregation on the demonstrator 27
v
5 Results 2951 Results from simulations 29
511 Simulated aggregation during one-wheel stall 29512 Simulated aggregation during two-wheel stall 29
52 Results from real-time implementation 30521 Real-time aggregation during one-wheel stall 30522 Real-time aggregation during one-wheel slip 30
6 Discussion and Future work 33
vi
1 Introduction
With vehicles moving towards having electric control units (ECUrsquos) in the hundreds and 60-100sensors [47] comes increasing amounts of communication on the bus between the nodes of thecar Data is sent between sensing nodes and computational nodes in order to make decisionsfor the vehicle for example in cruise control systems deciding to give more or less gas based onsensed velocity data Smart ways of increasing the value and accuracy of the sensed data whileat the same time lessening the amount of data packages to be sent is of ever growing interestand is a necessity for a paradigm shift towards autonomous driving and more sensors
This chapter introduces some terminology and background within the area of cyber-physicalsystems (CPS) data aggregation in multi-sensor systems as well as Advanced Driver Assistancesystems in modern vehicles Thereafter moving on to define the purpose of the study and itsdelimitations
11 Background
A cyber-physical system is a system that senses and acts adaptively to its environment In thisstudy the CPS will be exemplified by an automotive application
As cars move towards having sensor systems in the hundreds [47] a lot of communicationtakes place on the local communication bus
Merging functions and reusing sensor information in more than one application is also rel-evant for the vehicle industry where sensor data from for example electronic stability control(ESC) could be used in the separate system that is the airbag control [44] This example wouldincrease the safety for the passenger but also increase the communication load on the bus
Efforts are made to lessen the bus communication via for example combining tasks on thesame nodes even if they have different criticality such as in the EMC2-project1 and also to senaggregated data instead of raw data
The act of combining data into one representative value is referred to as Data AggregationAdvances in computing power has opened for using this approach even in embedded applicationsfor example in multi-sensor systems [46] With this approach patterns in data can be discoveredand the amount of data that has to be sent between nodes in a distributed cyber-physical systemcan be limited thus saving bandwidth and energy [18] Moreover the value of the data isgenerally said to be increased by aggregation With data having a higher value better decisionscan be made based on this data [40]
12 Problem Statement
An increasing number of sensor systems in cars and other cyber-physical systems allows forbetter response to dynamical environments but also leads to an increased load on the localbus This study aims to incorporate an ad hoc data aggregation strategy in a time sensitivemulti-sensor system and apply it on a use case regarding a usecase in this case slip detectionin a vehicle convoy
The use case comes from the ongoing research project SafeCOP focusing on cooperationbetween CPS and is called control loss warning (depicted in Figure 1) The aim is to send awarning to nearby vehicles when a vehicle looses functionality affecting the platoon All vehiclesin the platoon are to be notified and should assess what actions should be taken [7]
The previously mentioned strategy of aggregating data in multi-sensor systems will be im-plemented on a physical demonstrator of two platooning autonomous miniature carsData Aggregation takes time to perform and looking at this context of convoy driving can data
1EMC2 stands for rdquoEmbedded Multi-Core systems for Mixed Criticality applications in dynamic and change-able real-time environmentsrdquo and is an EU-funded project with the goal of handling mixed criticality applicationsunder real-time conditions and providing multi-core technology to embedded systems [2]
1
aggregation be performed on multiple sensors in a time sensitive system and still produce a resultwithin the time frame where it has a value as a warning to the vehicle behindThe warning will be based on aggregated wheel sensor data from the four wheels of the frontvehicle in the demonstrator platoon The aim is to detect slip on one or more wheels Theconcept of slip and slip detection in similar systems will be elaborated further in the literaturestudy
Figure 1 Image of the relevant SafeCOP usecase regarding vehicle control loss warning [8]
121 Thesis Objective
The objective is to address the problem described in Section Problem Statement through animplementation of data aggregation of wheel velocity data from a physical demonstrator whichis subjected to slip With slip it is meant a situation where one wheel temporarily loses tractionto the surface Empirical data will be collected and analysed to evaluate the accuracy andadequacy of an aggregation strategy for detecting slip in platooning contexts with accuracyadequacy and slip measured as below
accuracy ratio of correctincorrect detections of slip [unitless]
adequacy if a warning based on a certain aggregation strategy can reach the vehicle behindwithin the time frame where it has a value [ms]
slip is a state of a vehicle characterized by one or more wheel velocities deviating from thevehicle velocity It is measured as a slip ratio for each wheel ρslipi
To evaluate the demonstrator based on these metrics research questions were formulatedThe objective of the demonstrator is to answer the following questions
1 How well can a weighted adaptive average of four wheel velocity sensors estimate thevehicle velocity and thus the slip ratio of the wheels during one-wheel slip in the timesensitive system of an autonomous vehicle
2 Using data from several test runs With what accuracy can instances of one-wheel slip onthe surface be identified using the aggregation strategy for estimating the vehicle velocitymentioned in (1)
122 Thesis outline
This report will firstly give a review of relevant literature within the frame-of-reference con-sisting of broad subjects with sometimes overlapping areas These are Data aggregation andmulti-sensor systems including some applications such as Wireless Sensor Networks (WSNrsquos)
2
and mobile robots Then moving on to the emerging area of cooperation between CPSrsquos(CO-CPS) and lastly advanced driver assistance systems (ADAS) concluding withhighlighting a few points from the literature review before moving onto the implementationpart of creating a physical demonstrator
The report then describes the design and construction of a physical demonstrator to be usedfor research within intelligent transport and autonomous driving thereafter describing testingand results from the demonstrator Finally a discussion of which generalizations can be madefrom the results and their validity
13 Related work
This study relates to several ongoing research projects Firstly to SafeCOP which focuseson the need of cyber-physical systems to cooperate safely with each other in unpredictableoperating environments [8] CPSrsquos cooperating is referred to as Cooperative Open Cyber-Physical Systems (CO-CPS) Cooperation can be either Vehicle-to-Vehicle (V2V) or Vehicle-to-Infrastructure (V2I) but is generally seen as a system-of-systems which adds complexity to theinteractions It is stated that most accidents in any system with software components are causedby unsafe interactions between systems The increased complexity that CO-CPSrsquos bring thuscalls for safety assurance models and certifications to be developed which is also a deliverableof SafeCOP [7]
According to [7] this type of cooperation between vehicles will lead to reduction of fuelconsumption reduce the number of accidents and reduce road congestions
Another related research project is DAGGERS 2 (Data Aggregation for Embedded Real-Time Database Systems) which aims to bridge the gap between traditional non-real time datamanagement and real-time embedded systems identifying conflicts and formalizing taxonomyand data transaction models [6]
For the implementation phase this report is related to the software described in [56] and willbuild on this research which combines critical and non-critical tasks on the same hardware Itimplements a layer of Software Oriented Architecture (SOA) which enables cloud communicationbetween nodes through which the aggregated data will be made available to the vehicles Thisis the platform of the V2V communication that will be used
14 Purpose and goal
This study is divided into two main sections with one being a Literature Review and onedescribing the implementation of a physical demonstrator Understanding existing data aggre-gation strategies in multi-sensor systems from the literature review can help to reuse existingsolutions or design new solutions for the second phase of the thesis the implementation of aconvoy driving context
The purpose of the literature study is to summarize learnings from related research in astructured way and form a theoretical framework for the thesis placing the benchmark of thefield to integrate this thesis to existing research
Based on the findings of the literary study an implementation of real-time data aggregationwill be put in a context of two platooning cars The goal of the implementation phase is toevaluate a practical implementation of data aggregation for four wheel sensors in a use-casewith the aim of detecting a slip of a wheel Measurements based on sensor data from thedemonstrator will be performed in a controlled test environment
Within a team consisting of five students the goal is to create a demonstrator utilizing V2Vcommunication in a platooning context which is used in our individual thesis works but also forfuture research by Alten The situation studied within the scope of this thesis will be a slippagesituation acting on the front car which sends a warning to the vehicle behind
2DAGGERS is a cooperation between Malardalens Hogskola and industrial partners
3
15 Ethics and sustainability considerations
Traffic density is increasing in many parts of the world especially freight transport which willcontinue to grow leading to higher emissions of fossil fuels and harmful exhaust particles Apartial solution to this problem can be said to be platooning of heavy duty vehicles [10] Theethical aspects of this study partly depends on the individual nodes placed in each vehicle ofthe system and what data they collect and transmit but also in their interactions with nearbynodes Internet-of-things systems interact with each other and other entities The architectureof these systems can be divided between centralized and distributed systems each holding theirindividual challenges [45] More described in Section Architectural Aspects
IoT and Data management It is stated in [45] that one of the major obstacles for bringingInternet-of-things into the real world is the issue of security Distributed IoTrsquos can be hugenetworks and how is access control managed and privacy of the user contained If the data isintended to be shared to nearby vehicles (V2V) or a base station (V2I) would it be anonymizedor could it be used to track a vehicles path thus posing an integrity threat The issue of securityis noted by Lee Cresswell in his article in Elektroniktidningen that the wireless communicationsused in vehicles today often has a direct link to essential safety systems such as navigationbreaking and steering This relatively new concept of interconnection between internal vehiclefunctions as well as separate vehicles has meant a steep learning curve for developers allowingdata security to fall behind [22]
Autonomous vehicles and whether they can be said to be safe is an ongoing question Thereis a lack of evidence regarding their alleged safety according to Mohammad Mousavi professorin computer systems at Hogskolan i Halmstad There is an infinite number of situations thatmust be handled by an autonomous system to prove its safety thus making traditional testingunsufficient He also emphasises an ethical dilemma where an autonomous system in a collisionsituation hypothetically can be forced to actively make the decision to save multiple trafficantsby steering towards another trafficant [42]
Autonomous vehicles would have to have a programmed moral for however unlikely situa-tions that could occur
Whether algorithms can be said to be moral and if society is ready for utilitarian autonomouscars that are programmed to sacrifice themselves (including driver and passenger) in situationsthat will lead to unavoidable harm is discussed in [16] It was found that consumers approvedof utilitarian vehicles and that others should drive them but when it comes to themselves theywould prefer the vehicle to save the driver and its passenger at all costs even if it means agreater loss of life outside the vehicle Of course an impossible situation to comply to [16]
Figure 2 The trolley problem an ethical dilemma and thought-experiment first introduced by philoso-pher Philippa Foot in 1967 Actualized again by the development of autonomous vehicles Image from[3]
Platooning In the context of platooning consequences of accidents can be dire because ofthe small distances between the vehicles where an absolute minimum distance is concluded in
4
[10] to be between 12 and 2 metres The question is who is responsible for an accident themanufacturer of the system the driver of one vehicle or always the driver in the front vehicleor someone else This is an issue surrounding autonomous vehicles in general This problemcalls for safety assurance and certification of safety critical cooperating vehicles which is a goalfor SafeCOP
Sustainability can be divided into three different aspects social- economic- and environ-mental sustainability Platooning is seen as a mean for decreasing fuel consumption by loweringthe air drag and improving the flow of the traffic [10] acting as an economical and environ-mental incentive However from a societal perspective it can be seen as risky to for exampleovertake a convoy of several trucks From an environmental point-of-view the total fuel amountused for freight is still considerable even though there are savings compared to non platooningfreight
16 Delimitations
The context in this scope is limited to two vehicles and this work will thus be unable tostudy the effects of having more vehicles on the same network The tests will be performed onone of the two cars on a straight track and results will only be directly applicable to similarsystems although some generalizations for other vehicle configurations could be made and willbe discussed A general demand is that the setting in which the empirical tests will be performedmust be controlled and reproducible
The results of this study will to some extent be dependent on the platform An upscalingto an actual automotive platooning system with strict safety regulations will not be coveredalthough indications regarding the possibility of upscaling can be deduced
Once a control loss warning is given a decision regarding actions for the system-of-systemswhich is the platoon must be made As stated in [13] cooperative driving inherently forms asafety paradox where a vehicle is dependent on input from external systems (nearby vehicles)to assure its own safety which creates a system design challenge However actions taken as aconsequence of a control loss warning falls outside of the scope of this study Instead the focusis detecting instances of slip
5
2 Methodology
This study is divided into firstly a literature review and secondly an implementation phase Theliterature review will be performed to gain background knowledge within the three key themesData aggregation Multi-sensor systems and cooperation between CPS as seen in Figure 3
21 Methodology of the literature review
The methodology for the literature review is of qualititative nature The literature review placesthe benchmark and paradigm of the field and integrates this thesis to existing research Theliterature review forms a frame-of-reference and will lead to research questions being crystalized[27] which is not a numerical result but rather a qualitative value
The data collection method of the literature review will consist of the following steps
1 Article search based on keywords
2 Mapping the read articles in order to place the research of this project in a context of theexisting research a procedure proposed by Creswell [23]
3 Iterate search
4 Summarize relevant information thematically
The databases used are IEEE Xplore and ScienceDirect Articles were manually chosenbased on title and abstract for percieved relevance to this study
22 Methodology of the implementation phase
The general methodology of the implementation phase will be of a quantitative nature meaningthat measurable data is used to verify or falsify a systems functionality [27]
Having a theory in the beginning of a study means having a deductive approach on theresearch [23] The research approach of this study will be based on deductive reasoning wherea theory is tested on generally large data sets and conclusions are drawn based on the collecteddata The investigation will be of confirmatory nature with the aim of confirmingdisconfirminga theory which will be formulated based on the literature review
The methodology of the implementation will be non-experimental empirical The collectionand analysis of data is performed in order to evaluate in this case a technology The data collec-tion will be made through structured observationsmeasurements performed on a demonstratorto produce numerical data
Finally the external validity if the results can be generalized for similar systems and internalvalidity if the study measures what it says it will measure will be discussed
6
3 Literature Review
The theoretical framework will consist of three main areas which will be covered in the LiteratureStudy section of this report They are identified as
bull Safe cooperation between CPS related to SafeCOP
bull Data aggregation in multi sensor systems algorithms architecture and applications forboth real time and non real time
bull Advanced driver assistance systems
These three areas together make up the theoretical framework for the implementation phaseA depiction of the general themes of the literature study are shown in Figure 3
Figure 3 Depiction of general themes and selected sub-categories
31 Data aggregation
Data aggregation is a process where one representative value is chosen from a larger data-set[46] The purpose is often to discover patterns in data [21] and also to save energy and transfertime in a multi-sensor network [52]
311 Data Aggregation Theory
A Data Aggregation Process (DAP) is in [18] described as a process with raw data as input anaggregation function and an output of aggregated data Aggregation functions can be of typesAveraging Conjunctive Disjunctive or mixed [14] The application of aggregation functionscan be to reduce noise summarizefuse data or to make decisions [51] To fuseintegrateinformation the process is generally to acquire data preprocess fusion execution During thefusion redundant information can be removed or multiple sources can be used to complementeach other Data to be fused can be for example numerical data or fuzzy sets where a variablesmembership of set is not binary but rather rdquofuzzyrdquo [51]
In order to save energy and transfer time in a multi-sensor network a data aggregationapproach is advantageous Instead of sending data every time it is available it can be aggregatedand transferred as a representative value instead This is generally seen as increasing the valueof the data [52]
Data aggregation in sensor networks can be seen as being of either flat or hierarchicalstructure A flat structure means all sensor data is combined into a global estimate In a
7
hierarchical structure sensor data is combined in clusters which results in a local estimatecreated in the cluster head The local estimate is then fused to obtain a global estimate [49]
Applications utilizing data aggregation was found by the authors in the survey study in [18]to vary in among other things their way of acquiring the raw data from for example sensorsOne way is by rdquopullrdquo where the aggregator requests data from nodes One way is by rdquopushrdquowhere the sensorsnodes push data to the aggregator [18]
As mentioned a Data Aggregation Process increases the value of the information it analysesThe notion that information holds a value has been a topic within economics but withingsensor networks the studies are limited according to Aggregation takes time which in a worstcase scenario could render the aggregated information obsolete This is referred to as TimeDiscounting when information loses value over time until it has no value [52]
312 Data Aggregation in Multi-sensor Systems
One practical application of Data Aggregation theory is that of Multi-sensor fusion This is asynergistic combination of sensor data in order to get more reliable data than would be possiblewith one sensor Multiple sensors also allow for having redundancy in the system in case offailure [35]
All in all the advantages can be said to be [35]
bull Redundancy increases reliability in case of failure and reduce uncertainty
bull Timeliness
bull Complimentary information Synergistic effect
bull Less cost of information
Aggregating or fusing data in multi-sensor systems can either refer to combining data fromdistributed sensor nodes at one moment of time or to data from one sensor at several instancesThis aggregation provides a synergistic effect providing more valuable information than theindividual sensors alone thus leading to systems being able to operate more autonomously evenin dynamical environments Also having different types of sensors can allow for sensing evenin different operation conditions for example day- and night conditions [35]
Sensor networks and rule-based systems are the most common application for multi-sensorfusion and allow for hierarchical structures [35] where the decision-making can be delegated tothe lower level nodes forming a decentralized or distributed architecture On the other side ofthe spectrum is the centralized architecture where the sensor nodes are providers of data for acentral intelligence which processes the data This central unit can for example be located in acloud [45]
Applications Although originally emerging for military purposes multi-sensor fusion nowfinds applications within environmental sensing (Wireless Sensor Networks WSNrsquos) medicaltechnology autonomous robots and the automotive sector [43]
One of the important applications for sensor data fusion is said to be that of mobile robotsHaving multiple sensors allow them to gain perception and achieve path planning and obstacleavoidance [36] Having real-time knowledge of a mobile robots position is essential howeverGPS is intermittent and low frequency thus requiring the combination with other sensors in adead-reckoning system In [17] angular wheel encoders measuring wheel velocity normally usedfor ABS breaking is proposed as these extra sensors A conclusion was that combining all fourwheelsrsquo sensors significantly increased the positioning accuracy during GPS blackouts comparedwith only using the sensors of the two back wheels
Another application is mobile sensing where large amounts of data are gathered by partici-pants mobile devices (smartphones) Because of available GPS this is useful for geo-referencing
8
data [25] A reduction of the amounts of data is however necessary In [25] a vehicular sens-ing application for mapping roughness of road surfaces is proposed The application utilizesaccelerometer data collected from vehicles via mobile devices and applies an architecture of lay-ers of aggregation to reduce the size of the data The aggregation is both spatial and temporalie data points varying in geographical location and time
Another central area of multi sensor systems where data aggregation gives value to thesystem is in that of Wireless Sensor Networks A WSN consists of several sensor nodes thateach transfer data wirelessly to a sink node By using data aggregation the data from thesensor nodes are aggregated into one value This opens up for reducing traffic on the networkcompared to if the raw data from all sensors would be transmitted [31]
Sensor systems of this kind can be cluster based both statically clustered and dynamicallyclustered In the case of static clustering the sensor nodes transmit their data to a cluster headwhich aggregated and sends the aggregated data to the sink The cluster head is predetermined[31]
Dynamically clustered networks decide which node is the cluster head depending on targetssuch as closeness to the sensed event This reduces the amount of hops the data must travelto the sink A hybrid approach between statical and dynamical clustering is proposed in [31]where
Likewise in a hierarchical aggregation technique local aggregations are parallelly createdlocally in the cluster heads and are sent to the sink for global aggregation [49]
In [49] an algorithm that adaptively decreases the weight of nodes if they fail is proposedand also adaptive sampling when there are large fluctuations in the aggregated values whichindicates an event of interest the sampling rate is increased
Architectural Aspects Where before one sensor whas linked to a specific application in amodern car there is a growing interconnection of functions One sensor can deliver environmentaldata to several applications There are savings in using sensors for more applications forexample using the wheel ABS-sensors for controlling the transmission [24] Driver assistanceand safety functions are the largest factor for this growing interconnectivitynetworking ina car [24] Sensor data fusion is applied in intelligent transportation systems where speedand position data can be fused for vehicle tracking purposes [36] The consequences of thisinterconnectivity The reduction of the number of physical components as a result of reuseof sensor signals generally leads to an increased safety however a failure of one sensor canhave serious consequences Furthermore the development becomes more difficult and calls forcomputer aided architecture design and development as proposed in for example [13] [24]
Just like one sensor can be used for several applications several sensor signals can be usedin one application The sensor data is reduced by model based filtering (for example ExtendedKalman Filters EKFrsquos) adaptive filtering or fusion The consequences as listed in bullet listedin the beginning of Section 312
Multi-sensor fusion can be divided between centralized- decentralized- and hybrid architec-ture In a centralized architecture all processing of raw data happens at a central node ofthe network without preprocessing at sensor nodes This gives more raw data to the centralnode thus providing higher accuracy The bandwidth of the system is however high since moredata is transferred Also the scalability is limited in this approach since modification of thesystem requires re-optimization On the other hand a decentralized architecture provides dataprocessing at sensor level requiring less bandwidth and offering more scalability A comparisonbetween requirement fulfillment between these approaches from [24] is shown in Table 1
9
Requirement Centralized Decentralized
No loss of information + -High degree of accuracy + -
Consistent model assumptions + -Low bandwidth - +
Homogenous processor load - +Easily modifiable - +
Table 1 Comparison between centralized- and distributed architecture for data processing [24]
To connect the raw sensor readings to what they represent in the environment in automotiveapplications the term sensor model is used It is a model of the sensor data and how it representsthe vehiclersquos environment It is made for individual sensors and currently not for multi-sensorsystems as one unit [43] The data fusion process often makes assumptions concerning how wellthe sensor model represents the real sensor data [35]
The fusing of information can be seen to take place at different levels signal level featurelevel pixel level or symbol level Data can often be fused at one or more levels Fusion on asignal level renders a signal commonly of the same form as the input but of greater qualitySignal-level fusion is often not possible if the sensors are distributed on different platformsdue to communication delays The levels are distinguished by what type of information theyproduce how the sensor is modeled and in what way the fusion increases the quality of thedata [35] If the signals are one-dimensional (they sense the same property in the environment)a weighted average can produce a more reliable output by making sure all sensors contributeto the fusion but to a degree decided by the confidence in the data [26] Whereas if the signalsare multi-dimensional a Kalman filter approach can be used [35]
An architecture for fusion of environment sensor data for ADAS systems is proposed in [24]where the levels sensor level fusion level and application layer are proposed since processing ofsensor data is application dependent This allows for adding new applications without alteringthe lower levels (filters and fusion) [24]
32 Advanced Driver Assistance Systems (ADAS)
Many vehicle safety systems to improve stability and grip on cars have been introduced in thelast thirty years such as Anti-Lock brakes (ABS) stability controllers such as Electronic StabilityControllers (ESC) and are commonly known as Advanced Driver Assistance systems (ADAS)[12] An ESC system is commonly consisting of sensors steering wheel angle acceleration sensors(dual axis) and angular velocity (one axis) and wheel velocity sensors [44]
The area of V2V- and V2I communication are seen as technologies that can enable furtherdevelopment of ADAS but they are constrained by accuracy reliability and delays The delaycan generally be contributed to the fact that the event of breaking is noticed by measuring thedistance to the preceding vehicle where a faster alternative would be to wirelessly transmit thebreaking signal of the front vehicle [10]
The advanced safety systems save lives but increases the bus load and how many ECUrsquos areneeded thus increasing costs Efforts are therefore made to merge and re-use sensor informationOne method is that of sensor fusion merging sensor data at subsystem-level that can be re-used For example clustering inertial sensors closely together and integrating them to the sameECU In this way they can be housed together saving cabling collecting the signals allowingfor synergistic processing for example via model-based algorithms [44]
10
321 Slip detection and control
The contact points between the car and the road surface is the key factor causing the dynamicalbehavior of a car ie the source for forces and torques generated [12] Modeling vehicle-grounddynamics is complex because of parameters such as tire body and soil properties [32]
Slip is seen as the relative motion between the tyre and the road surface the vehicle moves onSlippage of wheels can refer to either longitudinal slip which occurs in the forwardbackwarddirection of the wheel velocity while lateral slip is orthogonal to that of longitudinal slip [37]
Slip is a common occurrence of mobile robots especially when taking sharp turns [37] Thismakes control and positioning of the system difficult which makes an early detection of slip to beessential In [28] a slip detector is implemented on a mobile robot in order to switch between twoKalman filters one for when the robot is slipping and one for when it is not slipping The slipdetector compares sensed velocity from an accelerometer to the wheel velocities A differenceover a certain treshold is considered as a slip and the threshold is decided experimentally [28]
Figure 4 Illustration of lateral and longitudinal direction of slip
Modern cars have ABS systems for detecting and controlling wheel slip this in order toavoid the wheels from locking when breaking hard If the wheels lock the vehicle will startslipping losing the side force causing it to stay on the road but also losing the longitudinaltraction Longitudinal traction can also be lost when the wheel gives too much driving torquecompared to the road friction which means it often happens on wet or icy road surfaces [33]
Strategies for slip detection and control depends on the vehicle and how many wheels aredrivennot driven Generally in order to control the slippage two variables needs to be sensedon the vehicle vehicle velocity and individual wheel velocities [55] Slip ratio is defined ashowever this does not apply if all wheels are individually actuated a so called All-wheel drive(AWD) vehicle
Estimating the slip ratio has been researched in recent years [57] One input that is necessaryis the vehicle speed as mentioned above This can be measured by either inertial sensors [44]such as a gyroscope or integration of accelerometer data Alternatively it can be acquired bymeasuring velocity on a non-driving wheel [57] Other means of measuring operational velocityof the vehicle exists such as GPS or visual sensors but these are not fast enough for real-timeslip detection and control [34] Generally obtaining the vehicle speed directly is not practicalaccording to [33] It is instead proposed to be extracted from more easily obtained data suchas wheel torque or wheel speed [33] One approach for estimating vehicle velocity is an adaptivenonlinear filter where the estimation is based only on wheel velocity data [11]
Another approach is to estimate the slip ratio using Extended Kalman Filter (EKF) such asin [57] where the more measurable quantities torque and individual wheel velocities are fused toestimate the slip ratio However Kalman filters can result in high transient errors [11] In [53] asimilar approach is used but fusing IMU data of the a small ground robotrsquos forward velocity andthe front wheels velocities from encoder data Combining measurement data with a dynamicvehicle model in a EKF in order to detect immobilization (slipping) of the ground robot Thealgorithm successfully detected 20 instances of immobilization with an average detection time
11
of 04 s [53]In [39] the identified problem of wheel slipping when performing odometry on mars rovers
is discussed It is stated that as long as at least one wheel on the individually all-wheel driverobot has traction the position of the robot can be known However if all wheels slip All-wheelslippage (AWS) this is a condition that needs to be recognized The most efficient AWS-indicators was said to be compare encoder readings with each other compare encoder readingswith gyro current indicator where motor currents are measured and Acceleration Indicatorwhere encoder readings are compared to an accelerometer [39]
With introduction of more powerful electric vehicles on the market slip detection and pre-vention gets easier than with combustion motors This is because the torque response of anelectric motor is significantly faster than that of a combustion engine [57]
In [55] a fuzzy controller is designed to control the desired slip of one wheel also proposingan algorithm detecting sensor faults In another article [33] another longitudinal slip controlleris proposed where four independently actuated wheels are controlled to detect longitudinal slipand do a controlled re-adhesion to the surface
33 Cooperation between CPS
Moving the paradigm of CPS from a single system interacting with its surroundings to insteadhave several CPSrsquos interacting with each other means a transformation towards system-of-systems This would lead to a society where more and more machines cooperate and communi-cate without human intervention M2M V2V etc The move of perspective from one node andits interactions with its physical surroundings to instead focus on a situation where nodes makedecisions based on local knowledge requires decentralization of decisions and design of localizedalgorithms where CPSrsquos make decisions based on local knowledge [50]
Currently existing M2M applications commonly utilize a central node for collecting dataand making decisions a sink node The data is collected by sensors and is then bounced tothe sink via ex single hop or multi hop communications This is called a networked controlsystem where the network is a medium between computation and physical entities Howeverthe goal according to [50] is to instead let the network itself be decision maker and actuator infuture applications These large scale CPS have the challenge of implementing data processingfusing multiple sources of data and different types of data while also maintaining security andscalability [50]
One application of this M2M technology is stated to be Intelligent Transportation whichcould bring safer greener and more efficient transportation [50] A cooperative driving systemas mentioned in [13] allow vehicles to adapt their motion to the traffic situation they are inThis by using information which the vehicles communicate to each other (V2V) or from roadinfrastructure (V2I) A vehicle generally has little influence over nearby vehiclesrsquo behavior whichmay or may not follow traffic rules but it has the ability to broadcast information about itselfThus leaving the decision making to the surrounding vehicles [13]
Vehicular ad-hoc Networks (VANETS) is a term for collaboration between vehicles (or ve-hicles to road infrastructure) in a temporary distributed network The purpose is to providedrivers with warnings about critical situations for example approaching emergency vehicles orcollision warnings [7]
Data aggregation enables for M2M applications to have low cost and consume less powerwhich could be an issue for large scale applications Cloud computing can also enable scalability[50]
SafeCOP focuses on CO-CPS communicating via wireless channels and safety assurancethat CO-CPSrsquos safety requirements are not compromised Since platooning or other M2MV2Vsituations means that one vehicle may influence the behaviour of other vehicles which meansthat functional safety must be guaranteed (absence of unreasonable risk caused by malfunc-tioningundefined behaviour of the system) Guaranteeing functional safety for automotive
12
Figure 5 Depiction of V2V (M2M) and V2I communication [38]
systems with M2MV2V components means a progression beyond the current state-of-the-artof automotive functional safety is necessary [7]
It is stated that a cooperative driving context should be able to judge which of its con-stituents are working as intended and use that as a basis for decisions [13]
A cooperative driving system consists of tasks of both high criticality and low criticalitythis affects the architecture of the system [13]
331 Concurrency and Isolation
Concurrency refers to the execution of two tasks at seemingly the same time Conflicts canoccur due to dependencies [9]
The avoidance of two concurrent transactions (readwrite) interfering with each other isreferred to as isolation [9] A full isolation requires more performance which is not alwaysapplicable in embedded systems deadlines can be missed due to strict concurrency control [20]A relaxation of the requirements of isolation has therefore been proposed [19]
Since a real time system monitors the environment having data that corresponds to theactual environment is of highest importance This is referred to as temporal consistency [18]
A real-time system can have different strictness with regards to temporal consistency andare characterized as
bull Soft
bull Firm
bull Hard
For a hard real time system outdated data is not an option while for soft real time systems itcan be tolerated at the cost of usefulness [18]
34 Conclusions from Literature Review
Here some important conclusions found in the literature review are highlighted
bull Driver assistance- and safety functions are the largest factor for the growing interconnec-tivitynetworking in a car [24] It is important to merge and re-use sensor information[44]
bull There are savings in using sensors for more than one application for example using thewheel ABS-sensors for controlling the transmission as in [24] or for vehicle localizationalgorithms seen in [17]
13
bull Obtaining the vehicle speed directly is not practical It is instead proposed to be extractedfrom more easily obtained data such as wheel torque or wheel speed [33]
bull Aggregation of sensor data provides a synergistic effect providing more valuable informa-tion than the individual sensors alone Consequently CPSrsquos utilizing this fact are able tooperate more autonomously even in dynamical environments [35]
bull If the signals are one-dimensional (they sense the same property in the environment) aweighted average can produce a more reliable output by making sure all sensors contributeto the fusion but to a degree decided by the confidence in the data [26]
bull The area of V2V- and V2I communication are seen as technologies that can enable furtherdevelopment of ADAS but they are constrained by accuracy reliability and delays Thedelay can generally be contributed to the fact that the event of breaking is noticed bymeasuring the distance to the preceding vehicle where a faster alternative would be towirelessly transmit the breaking signal of the front vehicle [10]
14
4 Implementation
The second part of the thesis is the implementation part The goal for the team of five is toproduce a demonstrator for platooning to stand as basis for the individual research as well asbeing a platform for future research within platooning Intelligent Transport andor ADAS thatcan be used by Alten The individual focuses for the five members have been
bull Robust communication for mixed criticality systems
bull Modeling and control of ADAS
bull Lane detection and lateral control
bull Longitudinal control
bull In this report data aggregation strategies for sensor data in time sensitive applicationswill be investigated and tested on a use case
41 Implications of convoy driving
Drivers of heavy duty vehicles know from experience that driving closely to the preceding vehicleresults in lower air drag and leads to having to give less gas to propel the vehicle The fact is thatdecreasing the distance between heavy-duty vehicles (HDVrsquos) results in lower fuel consumptionand less congestions on the roads The advantage of automating the process of platooning in anintelligent transportation system is an improved flow of traffic affecting even private motoristson the road [10]
However linking several heavy machines in high speeds close to eachother leads to a difficultdynamic Small steerings of one vehicle immediately affects the vehicles in the chain [10]
Existing technologies as well as emerging ones are needed to enable platooning Such asimproved use of sensors wireless communication and advanced driver assistance systems Keytechnologies are the V2x technologies In normal adaptive cruise control there is a delay intro-duced because deceleration of the preceding vehicle is detected by sensors on the vehicle behindand needs processing in order to take action and break An advantageous approach would beto instead wirelessly transmit for example the breaking signal from the front car causing theback vehicle to take action earlier without having to wait for its sensors to detect the actualvelocity decrease [10]
In [10] the scenario of two identical HDVrsquos in a platoon is studied and the safe set of distancesbetween the vehicles is experimentally investigated in the case of collaborative breaking Thecollaboration means that the vehicles can access each others velocities accelerations and controlinputs Varying intermediate distances as well as reference velocities are examined with full sizeScania HDVrsquos It is stated that having varying breaking capabilities in the platoon affects thissafe set The conclusion as mentioned earlier in this report is that two HDVrsquos can keep 12m but the recommendation is 2 m when a worst case communication delay of 500 ms is takeninto account [10]
42 Use Case Vehicle Control Loss Warning
The technology of aggregating multi-sensor data in a time sensitive system will be verified ona use case For this thesis the use case is that of rdquoControl loss warningrdquo from SafeCOP Thesystem is to produce a warning signal to nearby vehicles when something affects the vehiclersquosfunctionality and thus its ability to be part of a platoon [8] In this case slip of one or morewheels will be investigated
The ABS functionality of a modern car assures traction to the road The implementationpart of this project will look at the detection of slip however not how it can be prevented Theinconsistence between wheel velocities and the vehicle velocity is referred to as slip
15
The use case is aimed towards real trucks but for the scope of this project two modifiedRC-cars will be used as a demonstrator The cars are identical and are driving autonomouslyon a test track indoors The cars utilize four-wheel-drive and unlike full sized trucks are purelyelectrical since the demonstrator is created for indoor usage However there exists communi-cation between the secure sides of the two vehicles the subject of a related thesis of anothermember of the project team which enables research of intelligent transport systems and col-laboration within platoons It also allows for warnings to be sent between the front and backvehicles
The basis for this warning will in this study be an aggregation algorithm of wheel sensordata in order to detect a slip
Figure 6 Control loss warning
43 Requirements
The requirements of this system is separated into those regarding the use case and thosereferring to the global convoy driving context
431 Requirements for Use Case
As described in Section 13 the use case for the demonstrator to be evaluated for is that of acontrol loss warning sent to the vehicle behind
1 The vehicle behind should receive the warning within a time frame where it has a chanceto fully stop to avoid rear ending collision
2 Omission of warning should not occur when aggregated data indicates slip of wheel
432 Requirements for Convoy Driving
1 Two vehicles shall be able to keep a distance of 50 cm between them
2 The demonstrator shall be able to safely detect and switch between platooning and non-platooning state
3 The demonstrator shall function indoors at flat ground
4 Both vehicles must keep within the lanes of the test road at all times but should notdeviate from the center line more than 2 cm
5 An object on a colliding course shall be detected by the front vehicle
6 Both vehicles shall be able to perform a full stop within 01 seconds
44 Hardware
The main platform for this thesis is the Zynq-7000 Both vehicles will house this component onan interfacing board either Zedboard or the more industrially adapted development platformthe EMC2-DP board and be connected each other wirelessly in order to share traffic data andthus forming a small demonstrator of an Intelligent Transport System with V2x capabilities
16
441 Board
The main processing component is the Software-on-Chip Zynq 7000 which contains dual-CoreARM9 processors as well as programmable logic (PL) in the shape of a Field ProgrammableGate Array (FPGA) with an AXI bus which forms an interface to between the PL and theprocessor side (PS) [4] Using the ARM TrustZone architecture the two cores are partitionedinto a non-secure and a secure virtual CPU The switching between non-secure and secure zoneis performed by a monitor The monitor is responsible for saving the state of the zone it isswitching from and loading it when reentering [56]
442 Field Programmable Logic - FPGA
In the automotive industry the increasing use of sensors and the signal processing pertainingto these continues to grow more complex Algorithms running on hardwired logic insteadof software-based solution is likely to have better timing performance however resulting inless flexibility when designing and redesigning It is possible to instantiate a microprocessoron the FPGA via a so called IP-block which are provided by core vendors such as ARM orby third parts These embedded processors are stated to be suitable for for example sensorconditioningpre-processing of sensor signals [48]
This project utilizes the design software Vivado provided by Xilinx where block IPrsquos canbe instantiated with following synthesis and verification of the design
The design of the FPGA used in the demonstrator can be seen in Appendix 6
443 Car platform
Two regular 18 scaled RC cars were modified and equipped with sensors for the purpose ofdriving autonomously in a platoon on an indoor track
Figure 7 Car platform before adaptation to autonomous driving (left) and mounting of one encoderon wheel axis (right)
444 Sensors
bull LIDAR for distance measurement and longitudinal control
bull Camera for lane detection and lateral control
bull Rotary encoders for individual wheel velocity measurements as seen in Appendix 6
bull ADC conversion of battery voltage
Initial system tests were performed to look at the sensor signals and to verify that the systemlogging via dualOS-communication works The car was run at full speed intermittently withthe sensors being sampled every 25 ms
17
Figure 8 Voltage fed from batteries at full gas test
Figure 9 Raw velocity data of driven wheel at full gas test
45 Software
Driven by the need to lessen the costs of embedded systems the phenomenon of Mixed Crit-icality systems have emerged The idea is to share system resources (memory processor etc)amongst both critical and non-critical tasks An isolation is however necessary either temporal(timesharing) or spatial (a physical division of trusted and non-trusted hardware) The conceptof virtualization allows for different operative systems to execute on the same hardware platformusing a so called hypervisor
Figure 10 Hypervisor for safe and separated vehicle systems [22]
In the demonstrator of this thesis on two ARM cores of the Zynq-7000 runs two concurrentoperative systems coordinated by a Virtual Machine Monitor [56] One open source RTOSFMPToppers and one Linux GPOS The idea is to separate critical tasks such as steeringbraking and controlling the vehicle from non-critical tasks thus forming a Mixed Criticalitysystem
451 RTOS ToppersFMP and SafeG
Toppers (Toyohashi Open Platform for Embedded Real-Time Systems) is an RTOS providingsupport for multi-core processors and providing APIrsquos for assigning tasks to specific processorsduring run-time Provided is also the software for concurrently running a Real-Time Operativesystem alongside with a GPOS on the same processor via the virtual machine monitor SafeG
18
The RTOSrsquos real-time requirements are however guaranteed despite the timeresource sharingwith another operative system [5]
452 GPOS Linux Digilent
An embedded Linux solution targeting Zynq-7000 and Digilent FPGA devices including devicetree Linux kernel and root file system In this project the Linux represents the non safetycritical part of the system
453 Dual-OS communication
As mentioned the Virtual Machine Monitor developed by FMPToppers SafeG allows forrunning both safety critical and non safety critical applications on the same platform butisolated This isolation however makes critical zones unable to communicate with non criticalzones Therefore inter-OS communication is enabled via a dual-OS communication mechanismwhich utilizes shared memory slots This allows for communication between secure and non-secure software [56]
Figure 11 Function of virtual machine monitor SafeG provided by FMPToppers which acts as a safeseparation between GPOS (Linux) and RTOS (FMPToppers)
454 SoA and SHAPE
For communication between the nodesboards in the distributed system that is the two-carplatoon the existing Service Oriented Architecture (SoA) based platform called SHAPE3 isused SHAPE implements a middle layer of software which enables a cloud approach betweenthe nodes of the system where local knowledge for the system-of-systems is shared and storedSHAPE allows for several master-nodes to be present [41] but with different priorities [15]The master node with the highest priority is responsible for registering active services (pro-ducerconsumer) [15]
The approach of implementing a middleware a layer of software in a distributed systemallows for abstraction to the distributiveness which means it is not obvious from the perspectiveof a userapplication developer that the system is distributed [41]
46 Software design of demonstrator
On the RTOS five cyclic tasks are running with one being a switching-task which gives timeslots to the GPOS for execution of tasks of lower criticality Each task interacts with differentperipherals andor memory Shown in Figure 12 are the tasks and a simplified depiction oftheir interaction with memoriesperipherals The task of relevance for this thesis is the DataAggregation task The cyclic tasks of the RTOS are
3An abbreviation of Self-configurable High Availability and Policy based platform for Embedded systemsSHAPE is developed by Enea for automotive project DySCAS A major goal of DySCAS was to develop middle-ware for distributed automotive systems [41]
19
Longitudinal control regulates the distance between the two vehicles by sampling the LI-DAR and calculating the output signal to the driver
Lateral control analyzes the input from the lane detection module (RaspberryPi) and turnsthe steering servos accordingly
Wheel data aggregation reads memory addresses where wheel velocity data from all fourencoders is continuously updated from the FPGA performs aggregation and thereafter com-municates with the secure-to-secure inter-vehicle communication task (the scope of a parallelthesis work)
Inter-vehicle communication See Figure 12 for overview where BT is the switching taskof low priority switching between the two operative systems
Switching task switches between RTOS and GPOS a low priority task
Figure 12 The six tasks executed on RTOS and simplified depiction of peripherals interacted withHighlighted are the tasks and interactions of highest relevance for this thesis
47 Slip detection on the demonstrator
Relating to the use case of control loss warning where the system is to produce a warning signalto nearby vehicles when something affects the vehiclersquos functionality and thus its ability to bepart of a platoon [8] this thesis chooses to investigate the demonstrator in the context of slip
Slip is commonly measured by quantity slip ratio used in for example ABS-systems and inthe demonstrator as seen in Figure 13 and is defined as in Equation 1 [1]
ρslip =vvehicle minus viwheel
vvehicle(1)
471 Related works for slip detection
As stated in the Literature Review obtaining the vehicle speed directly is not practical accordingto [33] It is instead proposed to be extracted from more easily obtained data such as wheeltorque or wheel speed [33] Furthermore visual sensors such as GPS or camera of which thelatter the demonstrator in this thesis is equipped with are said to not be suitable for real timeslip detection [34] Also a GPS is disturbed by trees and buildings [29] In [30] it is however
20
Figure 13 Demonstrator car with velocity parameters marked and simplified schematic of the driveline with DC-motor drive shaft and differential gears
concluded that image based sensors can be applicable for velocity sensing in mobile robotsand automotive applications The advantage compared to encoder based solutions is that theyare not affected by slip and can therefore be used as objective vehicle velocity to detect slipSubsequently they can also detect the lateral velocity (car moving sideways) which can occurwhen slipping something not measurable by wheel encoders
In [34] only wheel encoder measurements are used for slip detection and control of arobot with individually actuated wheels which is a common setup for Wheeled Mobile Robots(WMRrsquos)
In [58] the wheel velocities are instead indirectly measured from the individually drivenwheel-motorrsquos armature currents during a slip experiment depicted in Figure 14 A compari-son between the armature currents and the wheel velocities allows for detection of slip and apredictive slip controller is also implemented to minimize the effects of the slip
A similar approach but applied on an electric railway vehicle is proposed in [54] wherearmature current is used to detect slip by finding torque differences between wheels and also toperform controlled re-adhesion to the rails The system is modeled and the results are simulatedwhich shows success in detecting small slips compared to using wheel velocity sensors [54]
Figure 14 Description of slip experiment performed in [58]
Vehicle velocity can be measured in the following ways
bull Measured on non-driven wheel [57]
bull Accelerometer integration not appropriate for low velocities [29]
bull Optical sensor [57]
21
bull Image based sensors [30]
bull GPS [17]
Or estimated
bull Using EKF based approach on individually actuated wheels [57]
Figure 15 Velocity measurements at slow speeds Comparison between integrated accelerometer dataand wheel encoder data [29]
In Section 321 some examples of applications for slip detection and slip control are de-scribed It is clear that a common application is in wheeled mobile robots (WMRrsquos) whereodometry and thus slip detection are important tools for localization of the robot The appli-cations are for example lawn mowers or mars rovers as in [39]
In [17] it is proposed to reuse the already existing angular encoders present for the ABSsystem in a normal car in order to localize the vehicle via odometrydead-reckoning The sensorsignals are fused via an EKF and experiments are performed on a real car A case where a GPSsensor is available to correct the positioning is also considered It is concluded that the use ofall four wheel sensors are necessary [17]
As stated in Architectural Aspects in the Literature Review in a multi-sensor system forsignals which senses the same property in the environment a weighted average can produce amore reliable output by making sure all sensors contribute to the fusion but to a degree decidedby the confidence in the data [26] Whereas if the signals are multi-dimensional a Kalman filterapproach can be used [35]
In [49] a problem is identified as giving less weight to faulty sensors in a widespread WSNsensing the environment The approach utilizes the concepts of adaptive weighted average andspatial correlation meaning that sensors located in the same area are expected to show similarreadings If a sensorrsquos readings deviate from nearby sensors this is said to indicate a highlikelihood of sensor failure Less weight should therefore be given to that node when processingthe data instead relying more on the neighboring sensors [49]
472 Proposed approach for slip detection on the demonstrator
In [49] each sensor is associated with an estimated weight wi which is updated every iterationof the algorithm according to
wi[t+ 1] = wi[t]plusmn∆wi[t] (2)
where i denotes the sensor and the change in weight ∆wi is given as
∆wi[t] = |τ | lowast ε (3)
22
Scaling factor ε is application dependent and chosen to assure that 0 lt ∆wi[t] lt 1 and τ is calledan adaption parameter and represents how well a sensor reading correlates to the surroundingsensors a larger value indicating lower correlation and is defined as
τi =riminus1 ri+1rk
kminus ri (4)
where ri is the sensor reading for the ith sensor and k is the number of neighboring sensors[49]
This approach of adapted weighted average will in this thesis be used as the aggregationalgorithm depicted as a funnel in Figure 16 that estimates the vehicle velocity vvehicleestbased on the individual wheel velocity readings v1 v2 v3 v4 of the four wheels The slip ratioρslip is thereafter calculated based on the estimated vehicle velocity and the individual wheelvelocities The slip ratio is compared to an experimentally set threshold in order to determineif there is an occurrence of slip on the demonstrator or not
The way-of-work for the implementation was to initially simulate slip detection with theproposed algorithm running in MATLAB on collected data from the demonstrator but after-wards The advantage of using simulations was to expand knowledge about the data and thealgorithm tuning parameters and experimenting with external velocity references After thesimulations the algorithm was implemented in real time on the RTOS of the demonstrator
The algorithm is described in C-style pseudo code as follows
23
velDataPoint Queue[10] structure to hold 10 data points
while(1)
velDataPoint dataP structure to hold velocity and weight data
insert(dataP) insert in Queue
if isFull(Queue)
for sensor 14 in newest data point
avgwin[rear] = average velocity based on 10 last data points
deltaw[rear] = abs(avgwin)
set weight attributes for last data point based on
properties of second last data point
if deltaw[rear-1] is strictly smallest of all sensors
w[rear] = w[rear-1] + deltaw[rear-1] increase weight of that sensor
else
w[rear] = w[rear-1] - deltaw[rear-1] else decrease weight of that sensor
for sensor 14 in newest data point normalize weights
wnorm = w[rear]weightsum
for sensor 14 in newest data point calculate weighted average
avg_weighted = avgwin[rear]wnorm
removeOldest(Queue) remove oldest data point in queue
Showing an implementation of the algorithm from [49] adapted for the purpose of aggregationof raw wheel data in real time filtering and outputting an estimated vehicle velocity based ona weighted average of the four wheel sensors
Since the aim is to detect differences between wheel velocities and vehicle velocity both stalland slip were situations of interest during tests Initially stalling was used during simulationsbecause of simplicity and reproducibility thereafter moving on to tests on a slippery surface forthe real-time tests
24
Figure 16 Proposed procedure showing data collection data aggregation and estimation of vehiclevelocity followed by a comparison between calculated slip ratio and a threshold in order to detect slip
25
48 Initial simulations
Initial tests were performed using four encoders mounted on the wheels of the demonstratorThe proposed approach is to use the local (individual) wheel velocity data of the four wheels todeduce a global estimate of the vehicle velocity using the adaptive average strategy for spatiallycorrelated sensors seen in [49] Depending on a sensor readingrsquos convergence with the expectedvalue for that time point the different sensors are given a weight which can be seen as levelof trustworthiness In this case it is however not the issue of faulty sensors we wish to detectbut the actual deviation of wheel velocities from the other wheels in order to adapt the globalestimation of the vehicle velocity
481 One- and two wheel stall
Per definition a maximum slip ratio is achieved when a wheel is completely stalled Theslip ratio is then = 1 Because of the simplicity and repeatability of stalling a wheel whilerunning the others an induced stall of one wheel was performed and the data was afterwardsrun through the proposed algorithm using MATLAB The full code for the simulations can befound in Appendix A MATLAB code for data aggregation
The tests consisted of the car being brought to speed while the wheels spun freely aboveground as presented in the left image of Figure 17 one wheel was then manually stalled Theresults can be seen in Section 51 Results from simulations
Regarding two-wheel stall a similar test but with two wheels being stalled at the same timewas performed The results can be seen in Section 51 Results from simulations
Figure 17 Set-up for tests Left image shows in-air suspension where manually induced wheel velocitydifferences (stalling) was performed Right image shows the demonstrator on a surface with minimalfriction on left back wheel as used in slip tests
49 Real-time implementation on the Demonstrator
The algorithm previously run in MATLAB was now implemented on the demonstrator softwarein order to provide the functionality of slip detection in real-time
491 Demonstrator Architecture
The task of Data Aggregation was implemented as a cyclic task on the RTOS sharing time withother cyclic tasks All tasks can safely share data with each other via implemented mailboxesa functionality provided by FMPToppers along with most RTOSs A sequence diagram forthe system modules and their shared data can be seen in Figure 18 where the parts of highestrelevance for this thesis are highlighted Besides inter-RTOS communication via mailboxes ademonstrator vehicle also communicates with other vehicles and infrastructure via WiFi thusforming a demonstrator of a small V2x system
26
Figure 18 Sequence diagram showing system modules and their shared data via mailboxes on theRTOS Highlighted are the modules and transactions of highest relevance for this thesis
492 Real time data aggregation on the demonstrator
Stalling On the RTOS a digital filter using the average of the ten last samples was imple-mented using a queue of data points Each structure data point is associated to four velocitiesvel1234 as well as average velocities avgwin1234 based on the 10 last data points Alsoweights w1234 and weight updates for the next iteration deltaw1234 are enclosed in thisstructure see Figure 19
An equivalent test to what is seen in Figure 20 was performed but this time with all com-putation taking place in real time on the RTOS instead of afterwards in MATLAB All wheelswere brought up to speed thereafter inducing a stall on the left back wheel (wheel number 1)The results from this test can be found in Section 52 Results from real-time implementation
Slipping Slip dynamics for a real slip on the demonstrator was investigated In order toachieve controllability and repeatability in the creation of a slip the demonstrator was partlyhindered from going forward by pressing a hand to its front while still given considerable forwardpropulsion This resulted in a noticeable slip of the left back wheel which was taped to reducefriction for the experiment as can be seen in the right image of Figure 17 An example of whata slip looks like will can be seen in Section 52 Results from real-time implementation alongsidewith results of real-time slip detection for one and several instances of slip respectively
27
Figure 19 Attributes of structure velDataPoint and illustration of the implemented queue
28
5 Results
The simulations described in Section 48 Initial simulations indicated feasibility in using theweighted average approach for estimating the vehicle velocity without using too much compu-tation time The algorithm was thereafter implemented as a cyclic task on the RTOS with arecorded worst-case-execution time of 4micros measured by a high-resolution hardware timer over6351 executions of the data aggregation task This result is only valid for the target hardwarebut indicates that the aggregation strategy is not to heavy to be run on the RTOS of a similarsystem
In this section follows a presentation of the results from simulations and real-time imple-mentation respectively
51 Results from simulations
Here follows results from the tests where data was collected from the wheels during one- and two-wheel stalling and the algorithm applied afterwards in MATLAB The output of the weightedadaptive average is compared to a regular average value of all four wheels
511 Simulated aggregation during one-wheel stall
From the graph seen in Figure 20 it can be noted that the vehicle velocity estimation usingthe adaptive average approach results in the estimation coinciding more to the other backwheel which is not stalled v2 The reason for v2 also being slightly affected by the stall is thedifferential gear between wheel 1 and wheel 2 as seen in Figure 13
Figure 20 One-wheel stall test showing that the weighted adaptive average follows non-slipping wheelsmore because of their correlation to the other wheel velocities
512 Simulated aggregation during two-wheel stall
During a two-wheel stall it was obvious that this time fewer wheels were coherent to eachother with regards to velocity and thus the adaptive average approach produces a less valuableestimate of the vehicle velocity as seen in Figure 21 Both averages weighted adaptive andregular are compared to a reference average which is a purely hypothetical situation where thesystem would know which wheels are slipping and therefore exclude them from the averageHaving a higher number of non-slipping velocity references clearly results in a smaller differencebetween the reference average and the weighted adaptive average as seen in the right image of
29
Figure 21 Two-wheel stall test showing the impact that the number of non-slipping velocity referenceshave on the weighted adaptive average as compared to a hypothetical reference average
Figure 21 Potential sources for these velocity references that could be used in the demonstratorare discussed in the Discussion section of this report
52 Results from real-time implementation
Digital filtering was applied during all tests The filtering used an average of the ten last datapoints in the queue for each wheel The filtered and unfiltered velocity data of one wheel loggedfrom the RTOS can be seen in Figure 22
521 Real-time aggregation during one-wheel stall
Applying the proposed algorithm during a one-wheel stall just like the one seen in Figure 20rendered the results in Figure 23 when run at a cyclic period of 35ms It can be noted in themiddle graph of 23 that the weighted average produces a vastly different output compared tothe normal average during the slip starting at approximately the 100th sample coinciding morewith the non-stalled wheels than the normal average does
Figure 22 Digitally filtered and unfiltered raw velocity data from one wheel encoder with filteringperformed on the RTOS
522 Real-time aggregation during one-wheel slip
Moving onto slip an example of what a one-wheel slip looks like on the demonstrator can beseen in Figure 24 It is clear that the front wheel pair wheel 3 and wheel 4 show coherencyto each other while the back wheel pair deviate noticeably with one spinning faster and onespinning slower than the front wheels Wheel 1 having next to no traction to the surface spinsfreely resulting in the differential gear giving less torque to wheel 2 which drops to almost
30
Figure 23 One-wheel stall test with algorithm and filtering implemented in the RTOS
zero velocity Figure 24 also shows the weighted average algorithm producing a result morecorrelated to the non-slipping wheel pair
Figure 24 Slip dynamics during a one-wheel slip on the demonstrator showing the effect of thedifferential gear
As stated in the research questions the approach should be tested over several instances ofslip to determine a ratio of successful slip detection The introduction of a threshold value forslip ratio over which a wheel is said to be slipping produced the binary result of simply slipor no slip that can be seen in 25 The threshold was in this case experimentally decided to beρslip gt 08 to minimize the number of false positives Testing over several slips the algorithmsuccessfully detected all seven instances of slip as can be seen in Figure 25
31
Figure 25 Algorithm applied on a sequence of seven slips successfully detecting all instances of slip
32
6 Discussion and Future work
Using the described approach of adaptive average to estimate the vehicle velocity of the existingdemonstrator there is currently no way to get an objective measurement of the vehicle velocityto be used for comparison Instead it is assumed that the wheels with traction to the surfaceare a better representation of the vehicle velocity than wheels that are slippingndash a hypothesis that would be of interest to verifyfalsify using an objective velocity reference
It can also be discussed which wheel is most trustworthy in a slippage situation when itcomes to reflecting the actual vehicle velocity In the case of the left back wheel being thesubject of slip the front pair speeds up It should be investigated whether the right back wheelor the two front wheels are more representative of the vehicle velocity in this situation
For a better estimation of the vehicle velocity in general an objective velocity reference isneeded As previously stated in [39] all-wheel-slip for a WMR with individually actuated wheelsis determined to best be sensed by encoder readings together with other velocity references Herestated in order of preference [39]
1 Other encoder readings
2 Gyro data
3 Current indicators
4 Accelerometer data
The extra velocity reference could also be a GPS sensor often used in odometry applicationsgiven that the application can be run outdoors However the low update frequency of a GPScould pose a problem for the slip detection depending on the requirements of the system Animage sensor or camera as in [30] is also a possibility as is an accelerometer An accelerometeron the demonstrator could give the mutual benefit that a non-slipping wheel could be usedto counteract drift of the accelerometer while the accelerometer provides an extra input tothe vehicle velocity estimation Furthermore the demonstrator is already equipped with acamera and image analyzing software located on a Raspberry Pi-module making it an optionworth trying Using current sensors would not be of use for the demonstrator in questionbecause it would require extensive modeling having to consider both three-phase currents andthe differential gears dividing the torque from one central motor to the wheels Consequentlyderiving the individual wheel velocities from this data would be an unnecessary hassle
In conclusion further additional velocity references to possibly be used in the demonstratorwhen looking at what is used in related works and thinking freely could be
1 GPS (as in [17])
2 Camera (as in [30])
3 Accelerometergyroscope (as in [39])
4 More wheel pairs (Especially advantageous for heavy-duty trucks which often have morethan two wheel pairs)
5 Other vehicles (Co-operation)
Using broadcast velocity data from other vehicles to form a cooperative context would bethe most innovative approach in line with the current paradigm shift into systems-of-systemsand cooperative CPS discussed in Section Cooperation between CPS The information to beshared between the vehicles could be either an estimated vehicle velocity or the individual wheelvelocities In the latter case leaving the choice of aggregation strategy to the receiver but alsocausing more data to be transferred over the V2V channel ndash a trade-off to take into consideration
33
The alternative of using this cooperative velocity reference is however only applicable when oneor more vehicles have agreed to form a platoon together and to share data To blindly trust anearby vehicle not being in a committed platoon with you could result in omission or wrongfulcommission of the slip detection which in its current state should not be considered a hardrequirement but rather a complement to a human driver
The contribution of this thesis also includes element of real time data aggregation not onlylimited to the application of slip detection It has been shown that real-time data aggregationof multiple sensors of the demonstrator is possible directly on the RTOS and this is not limitedto wheel sensors Using the sensors already available and possibly adding more will give morefunctionality
The usage of real-time databases is becoming more common in embedded systems Usingsuch a database in future versions of the demonstrator would be advantageous since it wouldallow for the aggregation to be performed in the cloud also protecting the data from malfunc-tioning application software An RTDB guarantees timeliness which could improve the accuracyand reliability of the proposed approach The demonstrator is prepared for including a RTDBby having functioning dualOS-communication to transfer sensor data from the RTOS to theGPOS side which can then be connected to a real-time database as a service in the existingservice oriented platform SHAPE something SHAPE is already prepared for
Accuracy of proposed approach Since the vehicle velocity output from the proposed al-gorithm is an estimation the slip ratio is not exact However the approach could constistutea cheap and simple way of detecting slip mainly in smaller autonomous applications but withimplications that with usage of extra velocity references it could also work in full size appli-cations or other types of vehicles The accuracy of the proposed approach is not only limitedby external factors such as vehicle type number of wheels or transmission system It is alsodependent on internal factors within an embedded system such as how the memory is handledor delays in the system Looking at the proposed cooperative context with shared velocityreferences between vehicles more delays are introduced with the communication
In hindsight the structure for velocity data should have include a fault parameter represent-ing an arbitrary uncertainty of the system The data could and should have been timestampedwhen added to the structure velDataPoint thus allowing for evaluation of timeliness
Adequacy of proposed approach The use of additional velocity references would enablereal-time detection of slippage on more than one wheel which is a necessary expansion for thefuture that needs further investigation It is suggested from Figure 21 that a two wheel slipcould be problematic for the algorithm as is The priority should therefore be to prove theadequacy of the approach for slippage on more than one wheel and also for other numberof wheels on vehicles Only the current setup of a four-wheel drive on a small autonomousvehicle running straight has been explicitly investigated together with simulated extra velocityreferences A proposed next step would be to also include the steering angle in the aggregation(easily obtainable from the control signal of the lateral controller of the demonstrator system)It could then be known when and how much the vehicle is turning Something that could allowfor slip detection even during turns when the wheels are naturally diverging in velocities
34
References
[1] (2016) ABS presentation department of electronics and communication engi-neering sri venkateshwara college of engineering httpswwwslidesharenet
RaghavendraRaghu32abs-presentation-70307206 Accessed 2017-04-27
[2] (2017a) Artemis EMC2 embedded multi-core systems for mixed criticality applications indynamic and changeable real-time environments home page httpswwwartemis-emc2
eu Accessed 2017-06-21
[3] (2017) Crowdsourcing an Ethical Dilemma blog post on crowdflower blog httpswww
crowdflowercomcrowdsourcing-ethics Accessed 2017-06-21
[4] (2017b) Design Specification EMC2-DP V2 Sundance Multiprocessor Technology Limited2015 Accessed 2017-04-06
[5] (2017) FMPToppers Product Description and Home Page httpswwwtoppersjp
enindexhtml Accessed 2017-06-04
[6] (2017) Project Overview daggers httpesmdhseprojects Accessed 2017-03-20
[7] (2017a) Technical annex safecop project specification not published Accessed 2017-02-10
[8] (2017b) Use Cases safecop httpsafecopdeibpolimiitpage_id=45 Accessed2017-01-30
[9] Adya A Liskov B and OrsquoNeil P (2000) Generalized isolation level definitions In DataEngineering 2000 Proceedings 16th International Conference on pages 67ndash78 IEEE
[10] Alam A Gattami A Johansson K H and Tomlin C J (2014) Guaranteeing safety forheavy duty vehicle platooning Safe set computations and experimental evaluations ControlEngineering Practice 2433ndash41
[11] Amiri M and Moaveni B (2012) Vehicle velocity estimation based on data fusion bykalman filtering for abs In Electrical Engineering (ICEE) 2012 20th Iranian Conference onpages 1495ndash1500 IEEE
[12] Arat M A and Taheri S (2014) Adaptive vehicle stability control by means of tireslip-angle feedback In American Control Conference (ACC) 2014 pages 2365ndash2370 IEEE
[13] Behere S Torngren M and Chen D-J (2013) A reference architecture for cooperativedriving journal of Systems Architecture 59(10)1095ndash1112
[14] Beliakov G Pradera A and Calvo T (2007) Aggregation functions A guide forpractitioners volume 221 Springer
[15] Bergman J (2016) Policy Assertions for Web Services in Automotive Systems Mixed-Criticality and Real-Time PhD thesis KTH
[16] Bonnefon J-F Shariff A and Rahwan I (2016) The social dilemma of autonomousvehicles Science 352(6293)1573ndash1576
[17] Bonnifait P Bouron P Crubille P and Meizel D (2001) Data fusion of four abs sensorsand gps for an enhanced localization of car-like vehicles In Robotics and Automation 2001Proceedings 2001 ICRA IEEE International Conference on volume 2 pages 1597ndash1602IEEE
[18] Cai S Gallina B Nystrom D and Seceleanu C (2015a) Technical report
35
[19] Cai S Gallina B Nystrom D and Seceleanu C (2015b) Trading-off data consistencyfor timeliness in real-time database systems In 27th Euromicro Conference on Real-TimeSystems Available from httpwwwesmdhsepublications3969-
[20] Cai S Gallina B Nystrom D and Seceleanu C (2016a) Flexible verification oftransaction timeliness and isolation Technical report Available from httpwwwesmdhsepublications4276-
[21] Cai S Gallina B Nystrom D and Seceleanu C (2016b) A formal approach forflexible modeling and analysis of transaction timeliness and isolation In 24th InternationalConference on Real-Time Networks and Systems
[22] Cresswell L (2017) Separation sakrar uppkopplade bilar Elektroniktidningen 420ndash21
[23] Creswell J W (2013) Research design Qualitative quantitative and mixed methodsapproaches Sage publications
[24] Darms M and Winner H (2005) A modular system architecture for sensor data process-ing of adas applications In Intelligent Vehicles Symposium 2005 Proceedings IEEE pages729ndash734 IEEE
[25] Freschi V Delpriori S Klopfenstein L C Lattanzi E Luchetti G and Bogliolo A(2014) Geospatial data aggregation and reduction in vehicular sensing applications the caseof road surface monitoring In Connected Vehicles and Expo (ICCVE) 2014 InternationalConference on pages 711ndash716 IEEE
[26] Hackett J K and Shah M (1990) Multi-sensor fusion a perspective In Robotics andAutomation 1990 Proceedings 1990 IEEE International Conference on pages 1324ndash1330IEEE
[27] Hakansson A (2013) Portal of research methods and methodologies for research projectsand degree projects In Proceedings of the International Conference on Frontiers in EducationComputer Science and Computer Engineering (FECS) page 1 The Steering Committee ofThe World Congress in Computer Science Computer Engineering and Applied Computing(WorldComp)
[28] Hwang W Park J Kwon H-i Anjum M L Kim J-h Lee C Kim K-s et al(2010) Vision tracking system for mobile robots using two kalman filters and a slip detectorIn Control Automation and Systems (ICCAS) 2010 International Conference on pages 2041ndash2046 IEEE
[29] Iagnemma K and Ward C C (2009) Classification-based wheel slip detection anddetector fusion for mobile robots on outdoor terrain Autonomous Robots 26(1)33ndash46
[30] Joos M Ziegler J and Stiller C (2010) Low-cost sensors for image based measurementof 2d velocity and yaw rate In Intelligent Vehicles Symposium (IV) 2010 IEEE pages658ndash662 IEEE
[31] Jung W-S Lim K-W Ko Y-B and Park S-J (2009) A hybrid approach forclustering-based data aggregation in wireless sensor networks In Digital Society 2009ICDSrsquo09 Third International Conference on pages 112ndash117 IEEE
[32] Kadmiry B (2015) Fuzzy gain scheduled ekf for model-based skid-steered mobile robotIn Automation Robotics and Applications (ICARA) 2015 6th International Conference onpages 116ndash123 IEEE
36
[33] Lam T L Qian H and Xu Y (2014) Longitudinal wheel-slip control for four wheelindependent steering and drive vehicles In Robotics and Automation (ICRA) 2014 IEEEInternational Conference on pages 5280ndash5285 IEEE
[34] Li Y P Ang M H and Lin W (2008) Slip modelling detection and control forredundantly actuated wheeled mobile robots In Advanced Intelligent Mechatronics 2008AIM 2008 IEEEASME International Conference on pages 967ndash972 IEEE
[35] Luo R C and Kay M G (1990) A tutorial on multisensor integration and fusion InIndustrial Electronics Society 1990 IECONrsquo90 16th Annual Conference of IEEE pages707ndash722 IEEE
[36] Luo R C Yih C-C and Su K L (2002) Multisensor fusion and integration ap-proaches applications and future research directions IEEE Sensors journal 2(2)107ndash119
[37] Nandy S Shome S Somani R Tanmay T Chakraborty G and Kumar C (2011)Detailed slip dynamics for nonholonomic mobile robotic system In Mechatronics and Au-tomation (ICMA) 2011 International Conference on pages 519ndash524 IEEE
[38] Ndashimye E Ray S K Sarkar N I and Gutierrez J A (2017) Vehicle-to-infrastructure communication over multi-tier heterogeneous networks A survey Com-puter Networks 112144 ndash 166 Available from httpwwwsciencedirectcomsciencearticlepiiS1389128616303826
[39] Ojeda L Reina G and Borenstein J (2004) Experimental results from flexnav anexpert rule-based dead-reckoning system for mars rovers In Aerospace Conference 2004Proceedings 2004 IEEE volume 2 pages 816ndash825 IEEE
[40] Olariu S Mohrehkesh S and Weigle M C (2013) Toward aggregating time-discountedinformation In Proceedings of the 2nd ACM annual international workshop on Mission-oriented wireless sensor networking pages 57ndash66 ACM
[41] Persson M (2009) Adaptive Middleware for Self-Configurable Embedded Real-Time Sys-tems Experiences from the DySCAS Project and Remaining Challenges PhD thesis KTH
[42] Reza Mousavi M (2017) Traditionell testning klarar inte sjalvkorande bilar Elektronik-tidningen 426ndash27
[43] Rezaei M and Sabzevari R (2009) Multisensor data fusion strategies for advanced driverassistance systems Sensor and Data Fusion
[44] REZE M OSAJDA M and Halbleiter F (2013) Mems sensors for automotive vehiclestability control applications Mems for Automotive and Aerospace Applications page 29
[45] Roman R Zhou J and Lopez J (2013) On the features and challenges of security andprivacy in distributed internet of things Computer Networks 57(10)2266ndash2279
[46] Rudas I J Pap E and Fodorrdquo J (2013) rdquoinformation aggregation in intel-ligent systems An application oriented approach rdquo rdquoKnowledge-Based Systems rdquordquo38rdquo(rdquordquo)rdquo3 ndash 13rdquo Available from httpwwwsciencedirectcomsciencearticle
piiS0950705112002171
[47] Sisto A Pilato L Serventi R Saponara S and Fanucci L (2016a) Applicationspecific instruction set processor for sensor conditioning in automotive applications Micro-processors and Microsystems 47375ndash384
37
[48] Sisto A Pilato L Serventi R Saponara S and Fanucci L (2016b) Applicationspecific instruction set processor for sensor conditioning in automotive applications Micro-processors and Microsystems 47375ndash384
[49] Sridhar P Madni A M and Jamshidi M (2006) Hierarchical data aggregation inspatially correlated distributed sensor networks In Automation Congress 2006 WACrsquo06World pages 1ndash6 IEEE
[50] Stojmenovic I (2014) Machine-to-machine communications with in-network data aggre-gation processing and actuation for large-scale cyber-physical systems IEEE Internet ofThings Journal 1(2)122ndash128
[51] Torra V and Narukawa Y (2007) Modeling decisions information fusion and aggregationoperators Springer Science amp Business Media
[52] Wang X Walden A Weigle M C and Olariu S (2014) Strategies for sensor dataaggregation in support of emergency response In Military Communications Conference (MIL-COM) 2014 IEEE pages 1120ndash1126 IEEE
[53] Ward C C and Iagnemma K (2007) Model-based wheel slip detection for outdoormobile robots In Robotics and Automation 2007 IEEE International Conference on pages2724ndash2729 IEEE
[54] Watanabe T and Yamashita M (2001) A novel anti-slip control without speed sensorfor electric railway vehicles In Industrial Electronics Society 2001 IECONrsquo01 The 27thAnnual Conference of the IEEE volume 2 pages 1382ndash1387 IEEE
[55] Zahedi E and Gharaveisi A (2011) Fault detection and isolation of anti-lock braking sys-tem sensors In Control Instrumentation and Automation (ICCIA) 2011 2nd InternationalConference on pages 258ndash263 IEEE
[56] Zaki Y (2016) An embedded multi-core platform for mixed-criticality systems Studyand analysis of virtualization techniques
[57] Zhang Y Zhao H Yuan L and Chen H (2016) Slip ratio estimation for electricvehicle with in-wheel motors based on ekf without detection of vehicle velocity In Controland Decision Conference (CCDC) 2016 Chinese pages 4427ndash4432 IEEE
[58] Zhu Z Yuan K Zou W and Hu H (2009) Current-based wheel slip detection ofall-wheel driving vehicle In Information and Automation 2009 ICIArsquo09 International Con-ference on pages 495ndash499 IEEE
38
Table of Contents 1Parameters 1Read and plot data from semicolon-separated file 1Adaptive average aggregation 1Algorithm 3Slip ratios (for four wheels) 10Plots 11
clear all close all clc
Parametersconvert = 1256637 conversion from raw velocity data to radsepsi = [004 006 01]
Read and plot data from semicolon-separatedfile
Data = dlmread(marmor_testtxt[1750 0 1870 4])Data = dlmread(hejjj2txt0)Data = dlmread(hejjj2txt[170 0 280 3])
time = Data(1)v1 = convert(4Data(1)) encoder signal wheel1v2 = convert(4Data(2)) encoder signal wheel2v3 = convert(4Data(3)) encoder signal wheel3v4 = convert(4Data(4)) encoder signal wheel4
V51 = v4 + (2rand(length(v4)1))-(22) V5 = [V51(1150) V51(50119)108] V6 = V5 + (4rand(length(v4)1))-(42)
V5 = 30ones(length(v1)1) + (2rand(length(v4)1))-(22) simulated extra velocity reference signalV6 = 30ones(length(v1)1) + (2rand(length(v4)1))-(22) simulated extra velocity reference signal
Adaptive average aggregation Preallocation of vectors to be filled in loophank = hankel(110 10length(v1)) to create rolling windows of ten of which to calculate averagewhat1 = v1(hank)what2 = v2(hank)what3 = v3(hank)what4 = v4(hank)
1
Appendix A MATLAB code for data aggregation
what5 = V5(hank)what6 = V6(hank)
Four wheelsadapt_t1 = ones(length(v1)1)adapt_t2 = ones(length(v1)1)adapt_t3 = ones(length(v1)1)adapt_t4 = ones(length(v1)1)
w1 = ones(length(v1)length(epsi))w2 = ones(length(v1)length(epsi))w3 = ones(length(v1)length(epsi))w4 = ones(length(v1)length(epsi))w5 = ones(length(v1)length(epsi))
deltaw1=ones(length(v1)length(epsi))deltaw2=ones(length(v1)length(epsi))deltaw3=ones(length(v1)length(epsi))deltaw4=ones(length(v1)length(epsi))
Five wheelsadapt_T1 = ones(length(v1)1)adapt_T2 = ones(length(v1)1)adapt_T3 = ones(length(v1)1)adapt_T4 = ones(length(v1)1)adapt_T5 = ones(length(v1)1)
W1 = ones(length(v1)length(epsi))W2 = ones(length(v1)length(epsi))W3 = ones(length(v1)length(epsi))W4 = ones(length(v1)length(epsi))W5 = ones(length(v1)length(epsi))
deltaW1=ones(length(v1)length(epsi))deltaW2=ones(length(v1)length(epsi))deltaW3=ones(length(v1)length(epsi))deltaW4=ones(length(v1)length(epsi))deltaW5=ones(length(v1)length(epsi))
Six wheelsADAPT_T1 = ones(length(v1)1)ADAPT_T2 = ones(length(v1)1)ADAPT_T3 = ones(length(v1)1)ADAPT_T4 = ones(length(v1)1)ADAPT_T5 = ones(length(v1)1)ADAPT_T6 = ones(length(v1)1)
WW1 = ones(length(v1)length(epsi))WW2 = ones(length(v1)length(epsi))WW3 = ones(length(v1)length(epsi))WW4 = ones(length(v1)length(epsi))WW5 = ones(length(v1)length(epsi))WW6 = ones(length(v1)length(epsi))
2
DELTAW1=ones(length(v1)length(epsi))DELTAW2=ones(length(v1)length(epsi))DELTAW3=ones(length(v1)length(epsi))DELTAW4=ones(length(v1)length(epsi))DELTAW5=ones(length(v1)length(epsi))DELTAW6=ones(length(v1)length(epsi))
avg1 = ones(length(v1)1)avg2 = ones(length(v1)1)avg3 = ones(length(v1)1)avg4 = ones(length(v1)1)avg5 = ones(length(v1)1)avg6 = ones(length(v1)1)
Algorithmfor j = 1length(epsi)for i = 1length(what1)
win1 = what1(i) window from vector v1 in this iteration win2 = what2(i) window from vector v2 in this iteration win3 = what3(i) window from vector v3 in this iteration win4 = what4(i) window from vector v4 in this iteration win5 = what5(i) window from vector V5 in this iteration win6 = what6(i) window from vector V5 in this iteration
avgwin1 = sum(win1)length(win1) average value of window1 this iteration avgwin2 = sum(win2)length(win2) average value of window2 this iteration avgwin3 = sum(win3)length(win3) average value of window3 this iteration avgwin4 = sum(win4)length(win4) average value of window4 this iteration avgwin5 = sum(win5)length(win5) average value of window5 this iteration avgwin6 = sum(win6)length(win6) average value of window6 this iteration
avg1(i) = avgwin1 save averages in vector avg2(i) = avgwin2 avg3(i) = avgwin3 avg4(i) = avgwin4 avg5(i) = avgwin5 avg6(i) = avgwin6
FOUR WHEELS adapt_t1(i) = ((avgwin2+avgwin3+avgwin4)3)-avgwin1 Larger value=less correlation to neigbouring sensors adapt_t2(i) = ((avgwin1+avgwin3+avgwin4)3)-avgwin2 adapt_t3(i) = ((avgwin1+avgwin2+avgwin4)3)-avgwin3 adapt_t4(i) = ((avgwin1+avgwin2+avgwin3)3)-avgwin4
3
deltaw1(ij) = abs(adapt_t1(i))epsi(j) vector of delta_w deltaw2(ij) = abs(adapt_t2(i))epsi(j) deltaw3(ij) = abs(adapt_t3(i))epsi(j) deltaw4(ij) = abs(adapt_t4(i))epsi(j)
FIVE WHEELS adapt_T1(i) = ((avgwin2+avgwin3+avgwin4+avgwin5)4)-avgwin1 Larger value=less correlation to neigbouring sensors adapt_T2(i) = ((avgwin1+avgwin3+avgwin4+avgwin5)4)-avgwin2 adapt_T3(i) = ((avgwin1+avgwin2+avgwin4+avgwin5)4)-avgwin3 adapt_T4(i) = ((avgwin1+avgwin2+avgwin3+avgwin5)4)-avgwin4 adapt_T5(i) = ((avgwin1+avgwin2+avgwin3+avgwin4)4)-avgwin5
deltaW1(ij) = abs(adapt_T1(i))epsi(j) vector of delta_w deltaW2(ij) = abs(adapt_T2(i))epsi(j) deltaW3(ij) = abs(adapt_T3(i))epsi(j) deltaW4(ij) = abs(adapt_T4(i))epsi(j) deltaW5(ij) = abs(adapt_T5(i))epsi(j)
SIX WHEELS ADAPT_T1(i) = ((avgwin2+avgwin3+avgwin4+avgwin5+avgwin6)5)-avgwin1 Larger value=less correlation to neigbouring sensors ADAPT_T2(i) = ((avgwin1+avgwin3+avgwin4+avgwin5+avgwin6)5)-avgwin2 ADAPT_T3(i) = ((avgwin1+avgwin2+avgwin4+avgwin5+avgwin6)5)-avgwin3 ADAPT_T4(i) = ((avgwin1+avgwin2+avgwin3+avgwin5+avgwin6)5)-avgwin4 ADAPT_T5(i) = ((avgwin1+avgwin2+avgwin3+avgwin4+avgwin6)5)-avgwin5 ADAPT_T6(i) = ((avgwin1+avgwin2+avgwin3+avgwin4+avgwin5)5)-avgwin6
DELTAW1(ij) = abs(ADAPT_T1(i))epsi(j) vector of delta_w DELTAW2(ij) = abs(ADAPT_T2(i))epsi(j) DELTAW3(ij) = abs(ADAPT_T3(i))epsi(j) DELTAW4(ij) = abs(ADAPT_T4(i))epsi(j) DELTAW5(ij) = abs(ADAPT_T5(i))epsi(j) DELTAW6(ij) = abs(ADAPT_T6(i))epsi(j)
FOUR WHEELS Small deltaw = higher trustworthiness if ((deltaw1(ij) lt deltaw2(ij)) ampamp (deltaw1(ij) lt deltaw3(ij)) ampamp (deltaw1(ij) lt deltaw4(ij))) if deltaw1 is smallest of all deltaw = BRA = houmlg correlation w1(i+1j) = w1(ij) + deltaw1(ij) increase weight
if(w1(i+1j)gt1) w1(i+1j) = 1 end
else
4
w1(i+1j) = w1(ij) - deltaw1(ij) if deltaw1 is NOT smallest of all deltaw miska trust if(w1(i+1j)lt0) w1(i+1j) = 0 end
end
if ((deltaw2(ij) lt deltaw1(ij)) ampamp (deltaw2(ij) lt deltaw3(ij)) ampamp (deltaw2(ij) lt deltaw4(ij))) w2(i+1j) = w2(ij) + deltaw2(ij) if(w2(i+1j)gt1) w2(i+1j) = 1 end
else w2(i+1j) = w2(ij) - deltaw2(ij) if(w2(i+1j)lt0) w2(i+1j) = 0 end
end
if ((deltaw3(ij) lt deltaw1(ij)) ampamp (deltaw3(ij) lt deltaw2(ij)) ampamp (deltaw3(ij) lt deltaw4(ij))) w3(i+1j) = w3(ij) + deltaw3(ij) if(w3(i+1j)gt1) w3(i+1j) = 1 end
else w3(i+1j) = w3(ij) - deltaw3(ij) if(w3(i+1j)lt0) w3(i+1j) = 0 end
end
if ((deltaw4(ij) lt deltaw1(ij)) ampamp (deltaw4(ij) lt deltaw2(ij)) ampamp (deltaw4(ij) lt deltaw3(ij))) w4(i+1j) = w4(ij) + deltaw4(ij) if(w4(i+1j)gt1) w4(i+1j) = 1 end
else w4(i+1j) = w4(ij) - deltaw4(ij) if(w4(i+1j)lt0) w4(i+1j) = 0 end
end
5
FIVE WHEELS if ((deltaW1(ij) lt deltaW2(ij)) ampamp (deltaW1(ij) lt deltaW3(ij)) ampamp (deltaW1(ij) lt deltaW4(ij)) ampamp (deltaW1(ij) lt deltaW5(ij))) if deltaw1 is smallest of all deltaw = BRA = houmlg correlation W1(i+1j) = W1(ij) + deltaW1(ij) increase weight
if(W1(i+1j)gt1) W1(i+1j) = 1 end
else W1(i+1j) = W1(ij) - deltaW1(ij) if deltaw1 is NOT smallest of all deltaw miska trust if(W1(i+1j)lt0) W1(i+1j) = 0 end
end
if ((deltaW2(ij) lt deltaW1(ij)) ampamp (deltaW2(ij) lt deltaW3(ij)) ampamp (deltaW2(ij) lt deltaW4(ij)) ampamp (deltaW2(ij) lt deltaW5(ij))) W2(i+1j) = W2(ij) + deltaW2(ij) if(W2(i+1j)gt1) W2(i+1j) = 1 end
else W2(i+1j) = W2(ij) - deltaW2(ij) if(W2(i+1j)lt0) W2(i+1j) = 0 end
end
if ((deltaW3(ij) lt deltaW1(ij)) ampamp (deltaW3(ij) lt deltaW2(ij)) ampamp (deltaW3(ij) lt deltaW4(ij)) ampamp (deltaW3(ij) lt deltaW5(ij))) W3(i+1j) = W3(ij) + deltaW3(ij) if(W3(i+1j)gt1) W3(i+1j) = 1 end
else W3(i+1j) = W3(ij) - deltaW3(ij) if(W3(i+1j)lt0) W3(i+1j) = 0 end
end
if ((deltaW4(ij) lt deltaW1(ij)) ampamp (deltaW4(ij) lt deltaW2(ij)) ampamp (deltaW4(ij) lt deltaW3(ij)) ampamp (deltaW4(ij) lt deltaW5(ij))) W4(i+1j) = W4(ij) + deltaW4(ij)
6
if(W4(i+1j)gt1) W4(i+1j) = 1 end
else W4(i+1j) = W4(ij) - deltaW4(ij) if(W4(i+1j)lt0) W4(i+1j) = 0 end
end
if ((deltaW5(ij) lt deltaW1(ij)) ampamp (deltaW5(ij) lt deltaW2(ij)) ampamp (deltaW5(ij) lt deltaW3(ij)) ampamp (deltaW5(ij) lt deltaW4(ij))) W5(i+1j) = W5(ij) + deltaW5(ij) if(W5(i+1j)gt1) W5(i+1j) = 1 end
else W5(i+1j) = W5(ij) - deltaW5(ij) if(W5(i+1j)lt0) W5(i+1j) = 0 end
end
SIX WHEELS if ((DELTAW1(ij) lt DELTAW2(ij)) ampamp (DELTAW1(ij) lt DELTAW3(ij)) ampamp (DELTAW1(ij) lt DELTAW4(ij)) ampamp (DELTAW1(ij) lt DELTAW5(ij)) ampamp (DELTAW1(ij) lt DELTAW6(ij))) if deltaw1 is smallest of all deltaw = BRA = houmlg correlation WW1(i+1j) = WW1(ij) + DELTAW1(ij) increase weight
if(WW1(i+1j)gt1) WW1(i+1j) = 1 end
else WW1(i+1j) = WW1(ij) - DELTAW1(ij) if deltaw1 is NOT smallest of all deltaw miska trust if(WW1(i+1j)lt0) WW1(i+1j) = 0 end
end
if ((DELTAW2(ij) lt DELTAW1(ij)) ampamp (DELTAW2(ij) lt DELTAW3(ij)) ampamp (DELTAW2(ij) lt DELTAW4(ij)) ampamp (DELTAW2(ij) lt DELTAW5(ij)) ampamp (DELTAW2(ij) lt DELTAW6(ij))) if deltaw1 is smallest of all deltaw = BRA = houmlg correlation WW2(i+1j) = WW2(ij) + DELTAW2(ij) increase weight
7
if(WW2(i+1j)gt1) WW2(i+1j) = 1 end
else WW2(i+1j) = WW2(ij) - DELTAW2(ij) if deltaw1 is NOT smallest of all deltaw miska trust
if(WW2(i+1j)lt0) WW2(i+1j) = 0 end
end
if ((DELTAW3(ij) lt DELTAW1(ij)) ampamp (DELTAW3(ij) lt DELTAW2(ij)) ampamp (DELTAW3(ij) lt DELTAW4(ij)) ampamp (DELTAW3(ij) lt DELTAW5(ij)) ampamp (DELTAW3(ij) lt DELTAW6(ij))) if deltaw1 is smallest of all deltaw = BRA = houmlg correlation WW3(i+1j) = WW3(ij) + DELTAW3(ij) increase weight
if(WW3(i+1j)gt1) WW3(i+1j) = 1 end
else WW3(i+1j) = WW3(ij) - DELTAW3(ij) if deltaw1 is NOT smallest of all deltaw miska trust
if(WW3(i+1j)lt0) WW3(i+1j) = 0 end
end
if ((DELTAW4(ij) lt DELTAW1(ij)) ampamp (DELTAW4(ij) lt DELTAW2(ij)) ampamp (DELTAW4(ij) lt DELTAW3(ij)) ampamp (DELTAW4(ij) lt DELTAW5(ij)) ampamp (DELTAW4(ij) lt DELTAW6(ij))) if deltaw1 is smallest of all deltaw = BRA = houmlg correlation WW4(i+1j) = WW4(ij) + DELTAW4(ij) increase weight
if(WW4(i+1j)gt1) WW4(i+1j) = 1 end
else WW4(i+1j) = WW4(ij) - DELTAW4(ij) if deltaw1 is NOT smallest of all deltaw miska trust
if(WW4(i+1j)lt0) WW4(i+1j) = 0 end
8
end
if ((DELTAW5(ij) lt DELTAW1(ij)) ampamp (DELTAW5(ij) lt DELTAW2(ij)) ampamp (DELTAW5(ij) lt DELTAW3(ij)) ampamp (DELTAW5(ij) lt DELTAW4(ij)) ampamp (DELTAW5(ij) lt DELTAW6(ij))) if deltaw1 is smallest of all deltaw = BRA = houmlg correlation WW5(i+1j) = WW5(ij) + DELTAW5(ij) increase weight
if(WW5(i+1j)gt1) WW5(i+1j) = 1 end
else WW5(i+1j) = WW5(ij) - DELTAW5(ij) if deltaw1 is NOT smallest of all deltaw miska trust
if(WW5(i+1j)lt0) WW5(i+1j) = 0 end
end
if ((DELTAW6(ij) lt DELTAW1(ij)) ampamp (DELTAW6(ij) lt DELTAW2(ij)) ampamp (DELTAW6(ij) lt DELTAW3(ij)) ampamp (DELTAW6(ij) lt DELTAW4(ij)) ampamp (DELTAW6(ij) lt DELTAW5(ij))) if deltaw1 is smallest of all deltaw = BRA = houmlg correlation WW6(i+1j) = WW6(ij) + DELTAW6(ij) increase weight
if(WW6(i+1j)gt1) WW6(i+1j) = 1 end
else WW6(i+1j) = WW6(ij) - DELTAW6(ij) if deltaw1 is NOT smallest of all deltaw miska trust
if(WW6(i+1j)lt0) WW6(i+1j) = 0 end
end
endend
avg_all = (avg1+avg2+avg3+avg4)4 normal average of ALL wheels togetheravg_ALL = (avg1+avg2+avg3+avg4+avg5)5 normal average FIVE wheelsAVG_ALL = (avg1+avg2+avg3+avg4+avg5+avg6)6 normal average SIX wheels
9
Preallocation of vectoravg_all_weighted = ones(length(v1)length(epsi))avg_all_WEIGHTED = ones(length(v1)length(epsi))for j = 1length(epsi) Normalize weights FOUR WHEELS weight_sum = w1(j)+w2(j)+w3(j)+w4(j) w1_norm = w1(j)weight_sum w2_norm = w2(j)weight_sum w3_norm = w3(j)weight_sum w4_norm = w4(j)weight_sum
Normalize weights FIVE WHEELS weight_SUM = W1(j)+W2(j)+W3(j)+W4(j)+W5(j) W1_norm = W1(j)weight_SUM W2_norm = W2(j)weight_SUM W3_norm = W3(j)weight_SUM W4_norm = W4(j)weight_SUM W5_norm = W5(j)weight_SUM
Normalize weights SIX WHEELS WEIGHT_SUM = WW1(j)+WW2(j)+WW3(j)+WW4(j)+WW5(j)+WW6(j) W1_NORM = WW1(j)WEIGHT_SUM W2_NORM = WW2(j)WEIGHT_SUM W3_NORM = WW3(j)WEIGHT_SUM W4_NORM = WW4(j)WEIGHT_SUM W5_NORM = WW5(j)WEIGHT_SUM W6_NORM = WW6(j)WEIGHT_SUM
Four five six wheels respectively avg_all_weighted(j) = ((avg1(1)w1_norm)+(avg2(1)w2_norm)+(avg3(1)w3_norm)+(avg4(1)w4_norm)) weighted average of ALL wheels avg_all_WEIGHTED(j) = ((avg1(1)W1_norm)+(avg2(1)W2_norm)+(avg3(1)W3_norm)+(avg4(1)W4_norm)+(avg5(1)W5_norm)) weighted average of ALL wheels FIVE WHEELS avg_ALL_WEIGHTED = ((avg1W1_NORM)+(avg2W2_NORM)+(avg3W3_NORM)+(avg4W4_NORM)+(avg5W5_NORM)+(avg6W6_NORM)) weighted average of ALL wheels SIX WHEELS
end
Slip ratios (for four wheels)slipR1 = (avg_all_weighted(1)-avg1)avg_all_weighted(1) Filtered wheel velocity of wheel1 divided by estimated vehicle velocityslipR2 = (avg_all_weighted(1)-avg2)avg_all_weighted(1)slipR3 = (avg_all_weighted(1)-avg3)avg_all_weighted(1)slipR4 = (avg_all_weighted(1)-avg4)avg_all_weighted(1)
10
1200652 wwwkueblercom
MMiinniiaattuurree TTyyppee 22440000
bull High performance at a competitive pricebull Wide temperature range (-20 +85 degC)bull Sturdy cable outlet with multiple
clampingbull Temperature compensationbull Broad input voltage range
(5 24 V or 8 30 V)bull Highly flexible cable withstands
constant flexing from 0 degC 70 degC)
bull Low power consumption despite highscanning rate
bull Reverse connection protected and Short-circuit proof
bull Very high EMV standardndash KKuumluumlbblleerr eennccooddeerr ttyyppee 2244xxxx mmeeeettss GGeerrmmaann
RRaaiillwwaayyss ssttaannddaarrdd EENN 5500112211
4 6 10 16 20 25 36 40 5500 60 80 110000 120125 180 220000 250 300 336600 400 550000 51211000000 11002244 1080
EElleeccttrriiccaall cchhaarraacctteerriissttiiccss
PPuullssee rraatteess aavvaaiillaabbllee aatt sshhoorrtt nnoottiicceeSpeed max 12 000min-1
Rotor moment of inertia approx 01 x 10-6 kgm2
Starting torque lt0001 NmRadial load capacity of shaft 10 NAxial load capacity of shaft 20 NWeight approx 006 kgProtection acc to EN 60529 IP 64 housing sideWorking temperature ndash20deg C +85 degC2)
Operating temperature ndash20deg C +90 degC2)
Shaft stainless steelShock resistance acc to DIN-IEC 68-2-27 1000 ms2 6 msVibration resistance acc to DIN-IEC 68-2-6 100 ms2 55 2000 Hz
2) Non-condensing
Output circuit Push-pull Push-pull(7272)1) (7272)1)
Supply voltage 5 24 V DC 8 30 V DCPower consumption (no load) max 50 mA max 50 mAPermissible loadchannel max 50 mA max 50 mAPulse frequency max 160 kHz max 160 kHzSignal level high min UB = -25 V min UB = ndash3 VSignal level low max 05 V max 05 VRise time tr max 1 micros max 1 microsFall time tf max 1 micros max 1 microsShort circuit proof outputs yes yesConforms to CE requirements acc to EN 61000-6-1 EN 61000-6-4 and EN 61000-6-31) Max recommended cable length 30 m
AApppplliiccaattiioonnss
bull Pick and place machinesbull Handling machines for electronic compo-
nentsbull Quality testing machinesbull Medical machines
bull Mail opening and mail stuffing machinesbull Check weighersbull Labelling machinesbull Mole machines (camera control)bull Door and gates systemsbull Textil machines
KKuumluumlbblleerr eennccooddeerr ttyyppee 2244xxxx mmeeeettss GGeerrmmaannRRaaiillwwaayyss ssttaannddaarrddAn independent test laboratory (TTI-P-G11596-01) approved by the GermanAccreditation Council (DAR) certified thecompliance with the railway standardaccording to EN 50121 This means our encoder is compatible tohigher electromagnetic noise standardsthan standard industrial encoders Youwill have a higher quality encoder evenin applications with higher EMC noiselevelWe will gladly send you a copy of the testreport on request When ordering anencoder to the railway standard pleaseensure to state this explicitly on theorder
Rotary Measuring Technology Incremental shaft encoder
Appendix B Encoder datasheet
12006
Rota
ry M
easu
rem
ent T
echn
olog
yIn
crem
enta
l Enc
oder
s
wwwkueblercom 53
MMiinniiaattuurree TTyyppee 22440000
TTeerrmmiinnaall aassssiiggnnmmeennttSignal 0V +UB A A B B 0 OColour WH BN GN YE GY PK BU RDwithout inverted signal WH BN GN YE GY
6
18
1
D
24
min R50
10+
02
10+
214
10+
12
011
h7
21
21
max
5 3M
f7
IIssoollaattee uunnuusseedd oouuttppuuttss bbeeffoorree iinniittiiaall ssttaarrtt--uupp
DDiimmeennssiioonnssBracket type 1 (Oslash 24 mm)
Bracket type 2 (Oslash 30 mm)Bracket type 3 (Oslash 28 mm)
22
6
min R50
3M
B
24
D 21
A
812
max
5
h7
5
01
15f7
MMoouunnttiinngg aaddvviiccee
The brackets andshafts of theencoder and driveshould not both berigidly coupledtogether at the sametime We recom-mend the use ofsuitable couplings(see Accessoriessection)OOrrddeerr ccooddee 052400XXXXXXXX
Range
Bracket11 == oslashoslash 2244 mmmm 22 == oslashoslash 3300 mmmm33 == oslashoslash 2288 mmmmfurther on request
Shaft11 == oslashoslash 44 mmmm xx 1100 mmmm22 == oslashoslash 66 mmmm xx 1100 mmmm3 = oslash 5 mm x 10 mm with flattening
Pulse rate(eg 360 pulses=gt 0360)
Type of connection1 = Cable axial (2 m PVC cable oslash 45 mm) 22 == CCaabbllee rraaddiiaall ((2 m PVC cable oslash 45 mm))
Output and voltage supply1 = Push-pull (without inverted signals)
5 24 V supply voltage22 == PPuusshh--ppuullll ((wwiitthh iinnvveerrtteedd ssiiggnnaallss))
55 2244 VV DDCC ssuuppppllyy vvoollttaaggee3 = Push-pull (without inverted signals)
8 30 V DC supply voltage44 == PPuusshh--ppuullll ((wwiitthh iinnvveerrtteedd ssiiggnnaallss))
88 3300 VV ssuuppppllyy vvoollttaaggee
Bracket type 2 3A oslash 30 mm oslash 28 mmB 3 mm 2 mm
SSttoocckk ttyyppeess05240011220050052400112201000524001122036005240011220500052400112210000524001122102405240033211000052400334110000524003331050005240033311000
Preferred types are
indicated in bboolldd
Rotary Measuring Technology Incremental shaft encoder
DDR
Encoder1QuadA
Encoder1QuadB
Encoder2QuadA
Encoder2QuadB
Encoder3QuadA
Encoder3QuadB
Encoder4QuadA
Encoder4QuadB
FIXED_IO
LIDAR_lite_0
LIDAR_lite_v10 (Pre-Production)
S00_AXI
LIDAR_pwm
s00_axi_aclk
s00_axi_aresetn
LIDAR_pwm
MB_reset
Vn_adc
Vp_adc
axi_gpio_0
AXI GPIO
S_AXI
GPIOs_axi_aclk
s_axi_aresetn
axi_gpio_1
AXI GPIO
S_AXIGPIO
s_axi_aclk
s_axi_aresetnip2intc_irpt
axi_timer_0
AXI Timer
S_AXI
capturetrig0
capturetrig1
generateout0
generateout1
pwm0
interrupt
freeze
s_axi_aclk
s_axi_aresetn
axi_timer_1
AXI Timer
S_AXI
capturetrig0
capturetrig1
generateout0
generateout1
pwm0
interrupt
freeze
s_axi_aclk
s_axi_aresetn
axi_timer_2
AXI Timer
S_AXI
capturetrig0
capturetrig1
generateout0
generateout1
pwm0
interrupt
freeze
s_axi_aclk
s_axi_aresetn
axi_timer_3
AXI Timer
S_AXI
capturetrig0
capturetrig1
generateout0
generateout1
pwm0
interrupt
freeze
s_axi_aclk
s_axi_aresetn
axi_uartlite_0
AXI Uartlite
S_AXIUART
s_axi_aclk
s_axi_aresetninterrupt
axi_uartlite_1
AXI Uartlite
S_AXIUART
s_axi_aclk
s_axi_aresetninterrupt
decoder_0
decoder_v10 (Pre-Production)
S00_AXI
encoder_quadA
encoder_quadB
s00_axi_aclk
s00_axi_aresetn
decoder_1
decoder_v10 (Pre-Production)
S00_AXI
encoder_quadA
encoder_quadB
s00_axi_aclk
s00_axi_aresetn
decoder_2
decoder_v10 (Pre-Production)
S00_AXI
encoder_quadA
encoder_quadB
s00_axi_aclk
s00_axi_aresetn
decoder_3
decoder_v10 (Pre-Production)
S00_AXI
encoder_quadA
encoder_quadB
s00_axi_aclk
s00_axi_aresetn
gpio_rtl
gpio_rtl_0
mailbox_0
Mailbox
S0_AXI
S1_AXI
S0_AXI_ACLK
S0_AXI_ARESETN
S1_AXI_ACLK
S1_AXI_ARESETN
Interrupt_0
Interrupt_1
mailbox_1
Mailbox
S0_AXI
S1_AXI
S0_AXI_ACLK
S0_AXI_ARESETN
S1_AXI_ACLK
S1_AXI_ARESETN
Interrupt_0
Interrupt_1
mdm_1
MicroBlaze Debug Module (MDM)
S_AXI MBDEBUG_0
S_AXI_ACLK
S_AXI_ARESETN
Interrupt
Debug_SYS_Rst
microblaze_0
MicroBlaze
INTERRUPTDLMB
ILMB
M_AXI_DP
M_AXI_DC
M_AXI_IC
DEBUG
Clk
Reset
microblaze_0_axi_intc
AXI Interrupt Controller
s_axi
interrupt
s_axi_aclk
s_axi_aresetn
intr[20]
processor_clk
processor_rst
microblaze_0_axi_periph
AXI Interconnect
S00_AXI
M00_AXI
S01_AXI
S02_AXI
M01_AXI
M02_AXI
M03_AXI
M04_AXI
M05_AXI
M06_AXI
ACLK
ARESETN[00]
S00_ACLK
S00_ARESETN[00]
M00_ACLK
M00_ARESETN[00]
S01_ACLK
S01_ARESETN[00]
S02_ACLK
S02_ARESETN[00]
M01_ACLK
M01_ARESETN[00]
M02_ACLK
M02_ARESETN[00]
M03_ACLK
M03_ARESETN[00]
M04_ACLK
M04_ARESETN[00]
M05_ACLK
M05_ARESETN[00]
M06_ACLK
M06_ARESETN[00]
microblaze_0_local_memory
DLMB
ILMB
LMB_Clk
SYS_Rst[00]
microblaze_0_xlconcat
Concat
In0[00]
In1[00]
In2[00]
dout[20]
processing_system7_0
ZYNQ7 Processing System
DDR
FIXED_IO
USBIND_0
M_AXI_GP0
TTC0_WAVE0_OUT
TTC0_WAVE1_OUT
TTC0_WAVE2_OUT
M_AXI_GP0_ACLK
FCLK_CLK0
FCLK_RESET0_N
processing_system7_0_axi_periph
AXI Interconnect
S00_AXI
M00_AXI
M01_AXI
M02_AXI
M03_AXI
M04_AXI
M05_AXI
M06_AXI
M07_AXI
M08_AXI
M09_AXI
M10_AXI
M11_AXI
M12_AXI
ACLK
ARESETN[00]
S00_ACLK
S00_ARESETN[00]
M00_ACLK
M00_ARESETN[00]
M01_ACLK
M01_ARESETN[00]
M02_ACLK
M02_ARESETN[00]
M03_ACLK
M03_ARESETN[00]
M04_ACLK
M04_ARESETN[00]
M05_ACLK
M05_ARESETN[00]
M06_ACLK
M06_ARESETN[00]
M07_ACLK
M07_ARESETN[00]
M08_ACLK
M08_ARESETN[00]
M09_ACLK
M09_ARESETN[00]
M10_ACLK
M10_ARESETN[00]
M11_ACLK
M11_ARESETN[00]
M12_ACLK
M12_ARESETN[00]
pwm_motor
pwm_servo
rst_processing_system7_0_100M
Processor System Reset
slowest_sync_clk
ext_reset_in
aux_reset_in
mb_debug_sys_rst
dcm_locked
mb_reset
bus_struct_reset[00]
peripheral_reset[00]
interconnect_aresetn[00]
peripheral_aresetn[00]
uart_rtl
uart_rtl_0
xadc_wiz_0
XADC Wizard
s_axi_lite
Vp_Vn
vn_in
vp_in
s_axi_aclk
s_axi_aresetn
ip2intc_irpt
channel_out[40]
eoc_out
alarm_out
eos_out
busy_out
Appendix C Vivado FPGA block design
Appendix D Exploded view of RC-car
TRITA MMK 2017 160 MDA 617
wwwkthse
- Introduction
-
- Background
- Problem Statement
-
- Thesis Objective
- Thesis outline
-
- Related work
- Purpose and goal
- Ethics and sustainability considerations
- Delimitations
-
- Methodology
-
- Methodology of the literature review
- Methodology of the implementation phase
-
- Literature Review
-
- Data aggregation
-
- Data Aggregation Theory
- Data Aggregation in Multi-sensor Systems
-
- Advanced Driver Assistance Systems (ADAS)
-
- Slip detection and control
-
- Cooperation between CPS
-
- Concurrency and Isolation
-
- Conclusions from Literature Review
-
- Implementation
-
- Implications of convoy driving
- Use Case Vehicle Control Loss Warning
- Requirements
-
- Requirements for Use Case
- Requirements for Convoy Driving
-
- Hardware
-
- Board
- Field Programmable Logic - FPGA
- Car platform
- Sensors
-
- Software
-
- RTOS ToppersFMP and SafeG
- GPOS Linux Digilent
- Dual-OS communication
- SoA and SHAPE
-
- Software design of demonstrator
- Slip detection on the demonstrator
-
- Related works for slip detection
- Proposed approach for slip detection on the demonstrator
-
- Initial simulations
-
- One- and two wheel stall
-
- Real-time implementation on the Demonstrator
-
- Demonstrator Architecture
- Real time data aggregation on the demonstrator
-
- Results
-
- Results from simulations
-
- Simulated aggregation during one-wheel stall
- Simulated aggregation during two-wheel stall
-
- Results from real-time implementation
-
- Real-time aggregation during one-wheel stall
- Real-time aggregation during one-wheel slip
-
- Discussion and Future work
-

Master of Science Thesis MMK 2017 160 MDA 617
Data Aggregation in Time Sensitive
Multi-Sensor Systems
Study and Implementation of Wheel Data Aggregation for Slip Detection in an Autonomous Vehicle Convoy
Hanna Hellman
Godkaumlnt
2017-09-01
Examinator
De-Jiu Chen
Handledare
Didem Guumlrdur
Uppdragsgivare
Alten Sverige
Kontaktperson
Detlef Scholle
Sammanfattning En oumlvergaringng till bilar utrustade med avancerade automatiska saumlkerhetssystem (ADAS) och aumlven
utvecklingen mot sjaumllvkoumlrande fordon innebaumlr oumlkad trafik paring den lokala databussen Det finns
saringledes ett behov av att baringde minska den faktiska maumlngden data som oumlverfoumlrs samtidigt som
vaumlrdet paring datat oumlkas Data aggregation tillaumlmpas i dagslaumlget inom omraringden saringsom traringdloumlsa
sensornaumltverk och mindre mobila robotar (WMRrsquos) och skulle kunna vara en del av en loumlsning
Denna rapport avser undersoumlka aggregation av sensordata i ett tidskaumlnsligt system Foumlr ett
anvaumlndarfall gaumlllande halka under konvojkoumlrning testas en aggregationsstrategi genom
implementation paring en fysisk demonstrator Demonstratorn bestaringr av ett autonomt fordon i mindre
skala som befinner sig i en konvoj med ett annat identiskt fordon
Resultaten pekar mot att ett viktat medelvaumlrde som i realtid anpassar sin viktning baserat paring
specifika sensorers koherens med foumlrdel kan anvaumlndas foumlr att estimera fordonshastighet baserat
paring individuella hjuls sensordata Daumlrefter kan en slip ratio beraumlknas vilket avgoumlr om
fordonet befinner sig i ett tillstaringnd av halka eller ej Begraumlnsningar foumlr den undersoumlkta strategin
inkluderar antalet icke-halkande hjul som behoumlvs foumlr tillfoumlrlitliga resultat Simulerade resultat
antyder att extra hastighetsreferenser behoumlvs foumlr tillfoumlrlitliga resultat Relaterat till anvaumlndarfallet
konvojkoumlrning foumlreslarings att andra fordon anvaumlnds som hastighetsreferens Detta skulle innebaumlra
en oumlkad precision foumlr estimeringen av fordonshastigheten samt utgoumlra en intressant
sammanslagning av omraringdena samarbetande cyberfysiska system (CO-CPS) och data
aggregation
iii
Abbreviations
Abbreviation Description
ECU Electronic Control UnitCPS Cyber-physical SystemCO-CPS Cooperating Cyber-physical SystemsM2M Machine-to-machine (-communication)V2V Vechicle-to-vehicle (-communication)V2I Vehicle-to-infrastructure (-communication)V2x Vehicle-to-x (refers to V2V or V2I)ADAS Advanced Driver Assistance SystemABS Anti-lock Braking SystemTCS Traction Control SystemESC Electronic Stability ControlDBMS Database Management SystemRTDBMS Real-time database Management SystemFPGA Field Programmable Gate ArrayRTOS Real-time Operative SystemGPOS General Purpose Operative SystemLIDAR Light Imaging Detection And Ranging (the term LIDAR is a combination of rdquoLightrdquo and rdquoRadarrdquo)SHAPE Self-configurable High Availability and Policy based platform for Embedded systems
iv
Contents
1 Introduction 111 Background 112 Problem Statement 1
121 Thesis Objective 2122 Thesis outline 2
13 Related work 314 Purpose and goal 315 Ethics and sustainability considerations 416 Delimitations 5
2 Methodology 621 Methodology of the literature review 622 Methodology of the implementation phase 6
3 Literature Review 731 Data aggregation 7
311 Data Aggregation Theory 7312 Data Aggregation in Multi-sensor Systems 8
32 Advanced Driver Assistance Systems (ADAS) 10321 Slip detection and control 11
33 Cooperation between CPS 12331 Concurrency and Isolation 13
34 Conclusions from Literature Review 13
4 Implementation 1541 Implications of convoy driving 1542 Use Case Vehicle Control Loss Warning 1543 Requirements 16
431 Requirements for Use Case 16432 Requirements for Convoy Driving 16
44 Hardware 16441 Board 17442 Field Programmable Logic - FPGA 17443 Car platform 17444 Sensors 17
45 Software 18451 RTOS ToppersFMP and SafeG 18452 GPOS Linux Digilent 19453 Dual-OS communication 19454 SoA and SHAPE 19
46 Software design of demonstrator 1947 Slip detection on the demonstrator 20
471 Related works for slip detection 20472 Proposed approach for slip detection on the demonstrator 22
48 Initial simulations 26481 One- and two wheel stall 26
49 Real-time implementation on the Demonstrator 26491 Demonstrator Architecture 26492 Real time data aggregation on the demonstrator 27
v
5 Results 2951 Results from simulations 29
511 Simulated aggregation during one-wheel stall 29512 Simulated aggregation during two-wheel stall 29
52 Results from real-time implementation 30521 Real-time aggregation during one-wheel stall 30522 Real-time aggregation during one-wheel slip 30
6 Discussion and Future work 33
vi
1 Introduction
With vehicles moving towards having electric control units (ECUrsquos) in the hundreds and 60-100sensors [47] comes increasing amounts of communication on the bus between the nodes of thecar Data is sent between sensing nodes and computational nodes in order to make decisionsfor the vehicle for example in cruise control systems deciding to give more or less gas based onsensed velocity data Smart ways of increasing the value and accuracy of the sensed data whileat the same time lessening the amount of data packages to be sent is of ever growing interestand is a necessity for a paradigm shift towards autonomous driving and more sensors
This chapter introduces some terminology and background within the area of cyber-physicalsystems (CPS) data aggregation in multi-sensor systems as well as Advanced Driver Assistancesystems in modern vehicles Thereafter moving on to define the purpose of the study and itsdelimitations
11 Background
A cyber-physical system is a system that senses and acts adaptively to its environment In thisstudy the CPS will be exemplified by an automotive application
As cars move towards having sensor systems in the hundreds [47] a lot of communicationtakes place on the local communication bus
Merging functions and reusing sensor information in more than one application is also rel-evant for the vehicle industry where sensor data from for example electronic stability control(ESC) could be used in the separate system that is the airbag control [44] This example wouldincrease the safety for the passenger but also increase the communication load on the bus
Efforts are made to lessen the bus communication via for example combining tasks on thesame nodes even if they have different criticality such as in the EMC2-project1 and also to senaggregated data instead of raw data
The act of combining data into one representative value is referred to as Data AggregationAdvances in computing power has opened for using this approach even in embedded applicationsfor example in multi-sensor systems [46] With this approach patterns in data can be discoveredand the amount of data that has to be sent between nodes in a distributed cyber-physical systemcan be limited thus saving bandwidth and energy [18] Moreover the value of the data isgenerally said to be increased by aggregation With data having a higher value better decisionscan be made based on this data [40]
12 Problem Statement
An increasing number of sensor systems in cars and other cyber-physical systems allows forbetter response to dynamical environments but also leads to an increased load on the localbus This study aims to incorporate an ad hoc data aggregation strategy in a time sensitivemulti-sensor system and apply it on a use case regarding a usecase in this case slip detectionin a vehicle convoy
The use case comes from the ongoing research project SafeCOP focusing on cooperationbetween CPS and is called control loss warning (depicted in Figure 1) The aim is to send awarning to nearby vehicles when a vehicle looses functionality affecting the platoon All vehiclesin the platoon are to be notified and should assess what actions should be taken [7]
The previously mentioned strategy of aggregating data in multi-sensor systems will be im-plemented on a physical demonstrator of two platooning autonomous miniature carsData Aggregation takes time to perform and looking at this context of convoy driving can data
1EMC2 stands for rdquoEmbedded Multi-Core systems for Mixed Criticality applications in dynamic and change-able real-time environmentsrdquo and is an EU-funded project with the goal of handling mixed criticality applicationsunder real-time conditions and providing multi-core technology to embedded systems [2]
1
aggregation be performed on multiple sensors in a time sensitive system and still produce a resultwithin the time frame where it has a value as a warning to the vehicle behindThe warning will be based on aggregated wheel sensor data from the four wheels of the frontvehicle in the demonstrator platoon The aim is to detect slip on one or more wheels Theconcept of slip and slip detection in similar systems will be elaborated further in the literaturestudy
Figure 1 Image of the relevant SafeCOP usecase regarding vehicle control loss warning [8]
121 Thesis Objective
The objective is to address the problem described in Section Problem Statement through animplementation of data aggregation of wheel velocity data from a physical demonstrator whichis subjected to slip With slip it is meant a situation where one wheel temporarily loses tractionto the surface Empirical data will be collected and analysed to evaluate the accuracy andadequacy of an aggregation strategy for detecting slip in platooning contexts with accuracyadequacy and slip measured as below
accuracy ratio of correctincorrect detections of slip [unitless]
adequacy if a warning based on a certain aggregation strategy can reach the vehicle behindwithin the time frame where it has a value [ms]
slip is a state of a vehicle characterized by one or more wheel velocities deviating from thevehicle velocity It is measured as a slip ratio for each wheel ρslipi
To evaluate the demonstrator based on these metrics research questions were formulatedThe objective of the demonstrator is to answer the following questions
1 How well can a weighted adaptive average of four wheel velocity sensors estimate thevehicle velocity and thus the slip ratio of the wheels during one-wheel slip in the timesensitive system of an autonomous vehicle
2 Using data from several test runs With what accuracy can instances of one-wheel slip onthe surface be identified using the aggregation strategy for estimating the vehicle velocitymentioned in (1)
122 Thesis outline
This report will firstly give a review of relevant literature within the frame-of-reference con-sisting of broad subjects with sometimes overlapping areas These are Data aggregation andmulti-sensor systems including some applications such as Wireless Sensor Networks (WSNrsquos)
2
and mobile robots Then moving on to the emerging area of cooperation between CPSrsquos(CO-CPS) and lastly advanced driver assistance systems (ADAS) concluding withhighlighting a few points from the literature review before moving onto the implementationpart of creating a physical demonstrator
The report then describes the design and construction of a physical demonstrator to be usedfor research within intelligent transport and autonomous driving thereafter describing testingand results from the demonstrator Finally a discussion of which generalizations can be madefrom the results and their validity
13 Related work
This study relates to several ongoing research projects Firstly to SafeCOP which focuseson the need of cyber-physical systems to cooperate safely with each other in unpredictableoperating environments [8] CPSrsquos cooperating is referred to as Cooperative Open Cyber-Physical Systems (CO-CPS) Cooperation can be either Vehicle-to-Vehicle (V2V) or Vehicle-to-Infrastructure (V2I) but is generally seen as a system-of-systems which adds complexity to theinteractions It is stated that most accidents in any system with software components are causedby unsafe interactions between systems The increased complexity that CO-CPSrsquos bring thuscalls for safety assurance models and certifications to be developed which is also a deliverableof SafeCOP [7]
According to [7] this type of cooperation between vehicles will lead to reduction of fuelconsumption reduce the number of accidents and reduce road congestions
Another related research project is DAGGERS 2 (Data Aggregation for Embedded Real-Time Database Systems) which aims to bridge the gap between traditional non-real time datamanagement and real-time embedded systems identifying conflicts and formalizing taxonomyand data transaction models [6]
For the implementation phase this report is related to the software described in [56] and willbuild on this research which combines critical and non-critical tasks on the same hardware Itimplements a layer of Software Oriented Architecture (SOA) which enables cloud communicationbetween nodes through which the aggregated data will be made available to the vehicles Thisis the platform of the V2V communication that will be used
14 Purpose and goal
This study is divided into two main sections with one being a Literature Review and onedescribing the implementation of a physical demonstrator Understanding existing data aggre-gation strategies in multi-sensor systems from the literature review can help to reuse existingsolutions or design new solutions for the second phase of the thesis the implementation of aconvoy driving context
The purpose of the literature study is to summarize learnings from related research in astructured way and form a theoretical framework for the thesis placing the benchmark of thefield to integrate this thesis to existing research
Based on the findings of the literary study an implementation of real-time data aggregationwill be put in a context of two platooning cars The goal of the implementation phase is toevaluate a practical implementation of data aggregation for four wheel sensors in a use-casewith the aim of detecting a slip of a wheel Measurements based on sensor data from thedemonstrator will be performed in a controlled test environment
Within a team consisting of five students the goal is to create a demonstrator utilizing V2Vcommunication in a platooning context which is used in our individual thesis works but also forfuture research by Alten The situation studied within the scope of this thesis will be a slippagesituation acting on the front car which sends a warning to the vehicle behind
2DAGGERS is a cooperation between Malardalens Hogskola and industrial partners
3
15 Ethics and sustainability considerations
Traffic density is increasing in many parts of the world especially freight transport which willcontinue to grow leading to higher emissions of fossil fuels and harmful exhaust particles Apartial solution to this problem can be said to be platooning of heavy duty vehicles [10] Theethical aspects of this study partly depends on the individual nodes placed in each vehicle ofthe system and what data they collect and transmit but also in their interactions with nearbynodes Internet-of-things systems interact with each other and other entities The architectureof these systems can be divided between centralized and distributed systems each holding theirindividual challenges [45] More described in Section Architectural Aspects
IoT and Data management It is stated in [45] that one of the major obstacles for bringingInternet-of-things into the real world is the issue of security Distributed IoTrsquos can be hugenetworks and how is access control managed and privacy of the user contained If the data isintended to be shared to nearby vehicles (V2V) or a base station (V2I) would it be anonymizedor could it be used to track a vehicles path thus posing an integrity threat The issue of securityis noted by Lee Cresswell in his article in Elektroniktidningen that the wireless communicationsused in vehicles today often has a direct link to essential safety systems such as navigationbreaking and steering This relatively new concept of interconnection between internal vehiclefunctions as well as separate vehicles has meant a steep learning curve for developers allowingdata security to fall behind [22]
Autonomous vehicles and whether they can be said to be safe is an ongoing question Thereis a lack of evidence regarding their alleged safety according to Mohammad Mousavi professorin computer systems at Hogskolan i Halmstad There is an infinite number of situations thatmust be handled by an autonomous system to prove its safety thus making traditional testingunsufficient He also emphasises an ethical dilemma where an autonomous system in a collisionsituation hypothetically can be forced to actively make the decision to save multiple trafficantsby steering towards another trafficant [42]
Autonomous vehicles would have to have a programmed moral for however unlikely situa-tions that could occur
Whether algorithms can be said to be moral and if society is ready for utilitarian autonomouscars that are programmed to sacrifice themselves (including driver and passenger) in situationsthat will lead to unavoidable harm is discussed in [16] It was found that consumers approvedof utilitarian vehicles and that others should drive them but when it comes to themselves theywould prefer the vehicle to save the driver and its passenger at all costs even if it means agreater loss of life outside the vehicle Of course an impossible situation to comply to [16]
Figure 2 The trolley problem an ethical dilemma and thought-experiment first introduced by philoso-pher Philippa Foot in 1967 Actualized again by the development of autonomous vehicles Image from[3]
Platooning In the context of platooning consequences of accidents can be dire because ofthe small distances between the vehicles where an absolute minimum distance is concluded in
4
[10] to be between 12 and 2 metres The question is who is responsible for an accident themanufacturer of the system the driver of one vehicle or always the driver in the front vehicleor someone else This is an issue surrounding autonomous vehicles in general This problemcalls for safety assurance and certification of safety critical cooperating vehicles which is a goalfor SafeCOP
Sustainability can be divided into three different aspects social- economic- and environ-mental sustainability Platooning is seen as a mean for decreasing fuel consumption by loweringthe air drag and improving the flow of the traffic [10] acting as an economical and environ-mental incentive However from a societal perspective it can be seen as risky to for exampleovertake a convoy of several trucks From an environmental point-of-view the total fuel amountused for freight is still considerable even though there are savings compared to non platooningfreight
16 Delimitations
The context in this scope is limited to two vehicles and this work will thus be unable tostudy the effects of having more vehicles on the same network The tests will be performed onone of the two cars on a straight track and results will only be directly applicable to similarsystems although some generalizations for other vehicle configurations could be made and willbe discussed A general demand is that the setting in which the empirical tests will be performedmust be controlled and reproducible
The results of this study will to some extent be dependent on the platform An upscalingto an actual automotive platooning system with strict safety regulations will not be coveredalthough indications regarding the possibility of upscaling can be deduced
Once a control loss warning is given a decision regarding actions for the system-of-systemswhich is the platoon must be made As stated in [13] cooperative driving inherently forms asafety paradox where a vehicle is dependent on input from external systems (nearby vehicles)to assure its own safety which creates a system design challenge However actions taken as aconsequence of a control loss warning falls outside of the scope of this study Instead the focusis detecting instances of slip
5
2 Methodology
This study is divided into firstly a literature review and secondly an implementation phase Theliterature review will be performed to gain background knowledge within the three key themesData aggregation Multi-sensor systems and cooperation between CPS as seen in Figure 3
21 Methodology of the literature review
The methodology for the literature review is of qualititative nature The literature review placesthe benchmark and paradigm of the field and integrates this thesis to existing research Theliterature review forms a frame-of-reference and will lead to research questions being crystalized[27] which is not a numerical result but rather a qualitative value
The data collection method of the literature review will consist of the following steps
1 Article search based on keywords
2 Mapping the read articles in order to place the research of this project in a context of theexisting research a procedure proposed by Creswell [23]
3 Iterate search
4 Summarize relevant information thematically
The databases used are IEEE Xplore and ScienceDirect Articles were manually chosenbased on title and abstract for percieved relevance to this study
22 Methodology of the implementation phase
The general methodology of the implementation phase will be of a quantitative nature meaningthat measurable data is used to verify or falsify a systems functionality [27]
Having a theory in the beginning of a study means having a deductive approach on theresearch [23] The research approach of this study will be based on deductive reasoning wherea theory is tested on generally large data sets and conclusions are drawn based on the collecteddata The investigation will be of confirmatory nature with the aim of confirmingdisconfirminga theory which will be formulated based on the literature review
The methodology of the implementation will be non-experimental empirical The collectionand analysis of data is performed in order to evaluate in this case a technology The data collec-tion will be made through structured observationsmeasurements performed on a demonstratorto produce numerical data
Finally the external validity if the results can be generalized for similar systems and internalvalidity if the study measures what it says it will measure will be discussed
6
3 Literature Review
The theoretical framework will consist of three main areas which will be covered in the LiteratureStudy section of this report They are identified as
bull Safe cooperation between CPS related to SafeCOP
bull Data aggregation in multi sensor systems algorithms architecture and applications forboth real time and non real time
bull Advanced driver assistance systems
These three areas together make up the theoretical framework for the implementation phaseA depiction of the general themes of the literature study are shown in Figure 3
Figure 3 Depiction of general themes and selected sub-categories
31 Data aggregation
Data aggregation is a process where one representative value is chosen from a larger data-set[46] The purpose is often to discover patterns in data [21] and also to save energy and transfertime in a multi-sensor network [52]
311 Data Aggregation Theory
A Data Aggregation Process (DAP) is in [18] described as a process with raw data as input anaggregation function and an output of aggregated data Aggregation functions can be of typesAveraging Conjunctive Disjunctive or mixed [14] The application of aggregation functionscan be to reduce noise summarizefuse data or to make decisions [51] To fuseintegrateinformation the process is generally to acquire data preprocess fusion execution During thefusion redundant information can be removed or multiple sources can be used to complementeach other Data to be fused can be for example numerical data or fuzzy sets where a variablesmembership of set is not binary but rather rdquofuzzyrdquo [51]
In order to save energy and transfer time in a multi-sensor network a data aggregationapproach is advantageous Instead of sending data every time it is available it can be aggregatedand transferred as a representative value instead This is generally seen as increasing the valueof the data [52]
Data aggregation in sensor networks can be seen as being of either flat or hierarchicalstructure A flat structure means all sensor data is combined into a global estimate In a
7
hierarchical structure sensor data is combined in clusters which results in a local estimatecreated in the cluster head The local estimate is then fused to obtain a global estimate [49]
Applications utilizing data aggregation was found by the authors in the survey study in [18]to vary in among other things their way of acquiring the raw data from for example sensorsOne way is by rdquopullrdquo where the aggregator requests data from nodes One way is by rdquopushrdquowhere the sensorsnodes push data to the aggregator [18]
As mentioned a Data Aggregation Process increases the value of the information it analysesThe notion that information holds a value has been a topic within economics but withingsensor networks the studies are limited according to Aggregation takes time which in a worstcase scenario could render the aggregated information obsolete This is referred to as TimeDiscounting when information loses value over time until it has no value [52]
312 Data Aggregation in Multi-sensor Systems
One practical application of Data Aggregation theory is that of Multi-sensor fusion This is asynergistic combination of sensor data in order to get more reliable data than would be possiblewith one sensor Multiple sensors also allow for having redundancy in the system in case offailure [35]
All in all the advantages can be said to be [35]
bull Redundancy increases reliability in case of failure and reduce uncertainty
bull Timeliness
bull Complimentary information Synergistic effect
bull Less cost of information
Aggregating or fusing data in multi-sensor systems can either refer to combining data fromdistributed sensor nodes at one moment of time or to data from one sensor at several instancesThis aggregation provides a synergistic effect providing more valuable information than theindividual sensors alone thus leading to systems being able to operate more autonomously evenin dynamical environments Also having different types of sensors can allow for sensing evenin different operation conditions for example day- and night conditions [35]
Sensor networks and rule-based systems are the most common application for multi-sensorfusion and allow for hierarchical structures [35] where the decision-making can be delegated tothe lower level nodes forming a decentralized or distributed architecture On the other side ofthe spectrum is the centralized architecture where the sensor nodes are providers of data for acentral intelligence which processes the data This central unit can for example be located in acloud [45]
Applications Although originally emerging for military purposes multi-sensor fusion nowfinds applications within environmental sensing (Wireless Sensor Networks WSNrsquos) medicaltechnology autonomous robots and the automotive sector [43]
One of the important applications for sensor data fusion is said to be that of mobile robotsHaving multiple sensors allow them to gain perception and achieve path planning and obstacleavoidance [36] Having real-time knowledge of a mobile robots position is essential howeverGPS is intermittent and low frequency thus requiring the combination with other sensors in adead-reckoning system In [17] angular wheel encoders measuring wheel velocity normally usedfor ABS breaking is proposed as these extra sensors A conclusion was that combining all fourwheelsrsquo sensors significantly increased the positioning accuracy during GPS blackouts comparedwith only using the sensors of the two back wheels
Another application is mobile sensing where large amounts of data are gathered by partici-pants mobile devices (smartphones) Because of available GPS this is useful for geo-referencing
8
data [25] A reduction of the amounts of data is however necessary In [25] a vehicular sens-ing application for mapping roughness of road surfaces is proposed The application utilizesaccelerometer data collected from vehicles via mobile devices and applies an architecture of lay-ers of aggregation to reduce the size of the data The aggregation is both spatial and temporalie data points varying in geographical location and time
Another central area of multi sensor systems where data aggregation gives value to thesystem is in that of Wireless Sensor Networks A WSN consists of several sensor nodes thateach transfer data wirelessly to a sink node By using data aggregation the data from thesensor nodes are aggregated into one value This opens up for reducing traffic on the networkcompared to if the raw data from all sensors would be transmitted [31]
Sensor systems of this kind can be cluster based both statically clustered and dynamicallyclustered In the case of static clustering the sensor nodes transmit their data to a cluster headwhich aggregated and sends the aggregated data to the sink The cluster head is predetermined[31]
Dynamically clustered networks decide which node is the cluster head depending on targetssuch as closeness to the sensed event This reduces the amount of hops the data must travelto the sink A hybrid approach between statical and dynamical clustering is proposed in [31]where
Likewise in a hierarchical aggregation technique local aggregations are parallelly createdlocally in the cluster heads and are sent to the sink for global aggregation [49]
In [49] an algorithm that adaptively decreases the weight of nodes if they fail is proposedand also adaptive sampling when there are large fluctuations in the aggregated values whichindicates an event of interest the sampling rate is increased
Architectural Aspects Where before one sensor whas linked to a specific application in amodern car there is a growing interconnection of functions One sensor can deliver environmentaldata to several applications There are savings in using sensors for more applications forexample using the wheel ABS-sensors for controlling the transmission [24] Driver assistanceand safety functions are the largest factor for this growing interconnectivitynetworking ina car [24] Sensor data fusion is applied in intelligent transportation systems where speedand position data can be fused for vehicle tracking purposes [36] The consequences of thisinterconnectivity The reduction of the number of physical components as a result of reuseof sensor signals generally leads to an increased safety however a failure of one sensor canhave serious consequences Furthermore the development becomes more difficult and calls forcomputer aided architecture design and development as proposed in for example [13] [24]
Just like one sensor can be used for several applications several sensor signals can be usedin one application The sensor data is reduced by model based filtering (for example ExtendedKalman Filters EKFrsquos) adaptive filtering or fusion The consequences as listed in bullet listedin the beginning of Section 312
Multi-sensor fusion can be divided between centralized- decentralized- and hybrid architec-ture In a centralized architecture all processing of raw data happens at a central node ofthe network without preprocessing at sensor nodes This gives more raw data to the centralnode thus providing higher accuracy The bandwidth of the system is however high since moredata is transferred Also the scalability is limited in this approach since modification of thesystem requires re-optimization On the other hand a decentralized architecture provides dataprocessing at sensor level requiring less bandwidth and offering more scalability A comparisonbetween requirement fulfillment between these approaches from [24] is shown in Table 1
9
Requirement Centralized Decentralized
No loss of information + -High degree of accuracy + -
Consistent model assumptions + -Low bandwidth - +
Homogenous processor load - +Easily modifiable - +
Table 1 Comparison between centralized- and distributed architecture for data processing [24]
To connect the raw sensor readings to what they represent in the environment in automotiveapplications the term sensor model is used It is a model of the sensor data and how it representsthe vehiclersquos environment It is made for individual sensors and currently not for multi-sensorsystems as one unit [43] The data fusion process often makes assumptions concerning how wellthe sensor model represents the real sensor data [35]
The fusing of information can be seen to take place at different levels signal level featurelevel pixel level or symbol level Data can often be fused at one or more levels Fusion on asignal level renders a signal commonly of the same form as the input but of greater qualitySignal-level fusion is often not possible if the sensors are distributed on different platformsdue to communication delays The levels are distinguished by what type of information theyproduce how the sensor is modeled and in what way the fusion increases the quality of thedata [35] If the signals are one-dimensional (they sense the same property in the environment)a weighted average can produce a more reliable output by making sure all sensors contributeto the fusion but to a degree decided by the confidence in the data [26] Whereas if the signalsare multi-dimensional a Kalman filter approach can be used [35]
An architecture for fusion of environment sensor data for ADAS systems is proposed in [24]where the levels sensor level fusion level and application layer are proposed since processing ofsensor data is application dependent This allows for adding new applications without alteringthe lower levels (filters and fusion) [24]
32 Advanced Driver Assistance Systems (ADAS)
Many vehicle safety systems to improve stability and grip on cars have been introduced in thelast thirty years such as Anti-Lock brakes (ABS) stability controllers such as Electronic StabilityControllers (ESC) and are commonly known as Advanced Driver Assistance systems (ADAS)[12] An ESC system is commonly consisting of sensors steering wheel angle acceleration sensors(dual axis) and angular velocity (one axis) and wheel velocity sensors [44]
The area of V2V- and V2I communication are seen as technologies that can enable furtherdevelopment of ADAS but they are constrained by accuracy reliability and delays The delaycan generally be contributed to the fact that the event of breaking is noticed by measuring thedistance to the preceding vehicle where a faster alternative would be to wirelessly transmit thebreaking signal of the front vehicle [10]
The advanced safety systems save lives but increases the bus load and how many ECUrsquos areneeded thus increasing costs Efforts are therefore made to merge and re-use sensor informationOne method is that of sensor fusion merging sensor data at subsystem-level that can be re-used For example clustering inertial sensors closely together and integrating them to the sameECU In this way they can be housed together saving cabling collecting the signals allowingfor synergistic processing for example via model-based algorithms [44]
10
321 Slip detection and control
The contact points between the car and the road surface is the key factor causing the dynamicalbehavior of a car ie the source for forces and torques generated [12] Modeling vehicle-grounddynamics is complex because of parameters such as tire body and soil properties [32]
Slip is seen as the relative motion between the tyre and the road surface the vehicle moves onSlippage of wheels can refer to either longitudinal slip which occurs in the forwardbackwarddirection of the wheel velocity while lateral slip is orthogonal to that of longitudinal slip [37]
Slip is a common occurrence of mobile robots especially when taking sharp turns [37] Thismakes control and positioning of the system difficult which makes an early detection of slip to beessential In [28] a slip detector is implemented on a mobile robot in order to switch between twoKalman filters one for when the robot is slipping and one for when it is not slipping The slipdetector compares sensed velocity from an accelerometer to the wheel velocities A differenceover a certain treshold is considered as a slip and the threshold is decided experimentally [28]
Figure 4 Illustration of lateral and longitudinal direction of slip
Modern cars have ABS systems for detecting and controlling wheel slip this in order toavoid the wheels from locking when breaking hard If the wheels lock the vehicle will startslipping losing the side force causing it to stay on the road but also losing the longitudinaltraction Longitudinal traction can also be lost when the wheel gives too much driving torquecompared to the road friction which means it often happens on wet or icy road surfaces [33]
Strategies for slip detection and control depends on the vehicle and how many wheels aredrivennot driven Generally in order to control the slippage two variables needs to be sensedon the vehicle vehicle velocity and individual wheel velocities [55] Slip ratio is defined ashowever this does not apply if all wheels are individually actuated a so called All-wheel drive(AWD) vehicle
Estimating the slip ratio has been researched in recent years [57] One input that is necessaryis the vehicle speed as mentioned above This can be measured by either inertial sensors [44]such as a gyroscope or integration of accelerometer data Alternatively it can be acquired bymeasuring velocity on a non-driving wheel [57] Other means of measuring operational velocityof the vehicle exists such as GPS or visual sensors but these are not fast enough for real-timeslip detection and control [34] Generally obtaining the vehicle speed directly is not practicalaccording to [33] It is instead proposed to be extracted from more easily obtained data suchas wheel torque or wheel speed [33] One approach for estimating vehicle velocity is an adaptivenonlinear filter where the estimation is based only on wheel velocity data [11]
Another approach is to estimate the slip ratio using Extended Kalman Filter (EKF) such asin [57] where the more measurable quantities torque and individual wheel velocities are fused toestimate the slip ratio However Kalman filters can result in high transient errors [11] In [53] asimilar approach is used but fusing IMU data of the a small ground robotrsquos forward velocity andthe front wheels velocities from encoder data Combining measurement data with a dynamicvehicle model in a EKF in order to detect immobilization (slipping) of the ground robot Thealgorithm successfully detected 20 instances of immobilization with an average detection time
11
of 04 s [53]In [39] the identified problem of wheel slipping when performing odometry on mars rovers
is discussed It is stated that as long as at least one wheel on the individually all-wheel driverobot has traction the position of the robot can be known However if all wheels slip All-wheelslippage (AWS) this is a condition that needs to be recognized The most efficient AWS-indicators was said to be compare encoder readings with each other compare encoder readingswith gyro current indicator where motor currents are measured and Acceleration Indicatorwhere encoder readings are compared to an accelerometer [39]
With introduction of more powerful electric vehicles on the market slip detection and pre-vention gets easier than with combustion motors This is because the torque response of anelectric motor is significantly faster than that of a combustion engine [57]
In [55] a fuzzy controller is designed to control the desired slip of one wheel also proposingan algorithm detecting sensor faults In another article [33] another longitudinal slip controlleris proposed where four independently actuated wheels are controlled to detect longitudinal slipand do a controlled re-adhesion to the surface
33 Cooperation between CPS
Moving the paradigm of CPS from a single system interacting with its surroundings to insteadhave several CPSrsquos interacting with each other means a transformation towards system-of-systems This would lead to a society where more and more machines cooperate and communi-cate without human intervention M2M V2V etc The move of perspective from one node andits interactions with its physical surroundings to instead focus on a situation where nodes makedecisions based on local knowledge requires decentralization of decisions and design of localizedalgorithms where CPSrsquos make decisions based on local knowledge [50]
Currently existing M2M applications commonly utilize a central node for collecting dataand making decisions a sink node The data is collected by sensors and is then bounced tothe sink via ex single hop or multi hop communications This is called a networked controlsystem where the network is a medium between computation and physical entities Howeverthe goal according to [50] is to instead let the network itself be decision maker and actuator infuture applications These large scale CPS have the challenge of implementing data processingfusing multiple sources of data and different types of data while also maintaining security andscalability [50]
One application of this M2M technology is stated to be Intelligent Transportation whichcould bring safer greener and more efficient transportation [50] A cooperative driving systemas mentioned in [13] allow vehicles to adapt their motion to the traffic situation they are inThis by using information which the vehicles communicate to each other (V2V) or from roadinfrastructure (V2I) A vehicle generally has little influence over nearby vehiclesrsquo behavior whichmay or may not follow traffic rules but it has the ability to broadcast information about itselfThus leaving the decision making to the surrounding vehicles [13]
Vehicular ad-hoc Networks (VANETS) is a term for collaboration between vehicles (or ve-hicles to road infrastructure) in a temporary distributed network The purpose is to providedrivers with warnings about critical situations for example approaching emergency vehicles orcollision warnings [7]
Data aggregation enables for M2M applications to have low cost and consume less powerwhich could be an issue for large scale applications Cloud computing can also enable scalability[50]
SafeCOP focuses on CO-CPS communicating via wireless channels and safety assurancethat CO-CPSrsquos safety requirements are not compromised Since platooning or other M2MV2Vsituations means that one vehicle may influence the behaviour of other vehicles which meansthat functional safety must be guaranteed (absence of unreasonable risk caused by malfunc-tioningundefined behaviour of the system) Guaranteeing functional safety for automotive
12
Figure 5 Depiction of V2V (M2M) and V2I communication [38]
systems with M2MV2V components means a progression beyond the current state-of-the-artof automotive functional safety is necessary [7]
It is stated that a cooperative driving context should be able to judge which of its con-stituents are working as intended and use that as a basis for decisions [13]
A cooperative driving system consists of tasks of both high criticality and low criticalitythis affects the architecture of the system [13]
331 Concurrency and Isolation
Concurrency refers to the execution of two tasks at seemingly the same time Conflicts canoccur due to dependencies [9]
The avoidance of two concurrent transactions (readwrite) interfering with each other isreferred to as isolation [9] A full isolation requires more performance which is not alwaysapplicable in embedded systems deadlines can be missed due to strict concurrency control [20]A relaxation of the requirements of isolation has therefore been proposed [19]
Since a real time system monitors the environment having data that corresponds to theactual environment is of highest importance This is referred to as temporal consistency [18]
A real-time system can have different strictness with regards to temporal consistency andare characterized as
bull Soft
bull Firm
bull Hard
For a hard real time system outdated data is not an option while for soft real time systems itcan be tolerated at the cost of usefulness [18]
34 Conclusions from Literature Review
Here some important conclusions found in the literature review are highlighted
bull Driver assistance- and safety functions are the largest factor for the growing interconnec-tivitynetworking in a car [24] It is important to merge and re-use sensor information[44]
bull There are savings in using sensors for more than one application for example using thewheel ABS-sensors for controlling the transmission as in [24] or for vehicle localizationalgorithms seen in [17]
13
bull Obtaining the vehicle speed directly is not practical It is instead proposed to be extractedfrom more easily obtained data such as wheel torque or wheel speed [33]
bull Aggregation of sensor data provides a synergistic effect providing more valuable informa-tion than the individual sensors alone Consequently CPSrsquos utilizing this fact are able tooperate more autonomously even in dynamical environments [35]
bull If the signals are one-dimensional (they sense the same property in the environment) aweighted average can produce a more reliable output by making sure all sensors contributeto the fusion but to a degree decided by the confidence in the data [26]
bull The area of V2V- and V2I communication are seen as technologies that can enable furtherdevelopment of ADAS but they are constrained by accuracy reliability and delays Thedelay can generally be contributed to the fact that the event of breaking is noticed bymeasuring the distance to the preceding vehicle where a faster alternative would be towirelessly transmit the breaking signal of the front vehicle [10]
14
4 Implementation
The second part of the thesis is the implementation part The goal for the team of five is toproduce a demonstrator for platooning to stand as basis for the individual research as well asbeing a platform for future research within platooning Intelligent Transport andor ADAS thatcan be used by Alten The individual focuses for the five members have been
bull Robust communication for mixed criticality systems
bull Modeling and control of ADAS
bull Lane detection and lateral control
bull Longitudinal control
bull In this report data aggregation strategies for sensor data in time sensitive applicationswill be investigated and tested on a use case
41 Implications of convoy driving
Drivers of heavy duty vehicles know from experience that driving closely to the preceding vehicleresults in lower air drag and leads to having to give less gas to propel the vehicle The fact is thatdecreasing the distance between heavy-duty vehicles (HDVrsquos) results in lower fuel consumptionand less congestions on the roads The advantage of automating the process of platooning in anintelligent transportation system is an improved flow of traffic affecting even private motoristson the road [10]
However linking several heavy machines in high speeds close to eachother leads to a difficultdynamic Small steerings of one vehicle immediately affects the vehicles in the chain [10]
Existing technologies as well as emerging ones are needed to enable platooning Such asimproved use of sensors wireless communication and advanced driver assistance systems Keytechnologies are the V2x technologies In normal adaptive cruise control there is a delay intro-duced because deceleration of the preceding vehicle is detected by sensors on the vehicle behindand needs processing in order to take action and break An advantageous approach would beto instead wirelessly transmit for example the breaking signal from the front car causing theback vehicle to take action earlier without having to wait for its sensors to detect the actualvelocity decrease [10]
In [10] the scenario of two identical HDVrsquos in a platoon is studied and the safe set of distancesbetween the vehicles is experimentally investigated in the case of collaborative breaking Thecollaboration means that the vehicles can access each others velocities accelerations and controlinputs Varying intermediate distances as well as reference velocities are examined with full sizeScania HDVrsquos It is stated that having varying breaking capabilities in the platoon affects thissafe set The conclusion as mentioned earlier in this report is that two HDVrsquos can keep 12m but the recommendation is 2 m when a worst case communication delay of 500 ms is takeninto account [10]
42 Use Case Vehicle Control Loss Warning
The technology of aggregating multi-sensor data in a time sensitive system will be verified ona use case For this thesis the use case is that of rdquoControl loss warningrdquo from SafeCOP Thesystem is to produce a warning signal to nearby vehicles when something affects the vehiclersquosfunctionality and thus its ability to be part of a platoon [8] In this case slip of one or morewheels will be investigated
The ABS functionality of a modern car assures traction to the road The implementationpart of this project will look at the detection of slip however not how it can be prevented Theinconsistence between wheel velocities and the vehicle velocity is referred to as slip
15
The use case is aimed towards real trucks but for the scope of this project two modifiedRC-cars will be used as a demonstrator The cars are identical and are driving autonomouslyon a test track indoors The cars utilize four-wheel-drive and unlike full sized trucks are purelyelectrical since the demonstrator is created for indoor usage However there exists communi-cation between the secure sides of the two vehicles the subject of a related thesis of anothermember of the project team which enables research of intelligent transport systems and col-laboration within platoons It also allows for warnings to be sent between the front and backvehicles
The basis for this warning will in this study be an aggregation algorithm of wheel sensordata in order to detect a slip
Figure 6 Control loss warning
43 Requirements
The requirements of this system is separated into those regarding the use case and thosereferring to the global convoy driving context
431 Requirements for Use Case
As described in Section 13 the use case for the demonstrator to be evaluated for is that of acontrol loss warning sent to the vehicle behind
1 The vehicle behind should receive the warning within a time frame where it has a chanceto fully stop to avoid rear ending collision
2 Omission of warning should not occur when aggregated data indicates slip of wheel
432 Requirements for Convoy Driving
1 Two vehicles shall be able to keep a distance of 50 cm between them
2 The demonstrator shall be able to safely detect and switch between platooning and non-platooning state
3 The demonstrator shall function indoors at flat ground
4 Both vehicles must keep within the lanes of the test road at all times but should notdeviate from the center line more than 2 cm
5 An object on a colliding course shall be detected by the front vehicle
6 Both vehicles shall be able to perform a full stop within 01 seconds
44 Hardware
The main platform for this thesis is the Zynq-7000 Both vehicles will house this component onan interfacing board either Zedboard or the more industrially adapted development platformthe EMC2-DP board and be connected each other wirelessly in order to share traffic data andthus forming a small demonstrator of an Intelligent Transport System with V2x capabilities
16
441 Board
The main processing component is the Software-on-Chip Zynq 7000 which contains dual-CoreARM9 processors as well as programmable logic (PL) in the shape of a Field ProgrammableGate Array (FPGA) with an AXI bus which forms an interface to between the PL and theprocessor side (PS) [4] Using the ARM TrustZone architecture the two cores are partitionedinto a non-secure and a secure virtual CPU The switching between non-secure and secure zoneis performed by a monitor The monitor is responsible for saving the state of the zone it isswitching from and loading it when reentering [56]
442 Field Programmable Logic - FPGA
In the automotive industry the increasing use of sensors and the signal processing pertainingto these continues to grow more complex Algorithms running on hardwired logic insteadof software-based solution is likely to have better timing performance however resulting inless flexibility when designing and redesigning It is possible to instantiate a microprocessoron the FPGA via a so called IP-block which are provided by core vendors such as ARM orby third parts These embedded processors are stated to be suitable for for example sensorconditioningpre-processing of sensor signals [48]
This project utilizes the design software Vivado provided by Xilinx where block IPrsquos canbe instantiated with following synthesis and verification of the design
The design of the FPGA used in the demonstrator can be seen in Appendix 6
443 Car platform
Two regular 18 scaled RC cars were modified and equipped with sensors for the purpose ofdriving autonomously in a platoon on an indoor track
Figure 7 Car platform before adaptation to autonomous driving (left) and mounting of one encoderon wheel axis (right)
444 Sensors
bull LIDAR for distance measurement and longitudinal control
bull Camera for lane detection and lateral control
bull Rotary encoders for individual wheel velocity measurements as seen in Appendix 6
bull ADC conversion of battery voltage
Initial system tests were performed to look at the sensor signals and to verify that the systemlogging via dualOS-communication works The car was run at full speed intermittently withthe sensors being sampled every 25 ms
17
Figure 8 Voltage fed from batteries at full gas test
Figure 9 Raw velocity data of driven wheel at full gas test
45 Software
Driven by the need to lessen the costs of embedded systems the phenomenon of Mixed Crit-icality systems have emerged The idea is to share system resources (memory processor etc)amongst both critical and non-critical tasks An isolation is however necessary either temporal(timesharing) or spatial (a physical division of trusted and non-trusted hardware) The conceptof virtualization allows for different operative systems to execute on the same hardware platformusing a so called hypervisor
Figure 10 Hypervisor for safe and separated vehicle systems [22]
In the demonstrator of this thesis on two ARM cores of the Zynq-7000 runs two concurrentoperative systems coordinated by a Virtual Machine Monitor [56] One open source RTOSFMPToppers and one Linux GPOS The idea is to separate critical tasks such as steeringbraking and controlling the vehicle from non-critical tasks thus forming a Mixed Criticalitysystem
451 RTOS ToppersFMP and SafeG
Toppers (Toyohashi Open Platform for Embedded Real-Time Systems) is an RTOS providingsupport for multi-core processors and providing APIrsquos for assigning tasks to specific processorsduring run-time Provided is also the software for concurrently running a Real-Time Operativesystem alongside with a GPOS on the same processor via the virtual machine monitor SafeG
18
The RTOSrsquos real-time requirements are however guaranteed despite the timeresource sharingwith another operative system [5]
452 GPOS Linux Digilent
An embedded Linux solution targeting Zynq-7000 and Digilent FPGA devices including devicetree Linux kernel and root file system In this project the Linux represents the non safetycritical part of the system
453 Dual-OS communication
As mentioned the Virtual Machine Monitor developed by FMPToppers SafeG allows forrunning both safety critical and non safety critical applications on the same platform butisolated This isolation however makes critical zones unable to communicate with non criticalzones Therefore inter-OS communication is enabled via a dual-OS communication mechanismwhich utilizes shared memory slots This allows for communication between secure and non-secure software [56]
Figure 11 Function of virtual machine monitor SafeG provided by FMPToppers which acts as a safeseparation between GPOS (Linux) and RTOS (FMPToppers)
454 SoA and SHAPE
For communication between the nodesboards in the distributed system that is the two-carplatoon the existing Service Oriented Architecture (SoA) based platform called SHAPE3 isused SHAPE implements a middle layer of software which enables a cloud approach betweenthe nodes of the system where local knowledge for the system-of-systems is shared and storedSHAPE allows for several master-nodes to be present [41] but with different priorities [15]The master node with the highest priority is responsible for registering active services (pro-ducerconsumer) [15]
The approach of implementing a middleware a layer of software in a distributed systemallows for abstraction to the distributiveness which means it is not obvious from the perspectiveof a userapplication developer that the system is distributed [41]
46 Software design of demonstrator
On the RTOS five cyclic tasks are running with one being a switching-task which gives timeslots to the GPOS for execution of tasks of lower criticality Each task interacts with differentperipherals andor memory Shown in Figure 12 are the tasks and a simplified depiction oftheir interaction with memoriesperipherals The task of relevance for this thesis is the DataAggregation task The cyclic tasks of the RTOS are
3An abbreviation of Self-configurable High Availability and Policy based platform for Embedded systemsSHAPE is developed by Enea for automotive project DySCAS A major goal of DySCAS was to develop middle-ware for distributed automotive systems [41]
19
Longitudinal control regulates the distance between the two vehicles by sampling the LI-DAR and calculating the output signal to the driver
Lateral control analyzes the input from the lane detection module (RaspberryPi) and turnsthe steering servos accordingly
Wheel data aggregation reads memory addresses where wheel velocity data from all fourencoders is continuously updated from the FPGA performs aggregation and thereafter com-municates with the secure-to-secure inter-vehicle communication task (the scope of a parallelthesis work)
Inter-vehicle communication See Figure 12 for overview where BT is the switching taskof low priority switching between the two operative systems
Switching task switches between RTOS and GPOS a low priority task
Figure 12 The six tasks executed on RTOS and simplified depiction of peripherals interacted withHighlighted are the tasks and interactions of highest relevance for this thesis
47 Slip detection on the demonstrator
Relating to the use case of control loss warning where the system is to produce a warning signalto nearby vehicles when something affects the vehiclersquos functionality and thus its ability to bepart of a platoon [8] this thesis chooses to investigate the demonstrator in the context of slip
Slip is commonly measured by quantity slip ratio used in for example ABS-systems and inthe demonstrator as seen in Figure 13 and is defined as in Equation 1 [1]
ρslip =vvehicle minus viwheel
vvehicle(1)
471 Related works for slip detection
As stated in the Literature Review obtaining the vehicle speed directly is not practical accordingto [33] It is instead proposed to be extracted from more easily obtained data such as wheeltorque or wheel speed [33] Furthermore visual sensors such as GPS or camera of which thelatter the demonstrator in this thesis is equipped with are said to not be suitable for real timeslip detection [34] Also a GPS is disturbed by trees and buildings [29] In [30] it is however
20
Figure 13 Demonstrator car with velocity parameters marked and simplified schematic of the driveline with DC-motor drive shaft and differential gears
concluded that image based sensors can be applicable for velocity sensing in mobile robotsand automotive applications The advantage compared to encoder based solutions is that theyare not affected by slip and can therefore be used as objective vehicle velocity to detect slipSubsequently they can also detect the lateral velocity (car moving sideways) which can occurwhen slipping something not measurable by wheel encoders
In [34] only wheel encoder measurements are used for slip detection and control of arobot with individually actuated wheels which is a common setup for Wheeled Mobile Robots(WMRrsquos)
In [58] the wheel velocities are instead indirectly measured from the individually drivenwheel-motorrsquos armature currents during a slip experiment depicted in Figure 14 A compari-son between the armature currents and the wheel velocities allows for detection of slip and apredictive slip controller is also implemented to minimize the effects of the slip
A similar approach but applied on an electric railway vehicle is proposed in [54] wherearmature current is used to detect slip by finding torque differences between wheels and also toperform controlled re-adhesion to the rails The system is modeled and the results are simulatedwhich shows success in detecting small slips compared to using wheel velocity sensors [54]
Figure 14 Description of slip experiment performed in [58]
Vehicle velocity can be measured in the following ways
bull Measured on non-driven wheel [57]
bull Accelerometer integration not appropriate for low velocities [29]
bull Optical sensor [57]
21
bull Image based sensors [30]
bull GPS [17]
Or estimated
bull Using EKF based approach on individually actuated wheels [57]
Figure 15 Velocity measurements at slow speeds Comparison between integrated accelerometer dataand wheel encoder data [29]
In Section 321 some examples of applications for slip detection and slip control are de-scribed It is clear that a common application is in wheeled mobile robots (WMRrsquos) whereodometry and thus slip detection are important tools for localization of the robot The appli-cations are for example lawn mowers or mars rovers as in [39]
In [17] it is proposed to reuse the already existing angular encoders present for the ABSsystem in a normal car in order to localize the vehicle via odometrydead-reckoning The sensorsignals are fused via an EKF and experiments are performed on a real car A case where a GPSsensor is available to correct the positioning is also considered It is concluded that the use ofall four wheel sensors are necessary [17]
As stated in Architectural Aspects in the Literature Review in a multi-sensor system forsignals which senses the same property in the environment a weighted average can produce amore reliable output by making sure all sensors contribute to the fusion but to a degree decidedby the confidence in the data [26] Whereas if the signals are multi-dimensional a Kalman filterapproach can be used [35]
In [49] a problem is identified as giving less weight to faulty sensors in a widespread WSNsensing the environment The approach utilizes the concepts of adaptive weighted average andspatial correlation meaning that sensors located in the same area are expected to show similarreadings If a sensorrsquos readings deviate from nearby sensors this is said to indicate a highlikelihood of sensor failure Less weight should therefore be given to that node when processingthe data instead relying more on the neighboring sensors [49]
472 Proposed approach for slip detection on the demonstrator
In [49] each sensor is associated with an estimated weight wi which is updated every iterationof the algorithm according to
wi[t+ 1] = wi[t]plusmn∆wi[t] (2)
where i denotes the sensor and the change in weight ∆wi is given as
∆wi[t] = |τ | lowast ε (3)
22
Scaling factor ε is application dependent and chosen to assure that 0 lt ∆wi[t] lt 1 and τ is calledan adaption parameter and represents how well a sensor reading correlates to the surroundingsensors a larger value indicating lower correlation and is defined as
τi =riminus1 ri+1rk
kminus ri (4)
where ri is the sensor reading for the ith sensor and k is the number of neighboring sensors[49]
This approach of adapted weighted average will in this thesis be used as the aggregationalgorithm depicted as a funnel in Figure 16 that estimates the vehicle velocity vvehicleestbased on the individual wheel velocity readings v1 v2 v3 v4 of the four wheels The slip ratioρslip is thereafter calculated based on the estimated vehicle velocity and the individual wheelvelocities The slip ratio is compared to an experimentally set threshold in order to determineif there is an occurrence of slip on the demonstrator or not
The way-of-work for the implementation was to initially simulate slip detection with theproposed algorithm running in MATLAB on collected data from the demonstrator but after-wards The advantage of using simulations was to expand knowledge about the data and thealgorithm tuning parameters and experimenting with external velocity references After thesimulations the algorithm was implemented in real time on the RTOS of the demonstrator
The algorithm is described in C-style pseudo code as follows
23
velDataPoint Queue[10] structure to hold 10 data points
while(1)
velDataPoint dataP structure to hold velocity and weight data
insert(dataP) insert in Queue
if isFull(Queue)
for sensor 14 in newest data point
avgwin[rear] = average velocity based on 10 last data points
deltaw[rear] = abs(avgwin)
set weight attributes for last data point based on
properties of second last data point
if deltaw[rear-1] is strictly smallest of all sensors
w[rear] = w[rear-1] + deltaw[rear-1] increase weight of that sensor
else
w[rear] = w[rear-1] - deltaw[rear-1] else decrease weight of that sensor
for sensor 14 in newest data point normalize weights
wnorm = w[rear]weightsum
for sensor 14 in newest data point calculate weighted average
avg_weighted = avgwin[rear]wnorm
removeOldest(Queue) remove oldest data point in queue
Showing an implementation of the algorithm from [49] adapted for the purpose of aggregationof raw wheel data in real time filtering and outputting an estimated vehicle velocity based ona weighted average of the four wheel sensors
Since the aim is to detect differences between wheel velocities and vehicle velocity both stalland slip were situations of interest during tests Initially stalling was used during simulationsbecause of simplicity and reproducibility thereafter moving on to tests on a slippery surface forthe real-time tests
24
Figure 16 Proposed procedure showing data collection data aggregation and estimation of vehiclevelocity followed by a comparison between calculated slip ratio and a threshold in order to detect slip
25
48 Initial simulations
Initial tests were performed using four encoders mounted on the wheels of the demonstratorThe proposed approach is to use the local (individual) wheel velocity data of the four wheels todeduce a global estimate of the vehicle velocity using the adaptive average strategy for spatiallycorrelated sensors seen in [49] Depending on a sensor readingrsquos convergence with the expectedvalue for that time point the different sensors are given a weight which can be seen as levelof trustworthiness In this case it is however not the issue of faulty sensors we wish to detectbut the actual deviation of wheel velocities from the other wheels in order to adapt the globalestimation of the vehicle velocity
481 One- and two wheel stall
Per definition a maximum slip ratio is achieved when a wheel is completely stalled Theslip ratio is then = 1 Because of the simplicity and repeatability of stalling a wheel whilerunning the others an induced stall of one wheel was performed and the data was afterwardsrun through the proposed algorithm using MATLAB The full code for the simulations can befound in Appendix A MATLAB code for data aggregation
The tests consisted of the car being brought to speed while the wheels spun freely aboveground as presented in the left image of Figure 17 one wheel was then manually stalled Theresults can be seen in Section 51 Results from simulations
Regarding two-wheel stall a similar test but with two wheels being stalled at the same timewas performed The results can be seen in Section 51 Results from simulations
Figure 17 Set-up for tests Left image shows in-air suspension where manually induced wheel velocitydifferences (stalling) was performed Right image shows the demonstrator on a surface with minimalfriction on left back wheel as used in slip tests
49 Real-time implementation on the Demonstrator
The algorithm previously run in MATLAB was now implemented on the demonstrator softwarein order to provide the functionality of slip detection in real-time
491 Demonstrator Architecture
The task of Data Aggregation was implemented as a cyclic task on the RTOS sharing time withother cyclic tasks All tasks can safely share data with each other via implemented mailboxesa functionality provided by FMPToppers along with most RTOSs A sequence diagram forthe system modules and their shared data can be seen in Figure 18 where the parts of highestrelevance for this thesis are highlighted Besides inter-RTOS communication via mailboxes ademonstrator vehicle also communicates with other vehicles and infrastructure via WiFi thusforming a demonstrator of a small V2x system
26
Figure 18 Sequence diagram showing system modules and their shared data via mailboxes on theRTOS Highlighted are the modules and transactions of highest relevance for this thesis
492 Real time data aggregation on the demonstrator
Stalling On the RTOS a digital filter using the average of the ten last samples was imple-mented using a queue of data points Each structure data point is associated to four velocitiesvel1234 as well as average velocities avgwin1234 based on the 10 last data points Alsoweights w1234 and weight updates for the next iteration deltaw1234 are enclosed in thisstructure see Figure 19
An equivalent test to what is seen in Figure 20 was performed but this time with all com-putation taking place in real time on the RTOS instead of afterwards in MATLAB All wheelswere brought up to speed thereafter inducing a stall on the left back wheel (wheel number 1)The results from this test can be found in Section 52 Results from real-time implementation
Slipping Slip dynamics for a real slip on the demonstrator was investigated In order toachieve controllability and repeatability in the creation of a slip the demonstrator was partlyhindered from going forward by pressing a hand to its front while still given considerable forwardpropulsion This resulted in a noticeable slip of the left back wheel which was taped to reducefriction for the experiment as can be seen in the right image of Figure 17 An example of whata slip looks like will can be seen in Section 52 Results from real-time implementation alongsidewith results of real-time slip detection for one and several instances of slip respectively
27
Figure 19 Attributes of structure velDataPoint and illustration of the implemented queue
28
5 Results
The simulations described in Section 48 Initial simulations indicated feasibility in using theweighted average approach for estimating the vehicle velocity without using too much compu-tation time The algorithm was thereafter implemented as a cyclic task on the RTOS with arecorded worst-case-execution time of 4micros measured by a high-resolution hardware timer over6351 executions of the data aggregation task This result is only valid for the target hardwarebut indicates that the aggregation strategy is not to heavy to be run on the RTOS of a similarsystem
In this section follows a presentation of the results from simulations and real-time imple-mentation respectively
51 Results from simulations
Here follows results from the tests where data was collected from the wheels during one- and two-wheel stalling and the algorithm applied afterwards in MATLAB The output of the weightedadaptive average is compared to a regular average value of all four wheels
511 Simulated aggregation during one-wheel stall
From the graph seen in Figure 20 it can be noted that the vehicle velocity estimation usingthe adaptive average approach results in the estimation coinciding more to the other backwheel which is not stalled v2 The reason for v2 also being slightly affected by the stall is thedifferential gear between wheel 1 and wheel 2 as seen in Figure 13
Figure 20 One-wheel stall test showing that the weighted adaptive average follows non-slipping wheelsmore because of their correlation to the other wheel velocities
512 Simulated aggregation during two-wheel stall
During a two-wheel stall it was obvious that this time fewer wheels were coherent to eachother with regards to velocity and thus the adaptive average approach produces a less valuableestimate of the vehicle velocity as seen in Figure 21 Both averages weighted adaptive andregular are compared to a reference average which is a purely hypothetical situation where thesystem would know which wheels are slipping and therefore exclude them from the averageHaving a higher number of non-slipping velocity references clearly results in a smaller differencebetween the reference average and the weighted adaptive average as seen in the right image of
29
Figure 21 Two-wheel stall test showing the impact that the number of non-slipping velocity referenceshave on the weighted adaptive average as compared to a hypothetical reference average
Figure 21 Potential sources for these velocity references that could be used in the demonstratorare discussed in the Discussion section of this report
52 Results from real-time implementation
Digital filtering was applied during all tests The filtering used an average of the ten last datapoints in the queue for each wheel The filtered and unfiltered velocity data of one wheel loggedfrom the RTOS can be seen in Figure 22
521 Real-time aggregation during one-wheel stall
Applying the proposed algorithm during a one-wheel stall just like the one seen in Figure 20rendered the results in Figure 23 when run at a cyclic period of 35ms It can be noted in themiddle graph of 23 that the weighted average produces a vastly different output compared tothe normal average during the slip starting at approximately the 100th sample coinciding morewith the non-stalled wheels than the normal average does
Figure 22 Digitally filtered and unfiltered raw velocity data from one wheel encoder with filteringperformed on the RTOS
522 Real-time aggregation during one-wheel slip
Moving onto slip an example of what a one-wheel slip looks like on the demonstrator can beseen in Figure 24 It is clear that the front wheel pair wheel 3 and wheel 4 show coherencyto each other while the back wheel pair deviate noticeably with one spinning faster and onespinning slower than the front wheels Wheel 1 having next to no traction to the surface spinsfreely resulting in the differential gear giving less torque to wheel 2 which drops to almost
30
Figure 23 One-wheel stall test with algorithm and filtering implemented in the RTOS
zero velocity Figure 24 also shows the weighted average algorithm producing a result morecorrelated to the non-slipping wheel pair
Figure 24 Slip dynamics during a one-wheel slip on the demonstrator showing the effect of thedifferential gear
As stated in the research questions the approach should be tested over several instances ofslip to determine a ratio of successful slip detection The introduction of a threshold value forslip ratio over which a wheel is said to be slipping produced the binary result of simply slipor no slip that can be seen in 25 The threshold was in this case experimentally decided to beρslip gt 08 to minimize the number of false positives Testing over several slips the algorithmsuccessfully detected all seven instances of slip as can be seen in Figure 25
31
Figure 25 Algorithm applied on a sequence of seven slips successfully detecting all instances of slip
32
6 Discussion and Future work
Using the described approach of adaptive average to estimate the vehicle velocity of the existingdemonstrator there is currently no way to get an objective measurement of the vehicle velocityto be used for comparison Instead it is assumed that the wheels with traction to the surfaceare a better representation of the vehicle velocity than wheels that are slippingndash a hypothesis that would be of interest to verifyfalsify using an objective velocity reference
It can also be discussed which wheel is most trustworthy in a slippage situation when itcomes to reflecting the actual vehicle velocity In the case of the left back wheel being thesubject of slip the front pair speeds up It should be investigated whether the right back wheelor the two front wheels are more representative of the vehicle velocity in this situation
For a better estimation of the vehicle velocity in general an objective velocity reference isneeded As previously stated in [39] all-wheel-slip for a WMR with individually actuated wheelsis determined to best be sensed by encoder readings together with other velocity references Herestated in order of preference [39]
1 Other encoder readings
2 Gyro data
3 Current indicators
4 Accelerometer data
The extra velocity reference could also be a GPS sensor often used in odometry applicationsgiven that the application can be run outdoors However the low update frequency of a GPScould pose a problem for the slip detection depending on the requirements of the system Animage sensor or camera as in [30] is also a possibility as is an accelerometer An accelerometeron the demonstrator could give the mutual benefit that a non-slipping wheel could be usedto counteract drift of the accelerometer while the accelerometer provides an extra input tothe vehicle velocity estimation Furthermore the demonstrator is already equipped with acamera and image analyzing software located on a Raspberry Pi-module making it an optionworth trying Using current sensors would not be of use for the demonstrator in questionbecause it would require extensive modeling having to consider both three-phase currents andthe differential gears dividing the torque from one central motor to the wheels Consequentlyderiving the individual wheel velocities from this data would be an unnecessary hassle
In conclusion further additional velocity references to possibly be used in the demonstratorwhen looking at what is used in related works and thinking freely could be
1 GPS (as in [17])
2 Camera (as in [30])
3 Accelerometergyroscope (as in [39])
4 More wheel pairs (Especially advantageous for heavy-duty trucks which often have morethan two wheel pairs)
5 Other vehicles (Co-operation)
Using broadcast velocity data from other vehicles to form a cooperative context would bethe most innovative approach in line with the current paradigm shift into systems-of-systemsand cooperative CPS discussed in Section Cooperation between CPS The information to beshared between the vehicles could be either an estimated vehicle velocity or the individual wheelvelocities In the latter case leaving the choice of aggregation strategy to the receiver but alsocausing more data to be transferred over the V2V channel ndash a trade-off to take into consideration
33
The alternative of using this cooperative velocity reference is however only applicable when oneor more vehicles have agreed to form a platoon together and to share data To blindly trust anearby vehicle not being in a committed platoon with you could result in omission or wrongfulcommission of the slip detection which in its current state should not be considered a hardrequirement but rather a complement to a human driver
The contribution of this thesis also includes element of real time data aggregation not onlylimited to the application of slip detection It has been shown that real-time data aggregationof multiple sensors of the demonstrator is possible directly on the RTOS and this is not limitedto wheel sensors Using the sensors already available and possibly adding more will give morefunctionality
The usage of real-time databases is becoming more common in embedded systems Usingsuch a database in future versions of the demonstrator would be advantageous since it wouldallow for the aggregation to be performed in the cloud also protecting the data from malfunc-tioning application software An RTDB guarantees timeliness which could improve the accuracyand reliability of the proposed approach The demonstrator is prepared for including a RTDBby having functioning dualOS-communication to transfer sensor data from the RTOS to theGPOS side which can then be connected to a real-time database as a service in the existingservice oriented platform SHAPE something SHAPE is already prepared for
Accuracy of proposed approach Since the vehicle velocity output from the proposed al-gorithm is an estimation the slip ratio is not exact However the approach could constistutea cheap and simple way of detecting slip mainly in smaller autonomous applications but withimplications that with usage of extra velocity references it could also work in full size appli-cations or other types of vehicles The accuracy of the proposed approach is not only limitedby external factors such as vehicle type number of wheels or transmission system It is alsodependent on internal factors within an embedded system such as how the memory is handledor delays in the system Looking at the proposed cooperative context with shared velocityreferences between vehicles more delays are introduced with the communication
In hindsight the structure for velocity data should have include a fault parameter represent-ing an arbitrary uncertainty of the system The data could and should have been timestampedwhen added to the structure velDataPoint thus allowing for evaluation of timeliness
Adequacy of proposed approach The use of additional velocity references would enablereal-time detection of slippage on more than one wheel which is a necessary expansion for thefuture that needs further investigation It is suggested from Figure 21 that a two wheel slipcould be problematic for the algorithm as is The priority should therefore be to prove theadequacy of the approach for slippage on more than one wheel and also for other numberof wheels on vehicles Only the current setup of a four-wheel drive on a small autonomousvehicle running straight has been explicitly investigated together with simulated extra velocityreferences A proposed next step would be to also include the steering angle in the aggregation(easily obtainable from the control signal of the lateral controller of the demonstrator system)It could then be known when and how much the vehicle is turning Something that could allowfor slip detection even during turns when the wheels are naturally diverging in velocities
34
References
[1] (2016) ABS presentation department of electronics and communication engi-neering sri venkateshwara college of engineering httpswwwslidesharenet
RaghavendraRaghu32abs-presentation-70307206 Accessed 2017-04-27
[2] (2017a) Artemis EMC2 embedded multi-core systems for mixed criticality applications indynamic and changeable real-time environments home page httpswwwartemis-emc2
eu Accessed 2017-06-21
[3] (2017) Crowdsourcing an Ethical Dilemma blog post on crowdflower blog httpswww
crowdflowercomcrowdsourcing-ethics Accessed 2017-06-21
[4] (2017b) Design Specification EMC2-DP V2 Sundance Multiprocessor Technology Limited2015 Accessed 2017-04-06
[5] (2017) FMPToppers Product Description and Home Page httpswwwtoppersjp
enindexhtml Accessed 2017-06-04
[6] (2017) Project Overview daggers httpesmdhseprojects Accessed 2017-03-20
[7] (2017a) Technical annex safecop project specification not published Accessed 2017-02-10
[8] (2017b) Use Cases safecop httpsafecopdeibpolimiitpage_id=45 Accessed2017-01-30
[9] Adya A Liskov B and OrsquoNeil P (2000) Generalized isolation level definitions In DataEngineering 2000 Proceedings 16th International Conference on pages 67ndash78 IEEE
[10] Alam A Gattami A Johansson K H and Tomlin C J (2014) Guaranteeing safety forheavy duty vehicle platooning Safe set computations and experimental evaluations ControlEngineering Practice 2433ndash41
[11] Amiri M and Moaveni B (2012) Vehicle velocity estimation based on data fusion bykalman filtering for abs In Electrical Engineering (ICEE) 2012 20th Iranian Conference onpages 1495ndash1500 IEEE
[12] Arat M A and Taheri S (2014) Adaptive vehicle stability control by means of tireslip-angle feedback In American Control Conference (ACC) 2014 pages 2365ndash2370 IEEE
[13] Behere S Torngren M and Chen D-J (2013) A reference architecture for cooperativedriving journal of Systems Architecture 59(10)1095ndash1112
[14] Beliakov G Pradera A and Calvo T (2007) Aggregation functions A guide forpractitioners volume 221 Springer
[15] Bergman J (2016) Policy Assertions for Web Services in Automotive Systems Mixed-Criticality and Real-Time PhD thesis KTH
[16] Bonnefon J-F Shariff A and Rahwan I (2016) The social dilemma of autonomousvehicles Science 352(6293)1573ndash1576
[17] Bonnifait P Bouron P Crubille P and Meizel D (2001) Data fusion of four abs sensorsand gps for an enhanced localization of car-like vehicles In Robotics and Automation 2001Proceedings 2001 ICRA IEEE International Conference on volume 2 pages 1597ndash1602IEEE
[18] Cai S Gallina B Nystrom D and Seceleanu C (2015a) Technical report
35
[19] Cai S Gallina B Nystrom D and Seceleanu C (2015b) Trading-off data consistencyfor timeliness in real-time database systems In 27th Euromicro Conference on Real-TimeSystems Available from httpwwwesmdhsepublications3969-
[20] Cai S Gallina B Nystrom D and Seceleanu C (2016a) Flexible verification oftransaction timeliness and isolation Technical report Available from httpwwwesmdhsepublications4276-
[21] Cai S Gallina B Nystrom D and Seceleanu C (2016b) A formal approach forflexible modeling and analysis of transaction timeliness and isolation In 24th InternationalConference on Real-Time Networks and Systems
[22] Cresswell L (2017) Separation sakrar uppkopplade bilar Elektroniktidningen 420ndash21
[23] Creswell J W (2013) Research design Qualitative quantitative and mixed methodsapproaches Sage publications
[24] Darms M and Winner H (2005) A modular system architecture for sensor data process-ing of adas applications In Intelligent Vehicles Symposium 2005 Proceedings IEEE pages729ndash734 IEEE
[25] Freschi V Delpriori S Klopfenstein L C Lattanzi E Luchetti G and Bogliolo A(2014) Geospatial data aggregation and reduction in vehicular sensing applications the caseof road surface monitoring In Connected Vehicles and Expo (ICCVE) 2014 InternationalConference on pages 711ndash716 IEEE
[26] Hackett J K and Shah M (1990) Multi-sensor fusion a perspective In Robotics andAutomation 1990 Proceedings 1990 IEEE International Conference on pages 1324ndash1330IEEE
[27] Hakansson A (2013) Portal of research methods and methodologies for research projectsand degree projects In Proceedings of the International Conference on Frontiers in EducationComputer Science and Computer Engineering (FECS) page 1 The Steering Committee ofThe World Congress in Computer Science Computer Engineering and Applied Computing(WorldComp)
[28] Hwang W Park J Kwon H-i Anjum M L Kim J-h Lee C Kim K-s et al(2010) Vision tracking system for mobile robots using two kalman filters and a slip detectorIn Control Automation and Systems (ICCAS) 2010 International Conference on pages 2041ndash2046 IEEE
[29] Iagnemma K and Ward C C (2009) Classification-based wheel slip detection anddetector fusion for mobile robots on outdoor terrain Autonomous Robots 26(1)33ndash46
[30] Joos M Ziegler J and Stiller C (2010) Low-cost sensors for image based measurementof 2d velocity and yaw rate In Intelligent Vehicles Symposium (IV) 2010 IEEE pages658ndash662 IEEE
[31] Jung W-S Lim K-W Ko Y-B and Park S-J (2009) A hybrid approach forclustering-based data aggregation in wireless sensor networks In Digital Society 2009ICDSrsquo09 Third International Conference on pages 112ndash117 IEEE
[32] Kadmiry B (2015) Fuzzy gain scheduled ekf for model-based skid-steered mobile robotIn Automation Robotics and Applications (ICARA) 2015 6th International Conference onpages 116ndash123 IEEE
36
[33] Lam T L Qian H and Xu Y (2014) Longitudinal wheel-slip control for four wheelindependent steering and drive vehicles In Robotics and Automation (ICRA) 2014 IEEEInternational Conference on pages 5280ndash5285 IEEE
[34] Li Y P Ang M H and Lin W (2008) Slip modelling detection and control forredundantly actuated wheeled mobile robots In Advanced Intelligent Mechatronics 2008AIM 2008 IEEEASME International Conference on pages 967ndash972 IEEE
[35] Luo R C and Kay M G (1990) A tutorial on multisensor integration and fusion InIndustrial Electronics Society 1990 IECONrsquo90 16th Annual Conference of IEEE pages707ndash722 IEEE
[36] Luo R C Yih C-C and Su K L (2002) Multisensor fusion and integration ap-proaches applications and future research directions IEEE Sensors journal 2(2)107ndash119
[37] Nandy S Shome S Somani R Tanmay T Chakraborty G and Kumar C (2011)Detailed slip dynamics for nonholonomic mobile robotic system In Mechatronics and Au-tomation (ICMA) 2011 International Conference on pages 519ndash524 IEEE
[38] Ndashimye E Ray S K Sarkar N I and Gutierrez J A (2017) Vehicle-to-infrastructure communication over multi-tier heterogeneous networks A survey Com-puter Networks 112144 ndash 166 Available from httpwwwsciencedirectcomsciencearticlepiiS1389128616303826
[39] Ojeda L Reina G and Borenstein J (2004) Experimental results from flexnav anexpert rule-based dead-reckoning system for mars rovers In Aerospace Conference 2004Proceedings 2004 IEEE volume 2 pages 816ndash825 IEEE
[40] Olariu S Mohrehkesh S and Weigle M C (2013) Toward aggregating time-discountedinformation In Proceedings of the 2nd ACM annual international workshop on Mission-oriented wireless sensor networking pages 57ndash66 ACM
[41] Persson M (2009) Adaptive Middleware for Self-Configurable Embedded Real-Time Sys-tems Experiences from the DySCAS Project and Remaining Challenges PhD thesis KTH
[42] Reza Mousavi M (2017) Traditionell testning klarar inte sjalvkorande bilar Elektronik-tidningen 426ndash27
[43] Rezaei M and Sabzevari R (2009) Multisensor data fusion strategies for advanced driverassistance systems Sensor and Data Fusion
[44] REZE M OSAJDA M and Halbleiter F (2013) Mems sensors for automotive vehiclestability control applications Mems for Automotive and Aerospace Applications page 29
[45] Roman R Zhou J and Lopez J (2013) On the features and challenges of security andprivacy in distributed internet of things Computer Networks 57(10)2266ndash2279
[46] Rudas I J Pap E and Fodorrdquo J (2013) rdquoinformation aggregation in intel-ligent systems An application oriented approach rdquo rdquoKnowledge-Based Systems rdquordquo38rdquo(rdquordquo)rdquo3 ndash 13rdquo Available from httpwwwsciencedirectcomsciencearticle
piiS0950705112002171
[47] Sisto A Pilato L Serventi R Saponara S and Fanucci L (2016a) Applicationspecific instruction set processor for sensor conditioning in automotive applications Micro-processors and Microsystems 47375ndash384
37
[48] Sisto A Pilato L Serventi R Saponara S and Fanucci L (2016b) Applicationspecific instruction set processor for sensor conditioning in automotive applications Micro-processors and Microsystems 47375ndash384
[49] Sridhar P Madni A M and Jamshidi M (2006) Hierarchical data aggregation inspatially correlated distributed sensor networks In Automation Congress 2006 WACrsquo06World pages 1ndash6 IEEE
[50] Stojmenovic I (2014) Machine-to-machine communications with in-network data aggre-gation processing and actuation for large-scale cyber-physical systems IEEE Internet ofThings Journal 1(2)122ndash128
[51] Torra V and Narukawa Y (2007) Modeling decisions information fusion and aggregationoperators Springer Science amp Business Media
[52] Wang X Walden A Weigle M C and Olariu S (2014) Strategies for sensor dataaggregation in support of emergency response In Military Communications Conference (MIL-COM) 2014 IEEE pages 1120ndash1126 IEEE
[53] Ward C C and Iagnemma K (2007) Model-based wheel slip detection for outdoormobile robots In Robotics and Automation 2007 IEEE International Conference on pages2724ndash2729 IEEE
[54] Watanabe T and Yamashita M (2001) A novel anti-slip control without speed sensorfor electric railway vehicles In Industrial Electronics Society 2001 IECONrsquo01 The 27thAnnual Conference of the IEEE volume 2 pages 1382ndash1387 IEEE
[55] Zahedi E and Gharaveisi A (2011) Fault detection and isolation of anti-lock braking sys-tem sensors In Control Instrumentation and Automation (ICCIA) 2011 2nd InternationalConference on pages 258ndash263 IEEE
[56] Zaki Y (2016) An embedded multi-core platform for mixed-criticality systems Studyand analysis of virtualization techniques
[57] Zhang Y Zhao H Yuan L and Chen H (2016) Slip ratio estimation for electricvehicle with in-wheel motors based on ekf without detection of vehicle velocity In Controland Decision Conference (CCDC) 2016 Chinese pages 4427ndash4432 IEEE
[58] Zhu Z Yuan K Zou W and Hu H (2009) Current-based wheel slip detection ofall-wheel driving vehicle In Information and Automation 2009 ICIArsquo09 International Con-ference on pages 495ndash499 IEEE
38
Table of Contents 1Parameters 1Read and plot data from semicolon-separated file 1Adaptive average aggregation 1Algorithm 3Slip ratios (for four wheels) 10Plots 11
clear all close all clc
Parametersconvert = 1256637 conversion from raw velocity data to radsepsi = [004 006 01]
Read and plot data from semicolon-separatedfile
Data = dlmread(marmor_testtxt[1750 0 1870 4])Data = dlmread(hejjj2txt0)Data = dlmread(hejjj2txt[170 0 280 3])
time = Data(1)v1 = convert(4Data(1)) encoder signal wheel1v2 = convert(4Data(2)) encoder signal wheel2v3 = convert(4Data(3)) encoder signal wheel3v4 = convert(4Data(4)) encoder signal wheel4
V51 = v4 + (2rand(length(v4)1))-(22) V5 = [V51(1150) V51(50119)108] V6 = V5 + (4rand(length(v4)1))-(42)
V5 = 30ones(length(v1)1) + (2rand(length(v4)1))-(22) simulated extra velocity reference signalV6 = 30ones(length(v1)1) + (2rand(length(v4)1))-(22) simulated extra velocity reference signal
Adaptive average aggregation Preallocation of vectors to be filled in loophank = hankel(110 10length(v1)) to create rolling windows of ten of which to calculate averagewhat1 = v1(hank)what2 = v2(hank)what3 = v3(hank)what4 = v4(hank)
1
Appendix A MATLAB code for data aggregation
what5 = V5(hank)what6 = V6(hank)
Four wheelsadapt_t1 = ones(length(v1)1)adapt_t2 = ones(length(v1)1)adapt_t3 = ones(length(v1)1)adapt_t4 = ones(length(v1)1)
w1 = ones(length(v1)length(epsi))w2 = ones(length(v1)length(epsi))w3 = ones(length(v1)length(epsi))w4 = ones(length(v1)length(epsi))w5 = ones(length(v1)length(epsi))
deltaw1=ones(length(v1)length(epsi))deltaw2=ones(length(v1)length(epsi))deltaw3=ones(length(v1)length(epsi))deltaw4=ones(length(v1)length(epsi))
Five wheelsadapt_T1 = ones(length(v1)1)adapt_T2 = ones(length(v1)1)adapt_T3 = ones(length(v1)1)adapt_T4 = ones(length(v1)1)adapt_T5 = ones(length(v1)1)
W1 = ones(length(v1)length(epsi))W2 = ones(length(v1)length(epsi))W3 = ones(length(v1)length(epsi))W4 = ones(length(v1)length(epsi))W5 = ones(length(v1)length(epsi))
deltaW1=ones(length(v1)length(epsi))deltaW2=ones(length(v1)length(epsi))deltaW3=ones(length(v1)length(epsi))deltaW4=ones(length(v1)length(epsi))deltaW5=ones(length(v1)length(epsi))
Six wheelsADAPT_T1 = ones(length(v1)1)ADAPT_T2 = ones(length(v1)1)ADAPT_T3 = ones(length(v1)1)ADAPT_T4 = ones(length(v1)1)ADAPT_T5 = ones(length(v1)1)ADAPT_T6 = ones(length(v1)1)
WW1 = ones(length(v1)length(epsi))WW2 = ones(length(v1)length(epsi))WW3 = ones(length(v1)length(epsi))WW4 = ones(length(v1)length(epsi))WW5 = ones(length(v1)length(epsi))WW6 = ones(length(v1)length(epsi))
2
DELTAW1=ones(length(v1)length(epsi))DELTAW2=ones(length(v1)length(epsi))DELTAW3=ones(length(v1)length(epsi))DELTAW4=ones(length(v1)length(epsi))DELTAW5=ones(length(v1)length(epsi))DELTAW6=ones(length(v1)length(epsi))
avg1 = ones(length(v1)1)avg2 = ones(length(v1)1)avg3 = ones(length(v1)1)avg4 = ones(length(v1)1)avg5 = ones(length(v1)1)avg6 = ones(length(v1)1)
Algorithmfor j = 1length(epsi)for i = 1length(what1)
win1 = what1(i) window from vector v1 in this iteration win2 = what2(i) window from vector v2 in this iteration win3 = what3(i) window from vector v3 in this iteration win4 = what4(i) window from vector v4 in this iteration win5 = what5(i) window from vector V5 in this iteration win6 = what6(i) window from vector V5 in this iteration
avgwin1 = sum(win1)length(win1) average value of window1 this iteration avgwin2 = sum(win2)length(win2) average value of window2 this iteration avgwin3 = sum(win3)length(win3) average value of window3 this iteration avgwin4 = sum(win4)length(win4) average value of window4 this iteration avgwin5 = sum(win5)length(win5) average value of window5 this iteration avgwin6 = sum(win6)length(win6) average value of window6 this iteration
avg1(i) = avgwin1 save averages in vector avg2(i) = avgwin2 avg3(i) = avgwin3 avg4(i) = avgwin4 avg5(i) = avgwin5 avg6(i) = avgwin6
FOUR WHEELS adapt_t1(i) = ((avgwin2+avgwin3+avgwin4)3)-avgwin1 Larger value=less correlation to neigbouring sensors adapt_t2(i) = ((avgwin1+avgwin3+avgwin4)3)-avgwin2 adapt_t3(i) = ((avgwin1+avgwin2+avgwin4)3)-avgwin3 adapt_t4(i) = ((avgwin1+avgwin2+avgwin3)3)-avgwin4
3
deltaw1(ij) = abs(adapt_t1(i))epsi(j) vector of delta_w deltaw2(ij) = abs(adapt_t2(i))epsi(j) deltaw3(ij) = abs(adapt_t3(i))epsi(j) deltaw4(ij) = abs(adapt_t4(i))epsi(j)
FIVE WHEELS adapt_T1(i) = ((avgwin2+avgwin3+avgwin4+avgwin5)4)-avgwin1 Larger value=less correlation to neigbouring sensors adapt_T2(i) = ((avgwin1+avgwin3+avgwin4+avgwin5)4)-avgwin2 adapt_T3(i) = ((avgwin1+avgwin2+avgwin4+avgwin5)4)-avgwin3 adapt_T4(i) = ((avgwin1+avgwin2+avgwin3+avgwin5)4)-avgwin4 adapt_T5(i) = ((avgwin1+avgwin2+avgwin3+avgwin4)4)-avgwin5
deltaW1(ij) = abs(adapt_T1(i))epsi(j) vector of delta_w deltaW2(ij) = abs(adapt_T2(i))epsi(j) deltaW3(ij) = abs(adapt_T3(i))epsi(j) deltaW4(ij) = abs(adapt_T4(i))epsi(j) deltaW5(ij) = abs(adapt_T5(i))epsi(j)
SIX WHEELS ADAPT_T1(i) = ((avgwin2+avgwin3+avgwin4+avgwin5+avgwin6)5)-avgwin1 Larger value=less correlation to neigbouring sensors ADAPT_T2(i) = ((avgwin1+avgwin3+avgwin4+avgwin5+avgwin6)5)-avgwin2 ADAPT_T3(i) = ((avgwin1+avgwin2+avgwin4+avgwin5+avgwin6)5)-avgwin3 ADAPT_T4(i) = ((avgwin1+avgwin2+avgwin3+avgwin5+avgwin6)5)-avgwin4 ADAPT_T5(i) = ((avgwin1+avgwin2+avgwin3+avgwin4+avgwin6)5)-avgwin5 ADAPT_T6(i) = ((avgwin1+avgwin2+avgwin3+avgwin4+avgwin5)5)-avgwin6
DELTAW1(ij) = abs(ADAPT_T1(i))epsi(j) vector of delta_w DELTAW2(ij) = abs(ADAPT_T2(i))epsi(j) DELTAW3(ij) = abs(ADAPT_T3(i))epsi(j) DELTAW4(ij) = abs(ADAPT_T4(i))epsi(j) DELTAW5(ij) = abs(ADAPT_T5(i))epsi(j) DELTAW6(ij) = abs(ADAPT_T6(i))epsi(j)
FOUR WHEELS Small deltaw = higher trustworthiness if ((deltaw1(ij) lt deltaw2(ij)) ampamp (deltaw1(ij) lt deltaw3(ij)) ampamp (deltaw1(ij) lt deltaw4(ij))) if deltaw1 is smallest of all deltaw = BRA = houmlg correlation w1(i+1j) = w1(ij) + deltaw1(ij) increase weight
if(w1(i+1j)gt1) w1(i+1j) = 1 end
else
4
w1(i+1j) = w1(ij) - deltaw1(ij) if deltaw1 is NOT smallest of all deltaw miska trust if(w1(i+1j)lt0) w1(i+1j) = 0 end
end
if ((deltaw2(ij) lt deltaw1(ij)) ampamp (deltaw2(ij) lt deltaw3(ij)) ampamp (deltaw2(ij) lt deltaw4(ij))) w2(i+1j) = w2(ij) + deltaw2(ij) if(w2(i+1j)gt1) w2(i+1j) = 1 end
else w2(i+1j) = w2(ij) - deltaw2(ij) if(w2(i+1j)lt0) w2(i+1j) = 0 end
end
if ((deltaw3(ij) lt deltaw1(ij)) ampamp (deltaw3(ij) lt deltaw2(ij)) ampamp (deltaw3(ij) lt deltaw4(ij))) w3(i+1j) = w3(ij) + deltaw3(ij) if(w3(i+1j)gt1) w3(i+1j) = 1 end
else w3(i+1j) = w3(ij) - deltaw3(ij) if(w3(i+1j)lt0) w3(i+1j) = 0 end
end
if ((deltaw4(ij) lt deltaw1(ij)) ampamp (deltaw4(ij) lt deltaw2(ij)) ampamp (deltaw4(ij) lt deltaw3(ij))) w4(i+1j) = w4(ij) + deltaw4(ij) if(w4(i+1j)gt1) w4(i+1j) = 1 end
else w4(i+1j) = w4(ij) - deltaw4(ij) if(w4(i+1j)lt0) w4(i+1j) = 0 end
end
5
FIVE WHEELS if ((deltaW1(ij) lt deltaW2(ij)) ampamp (deltaW1(ij) lt deltaW3(ij)) ampamp (deltaW1(ij) lt deltaW4(ij)) ampamp (deltaW1(ij) lt deltaW5(ij))) if deltaw1 is smallest of all deltaw = BRA = houmlg correlation W1(i+1j) = W1(ij) + deltaW1(ij) increase weight
if(W1(i+1j)gt1) W1(i+1j) = 1 end
else W1(i+1j) = W1(ij) - deltaW1(ij) if deltaw1 is NOT smallest of all deltaw miska trust if(W1(i+1j)lt0) W1(i+1j) = 0 end
end
if ((deltaW2(ij) lt deltaW1(ij)) ampamp (deltaW2(ij) lt deltaW3(ij)) ampamp (deltaW2(ij) lt deltaW4(ij)) ampamp (deltaW2(ij) lt deltaW5(ij))) W2(i+1j) = W2(ij) + deltaW2(ij) if(W2(i+1j)gt1) W2(i+1j) = 1 end
else W2(i+1j) = W2(ij) - deltaW2(ij) if(W2(i+1j)lt0) W2(i+1j) = 0 end
end
if ((deltaW3(ij) lt deltaW1(ij)) ampamp (deltaW3(ij) lt deltaW2(ij)) ampamp (deltaW3(ij) lt deltaW4(ij)) ampamp (deltaW3(ij) lt deltaW5(ij))) W3(i+1j) = W3(ij) + deltaW3(ij) if(W3(i+1j)gt1) W3(i+1j) = 1 end
else W3(i+1j) = W3(ij) - deltaW3(ij) if(W3(i+1j)lt0) W3(i+1j) = 0 end
end
if ((deltaW4(ij) lt deltaW1(ij)) ampamp (deltaW4(ij) lt deltaW2(ij)) ampamp (deltaW4(ij) lt deltaW3(ij)) ampamp (deltaW4(ij) lt deltaW5(ij))) W4(i+1j) = W4(ij) + deltaW4(ij)
6
if(W4(i+1j)gt1) W4(i+1j) = 1 end
else W4(i+1j) = W4(ij) - deltaW4(ij) if(W4(i+1j)lt0) W4(i+1j) = 0 end
end
if ((deltaW5(ij) lt deltaW1(ij)) ampamp (deltaW5(ij) lt deltaW2(ij)) ampamp (deltaW5(ij) lt deltaW3(ij)) ampamp (deltaW5(ij) lt deltaW4(ij))) W5(i+1j) = W5(ij) + deltaW5(ij) if(W5(i+1j)gt1) W5(i+1j) = 1 end
else W5(i+1j) = W5(ij) - deltaW5(ij) if(W5(i+1j)lt0) W5(i+1j) = 0 end
end
SIX WHEELS if ((DELTAW1(ij) lt DELTAW2(ij)) ampamp (DELTAW1(ij) lt DELTAW3(ij)) ampamp (DELTAW1(ij) lt DELTAW4(ij)) ampamp (DELTAW1(ij) lt DELTAW5(ij)) ampamp (DELTAW1(ij) lt DELTAW6(ij))) if deltaw1 is smallest of all deltaw = BRA = houmlg correlation WW1(i+1j) = WW1(ij) + DELTAW1(ij) increase weight
if(WW1(i+1j)gt1) WW1(i+1j) = 1 end
else WW1(i+1j) = WW1(ij) - DELTAW1(ij) if deltaw1 is NOT smallest of all deltaw miska trust if(WW1(i+1j)lt0) WW1(i+1j) = 0 end
end
if ((DELTAW2(ij) lt DELTAW1(ij)) ampamp (DELTAW2(ij) lt DELTAW3(ij)) ampamp (DELTAW2(ij) lt DELTAW4(ij)) ampamp (DELTAW2(ij) lt DELTAW5(ij)) ampamp (DELTAW2(ij) lt DELTAW6(ij))) if deltaw1 is smallest of all deltaw = BRA = houmlg correlation WW2(i+1j) = WW2(ij) + DELTAW2(ij) increase weight
7
if(WW2(i+1j)gt1) WW2(i+1j) = 1 end
else WW2(i+1j) = WW2(ij) - DELTAW2(ij) if deltaw1 is NOT smallest of all deltaw miska trust
if(WW2(i+1j)lt0) WW2(i+1j) = 0 end
end
if ((DELTAW3(ij) lt DELTAW1(ij)) ampamp (DELTAW3(ij) lt DELTAW2(ij)) ampamp (DELTAW3(ij) lt DELTAW4(ij)) ampamp (DELTAW3(ij) lt DELTAW5(ij)) ampamp (DELTAW3(ij) lt DELTAW6(ij))) if deltaw1 is smallest of all deltaw = BRA = houmlg correlation WW3(i+1j) = WW3(ij) + DELTAW3(ij) increase weight
if(WW3(i+1j)gt1) WW3(i+1j) = 1 end
else WW3(i+1j) = WW3(ij) - DELTAW3(ij) if deltaw1 is NOT smallest of all deltaw miska trust
if(WW3(i+1j)lt0) WW3(i+1j) = 0 end
end
if ((DELTAW4(ij) lt DELTAW1(ij)) ampamp (DELTAW4(ij) lt DELTAW2(ij)) ampamp (DELTAW4(ij) lt DELTAW3(ij)) ampamp (DELTAW4(ij) lt DELTAW5(ij)) ampamp (DELTAW4(ij) lt DELTAW6(ij))) if deltaw1 is smallest of all deltaw = BRA = houmlg correlation WW4(i+1j) = WW4(ij) + DELTAW4(ij) increase weight
if(WW4(i+1j)gt1) WW4(i+1j) = 1 end
else WW4(i+1j) = WW4(ij) - DELTAW4(ij) if deltaw1 is NOT smallest of all deltaw miska trust
if(WW4(i+1j)lt0) WW4(i+1j) = 0 end
8
end
if ((DELTAW5(ij) lt DELTAW1(ij)) ampamp (DELTAW5(ij) lt DELTAW2(ij)) ampamp (DELTAW5(ij) lt DELTAW3(ij)) ampamp (DELTAW5(ij) lt DELTAW4(ij)) ampamp (DELTAW5(ij) lt DELTAW6(ij))) if deltaw1 is smallest of all deltaw = BRA = houmlg correlation WW5(i+1j) = WW5(ij) + DELTAW5(ij) increase weight
if(WW5(i+1j)gt1) WW5(i+1j) = 1 end
else WW5(i+1j) = WW5(ij) - DELTAW5(ij) if deltaw1 is NOT smallest of all deltaw miska trust
if(WW5(i+1j)lt0) WW5(i+1j) = 0 end
end
if ((DELTAW6(ij) lt DELTAW1(ij)) ampamp (DELTAW6(ij) lt DELTAW2(ij)) ampamp (DELTAW6(ij) lt DELTAW3(ij)) ampamp (DELTAW6(ij) lt DELTAW4(ij)) ampamp (DELTAW6(ij) lt DELTAW5(ij))) if deltaw1 is smallest of all deltaw = BRA = houmlg correlation WW6(i+1j) = WW6(ij) + DELTAW6(ij) increase weight
if(WW6(i+1j)gt1) WW6(i+1j) = 1 end
else WW6(i+1j) = WW6(ij) - DELTAW6(ij) if deltaw1 is NOT smallest of all deltaw miska trust
if(WW6(i+1j)lt0) WW6(i+1j) = 0 end
end
endend
avg_all = (avg1+avg2+avg3+avg4)4 normal average of ALL wheels togetheravg_ALL = (avg1+avg2+avg3+avg4+avg5)5 normal average FIVE wheelsAVG_ALL = (avg1+avg2+avg3+avg4+avg5+avg6)6 normal average SIX wheels
9
Preallocation of vectoravg_all_weighted = ones(length(v1)length(epsi))avg_all_WEIGHTED = ones(length(v1)length(epsi))for j = 1length(epsi) Normalize weights FOUR WHEELS weight_sum = w1(j)+w2(j)+w3(j)+w4(j) w1_norm = w1(j)weight_sum w2_norm = w2(j)weight_sum w3_norm = w3(j)weight_sum w4_norm = w4(j)weight_sum
Normalize weights FIVE WHEELS weight_SUM = W1(j)+W2(j)+W3(j)+W4(j)+W5(j) W1_norm = W1(j)weight_SUM W2_norm = W2(j)weight_SUM W3_norm = W3(j)weight_SUM W4_norm = W4(j)weight_SUM W5_norm = W5(j)weight_SUM
Normalize weights SIX WHEELS WEIGHT_SUM = WW1(j)+WW2(j)+WW3(j)+WW4(j)+WW5(j)+WW6(j) W1_NORM = WW1(j)WEIGHT_SUM W2_NORM = WW2(j)WEIGHT_SUM W3_NORM = WW3(j)WEIGHT_SUM W4_NORM = WW4(j)WEIGHT_SUM W5_NORM = WW5(j)WEIGHT_SUM W6_NORM = WW6(j)WEIGHT_SUM
Four five six wheels respectively avg_all_weighted(j) = ((avg1(1)w1_norm)+(avg2(1)w2_norm)+(avg3(1)w3_norm)+(avg4(1)w4_norm)) weighted average of ALL wheels avg_all_WEIGHTED(j) = ((avg1(1)W1_norm)+(avg2(1)W2_norm)+(avg3(1)W3_norm)+(avg4(1)W4_norm)+(avg5(1)W5_norm)) weighted average of ALL wheels FIVE WHEELS avg_ALL_WEIGHTED = ((avg1W1_NORM)+(avg2W2_NORM)+(avg3W3_NORM)+(avg4W4_NORM)+(avg5W5_NORM)+(avg6W6_NORM)) weighted average of ALL wheels SIX WHEELS
end
Slip ratios (for four wheels)slipR1 = (avg_all_weighted(1)-avg1)avg_all_weighted(1) Filtered wheel velocity of wheel1 divided by estimated vehicle velocityslipR2 = (avg_all_weighted(1)-avg2)avg_all_weighted(1)slipR3 = (avg_all_weighted(1)-avg3)avg_all_weighted(1)slipR4 = (avg_all_weighted(1)-avg4)avg_all_weighted(1)
10
1200652 wwwkueblercom
MMiinniiaattuurree TTyyppee 22440000
bull High performance at a competitive pricebull Wide temperature range (-20 +85 degC)bull Sturdy cable outlet with multiple
clampingbull Temperature compensationbull Broad input voltage range
(5 24 V or 8 30 V)bull Highly flexible cable withstands
constant flexing from 0 degC 70 degC)
bull Low power consumption despite highscanning rate
bull Reverse connection protected and Short-circuit proof
bull Very high EMV standardndash KKuumluumlbblleerr eennccooddeerr ttyyppee 2244xxxx mmeeeettss GGeerrmmaann
RRaaiillwwaayyss ssttaannddaarrdd EENN 5500112211
4 6 10 16 20 25 36 40 5500 60 80 110000 120125 180 220000 250 300 336600 400 550000 51211000000 11002244 1080
EElleeccttrriiccaall cchhaarraacctteerriissttiiccss
PPuullssee rraatteess aavvaaiillaabbllee aatt sshhoorrtt nnoottiicceeSpeed max 12 000min-1
Rotor moment of inertia approx 01 x 10-6 kgm2
Starting torque lt0001 NmRadial load capacity of shaft 10 NAxial load capacity of shaft 20 NWeight approx 006 kgProtection acc to EN 60529 IP 64 housing sideWorking temperature ndash20deg C +85 degC2)
Operating temperature ndash20deg C +90 degC2)
Shaft stainless steelShock resistance acc to DIN-IEC 68-2-27 1000 ms2 6 msVibration resistance acc to DIN-IEC 68-2-6 100 ms2 55 2000 Hz
2) Non-condensing
Output circuit Push-pull Push-pull(7272)1) (7272)1)
Supply voltage 5 24 V DC 8 30 V DCPower consumption (no load) max 50 mA max 50 mAPermissible loadchannel max 50 mA max 50 mAPulse frequency max 160 kHz max 160 kHzSignal level high min UB = -25 V min UB = ndash3 VSignal level low max 05 V max 05 VRise time tr max 1 micros max 1 microsFall time tf max 1 micros max 1 microsShort circuit proof outputs yes yesConforms to CE requirements acc to EN 61000-6-1 EN 61000-6-4 and EN 61000-6-31) Max recommended cable length 30 m
AApppplliiccaattiioonnss
bull Pick and place machinesbull Handling machines for electronic compo-
nentsbull Quality testing machinesbull Medical machines
bull Mail opening and mail stuffing machinesbull Check weighersbull Labelling machinesbull Mole machines (camera control)bull Door and gates systemsbull Textil machines
KKuumluumlbblleerr eennccooddeerr ttyyppee 2244xxxx mmeeeettss GGeerrmmaannRRaaiillwwaayyss ssttaannddaarrddAn independent test laboratory (TTI-P-G11596-01) approved by the GermanAccreditation Council (DAR) certified thecompliance with the railway standardaccording to EN 50121 This means our encoder is compatible tohigher electromagnetic noise standardsthan standard industrial encoders Youwill have a higher quality encoder evenin applications with higher EMC noiselevelWe will gladly send you a copy of the testreport on request When ordering anencoder to the railway standard pleaseensure to state this explicitly on theorder
Rotary Measuring Technology Incremental shaft encoder
Appendix B Encoder datasheet
12006
Rota
ry M
easu
rem
ent T
echn
olog
yIn
crem
enta
l Enc
oder
s
wwwkueblercom 53
MMiinniiaattuurree TTyyppee 22440000
TTeerrmmiinnaall aassssiiggnnmmeennttSignal 0V +UB A A B B 0 OColour WH BN GN YE GY PK BU RDwithout inverted signal WH BN GN YE GY
6
18
1
D
24
min R50
10+
02
10+
214
10+
12
011
h7
21
21
max
5 3M
f7
IIssoollaattee uunnuusseedd oouuttppuuttss bbeeffoorree iinniittiiaall ssttaarrtt--uupp
DDiimmeennssiioonnssBracket type 1 (Oslash 24 mm)
Bracket type 2 (Oslash 30 mm)Bracket type 3 (Oslash 28 mm)
22
6
min R50
3M
B
24
D 21
A
812
max
5
h7
5
01
15f7
MMoouunnttiinngg aaddvviiccee
The brackets andshafts of theencoder and driveshould not both berigidly coupledtogether at the sametime We recom-mend the use ofsuitable couplings(see Accessoriessection)OOrrddeerr ccooddee 052400XXXXXXXX
Range
Bracket11 == oslashoslash 2244 mmmm 22 == oslashoslash 3300 mmmm33 == oslashoslash 2288 mmmmfurther on request
Shaft11 == oslashoslash 44 mmmm xx 1100 mmmm22 == oslashoslash 66 mmmm xx 1100 mmmm3 = oslash 5 mm x 10 mm with flattening
Pulse rate(eg 360 pulses=gt 0360)
Type of connection1 = Cable axial (2 m PVC cable oslash 45 mm) 22 == CCaabbllee rraaddiiaall ((2 m PVC cable oslash 45 mm))
Output and voltage supply1 = Push-pull (without inverted signals)
5 24 V supply voltage22 == PPuusshh--ppuullll ((wwiitthh iinnvveerrtteedd ssiiggnnaallss))
55 2244 VV DDCC ssuuppppllyy vvoollttaaggee3 = Push-pull (without inverted signals)
8 30 V DC supply voltage44 == PPuusshh--ppuullll ((wwiitthh iinnvveerrtteedd ssiiggnnaallss))
88 3300 VV ssuuppppllyy vvoollttaaggee
Bracket type 2 3A oslash 30 mm oslash 28 mmB 3 mm 2 mm
SSttoocckk ttyyppeess05240011220050052400112201000524001122036005240011220500052400112210000524001122102405240033211000052400334110000524003331050005240033311000
Preferred types are
indicated in bboolldd
Rotary Measuring Technology Incremental shaft encoder
DDR
Encoder1QuadA
Encoder1QuadB
Encoder2QuadA
Encoder2QuadB
Encoder3QuadA
Encoder3QuadB
Encoder4QuadA
Encoder4QuadB
FIXED_IO
LIDAR_lite_0
LIDAR_lite_v10 (Pre-Production)
S00_AXI
LIDAR_pwm
s00_axi_aclk
s00_axi_aresetn
LIDAR_pwm
MB_reset
Vn_adc
Vp_adc
axi_gpio_0
AXI GPIO
S_AXI
GPIOs_axi_aclk
s_axi_aresetn
axi_gpio_1
AXI GPIO
S_AXIGPIO
s_axi_aclk
s_axi_aresetnip2intc_irpt
axi_timer_0
AXI Timer
S_AXI
capturetrig0
capturetrig1
generateout0
generateout1
pwm0
interrupt
freeze
s_axi_aclk
s_axi_aresetn
axi_timer_1
AXI Timer
S_AXI
capturetrig0
capturetrig1
generateout0
generateout1
pwm0
interrupt
freeze
s_axi_aclk
s_axi_aresetn
axi_timer_2
AXI Timer
S_AXI
capturetrig0
capturetrig1
generateout0
generateout1
pwm0
interrupt
freeze
s_axi_aclk
s_axi_aresetn
axi_timer_3
AXI Timer
S_AXI
capturetrig0
capturetrig1
generateout0
generateout1
pwm0
interrupt
freeze
s_axi_aclk
s_axi_aresetn
axi_uartlite_0
AXI Uartlite
S_AXIUART
s_axi_aclk
s_axi_aresetninterrupt
axi_uartlite_1
AXI Uartlite
S_AXIUART
s_axi_aclk
s_axi_aresetninterrupt
decoder_0
decoder_v10 (Pre-Production)
S00_AXI
encoder_quadA
encoder_quadB
s00_axi_aclk
s00_axi_aresetn
decoder_1
decoder_v10 (Pre-Production)
S00_AXI
encoder_quadA
encoder_quadB
s00_axi_aclk
s00_axi_aresetn
decoder_2
decoder_v10 (Pre-Production)
S00_AXI
encoder_quadA
encoder_quadB
s00_axi_aclk
s00_axi_aresetn
decoder_3
decoder_v10 (Pre-Production)
S00_AXI
encoder_quadA
encoder_quadB
s00_axi_aclk
s00_axi_aresetn
gpio_rtl
gpio_rtl_0
mailbox_0
Mailbox
S0_AXI
S1_AXI
S0_AXI_ACLK
S0_AXI_ARESETN
S1_AXI_ACLK
S1_AXI_ARESETN
Interrupt_0
Interrupt_1
mailbox_1
Mailbox
S0_AXI
S1_AXI
S0_AXI_ACLK
S0_AXI_ARESETN
S1_AXI_ACLK
S1_AXI_ARESETN
Interrupt_0
Interrupt_1
mdm_1
MicroBlaze Debug Module (MDM)
S_AXI MBDEBUG_0
S_AXI_ACLK
S_AXI_ARESETN
Interrupt
Debug_SYS_Rst
microblaze_0
MicroBlaze
INTERRUPTDLMB
ILMB
M_AXI_DP
M_AXI_DC
M_AXI_IC
DEBUG
Clk
Reset
microblaze_0_axi_intc
AXI Interrupt Controller
s_axi
interrupt
s_axi_aclk
s_axi_aresetn
intr[20]
processor_clk
processor_rst
microblaze_0_axi_periph
AXI Interconnect
S00_AXI
M00_AXI
S01_AXI
S02_AXI
M01_AXI
M02_AXI
M03_AXI
M04_AXI
M05_AXI
M06_AXI
ACLK
ARESETN[00]
S00_ACLK
S00_ARESETN[00]
M00_ACLK
M00_ARESETN[00]
S01_ACLK
S01_ARESETN[00]
S02_ACLK
S02_ARESETN[00]
M01_ACLK
M01_ARESETN[00]
M02_ACLK
M02_ARESETN[00]
M03_ACLK
M03_ARESETN[00]
M04_ACLK
M04_ARESETN[00]
M05_ACLK
M05_ARESETN[00]
M06_ACLK
M06_ARESETN[00]
microblaze_0_local_memory
DLMB
ILMB
LMB_Clk
SYS_Rst[00]
microblaze_0_xlconcat
Concat
In0[00]
In1[00]
In2[00]
dout[20]
processing_system7_0
ZYNQ7 Processing System
DDR
FIXED_IO
USBIND_0
M_AXI_GP0
TTC0_WAVE0_OUT
TTC0_WAVE1_OUT
TTC0_WAVE2_OUT
M_AXI_GP0_ACLK
FCLK_CLK0
FCLK_RESET0_N
processing_system7_0_axi_periph
AXI Interconnect
S00_AXI
M00_AXI
M01_AXI
M02_AXI
M03_AXI
M04_AXI
M05_AXI
M06_AXI
M07_AXI
M08_AXI
M09_AXI
M10_AXI
M11_AXI
M12_AXI
ACLK
ARESETN[00]
S00_ACLK
S00_ARESETN[00]
M00_ACLK
M00_ARESETN[00]
M01_ACLK
M01_ARESETN[00]
M02_ACLK
M02_ARESETN[00]
M03_ACLK
M03_ARESETN[00]
M04_ACLK
M04_ARESETN[00]
M05_ACLK
M05_ARESETN[00]
M06_ACLK
M06_ARESETN[00]
M07_ACLK
M07_ARESETN[00]
M08_ACLK
M08_ARESETN[00]
M09_ACLK
M09_ARESETN[00]
M10_ACLK
M10_ARESETN[00]
M11_ACLK
M11_ARESETN[00]
M12_ACLK
M12_ARESETN[00]
pwm_motor
pwm_servo
rst_processing_system7_0_100M
Processor System Reset
slowest_sync_clk
ext_reset_in
aux_reset_in
mb_debug_sys_rst
dcm_locked
mb_reset
bus_struct_reset[00]
peripheral_reset[00]
interconnect_aresetn[00]
peripheral_aresetn[00]
uart_rtl
uart_rtl_0
xadc_wiz_0
XADC Wizard
s_axi_lite
Vp_Vn
vn_in
vp_in
s_axi_aclk
s_axi_aresetn
ip2intc_irpt
channel_out[40]
eoc_out
alarm_out
eos_out
busy_out
Appendix C Vivado FPGA block design
Appendix D Exploded view of RC-car
TRITA MMK 2017 160 MDA 617
wwwkthse
- Introduction
-
- Background
- Problem Statement
-
- Thesis Objective
- Thesis outline
-
- Related work
- Purpose and goal
- Ethics and sustainability considerations
- Delimitations
-
- Methodology
-
- Methodology of the literature review
- Methodology of the implementation phase
-
- Literature Review
-
- Data aggregation
-
- Data Aggregation Theory
- Data Aggregation in Multi-sensor Systems
-
- Advanced Driver Assistance Systems (ADAS)
-
- Slip detection and control
-
- Cooperation between CPS
-
- Concurrency and Isolation
-
- Conclusions from Literature Review
-
- Implementation
-
- Implications of convoy driving
- Use Case Vehicle Control Loss Warning
- Requirements
-
- Requirements for Use Case
- Requirements for Convoy Driving
-
- Hardware
-
- Board
- Field Programmable Logic - FPGA
- Car platform
- Sensors
-
- Software
-
- RTOS ToppersFMP and SafeG
- GPOS Linux Digilent
- Dual-OS communication
- SoA and SHAPE
-
- Software design of demonstrator
- Slip detection on the demonstrator
-
- Related works for slip detection
- Proposed approach for slip detection on the demonstrator
-
- Initial simulations
-
- One- and two wheel stall
-
- Real-time implementation on the Demonstrator
-
- Demonstrator Architecture
- Real time data aggregation on the demonstrator
-
- Results
-
- Results from simulations
-
- Simulated aggregation during one-wheel stall
- Simulated aggregation during two-wheel stall
-
- Results from real-time implementation
-
- Real-time aggregation during one-wheel stall
- Real-time aggregation during one-wheel slip
-
- Discussion and Future work
-
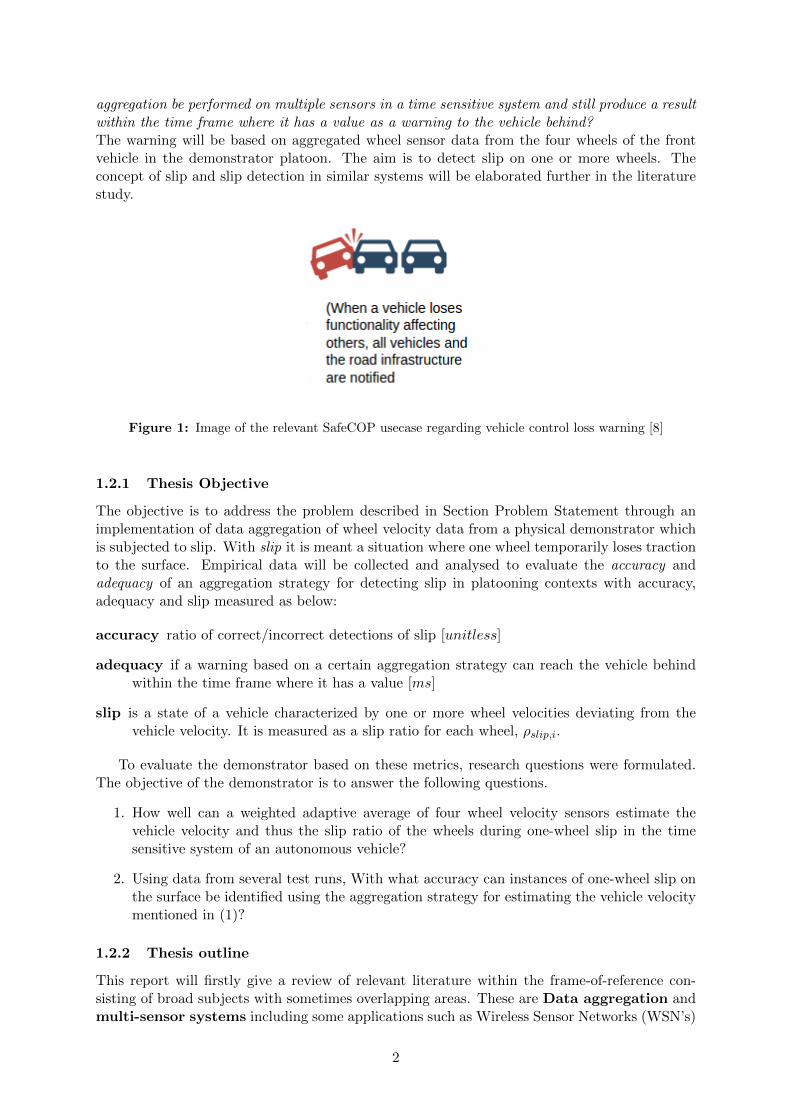
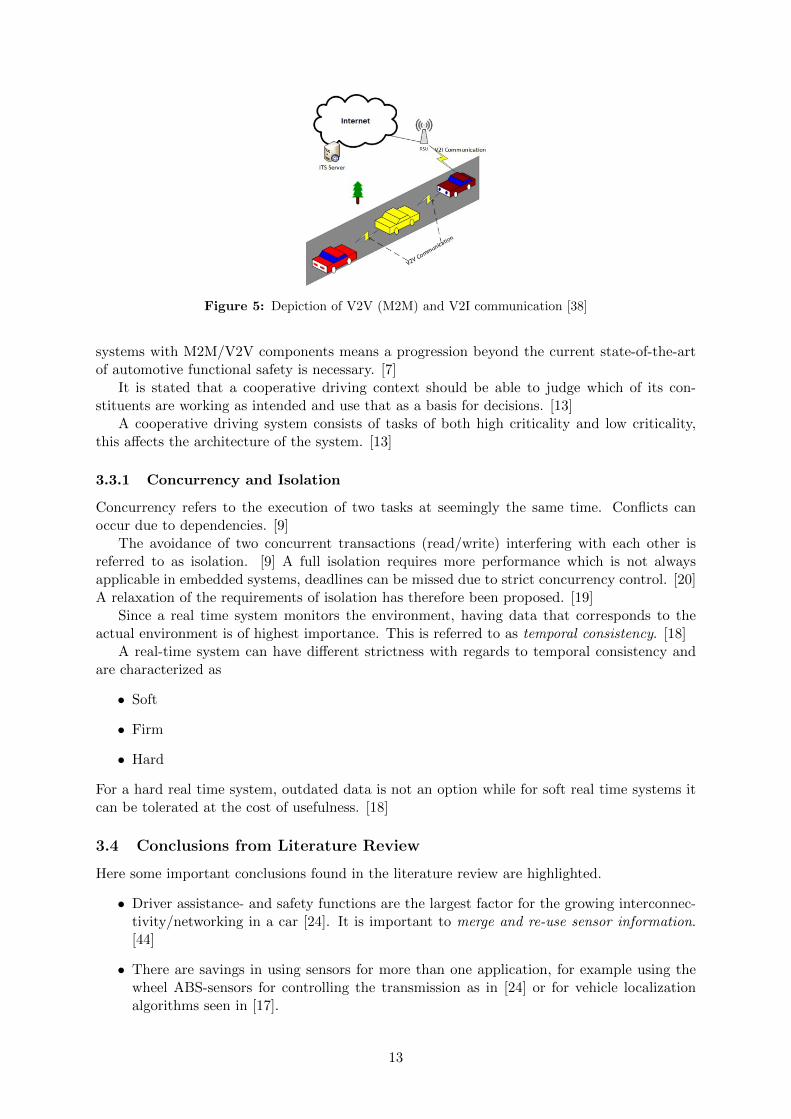
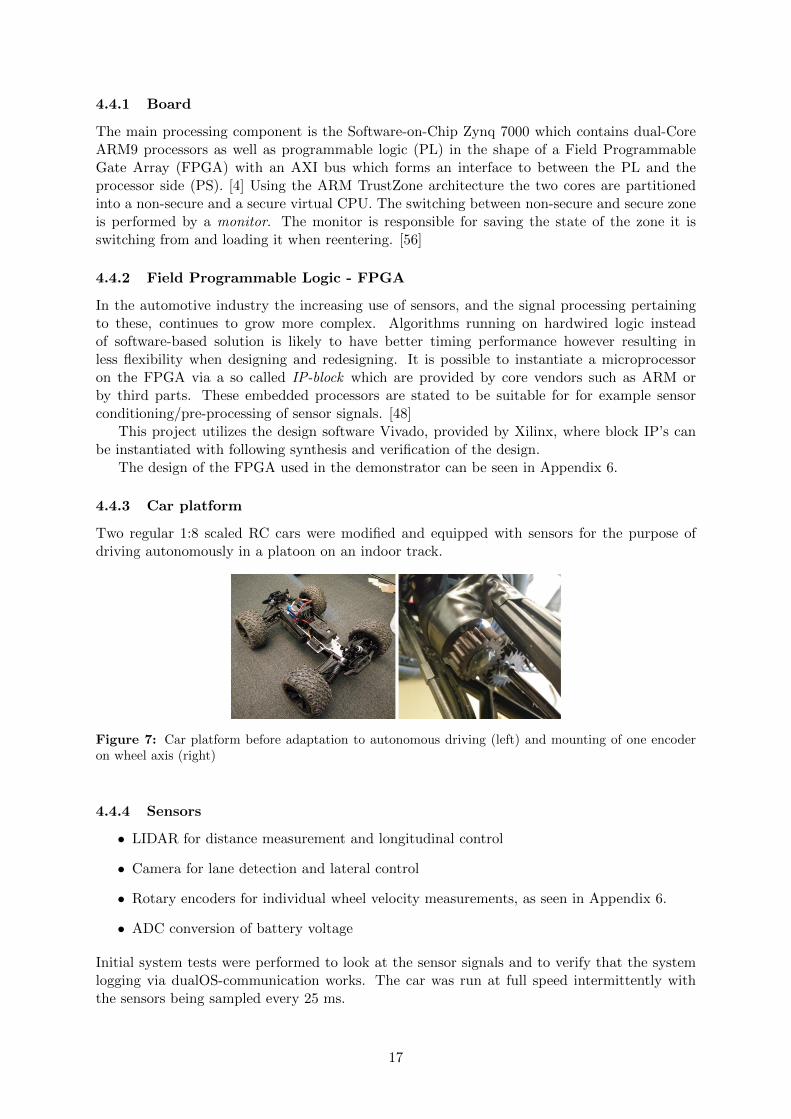
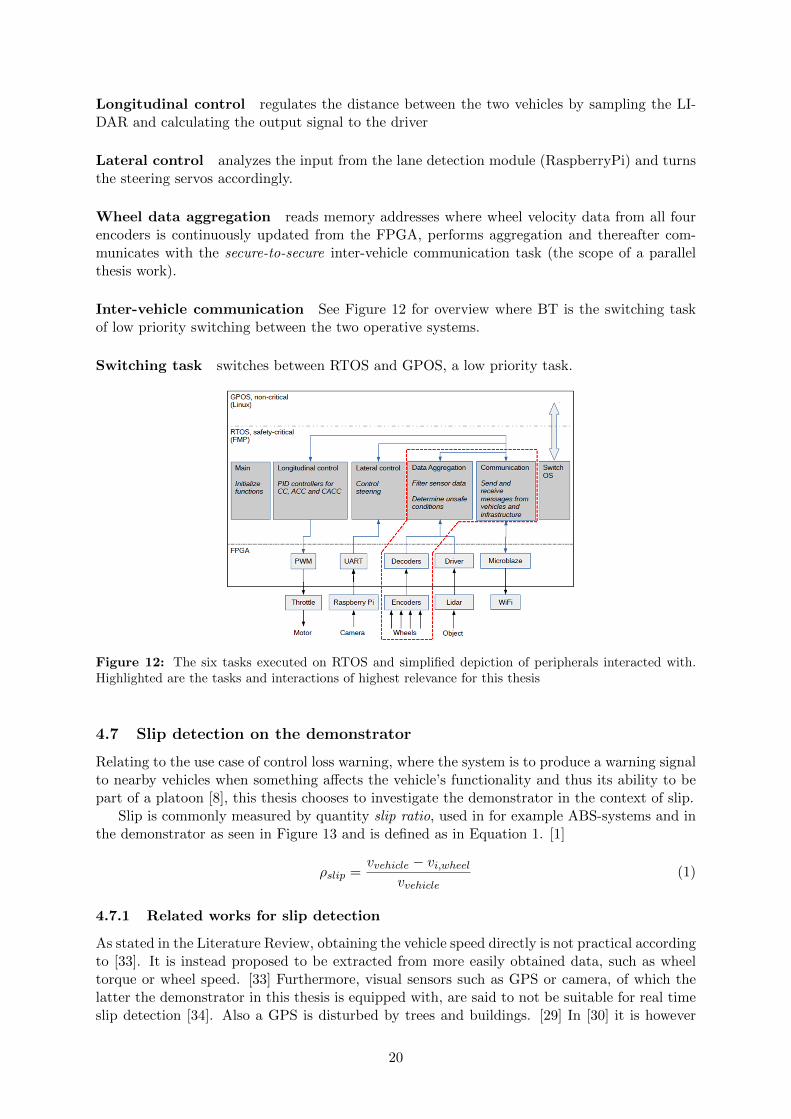
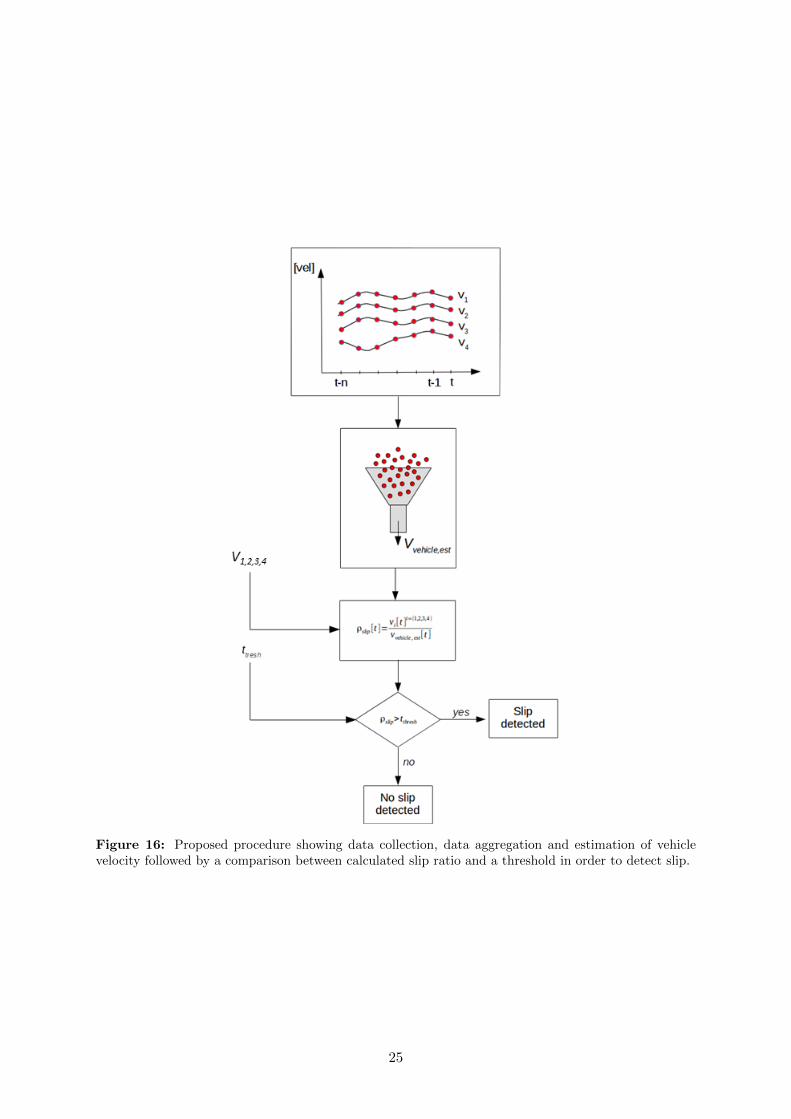
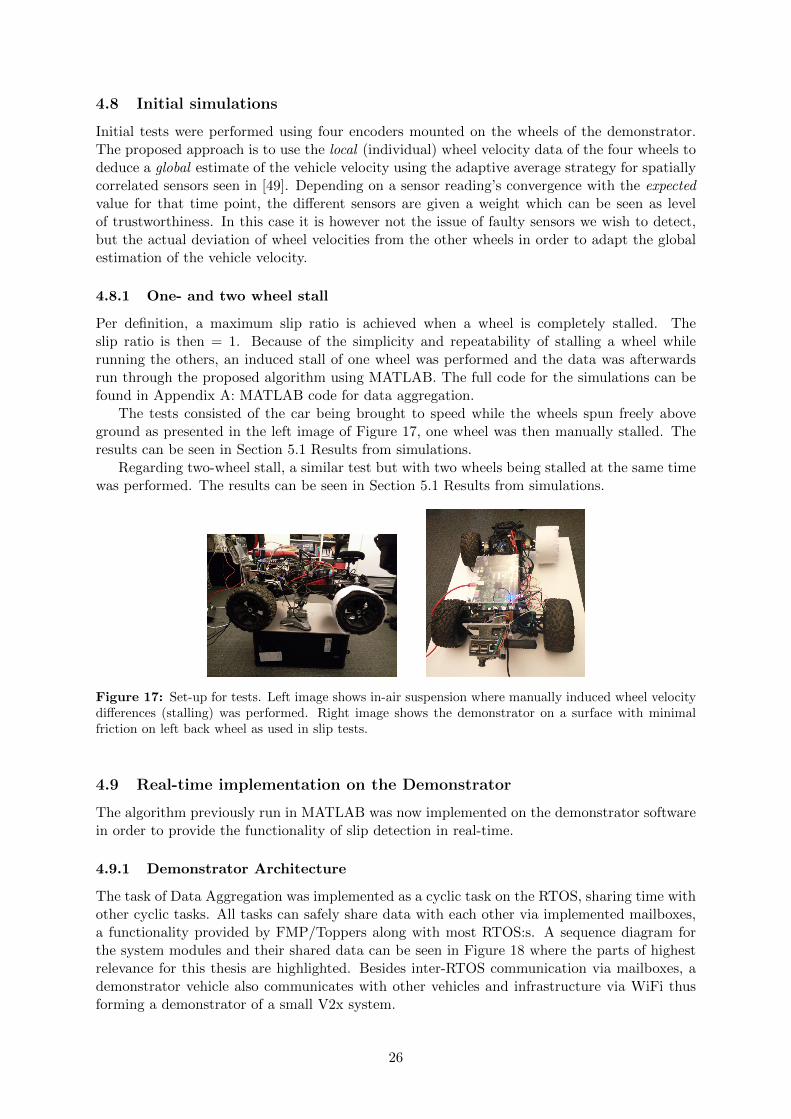
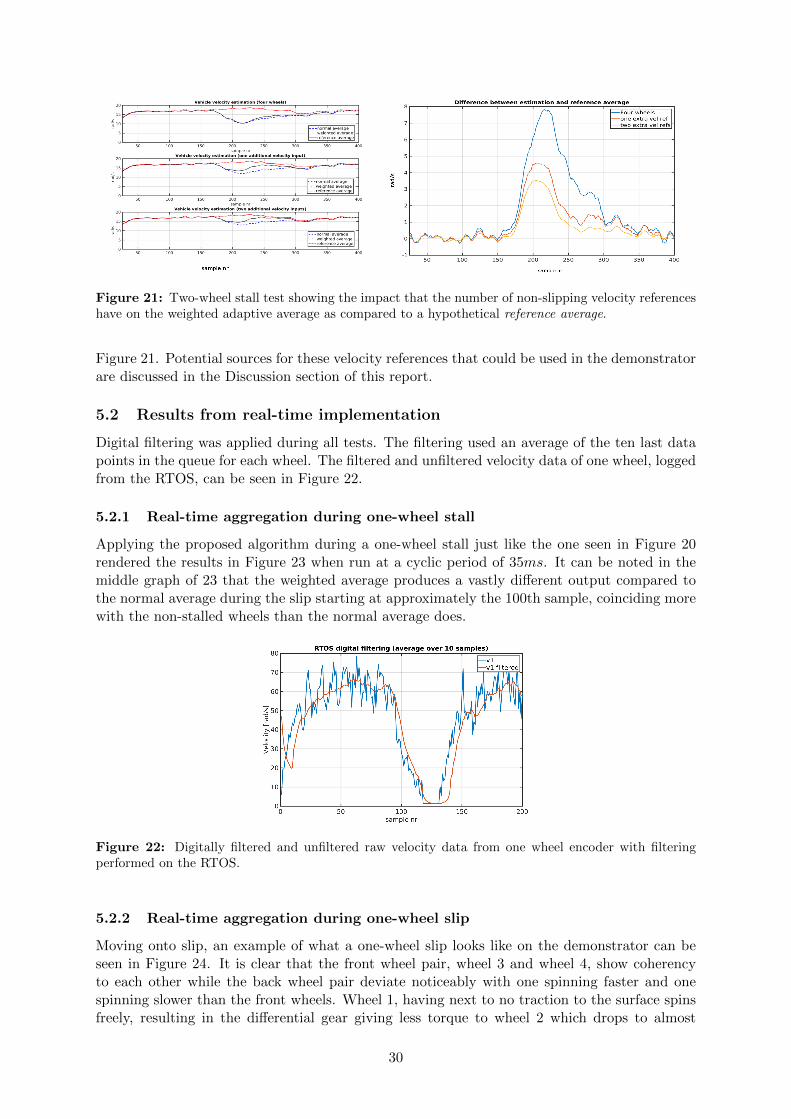
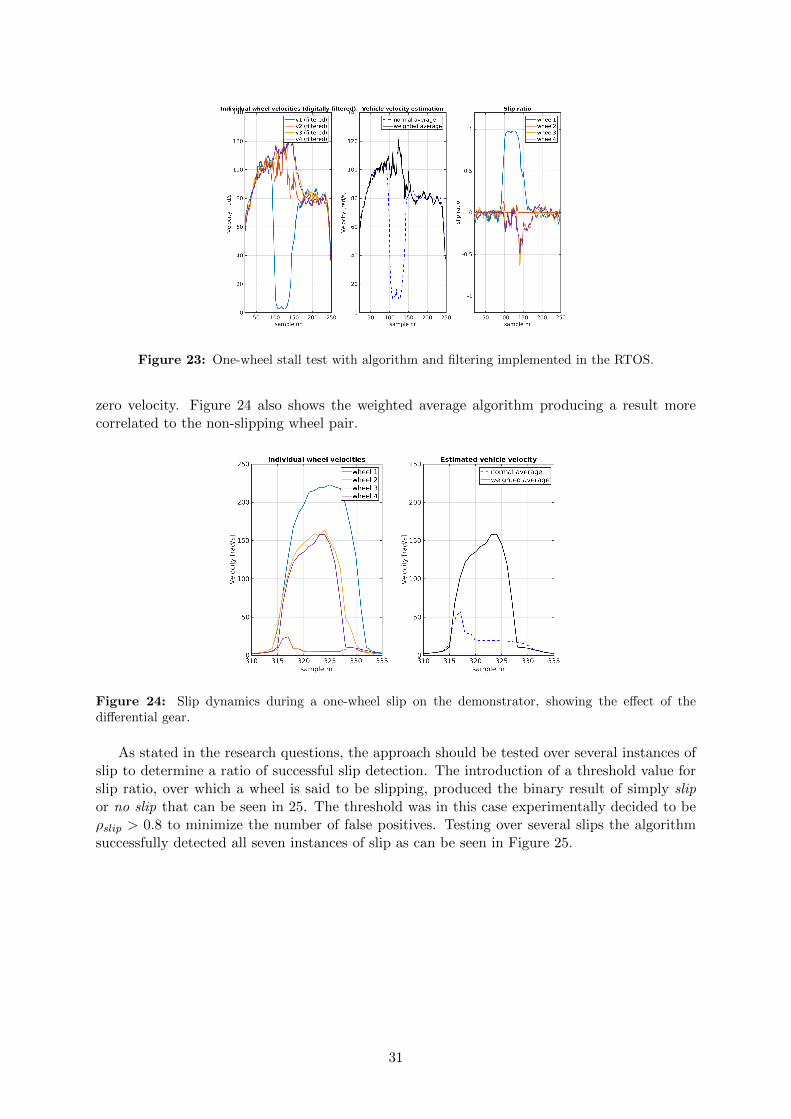
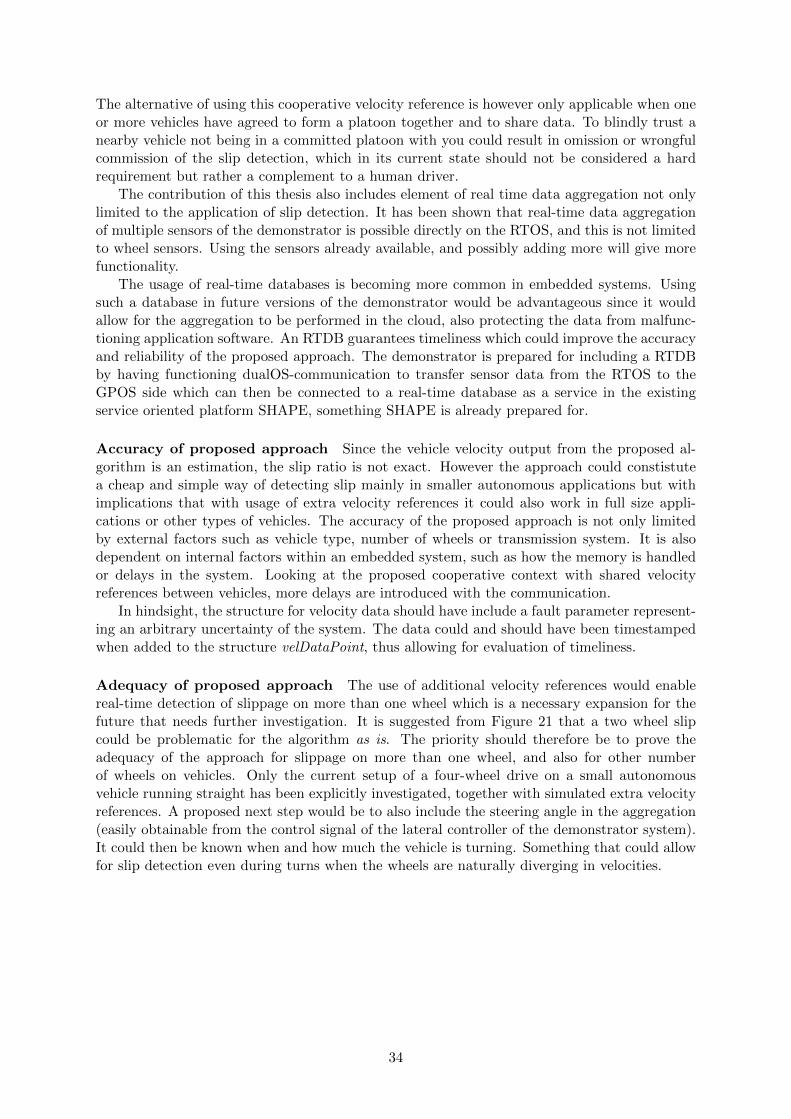
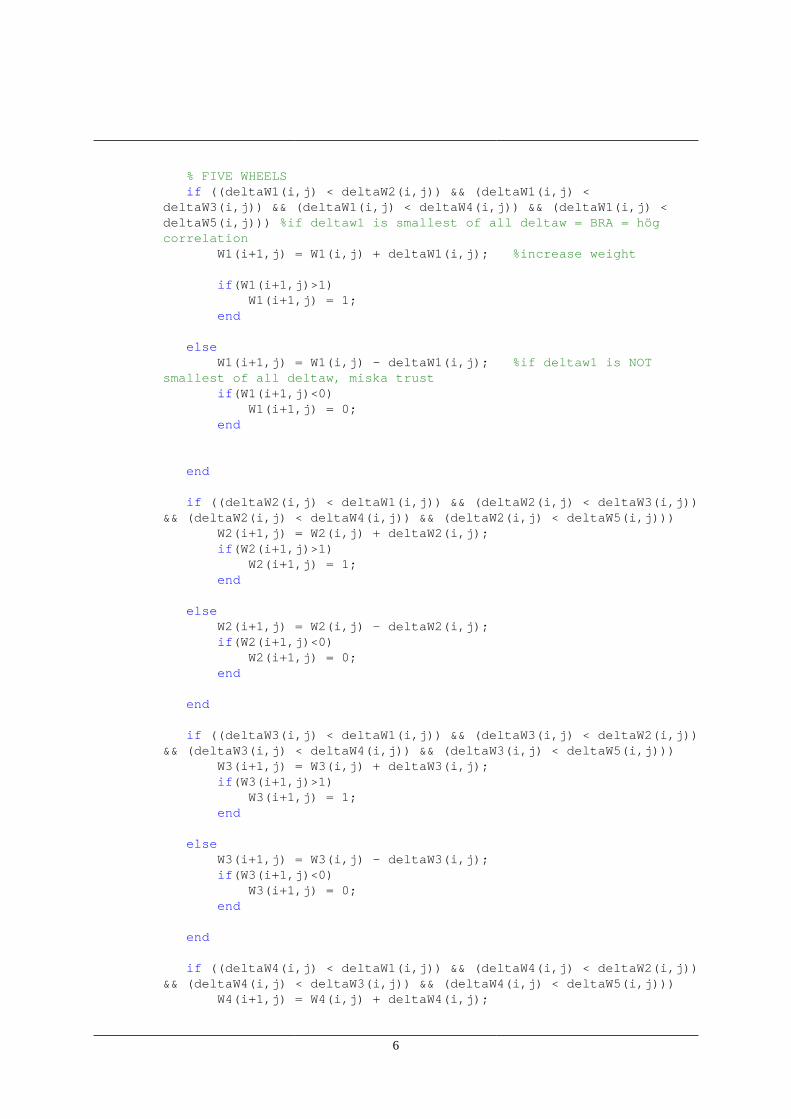

end
if ((DELTAW5(ij) lt DELTAW1(ij)) ampamp (DELTAW5(ij) lt DELTAW2(ij)) ampamp (DELTAW5(ij) lt DELTAW3(ij)) ampamp (DELTAW5(ij) lt DELTAW4(ij)) ampamp (DELTAW5(ij) lt DELTAW6(ij))) if deltaw1 is smallest of all deltaw = BRA = houmlg correlation WW5(i+1j) = WW5(ij) + DELTAW5(ij) increase weight
if(WW5(i+1j)gt1) WW5(i+1j) = 1 end
else WW5(i+1j) = WW5(ij) - DELTAW5(ij) if deltaw1 is NOT smallest of all deltaw miska trust
if(WW5(i+1j)lt0) WW5(i+1j) = 0 end
end
if ((DELTAW6(ij) lt DELTAW1(ij)) ampamp (DELTAW6(ij) lt DELTAW2(ij)) ampamp (DELTAW6(ij) lt DELTAW3(ij)) ampamp (DELTAW6(ij) lt DELTAW4(ij)) ampamp (DELTAW6(ij) lt DELTAW5(ij))) if deltaw1 is smallest of all deltaw = BRA = houmlg correlation WW6(i+1j) = WW6(ij) + DELTAW6(ij) increase weight
if(WW6(i+1j)gt1) WW6(i+1j) = 1 end
else WW6(i+1j) = WW6(ij) - DELTAW6(ij) if deltaw1 is NOT smallest of all deltaw miska trust
if(WW6(i+1j)lt0) WW6(i+1j) = 0 end
end
endend
avg_all = (avg1+avg2+avg3+avg4)4 normal average of ALL wheels togetheravg_ALL = (avg1+avg2+avg3+avg4+avg5)5 normal average FIVE wheelsAVG_ALL = (avg1+avg2+avg3+avg4+avg5+avg6)6 normal average SIX wheels
9
Preallocation of vectoravg_all_weighted = ones(length(v1)length(epsi))avg_all_WEIGHTED = ones(length(v1)length(epsi))for j = 1length(epsi) Normalize weights FOUR WHEELS weight_sum = w1(j)+w2(j)+w3(j)+w4(j) w1_norm = w1(j)weight_sum w2_norm = w2(j)weight_sum w3_norm = w3(j)weight_sum w4_norm = w4(j)weight_sum
Normalize weights FIVE WHEELS weight_SUM = W1(j)+W2(j)+W3(j)+W4(j)+W5(j) W1_norm = W1(j)weight_SUM W2_norm = W2(j)weight_SUM W3_norm = W3(j)weight_SUM W4_norm = W4(j)weight_SUM W5_norm = W5(j)weight_SUM
Normalize weights SIX WHEELS WEIGHT_SUM = WW1(j)+WW2(j)+WW3(j)+WW4(j)+WW5(j)+WW6(j) W1_NORM = WW1(j)WEIGHT_SUM W2_NORM = WW2(j)WEIGHT_SUM W3_NORM = WW3(j)WEIGHT_SUM W4_NORM = WW4(j)WEIGHT_SUM W5_NORM = WW5(j)WEIGHT_SUM W6_NORM = WW6(j)WEIGHT_SUM
Four five six wheels respectively avg_all_weighted(j) = ((avg1(1)w1_norm)+(avg2(1)w2_norm)+(avg3(1)w3_norm)+(avg4(1)w4_norm)) weighted average of ALL wheels avg_all_WEIGHTED(j) = ((avg1(1)W1_norm)+(avg2(1)W2_norm)+(avg3(1)W3_norm)+(avg4(1)W4_norm)+(avg5(1)W5_norm)) weighted average of ALL wheels FIVE WHEELS avg_ALL_WEIGHTED = ((avg1W1_NORM)+(avg2W2_NORM)+(avg3W3_NORM)+(avg4W4_NORM)+(avg5W5_NORM)+(avg6W6_NORM)) weighted average of ALL wheels SIX WHEELS
end
Slip ratios (for four wheels)slipR1 = (avg_all_weighted(1)-avg1)avg_all_weighted(1) Filtered wheel velocity of wheel1 divided by estimated vehicle velocityslipR2 = (avg_all_weighted(1)-avg2)avg_all_weighted(1)slipR3 = (avg_all_weighted(1)-avg3)avg_all_weighted(1)slipR4 = (avg_all_weighted(1)-avg4)avg_all_weighted(1)
10
1200652 wwwkueblercom
MMiinniiaattuurree TTyyppee 22440000
bull High performance at a competitive pricebull Wide temperature range (-20 +85 degC)bull Sturdy cable outlet with multiple
clampingbull Temperature compensationbull Broad input voltage range
(5 24 V or 8 30 V)bull Highly flexible cable withstands
constant flexing from 0 degC 70 degC)
bull Low power consumption despite highscanning rate
bull Reverse connection protected and Short-circuit proof
bull Very high EMV standardndash KKuumluumlbblleerr eennccooddeerr ttyyppee 2244xxxx mmeeeettss GGeerrmmaann
RRaaiillwwaayyss ssttaannddaarrdd EENN 5500112211
4 6 10 16 20 25 36 40 5500 60 80 110000 120125 180 220000 250 300 336600 400 550000 51211000000 11002244 1080
EElleeccttrriiccaall cchhaarraacctteerriissttiiccss
PPuullssee rraatteess aavvaaiillaabbllee aatt sshhoorrtt nnoottiicceeSpeed max 12 000min-1
Rotor moment of inertia approx 01 x 10-6 kgm2
Starting torque lt0001 NmRadial load capacity of shaft 10 NAxial load capacity of shaft 20 NWeight approx 006 kgProtection acc to EN 60529 IP 64 housing sideWorking temperature ndash20deg C +85 degC2)
Operating temperature ndash20deg C +90 degC2)
Shaft stainless steelShock resistance acc to DIN-IEC 68-2-27 1000 ms2 6 msVibration resistance acc to DIN-IEC 68-2-6 100 ms2 55 2000 Hz
2) Non-condensing
Output circuit Push-pull Push-pull(7272)1) (7272)1)
Supply voltage 5 24 V DC 8 30 V DCPower consumption (no load) max 50 mA max 50 mAPermissible loadchannel max 50 mA max 50 mAPulse frequency max 160 kHz max 160 kHzSignal level high min UB = -25 V min UB = ndash3 VSignal level low max 05 V max 05 VRise time tr max 1 micros max 1 microsFall time tf max 1 micros max 1 microsShort circuit proof outputs yes yesConforms to CE requirements acc to EN 61000-6-1 EN 61000-6-4 and EN 61000-6-31) Max recommended cable length 30 m
AApppplliiccaattiioonnss
bull Pick and place machinesbull Handling machines for electronic compo-
nentsbull Quality testing machinesbull Medical machines
bull Mail opening and mail stuffing machinesbull Check weighersbull Labelling machinesbull Mole machines (camera control)bull Door and gates systemsbull Textil machines
KKuumluumlbblleerr eennccooddeerr ttyyppee 2244xxxx mmeeeettss GGeerrmmaannRRaaiillwwaayyss ssttaannddaarrddAn independent test laboratory (TTI-P-G11596-01) approved by the GermanAccreditation Council (DAR) certified thecompliance with the railway standardaccording to EN 50121 This means our encoder is compatible tohigher electromagnetic noise standardsthan standard industrial encoders Youwill have a higher quality encoder evenin applications with higher EMC noiselevelWe will gladly send you a copy of the testreport on request When ordering anencoder to the railway standard pleaseensure to state this explicitly on theorder
Rotary Measuring Technology Incremental shaft encoder
Appendix B Encoder datasheet
12006
Rota
ry M
easu
rem
ent T
echn
olog
yIn
crem
enta
l Enc
oder
s
wwwkueblercom 53
MMiinniiaattuurree TTyyppee 22440000
TTeerrmmiinnaall aassssiiggnnmmeennttSignal 0V +UB A A B B 0 OColour WH BN GN YE GY PK BU RDwithout inverted signal WH BN GN YE GY
6
18
1
D
24
min R50
10+
02
10+
214
10+
12
011
h7
21
21
max
5 3M
f7
IIssoollaattee uunnuusseedd oouuttppuuttss bbeeffoorree iinniittiiaall ssttaarrtt--uupp
DDiimmeennssiioonnssBracket type 1 (Oslash 24 mm)
Bracket type 2 (Oslash 30 mm)Bracket type 3 (Oslash 28 mm)
22
6
min R50
3M
B
24
D 21
A
812
max
5
h7
5
01
15f7
MMoouunnttiinngg aaddvviiccee
The brackets andshafts of theencoder and driveshould not both berigidly coupledtogether at the sametime We recom-mend the use ofsuitable couplings(see Accessoriessection)OOrrddeerr ccooddee 052400XXXXXXXX
Range
Bracket11 == oslashoslash 2244 mmmm 22 == oslashoslash 3300 mmmm33 == oslashoslash 2288 mmmmfurther on request
Shaft11 == oslashoslash 44 mmmm xx 1100 mmmm22 == oslashoslash 66 mmmm xx 1100 mmmm3 = oslash 5 mm x 10 mm with flattening
Pulse rate(eg 360 pulses=gt 0360)
Type of connection1 = Cable axial (2 m PVC cable oslash 45 mm) 22 == CCaabbllee rraaddiiaall ((2 m PVC cable oslash 45 mm))
Output and voltage supply1 = Push-pull (without inverted signals)
5 24 V supply voltage22 == PPuusshh--ppuullll ((wwiitthh iinnvveerrtteedd ssiiggnnaallss))
55 2244 VV DDCC ssuuppppllyy vvoollttaaggee3 = Push-pull (without inverted signals)
8 30 V DC supply voltage44 == PPuusshh--ppuullll ((wwiitthh iinnvveerrtteedd ssiiggnnaallss))
88 3300 VV ssuuppppllyy vvoollttaaggee
Bracket type 2 3A oslash 30 mm oslash 28 mmB 3 mm 2 mm
SSttoocckk ttyyppeess05240011220050052400112201000524001122036005240011220500052400112210000524001122102405240033211000052400334110000524003331050005240033311000
Preferred types are
indicated in bboolldd
Rotary Measuring Technology Incremental shaft encoder
DDR
Encoder1QuadA
Encoder1QuadB
Encoder2QuadA
Encoder2QuadB
Encoder3QuadA
Encoder3QuadB
Encoder4QuadA
Encoder4QuadB
FIXED_IO
LIDAR_lite_0
LIDAR_lite_v10 (Pre-Production)
S00_AXI
LIDAR_pwm
s00_axi_aclk
s00_axi_aresetn
LIDAR_pwm
MB_reset
Vn_adc
Vp_adc
axi_gpio_0
AXI GPIO
S_AXI
GPIOs_axi_aclk
s_axi_aresetn
axi_gpio_1
AXI GPIO
S_AXIGPIO
s_axi_aclk
s_axi_aresetnip2intc_irpt
axi_timer_0
AXI Timer
S_AXI
capturetrig0
capturetrig1
generateout0
generateout1
pwm0
interrupt
freeze
s_axi_aclk
s_axi_aresetn
axi_timer_1
AXI Timer
S_AXI
capturetrig0
capturetrig1
generateout0
generateout1
pwm0
interrupt
freeze
s_axi_aclk
s_axi_aresetn
axi_timer_2
AXI Timer
S_AXI
capturetrig0
capturetrig1
generateout0
generateout1
pwm0
interrupt
freeze
s_axi_aclk
s_axi_aresetn
axi_timer_3
AXI Timer
S_AXI
capturetrig0
capturetrig1
generateout0
generateout1
pwm0
interrupt
freeze
s_axi_aclk
s_axi_aresetn
axi_uartlite_0
AXI Uartlite
S_AXIUART
s_axi_aclk
s_axi_aresetninterrupt
axi_uartlite_1
AXI Uartlite
S_AXIUART
s_axi_aclk
s_axi_aresetninterrupt
decoder_0
decoder_v10 (Pre-Production)
S00_AXI
encoder_quadA
encoder_quadB
s00_axi_aclk
s00_axi_aresetn
decoder_1
decoder_v10 (Pre-Production)
S00_AXI
encoder_quadA
encoder_quadB
s00_axi_aclk
s00_axi_aresetn
decoder_2
decoder_v10 (Pre-Production)
S00_AXI
encoder_quadA
encoder_quadB
s00_axi_aclk
s00_axi_aresetn
decoder_3
decoder_v10 (Pre-Production)
S00_AXI
encoder_quadA
encoder_quadB
s00_axi_aclk
s00_axi_aresetn
gpio_rtl
gpio_rtl_0
mailbox_0
Mailbox
S0_AXI
S1_AXI
S0_AXI_ACLK
S0_AXI_ARESETN
S1_AXI_ACLK
S1_AXI_ARESETN
Interrupt_0
Interrupt_1
mailbox_1
Mailbox
S0_AXI
S1_AXI
S0_AXI_ACLK
S0_AXI_ARESETN
S1_AXI_ACLK
S1_AXI_ARESETN
Interrupt_0
Interrupt_1
mdm_1
MicroBlaze Debug Module (MDM)
S_AXI MBDEBUG_0
S_AXI_ACLK
S_AXI_ARESETN
Interrupt
Debug_SYS_Rst
microblaze_0
MicroBlaze
INTERRUPTDLMB
ILMB
M_AXI_DP
M_AXI_DC
M_AXI_IC
DEBUG
Clk
Reset
microblaze_0_axi_intc
AXI Interrupt Controller
s_axi
interrupt
s_axi_aclk
s_axi_aresetn
intr[20]
processor_clk
processor_rst
microblaze_0_axi_periph
AXI Interconnect
S00_AXI
M00_AXI
S01_AXI
S02_AXI
M01_AXI
M02_AXI
M03_AXI
M04_AXI
M05_AXI
M06_AXI
ACLK
ARESETN[00]
S00_ACLK
S00_ARESETN[00]
M00_ACLK
M00_ARESETN[00]
S01_ACLK
S01_ARESETN[00]
S02_ACLK
S02_ARESETN[00]
M01_ACLK
M01_ARESETN[00]
M02_ACLK
M02_ARESETN[00]
M03_ACLK
M03_ARESETN[00]
M04_ACLK
M04_ARESETN[00]
M05_ACLK
M05_ARESETN[00]
M06_ACLK
M06_ARESETN[00]
microblaze_0_local_memory
DLMB
ILMB
LMB_Clk
SYS_Rst[00]
microblaze_0_xlconcat
Concat
In0[00]
In1[00]
In2[00]
dout[20]
processing_system7_0
ZYNQ7 Processing System
DDR
FIXED_IO
USBIND_0
M_AXI_GP0
TTC0_WAVE0_OUT
TTC0_WAVE1_OUT
TTC0_WAVE2_OUT
M_AXI_GP0_ACLK
FCLK_CLK0
FCLK_RESET0_N
processing_system7_0_axi_periph
AXI Interconnect
S00_AXI
M00_AXI
M01_AXI
M02_AXI
M03_AXI
M04_AXI
M05_AXI
M06_AXI
M07_AXI
M08_AXI
M09_AXI
M10_AXI
M11_AXI
M12_AXI
ACLK
ARESETN[00]
S00_ACLK
S00_ARESETN[00]
M00_ACLK
M00_ARESETN[00]
M01_ACLK
M01_ARESETN[00]
M02_ACLK
M02_ARESETN[00]
M03_ACLK
M03_ARESETN[00]
M04_ACLK
M04_ARESETN[00]
M05_ACLK
M05_ARESETN[00]
M06_ACLK
M06_ARESETN[00]
M07_ACLK
M07_ARESETN[00]
M08_ACLK
M08_ARESETN[00]
M09_ACLK
M09_ARESETN[00]
M10_ACLK
M10_ARESETN[00]
M11_ACLK
M11_ARESETN[00]
M12_ACLK
M12_ARESETN[00]
pwm_motor
pwm_servo
rst_processing_system7_0_100M
Processor System Reset
slowest_sync_clk
ext_reset_in
aux_reset_in
mb_debug_sys_rst
dcm_locked
mb_reset
bus_struct_reset[00]
peripheral_reset[00]
interconnect_aresetn[00]
peripheral_aresetn[00]
uart_rtl
uart_rtl_0
xadc_wiz_0
XADC Wizard
s_axi_lite
Vp_Vn
vn_in
vp_in
s_axi_aclk
s_axi_aresetn
ip2intc_irpt
channel_out[40]
eoc_out
alarm_out
eos_out
busy_out
Appendix C Vivado FPGA block design
Appendix D Exploded view of RC-car
TRITA MMK 2017 160 MDA 617
wwwkthse
- Introduction
-
- Background
- Problem Statement
-
- Thesis Objective
- Thesis outline
-
- Related work
- Purpose and goal
- Ethics and sustainability considerations
- Delimitations
-
- Methodology
-
- Methodology of the literature review
- Methodology of the implementation phase
-
- Literature Review
-
- Data aggregation
-
- Data Aggregation Theory
- Data Aggregation in Multi-sensor Systems
-
- Advanced Driver Assistance Systems (ADAS)
-
- Slip detection and control
-
- Cooperation between CPS
-
- Concurrency and Isolation
-
- Conclusions from Literature Review
-
- Implementation
-
- Implications of convoy driving
- Use Case Vehicle Control Loss Warning
- Requirements
-
- Requirements for Use Case
- Requirements for Convoy Driving
-
- Hardware
-
- Board
- Field Programmable Logic - FPGA
- Car platform
- Sensors
-
- Software
-
- RTOS ToppersFMP and SafeG
- GPOS Linux Digilent
- Dual-OS communication
- SoA and SHAPE
-
- Software design of demonstrator
- Slip detection on the demonstrator
-
- Related works for slip detection
- Proposed approach for slip detection on the demonstrator
-
- Initial simulations
-
- One- and two wheel stall
-
- Real-time implementation on the Demonstrator
-
- Demonstrator Architecture
- Real time data aggregation on the demonstrator
-
- Results
-
- Results from simulations
-
- Simulated aggregation during one-wheel stall
- Simulated aggregation during two-wheel stall
-
- Results from real-time implementation
-
- Real-time aggregation during one-wheel stall
- Real-time aggregation during one-wheel slip
-
- Discussion and Future work
-

DDR
Encoder1QuadA
Encoder1QuadB
Encoder2QuadA
Encoder2QuadB
Encoder3QuadA
Encoder3QuadB
Encoder4QuadA
Encoder4QuadB
FIXED_IO
LIDAR_lite_0
LIDAR_lite_v10 (Pre-Production)
S00_AXI
LIDAR_pwm
s00_axi_aclk
s00_axi_aresetn
LIDAR_pwm
MB_reset
Vn_adc
Vp_adc
axi_gpio_0
AXI GPIO
S_AXI
GPIOs_axi_aclk
s_axi_aresetn
axi_gpio_1
AXI GPIO
S_AXIGPIO
s_axi_aclk
s_axi_aresetnip2intc_irpt
axi_timer_0
AXI Timer
S_AXI
capturetrig0
capturetrig1
generateout0
generateout1
pwm0
interrupt
freeze
s_axi_aclk
s_axi_aresetn
axi_timer_1
AXI Timer
S_AXI
capturetrig0
capturetrig1
generateout0
generateout1
pwm0
interrupt
freeze
s_axi_aclk
s_axi_aresetn
axi_timer_2
AXI Timer
S_AXI
capturetrig0
capturetrig1
generateout0
generateout1
pwm0
interrupt
freeze
s_axi_aclk
s_axi_aresetn
axi_timer_3
AXI Timer
S_AXI
capturetrig0
capturetrig1
generateout0
generateout1
pwm0
interrupt
freeze
s_axi_aclk
s_axi_aresetn
axi_uartlite_0
AXI Uartlite
S_AXIUART
s_axi_aclk
s_axi_aresetninterrupt
axi_uartlite_1
AXI Uartlite
S_AXIUART
s_axi_aclk
s_axi_aresetninterrupt
decoder_0
decoder_v10 (Pre-Production)
S00_AXI
encoder_quadA
encoder_quadB
s00_axi_aclk
s00_axi_aresetn
decoder_1
decoder_v10 (Pre-Production)
S00_AXI
encoder_quadA
encoder_quadB
s00_axi_aclk
s00_axi_aresetn
decoder_2
decoder_v10 (Pre-Production)
S00_AXI
encoder_quadA
encoder_quadB
s00_axi_aclk
s00_axi_aresetn
decoder_3
decoder_v10 (Pre-Production)
S00_AXI
encoder_quadA
encoder_quadB
s00_axi_aclk
s00_axi_aresetn
gpio_rtl
gpio_rtl_0
mailbox_0
Mailbox
S0_AXI
S1_AXI
S0_AXI_ACLK
S0_AXI_ARESETN
S1_AXI_ACLK
S1_AXI_ARESETN
Interrupt_0
Interrupt_1
mailbox_1
Mailbox
S0_AXI
S1_AXI
S0_AXI_ACLK
S0_AXI_ARESETN
S1_AXI_ACLK
S1_AXI_ARESETN
Interrupt_0
Interrupt_1
mdm_1
MicroBlaze Debug Module (MDM)
S_AXI MBDEBUG_0
S_AXI_ACLK
S_AXI_ARESETN
Interrupt
Debug_SYS_Rst
microblaze_0
MicroBlaze
INTERRUPTDLMB
ILMB
M_AXI_DP
M_AXI_DC
M_AXI_IC
DEBUG
Clk
Reset
microblaze_0_axi_intc
AXI Interrupt Controller
s_axi
interrupt
s_axi_aclk
s_axi_aresetn
intr[20]
processor_clk
processor_rst
microblaze_0_axi_periph
AXI Interconnect
S00_AXI
M00_AXI
S01_AXI
S02_AXI
M01_AXI
M02_AXI
M03_AXI
M04_AXI
M05_AXI
M06_AXI
ACLK
ARESETN[00]
S00_ACLK
S00_ARESETN[00]
M00_ACLK
M00_ARESETN[00]
S01_ACLK
S01_ARESETN[00]
S02_ACLK
S02_ARESETN[00]
M01_ACLK
M01_ARESETN[00]
M02_ACLK
M02_ARESETN[00]
M03_ACLK
M03_ARESETN[00]
M04_ACLK
M04_ARESETN[00]
M05_ACLK
M05_ARESETN[00]
M06_ACLK
M06_ARESETN[00]
microblaze_0_local_memory
DLMB
ILMB
LMB_Clk
SYS_Rst[00]
microblaze_0_xlconcat
Concat
In0[00]
In1[00]
In2[00]
dout[20]
processing_system7_0
ZYNQ7 Processing System
DDR
FIXED_IO
USBIND_0
M_AXI_GP0
TTC0_WAVE0_OUT
TTC0_WAVE1_OUT
TTC0_WAVE2_OUT
M_AXI_GP0_ACLK
FCLK_CLK0
FCLK_RESET0_N
processing_system7_0_axi_periph
AXI Interconnect
S00_AXI
M00_AXI
M01_AXI
M02_AXI
M03_AXI
M04_AXI
M05_AXI
M06_AXI
M07_AXI
M08_AXI
M09_AXI
M10_AXI
M11_AXI
M12_AXI
ACLK
ARESETN[00]
S00_ACLK
S00_ARESETN[00]
M00_ACLK
M00_ARESETN[00]
M01_ACLK
M01_ARESETN[00]
M02_ACLK
M02_ARESETN[00]
M03_ACLK
M03_ARESETN[00]
M04_ACLK
M04_ARESETN[00]
M05_ACLK
M05_ARESETN[00]
M06_ACLK
M06_ARESETN[00]
M07_ACLK
M07_ARESETN[00]
M08_ACLK
M08_ARESETN[00]
M09_ACLK
M09_ARESETN[00]
M10_ACLK
M10_ARESETN[00]
M11_ACLK
M11_ARESETN[00]
M12_ACLK
M12_ARESETN[00]
pwm_motor
pwm_servo
rst_processing_system7_0_100M
Processor System Reset
slowest_sync_clk
ext_reset_in
aux_reset_in
mb_debug_sys_rst
dcm_locked
mb_reset
bus_struct_reset[00]
peripheral_reset[00]
interconnect_aresetn[00]
peripheral_aresetn[00]
uart_rtl
uart_rtl_0
xadc_wiz_0
XADC Wizard
s_axi_lite
Vp_Vn
vn_in
vp_in
s_axi_aclk
s_axi_aresetn
ip2intc_irpt
channel_out[40]
eoc_out
alarm_out
eos_out
busy_out
Appendix C Vivado FPGA block design
Appendix D Exploded view of RC-car
TRITA MMK 2017 160 MDA 617
wwwkthse
- Introduction
-
- Background
- Problem Statement
-
- Thesis Objective
- Thesis outline
-
- Related work
- Purpose and goal
- Ethics and sustainability considerations
- Delimitations
-
- Methodology
-
- Methodology of the literature review
- Methodology of the implementation phase
-
- Literature Review
-
- Data aggregation
-
- Data Aggregation Theory
- Data Aggregation in Multi-sensor Systems
-
- Advanced Driver Assistance Systems (ADAS)
-
- Slip detection and control
-
- Cooperation between CPS
-
- Concurrency and Isolation
-
- Conclusions from Literature Review
-
- Implementation
-
- Implications of convoy driving
- Use Case Vehicle Control Loss Warning
- Requirements
-
- Requirements for Use Case
- Requirements for Convoy Driving
-
- Hardware
-
- Board
- Field Programmable Logic - FPGA
- Car platform
- Sensors
-
- Software
-
- RTOS ToppersFMP and SafeG
- GPOS Linux Digilent
- Dual-OS communication
- SoA and SHAPE
-
- Software design of demonstrator
- Slip detection on the demonstrator
-
- Related works for slip detection
- Proposed approach for slip detection on the demonstrator
-
- Initial simulations
-
- One- and two wheel stall
-
- Real-time implementation on the Demonstrator
-
- Demonstrator Architecture
- Real time data aggregation on the demonstrator
-
- Results
-
- Results from simulations
-
- Simulated aggregation during one-wheel stall
- Simulated aggregation during two-wheel stall
-
- Results from real-time implementation
-
- Real-time aggregation during one-wheel stall
- Real-time aggregation during one-wheel slip
-
- Discussion and Future work
-


![Aggregation and Secure Aggregation. [Aggre_1] Section 12 Why do we need Aggregation? Sensor networks – Event-based Systems Example Query: –What is the.](https://static.fdocuments.in/doc/165x107/5a4d1bc87f8b9ab0599d5aae/aggregation-and-secure-aggregation-aggre1-section-12-why-do-we-need-aggregation.jpg)