DAT 407 Advanced Report Authoring With SQL Server Reporting Services Brian Welcker Group Program...
29
DAT 407 DAT 407 Advanced Report Authoring Advanced Report Authoring With SQL Server Reporting With SQL Server Reporting Services Services Brian Welcker Brian Welcker Group Program Manager Group Program Manager SQL Server Reporting SQL Server Reporting Services Services Microsoft Microsoft
-
Upload
betty-marshall -
Category
Documents
-
view
228 -
download
3
Transcript of DAT 407 Advanced Report Authoring With SQL Server Reporting Services Brian Welcker Group Program...
DAT 407DAT 407Advanced Report Authoring With Advanced Report Authoring With SQL Server Reporting ServicesSQL Server Reporting Services
DAT 407DAT 407Advanced Report Authoring With Advanced Report Authoring With SQL Server Reporting ServicesSQL Server Reporting Services
Brian WelckerBrian WelckerGroup Program ManagerGroup Program ManagerSQL Server Reporting ServicesSQL Server Reporting ServicesMicrosoftMicrosoft

GoalsGoalsGoalsGoals
Demonstrate broad set of report Demonstrate broad set of report design featuresdesign features
Build several reports of Build several reports of increasing complexityincreasing complexity
Discuss key report definition conceptsDiscuss key report definition concepts
Present tips, tricks and workaroundsPresent tips, tricks and workarounds

Creating ReportsCreating ReportsCreating ReportsCreating Reports
Use Report Designer hosted in Use Report Designer hosted in Visual Studio .NETVisual Studio .NET
Start with Report wizard or blank reportStart with Report wizard or blank report
Import from Microsoft Access XP or 2003Import from Microsoft Access XP or 2003Charts and code-behind are not importedCharts and code-behind are not imported
Redesign your top reports to use Reporting Redesign your top reports to use Reporting Services featuresServices features
Use 3rd party tools that target Use 3rd party tools that target Reporting ServicesReporting Services
Proclarity, Panorama, Cizer, MIS AGProclarity, Panorama, Cizer, MIS AG
Full list at: Full list at: http://www.microsoft.com/sql/reportinghttp://www.microsoft.com/sql/reporting

Creating ReportsCreating Reports

Report ItemsReport ItemsReport ItemsReport Items
TextboxTextbox
ImageImage
LineLine
RectangleRectangle
SubreportSubreport
Data Regions (List, Table, Matrix, Chart)Data Regions (List, Table, Matrix, Chart)
Custom Report Items coming in Custom Report Items coming in SQL Server 2005!SQL Server 2005!
$100,000$100,000

Item StylesItem StylesItem StylesItem Styles
All Report ItemsAll Report ItemsBackground ColorBackground ColorBackground ImageBackground ImageBorder ColorBorder ColorBorder StyleBorder StyleBorder WidthBorder WidthPaddingPadding
ChartsChartsBackground Background GradientGradient
TextboxesTextboxesColorColorFont FamilyFont FamilyFont SizeFont SizeFont StyleFont StyleFont WeightFont WeightFormatFormatLine HeightLine HeightText AlignText AlignText DecorationText DecorationVertical AlignVertical Align

ListsListsListsLists
Repeating regions Repeating regions with freeform layoutwith freeform layoutSimilar to “bands” in Similar to “bands” in other report writersother report writers
But multiple lists can But multiple lists can sit side-by-side!sit side-by-side!
Lists inside lists to Lists inside lists to get multiple levels get multiple levels of groupingof groupingUse for complex Use for complex repeating areasrepeating areas
BrianBrian
JasonJason
SteveSteve
$10,000$10,000
$20,000$20,000
$30,000$30,000
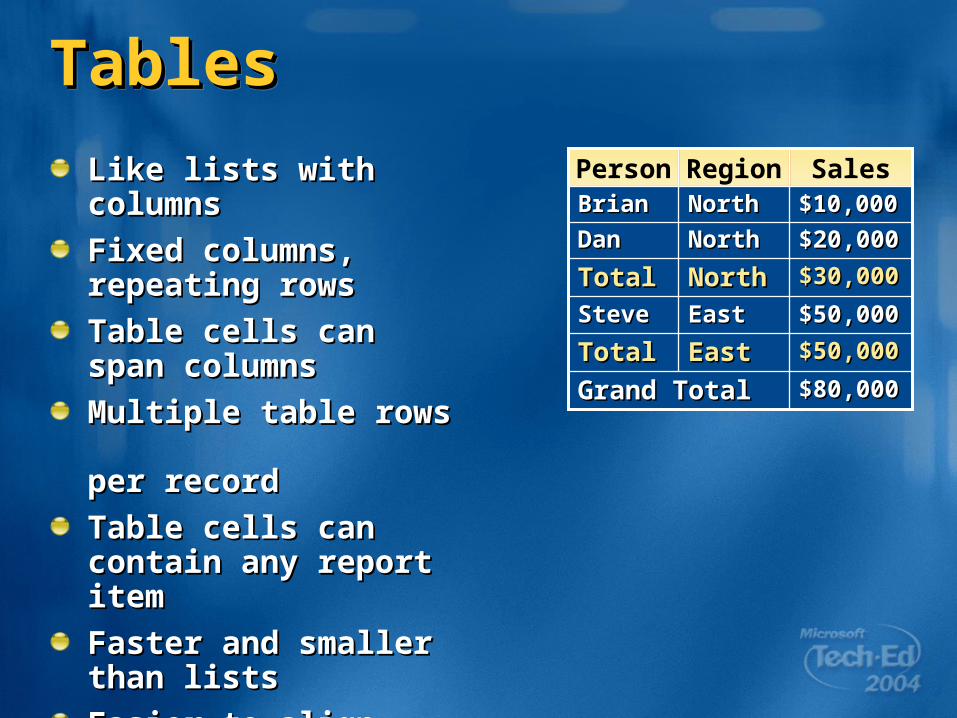
TablesTablesTablesTables
Like lists with columnsLike lists with columns
Fixed columns, Fixed columns, repeating rowsrepeating rows
Table cells can Table cells can span columnsspan columns
Multiple table rows Multiple table rows per recordper record
Table cells can contain Table cells can contain any report itemany report item
Faster and smaller than Faster and smaller than listslists
Easier to align itemsEasier to align items
Use for most reportsUse for most reports
$80,000$80,000Grand TotalGrand Total$50,000$50,000EastEastTotalTotal
$30,000$30,000NorthNorthTotalTotal
SalesRegionPerson
$50,000$50,000EastEastSteveSteve
$20,000$20,000NorthNorthDanDan
$10,000$10,000NorthNorthBrianBrian

MatricesMatricesMatricesMatrices
Repeats in row and Repeats in row and column directionscolumn directions
Also known as pivot Also known as pivot table or cross tabtable or cross tab
Arbitrary formatting Arbitrary formatting in headersin headers
Different formatting Different formatting for subtotalsfor subtotals
Matrix cells can contain Matrix cells can contain any report itemany report item
Use when column Use when column headings are records in headings are records in your datayour data
$720$720$760$760$600$600Total
$300 $300 $400 $400 $300 $300 Steve
$300 $300 $250 $250 $200 $200 Jason
$120 $120 $110 $110 $100 $100 Brian
200220022001200120002000SalesSales

ChartsChartsChartsCharts
Data from fields in Data from fields in the data setthe data set
or from expressionsor from expressions
Full set of chart Full set of chart properties and typesproperties and types
Style enhancementsStyle enhancementsin SP1in SP1
Same data functionality Same data functionality as Matrixas Matrix

Expressions and Expressions and InteractivityInteractivity

ExpressionsExpressionsExpressionsExpressions
Most properties take expressionsMost properties take expressionsValues from the data setsValues from the data sets
Values of other items on the reportValues of other items on the report
Values of global properties and user propertiesValues of global properties and user properties
Expressions use Visual Basic .NET syntaxExpressions use Visual Basic .NET syntax
Aggregates: Sum, Avg, Count, Min, First, etc.Aggregates: Sum, Avg, Count, Min, First, etc.
ExamplesExamples=Fields!Name.Value=Fields!Name.Value
=Fields!First.Value & " " & Fields!Last .Value=Fields!First.Value & " " & Fields!Last .Value
=Sum(Fields!Sales.Value)=Sum(Fields!Sales.Value)
=IIf(Sum(Fields!Sales.Value)>10, "green", "red")=IIf(Sum(Fields!Sales.Value)>10, "green", "red")

ParametersParametersParametersParameters
Report parameters can be used in report Report parameters can be used in report expressions (including binding to expressions (including binding to query parameters)query parameters)
Set of valid values and default values can be Set of valid values and default values can be static or query-basedstatic or query-based
Parameters can be hierarchicalParameters can be hierarchicalSelection of parameter value can drive later Selection of parameter value can drive later valid valuesvalid values
Accessed using global Parameters Accessed using global Parameters collection, e.g.collection, e.g.
=IIF(Fields!Sales.Value > Parameters!Goal.Value, =IIF(Fields!Sales.Value > Parameters!Goal.Value, “PASS", “FAIL")“PASS", “FAIL")

Making Reports InteractiveMaking Reports InteractiveMaking Reports InteractiveMaking Reports Interactive
Actions can be added to report itemsActions can be added to report itemsDrill down within a report Drill down within a report
Drill through to a different reportDrill through to a different report
Bookmarks jump within a reportBookmarks jump within a report
Hyperlinks any web pageHyperlinks any web page
Document map shows report structureDocument map shows report structure

Tips and TricksTips and Tricksa.k.a. “Sleazy Hacks”a.k.a. “Sleazy Hacks”

Green BarGreen BarGreen BarGreen Bar
Conditional formatting on contents of Conditional formatting on contents of table cellstable cells
Background color expressionBackground color expression=iif(RowNumber(Nothing) Mod =iif(RowNumber(Nothing) Mod 2,“Green","White")2,“Green","White")

Page Break After N RowsPage Break After N RowsPage Break After N RowsPage Break After N Rows
““Hidden” page break groupingHidden” page break groupingGroup expressionGroup expression
=Ceiling(RowNumber(Nothing)/30)=Ceiling(RowNumber(Nothing)/30)
No header or footerNo header or footer
Page break at end of groupPage break at end of group

Running TotalRunning TotalRunning TotalRunning Total
Running aggregate functionRunning aggregate function=RunningValue(Fields!SalesAmt.Value, =RunningValue(Fields!SalesAmt.Value, Sum, Nothing)Sum, Nothing)

Simulated End-User SortingSimulated End-User SortingSimulated End-User SortingSimulated End-User Sorting
““Sort By” report parameterSort By” report parameterValues = Names of fields to sort byValues = Names of fields to sort by
““Direction” report parameterDirection” report parameterValues = Ascending, Descending, NoneValues = Ascending, Descending, None

Simulated End-User Sorting Simulated End-User Sorting Simulated End-User Sorting Simulated End-User Sorting
Two sort expressions on tableTwo sort expressions on tableAscending sortAscending sort
=iif(Parameters!Direction.Value= "Ascending",=iif(Parameters!Direction.Value= "Ascending",
Fields(Parameters!SortBy.Value).Value,0)Fields(Parameters!SortBy.Value).Value,0)
Descending sortDescending sort=iif(Parameters!Direction.Value= =iif(Parameters!Direction.Value= “Descending",“Descending",
Fields(Parameters!SortBy.Value).Value,0)Fields(Parameters!SortBy.Value).Value,0)
SQL Server 2005 will have auto-sort SQL Server 2005 will have auto-sort and filter built in!and filter built in!

Simulated “All” ParametersSimulated “All” ParametersSimulated “All” ParametersSimulated “All” Parameters
String parameter (Country)String parameter (Country)Query contains “like @Country”Query contains “like @Country”
Valid Values list contains “All”Valid Values list contains “All”Mapped to value of “%”Mapped to value of “%”

Simulated “All” ParametersSimulated “All” ParametersSimulated “All” ParametersSimulated “All” Parameters
Integer parameter (Year)Integer parameter (Year)Query contains “>= @MinYear” and Query contains “>= @MinYear” and “<= @MaxYear”“<= @MaxYear”
Valid Values contains “All”Valid Values contains “All”Mapped to value of 0Mapped to value of 0
Query parameter expression for MaxYearQuery parameter expression for MaxYear=iif(Parameters!=iif(Parameters!Year.Value=0,10000,Parameters!Year.Value)Year.Value=0,10000,Parameters!Year.Value)
Alternate Method: Construct the query as an Alternate Method: Construct the query as an expressionexpression
Custom CodeCustom Code

Custom Code - DefinitionCustom Code - DefinitionCustom Code - DefinitionCustom Code - Definition
Define function in Code property Define function in Code property (VB .NET)(VB .NET)
Public Function IsGood(Percent as Single, Public Function IsGood(Percent as Single, EmpCount as Integer) as BooleanEmpCount as Integer) as BooleanIf (Percent * 100 / EmpCount) > 7If (Percent * 100 / EmpCount) > 7
[…][…]
End FunctionEnd Function
Link in any .NET AssemblyLink in any .NET AssemblyCall or instance-based methodsCall or instance-based methods
CAS determines code privilegesCAS determines code privileges

Custom Code - UsageCustom Code - UsageCustom Code - UsageCustom Code - Usage
Use code in any expressionUse code in any expression
E.g. Conditional formattingE.g. Conditional formatting=iif(Code.IsGood(ReportItems!Percent.Value,=iif(Code.IsGood(ReportItems!Percent.Value,
ReportItems!EmployeeCount.Value),ReportItems!EmployeeCount.Value),
"Green","Black")"Green","Black")
External AssembliesExternal Assemblies
=Code.CurrencyConverter.Convert(Fields!=Code.CurrencyConverter.Convert(Fields!Sales.Value, “eur”, “usd”)Sales.Value, “eur”, “usd”)

Deploying ReportsDeploying ReportsDeploying ReportsDeploying Reports
Copies reports, images, and data Copies reports, images, and data sources to Report Server via sources to Report Server via Web ServiceWeb Service
After you deployAfter you deploySet security permissionsSet security permissions
Set up caching and scheduled executionSet up caching and scheduled execution
Set up subscriptionsSet up subscriptions
Bask in the admiration of your co-Bask in the admiration of your co-workers!workers!
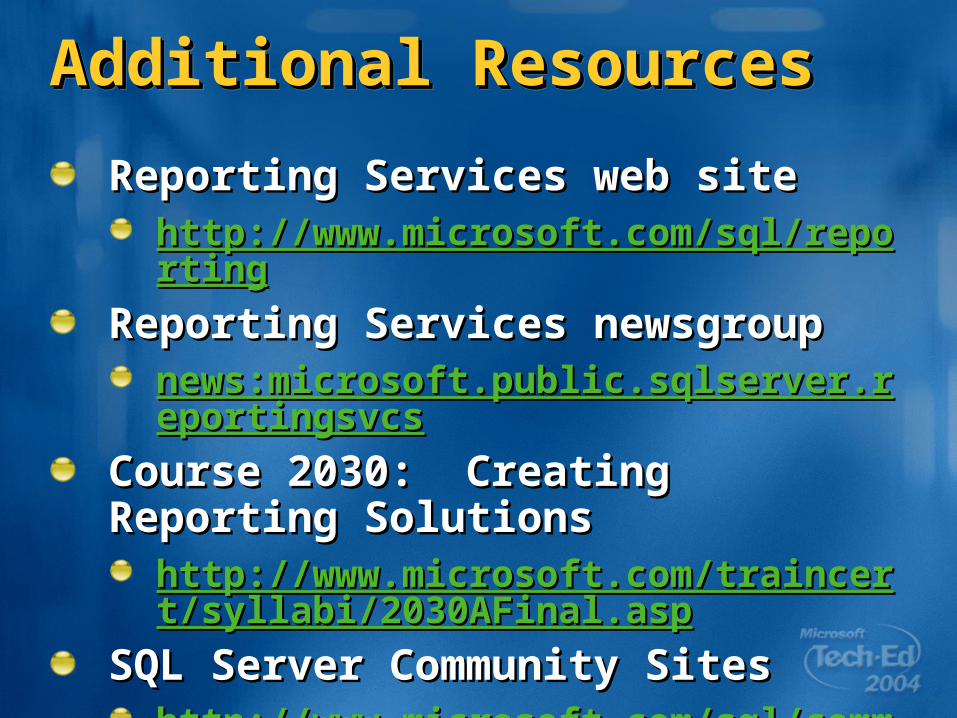
Additional ResourcesAdditional ResourcesAdditional ResourcesAdditional Resources
Reporting Services web siteReporting Services web sitehttp://www.microsoft.com/sql/reportinghttp://www.microsoft.com/sql/reporting
Reporting Services newsgroupReporting Services newsgroupnews:microsoft.public.sqlserver.reportingnews:microsoft.public.sqlserver.reportingsvcssvcs
Course 2030: Creating Course 2030: Creating Reporting SolutionsReporting Solutions
http://www.microsoft.com/traincert/syllabihttp://www.microsoft.com/traincert/syllabi/2030AFinal.asp/2030AFinal.asp
SQL Server Community SitesSQL Server Community Siteshttp://www.microsoft.com/sql/community/http://www.microsoft.com/sql/community/

Q1:Q1: Overall satisfaction with the sessionOverall satisfaction with the session
Q2:Q2: Usefulness of the informationUsefulness of the information
Q3:Q3: Presenter’s knowledge of the subjectPresenter’s knowledge of the subject
Q4:Q4: Presenter’s presentation skillsPresenter’s presentation skills
Q5:Q5: Effectiveness of the presentationEffectiveness of the presentation
Please fill out a session evaluation on CommNetPlease fill out a session evaluation on CommNet

© 2004 Microsoft Corporation. All rights reserved.This presentation is for informational purposes only. Microsoft makes no warranties, express or implied, in this summary.