DARLING INGREDIENTS INC. - s3.amazonaws.com · Indicate by check mark if the Registrant is not req...
195
DARLING INGREDIENTS INC. FORM 10-K (Annual Report) Filed 03/04/15 for the Period Ending 01/03/15 Address 251 O CONNOR RIDGE BLVD STE 300 IRVING, TX 75038 Telephone 9727170300 CIK 0000916540 Symbol DAR SIC Code 2070 - Fats And Oils Industry Food Processing Sector Consumer Non-Cyclicals Fiscal Year 05/07 http://www.edgar-online.com © Copyright 2016, EDGAR Online, Inc. All Rights Reserved. Distribution and use of this document restricted under EDGAR Online, Inc. Terms of Use.
-
Upload
nguyenduong -
Category
Documents
-
view
218 -
download
0
Transcript of DARLING INGREDIENTS INC. - s3.amazonaws.com · Indicate by check mark if the Registrant is not req...

DARLING INGREDIENTS INC.
FORM 10-K(Annual Report)
Filed 03/04/15 for the Period Ending 01/03/15
Address 251 O CONNOR RIDGE BLVDSTE 300IRVING, TX 75038
Telephone 9727170300CIK 0000916540
Symbol DARSIC Code 2070 - Fats And Oils
Industry Food ProcessingSector Consumer Non-Cyclicals
Fiscal Year 05/07
http://www.edgar-online.com© Copyright 2016, EDGAR Online, Inc. All Rights Reserved.
Distribution and use of this document restricted under EDGAR Online, Inc. Terms of Use.
UNITED STATES
SECURITIES AND EXCHANGE COMMISSION Washington, DC 20549
FORM 10-K
Commission File Number 001-13323
DARLING INGREDIENTS INC. (Exact name of registrant as specified in its charter)
Registrant's telephone number, including area code: (972) 717-0300
Securities registered pursuant to Section 12(b) of the Act:
Securities registered pursuant to Section 12(g) of the Act: None
Indicate by check mark if the Registrant is a well-known seasoned issuer, as defined in Rule 405 of the Securities Act.
Yes X No ____
Indicate by check mark if the Registrant is not required to file reports pursuant to Section 13 or Section 15(d) of the Act. Yes No X Indicate by check mark whether the Registrant (1) has filed all reports required to be filed by Section 13 or 15(d) of the Securities Exchange
Act of 1934 during the preceding 12 months (or for such shorter period that the Registrant was required to file such reports), and (2) has been subject to such filing requirements for the past 90 days. Yes X No ____
Indicate by check mark whether the Registrant has submitted electronically and posted on its corporate Web site, if any, every Interactive Data File required to be submitted and posted pursuant to Rule 405 of Regulation S-T (§232.405 of this chapter) during the preceding 12 months (or for such shorter period that the Registrant was required to submit and post such files). Yes X No ___
Indicate by check mark if disclosure of delinquent filers pursuant to Item 405 of Regulation S-K is not contained herein, and will not be contained, to the best of the Registrant’s knowledge, in definitive proxy or information statements incorporated by reference in Part III of this Form 10-K or any amendment to this Form 10-K. X
Page 1
(Mark One)
/X/ ANNUAL REPORT PURSUANT TO SECTION 13 or 15(d) OF THE SECURITIES
EXCHANGE ACT OF 1934
For the fiscal year ended January 3, 2015 OR
/ / TRANSITION REPORT PURSUANT TO SECTION 13 or 15(d) OF THE SECURITIES
EXCHANGE ACT OF 1934
For the transition period from _______ to _______
Delaware 36-2495346 (State or other jurisdiction (I.R.S. Employer
of incorporation or organization) Identification Number)
251 O'Connor Ridge Blvd., Suite 300
Irving, Texas 75038 (Address of principal executive offices) (Zip Code)
Title of Each Class Name of Exchange on Which Registered
Common Stock $0.01 par value per share New York Stock Exchange (“NYSE”)

Indicate by check mark whether the Registrant is a large accelerated filer, an accelerated filer, a non-accelerated filer, or a smaller reporting
company. See the definitions of “large accelerated filer,” “accelerated filer” and “smaller reporting company” in Rule 12b-2 of the Exchange Act.
Indicate by check mark whether the Registrant is a shell company (as defined in Rule 12b-2 of the Exchange Act). Yes No X
As of the last day of the Registrant's most recently completed second fiscal quarter, the aggregate market value of the shares of common
stock held by nonaffiliates of the Registrant was approximately $ 3,398,264,000 based upon the closing price of the common stock as reported on the NYSE on that day. (In determining the market value of the Registrant’s common stock held by non-affiliates, shares of common stock beneficially owned by directors, officers and holders of more than 10% of the Registrant’s common stock have been excluded. This determination of affiliate status is not necessarily a conclusive determination for other purposes.)
There were 164,718,413 shares of common stock, $0.01 par value, outstanding at February 25, 2015 .
DOCUMENTS INCORPORATED BY REFERENCE Selected designated portions of the Registrant's definitive Proxy Statement in connection with the Registrant’s 2015 Annual Meeting of
stockholders are incorporated by reference into Part III of this Annual Report.
Page 2
Large accelerated filer X Accelerated filer Non-accelerated filer Smaller reporting company
(Do not check if a smaller reporting company)

DARLING INGREDIENTS INC. AND SUBSIDIARIES FORM 10-K FOR THE FISCAL YEAR ENDED JANUARY 3, 2015
TABLE OF CONTENTS
PART I ITEM 1. BUSINESS
Page No.
PART I
Item 1. BUSINESS 3
Item 1A. RISK FACTORS 14
Item 1B. UNRESOLVED STAFF COMMENTS 33
Item 2. PROPERTIES 33
Item 3. LEGAL PROCEEDINGS 35
Item 4. MINE SAFETY DISCLOSURES 35
PART II
Item 5. MARKET FOR REGISTRANT'S COMMON EQUITY, RELATED STOCKHOLDER MATTERS AND ISSUER PURCHASES OF EQUITY SECURITIES 36
Item 6. SELECTED FINANCIAL DATA 37
Item 7. MANAGEMENT'S DISCUSSION AND ANALYSIS OF FINANCIAL CONDITION AND RESULTS OF OPERATIONS 39
Item 7A. QUANTITATIVE AND QUALITATIVE DISCLOSURE ABOUT MARKET RISK 62
Item 8. FINANCIAL STATEMENTS AND SUPPLEMENTARY DATA 62
Item 9. CHANGES IN AND DISAGREEMENTS WITH ACCOUNTANTS ON ACCOUNTING AND FINANCAL DISCLOSURE 113
Item 9A. CONTROLS AND PROCEDURES 113
Item 9B. OTHER INFORMATION 113
PART III
Item 10. DIRECTORS, EXECUTIVE OFFICERS AND CORPORATE GOVERNANCE 113
Item 11. EXECUTIVE COMPENSATION 113
Item 12. SECURITY OWNERSHIP OF CERTAIN BENEFICIAL OWNERS AND MANAGEMENT AND RELATED STOCKHOLDER MATTERS 113
Item 13. CERTAIN RELATIONSHIPS AND RELATED TRANSACTIONS, AND DIRECTOR INDEPENDENCE 113
Item 14. PRINCIPAL ACCOUNTING FEES AND SERVICES 113
PART IV
Item 15. EXHIBITS, FINANCIAL STATEMENT SCHEDULES 113
SIGNATURES 117

GENERAL
Founded by the Swift meat packing interests and the Darling family in 1882, Darling Ingredients Inc. ("Darling", and together with its subsidiaries, the "Company" or "we," "us" or "our") was incorporated in Delaware in 1962 under the name "Darling-Delaware Company, Inc." Darling changed its name from "Darling-Delaware Company, Inc." to "Darling International Inc." on December 28, 1993, and from "Darling International Inc." to "Darling Ingredients Inc." on May 6, 2014. The address of Darling's principal executive office is 251 O'Connor Ridge Boulevard, Suite 300, Irving, Texas, 75038, and its telephone number at this address is (972) 717-0300.
OVERVIEW
We are a global developer and producer of sustainable natural ingredients from edible and inedible bio-nutrients, creating a wide range of
ingredients and customized specialty solutions for customers in the pharmaceutical, food, pet food, feed, technical, fuel, bioenergy and fertilizer industries. With operations on five continents, the Company collects and transforms all aspects of animal by-product streams into useable and specialty ingredients, such as gelatin, edible fats, feed-grade fats, animal proteins and meals, plasma, pet food ingredients, organic fertilizers, yellow grease, fuel feedstocks, green energy, natural casings and hides. The Company also recovers and converts used cooking oil and commercial bakery residuals into valuable feed and fuel ingredients. In addition, the Company provides grease trap services to food establishments, environmental services to food processors and sells restaurant cooking oil delivery and collection equipment. In fiscal 2014 , we generated $ 4.0 billion in revenues and $ 64.2 million in net income attributable to Darling.
On January 7, 2014, we acquired the VION Ingredients business division (“VION Ingredients”) of VION Holding, N.V., a Dutch limited
liability company (“VION”), by purchasing all of the shares of VION Ingredients International (Holding) B.V., and VION Ingredients Germany GmbH, and 60% of Best Hides GmbH (collectively, the "VION Companies"), pursuant to a Sale and Purchase Agreement dated October 5, 2013, as amended, between Darling and VION (the “VION Acquisition”), as described in Notes 1 and 2 to the Company’s Consolidated Financial Statements for the period ended January 3, 2015 included herein. The VION Ingredients business is now conducted under the name Darling Ingredients International. In addition, on October 28, 2013, we completed the acquisition of substantially all of the assets of Rothsay ("Rothsay"), a division of Maple Leaf Foods, Inc. ("MFI"), a Canadian corporation, pursuant to an Acquisition Agreement between MFI and Darling dated August 23, 2013 (the "Rothsay Acquisition"), as described in Notes 1 and 2 to the Company’s Consolidated Financial Statements for the period ended January 3, 2015 included herein. Prior to the VION Acquisition and the Rothsay Acquisition (together, the "Acquisitions"), the Company had no material foreign operations. As a result of the Acquisitions, the Company’s business is now conducted through a global network of over 200 locations across five continents.
North America
We are a leading provider of animal by-product processing, used cooking oil and bakery residual recycling and recovery solutions to the U.S. food industry. We operate over 120 processing and transfer facilities in the United States to produce finished products such as protein (primarily meat and bone meal ("MBM") and poultry meal ("PM")), fats (primarily bleachable fancy tallow ("BFT"), poultry grease ("PG") and yellow grease ("YG")), bakery by-products ("BBP") and hides, as well as a range of branded and value-added products. Darling sells these products in North America and throughout the world, primarily to producers of animal feed, pet food, biodiesel, fertilizer and other consumer and industrial ingredients, including oleo-chemicals, soaps and leather goods, for use as ingredients in their products or for further processing. Rothsay is a leading recycler of animal byproducts and producer of biodiesel in Canada. Rothsay processes raw materials into finished fats and proteins products for use in animal feed, pet food, biodiesel, fertilizer and other ingredients and manufactures biodiesel for domestic and international markets. Rothsay has a network of five rendering plants in Manitoba, Ontario and Nova Scotia and a biodiesel operation in Quebec.
Europe, China, Australia and South America
Darling Ingredients International is a worldwide leader in the development and production of specialty ingredients from animal by-products for applications in animal feed, pet food, fuel, bioenergy, fertilizer, food and pharmaceuticals. Darling Ingredients International operates a global network of 68 production facilities across five continents covering all aspects of animal by-product processing through six brands: Rendac (fuel), Sonac (proteins, fats, edible fats and blood products), Ecoson (bioenergy
Page 3

and fertilizer), Rousselot (gelatin), CTH (natural casings) and Best Hides (hides and skins). Darling Ingredients International’s specialized portfolio of over 400 products covers all animal origin raw material types and thereby offers a comprehensive, single source solution for suppliers. Darling Ingredients International’s business has leading positions across Europe with operations in the Netherlands, Belgium, Germany, Poland and Italy under the Rendac and Sonac brand names. Value-added products include edible fats, blood products, bone products, protein meals and fats. Rousselot is a global leading market provider of gelatin for the food, pharmaceutical and technical industries with operations in Europe, the United States, South America and China. CTH is a leading natural casings company for the sausage industry with operations in Europe, China and the United States.
Operating Segments Commencing with the first quarter of 2014, the Company's business operations were reorganized into three new reportable operating
segments: Feed Ingredients, Food Ingredients and Fuel Ingredients. This change was necessitated by the VION Acquisition and aligns the Company's operations based on the products and services offered to various end markets. All historical periods reported herein have been restated to conform to the new reportable operating segment structure; however, none of the Company’s historic operations fall within the Food Ingredients operating segment and therefore there is no comparable financial information for the Food Ingredients operating segment for prior periods.
The Feed Ingredients operating segment includes the Company's global activities related to (i) the collection and processing of beef,
poultry and pork animal by-products in North America and Europe into non-food grade oils and protein meals, (ii) the collection and processing of bakery residuals in North America into Cookie Meal®, which is predominantly used in poultry and swine rations, (iii) the collection and processing of used cooking oil in North America into non-food grade fats, as well as the production and sale of a variety of cooking oil collection delivery systems, (iv) the collection and processing of bovine, porcine and ovine blood in China, Europe and North America into blood plasma powder and hemoglobin, (v) the processing of cattle hides and hog skins in North American and Europe, (vi) the production of organic fertilizers using protein produced from the Company’s animal by-products processing activities in North America and Europe, and (vii) grease trap services to food service establishments and environmental services to food processors. Non-food grade oils and fats produced and marketed by the Company are principally sold to third parties to be used as ingredients in animal feed and pet food, as an ingredient for the production of biodiesel and renewable diesel, or to the oleo-chemical industry to be used as an ingredient in a wide variety of industrial applications. Protein meals produced and marketed by the Company are sold to third parties to be used as ingredients in animal feed, pet food and aquaculture. Blood plasma powder and hemoglobin produced and marketed by the Company are sold to third parties to be used as ingredients in animal feed, pet food and aquaculture.
The Food Ingredients operating segment includes the Company's global activities related to (i) the collection and processing of beef and
pork bone chips, beef hides, pig skins, and fish skins into gelatin and hydrolyzed collagen in Europe, China, South America and North America, (ii) collection and processing of porcine and bovine intestines into natural casings in Europe, China and North America, (iii) the extraction and processing of porcine mucosa into crude heparin in Europe, (iv) the collection and refining of animal fat into food grade fat in Europe, and (v) the processing of bones to bone chips for the gelatin industry and bone ash. Gelatins produced and marketed by the Company are sold to third parties to be used as ingredients in the pharmaceutical, nutriceutical, food, and technical (i.e, photographic) industries. Natural casings produced and marketed by the Company are sold to third parties to be used as an ingredient in the production of sausages and other similar food products.
The Fuel Ingredients operating segment includes the Company's global activities related to (i) the conversion of animal fats and recycled
greases into biodiesel in North America, (ii) the conversion of organic sludge and food waste into biogas in Europe, (iii) the collection and conversion of fallen stock and certain animal by-products pursuant to applicable E.U. regulations into low-grade energy sources to be used in industrial applications, (iv) commencing in the second quarter of 2014, the processing of manure into natural bio-phosphate in Europe, and (v) the Company’s share of the results of its equity investment in Diamond Green Diesel Holdings LLC, a joint venture with Valero Energy Corporation ("Valero") to convert animal fats, recycled greases, used cooking oil, inedible corn oil, soybean oil, or other feedstocks that become economically and commercially viable into renewable diesel (the “DGD Joint Venture”) as described in Note 7 to the Company's Consolidated Financial Statement for the period ended January 3, 2015 included herein.
For financial information about our operating segments and geographic areas, refer to Note 20 to the Company's Consolidated Financial
Statements for the period ended January 3, 2015 included herein. Fiscal 2014 Net External Sales Darling’s net external sales from fiscal 2014 continuing operations by operating segment, including 52 weeks of contribution from the
VION Companies in fiscal 2014 were as follows (in thousands):
Page 4

OPERATIONS
Feed Ingredients Segment
Our Feed Ingredients segment consists principally of (i) our U.S. ingredients business, including our used cooking oil, trap grease and food residuals collection businesses, the Rothsay ingredients business, and the ingredients and specialty products businesses conducted by Darling Ingredients International under the Sonac name (proteins, fats, technical fats and blood products) and (ii) our bakery by-products business. Animal By-Products North American Operations
Raw materials : The Company's North American animal by-products operations collect beef, poultry and pork by-products, which are collected primarily from slaughterhouses, grocery stores, butcher shops and food service establishments. These raw materials are collected in one of two manners. Certain large suppliers, such as large slaughterhouses, are furnished with bulk containers in which the raw material is loaded. We provide the remaining suppliers, primarily grocery stores and butcher shops, with containers in which to deposit the raw material. The containers are picked up by, or emptied into, the Company’s trucks on a periodic basis. The type and frequency of service is determined by individual supplier requirements, the volume of raw material generated by the supplier, supplier location and weather, among other factors. The raw materials we collect are transported either directly to a processing plant or to a transfer station where materials from several collection routes are loaded into trailers and transported to a processing plant. These raw materials are delivered to plants for processing usually within 24 hours of collection to deter spoilage.
In North America, we also collect used cooking oil from and service grease traps at restaurants, food service establishments and grocery
stores. Used cooking oil is heated, settled, and purified for use as an animal feed additive or is further processed into biodiesel. Products derived from used cooking oil include YG, biodiesel, and Fat for Fuel®, which uses grease as a fuel source for industrial boilers and dryers. Many of our customers operate stores that are part of national chains. Used cooking oil from food service establishments is placed in various sizes and types of containers that we supply. In some instances, these containers are unloaded directly onto our trucks, while in other instances used cooking oil is pumped through a vacuum hose into the truck. We sell two types of containers, called CleanStar® and B.O.S.S., for used cooking oil collection to food service establishments, both of which are proprietary self-contained collection systems that are housed either inside or outside the establishment, with the used cooking oil pumped directly into collection vehicles via an outside valve. The frequency of all forms of used cooking oil collection is determined by the volume of oil generated by the food service establishment. We either transport trap grease to waste treatment centers or recycle it at our facilities into a host of environmentally safe product streams. We provide our customers with a comprehensive set of solutions to their trap grease disposal needs, including manifests for regulatory compliance, computerized routing for consistent cleaning and comprehensive trap cleaning. The Company also collects non-hazardous liquid and semi-solid waste streams from the food processing industry and reprocesses and recycles these residuals, primarily by permitted land application to enrich soils in accordance with applicable environmental regulations.
Processing operations: We produce finished products primarily through the grinding, cooking, separating, drying, and blending of various
raw materials. The process starts with the collection of animal by-products, including fat, bones, feathers, offal and other animal by-products. The animal by-products are ground and heated to evaporate water and separate fats from animal tissue, as well as to sterilize and make the material suitable as an ingredient for animal feed. The separated fats, tallows and greases are then centrifuged and/or refined for purity. The remaining solid product is pressed to remove additional oils to create protein meals. The protein meal is then sifted through screens and ground further if necessary to produce an appropriately sized protein meal. The primary finished products derived from the processing of animal by-products are MBM, PM (both feed grade and pet food), PG, tallow, feather meal and blood meal. In addition, at certain of our facilities, we are able to operate multiple process lines simultaneously, which provides us with the flexibility and capacity to manufacture a line of premium and value-added products in addition to our principal finished products. Because of these processing controls, we are able to blend end
Page 5
Fiscal 2014
Fiscal 2013
Fiscal 2012
Continuing operations:
Feed Ingredients $ 2,421,462 61.2 % $ 1,788,563 99.2 % $ 1,766,611 99.7 %
Food Ingredients 1,248,352 31.6 — — — — Fuel Ingredients 286,629 7.2 13,705 0.8 5,941 0.3
Total $ 3,956,443 100.0 % $ 1,802,268 100.0 % $ 1,772,552 100.0 %

products together in order to produce premium products with specific mixes that typically have higher protein and energy content and lower moisture than standard finished products, and such products command premium prices. International Operations
Darling Ingredients International’s ingredients and specialty products businesses are operated under the Sonac name by our Sonac C3, Sonac Bone and Sonac Blood business activities. The Sonac ingredients and specialty products businesses of Darling Ingredients International operate similarly to our North American ingredients division. However, the Sonac businesses, with the exception of Sonac C3, further separate raw material streams to add additional value to each stream.
Bakery By-Products
The Company is a leading processor of bakery residuals in the United States. The bakery by-products division, which operates solely in the United States, collects bakery residual materials and processes the raw materials into BBP, including Cookie Meal®, an animal feed ingredient primarily used in poultry and swine rations.
Raw materials: Bakery by-products are collected from large commercial bakeries that produce a variety of products, including cookies, crackers, cereal, bread, dough, potato chips, pretzels, sweet goods and biscuits. The Company collects these materials by bulk loading onsite at the bakeries utilizing proprietary equipment, the majority of which is designed, engineered, manufactured and installed by us. All of the bakery residual that the Company collects is bulk loaded, which represents a significant advantage over competitors that receive a large percentage of raw materials from less efficient, manual methods. The receipt of bulk-loaded bakery residual allows us to significantly streamline our bakery recycling process, reduce personnel costs, and maximize freight savings by hauling more tons per load.
Processing operations: The highly automated bakery by-products production process involves sorting and separating raw material, mixing it to produce the appropriate nutritional content, drying it to reduce excess moisture, and grinding it to the consistency of animal feed. During the bakery residual process, packaging materials are removed. The packaging material is fed into a combustion chamber along with sawdust, and heat is produced. This heat is used in the dryers to remove moisture from the raw materials that have been partially ground. Finally, the dried meal is ground to the specified granularity. The finished product, which is continually tested to ensure that the caloric and nutrient contents meet specifications, is a nutritious additive used in animal feed. Other Products
Our Feed Ingredients segment also includes the Company’s hides businesses, including that operated under the BestHides name by Darling
Ingredients International, and the organic fertilizer business conducted under the Nature Safe® name.
Page 6
• Sonac C3 processes animal by-products collected primarily from slaughterhouses, into proteins and fats for applications used in the pet food, feed, technical, biofuels and oleo-chemical markets. Oleo-chemical producers use fats to produce specialty ingredients used in paint, rubber, paper, concrete, plastics and a variety of other consumer and industrial products.
• Sonac Bone processes porcine bones into fat, bone protein, glue, bone ash and bone chips for the feed, pet food, food and gelatin industries.
• Sonac Blood processes bovine, porcine and ovine blood by separating blood into plasma and hemoglobin and produces specialized end products for application in the feed and pet food markets. Sonac Blood’s end products include plasma, fibrimex, globin and hemin.
• Our hides operations process hides and skins from beef and hog processors, respectively, into outputs used in commercial applications, such as the leather industry. We sell treated hides and skins to external customers, the majority of which are tanneries. BestHides sources, sorts and processes hides from slaughterhouses, renderers and traders in Western Europe, and has a leading position in the premium South German hides market. Fresh and salted hides and fresh skins are sold to tanneries, automotive companies, leather processors and to the shoe and furniture industries in Italy, Germany and China.
• Our fertilizer operations utilize finished products from our animal by-products division to manufacture organic fertilizers from ingredients approved by the U.S. Department of Agriculture (“USDA”) that contain no waste

by-products (i.e., sludge or sewage waste). The Company's North American fertilizer products are predominantly sold to golf courses, sports facilities, organic farms and landscaping companies.
Food Ingredients Segment
Our Food Ingredients segment consists principally of (i) the gelatin business conducted by Darling Ingredients International under the
Rousselot name, (ii) the natural casings and meat by-products business conducted by Darling Ingredients International under the CTH name and (iii) certain specialty products businesses conducted by Darling Ingredients International under the Sonac name. Gelatin
Rousselot is a global leading market provider of gelatin and hydrolyzed collagen for the food, nutritional pharmaceutical and technical (photographic) industries with operations in Europe, China, South America and the United States. Rousselot has a network of 13 production plants and 7 sales locations, covering sales into more than 75 countries. With the Rousselot gelatin business, the Company is part of the growing global gelatin market. Gelatin is a functional ingredient, which means that it has a role in the end product by adding a critical property to it that is largely non-substitutable. Gelatin is used in a large variety of end products, but only small amounts are used in most products. Currently, available substitutes are limited and do not have the broad functionality required for most usages. Rousselot gelatin products have higher sales prices relative to the Company’s other end products, but comprise a minimal portion of the cost of final products in many segments, for example the pharmaceutical end markets. Many end customers focus on gelatin quality and consistency, supply reliability, application know-how and regulatory support and are therefore relatively less price sensitive to gelatin products. Rousselot’s profitability is mainly driven by its ability to timely transfer increases in net raw materials costs to its customers in order to realize a relatively stable added value per kilogram of gelatin, in combination with a strong focus on operations excellence and product quality. Rousselot is involved in all four types of gelatin (pigskin, hide, bone and fish). Raw material prices are mainly driven by the availability and quality of raw material, and sales prices are mainly driven by market demand and the expected availability of gelatin supply. As such, securing sufficient raw material positions is key to the business. Rousselot enters into formal arrangements related to raw material purchases that differ by raw material type, by duration and by regional area. Rousselot markets its hydrolyzed collagen under the “Peptan” brand; this fast-growing specialty ingredient is positioned specifically towards nutritional supplement customers focusing on improved bone, joint and skin health. Natural Casings and Meat By-Products
The CTH business of Darling Ingredients International is a leading natural casings company for the sausage business with operations in Europe, China and the United States. The activities of this business are divided into two categories:
Other Specialty Products
In addition, our Food Ingredients segment includes the heparin and edible fat businesses currently operated by Darling Ingredients International under the Sonac name:
Fuel Ingredients Segment
Our Fuel Ingredients segment consists of (i) our biofuel business conducted under the Dar Pro® and Rothsay names and (ii) the bioenergy
business conducted by Darling Ingredients International under the Ecoson and Rendac names.
Page 7
• CTH Casings harvests, sorts and sells hog and sheep casings for worldwide food markets, particularly sausage manufacturers, and harvests, processes and sells hog and beef bowel package items for global pharmaceutical, food and feed market segments. CTH holds a leading position in the highly fragmented global casings market.
• CTH Meat By-Products harvests, purchases and processes hog, sheep and beef meat by-products for customers in the global food and European pet food industries. In the meat by-products market, CTH is a major player with established sales networks in Europe and Asia.
• Sonac Heparin extracts crude heparin from hydrolyzed mucosa for application in the pharmaceutical industry.
• Sonac Fat primarily melts, refines and packages animal fat into food grade fat for the food markets.
Biofuel
We produce biodiesel at our facilities in the United States and Canada. In the United States, we use a portion of our rendered animal fats and recycled greases, as well as third-party additives, to produce Bio G-3000™ Premium Diesel Fuel. We have the annual capacity to produce two million gallons of Bio G-3000™ at our facility in Butler, Kentucky. Our facility in Sainte-Catherine, Quebec also processes tallow and recycled oils produced by us into biodiesel. The Quebec facility, which was acquired in the Rothsay Acquisition, has a current annual capacity to produce approximately 14 million gallons a year. Our biodiesel product is sold to our internal divisions, as well as to commercial biodiesel producers in the United States and Canada, to be used as biodiesel fuel, a clean burning additive for diesel fuel, or as a biodegradable solvent or cleaning agent. Bioenergy
In Europe, Ecoson produces green power from biogas production out of organic sludge and food waste for combined heat plant installations. Ecoson is the largest industrial digestion operation in The Netherlands, with an output matching the annual use of energy needs of approximately 10,000 households. In addition Ecoson's fat refinery produces refined fats and fatty acids. In fiscal 2014, Ecoson commenced the processing of manure into natural biophosphate for use as fertilizer and green gas.
Rendac collects fallen stock and animal waste, also referred to as Category 1 and Category 2 material under applicable E.U. regulations,
from farmers and slaughterhouses, and processes these materials into fats and meals, which can only be used as a low grade source of energy or fuel for boilers and cement kilns. With a specialized collection fleet of approximately 300 trucks, Rendac collects raw materials in the Netherlands, Germany, Poland and Belgium. This business is a market leader in the countries of Belgium, Netherlands and Luxembourg (the "Benelux region"), a regulated market with spare capacity requirements and long-term contracts with local governments.
Diamond Green Diesel
The DGD Joint Venture commenced operations in June 2013. The DGD Joint Venture operates a renewable diesel plant (the "DGD Facility") located in Norco, Louisiana capable of producing approximately 11,000 barrels per day of input feedstock to produce renewable diesel fuel and certain other co-products. We account for the DGD Joint Venture as an "investment in unconsolidated subsidiary." The DGD Joint Venture operates the DGD Facility, which converts animal fats, recycled greases and used cooking oil, which are supplied in part by us, and other feedstocks that become economically and commercially viable, such as inedible corn oil and soybean oil, into renewable diesel. The DGD Facility uses an advanced hydroprocessing-isomerization process licensed from UOP LLC, known as the Ecofining™ Process, and a pretreatment process developed by the Desmet Ballestra Group designed to convert approximately 1.1 billion pounds per year of feedstocks, into renewable diesel and certain other co-products. The Diamond Green Diesel renewable diesel product is sold to refiners under the Diamond Green Diesel® name to be blended with diesel fuel and is interchangeable with diesel produced from petroleum. Biodiesel blenders registered with the Internal Revenue Service were eligible for a tax incentive in the amount of $ 1.00 per gallon of renewable diesel blended with petroleum diesel to produce a mixture containing 0.1% diesel fuel. As a blender, the DGD Joint Venture has recorded approximately $ 126.0 million of blenders tax credits in the fourth quarter of fiscal 2014.
Raw materials pricing and supply contracts
We have two primary pricing arrangements-formula and non-formula arrangements-with our suppliers of poultry, beef, pork, bakery
residuals and used cooking oil. Under a "formula" arrangement, the charge or credit for raw materials is tied to published finished product prices for a competing ingredient after deducting a fixed processing fee. We also acquire raw material under "non-formula" arrangements whereby suppliers are either paid a fixed price, are not paid, or are charged a collection fee, depending on various economic and competitive factors. The credit received or amount charged for raw materials under both formula and non-formula arrangements is based on various factors, including the type of raw materials, demand for the raw materials, the expected value of the finished product to be produced, the anticipated yields, the volume of material generated by the supplier and processing and transportation costs. Formula prices are generally adjusted on a weekly, monthly or quarterly basis, while non-formula prices or charges are adjusted as needed to respond to changes in finished product prices or related operating costs. Since most of our raw materials are residual by-products of meat processing and other food production, we are not able to contract with our suppliers to increase supply if demand for our products increases.
A majority of our U.S. North American volume of rendering raw materials, including all of our significant poultry accounts, and
substantially all of our bakery feed raw materials are acquired on a “formula basis,” which in most cases is set forth in contracts with our suppliers, generally with multi-year terms. These “formulas” allow us to manage the risk associated with decreases in commodity prices by adjusting our costs of materials based on changes in the price of our finished products, while also permitting us, in certain cases, to benefit from increases in commodity prices. The formulas provided in these contracts are reviewed and
Page 8

modified both during the term of, and in connection with the renewal of, the contracts to maintain an acceptable level of sharing between us and our suppliers of the costs and benefits from movements in commodity prices. A majority of Rothsay’s North American volume of rendering raw materials are acquired based on prices fixed on a quarterly basis with suppliers, with the remaining portion acquired on a “formula basis.” Darling Ingredients International (including North American operations) acquires a majority of its volume of rendering raw materials at spot or quarterly fixed prices. Although Darling Ingredients International, in general, has no long term contracts with its key suppliers, it has procured a series of four-year supply agreements with VION’s foods division (“VION Food”) that became effective on closing of the VION Acquisition and provided approximately 13% of Darling Ingredients International’s raw material supply (based on raw materials procured in fiscal 2014). Approximately 82% of Darling's U.S. North American volume of raw materials in fiscal 2014 was acquired on a "formula" basis.
Certain of the Company's geographic regions facilities are highly dependent on one or a few suppliers. During the 2014 fiscal year, the
Company's 10 largest raw materials suppliers in North America accounted for approximately 25% of the total raw material processed by the Company in North America, with one single supplier accounting for approximately 5% of the total raw material processed in North America. In Europe, the Company's 10 largest raw material suppliers accounted for approximately 35% of the total raw material processed by the Company in Europe, with one single supplier accounting for approximately 15% of the total raw material processed in Europe. In China, the Company's 10 largest raw material suppliers accounted for approximately 23% of the total raw material processed by the Company in China, with one single supplier accounting for approximately 3% of the total raw material processed in China. In South America, the Company's 10 largest raw material suppliers accounted for approximately 57% of the total raw material processed by the Company in South America, with one single supplier accounting for approximately 11% of the total raw material processed in South America. See "Risk Factors - A significant percentage of our revenue is attributable to a limited number of suppliers and customers." Should any of these suppliers choose alternate methods of disposal, cease or materially decrease their operations, have their operations interrupted by casualty, or otherwise cease using, or reduce the use of, the Company’s collection services, any operating facilities dependent on such suppliers could be materially and adversely affected. (See "Risk factors-Certain of our operating facilities are highly dependent upon a single or a few suppliers.") For a discussion of the Company’s competition for raw materials, see "Competition."
MARKETING, SALES AND DISTRIBUTION OF FINISHED PRODU CTS
The Company sells its finished products worldwide. Finished product sales are primarily managed through our commodity trading departments. With respect to our North American operations, we have trading departments located at our corporate headquarters in Irving, Texas for fats, and at our office in Cold Spring, Kentucky for proteins. We also maintain sales offices in Des Moines, Iowa, New Orleans, Louisiana, and Memphis, Tennessee for the sale and distribution of selected products. Darling Ingredients International’s finished product sales are managed primarily through trading departments that are located in Son en Breugel, the Netherlands, and through various offices located in Europe, Asia, South America and North America. Where appropriate, we coordinate international sales of common products in order to market them more efficiently. Our sales force is in contact with customers daily and coordinates the sale, and assists in the distribution of, most finished products produced at our processing plants. The Company also sells its finished products internationally through commodities brokers and our agents and directly to customers in various countries. We market certain of our finished products under our Dar Pro Solutions® brand, certain specialty products under the Sonac name, gelatin products under the Rousselot name, natural casings and meat by-products under the CTH name and hides under the BestHides name. See Note 20 of Notes to Consolidated Financial Statements for a breakdown of the Company’s sales by geographic regions.
The Company sells finished products in North America and throughout the world, primarily to producers of animal feed, pet food, biodiesel, fertilizer and other consumer and industrial products, including oleo-chemicals, soaps and leather goods, for use as ingredients in their products or for further processing. Certain of our finished products are ingredients that compete with alternatives, such as corn, soybean oil, inedible corn oil, palm oils, soybean meal and heating oil, based on nutritional and functional values; therefore, the actual pricing for those finished products, as well a competing products, can be quite volatile. While the Company's principal finished products are generally sold at prices prevailing at the time of sale, the Company's ability to deliver large quantities of finished products from multiple locations and to coordinate sales from a central location enables us to occasionally receive a premium over the then-prevailing market price. The Company's premium, value-added and branded products command significantly higher pricing relative to the Company's principal finished product lines due to their enhanced nutritional content, which is a function of the Company's specialized processing techniques. Customers for our premium, value-added and branded products include feed mills, pet food manufacturers, integrated poultry producers, the dairy industry and golf courses. Feed mills purchase meals, greases, tallows, and Cookie Meal® for use as feed ingredients. Pet food manufacturers require stringent feed safety certifications and consistently demand premium additives that are high in protein and nutritional content. As a result, pet food manufacturers typically purchase only premium or value-added products under supply contracts with us. Oleo-chemical producers use fats as feedstocks to produce specialty ingredients used in paint, rubber, paper, concrete, plastics and a variety of other consumer and industrial products. Darling Ingredients International’s premium, value-added and branded products also
Page 9

command higher pricing, including with respect to gelatin, natural casings, meat by-products, edible fat, heparin and specialty blood products.
We obtain payment protection for most of our global export sales by requiring payment before shipment, either through bank letters of
credit or cash against documents at the origin of the sale or guarantees of payment from government agencies. For U.S. sales, we are ordinarily paid for products in U.S. dollars and have not experienced any material currency translation losses or any material foreign exchange control difficulties. Darling Ingredients International’s product sales are generally denominated in the local currency. However, in certain markets (such as South America), some product sales are denominated in non-functional currencies, such as U.S. dollars and euros. Historically, Darling Ingredients International hedged non-functional currency product sales, which we have continued post-closing.
Our management monitors market conditions and prices for our finished products on a daily basis. If market conditions or prices were to
significantly change, our management would evaluate and implement any measures that it may deem necessary to respond to the change in market conditions. For larger formula-based pricing suppliers, the indexing of raw material cost to finished product prices effectively establishes the gross margin on finished product sales at a stable level, providing us some protection from finished product price declines.
Finished products produced by the Company are shipped primarily by truck or rail from our plants shortly following production. While there can be some temporary inventory accumulations at various North American and international locations, particularly port locations for export shipments, with the exception of gelatin and natural casings, inventories rarely exceed three weeks’ production and, therefore, we use limited working capital to carry those inventories. Our limited inventories also reduce our exposure to fluctuations in finished-product prices. With respect to gelatin and natural casings, Darling Ingredients International, in contrast, has historically carried much larger inventories due to the manufacturing process and market dynamics related to those products, which requires a greater amount of working capital to carry these investments. Other factors that influence competition, markets and the prices that we receive for our finished products include the quality of our finished products, consumer health consciousness, worldwide credit conditions and government aid and regulations. From time to time, we enter into arrangements with our suppliers of raw materials pursuant to which these suppliers have the option to buy back our finished products at market prices.
The Company operates a fleet of trucks, trailers and railcars to transport raw materials from suppliers and finished products to customers or
ports for transportation by ship. It also utilizes third party freight to cost-effectively transfer materials and augment our in-house logistics fleet. Within our bakery by-products division, substantially all inbound and outbound freight is handled by third party logistics companies.
COMPETITION
We believe we are the only global ingredients company with products generated principally from animal-origin raw material types; however, we compete with a number of regional and local players in our various sub-segments and end markets.
The procurement of raw materials currently presents greater challenges to our business than the sale of finished products. In North America, consolidation within the meat processing industry has resulted in bigger and more efficient slaughtering operations, the majority of which utilize "captive" renderers (rendering operations integrated with the meat or poultry packing operation). At the same time, the number of small meat processors, which have historically been a dependable source of supply for non-captive renderers, such as us, has decreased significantly. In addition, the slaughter rates in the meat processing industry are subject to economic conditions and, as a result, during periods of economic decline, the availability, quantity and quality of raw materials available to the independent renderers decreases. These factors have been offset, in part, however, by increasing environmental consciousness. The need for food service establishments in the United States to comply with environmental regulations concerning the proper disposal of used restaurant cooking oil should continue to provide a growth area for this raw material source. The rendering industry is highly fragmented with a number of local slaughtering operations that provide us with raw materials. In North America, we compete with other rendering, restaurant services and bakery residual businesses, and alternative methods of disposal of animal processing by-products and used restaurant cooking oil provided by trash haulers, waste management companies and biodiesel companies and others. In addition, U.S. food service establishments have increasingly experienced theft of used cooking oil. A number of our competitors for the procurement of raw material are experienced, well-capitalized companies that have significant operating experience and historic supplier relationships. Competition for available raw materials is based primarily on price and proximity to the supplier.
In marketing our finished products domestically and internationally, we face competition from other processors and from producers of other suitable ingredient alternatives. However, we differentiate ourselves through the scope and depth of our product portfolio and geographic footprint. While we compete with a number of well capitalized companies across our business, such as
Page 10
Cargill, Inc., Tyson Foods, Inc. and Swift & Company in the U.S. products business, and others in the global gelatin, bone products, and blood products business, we do not have a single competitor that we compete with across all of our products or geographies.
SEASONALITY
Although the amount of raw materials made available to us in each of our segments by our suppliers is relatively stable on a weekly basis, it is impacted by seasonal factors, including holidays, during which the availability of raw materials declines because major meat and poultry processors are not operating, and cold and other severe weather, which can hinder the collection of raw materials. Warm weather can also adversely affect the quality of raw materials processed and our yields on production because raw material deteriorates more rapidly in warm weather than in cooler weather. Weather can vary significantly from one year to the next and may impact the comparability of our operating results between periods. The amount of bakery residuals we process generally increases during the summer from June to September. Gelatin sales generally decline in the summer.
INTELLECTUAL PROPERTY
The Company maintains valuable trademarks, service marks, copyrights, trade names, trade secrets, proprietary technologies and similar intellectual property, and considers our intellectual property to be of material value. We have registered or applied for registration of certain of our intellectual property, including the tricolor triangle used in our signage and logos and the names "Darling," "Darling Ingredients", "Griffin Industries," "Dar Pro Solutions," "Dar Pro," "Rousselot," "Sonac," "Ecoson," "Rendac," "CTH," "BestHides," "Rothsay," "Rothsay Diesel," "Nature Safe," "CleanStar," "Peptan," "Cookie Meal," and "Bakery Feeds," and certain patents, both domestically and internationally, relating to the process for preparing nutritional supplements and the drying and processing of raw materials.
EMPLOYEES AND LABOR RELATIONS
As of January 3, 2015 , the Company employed globally approximately 10,000 persons full-time. While we have no national or multi-plant union contracts, at January 3, 2015 , approximately 25% of the Company's North American employees were covered by multiple collective bargaining agreements. In addition, approximately 36% of Darling Ingredients International's employees are covered by various collective bargaining agreements. Management believes that our relations with our employees and their representatives are satisfactory. There can be no assurance, however, that these satisfactory arrangements will continue, or that new agreements will be reached without union action or on terms satisfactory to us.
REGULATIONS
We are subject to the rules and regulations of various federal, state, local and foreign governmental agencies including the following
principal governmental agencies in the following countries:
United States
- Animal and Plant Health Inspection Service ("APHIS") certifies facilities and claims made for exported materials to meet importing country requirements and establishes and enforces import requirements for live animals and animal by-products as well as plant products, and
Page 11
• The Food and Drug Administration ("FDA"), which regulates pharmaceutical products and food and feed safety. Effective August 1997, the FDA promulgated a rule prohibiting the use of mammalian proteins, with some exceptions, in feeds for cattle, sheep and other ruminant animals (21 C.F.R. 589.2000, referred to herein as the "BSE Feed Rule") to prevent further spread of bovine spongiform encephalopathy, which is commonly referred to as "mad cow" disease ("BSE"). With respect to BSE in the United States, on October 26, 2009, the FDA began enforcing new regulations intended to further reduce the risk of spreading BSE (the "Enhanced BSE Rule"). These new regulations included amending the BSE Feed Rule to prohibit the use of tallow having more than 0.15% insoluble impurities in feed for cattle or other ruminant animals. In addition, the FDA implemented rules that prohibit the use of brain and spinal cord material from cattle aged 30 months and older or the carcasses of such cattle, if the brain and spinal cord are not removed, in the feed or food for all animals. Management believes we are in compliance with the provisions of these rules. See Item 1A "Risk Factors - Our business may be affected by the impact of BSE and other food safety issues," for more information regarding certain FDA rules that affect our business, including changes to the BSE Feed Rule.
• The United States Department of Agriculture ("USDA"), which regulates our collection and production methods. Within the USDA, two agencies exercise direct regulatory oversight of our activities:

- Food Safety Inspection Service ("FSIS") regulates sanitation of our facilities and our food safety programs, among other things.
On December 30, 2003, the Secretary of Agriculture announced new beef slaughter/meat processing regulations to assure consumers of the safety of the meat supply. These regulations prohibit non-ambulatory animals from entering the food chain, require removal of specified risk materials at slaughter and prohibit carcasses from cattle tested for BSE from entering the food chain until the animals are shown negative for BSE.
On November 19, 2007, APHIS implemented revised import regulations that allowed Canadian cattle over 30 months of age and born after March 1, 1999, and bovine products derived from such cattle to be imported into the United States for any use. Imports of Canadian cattle younger than 30 months of age have been allowed since March 2005. Imports of specialized risk material ("SRM") from Canadian born cattle slaughtered in Canada are not permitted. On March 4, 2014, APHIS implemented new import regulations for all countries to establish a system for classifying regions as to BSE risk that is consistent with international standards set by the World Organization for Animal Health ("OIE"), and to base importation requirements for cattle and beef products on: (i) the inherent risk of BSE infectivity in the commodity to be imported and (ii) the BSE risk status of the region from which the commodity originates.
European Union and the United Kingdom
Page 12
• The U.S. Environmental Protection Agency ("EPA"), which regulates air and water discharge requirements, as well as local and state environmental agencies governing air and water discharge.
• State Departments of Agriculture , which regulate animal by-product collection and transportation procedures and animal feed quality.
• The United States Department of Transportation ("USDOT"), as well as local and state transportation agencies, which regulate the operation of our commercial vehicles.
• The U.S. Occupational Safety and Health Administration ("OSHA"), which is the main federal agency charged with the enforcement of worker safety and health legislation.
• The Securities and Exchange Commission ("SEC"), which regulates securities and information required in annual, quarterly and other reports filed by publicly traded companies.
• The European Commission, Directorate-General for Health and Consumers , which addresses regulations for food, feed, human and animal health, technical uses of animal by-products and packaging.
• The European Medicines Agency , which establishes guidance for pharmaceutical products, bovine products and metal residues.
• The European Directorate for the Quality for Medicine , which certifies pharmaceutical products.
• The European Pharmacopeia , which establishes requirements for pharmaceutical products.
• The European Chemical Agency , which is responsible for the implementation of the European Council's Regulation on the Registration, Evaluation, Authorisation and Restriction of Chemicals.
• The European Commission, Directorate-General for the Environment , which establishes regulations on pollution and waste, such as the Directives on Industrial Emissions, Integrated Pollution Prevention and Control and Best Available Techniques Reference Document on the Slaughterhouses and Animal By-products Industries.
• European Union Member States must ensure adequate control and supervision of principles set forth in numerous EU Directives, such as minimum safety and health requirements for the workplace and use of work equipment by workers. EU Member States are allowed to maintain or establish more stringent measures in their own legislation. In general, each EU Member State’s ministry of labor affairs is responsible for regulating health and safety at work and labor inspection services and is in charge of controlling compliance with applicable legislation and regulations.
Canada
China
Brazil
Argentina
Page 13
• The Dutch Food Safety Authority (Nederlandse Voedsel- en Warenautoriteit) , which issues permits, approvals and registrations to establishments or plants engaged in certain activities related to the handling of animal by-products and food and feed production.
• The Belgian Federal Food Safety Agency (Federal Agentschap voor de Veiligheid van de Voedselketen) , which issues permits, approvals and registrations to establishments or plants engaged in certain activities related to the handling of animal by-products and food and feed production.
• The Public Flemish Waste Agency (Openbare Vlaamse Afvalstoffenmaatschappij) , which issues permits, approvals and registrations to establishments or plants carrying out certain activities related to the handling of animal by-products.
• The German Competent Authorities at Länder level , which issue permits, approvals and registrations to establishments or plants carrying out certain activities related to the handling of animal by-products and food and feed production.
• The United Kingdom’s Health and Safety Executive is the government body responsible for enforcing health and safety at work legislation, such as the Health and Safety at Work Act 1974 , and enforcing health and safety law in industrial workplaces, together with local authorities.
• The United Kingdom’s Food Standards Agency issues permits, approvals and registrations to plants carrying out certain activities related to the handling of animal by-products.
• The Canadian Food Inspection Agency ("CFIA"), which regulates animal health and the disposal of animals and their products or by-products.
• Canadian provincial ministries of agriculture , which regulate food safety and quality, air and water discharge requirements and the disposal of deadstock.
• The Canadian Department of the Environment ("Environment Canada"), which ensures compliance with Canadian federal air and water discharge and wildlife management requirements.
• The Canadian Technical Standards and Safety Authority ("TSSA"), a non-profit organization that regulates the safety of fuels and pressure vessels and boilers.
• The General Administration of Quality Supervision, Inspection and Quarantine , which supervises the import and export of food and feed.
• The Ministry of Health of the People’s Republic of China , which establishes standards for food and pharmaceutical products.
• The Chinese Pharmacopeia , which establishes standards for pharmaceutical products.
• The Ministry of Agriculture, Cattle and Supply (Ministério da Agricultura, Pecuária e Abastecimento) , which regulates the production of gelatin.
• The National Department for Food Safety and Quality (Servicio Nacional de Sanidad y Calidad Agroalimentaria) , which regulates the production of gelatin.
• The National Department of Animal Health (Servicio Nacional de Sanidad Animal) , which at the local level is equivalent to the FDA in Argentina.

Australia
Rules and regulations promulgated by these and other agencies may influence our operating results at one or more facilities.
AVAILABLE INFORMATION
Under the Securities Exchange Act of 1934, the Company is required to file annual, quarterly and special reports, proxy statements and other information with the SEC, which can be read and/or copies made at the SEC's Public Reference Room at 100 F Street N.E., Washington D.C. 20549. Please call the SEC at 1-800-SEC-0330 for further information about the Public Reference Room. The SEC maintains a web site at http://www.sec.gov that contains reports, proxy and information statements, and other information regarding issuers that file electronically with the SEC. The Company files electronically with the SEC.
We make available, free of charge, through our investor relations web site, our reports on Forms 10-K, 10-Q and 8-K, and amendments to
those reports, as well as all other filings with the SEC, as soon as reasonably practicable after such materials are electronically filed with, or
furnished to, the SEC pursuant to Section 13(a) or 15(d) of the Exchange Act. The Company's website is http://www.darlingii.com and the address for the Company's investor relations web site is
http://ir.darlingii.com . Information contained on these websites is not and should not be deemed to be a part of this report or any filing filed with, or furnished to, the SEC by us. ITEM 1A. RISK FACTORS
An investment in Darling involves substantial risks. In consultation with your financial, tax and legal advisors, you should carefully consider, among other matters, the following risks in, as well as the other information contained in or incorporated by reference into, this report. If any of the events described in the following risk factors actually occur, our business, financial condition, prospects or results of operations could be materially adversely affected, the market price of our common stock could decline and you may lose all or part of your investment in the common stock. The risks and uncertainties described below are not the only risks we face. Additional risks and uncertainties that are not currently known or that are currently deemed to be immaterial may also materially and adversely affect our business operations and financial condition or the market price of our common stock. The risks described below also include forward-looking statements and our actual results may differ substantially from those discussed in these forward-looking statements. See the section entitled “Forward-Looking Statements” in this filing.
Risks Related to the Company
The prices of many of our products are subject to significant volatility associated with commodities markets.
Our principal finished products include MBM, BFT, YG and hides, which are commodities. We also manufacture and sell a number of other products that are derived from animal by-products and many of which are commodities or compete with
Page 14
• The Australian Quarantine and Inspection Service , which regulates the import and export of agricultural products, including animal by-products.
• The Department of Agriculture, Fisheries and Forestry , which administers meat and animal by-product legislation.
• PrimeSafe , which is the principal regulator of meat and animal by-product businesses in the State of Victoria.
• The Australian Competition and Consumer Commission , which regulates Australia’s competition and consumer protection law.
• The Australian Securities and Investments Commission , which regulates Australia’s company and financial services laws.
• Worksafe Victoria , which is the regulator responsible for administering and enforcing occupational health and safety laws and regulations in the State of Victoria.
• Environment Protection Authority Victoria , which administers environmental protection laws in Victoria.
• Goulburn-Murray Rural Water Corporation , which manages allocation and use of water under local water laws in Victoria.

commodities. The prices of these commodities are quoted on, or derived from prices quoted on, established commodity markets. Accordingly, our results of operations will be affected by fluctuations in the prevailing market prices of these finished products or of other commodities that may be substituted for our products by our customers. Historically, market prices for commodity grains, fats and food stocks have fluctuated in response to a number of factors, including global changes in supply and demand resulting from changes in local and global economic conditions, changes in global government agriculture programs, changes in energy policies of U.S. and foreign governments, changes in international agricultural trading policies, impact of disease outbreaks on protein sources and the potential effect on supply and demand, as well as weather conditions during the growing and harvesting seasons. While we seek to mitigate the risks associated with price declines, including by diversifying our finished products offerings, through the use of formula pricing tied to commodity prices for a substantial portion of our raw materials (which may not protect our margins in periods of rapidly declining prices) and hedging, a significant decrease in the market price of any of our products or of other commodities that may be substituted for our products would have a material adverse effect on our results of operations and cash flow. Furthermore, rapid and material changes in finished goods prices, including competing agricultural-based alternative ingredients, generally have an immediate and, often times, material impact on the Company’s gross margin and profitability resulting from the lag effect or lapse of time from the procurement of the raw materials until they are processed and the finished goods are sold.
The prices available for the Company’s Food Ingredients segment gelatin and natural casings products are influenced by other competing ingredients, including plant-based and synthetic hydrocolloids and artificial casings. In the gelatin operation, in particular, the cost of the Company's animal-based raw material moves in relationship to the selling price of the finished goods. The processing time for gelatin and casings is generally 30 to 60 days, which is substantially longer than the Company's animal by-products operations. Consequently, the Company’s gross margin and profitability in this segment can be influenced by the movement of finished goods prices from the time the raw materials were procured until the finished goods are sold.
In addition, increases in the market prices of raw materials would require us to raise prices for our premium, value-added and branded
products to avoid margin deterioration. There can be no assurance as to whether we could implement future price increases in response to increases in the market prices of raw materials or how any such price increases would affect future sales volumes to our customers. Our results of operations could be materially and adversely affected in the future by this volatility. Our business is dependent on the procurement of raw materials, which is the most competitive aspect of our business.
Our management believes that the most competitive aspect of our business is the procurement of raw materials rather than the sale of finished products. Many of our raw materials are derived directly or indirectly from animal by-products, which results in the following challenges:
Page 15
• In North America, consolidation within the meat processing industry has resulted in bigger and more efficient slaughtering operations, the majority of which utilize "captive" renderers (rendering operations integrated with the meat or poultry packing operation).
• Concurrently, the number of small U.S. meat processors, which have historically been a dependable source of supply for non-captive U.S. renderers, such as us, has decreased significantly.
• The slaughter rates in the meat processing industry are subject to decline during poor economic conditions when consumers generally reduce their consumption of protein, and as a result, during such periods of decline, the availability, quantity and quality of raw materials available to the independent renderers, such as us, decreases.
• In addition, the Company has seen an increase in the use of used cooking oil in the production of biodiesel, which has increased competition for the collection of used cooking oil from restaurants and other food service establishments and contributed to an increase in the frequency and magnitude of theft of used cooking oil in the United States.
• Furthermore, a decline in the general performance of the global economy (including a decline in consumer confidence) and any inability of consumers and companies to obtain credit in the financial markets could have a negative impact on our raw material volume, such as through the forced closure of any of our raw material suppliers. A significant decrease in available raw materials or a closure of a significant number of raw material suppliers could materially and adversely affect our business, results of operations and financial condition, including the carrying value of certain of our assets.

The rendering industry is highly fragmented and both the rendering and bakery residual industries are very competitive. We compete with
other rendering businesses and alternative methods of disposal of animal by-products, bakery residue and used cooking oil provided by trash haulers, waste management companies and biodiesel companies, as well as the alternative of illegal disposal. See Item 1. “ Competition. ” In addition, U.S. restaurants experience theft of used cooking oil, the frequency and magnitude of which has increased with the rise in value of used cooking oil. Depending on market conditions, we either charge a collection fee to offset a portion of the cost incurred in collecting raw material or will pay for the raw material. To the extent suppliers of raw materials look to alternate methods of disposal, whether as a result of our collection fees being deemed too expensive, the payments we offer being deemed too low or otherwise, our raw material supply will decrease and our collection fee revenues will decrease, which could materially and adversely affect our business, results of operations and financial condition.
A majority of the Company's U.S. volume of animal by-product raw materials, including all of its significant U.S. poultry accounts, and
substantially all of the Company's U.S. bakery feed raw materials, are acquired on a “formula basis,” which in most cases is set forth in contracts with our suppliers, generally with multi-year terms. These “formulas” allow us to mitigate the risks associated with decreases in commodity prices by adjusting our costs of materials based on changes in the price of our finished products, while also permitting us, in certain cases, to benefit from increases in commodity prices. The formulas provided in these contracts are reviewed and modified both during the term of, and in connection with the renewal of, the contracts to maintain an acceptable level of sharing between us and our suppliers of the costs and benefits from movements in commodity prices. Changes to these formulas or the inability to renew such contracts could have a material adverse effect on our business, results of operations and financial condition. A majority of Rothsay’s animal by-product raw materials are acquired based on prices fixed on a quarterly basis with suppliers, with the remaining portion acquired on a “formula basis.” A majority of Darling Ingredients International’s volume of animal by-product raw materials is acquired at spot or quarterly fixed prices. Although Darling Ingredients International, in general, has no long term contracts with its key suppliers, it has procured a series of four-year supply agreements with VION Food that became effective concurrently with the completion of the VION Acquisition and are expected to provide approximately 13% of Darling Ingredients International’s raw material supply (based on raw materials procured in fiscal 2014). Our business may be adversely impacted by fluctuations in exchange rates, which could affect our ability to comply with our financial covenants.
Our international operations have expanded significantly and our exposure to fluctuations in currency exchange rates has increased
accordingly. We now carry out transactions in a number of foreign currencies, principally the euro, the Canadian dollar, the Chinese renminbi, the Brazilian real, the British pound, the Japanese yen, the Argentine peso and the Australian dollar. To the extent possible, we attempt to match revenues and expenses in each of the currencies in which we operate. However, we will still be exposed to currency fluctuations when we translate the results of our overseas operations into U.S. dollars, our functional currency, in the preparation of our consolidated financial statements. The exchange rates between these currencies and the U.S. dollar may fluctuate and these fluctuations may affect our U.S. dollar-denominated results of operations and financial condition even if our underlying operations and financial condition, in local currency terms, remain unchanged. While we may from time to time enter into the use of currency hedging instruments to provide us with protection from adverse fluctuations in currency exchange rates, there can be no assurance that such instruments will successfully protect us from more pronounced swings in such exchange rates. Further, by utilizing these instruments we potentially forego the benefits that might result from favorable fluctuations in currency exchange rates.
We also face risks arising from the possible future imposition of exchange controls and currency devaluations. Exchange controls may
limit our ability to convert foreign currencies into U.S. dollars or to remit dividends and other payments by our foreign subsidiaries located in, or business conducted within, a country imposing such controls. Currency devaluations would result in a diminished value of funds denominated in the currency of the country instituting the devaluation.
Any fluctuations in exchange rates or the imposition of exchange controls or currency devaluation may adversely impact our ability to
comply with the financial and other covenants under the documents governing our indebtedness, which could affect our ability to incur indebtedness, pay dividends, make investments or take other actions that might be in our best interest. Should our international operations continue to expand, they will represent a larger part of our business and such exchange rate fluctuations may have a greater impact on our business, financial condition and results of operations. We are highly dependent on natural gas and diesel fuel, the price of which can be volatile, and such dependency could materially adversely affect our business.
Our operations are highly dependent on the use of natural gas and diesel fuel. We consume significant volumes of natural gas to operate boilers in our plants, which generate steam to heat raw materials. Natural gas prices represent a significant cost of facility operations included in cost of sales. We also consume significant volumes of diesel fuel to operate our fleet of tractors and trucks used to collect raw materials. Diesel fuel prices represent a significant component of cost of collection expenses included
Page 16

in cost of sales. Prices for both natural gas and diesel fuel can be volatile and therefore represent an ongoing challenge to our operating results. Although we continually manage these costs and hedge our exposure to changes in fuel prices through our formula pricing and from time to time derivatives, a material increase in prices for natural gas and/or diesel fuel over a sustained period of time could materially adversely affect our business, results of operations and financial condition.
A significant percentage of our revenue is attributable to a limited number of suppliers and customers.
In fiscal 2014, the Company's top ten customers for finished products accounted for approximately 19% of product sales. In addition, the
Company's top ten raw material suppliers accounted for approximately 21% of its raw material supply in the same period. VION Food, Darling Ingredients International’s largest raw materials supplier, accounted for approximately 13% of Darling Ingredients International’s raw materials supply in fiscal 2014. Darling Ingredients International has entered into supply agreements with VION Food pursuant to which VION Foods supplies Darling Ingredients International with by-products generated by VION Food’s operations. The supply agreements all have a term of four years and became effective concurrently with the completion of the VION Acquisition. MFI, Rothsay’s largest raw materials supplier, accounted for approximately 24% of Rothsay’s raw materials supply in fiscal 2014. In connection with the Rothsay Acquisition, we entered into a seven-year supply agreement with MFI to supply us with substantially all of the MFI raw materials processed by Rothsay prior to the sale.
Disruptions or modifications to, or termination of, our relationships with any of our significant suppliers or customers, or financial
difficulties experienced by any of our suppliers or customers that lead to curtailment or termination of their operations, could cause our businesses to suffer significant financial losses and could have a material adverse impact on our business, earnings, financial condition and/or cash flows.
Certain of our operating facilities are highly dependent upon a single or a few suppliers.
Certain of our operating facilities are highly dependent on one or a few suppliers. Should any of these suppliers choose alternate methods of disposal, cease their operations, have their operations interrupted by casualty, curtail their operations or otherwise cease using our collection services, these operating facilities may be materially and adversely affected, which could materially and adversely affect our business, results of operations and financial condition.
We face risks associated with our international activities, which could negatively affect our sales to customers in foreign countries and our operations and assets in such countries.
We conduct foreign operations in Canada, Europe, South America, Asia and Australia. While we expect that our geographical diversity reduces our exposure to risks in any one country or part of the world, it also subjects us to the various risks and uncertainties relating to international sales and operations, including:
Page 17
• imposition of tariffs, quotas, trade barriers and other trade protection measures imposed by foreign countries regarding the importation of poultry, beef and pork products, in addition to operating, import or export licensing requirements imposed by various foreign countries;
• imposition of border restrictions by foreign countries with respect to the import of poultry, beef and pork products due to animal disease or other perceived health or safety issues;
• impact of currency exchange rate fluctuations between the U.S. dollar and foreign currencies, particularly the euro, the Canadian dollar, the Chinese renminbi, the Brazilian real, the British pound, the Japanese yen, the Argentine peso and the Australian dollar, which may reduce the U.S. dollar value of the revenues, profits and cash flows we receive from non-U.S. markets or of our assets in non-U.S. countries or increase our supply costs, as measured in U.S. dollars in those markets;
• exchange controls and other limits on our ability to import raw materials, import or export finished products or to repatriate earnings from overseas, such as exchange controls in effect in China, that may limit our ability to repatriate earnings from those countries;
• different regulatory structures (including creditor rights that may be different than in the United States) and unexpected changes in regulatory environments (including, without limitation, in China), including changes resulting in potentially adverse tax consequences or imposition of onerous trade restrictions, price controls, industry controls, animal and human food safety controls, employee welfare schemes or other government controls;
These risks and uncertainties could jeopardize or limit our ability to transact business in one or more of our international markets or in
other developing markets and may have a material adverse affect on our business, results of operations, cash flows and financial condition.
The DGD Joint Venture subjects us to a number of risks.
In January 2011, our wholly-owned subsidiary entered into a limited liability company agreement with a wholly-owned subsidiary of Valero to form the DGD Joint Venture, which was formed to design, engineer, construct and operate the DGD Facility, which is capable of processing approximately 11,000 barrels per day of input feedstock to produce renewable diesel fuel and certain other co-products. The DGD Facility, which is located adjacent to Valero’s refinery in Norco, Louisiana, reached mechanical completion and began production of renewable diesel in late June 2013. As of January 3, 2015, under the equity method of accounting, we had an investment in the DGD Joint Venture of approximately $ 178.9 million included on the consolidated balance sheet. There is no assurance that the DGD Joint Venture will be profitable or allow us to continue to make a return on our investment.
The DGD Joint Venture is dependent on governmental energy policies and programs, such as the National Renewable Fuel Standard
Program (“RFS2”), which positively impact the demand for and price of renewable diesel. Any changes to, a failure to enforce or a discontinuation of any of these programs could have a material adverse affect on the DGD Joint Venture. See the section entitled “Risk Factors - Risks Related to the Company-Our biofuels business may be affected by energy policies of U.S. and foreign governments. ” Similarly, the DGD Joint Venture is subject to the risk that new or changing technologies may be developed that could meet demand for renewable diesel under governmental mandates in a more efficient or less costly manner than the technologies used by the DGD Joint Venture, which could negatively affect the price of renewable diesel and have a material adverse affect on the DGD Joint Venture.
In addition, the operation of a joint venture such as this involves a number of risks that could harm our business and result in the DGD
Joint Venture not performing as expected, such as:
Page 18
• political or economic instability, social or labor unrest or changing macroeconomic conditions or other changes in political, economic or social conditions in the respective jurisdictions;
• changes in our effective tax rate including, tax rates that may exceed those in the U.S., earnings that may be subject to withholding requirements and incremental taxes upon repatriation, changes in the mix of our business from year to year and from country to country, changes in rules related to accounting for income taxes, changes in tax laws in any of the jurisdictions in which we operate and adverse outcomes from tax audits;
• difficulties and costs associated with complying with, and enforcement of remedies under, a wide variety of complex domestic and international laws, treaties and regulations, including, without limitation, anti-bribery laws such as the U.S. Foreign Corrupt Practices Act (the “FCPA”), the U.K. Bribery Act 2010, the new Brazilian corporate anti-corruption law and similar anti-corruption legislation in many jurisdictions in which we operate, as well as economic and trade sanctions enforced by the U.S. Department of the Treasury’s Office of Foreign Assets Control, the E.U. and other governmental entities; and
• distribution costs, disruptions in shipping or reduced availability or increased costs of freight transportation.
• problems integrating or developing operations, personnel, technologies or products;
• the unanticipated breakdown or failure of equipment or processes, including any unforeseen issues that may arise in connection with the operation of the DGD Facility;
• the inaccuracy of our assumptions about prices for the renewal diesel that the DGD Joint Venture produces;
• unforeseen engineering or environmental issues, including new or more stringent environmental regulations affecting operations;
• the inaccuracy of our assumptions about the timing and amount of anticipated revenues and operating costs including feedstock prices;
• the diversion of management time and resources;

If any of these risks described above were to materialize and the operations of the DGD Joint Venture were significantly disrupted, a
material adverse effect on our business, financial condition and results of operations could result. Our biofuels business may be affected by energy policies of U.S. and foreign governments.
Pursuant to the requirements established by the Energy Independence and Security Act of 2007, the EPA finalized regulations for RFS2 in 2010. The regulation mandated the domestic use of biomass-based diesel (biodiesel or renewable diesel) of 1.0 billion gallons in 2012. Beyond 2012, the regulation requires a minimum of 1.0 billion gallons of biomass-based diesel for each year through 2022, which amount is subject to increase by the Administrator of the EPA. On September 14, 2012, the EPA issued a final rule establishing the biomass-based diesel and the advance biofuel volumes for calendar year 2013 to be 1.28 billion gallons and 2.75 billion gallons, respectively. Though a final rule is yet to be issued, the EPA has proposed maintaining the biomass-based diesel volume for calendar years 2014 and 2015 at the 2013 calendar year level of 1.28 billion gallons, but has proposed reducing the advance biofuel volume to 2.20 billion gallons. Biomass-based diesel also qualifies to fulfill the non-specified portion of the advanced biofuel requirement. In order to qualify as a “renewable fuel” each type of fuel from each type of feedstock is required to lower greenhouse gas emissions (“GHG”) by levels specified in the regulation. The EPA has determined that biofuels (either biodiesel or renewable diesel) produced from waste oils, fats and greases result in an 86% reduction in GHG emissions, exceeding the 50% requirement established by the regulation. Prices for our finished products may be impacted by worldwide government policies relating to renewable fuels and GHG. Programs like RFS2 and tax credits for biofuels both in the United States and abroad may positively impact the demand for our finished products. In fiscal 2014, the amount of tax credits for biofuels impacting the Company was material. Conversely, legal challenges to, changes to, a failure to enforce, reductions in the mandated volumes under, or discontinuing any of these programs could have a negative impact on our business and results of operations. We may incur material costs and liabilities in complying with government regulations.
We are subject to the rules and regulations of various governmental agencies in the United States, the European Union, Canada, China and
the other countries in which Darling Ingredients International operates. These include rules and regulations administered by governmental agencies at the federal, state, provincial or local level. See Item1. "Business - Regulations" for a listing of certain governmental agencies to which we are subject.
The applicable rules and regulations promulgated by these and other agencies, which are likely to change over time, affect our operations
and may influence our operating results at one or more facilities. Furthermore, the loss of or failure to obtain necessary federal, state, provincial or local permits and registrations at one or more of our facilities could halt or curtail operations at impacted facilities, which could result in impairment charges related to the affected facility and otherwise adversely affect our operating results. In addition, our failure to comply with applicable rules and regulations, including obtaining or maintaining
Page 19
• difficulty in obtaining and maintaining permits and other regulatory issues, potential license revocation and changes in legal requirements;
• difficulties in establishing and maintaining relationships with suppliers and end user customers;
• limitations in the DGD Joint Venture’s operating agreement restricting the payment of dividends to the DGD Joint Venture partners in certain circumstances, including prior to the time that the DGD Joint Venture’s existing debt has been repaid and reserves for contingent liabilities have been made;
• the risk that one or more competitive new renewable diesel plants are constructed that use different technologies from the DGD Joint Venture facility and result in the marketing of products that are more effective as a substitute for carbon-based fuels or less expensive than the products marketed by the DGD Joint Venture;
• performance below expected levels of output or efficiency;
• reliance on Valero and its adjacent refinery facility for many services and processes;
• if any of the risks described in connection with the DGD Joint Venture occur, possible impairment of the acquired assets, including intangible assets;
• possible third party claims of intellectual property infringement; and
• being forced to sell our equity interests in the DGD Joint Venture pursuant to buy/sell provisions in the DGD Joint Venture’s operating agreement and not realizing the benefits of the DGD Joint Venture.

required operating certificates or permits, could subject us to: (i) administrative penalties and injunctive relief; (ii) civil remedies, including fines, injunctions and product recalls; and (iii) adverse publicity. There can be no assurance that we will not incur material costs and liabilities in connection with these rules and regulations.
Because of our international operations throughout much of the world, we could be adversely affected by violations of the FCPA and similar
worldwide anti-bribery laws. The FCPA and similar worldwide anti-bribery laws generally prohibit companies and their intermediaries from making improper payments to government officials or other third parties for the purpose of obtaining or retaining business. In addition, given the competitive nature of our industry, we could be adversely affected by violations of various countries’ antitrust, competition and consumer protection laws. These laws generally prohibit companies and individuals from engaging in anticompetitive and unfair business practices. While our policies mandate compliance with these laws, we cannot provide assurance that our internal control policies and procedures will always protect us from reckless or criminal acts committed by our employees, joint venture partners or agents. Violations of these laws, or allegations of such violations, could result in lengthy investigations and possibly criminal and/or civil legal proceedings brought by governmental agencies and/or third parties, which could disrupt our business, result in material fines and legal and other costs, and have a material adverse effect on our results of operations, cash flows and financial condition and reputation.
Seasonal factors and weather, including the physical impacts of climate change, can impact the availability, quality and volume of raw materials that we process and negatively affect our operations.
The quantity of raw materials available to us is impacted by seasonal factors, including holidays, when raw material volumes decline, and
cold weather, which can impact the collection of raw materials. In addition, warm weather can adversely affect the quality of raw materials processed and our yield on production due to more rapidly degrading raw materials. In addition to seasonal impacts, depending upon the location of our facilities and those of our suppliers, our operations could be subject to the physical impacts of climate change, including changes in rainfall patterns, water shortages, changing sea levels, changing storm patterns and intensities and changing temperature levels. Physical damage, flooding, excessive snowfall or drought resulting from changing climate patterns could adversely impact our costs and business operations, the availability and costs of our raw materials, and the supply and demand for our end products. These effects could be material to our results of operations, liquidity or capital resources. The quality and volume of the finished products that we are able to produce could be negatively impacted by unseasonable or severe weather or unexpected declines in the volume of raw materials available during holidays, which in turn could have a material adverse impact on our business, results of operations and financial condition. In addition, severe weather events may also impact our ability to collect or process raw materials or to transport finished products. Downturns and volatility in global economies and commodity and credit markets could materially adversely affect our business, results of operations and financial condition.
Our results of operations are materially affected by the conditions of the global economies and the credit, commodities and stock markets.
Among other things, we may be adversely impacted if our domestic and international customers and suppliers are not able to access sufficient capital to continue to operate their businesses or to operate them at prior levels. A decline in consumer confidence or changing patterns in the availability and use of disposable income by consumers can negatively affect both our suppliers and customers. Declining discretionary consumer spending or the loss or impairment of a meaningful number of our suppliers or customers could lead to a dislocation in either raw material availability or customer demand. Any tightening in credit supply could negatively affect our customers’ ability to pay for our products on a timely basis or at all and could result in a requirement for additional bad debt reserves. Although many of our customer contracts are formula-based, continued volatility in the commodities markets could negatively impact our revenues and overall profits. Counterparty risk on finished product sales can also impact revenue and operating profits when customers either are unable to obtain credit or refuse to take delivery of finished products due to market price declines. Our substantial level of indebtedness could adversely affect our financial condition.
As of January 3, 2015 , our total indebtedness, including trade debt was approximately $ 2.2 billion . Our high level of indebtedness could have important consequences, including the following:
Page 20
• making it more difficult for us to satisfy our obligations to our financial lenders and our contractual and commercial commitments;
• limiting our ability to obtain additional financing to fund future working capital, capital expenditures, acquisitions or other general corporate requirements on commercially reasonable terms or at all;

In addition, the indenture that governs our senior notes and the credit agreement governing our senior secured credit facilities contain
restrictive covenants that limit our ability to engage in activities that may be in our long-term best interest. Our failure to comply with those covenants could result in an event of default which, if not cured or waived, could result in the acceleration of all our funded indebtedness. See Item 7. " Management Discussion and Analysis of Financial Condition and Results of Operations " - " Senior Secured Credit Facilities " and " 5.375% Senior Notes due 2022 ." Despite our existing level of indebtedness, we and our subsidiaries may still be able to incur substantially more indebtedness, which could further exacerbate the risks to our financial condition described above.
We and our subsidiaries may be able to incur substantial additional indebtedness in the future, including additional secured indebtedness under the senior secured credit facilities. Although the indenture that governs the senior notes and the credit agreement governing the senior secured credit facilities contain restrictions on our incurrence of additional indebtedness, these restrictions are subject to a number of significant qualifications and exceptions, and the additional indebtedness that could be incurred in compliance with these restrictions could be substantial. To the extent that we or our subsidiaries incur additional indebtedness, the risks associated with our indebtedness, including our possible inability to service our indebtedness, could intensify. See Item 7. " Management Discussion and Analysis of Financial Condition and Results of Operations " -" Senior Secured Credit Facilities " and " 5.375% Senior Notes due 2022 ." We may not be able to generate sufficient cash to service all of our indebtedness and may be forced to take other actions to satisfy our obligations under our indebtedness, which may not be successful.
Our ability to make scheduled payments on or to refinance our debt obligations depends on our financial condition and operating performance, which are subject to prevailing economic and competitive conditions and to certain financial, business, legislative, regulatory and other factors beyond our control. We may be unable to maintain a level of cash flows from operating activities sufficient to permit us to pay the principal, premium, if any, and interest on our indebtedness.
If our cash flows and capital resources are insufficient to fund our debt service obligations and to meet our other cash needs, we could be forced to reduce or delay investments and capital expenditures or to dispose of material assets or operations, seek additional debt or equity capital or restructure or refinance our indebtedness. We may not be able to effect any such alternative measures, if necessary, on commercially reasonable terms or at all and, even if successful, such alternative actions may not allow us to meet our scheduled debt service obligations and our other cash needs. The credit agreement governing our senior secured credit facilities and the indenture governing our senior notes restrict our ability to use the proceeds from the disposition of assets, debt incurrence or sales of equity to repay other indebtedness when it becomes due. We may not be able to consummate any such dispositions or to obtain debt or equity proceeds in amounts sufficient to meet any debt service obligations then due, and we may be restricted under the credit agreement governing our senior secured credit facilities or the indenture governing our senior notes from using any such amounts to service other debt obligations.
If we cannot make scheduled payments under any of the agreements governing our debt, we would be in default under such agreements, which could allow lenders under any credit facilities to terminate their commitments to loan money and could allow the applicable lenders or other debt holders to declare all outstanding principal and interest of such debt to be immediately due and payable, and, in the case of secured debt, to foreclose against the assets securing such debt and apply the proceeds from such foreclosure to repay amounts owed to them. Any of these events would likely in turn trigger cross-acceleration or cross-default provisions in our other debt instruments, which would allow the creditors under those instruments to exercise similar rights. If any of these actions are taken, we could be forced into restructuring, bankruptcy or liquidation.
Page 21
• requiring us to use a substantial portion of our cash flows from operations to pay principal and interest on our indebtedness instead of other purposes, thereby reducing the amount of our cash flows from operations available for working capital, capital expenditures, acquisitions and other general corporate purposes;
• increasing our vulnerability to adverse economic, industry and business conditions;
• exposing us to the risk of increased interest rates as certain of our borrowings are at variable rates of interest;
• limiting our flexibility in planning for, or reacting to, changes in our business and the industry in which we operate;
• placing us at a competitive disadvantage compared to other, less leveraged competitors; and
• increasing our cost of borrowing.
Our ability to repay our indebtedness depends in part on the performance of our subsidiaries, including our non-guarantor subsidiaries, and their ability to make payments.
We conduct a significant portion of our operations through our subsidiaries, a number of which operate outside the United States. Accordingly, repayment of our indebtedness is dependent, to a significant extent, on the generation of cash flow by our subsidiaries and their ability to make such cash available to us. Unless they are guarantors of the indebtedness, our subsidiaries do not have any obligation to pay amounts due on the indebtedness or to make funds available for that purpose. Under certain circumstances, legal and contractual restrictions may limit our ability to obtain cash from our subsidiaries. For example, our subsidiaries that are organized under the laws of, and operate in, China, currently have substantial regulatory restrictions on their ability to make cash available to us. While the credit agreement governing the senior secured credit facilities, the indenture governing our senior notes and the agreements governing certain of our other indebtedness will limit the ability of certain of our subsidiaries to incur consensual restrictions on their ability to make other intercompany payments to us, these limitations are subject to certain significant qualifications and exceptions.
Our business may be affected by the impact of BSE and other food safety issues.
Effective August 1997, the FDA promulgated the BSE Feed Rule to prevent further spread of BSE. Detection of the first case of BSE in
the United States in December 2003 resulted in additional U.S. government regulations, finished product export restrictions by foreign governments, market price fluctuations for our finished products and reduced demand for beef and beef products by consumers. Even though the export markets for U.S. beef have recovered to meet or exceed pre-BSE levels, most export markets remain closed to MBM derived from U.S. beef. On May 29, 2013, the USDA announced that the OIE had officially upgraded the BSE-status for the United States from “controlled risk” to “negligible risk” based on a thorough review of BSE safeguards implemented in the United States. Attaining a negligible risk status for BSE is an important step toward regaining access to export markets for U.S. MBM; however, except for Indonesia, which reopened its markets to U.S. MBM on June 17, 2013, other export markets previously closed because of BSE have not reopened as of the date of this report, and no assurance can be given that such closed export markets will be reopened as a result of the upgraded status. We do not expect this trade disruption to have a material impact on our business, financial condition or results of operations. Continued concern about BSE in the United States, and other countries in which we operate now or in the future, may result in additional regulatory and market related challenges that may affect our operations or increase our operating costs.
With respect to BSE in the United States, on October 26, 2009, the FDA began enforcing the Enhanced BSE Rule. These new regulations
amended the BSE Feed Rule to also prohibit the use of tallow having more than 0.15% insoluble impurities in feed for cattle or other ruminant animals. In addition, the Enhanced BSE Rule prohibits brain and spinal cord material from cattle aged 30 months and older or the carcasses of such cattle, if the brain and spinal cord are not removed (collectively, “Prohibited Cattle Materials”), and tallow derived from Prohibited Cattle Materials that also contains more than 0.15% insoluble impurities in the feed or food for all animals. We have made capital expenditures and implemented processes and procedures to be compliant with the Enhanced BSE Rule at all of our U.S. operations. In Canada, the CFIA implemented feed restrictions, which were similar to the FDA’s BSE Feed Rule, in 1997 to prevent the spread of BSE. Following confirmation of nine positive cases of BSE between May 2003 and July 2007, however, the CFIA amended the Canadian Health of Animals Regulations to strengthen Canada’s BSE safeguards (“SRM Ban”). These enhanced safeguards, which became effective July 2007, required the removal of all SRMs from animal feed, pet food and fertilizer; placed the removal, transport and disposal of SRM under direct CFIA control; prohibited the use of tallow containing more than 0.15% insoluble impurities in any animal feed; and extended the retention time for keeping relevant records from two years to 10 years. Other cases of BSE have been reported in Canada since the SRM Ban was implemented. The most recent case occurred on February 12, 2015 and the CFIA reported that no part of the infected carcass entered human or animal food systems. We can provide no assurance that unanticipated costs and/or reductions in raw material volumes related to our compliance with the Enhanced BSE Rule, the SRM Ban or the occurrence of new cases of BSE will not negatively impact our operations and financial performance.
With respect to human food, pet food and animal feed safety in the United States, the Food and Drug Administration Amendments Act of
2007 (the “FDAAA”) directed the FDA to establish a Reportable Food Registry ("RFR"), which was implemented on September 8, 2009. On June 11, 2009, the FDA issued “Guidance for Industry: Questions and Answers Regarding the Reportable Food Registry as Established by the Food and Drug Administration Amendments Act of 2007: Draft Guidance” (“RFR Draft Guidance”). Although the RFR Draft Guidance was revised in September 2009 and again in May 2010, it had not been finalized as of the date of this report. In the RFR Draft Guidance, the FDA defined a reportable food, which the manufacturer or distributor would be required to report in the RFR, to include materials used as ingredients in animal feeds and pet foods, if there is reasonable probability that the use of, or exposure to, such materials will cause serious adverse health consequences or death to humans or animals. In March 2014, the FDA issued an advance notice of proposed rulemaking to solicit comments and information regarding provisions in the Food Safety Modernization Act ("FSMA") that amended Section 417 of
Page 22

the the Food, Drug and Cosmetic Act (“FD&C Act”), which governs the RFR, to permit the FDA to require the submission of "consumer-oriented information" regarding a reportable food. The FDA later reopened the comment period for the advance notice of proposed rulemaking and set August 18, 2014 as the deadline for comments. In July 2013, the FDA announced the criteria to be used to determine whether pet food and farmed animal feeds that are contaminated with salmonella will be considered to be adulterated under section 402(a)(1) of FD&C Act in the “Compliance Policy Guide Sec. 690.800, Salmonella in Food for Animals” (the “CPG”). According to the CPG, any finished pet food contaminated with any species of salmonella will be considered adulterated and the FDA believes regulatory action is warranted in cases involving such pet foods because of the heightened risk to humans given the high likelihood of direct human contact with the pet food. Finished animal feeds intended for pigs, poultry and other farmed animals, however, will be considered to be adulterated only if the feed is contaminated with a species of salmonella that is considered to be pathogenic for the animal species for which the feed is intended. The finalization of the RFR Draft Guidance and the possible issuance of a rule pursuant to the FSMA by the FDA may impose additional requirements on us. We believe that we have adequate procedures in place to assure that our finished products are safe to use in animal feed and pet food and we do not currently anticipate that the FDAAA will have a significant impact on our operations or financial performance. Any pathogen, such as salmonella, that is correctly or incorrectly associated with our finished products could have a negative impact on the demand for our finished products.
In addition, the FSMA was enacted on January 4, 2011. The FSMA gave the FDA new authorities, which became effective immediately. Included among these is a mandatory recall authority for adulterated foods that are likely to cause serious adverse health consequences or death to humans or animals, if the responsible party fails to cease distribution and recall such adulterated foods voluntarily. The FSMA further instructed the FDA to amend existing regulations that define its administrative detention authority. Prior to the FSMA becoming law, the FDA had authority to order that an article of food be detained only if there was credible evidence or information indicating that the article of food presented a threat of serious adverse health consequences or death to humans or animals. On May 5, 2011, the FDA issued an interim final rule amending its administrative detention authority and lowering both the level of proof and the degree of risk required for detaining an article of food. This interim final rule, which became a final rule on February 5, 2013, gives the FDA authority to detain an article of food if there is reason to believe the food is adulterated or misbranded. The FMSA also requires the FDA to develop new regulations that, among other provisions, place additional registration requirements on food and feed producing firms. Section 102 of the FSMA amends facility registration requirements in the FD&C Act for domestic and foreign manufacturers, processors, packers or holders of food for human or animal consumption. Such facility registrations were previously required to be updated when changes in a facility occurred, but there were no provisions for renewing facility registrations. The FSMA, however, requires that facility registrations be renewed during the fourth quarter of each even-numbered year, beginning October 1, 2012. Other new FDA regulations mandated by the FSMA and currently in the proposed stage will require registered facilities to perform hazard analyses and to implement preventive plans to control those hazards identified to be reasonably likely to occur; increase the length of time that records are required to be retained; and regulate the sanitary transportation of food, which is defined in Section 201(f) of the FD&C Act to include “articles used for food or drink for man or other animals.” The FDA proposed new rules on January 16, 2013 and October 29, 2013 addressing preventive controls for food for humans and for animals, respectively, and reissued revised proposed rules for human food and animal feed on September 29, 2014. These proposed rules would create regulations applicable to facilities that manufacture, process, pack and hold human or animal food requiring these facilities to establish and implement written food safety plans, which include hazard analyses, written preventive controls that provide assurance that significant hazards identified as known or reasonably foreseeable will be significantly reduced or prevented, monitoring of preventive controls, corrective actions, verification and recordkeeping. The proposed rule pertaining to animal food would create new Current Good Manufacturing Practice (“CGMP”) regulations, which are mandatory manufacturing procedures to protect against the possibility of a foodborne illness outbreak through contaminated food, that are specifically applicable to the manufacturing, processing, packing and holding of animal food. The proposed rule pertaining to human food would revise the CGMP regulations that are currently applicable to the manufacturing, processing, packing and holding of human food. For both human and animal food, the CGMP regulations would apply to each of the following areas: personnel, the facility and grounds, sanitation, water supply, equipment and utensils, facility operations, and the holding and distribution of the human or animal food. Human and animal food facilities will need “qualified individuals,” those with appropriate training or job experience in the development and application of risk-based preventive controls, to prepare, evaluate and maintain the safety plan and preventive controls. Rulemaking proposed on July 29, 2013 and proposed with revisions on September 29, 2014 would extend similar requirements to imported foods intended for humans or animals. This proposed imported foods rule designates the importer as the party responsible for verifying that process controls and CGMP were used by the foreign manufacturer to control significant hazards that are known or reasonably foreseeable in the imported food. On February 5, 2014, the FDA proposed new regulations for the sanitary transportation of human and animal foods, which establishes sanitary transportation practices that are to be used by shippers, motor vehicle and rail carriers, and receivers engaged in the transportation of food. We have followed the FSMA throughout its legislative history and have renewed registrations for all of our facilities and implemented hazard prevention controls and other procedures which continue to be assessed under the proposed rules to determine if they comply. Such rulemaking could, among other things, limit our ability to import necessary raw materials or finished products or require us to amend certain of our other operational policies and procedures. Unforeseen issues and requirements may arise as the FDA promulgates the new regulations provided for by the FSMA.
Page 23

As a result of our international operations, we could be adversely affected by additional foreign regulations regarding BSE and other food
safety issues. For example, an enforceable ban on the feeding of restricted animal material to ruminant animals was introduced in Australia in 1996. This ban is part of a comprehensive national program to prevent the entry and establishment of the BSE agent in Australia. Inspections and audits are undertaken to ensure compliance. In addition, in the E.U., harmonized rules have been adopted for prevention, control and eradication of transmissible spongiform encephalopathies (“TSEs”), which includes BSE, in Regulation 999/2001 (“TSE Regulation”) and in other instruments such as Regulation 1069/2009 on animal by-products and food and feed hygiene regulations. The TSE Regulation establishes a “feed ban,” which is the basic preventive measure against TSE and consists of a ban on the use of processed animal protein (“PAP”) in feed for farmed animals. A ban on the feeding of mammalian PAP to cattle, sheep and goats was first introduced in July 1994. The ban was expanded in January 2001 with the feeding of all PAP to all farmed animals being prohibited, with certain limited exceptions. Only certain animal proteins considered to be safe (such as fishmeal) can be used, and even then under very strict conditions. Other animal-derived products besides PAP, such as collagen and gelatin from non-ruminants and hydrolyzed protein, are not subject to the “feed ban.” In June 2013, the “feed ban” was lifted for the feeding of aquaculture animals and the European Commission is currently investigating the options to lift the ban for other non-ruminants, such as pigs and poultry. Although Darling Ingredients International may profit from the possible lifting of the ban for pigs and poultry, changes to the “feed ban” may adversely affect Darling Ingredients International, possibly restricting the allowed use of some of their products. The TSE Regulation applies to the production and placing on the market of live animals and products of animal origin. For that purpose, the BSE status of member states of the European Union (E.U. Member States"), non-E.U. members of the European Economic Area-European Free Trade Association and other countries or regions (such other countries or regions, “third countries”) is to be determined by classification into one of three categories depending on the BSE risk involved: a negligible risk, a controlled risk and an undetermined risk. This classification is in line with that of the OIE. The determination of BSE status is based on a risk assessment and the implementation of a surveillance program. For each risk category there are trade rules to provide the necessary guarantees for protecting public and animal health. Currently, the following E.U. Member States are classified as having a controlled BSE risk: Bulgaria, Cyprus, Czech Republic, Estonia, France, Germany, Greece, Hungary, Ireland, Latvia, Lithuania, Luxembourg, Malta, Poland, Portugal, Slovakia, Spain and the United Kingdom. The other E.U. Member States are classified as having a negligible BSE risk. A change in the BSE status of one or more E.U. Member States may have a negative impact on Darling Ingredients International. Under E.U. legislation, imported products from outside the E.U. must meet the same safety standards as products produced in E.U. Member States. Therefore, the TSE Regulation imposes strict import requirements related to TSEs for live animals and animal by-products, such as full traceability of imported animals and animal by-products, a ban on the use of MBM in feed for ruminants and the prohibition of the import of specified risk material or mechanically recovered meat. The detailed import requirements depend on the BSE status of third countries. Regulation 1069/2009 on animal by-products establishes rules intended to prevent the outbreak of certain diseases such as BSE. Regulation 1069/2009 imposes, for example, rules for the use and disposal of specified risk material and other high risk material. A BSE outbreak or other event viewed as hazardous to animal or human health could lead to the adoption of more stringent rules on the use and disposal of animal by-products, which could require Darling Ingredients International to change its production processes and could have a material adverse effect on our business, results of operations or financial condition. Our business may be negatively impacted by the occurrence of any disease correctly or incorrectly linked to animals.
The emergence of diseases such as 2009 H1N1 flu (initially known as “Swine Flu”), highly pathogenic strains of avian influenza
(collectively known as “Bird Flu”), including H5N1, H7N3, H7N9, H10N8 and H5N8 strains of avian influenza and severe acute respiratory syndrome (“SARS”) that are in or associated with animals and have the potential to also threaten humans has created concern that such diseases could spread and cause a global pandemic. To date, the H5N1 strain has not been reported in North America. Outbreaks of the H7N3 strain, however, were reported on chicken farms in Mexico during 2012 and again in February 2013. There have been no reports of human cases of the H7N3 strain. Human cases of the H7N9 and H10N8 strains were reported in China in 2013 and 2014, respectively. Both the H7N9 and H10N8 strains are believed to be an animal virus that infects people in rare cases. To date, however, there have been no incidences of person-to-person transmission of the H7N9 or the H10N8 Bird Flus reported. Another highly pathogenic strain (H5N8) was reported on commercial poultry farms in Germany, the Netherlands and in the United Kingdom in November 2014. This H5N8 strain was subsequently reported in commercial poultry farms in Western Canada and backyard flocks in the Northwestern U.S. in December 2014. More recently, on January 24, 2015, a commercial poultry farm in California was quarantined after turkeys on the farm were confirmed by state and federal health officials to have the H5N8 Bird Flu. Restrictions on the movement of animals and animal products in a country or region infected with a highly infectious disease, such as Bird Flu, are commonly used to prevent further spread of the disease.
In April 2013, the first case of porcine epidemic diarrhea ("PED") virus was confirmed in the United States on a hog farm in Ohio. The
disease has since spread into 33 states in the U.S. and in Ontario and three other Canadian provinces. The PED virus is highly contagious among pigs, but does not affect other animals and is not transmissible to humans. The effects of the PED virus on hog production will vary according to the age of the pigs affected. Death rates can be very high among young pigs, while
Page 24

symptoms are mild in older animals. Because the PED virus is common in other parts of the world and poses no threat to human health or food safety, its presence in a country or region does not restrict trade in pork or pork products. However, any outbreak that is severe enough to significantly reduce the pig population in a country or region could reduce the availability of pork raw material to our plants. Animal health experts believe the PED virus is spread primarily through contaminated feces, although other transmission routes continue to be studied. On January 30, 2015, scientists in the College of Veterinary Sciences at the University of Minnesota released its report titled “Risk Assessment of Feed Ingredients as Vehicles in the Transmission of the PED Virus.” This risk assessment concluded that the virus is unlikely to survive the rendering process. Therefore, the risk of spreading PED through rendered animal fats and proteins was determined to be negligible. Because data on the effects of spray drying on the virus is limited, the risk of spreading PED through spray dried blood products was determined to be negligible to low. Any reports, proven or perceived, that implicate animal feed or feed ingredients, including but not limited to animal byproducts, as contributing to the spread of the PED virus could negatively affect demand for our products as ingredients in pig feeds in the U.S and in Canada.
From December 2002 to June 2003, China and some other countries experienced an outbreak of SARS, a highly contagious form of
atypical pneumonia. On July 5, 2003, the World Health Organization declared that the SARS outbreak had been contained. In April 2004, however, a number of isolated new cases of SARS were reported, including in central China.
Although no global disease pandemic among humans has been linked to Bird Flu, Swine Flu, PED virus or SARS as of the date of this
report, governments may be pressured to address these concerns, including by executive action such as temporarily closing certain businesses, including meat and animal processing facilities, within their jurisdictions suspected of contributing to the spread of such diseases or by legislative or other policy action, such as prohibiting imports of animals, meat and animal by-products from countries or regions where the disease is detected or suspected. For example, during May and June 2003, many businesses in China were temporarily closed by the Chinese government to prevent transmission of SARS.
The E.U. has enacted several disease control directives, as well as other legislation regarding the notification of animal diseases within the
community and veterinary and zoo technical checks, among others. The applicable legislation generally enables the E.U. to take preventive measures, as well as act promptly in case of an outbreak, by restricting the circulation of livestock and products at risk of being infected within the E.U. and implementing bans on the imports of such products. For instance, there are preventive measures against Bird Flu that must be implemented by all the E.U. Member States. In the event of an outbreak of Bird Flu, the European Council’ s Directive 2005/94/EC of December 20, 2005 on community measures for the control of avian influenza provides for preventive measures relating to the surveillance and the early detection of Bird Flu and the minimum control measures to be applied in the event of an outbreak of that disease in poultry or other captive birds. The E.U. is empowered to act quickly in the case of an outbreak by defining protection and surveillance risk zones and adopting measures such as restricting the movement of live poultry and certain poultry products to other E.U. Member States or to third countries. The most recent case where the E.U. took certain measures in light of outbreaks of Bird Flu was in August 2013 in Italy. In addition, E.U. import bans have also been placed on potentially risky poultry products and susceptible imports from third countries with Bird Flu outbreaks.
If Swine Flu, Bird Flu, PED virus, SARS or any other disease that is correctly or incorrectly linked to animals and has a negative impact
on meat or poultry consumption or animal production occurs in any jurisdiction in which we operate, such occurrence could have a material negative impact on the volume of raw materials available to us or the demand for our finished products. If we or our customers are the subject of product liability claims or product recalls, we may incur significant and unexpected costs and our business reputation could be adversely affected.
We and our customers for whom we manufacture products may be exposed to product liability claims and adverse public relations if
consumption or use of our products is alleged to cause injury or illness to humans or animals. In addition, we and our customers may be subject to product recalls resulting from developments relating to the discovery of unauthorized adulterations to food additives or from allegations that our food ingredients have not performed adequately in the end product, even where food safety is not a concern. Product recalls in one jurisdiction may result in product recalls in other jurisdictions, as is the case in the E.U., where an E.U. Member State could recall a product in connection with the recall of such product in another E.U. Member State. Our insurance may not be adequate to cover all liabilities we incur in connection with product liability claims, whether or not legitimate, or product recalls, whether voluntary or mandatory. We may not be able to maintain our existing insurance or obtain comparable insurance at a reasonable cost, if at all. A product liability judgment against us or against one of our customers for whom we manufacture or provide products, or our or their agreement to settle a product liability claim or a product recall, could also result in substantial and unexpected expenditures, which would reduce operating income and cash flow. In addition, even if product liability claims against us or our customers for whom we manufacture products are not successful or are not fully pursued, defending these claims would likely be costly and time-consuming and may require management to spend time defending the
Page 25

claims rather than operating our business. Any such claim could also result in adverse publicity and negatively impact our reputation.
Product liability claims, product recalls or any other events that cause consumers to no longer associate our brands or those of our
customers for whom we manufacture products with high quality and safety may harm the value of our and their brands and lead to decreased demand for our products. In addition, as a result of any such claims against us or product recalls, we may be exposed to claims by our customers for damage to their reputations and brands. Product liability claims and product recalls may also lead to increased scrutiny by federal, state and foreign regulatory agencies of our operations and could have a material adverse effect on our brands, business, results of operations and financial condition.
Changes in consumer preference could negatively impact our business.
The food industry in general is subject to changing consumer trends, demands and preferences. Trends within the food industry change
often, and failure to identify and react to changes in these trends could lead to, among other things, reduced demand and price reductions for our products or those of our customers for whom we manufacture products, and could have an adverse effect on our financial results. Our operations are subject to various laws, rules and regulations relating to the protection of the environment and to health and safety, and we could incur significant costs to comply with these requirements or be subject to sanctions or held liable for environmental damages.
Our operations subject us to various and increasingly stringent environmental, health and safety requirements in the various jurisdictions
where we operate, including those governing air emissions, wastewater discharges, the management, storage and disposal of materials in connection with our facilities, occupational health and safety, product packaging and labeling and our handling of hazardous materials and wastes, such as gasoline and diesel fuel used by our trucking fleet and operations. Failure to comply with these requirements could have significant consequences, including recalls, penalties, injunctive relief, claims for personal injury and property and natural resource damages and negative publicity. Our operations require the control of air emissions and odor and the treatment and discharge of wastewater to municipal sewer systems and the environment. We operate boilers at many of our facilities and store wastewater in lagoons or, as permitted, discharge it to publicly owned wastewater treatment systems, surface waters or through land application. We have incurred significant capital and operating expenditures to comply with environmental requirements, including for the upgrade of wastewater treatment facilities, and will continue to incur such costs in the future.
We could be responsible for the remediation of environmental contamination and may be subject to associated liabilities and claims for
personal injury and property and natural resource damages. We own or operate numerous properties, have been in business for many years and have acquired and disposed of properties and businesses over that time. During that time, we or other owners or operators may have generated or disposed of wastes or stored or handled other materials that are or may be considered hazardous or may have polluted the soil, surface water or groundwater at or around our facilities. Under some environmental laws, such as the Comprehensive Environmental Response, Compensation, and Liability Act of 1980 in the United States, also known as the Superfund law, responsibility for the cost of cleanup of a contaminated site can be imposed upon current or former site owners and operators, or upon any party that sent waste to the site, regardless of the lawfulness of the activities that led to the contamination. Similar laws outside the United States impose liability for environmental cleanup, often under the polluter pays theory of liability but also based upon ownership in some circumstances. There can be no assurance that we will not face extensive costs or penalties that would have a material adverse effect on our financial condition and results of operations. For example, we have received notice from the EPA relating to alleged river sediment contamination in the Lower Passaic River area of New Jersey. See Item 3. “ Legal Proceedings. ” In addition, future developments, such as more aggressive enforcement policies, new laws or discoveries of currently unknown contamination conditions, may also require expenditures that may have a material adverse effect on our business and financial condition.
In addition, increasing efforts to control emissions of GHG are likely to impact our operations. We operate in certain jurisdictions subject
to the Montreal Protocol, which mandates reduced GHG emissions in participating countries, and the EPA’s recent rule establishing mandatory GHG reporting for certain activities may apply to some of our facilities if we exceed the applicable thresholds. The EPA has also announced a regulatory finding relating to GHG emissions that may result in the imposition of GHG air quality standards. Legislation to regulate GHG emissions has periodically been proposed in the U.S. Congress and a growing number of states and foreign countries are taking action to require reductions in GHG emissions. Future GHG emissions limits may require us to incur additional capital and operational expenditures. EPA regulations limiting exhaust emissions also have become more restrictive, and the National Highway Traffic Safety Administration and the EPA have adopted new regulations that govern fuel efficiency and GHG emissions beginning in 2014. Compliance with these and similar regulations could increase
Page 26

the cost of new fleet vehicles and increase our operating expenses. Compliance with future GHG regulations may require expenditures that could materially adversely affect our business, results of operations and financial condition.
We have approximately 10,000 employees world-wide and are subject to a wide range of local, provincial and national laws and
regulations governing the health and safety of workers, including, for example, OSHA in the United States. We can be subject to potential fines and civil and, in egregious cases, criminal actions if we are found to be in violation of worker health and safety laws in any of these jurisdictions. Further, as such laws and regulations change, we may sometimes be required to commit to unplanned capital expenditures in order to continue to comply with workplace safety requirements at our facilities. In addition, we operate and maintain an extensive vehicle fleet to transport products to and from customer locations in all jurisdictions where we have facilities. Our fleets and drivers are subject to federal, state, local and foreign laws and licensing requirements applicable to commercial fleets, their cargo and their hours and methods of operation. Failure to comply with these laws and regulations in any location could materially adversely affect our business, results of operations, financial condition and reputation.
If we experience difficulties or a significant disruption in our information systems or if we fail to implement new systems and software successfully, our business could be materially adversely affected.
We depend on information systems throughout our business to collect and process data that is critical to our operations and accurate
financial reporting. Among other things, these information systems process incoming customer orders and outgoing supplier orders, manage inventory, and allow us to efficiently collect raw materials and distribute products, process and bill shipments to and collect cash from our customers, respond to customer and supplier inquiries, contribute to our overall internal control processes, maintain records of our property, plant and equipment, and record and pay amounts due vendors and other creditors.
If we were to experience a disruption in our information systems that involve interactions with suppliers and customers, it could result in a
loss of raw material supplies, sales and customers and/or increased costs, which could have a material adverse effect on our business, financial condition and results of operations. In addition, any such disruption could adversely affect our ability to meet our financial reporting obligations. We may also encounter difficulties in developing new systems or maintaining and upgrading existing systems. Such difficulties may lead to significant expenses or losses due to unexpected additional costs required to implement or maintain systems, disruption in business operations, loss of sales or profits, or cause us to incur significant costs to reimburse third parties for damages, and, as a result, may have a material adverse effect on our results of operations and financial condition. We could also experience impairment of our reputation if any of these events were to occur.
The Company is in the process of a multi-year project to replace our existing work management, financial and supply chain software
applications with a new suite of systems, including a company-wide enterprise resource planning (“ERP”) system. This multi-year project will be extended to the replacement of Rothsay’s system as part of the process of integrating that system with Darling’s systems. We currently do not intend to replace Darling Ingredients International’s system. The ERP system’s implementation process involves a number of risks that may adversely hinder our business operations and/or affect our financial condition and results of operations, if not implemented successfully. The need to implement this project in connection with the integration of the operations of Rothsay could create additional risks. The ERP system’s implementation is a complex and time-consuming project that involves substantial expenditures for implementation consultants, system hardware, software and implementation activities, as well as the transformation of business and financial processes.
As with any large software project, there are many factors that may materially affect the schedule, cost, execution and implementation of
this project. Those factors include: problems during the design, implementation and testing phases; system delays and/or malfunctions; the risk that suppliers and contractors will not perform as required under their contracts; the diversion of management’s attention from daily operations to the project; re-works due to changes in business processes or financial reporting standards; and other events, some of which are beyond our control. These types of issues could disrupt our business operations and/or our ability to timely and accurately process and report key components of our financial results and and/or complete important business processes such as the evaluation of our internal controls and attestation activities pursuant to Section 404 of the Sarbanes-Oxley Act of 2002. Accordingly, material deviations from the project plan or unsuccessful execution of the plan may adversely affect our business, results of operations and financial condition. Increased information technology security threats and more sophisticated computer crime pose a risk to our systems, networks, products and services.
We rely upon our information systems and networks in connection with a variety of business activities, and we collect and store sensitive
data. Increased security threats to information systems and more sophisticated computer crime pose a risk to the security of our systems and networks and the confidentiality, availability and integrity of our data. A failure of or breach in technology security could expose us and our customers and suppliers to risks of misuse of information or systems, the compromising
Page 27

of confidential information, manipulation and destruction of data, defective products, production downtimes and operating disruptions, which in turn could adversely affect our reputation, competitive position, business and results of operations. In addition, such breaches in security could result in litigation, regulatory action and potential liability and the costs and operational consequences of implementing further data protection measures. Our success is dependent on our key personnel.
Our success depends to a significant extent upon a number of key employees, including members of senior management. The loss of the
services of one or more of these key employees could have a material adverse effect on our results of operations and prospects. We believe that our future success will depend in part on our ability to attract, motivate and retain skilled technical, managerial, marketing and sales personnel. Competition for these types of skilled personnel is intense and there can be no assurance that we will be successful in attracting, motivating and retaining key personnel. The failure to hire and retain such personnel could materially adversely affect our business, results of operations and financial condition. In certain markets we are highly dependent upon a single operating facility and various events beyond our control could cause an interruption in the operation of our facilities, which could adversely affect our business in those markets.
Our facilities are subject to various federal, state, provincial and local environmental and other permitting requirements of the countries in
which we operate, depending on the locations of those facilities. Periodically, these permits may be reviewed and subject to amendment or withdrawal. Applications for an extension or renewal of various permits may be subject to challenge by community and environmental groups and others. In the event of a casualty, condemnation, work stoppage, permitting withdrawal or delay, severe weather event, or other unscheduled shutdown involving one of our facilities, in a majority of our markets we would utilize a nearby operating facility to continue to serve our customers in the affected market. In certain markets, however, we do not have alternate operating facilities. In the event of a casualty, condemnation, work stoppage, permitting withdrawal or delay, severe weather event or other unscheduled shutdown in these markets, we may experience an interruption in our ability to service our customers and to procure raw materials, and potentially an impairment of the value of that facility. Any of these circumstances may materially and adversely affect our business and results of operations in those markets. In addition, after an operating facility affected by a casualty, condemnation, work stoppage, permitting withdrawal or delay or other unscheduled shutdown is restored, there could be no assurance that customers who in the interim choose to use alternative disposal services would return to use our services. We could incur a material weakness in our internal control over financial reporting that would require remediation.
Any future failures to maintain the effectiveness of our disclosure controls and procedures, including our internal control over financial
reporting, could subject us to a loss of public confidence in our internal control over financial reporting and in the integrity of our financial statements and our public filings with the SEC and other governmental agencies and could harm our operating results or cause us to fail to meet our regulatory reporting obligations in a timely manner. The need to integrate the operations of Rothsay and Darling Ingredients International following the Acquisitions could create additional risks to our disclosure controls, including our internal controls over financial reporting. Changes in our tax rates or exposure to additional income tax liabilities could impact our profitability.
We are subject to income taxes in the United States and in various other foreign jurisdictions. Our effective tax rates could be adversely
affected by changes in the mix of earnings by jurisdiction, changes in tax laws or tax rates including potential tax reform in the U.S. to broaden the tax base and reduce deductions or credits, changes in the valuation of deferred tax assets and liabilities, and material adjustments from tax audits. In addition, the amount of income taxes we pay is subject to ongoing audits in various jurisdictions and a material assessment by a governing tax authority could affect our profitability.
An impairment in the carrying value of our goodwill or other intangible assets may have a material adverse effect on our results of operations.
As of January 3, 2015, the Company had approximately $ 1.3 billion of goodwill. We are required to annually test goodwill to determine if impairment has occurred. Additionally, impairment of goodwill must be tested whenever events or changes in circumstances indicate that impairment may have occurred. If the testing performed indicates that impairment has occurred, we are required to record a non-cash impairment charge for the difference between the carrying value of the goodwill and the implied fair value of the goodwill in the period the determination is made. The testing of goodwill for impairment requires us to make significant estimates about our future performance and cash flows, as well as other assumptions. These estimates can be affected by numerous factors, including changes in economic, industry or market conditions, changes in business operations or regulation, or changes in competition. Changes in these factors, or changes in actual performance compared with estimates of our future
Page 28

performance, may affect the fair value of goodwill, which may result in an impairment charge. For example, a deterioration in demand for, or increases in costs for producing, a supplier’s principal products could lead to a reduction in the supplier’s output of raw materials, thus impacting the fair value of a plant processing that raw material. We cannot accurately predict the amount and timing of any impairment of assets. Should the value of goodwill become impaired, there may be a material adverse effect on our results of operations. We may be subject to work stoppages at our operating facilities, which could cause interruptions in the manufacturing or distribution of our products.
While we currently have no international, national or multi-plant union contracts, approximately 23% of Darling’s employees, 24% of
Rothsay’s employees and 36% of Darling Ingredients International’s employees are covered by various collective bargaining agreements. Furthermore, local laws and regulations in certain jurisdictions in which we operate provide for worker groups with prescribed powers and rights with regard to working conditions, wages and similar matters. In jurisdictions where such groups do not exist, labor organizing activities could result in additional employees becoming unionized and higher ongoing labor costs. Darling’s collective bargaining agreements expire at varying times over the next five years, some of which may have already expired and are in the process of being re-negotiated. In contrast, Darling Ingredients International’s collective bargaining agreements generally have one to two year terms. Rothsay agreements generally have terms up to three years. There can be no assurance that we will be able to negotiate the terms of any expiring or expired agreement in a manner acceptable to us. If our workers were to engage in a strike, work stoppage, slowdown or other collective action in the future in any of our locations, we could experience a significant disruption of our operations, which could have a material adverse effect on our business, results of operations and financial condition. We may also be subject to general country strikes or work stoppages unrelated to our business or collective bargaining agreements that could have a direct or indirect adverse effect on our business, results of operation or financial condition. Litigation or regulatory proceedings may materially adversely affect our business, results of operations and financial condition.
We are a party to several lawsuits, claims and loss contingencies arising in the ordinary course of our business, including assertions by
certain regulatory and governmental agencies related to permitting requirements and air, wastewater and storm water discharges from our processing facilities. The outcome of litigation, particularly class action lawsuits, and regulatory proceedings is difficult to assess or quantify. Plaintiffs (including governmental agencies) in these types of lawsuits and proceedings may seek recovery of very large or indeterminate amounts, and the magnitude of the potential loss relating to such lawsuits or proceedings may remain unknown for substantial periods of time. The costs of responding to or defending future litigation or regulatory proceedings may be significant and any future litigation or regulatory proceedings may divert the attention of management away from our strategic objectives. There may also be adverse publicity associated with litigation or regulatory proceedings that may decrease customer confidence in our business, regardless of whether the allegations are valid or whether we are ultimately found liable. As a result, litigation or regulatory proceedings may have a material adverse effect on our business, results of operations and financial condition. For more information related to our litigation and regulatory proceedings, see Item 3. “ Legal Proceedings. ”
Certain U.S. multiemployer defined benefit pension plans to which we contribute are underfunded and these plans and our European pension funds may require minimum funding contributions.
We participate in various U.S. multiemployer pension plans which provide defined benefits to certain employees covered by labor
contracts. These plans are not administered by us and contributions are determined in accordance with provisions of negotiated labor contracts to meet their pension benefit obligations to their participants. Based upon the most currently available information, certain of these multiemployer plans are under-funded due partially to a decline in the value of the assets supporting these plans, a reduction in the number of actively participating members for whom employer contributions are required and the level of benefits provided by the plans. In addition, the U.S. Pension Protection Act, which went into effect in January 2008, requires under-funded pension plans to improve their funding ratios within prescribed intervals based on the level of their under-funding. As a result, our required contributions to these plans may increase in the future. Furthermore, under current law, a termination of, our voluntary withdrawal from or a mass withdrawal of all contributing employers from any underfunded multiemployer defined benefit plan to which we contribute would require us to make payments to the plan for our proportionate share of such multiemployer plan’s unfunded vested liabilities. Also, if a multiemployer defined benefit plan fails to satisfy certain minimum funding requirements, the Internal Revenue Service (“IRS”) may impose a nondeductible excise tax of 5% on the amount of the accumulated funding deficiency for those employers not contributing their allocable share of the minimum funding to the plan. Requirements to pay increased contributions, withdrawal liability and excise taxes could negatively impact our liquidity and results of operations.
Page 29
In the European Union, pension funds are generally subject to the Institution for Occupational Retirement Provision Directive (Directive
2003/41/EC) (the “IORP Directive”) as implemented in the relevant EU Member States. The IORP Directive provides for certain general solvency requirements but allows EU Member States discretion to impose specific national requirements. As a result, the solvency of European Union pension funds are mostly regulated on a national level. The IORP Directive is currently being reformed. In March 2014, the European Commission published a new draft IORP Directive (“IORP Directive II”). The European Commission’s initial proposal for the IORP Directive II included minimum solvency requirements similar to those under the Solvency II Directive (Directive 2009/138/EC) (which is the main legislation for the insurance industry in the European Union and is being implemented). The European Commission subsequently decided to withdraw such requirements and the IORP Directive II, as published, does not make substantive changes to the solvency requirements under the current IORP Directive. The IORP Directive II is currently going through the legislative process at the European Union level. It is difficult to predict, at this stage, what form the final legislation will take and what impact (if any) it will have on the solvency requirements of pension funds. It is possible that the final legislation could require us to comply with increased minimum coverage requirements, which could burden us and negatively impact our liquidity and results of operations. If the number or severity of claims for which we are self-insured increases, if we are required to accrue or pay additional amounts because the claims prove to be more severe than our recorded liabilities, if our insurance premiums increase or if we are unable to obtain insurance at acceptable rates or at all, our financial condition and results of operations may be materially adversely affected.
Our workers compensation, auto and general liability policies contain significant deductibles or self-insured retentions. We develop bi-
yearly and record quarterly an estimate of our projected insurance-related liabilities. We estimate the liabilities associated with the risks retained by us, in part, by considering historical claims experience, demographic and severity factors and other actuarial assumptions. Any actuarial projection of losses is subject to a degree of variability. If the number or severity of claims for which we are self-insured increases, or we are required to accrue or pay additional amounts because the claims prove to be more severe than our original assessments, our financial condition and results of operations may be materially adversely affected. In addition, in the future, our insurance premiums may increase and we may not be able to obtain similar levels of insurance on reasonable terms or at all. Any such inadequacy of, or inability to obtain, insurance coverage could have a material adverse effect on our business, financial condition and results of operations.
We may not successfully identify and complete acquisitions on favorable terms or achieve anticipated synergies relating to any acquisitions, and such acquisitions could result in unforeseen operating difficulties and expenditures and require significant management resources.
We regularly review potential acquisitions of complementary businesses, services or products. However, we may be unable to identify
suitable acquisition candidates in the future. Even if we identify appropriate acquisition candidates, we may be unable to complete or finance such acquisitions on favorable terms, if at all. In addition, the process of integrating an acquired business, service or product into our existing business and operations may result in unforeseen operating difficulties and expenditures. Integration of an acquired company also may require significant management resources that otherwise would be available for ongoing development of our business. Moreover, we may not realize the anticipated benefits of any acquisition or strategic alliance and such transactions may not generate anticipated financial results. Future acquisitions could also require us to incur debt, assume contingent liabilities or amortize expenses related to intangible assets, any of which could harm our business. Terrorist attacks or acts of war may cause damage or disruption to us and our employees, facilities, information systems, security systems, suppliers and customers, which could significantly impact our net sales, costs and expenses and financial condition.
Terrorist attacks, such as those that occurred on September 11, 2001, have contributed to economic instability in the U.S. and in certain
other countries, and further acts of terrorism, bioterrorism, cyberterrorism, violence or war could affect the markets in which we operate, our business operations, our expectations and other forward-looking statements contained in this report. The potential for future terrorist attacks, the U.S. and international responses to terrorist attacks and other acts of war or hostility, including the ongoing conflicts in the Middle East, North Korea and Ukraine, may cause economic and political uncertainties and cause our business to suffer in ways that cannot currently be predicted. Events such as those referred to above could cause or contribute to a general decline in investment valuations. In addition, terrorist attacks, particularly acts of bioterrorism, that directly impact our facilities or those of our suppliers or customers could have an impact on our sales, supply chain, production capability and costs and our ability to deliver our finished products.
Page 30
Our products may infringe upon the intellectual property rights of others, which may cause us to incur unexpected costs or prevent us from selling our products.
We maintain valuable trademarks, service marks, copyrights, trade names, trade secrets, proprietary technologies and similar intellectual
property, and consider our intellectual property to be of material value. We have in the past and may in the future be subject to legal proceedings and claims in the ordinary course of our business, including claims of alleged infringement of patents, trademarks and other intellectual property rights of third parties by us or our customers. Any such claims, whether or not meritorious, could result in costly litigation and divert the efforts of our management. Moreover, should we be found liable for infringement, we may be required to enter into licensing agreements (if available on acceptable terms or at all) or to pay damages and cease making or selling certain products. Any of the foregoing could cause us to incur significant costs and prevent us from manufacturing or selling our products and thereby materially adversely affect our business, results of operations and financial condition.
The healthcare reform legislation in the United States and its implementation regulations could impact the healthcare benefits we are required to provide our employees in the United States and cause our compensation costs to increase, potentially reducing our net income and adversely affecting our cash flows.
In March 2010, the Patient Protection and Affordable Care Act, as amended by the Health Care and Education Affordability Reconciliation Act, were signed into law in the United States. This healthcare reform legislation and its applicable implementing regulations contain provisions that could materially impact our future healthcare costs, including the contributions we are required to make to our benefit plans. While the ultimate impact is not yet known, it is possible that these provisions, once implemented, could significantly increase our U.S. compensation costs, which would reduce our net income and adversely affect our cash flows. Because of our prior acquisitions and future acquisitions we may engage in, our historical operating results may be of limited use in evaluating our historical performance and predicting our future results.
Darling has acquired a number of businesses in recent years, including Rothsay and VION Ingredients, and we expect that we will engage
in acquisitions of other businesses from time to time in the future. The operating results of the acquired businesses are included in our financial statements from the date of the completion of such acquisitions. All of Darling’s acquisitions have been accounted for using the acquisition method of accounting. Use of this method has resulted in a new valuation of the assets and liabilities of the acquired companies. We expect a substantial increase in our depreciation and amortization and reduction in our operating and net income commensurate with such increase. As a result of these acquisitions and any future acquisitions, our historical operating results may be of limited use in evaluating our historical performance and predicting our future results.
We may incur significant charges in the event we close or divest all or part of a manufacturing plant or facility.
We periodically assess our manufacturing operations in order to manufacture and distribute our products in the most efficient manner.
Based on our assessments, we may make capital improvements to modernize certain units, move manufacturing or distribution capabilities from one plant or facility to another plant or facility, discontinue manufacturing or distributing certain products or close or divest all or part of a manufacturing plant or facility. The closure or divestiture of all or part of a manufacturing plant or facility could result in future charges that could be significant.
Risks Related to our Common Stock
The market price of our common stock has been and may continue to be volatile, which could cause the value of your investment to decline.
The market price of our common stock has been subject to volatility and, in the future, the market price of our common stock could
fluctuate widely in response to numerous factors, many of which are beyond our control. Numerous factors, including many over which we have no control, may have a significant impact on the market price of our common stock. In addition to the risk factors discussed in this report, the price and volume volatility of our common stock may be affected by:
Page 31
• actual or anticipated fluctuations in ingredient prices;
• actual or anticipated variations in our operating results;
• our earnings releases and financial performance;
• changes in financial estimates or buy/sell recommendations by securities analysts;

Future sales of our common stock or the issuance of other equity may adversely affect the market price of our common stock.
We are not restricted from issuing additional common stock, including securities that are convertible into or exchangeable for, or that
represent the right to receive, common stock. The issuance of additional shares of our common stock or convertible securities, including our outstanding options, or otherwise, will dilute the ownership interest of our common stockholders.
Sales of a substantial number of shares of our common stock or other equity-related securities in the public market could depress the
market price of our common stock and impair our ability to raise capital through the sale of additional equity securities. We cannot predict the effect that future sales of our common stock or other equity-related securities would have on the market price of our common stock. Our common stock is an equity security and is subordinate to our existing and future indebtedness.
Shares of our common stock are equity interests and do not constitute indebtedness. As such, the shares of common stock will rank junior
to all of our indebtedness, including our trade debt, and to other non-equity claims on us and our assets available to satisfy claims on us, including claims in a bankruptcy, liquidation or similar proceedings. Our existing indebtedness restricts, and future indebtedness may restrict, payment of dividends on the common stock.
Unlike indebtedness, where principal and interest customarily are payable on specified due dates, in the case of common stock, (i)
dividends are payable only when and if declared by our board of directors or a duly authorized committee of the board and (ii) as a corporation, we are restricted under applicable Delaware law to making dividend payments and redemption payments only from legally available assets. Further, under our certificate of incorporation, there are no restrictions on our business or operations or on our ability to incur indebtedness or engage in any transactions arising as to our common stock, subject only to the voting rights available to stockholders generally.
In addition, our rights to participate in the assets of any of our subsidiaries upon any liquidation or reorganization of any subsidiary will be
subject to the prior claims of that subsidiary’s creditors (except to the extent we may ourselves be a creditor of that subsidiary), including that subsidiary’s trade creditors and our creditors who have obtained or may obtain guarantees from the subsidiaries. As a result, our common stock will be subordinated to our and our subsidiaries’ obligations and liabilities, which currently include borrowings and guarantees. See Item 7. " Management Discussion and Analysis of Financial Condition and Results of Operations " - " Senior Secured Credit Facilities " and " 5.375% Senior Notes due 2022 ."
Page 32
• the ongoing integration of Darling Ingredients International and Rothsay, the effect of those acquisitions on our business going forward and our ability to realize growth opportunities as a result therefrom;
• our ability to repay our debt;
• our access to financial and capital markets to refinance our debt;
• performance of our joint venture investments, including the DGD Joint Venture;
• our dividend policy;
• market conditions in the industry and the general state of the securities markets;
• investor perceptions of us and the industry and markets in which we operate;
• governmental legislation or regulation;
• currency and exchange rate fluctuations; and
• general economic and market conditions, such as U.S. or global reactions to economic developments, including regional recessions, currency devaluations or political unrest.

Our ability to pay any dividends on our common stock may be limited and, consequently, your ability to achieve a return on your investment will depend on appreciation in the price of our common stock.
We have not paid any dividends on our common stock since January 3, 1989 and we have no current plans to do so. Our current financing
arrangements permit us to pay cash dividends on our common stock within limitations defined by the terms of our existing indebtedness, including our senior secured credit facility and senior notes due 2022 and any indentures or other financing arrangements that we enter into in the future. For example, our senior secured credit facility restricts our ability to make payments of dividends in cash if certain coverage ratios are not met. Even if such coverage ratios are met in the future, any determination to pay cash dividends on our common stock will be at the discretion of our board of directors and will be based upon our financial condition, operating results, capital requirements, plans for expansion, business opportunities, restrictions imposed by any of our financing arrangements, provisions of applicable law and any other factors that our board of directors determines are relevant at that point in time. The issuance of shares of preferred stock could adversely affect holders of common stock, which may negatively impact your investment.
Our board of directors is authorized to cause us to issue classes or series of preferred stock without any action on the part of our
stockholders. The board of directors also has the power, without stockholder approval, to set the terms of any such classes or series of preferred shares that may be issued, including the designations, preferences, limitations and relative rights senior to the rights of our common stock with respect to dividends or upon the liquidation, dissolution or winding up of our business and other terms. If we issue preferred shares in the future that have a preference over the common stock with respect to the payment of dividends or upon liquidation, dissolution or winding up, or if we issue preferred shares with voting rights that dilute the voting power of the common stock, the rights of holders of the common stock or the market price of the common stock could be adversely affected. As of the date of this prospectus supplement, we have no outstanding shares of preferred stock but we have available for issuance 1,000,000 authorized but unissued shares of preferred stock.
ITEM 1B. UNRESOLVED STAFF COMMENTS
None.
ITEM 2. PROPERTIES
As of January 3, 2015 , the Company's corporate headquarters is located at 251 O’Connor Ridge Boulevard, Suite 300, Irving, Texas, 75038.
As of January 3, 2015 , the Company operates a global network of over 200 locations, including 140 production facilities, across five continents. All of the processing facilities are owned except for 16 leased facilities and the Company owns or leases a network of transfer stations. The following is a listing of a majority of the Company's operating plants as of January 3, 2015 by operating segment with a description of the plants principal process.
Page 33
LOCATION DESCRIPTION Feed Ingredients Segment
Albertville, Alabama, United States Bakery By-Products
Bastrop, Texas, United States Animal By-Products
Bellevue, Nebraska, United States Animal By-Products
Berlin, Wisconsin, United States Animal By-Products
Blue Earth, Minnesota, United States Animal By-Products
Blue Island, Illinois, United States Animal By-Products
Boise, Idaho, United States Animal By-Products
Burgum, Netherlands Animal By-Products
Butler, Kentucky, United States Animal By-Products
Butler, Kentucky, United States Bakery By-Products
Clinton, Iowa, United States Animal By-Products
Coldwater, Michigan, United States Animal By-Products
Collinsville, Oklahoma, United States Animal By-Products
Dallas, Texas, United States Animal By-Products
Dardanelle, Arkansas, United States Animal By-Products
Denver, Colorado, United States Animal By-Products
Des Moines, Iowa, United States Animal By-Products
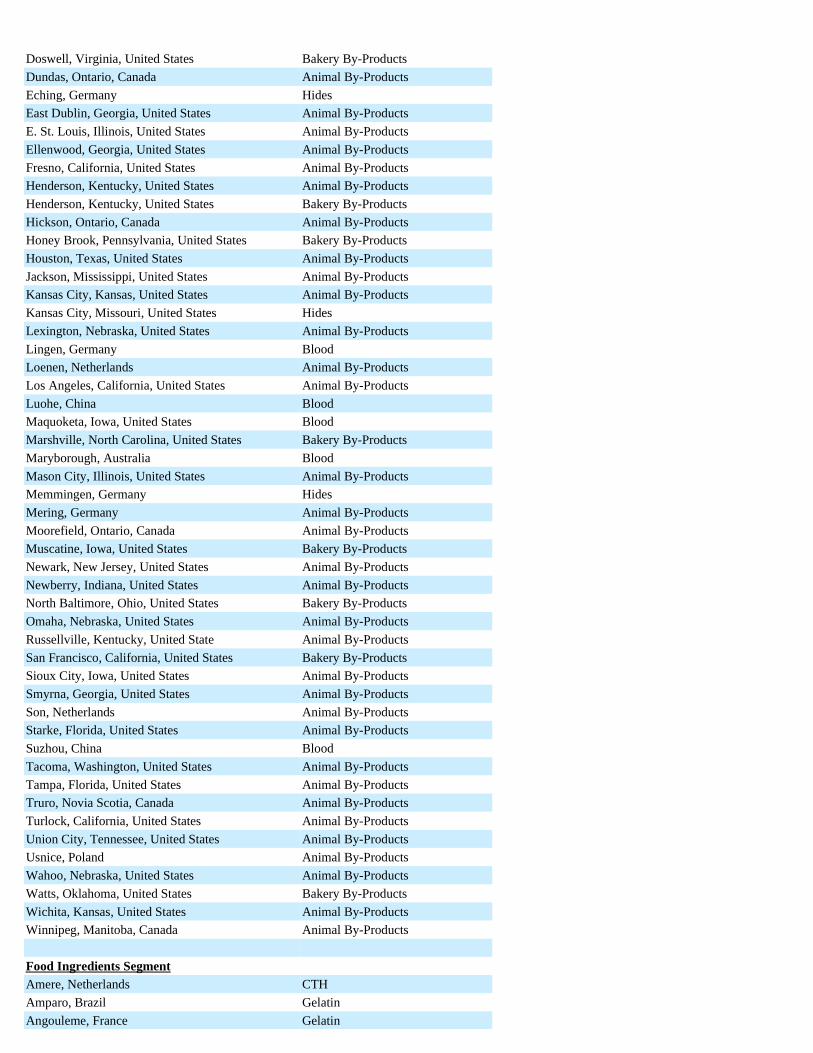
Doswell, Virginia, United States Bakery By-Products
Dundas, Ontario, Canada Animal By-Products
Eching, Germany Hides
East Dublin, Georgia, United States Animal By-Products
E. St. Louis, Illinois, United States Animal By-Products
Ellenwood, Georgia, United States Animal By-Products
Fresno, California, United States Animal By-Products
Henderson, Kentucky, United States Animal By-Products
Henderson, Kentucky, United States Bakery By-Products
Hickson, Ontario, Canada Animal By-Products
Honey Brook, Pennsylvania, United States Bakery By-Products
Houston, Texas, United States Animal By-Products
Jackson, Mississippi, United States Animal By-Products
Kansas City, Kansas, United States Animal By-Products
Kansas City, Missouri, United States Hides
Lexington, Nebraska, United States Animal By-Products
Lingen, Germany Blood
Loenen, Netherlands Animal By-Products
Los Angeles, California, United States Animal By-Products
Luohe, China Blood
Maquoketa, Iowa, United States Blood
Marshville, North Carolina, United States Bakery By-Products
Maryborough, Australia Blood
Mason City, Illinois, United States Animal By-Products
Memmingen, Germany Hides
Mering, Germany Animal By-Products
Moorefield, Ontario, Canada Animal By-Products
Muscatine, Iowa, United States Bakery By-Products
Newark, New Jersey, United States Animal By-Products
Newberry, Indiana, United States Animal By-Products
North Baltimore, Ohio, United States Bakery By-Products
Omaha, Nebraska, United States Animal By-Products
Russellville, Kentucky, United State Animal By-Products
San Francisco, California, United States Bakery By-Products
Sioux City, Iowa, United States Animal By-Products
Smyrna, Georgia, United States Animal By-Products
Son, Netherlands Animal By-Products
Starke, Florida, United States Animal By-Products
Suzhou, China Blood
Tacoma, Washington, United States Animal By-Products
Tampa, Florida, United States Animal By-Products
Truro, Novia Scotia, Canada Animal By-Products
Turlock, California, United States Animal By-Products
Union City, Tennessee, United States Animal By-Products
Usnice, Poland Animal By-Products
Wahoo, Nebraska, United States Animal By-Products
Watts, Oklahoma, United States Bakery By-Products
Wichita, Kansas, United States Animal By-Products
Winnipeg, Manitoba, Canada Animal By-Products
Food Ingredients Segment
Amere, Netherlands CTH
Amparo, Brazil Gelatin
Angouleme, France Gelatin

Page 34
Da'an, China Gelatin
Dubuque, Iowa, United States Gelatin
Eindhoven, Netherlands Fat
Elsholz, Germany Fat
Epolzheim, Germany Fat
Gent, Belgium Gelatin
Girona, Spain Gelatin
Harlingen, Netherlands Fat
Hurlingham, Agrentina Gelatin

Rent expense for our leased properties was $ 6.7 million in the aggregate in fiscal 2014 .
Substantially all assets of the Company are either pledged or mortgaged as collateral for borrowings under our senior secured credit facilities. ITEM 3. LEGAL PROCEEDINGS
The Company is a party to several lawsuits, claims and loss contingencies arising in the ordinary course of its business, including
assertions by certain regulatory and governmental agencies related to permitting requirements and air, wastewater and storm water discharges from the Company's processing facilities.
The Company’s workers compensation, auto and general liability policies contain significant deductibles or self-insured retentions. The Company estimates and accrues its expected ultimate claim costs related to accidents occurring during each fiscal year and carries this accrual as a reserve until these claims are paid by the Company.
As a result of the matters discussed above, the Company has established loss reserves for insurance, environmental and litigation matters. At January 3, 2015 and December 28, 2013 , the reserves for insurance, environmental and litigation contingencies reflected on the balance sheet in accrued expenses and other non-current liabilities were approximately $ 54.9 million and $ 35.5 million , respectively. The Company has insurance recovery receivables of approximately $ 11.4 million and $ 8.8 million as of January 3, 2015 and December 28, 2013 , respectively, related to these liabilities. The Company’s management believes these reserves for contingencies are reasonable and sufficient based upon present governmental regulations and information currently available to management; however, there can be no assurance that final costs related to these matters will not exceed current estimates. The Company believes that the likelihood is remote that any additional liability from these lawsuits and claims that may not be covered by insurance would have a material effect on the Company's financial position, results of operations or cash flows.
Lower Passaic River Area . In December 2009, the Company, along with numerous other entities, received notice from the United States
Environmental Protection Agency ("EPA") that the Company (as successor-in-interest to Standard Tallow Company) is considered a potentially responsible party with respect to alleged contamination in the lower Passaic River area which is part of the Diamond Alkali Superfund Site located in Newark, New Jersey. The Company’s designation as a potentially responsible party is based upon the operation of a former plant site located in Newark, New Jersey by Standard Tallow Company, an entity that the Company acquired in 1996. In the letter, EPA requested that the Company join a group of other parties in funding a remedial investigation and feasibility study at the site. As of the date of this report, the Company has not agreed to participate in the funding group. The Company's ultimate liability for investigatory costs, remedial costs and/or natural resource damages in connection with the lower Passaic River area cannot be determined at this time; however, as of the date of this report, there is nothing that leads the Company to believe that this matter will have a material effect on the Company's financial position, results of operations or cash flows.
Fresno Facility Permit Issue. The Company has been named as a defendant and a real party in interest in a lawsuit filed on April 9, 2012 in the Superior Court of the State of California, Fresno County, styled Concerned Citizens of West Fresno vs. Darling International Inc. The complaint, as subsequently amended, alleges that the Company's Fresno facility is operating without a proper use permit and seeks, among other things, injunctive relief. The complaint had at one time also alleged that the Company's Fresno facility constitutes a continuing private and public
Ilse-Sur-La-Sorgue, France Gelatin
Kaiping, China Gelatin
Peabody, Massachusetts, United States Gelatin
President Epitacio, Brazil Gelatin
Stoke-on Trent, United Kingdom Bone
Versmold, Germany Fat
Vuren, Netherlands Bone
Wenzhou, China Gelatin
Zheijong, China Gelatin
Fuel Ingredients Segment
Belm-Icker, Germany Bioenergy
Butler, Kentucky, United States Biodiesel
Denderleeuw, Belgium Bioenergy
Jagel, Germany Bioenergy
Rotenburg, Germany Bioenergy
Saint-Catherine, Quebec Canada Biodiesel
Son, Netherlands Bioenergy

nuisance, but the plaintiff has since amended the complaint to drop these allegations. The City of Fresno was also named as a defendant in the original complaint but has since had a judgment entered in its favor and is no longer a defendant in the lawsuit; however, in December 2013 the City of Fresno filed a motion to intervene as a plaintiff in this matter. The Superior Court heard the motion on February 4, 2014, and entered an order on February 18, 2014 denying the motion. Rendering operations have been conducted on the site since 1955, and the Company believes that it possesses all of the required federal, state and local permits to continue to operate the facility in the manner currently conducted and that its operations do not constitute a private or public nuisance. Accordingly, the Company intends to defend itself vigorously in this matter. Discovery has begun and this matter was scheduled for trial in July 2014; however, the parties have agreed to stay the litigation while they participate in a mediation process. While management cannot predict the ultimate outcome of this matter, management does not believe the outcome will have a material effect on the Company's financial condition, results of operations or cash flows.
The Company is engaged in other legal proceedings from time to time. The proceedings described above and such other proceedings can
be complex and take many months, or even years, to reach resolution, with the final outcome being dependent upon a number of variables, some of which are not within the control of the Company. Therefore, although the Company will vigorously defend itself in each of the described actions, the ultimate resolution and potential financial impact on the Company is uncertain. ITEM 4. MINE SAFETY DISCLOSURES
Not applicable.
Page 35

PART II ITEM 5. MARKET FOR REGISTRANT'S COMMON EQUITY, RELA TED STOCKHOLDER MATTERS AND ISSUER PURCHASES OF EQUITY SECURITIES
The Company’s common stock is traded on the New York Stock Exchange ("NYSE") under the symbol "DAR". The following table sets forth, for the quarters indicated, the high and low closing sales prices per share for the Company's common stock as reported on the NYSE.
On February 25, 2015, the closing sales price of the Company's common stock on the NYSE was $ 17.49 . The Company has been
notified by its stock transfer agent that as of February 25, 2015, there were 154 holders of record of the common stock.
The Company has not paid any dividends on its common stock since January 3, 1989 and does not expect to pay cash dividends in 2015 . The agreements underlying the Company's senior secured credit facilities and senior notes permit the Company to pay cash dividends on its common stock within limitations defined in such agreements. Any future determination to pay cash dividends on the Company’s common stock will be at the discretion of the Company’s board of directors and will be based upon the Company’s financial condition, operating results, capital requirements, plans for expansion, restrictions imposed by any existing or future financing arrangements, and any other factors that the board of directors determines are relevant.
Set forth below is a line graph comparing the change in the cumulative total stockholder return on the Company's common stock with the cumulative total return of the Russell 2000 Index, the Dow Jones US Waste and Disposal Service Index, and the Agri-Equities Index - Tier One for the period from January 2, 2010 to January 3, 2015, assuming the investment of $100 on January 2, 2010 and the reinvestment of dividends.
The stock price performance shown on the following graph only reflects the change in the Company's stock price relative to the noted
indices and is not necessarily indicative of future price performance.
Market Price
Fiscal Quarter High Low
2014:
First Quarter $ 21.13 $ 19.15
Second Quarter $ 21.27 $ 19.19
Third Quarter $ 20.99 $ 18.42
Fourth Quarter $ 19.09 $ 16.75
2013:
First Quarter $ 18.73 $ 16.04
Second Quarter $ 19.85 $ 16.53
Third Quarter $ 21.46 $ 19.06
Fourth Quarter $ 23.84 $ 19.29

EQUITY COMPENSATION PLANS
The following table sets forth certain information as of January 3, 2015 , with respect to the Company's equity compensation plans (including individual compensation arrangements) under which the Company's equity securities are authorized for issuance, aggregated by (i) all compensation plans previously approved by the Company's security holders, and (ii) all compensation plans not previously approved by the Company's security holders. The table includes:

Page 36
• the number of securities to be issued upon the exercise of outstanding options and granted non-vested stock;
• the weighted-average exercise price of the outstanding options and granted non-vested stock; and
• the number of securities that remain available for future issuance under the plans.
Plan Category
(a) Number of securities
to be issued upon exercise of outstanding
options, warrants and rights
(b) Weighted-average exercise price of
outstanding options, warrants
and rights
(c) Number of securities remaining available for future issuance
under equity compensation plans (excluding securities
reflected in column (a))
Equity compensation plans approved by security holders 1,495,354 (1) $17.60 8,829,332
Equity compensation plans not approved by security holders
–
–
–
Total 1,495,354 $17.60 8,829,332
(1) Includes shares underlying options that have been issued and granted non-vested stock pursuant to the Company’s 2012 Omnibus Incentive Plan (the “2012 Plan”) as approved by the Company’s stockholders. See Note 13 of Notes to Consolidated Financial Statements for information regarding the material features of the 2012 Plan.

ITEM 6. SELECTED FINANCIAL DATA
SELECTED HISTORICAL CONSOLIDATED FINANCIAL DATA
The following table presents selected consolidated historical financial data for the periods indicated. The selected historical consolidated
financial data set forth below should be read in conjunction with “Management’s Discussion and Analysis of Financial Condition and Results of Operations” and the Consolidated Financial Statements of the Company for the three years ended January 3, 2015 , December 28, 2013 , and December 29, 2012 , and the related notes thereto.
Page 37
Fiscal 2014 Fiscal 2013 Fiscal 2012 Fiscal 2011 Fiscal 2010
Fifty-three Fifty-two Fifty-two Fifty-two Fifty-two
Weeks Ended Weeks Ended Weeks Ended Weeks Ended Weeks Ended
January 3, December 28, December 29, December 31, January 1,
2015 (l) 2013 (k) 2012 (j) 2011 2011 (i)
(dollars in thousands, except per share data)
Statement of Operations Data:
Net sales (m) $ 3,956,443 $ 1,802,268 $ 1,772,552 $ 1,797,249 $ 724,909 Cost of sales and operating expenses (a), (m) 3,123,171 1,339,819 1,303,727 1,268,221 531,699 Selling, general and administrative expenses 374,580 170,825 151,713 136,135 68,042 Depreciation and amortization 269,517 98,787 85,371 78,909 31,908
Acquisition and integration costs 24,667 23,271 — — 10,798 Operating income 164,508 169,566 231,741 313,984 82,462 Interest expense (b) 135,416 38,108 24,054 37,163 8,737 Foreign currency (gain)/loss (f) 13,548 (28,107 ) — — — Other (income)/expense, net, (c), (d), (e) (299 ) 3,547 (1,760 ) 2,955 3,382 Equity in net (income)/loss of unconsolidated subsidiary (65,609 ) (7,660 ) 2,662 1,572 — Income from continuing operations before income taxes 81,452 163,678 206,785 272,294 70,343 Income tax expense 13,141 54,711 76,015 102,876 26,100 Net Income $ 68,311 $ 108,967 $ 130,770 $ 169,418 $ 44,243 Net Income attributable to minority interests (4,096 ) — — — — Net Income attributable to Darling $ 64,215 $ 108,967 $ 130,770 $ 169,418 $ 44,243 Basic earnings per common share $ 0.39 $ 0.91 $ 1.11 $ 1.47 $ 0.53 Diluted earnings per common share $ 0.39 $ 0.91 $ 1.11 $ 1.47 $ 0.53 Weighted average shares outstanding 164,627 119,526 117,592 114,924 82,854 Diluted weighted average shares outstanding 165,059 119,924 118,089 115,525 83,243
Other Financial Data: Adjusted EBITDA (a), (g) $ 434,025 $ 268,353 $ 317,112 $ 392,893 $ 114,370 Depreciation 185,955 66,691 57,305 50,891 26,328 Amortization 83,562 32,096 28,066 28,018 5,580 Capital expenditures (h) 228,918 118,307 115,413 60,153 24,720
Balance Sheet Data: Working capital $ 569,570 $ 950,698 $ 158,578 $ 92,423 $ 30,756 Total assets 5,170,713 3,244,133 1,552,416 1,417,030 1,382,258 Current portion of long-term debt 54,401 19,888 82 10 3,009 Total long-term debt less current portion 2,098,039 866,947 250,142 280,020 707,030 Stockholders’ equity attributable to Darling 1,952,990 2,020,952 1,062,436 920,375 464,296
(a) Included in fiscal 2014 are non-cash charges for the step-up of inventory acquired in the VION Acquisition of approximately $49.8 million. Additionally, fiscal 2011 and fiscal 2010 includes certain immaterial amounts that have been reclassified to conform to fiscal 2012 through fiscal 2014 presentation.
(b) Included in interest expense for fiscal 2014 is a redemption premium and a write-off of deferred loan costs of approximately $ 27.3 million and $ 4.3 million , respectively. Included in interest expense for fiscal 2013 is approximately $ 13.0 million for bank financing fees from an unutilized bridge facility. Fiscal 2012 includes the write-off of approximately $ 0.7 million in deferred loan costs as a result of the final payoff on the term loan portion of the Company's previous secured credit facilities. Included in interest expense for fiscal 2011 is approximately $ 4.9 million in deferred loan costs that were written off due to early payoff of a portion of a term loan from the Company's previous secured credit facilities and in fiscal 2010 is approximately $ 3.1 million for bank financing fees paid from a previous acquisition.

Reconciliation of Net Income to Adjusted EBITDA
Page 38
(c) Included in other (income)/expense in fiscal 2010 is a write-off of deferred loan costs of approximately $ 0.9 million for the early termination of a previous senior credit agreement.
(d) Included in other (income)/expense in fiscal 2010 is a write-off of property for fire and casualty losses of approximately $ 1.0 million for losses incurred in plant fires at two plant locations.
(e) Included in other (income)/expense in fiscal 2012 are gain contingencies from insurance proceeds from fiscal 2012 and fiscal 2010 fire and casualty losses of approximately $ 4.7 million .
(f) Included in fiscal 2014 and fiscal 2013, the Company recorded a loss of approximately $ 12.6 million and a gain of approximately $ 27.5 million , respectively on foreign currency exchange forward hedge contracts .
(g) Adjusted EBITDA is presented here not as an alternative to net income, but rather as a measure of the Company’s operating performance and is not intended to be a presentation in accordance with U.S. generally accepted accounting principles ("GAAP"). Since EBITDA is not calculated identically by all companies, the presentation in this report may not be comparable to those disclosed by other companies. Adjusted EBITDA is calculated below and represents, for any relevant period, net income/(loss) plus depreciation and amortization, goodwill and long-lived asset impairment, interest expense, (income)/loss from discontinued operations, net of tax, income tax provision, other income/(expense) and equity in net loss of unconsolidated subsidiary. The Company believes adjusted EBITDA is a useful measure for investors because it is frequently used by securities analysts, investors and other interested parties in the evaluation of companies in the Company's industry. In addition, management believes that adjusted EBITDA is useful in evaluating the Company's operating performance compared to that of other companies in the food ingredients and agriculture industries because the calculation of adjusted EBITDA generally eliminates the effects of financing, income taxes and certain non-cash and other items that may vary for different companies for reasons unrelated to overall operating performance. As a result, the Company’s management uses adjusted EBITDA as a measure to evaluate performance and for other discretionary purposes. However, adjusted EBITDA is not a recognized measurement under GAAP, should not be considered as an alternative to net income as a measure of operating results or to cash flow as a measure of liquidity, and is not intended to be a presentation in accordance with GAAP. Also, since adjusted EBITDA is not calculated identically by all companies, the presentation in this report may not be comparable to those disclosed by other companies. In addition to the foregoing, management also uses or will use adjusted EBITDA to measure compliance with certain financial covenants under the Company’s senior secured credit facilities and senior unsecured notes that were outstanding at January 3, 2015. The amounts shown below for adjusted EBITDA differ from the amounts calculated under similarly titled definitions in the Company’s Senior Secured Credit Facilities and Senior Unsecured Notes, as those definitions permit further adjustments to reflect certain other non-cash charges.
(dollars in thousands)
January 3, 2015
December 28, 2013
December 29, 2012
December 31, 2011
January 1, 2011
Net income attributable to Darling $ 64,215 $ 108,967 $ 130,770 $ 169,418 $ 44,243 Depreciation and amortization 269,517 98,787 85,371 78,909 31,908 Interest expense 135,416 38,108 24,054 37,163 8,737 Income tax expense 13,141 54,711 76,015 102,876 26,100 Other, net 13,249 (24,560 ) (1,760 ) 2,955 3,382 Equity in net (income)/loss of
unconsolidated subsidiaries (65,609 ) (7,660 ) 2,662 1,572 — Net income attributable to noncontrolling
interests 4,096 — — — —
Adjusted EBITDA $ 434,025 $ 268,353 $ 317,112 $ 392,893 $ 114,370
(h) Fiscal 2014 excludes the capital assets acquired as part of the VION Acquisition and the Custom Blenders acquisition of approximately $ 984.2 million . Excludes the capital assets acquired in the Terra Holding Company, a Delaware corporation, and its wholly owned subsidiaries, Terra Renewal Services, Inc., an Arkansas corporation ("TRS"), and EV Acquisition, Inc., an Arkansas corporation (the "Terra Transaction") and the Rothsay Acquisition in fiscal 2013 of approximately $ 167.0 million . Excludes the capital assets acquired as part of the RVO BioPur, LLC acquisition in fiscal 2012 of approximately $ 0.6 million . Finally, excludes the capital assets acquired as part of the merger of Griffin Industries, Inc. (together with its subsidiaries "Griffin") and from Nebraska By-Products, Inc. of approximately $ 243.7 million in fiscal 2010 .
(i) Subsequent to the date of acquisition, fiscal 2010 includes 2 weeks of contribution from the Griffin Industries, Inc. assets and 31 weeks of contribution from the assets of Nebraska By-Products, Inc.
(j) Subsequent to the date of acquisition, fiscal 2012 includes 29 weeks of contribution from the RVO BioPur, LLC assets.
(k) Subsequent to the date of acquisition, fiscal 2013 includes 18 weeks of contribution from the TRS assets and 9 weeks of contribution from the assets of Rothsay.
(l) Subsequent to the date of acquisition, fiscal 2014 includes 52 weeks of contribution and 14 weeks of contribution from the VION Acquisition and the Custom Blenders acquisition, respectively.
(m) Includes certain reclassifications from net sales to cost of sales and operating expenses of approximately $ 78.7 million and $ 71.1 million in fiscal 2013 and fiscal 2012, respectively to conform to current year presentation.

ITEM 7. MANAGEMENT'S DISCUSSION AND ANALYSIS OF FI NANCIAL CONDITION AND RESULTS OF OPERATIONS
The following Management's Discussion and Analysis of Financial Condition and Results of Operations contains forward-looking statements that involve risks and uncertainties. The Company's actual results could differ materially from those anticipated in these forward-looking statements as a result of certain factors, including those set forth below under the heading "Forward Looking Statements" and in Item 1A of this report under the heading "Risk Factors."
The following discussion should be read in conjunction with the historical consolidated financial statements and notes thereto included in
Item 8. Commencing with the first quarter of 2014, the Company's business operations were reorganized into three new reportable operating segments: Feed Ingredients, Food Ingredients and Fuel Ingredients. This change was necessitated by the VION Acquisition and aligns the Company's operations based on the products and services offered to various end markets. Comparative segment revenues and related financial information are discussed herein and are presented in Note 20 to the Consolidated Financial Statements.
Fiscal 2014 Overview
The Company is a global developer and producer of sustainable natural ingredients from edible and inedible bio-nutrients, creating a wide
range of ingredients and customized specialty solutions for customers in the pharmaceutical, food, pet food, feed, technical, fuel, bioenergy and fertilizer industries. With operations on five continents, the Company collects and transforms all aspects of animal by-product streams into useable and specialty ingredients, such as gelatin, edible fats, feed-grade fats, animal proteins and meals, plasma, pet food ingredients, organic fertilizers, yellow grease, fuel feedstocks, green energy, natural casings and hides. The Company also recovers and converts used cooking oil and commercial bakery residuals into valuable feed and fuel ingredients. In addition, the Company provides grease trap services to food service establishments, environmental services to food processors and sells restaurant cooking oil delivery and collection equipment.
On January 7, 2014, we acquired the VION Ingredients business division (“VION Ingredients”) of VION Holding, N.V., a Dutch limited
liability company (“VION”), by purchasing all of the shares of VION Ingredients International (Holding) B.V., and VION Ingredients Germany GmbH, and 60% of Best Hides GmbH (collectively, the "VION Companies"), pursuant to a Sale and Purchase Agreement dated October 5, 2013, as amended, between Darling and VION (the “VION Acquisition”), as described in Notes 1 and 2 to the Company’s Consolidated Financial Statements for the period ended January 3, 2015 included herein. The VION Ingredients business is now conducted under the name Darling Ingredients International. In addition, on October 28, 2013, we completed the acquisition of substantially all of the assets of Rothsay ("Rothsay"), a division of Maple Leaf Foods, Inc. ("MFI"), a Canadian corporation, pursuant to an Acquisition Agreement between MFI and Darling dated August 23, 2013 (the "Rothsay Acquisition"), as described in Notes 1 and 2 to the Company’s Consolidated Financial Statements for the period ended January 3, 2015 included herein. Prior to the VION Acquisition and the Rothsay Acquisition (together, the "Acquisitions"), the Company had no material foreign operations. As a result of the Acquisition's, the Company’s business is now conducted through a global network of over 200 locations across five continents.
Commencing with the first quarter of 2014, the Company's business operations were reorganized into three new reportable operating
segments: Feed Ingredients, Food Ingredients and Fuel Ingredients. This change was necessitated by the VION Acquisition and aligns the Company's operations based on the products and services offered to various end markets; however, none of the Company's historical operations fall within the Food Ingredients operating segment and therefore, there is no comparable financial information for the Food Ingredients operating segment for prior years. As a result, fiscal 2014 operations are not comparable to fiscal 2013 and fiscal 2012.
The Feed Ingredients operating segment includes the Company's global activities related to (i) the collection and processing of beef,
poultry and pork animal by-products in North America and Europe into non-food grade oils and protein meals, (ii) the collection and processing of bakery residuals in North America into Cookie Meal®, which is predominantly used in poultry and swine rations, (iii) the collection and processing of used cooking oil in North America into non-food grade fats, as well as the production and sale of a variety of cooking oil collection delivery systems, (iv) the collection and processing of bovine, porcine and ovine blood in China, Europe and North America into blood plasma powder and hemoglobin, (v) the processing of cattle hides and hog skins in North American and Europe, (vi) the production of organic fertilizers using protein produced from the Company’s animal by-products processing activities in North America and Europe, and (vii) grease trap services to food service establishments and environmental services to food processors. Non-food grade oils and fats produced and marketed by the Company are principally sold to third parties to be used as ingredients in animal feed and pet food, as an ingredient for the production of biodiesel and renewable diesel, or to the oleo-chemical industry to be used as an ingredient in a wide variety of industrial applications. Protein meals produced and marketed by the Company are sold to third parties to be used as ingredients in animal feed, pet food and
Page 39

aquaculture. Blood plasma powder and hemoglobin produced and marketed by the Company are sold to third parties to be used as ingredients in animal feed, pet food and aquaculture.
The Food Ingredients operating segment includes the Company's global activities related to (i) the collection and processing of beef and
pork bone chips, beef hides, pig skins, and fish skins into gelatin and hydrolyzed collagen in Europe, China, South America and North America, (ii) collection and processing of porcine and ovine intestines into natural casings in Europe, China and North America, (iii) the extraction and processing of porcine mucosa into crude heparin in Europe, (iv) the collection and refining of animal fat into food grade fat in Europe, and (v) the processing of bones to bone chips for the gelatin industry and bone ash. Gelatins produced and marketed by the Company are sold to third parties to be used as ingredients in the pharmaceutical, nutriceutical, food, and technical (i.e, photographic) industries. Natural casings produced and marketed by the Company are sold to third parties to be used as an ingredient in the production of sausages and other similar food products.
The Fuel Ingredients operating segment includes the Company's global activities related to (i) the conversion of animal fats and recycled
greases into biodiesel in North America, (ii) the conversion of organic sludge and food waste into biogas in Europe, (iii) the collection and conversion of fallen stock and certain animal by-products pursuant to applicable E.U. regulations into low-grade energy sources to be used in industrial applications, (iv) commencing in the second quarter of 2014, the processing of manure into natural bio-phosphate in Europe, and (v) the Company’s share of the results of its equity investment in Diamond Green Diesel Holdings LLC, a joint venture with Valero Energy Corporation ("Valero") to convert animal fats, recycled greases, used cooking oil, inedible corn oil, soybean oil, or other feedstocks that become economically and commercially viable into renewable diesel (the “DGD Joint Venture”) as described in Note 7 to the Company's Consolidated Financial Statement for the period ended January 3, 2015 included herein.
Corporate Activities principally includes unallocated corporate overhead expenses, acquisition-related expenses, interest expense net of
interest income, and other non-operating income and expenses.
Operating Performance Indicators
The Company is exposed to certain risks associated with a business that is influenced by agricultural-based commodities. These risks are further described in Item 1A of this report under the heading "Risk Factors."
The Company’s Feed Ingredients segment animal by-products, bakery residuals, used cooking oil recovery, and blood operations are each influenced by prices for agricultural-based alternative ingredients such as corn, soybean oil, soybean meal, and palm oil. In these operations, the costs of the Company's raw materials change with, or in certain cases are indexed to, the selling price or the anticipated selling price of the finished goods produced from the acquired raw materials and/or in some cases, the price spread between various types of finished products. The Company believes that this methodology of procuring raw materials generally establishes a relatively stable gross margin upon the acquisition of the raw material. Although the costs of raw materials for the Feed Ingredients segment are generally based upon actual or anticipated finished goods selling prices, rapid and material changes in finished goods prices, including competing agricultural-based alternative ingredients, generally have an immediate and often times, material impact on the Company’s gross margin and profitability resulting from the lag effect or lapse of time from the procurement of the raw materials until they are processed and the finished goods sold. In addition, the amount of raw material volume acquired, which has a direct impact on the amount of finished goods produced, can also have a material effect on the gross margin reported, as the Company has a substantial amount of fixed operating costs.
The prices available for the Company’s Food Ingredients segment gelatin and natural casings products are influenced by other competing ingredients including plant-based and synthetic hydrocolloids and artificial casings. In the gelatin operation, in particular, the cost of the Company's animal-based raw material moves in relationship to the selling price of the finished goods. The processing time for gelatin and casings is generally 30 to 60 days, which is substantially longer than the Company's animal by-products operations. Consequently, the Company’s gross margin and profitability in this segment can be influenced by the movement of finished goods prices from the time the raw materials were procured until the finished goods are sold.
The reporting currency for the Company's financial statements is the U.S. dollar. The Company operates in over 15 countries and therefore, certain of the Company's assets, liabilities, revenues and expenses are denominated in functional currencies other than the U.S. dollar, primarily in the euro, Brazilian real, Chinese renminbi, Canadian dollar, Argentine peso, Japanese yen and Polish zloty. To prepare the Company's consolidated financial statements the Company must translate those assets, liabilities, revenues, and expenses into U.S. dollars at the applicable exchange rate. As a result, increases or decreases in the value of the U.S. dollar against these other currencies will affect the amount of these items recorded in the Company's consolidated financial statements, even if their value has not changed in the functional currency. This could have a significant impact on the Company's results, if such increase or decrease in the value of the U.S. dollar relative to these other currencies is substantial.
Page 40

The Company monitors the performance of its business segments using key financial metrics such as segment operating income, metric
tons of raw material processed, gross margin percentage, foreign currency, and Adjusted EBITDA. The Company’s operating results can vary significantly due to changes in factors such as the fluctuation in energy prices, weather conditions, crop harvests, government policies and programs, changes in global demand, changes in standards of living, protein consumption, and global production of competing ingredients. Due to these unpredictable factors that are beyond the control of the Company, the Company does not provide forward-looking financial or operational estimates.
Fiscal Year Ended January 3, 2015 Compared to Fiscal Year Ended December 28, 2013
Fiscal 2014 includes an additional week of operations which occurs every five to six years. In fiscal 2014 the additional week increased net sales and operating income by approximately $71 million and $3 million, respectively.
As a result of the VION Acquisition and the Rothsay Acquisition, the Company's results for the twelve months of fiscal 2014 include 52 weeks of operations from the VION Acquisition and 53 weeks from the Rothsay Acquisition, as compared to no operations from the VION Acquisition and 9 weeks from the Rothsay Acquisition in the twelve months of fiscal 2013. Net income attributable to Darling for the fiscal year ended January 3, 2015 was $64.2 million, or $0.39 per diluted share, as compared to net income of $109.0 million, or $0.91 per diluted share, for the fiscal year ended December 28, 2013. The results for the fiscal years of fiscal 2014 and 2013, respectively, include the following after-tax costs:
Fiscal 2014
Fiscal 2013
Without the inventory step-up cost, the redemption premium and deferred loan write-off associated with the 8.5% Senior Notes, the
acquisition and integration costs and the euro forward contract hedge, net income and diluted earnings per common share would have been $144.3 million and $0.88 per diluted share, respectively, for the fiscal year ended January 3, 2015, as compared to $115.4 million and $0.97 per share, respectively, for the fiscal year ended December 28, 2013.
Segment operating income for the fiscal year ended January 3, 2015 was $164.5 million, which reflects a decline of $5.1 million, or 3.0%,
as compared to the fiscal year ended December 28, 2013. The results for fiscal year 2014 include an increase to cost of sales of $49.8 million related to the inventory step-up associated with the required purchase accounting for the VION Acquisition. Without these costs, segment operating income for fiscal year 2014 would have been $214.3 million, or 26.4% higher than the same period in 2013. Including the Company’s share of net income of unconsolidated subsidiaries, primarily the DGD Joint Venture, segment income for the year ended January 3, 2015 would have been $279.9 million, or $102.6 million (57.9%) higher than the same period in 2013. The DGD Joint Venture has not yet distributed any earnings to its venture partners.
Page 41
• $31.3 million ($0.19 per diluted share) related to a non-cash inventory step-up associated with the required purchase accounting for the VION Acquisition related to the portion of acquired inventory sold during the period;
• $19.9 million ($0.12 per diluted share) related to the redemption premium and write-off of deferred loan costs associated with the retirement of the Company’s 8.5% Senior Notes on February 7, 2014;
• $21.0 million ($0.13 per diluted share) associated with the acquisition and integration of Rothsay and VION Ingredients during the period; and
• $7.9 million ($0.05 per diluted share) related to certain euro forward contracts entered into to hedge against foreign exchange risks related to the closing of the VION Acquisition.
• $15.3 million ($0.13 per diluted share) associated with the acquisition costs of the Rothsay Acquisition, the acquisition costs related to the acquired shares of Terra Holding Company, a Delaware corporation, and its wholly owned subsidiaries, Terra Renewal Services, Inc., an Arkansas corporation ("TRS"), and EV Acquisition, Inc., an Arkansas corporation (the "Terra Transaction") and the incurred costs related to the VION Acquisition during the period;
• $8.0 million ($0.07 per diluted share) related to an unused bridge financing facility commitment associated with the VION Acquisition; and
• $(16.9) million ($0.14 per diluted share) related to an unrealized gain on certain euro forward contracts entered into to hedge against foreign exchange risks related to the closing of the VION Acquisition.

Non-U.S. GAAP Measures
Adjusted EBITDA is presented here not as an alternative to net income, but rather as a measure of the Company’s operating performance
and is not intended to be a presentation in accordance with GAAP. Since EBITDA (generally, net income plus interest expenses, taxes, depreciation and amortization) is not calculated identically by all companies, the presentation in this report may not be comparable to EBITDA or adjusted EBITDA presentations disclosed by other companies. Adjusted EBITDA is calculated below and represents, for any relevant period, net income/(loss) plus depreciation and amortization, goodwill and long-lived asset impairment, interest expense, (income)/loss from discontinued operations, net of tax, income tax provision, other income/(expense) and equity in net loss of unconsolidated subsidiary. Management believes that Adjusted EBITDA is useful in evaluating the Company's operating performance compared to that of other companies in its industry because the calculation of Adjusted EBITDA generally eliminates the effects of financing, income taxes and certain non-cash and other items that may vary for different companies for reasons unrelated to overall operating performance.
As a result, the Company’s management uses Adjusted EBITDA as a measure to evaluate performance and for other discretionary
purposes. However, Adjusted EBITDA is not a recognized measurement under GAAP, should not be considered as an alternative to net income as a measure of operating results or to cash flow as a measure of liquidity, and is not intended to be a presentation in accordance with GAAP. In addition to the foregoing, management also uses or will use Adjusted EBITDA to measure compliance with certain financial covenants under the Company’s Senior Secured Credit Facilities and 5.375% Notes that were outstanding at January 3, 2015. However, the amounts shown below for Adjusted EBITDA differ from the amounts calculated under similarly titled definitions in the Company’s Senior Secured Credit Facilities and 5.375% Notes, as those definitions permit further adjustments to reflect certain other non-recurring costs and non-cash charges.
In addition, the Company's management used adjusted diluted earning per share as a measure of earnings due to the significant merger and
acquisition activity of the Company. However, adjusted earnings per share is not a recognized measurement under GAAP, should not be considered as an alternative to diluted earnings per share presented in accordance with GAAP. Adjusted diluted earnings per share, is defined as adjusted net income attributable to Darling divided by the weighted average shares of diluted common stock. Adjusted net income attributable to Darling is defined as a reconciliation of net income attributable to Darling, net of tax (i) adjusted for net of tax acquisition and integration costs related to merger and acquisitions, (ii) net of tax amortization of acquisition related intangibles and (iii) net of tax certain non-recurring items that are not part of normal operations. This measure is solely for the purpose of calculating adjusted diluted earnings per share and is not intended to be a substitute or presentation in accordance with GAAP. Reconciliation of Net Income to (Non-GAAP) Adjusted EBITDA and (Non-GAAP) Pro Forma Adjusted EBITDA
(1) January 7, 2014 closed on VION Ingredients, thus the 13th week would be EBITDA adjusted for January 1, 2014 through January 7, 2014. (2) Darling's pro forma adjusted EBITDA (Non-GAAP) in the above table does not include the DGD Joint Venture adjusted EBITDA (Darling's share) if
we had consolidated the DGD Joint Venture.
Page 42
Fiscal Year Ended
(dollars in thousands) January 3,
2015 December 28,
2013
Net income attributable to Darling $ 64,215 $ 108,967 Depreciation and amortization 269,517 98,787 Interest expense 135,416 38,108 Income tax expense/(benefit) 13,141 54,711 Foreign currency loss/(gain) 13,548 (28,107 )
Other expense/(income), net (299 ) 3,547 Equity in net (income)/loss of unconsolidated subsidiaries (65,609 ) (7,660 )
Net (loss)/income attributable to noncontrolling interests 4,096 —
Adjusted EBITDA (Non-GAAP) $ 434,025 $ 268,353
Non-cash inventory step-up associated with VION Acquisition 49,803 — Acquisition and integration-related expenses 24,667 23,271 Darling Ingredients International - 13th week (1) 4,100 —
Pro forma Adjusted EBITDA (Non-GAAP) $ 512,595 $ 291,624
DGD Joint Venture Adjusted EBITDA (Darling's Share) (2) $ 81,639 $ 16,490

For the year ended January 3, 2015, the Company generated Adjusted EBITDA of $434.0 million, as compared to $268.4 million in the
same period in 2013. The increase was primarily attributable to the newly acquired Rothsay and VION Ingredients businesses. On a Pro forma Adjusted EBITDA basis, the Company would have generated $512.6 million in fiscal 2014, as compared to a Pro forma Adjusted EBITDA of $291.6 million in the same period in 2013. The increase in Pro forma Adjusted EBITDA is attributable to the inclusion of the newly acquired Rothsay and VION Ingredients businesses. Reconciliation (Non-GAAP) Adjusted Diluted Earnings Per Share and (Non-GAAP) Adjusted Net Income Attributable to Darling
Other principal indicators which management routinely monitors as an indicator of operating performance include:
These indicators and their importance are discussed below in greater detail.
Page 43
Fiscal Year Ended
(dollars in millions, except earnings per share) January 3,
2015 December 28,
2013 December 29,
2012
Net income attributable to Darling $ 64.2 $ 109.0 $ 130.8 Adjusted for acquisition related items (a)
Non-cash inventory step-up associated with the VION Acquisition 31.3 — —
Acquisition and integration costs 21.0 15.3 — Amortization of intangibles 52.6 19.7 17.7 Bridge financing — 8.0 — Redemption premium on 8.5% Senior Notes and write-off
deferred loan costs 19.9 — — Foreign currency hedge of VION purchase price 7.9 (16.9 ) —
Adjusted income attributable to Darling (non GAAP) $ 196.9 $ 135.1 $ 148.5
Weighted average shares of common stock outstanding 165,059 119,924 118,089
Diluted earnings per share, as reported $ 0.39 $ 0.91 $ 1.11
Non-cash inventory step-up associated with the VION Acquisition 0.19 — —
Acquisition and integration costs 0.13 0.13 — Amortization of intangibles 0.32 0.16 0.15 Bridge financing — 0.07 — Redemption premium on 8.5% Senior Notes and write-off
deferred loan costs 0.12 — — Foreign currency hedge of VION purchase price 0.05 (0.14 ) —
Adjusted diluted earnings per share attributable to Darling (non GAAP) $ 1.20 $ 1.13 $ 1.26
(a) Adjustments to net income attributable to Darling and diluted earnings per share of acquisition related items are net of tax. Calculations of all adjustment tax amounts were at the applicable effective tax rate for the period, except for fiscal 2014 and fiscal 2013, which were impacted by biofuel tax incentives and nonrecurring acquisition and integration costs. The effective tax rate used for calculating NonGAAP Adjusted EPS in the above table for the year ended January 3, 2015, December 28, 2013 and December 29, 2012 was 37.1%, 38.5% and 36.8%, respectively.
• Segment operating income • Raw material processed • Gross margin percentage • Foreign currency

Operating Income by Segment
Effective December 29, 2013, the Company's business operations were reorganized into three industry segments: Feed Ingredients, Food
Ingredients and Fuel Ingredients, in order to better align its business with the underlying markets and customers that the Company serves. As a result, fiscal 2014 operations are not comparable to fiscal 2013 and fiscal 2012.
Feed Ingredients operating income for fiscal year 2014 was $192.3 million, a decrease of $24.9 million as compared to the twelve months
of fiscal 2013. The results for the twelve months of fiscal 2014 include $14.2 million related to the non-cash inventory step-up associated with the required purchase accounting for the VION Acquisition. Without the non-cash inventory step-up adjustment, the Feed Ingredients operating income for the twelve months of fiscal 2014 would have been $206.5 million. On an adjusted basis, the Feed Ingredients segment declined by $10.7 million as compared to the same period in fiscal 2013. Lower earnings in the United States operations, which related primarily to the bakery feeds unit, severe winter weather in the first quarter of fiscal 2014, and lower finished fat prices, particularly in our non-formula business, were partially offset by the newly acquired operations in Europe, Canada and China, which generally performed as expected.
Food Ingredients operating income for fiscal year 2014 was $26.9 million. The Company had no Food Ingredients segment or products
prior to the VION Acquisition, and therefore had no Food Ingredients performance in the prior year period to provide comparability. The Food Ingredients segment results for the twelve months of fiscal 2014 include $35.3 million related to the non-cash inventory step-up associated with the purchase accounting for the VION Acquisition. Without the non-cash inventory step-up, the Food Ingredients segment operating income for the twelve months of fiscal 2014 would have been $62.2 million. The gelatin business performed modestly lower to the prior year as result of margin pressure from a decrease in finished product prices, softness in demand in China and increased raw material prices in South America driven from demand in alternative end markets. The European specialty ingredients business performed comparably to the prior year, not withstanding the issue associated with the closing of the Russian trade border in the second quarter of fiscal 2014. The Company's casing business also performed comparably to the prior year.
Exclusive of the DGD Joint Venture, Fuel Ingredients operating income for fiscal year 2014 was $21.3 million, an increase of $19.7 million as compared to $1.6 million in fiscal 2013. Including the DGD Joint Venture, the Fuel Ingredients segment income for the twelve months of fiscal 2014 was $85.1 million as compared to $9.3 million in the same period in fiscal 2013. The financial results are improved over the same period of fiscal 2013 mainly due to the inclusion of the newly acquired European business. The results were below expectations as the North American biofuel results were negatively impacted by lower RIN values during fiscal 2014, resulting from an uncertain regulatory environment with respect to the U.S. mandated RVO requirements for 2014 and the shutdown of the DGD Facility as a result of the fire incident on August 3, 2014. The passing of the blenders tax credit in December 2014 increased results in the forth quarter of fiscal 2014 by approximately $5.5 million at Darling's U.S. and Canada plants and by approximately $63.0 million at the DGD Joint Venture.
Page 44
Feed
Ingredients Food Ingredients Fuel Ingredients Corporate Total
Fiscal Year Ended January 3, 2015
Net Sales $ 2,421,462 $ 1,248,352 $ 286,629 $ — $ 3,956,443 Cost of sales and operating expenses 1,864,835 1,029,488 228,848 — 3,123,171
Gross Margin 556,627 218,864 57,781 — 833,272
Selling, general and administrative expense 205,484 118,716 8,596 41,784 374,580 Acquisition costs — — — 24,667 24,667 Depreciation and amortization 158,871 73,274 27,898 9,474 269,517
Segment operating income/ (loss) 192,272 26,874 21,287 (75,925 ) 164,508
Equity in net income of unconsolidated subsidiaries 1,842 — 63,767 — 65,609 Segment income 194,114 26,874 85,054 (75,925 ) 230,117
Total other expense (148,665 )
Income/ (loss) before income taxes $ 81,452

Raw Material Processed
Raw material processed represents the quantity in metric tons of raw material collected from the Company’s various raw material suppliers. The volume of raw material processed bears a direct relationship to the volume of finished product produced and available for sale.
Overall, in the twelve months ended January 3, 2015, the raw material processed by the Company totaled 8.97 million metric tons. Of this amount, 6.85 million metric tons was in the Feed Ingredients segment, 1.1 million metric tons was in the Food Ingredients segment, and 1.1 million metric tons was in the Fuel Ingredients segment. The raw materials processed total and that for the Fuel Ingredients segment excludes raw material processed at the DGD Joint Venture. Globally, raw material volumes were in line with the Company’s expectations.
Gross Margin Percentages
Gross margin percentage represents the gross margin dollars (net sales less cost of sales and operating expenses) as a percentage of net
sales. Overall, for the year ended January 3, 2015, the gross margin percentage was 21.1% compared to 25.7% for the twelve months ended December 28, 2013, or a decrease of 4.6 points (17.9%). Adjusting for the non-cash impact of the $49.8 million inventory step-up, the gross margin percentage would have been 22.3% or a decrease of 3.4 points (13.1%). The reduction in the adjusted gross margin percentage results from the VION Acquisition and modestly lower margins in the Feed Ingredients segment.
In the Feed Ingredients segment for year ended January 3, 2015, the gross margin percentage was 23.0% as compared to 25.7% for the comparable period in fiscal 2013, or a decrease of 2.7 points (10.5%). Adjusting for the impact of the non-cash inventory step-up related to this segment of $14.2 million, the gross margin percentage for the twelve months in fiscal 2014 would have been 23.6% or a decrease of 2.1 points (5.1%). The reduction in adjusted gross margin percentage is attributable to lower finished product selling prices for fat in the United States animal by-products division, which were only partially offset by lower raw material costs and increased volumes in the bakery feeds unit as result of a significant decline in corn prices.
In the Food Ingredients segment for the year ended January 3, 2015, the gross margin percentage was 17.5% as compared to nil during the twelve months of fiscal 2013. Adjusting for the impact of the non-cash inventory step-up related to this segment of $35.3 million, the gross margin percentage for the twelve months of fiscal 2014 would have been 20.4%.
In the Fuel Ingredients segment (exclusive of the equity contribution from the DGD Joint Venture) for the twelve months ended January 3, 2015, the gross margin percentage was 20.2% as compared to 21.5% for the same period in fiscal 2013, or a decrease of 1.3 points (6.0%). Adjusting for the impact of the non-cash inventory step-up had no impact on the gross margin percentage in fiscal 2014. The increase in adjusted gross margin percentage is related to the inclusion of the newly acquired businesses. In addition, in fourth quarter of fiscal 2014 the Company recorded revenues of approximately $5.5 million related to the blenders tax tax credit.
Page 45
(in thousands except percentages) Feed Ingredients Food
Ingredients Fuel Ingredients Corporate Total
Fiscal Year Ended January 3, 2015
Net Sales $ 2,421,462 $ 1,248,352 $ 286,629 $ — $ 3,956,443 Cost of sales and operating expenses 1,864,835 1,029,488 228,848 — 3,123,171
Gross Margin 556,627 218,864 57,781 — 833,272
Gross Margin % 23.0 % 17.5 % 20.2 % — 21.1 %
(in thousands except percentages) Feed
Ingredients Food
Ingredients Fuel Ingredients Corporate Total
Fiscal Year Ended December 28, 2013
Net Sales $ 1,788,563 $ — $ 13,705 $ — $ 1,802,268 Cost of sales and operating expenses 1,329,057 — 10,762 — 1,339,819
Gross Margin 459,506 — 2,943 — 462,449
Gross Margin % 25.7 % —% 21.5 % —% 25.7 %

Foreign Currency
The U.S. dollar has been strengthened against most of the other functional currencies used by the Company's non-domestic operations. Using actual results for fiscal year 2014 and comparing the yearly average rates to the spot rate at the end of January 2015, the U.S. dollar continues to strengthen. The impact of the strengthened U.S. dollar would result in an annual decrease in net sales and operating income of approximately $290 million and approximately $31 million, respectively if the same amount of non-domestic operations were attained in fiscal 2015. This is impacted mainly by the drop in the euro as compared to the U.S. dollar. The average rates assumptions used in this calculation was the actual fiscal average rate of €1.00:USD$1.32704 and CAD$0.90446:USD$1.00 as compared to the January 31, 2015 spot rate of €1.00:USD$1.13355 and CAD$0.78974:USD$1.00, respectively. Corporate Activities
Selling, General and Administrative Expenses. Selling, general and administrative expenses were $41.8 million during fiscal year 2014, a
$21.0 million increase from $20.8 million during fiscal year 2013. The increase was primarily due to an increase in professional fees and corporate staff costs to support the new global business and the impact of one extra week of operations.
Acquisition Costs. Acquisition and integration costs primarily related to the VION Acquisition and the Rothsay Acquisition were $24.7 million during fiscal year 2014, as compared to $23.3 million of acquisition and integration costs primarily related to the VION Acquisition, Rothsay Acquisition, and the TRS Transaction in fiscal year 2013.
Depreciation and Amortization. Depreciation and amortization charges increased $4.2 million to $9.5 million during fiscal year 2014 as
compared to $5.3 million during fiscal year 2013. The increase in depreciation and amortization is primarily due to the VION Acquisition and Rothsay Acquisition and depreciation associated with the ERP system.
Interest Expense. Interest expense was $135.4 million for the year ended January 3, 2015, compared to $38.1 million for the year ended December 28, 2013, an increase of $97.3 million. The increase in interest expense is due to (i) the redemption premium paid of approximately $27.3 million to retire the Company’s 8.5% Senior Notes due 2018, (ii) the increase in debt outstanding as a result of the borrowings to pay for the VION Acquisition and the Rothsay Acquisition, (iii) the incurrence and resultant amortization of deferred loan costs associated with the borrowings for the VION Acquisition and Rothsay Acquisition, and (iv) the approximately $4.3 million write-off of deferred loan costs related to the retirement of the 8.5% Senior Notes due 2018. Excluding the impact of the redemption premium and the write-off of deferred loan costs, the Company's average cost of borrowing during the year ended January 3, 2015 was approximately 4.0%.
Foreign Currency Gains/(Losses). Foreign currency losses were $13.5 million during the year ended January 3, 2015 as compared to a
gain of approximately $28.1 million for the year ended December 28, 2013. Of the overall foreign currency loss, approximately $12.6 million relates to certain euro forward contracts entered into to hedge against foreign exchange risks related to the acquisition price in the VION Acquisition. In fiscal 2013, the Company recorded a gain on these same contracts of approximately $27.5 million.
Other Income/Expense. Other income was $0.3 million for the twelve months of fiscal 2014, compared to expense of $3.5 million in the same period of fiscal 2013. The decrease in other expense for the twelve months of fiscal 2014 as compared to the same period in fiscal 2013 is primarily due to a prior year charge pursuant to the terms of the purchase agreement relating to the Company's acquisition in 2010 of Griffin Industries, Inc. to reimburse the former shareholders of Griffin Industries, Inc. for state income tax liability incurred by such shareholders as a result of the Company's election for certain tax treatment under Section 338(h)(10) of the U.S. Internal Revenue Code.
Equity in Net Income/(Loss) in Investment of Unconsolidated Subsidiaries. Mainly represents the Company's portion of the income of the DGD Joint Venture for the year ended January 3, 2015. In the year ended January 3, 2015 the net income was $63.8 million compared to a net income of $7.7 million in the same period in fiscal 2013. The $56.1 million increase in net income is primarily due the extension of a blenders tax credit during fiscal 2014, which more than offset any decrease in income due to the shutdown of the facility as result of the fire incident on August 3, 2014.
Income Taxes. The Company recorded income tax expense of $13.1 million for fiscal 2014, compared to $54.7 million of income tax
expense recorded in fiscal 2013, a decrease of $41.6 million, which is primarily due to decreased pre-tax earnings of the Company in fiscal 2014. The effective tax rate for fiscal 2014 and fiscal 2013 is 16.1% and 33.4%, respectively. The effective tax rate for fiscal 2014 differs from the statutory rate of 35% due primarily to the biofuel tax incentives from the DGD Joint Venture, relative mix of earnings among jurisdictions with different tax rates, non-deductible transaction-related costs, subpart
Page 46

F income and change in valuation allowance. The effective tax rate for fiscal 2013 differs from the statutory rate of 35% primarily due to state taxes and the receipt of biofuel tax incentives from the DGD Joint Venture, which began production in June 2013.
The biofuel tax incentive has expired as of the end of fiscal 2014. Accordingly, if the tax provision is not re-enacted, the Company’s
effective tax rate will be significantly impacted. Excluding the biofuel tax incentive and acquisition and integration-related costs, the Company’s effective tax rate for fiscal 2014 and fiscal 2013 is 37.1% and 38.5%, respectively. Results of Operations Fifty-two Week Fiscal Year Ended December 28, 2013 (“Fiscal 2013”) Compared to Fifty-two Week Fiscal Year Ended December 29, 2012 (“Fiscal 2012”) Summary of Key Factors Impacting Fiscal 2013 Results:
Principal factors that contributed to a $ 62.1 million decrease in operating income, which are discussed in greater detail in the following
section, were:
These decreases were partially offset by:
Summary of Key Indicators of Fiscal 2013 Performance:
Principal indicators that management routinely monitored during Fiscal 2013 and compared to previous periods as an indicator of problems or improvements in operating results include:
These indicators and their importance are discussed below in greater detail.
Finished Product Commodity Prices. Prices for finished product commodities that Darling produced in 2013 are reported each business day on the Jacobsen, an established agribusiness trading exchange price publisher. The Jacobsen reports U.S. industry sales from the prior day's activity by product. The Jacobsen includes reported prices for protein (primarily meat and bone meal ("MBM") and poultry meal ("PM")), fats (primarily bleachable fancy tallow ("BFT"), poultry grease ("PG") and yellow grease ("YG")), which are end products of the Company's Rendering segment. During the first quarter of Fiscal 2012, the Jacobsen stopped reporting BBP, which is the end product of the Company's Bakery segment. As a result, the Company monitored prices for corn, which is a substitute commodity for BBP and generally indicative of BBP price performance. The Company regularly monitored Jacobsen reports on MBM, PM, BFT, PG, YG and corn because they provide a daily indication of the Company's U.S. revenue performance against business plan benchmarks. Although the Jacobsen provides one useful metric of performance, the Company's 2013 finished products are commodities that compete with other commodities such as corn, soybean oil, inedible corn oil, palm oils, soybean meal and heating oil on nutritional and functional values and therefore actual pricing for the Company's finished products, as well as competing products, can be quite volatile. In addition, the Jacobsen does not provide data regarding international markets or forward or future period U.S. pricing. The Jacobsen prices quoted below are for delivery of the finished product at a specified U.S. location. Although the Company's U.S. prices generally move in concert with reported Jacobsen prices, the Company's actual sales prices for its finished products may vary significantly from the Jacobsen because of delivery timing differences and because the Company's finished products are delivered to multiple locations in different geographic regions which utilize different price indexes. In addition, certain of the Company's premium branded U.S. finished products may also sell at
Page 47
• Acquisition costs and expenses from current year acquisition activity, • Increases in payroll and related benefit costs, • Decrease in finished product prices, net of reduced raw material cost, • Decrease in yield, and • Increase in energy costs, primarily natural gas and diesel fuel.
• Increase in poultry raw material volumes, and • Nine weeks of contribution from the acquisition of Rothsay.
• Finished product commodity prices, • Raw material volume, • Production volume and related yield of finished product, • Energy prices for natural gas quoted on the NYMEX index and diesel fuel, • Collection fees and collection operating expenses, and • Factory operating expenses.
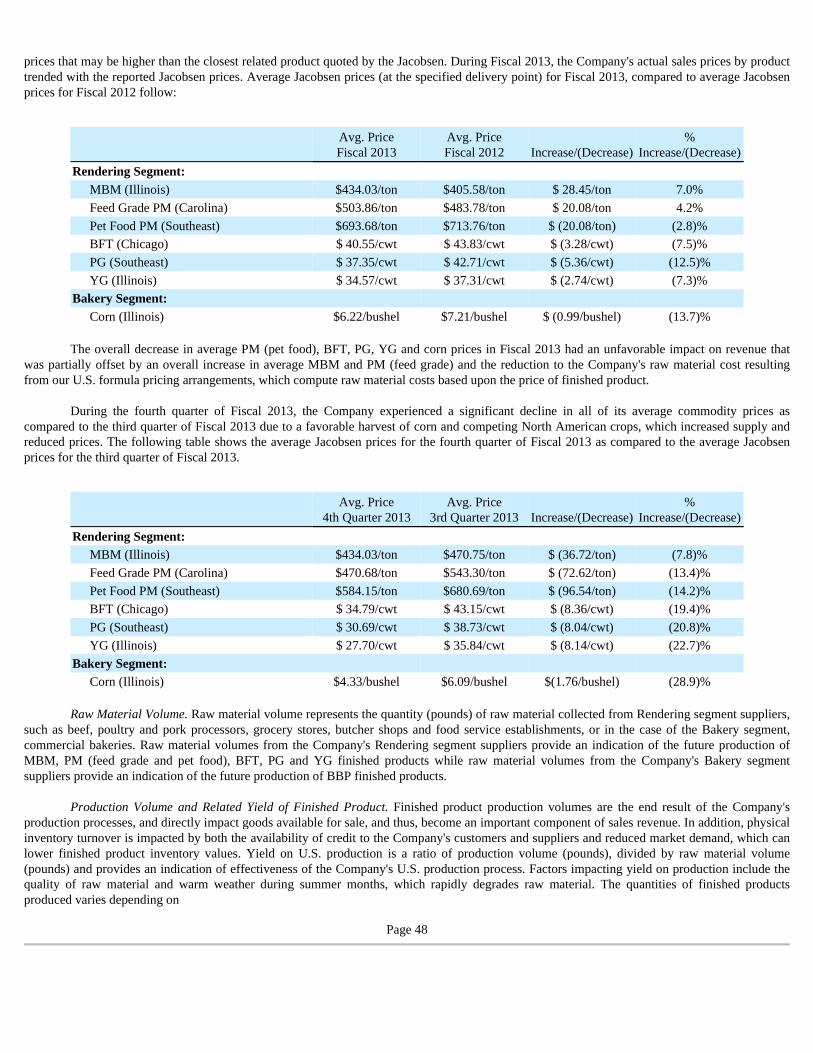
prices that may be higher than the closest related product quoted by the Jacobsen. During Fiscal 2013, the Company's actual sales prices by product trended with the reported Jacobsen prices. Average Jacobsen prices (at the specified delivery point) for Fiscal 2013, compared to average Jacobsen prices for Fiscal 2012 follow:
The overall decrease in average PM (pet food), BFT, PG, YG and corn prices in Fiscal 2013 had an unfavorable impact on revenue that
was partially offset by an overall increase in average MBM and PM (feed grade) and the reduction to the Company's raw material cost resulting from our U.S. formula pricing arrangements, which compute raw material costs based upon the price of finished product.
During the fourth quarter of Fiscal 2013, the Company experienced a significant decline in all of its average commodity prices as
compared to the third quarter of Fiscal 2013 due to a favorable harvest of corn and competing North American crops, which increased supply and reduced prices. The following table shows the average Jacobsen prices for the fourth quarter of Fiscal 2013 as compared to the average Jacobsen prices for the third quarter of Fiscal 2013.
Raw Material Volume. Raw material volume represents the quantity (pounds) of raw material collected from Rendering segment suppliers,
such as beef, poultry and pork processors, grocery stores, butcher shops and food service establishments, or in the case of the Bakery segment, commercial bakeries. Raw material volumes from the Company's Rendering segment suppliers provide an indication of the future production of MBM, PM (feed grade and pet food), BFT, PG and YG finished products while raw material volumes from the Company's Bakery segment suppliers provide an indication of the future production of BBP finished products.
Production Volume and Related Yield of Finished Product. Finished product production volumes are the end result of the Company's production processes, and directly impact goods available for sale, and thus, become an important component of sales revenue. In addition, physical inventory turnover is impacted by both the availability of credit to the Company's customers and suppliers and reduced market demand, which can lower finished product inventory values. Yield on U.S. production is a ratio of production volume (pounds), divided by raw material volume (pounds) and provides an indication of effectiveness of the Company's U.S. production process. Factors impacting yield on production include the quality of raw material and warm weather during summer months, which rapidly degrades raw material. The quantities of finished products produced varies depending on
Page 48
Avg. Price Fiscal 2013
Avg. Price Fiscal 2012 Increase/(Decrease)
% Increase/(Decrease)
Rendering Segment:
MBM (Illinois) $434.03/ton $405.58/ton $ 28.45/ton 7.0%
Feed Grade PM (Carolina) $503.86/ton $483.78/ton $ 20.08/ton 4.2%
Pet Food PM (Southeast) $693.68/ton $713.76/ton $ (20.08/ton) (2.8)%
BFT (Chicago) $ 40.55/cwt $ 43.83/cwt $ (3.28/cwt) (7.5)%
PG (Southeast) $ 37.35/cwt $ 42.71/cwt $ (5.36/cwt) (12.5)%
YG (Illinois) $ 34.57/cwt $ 37.31/cwt $ (2.74/cwt) (7.3)%
Bakery Segment:
Corn (Illinois) $6.22/bushel $7.21/bushel $ (0.99/bushel) (13.7)%
Avg. Price
4th Quarter 2013 Avg. Price
3rd Quarter 2013 Increase/(Decrease) %
Increase/(Decrease)
Rendering Segment:
MBM (Illinois) $434.03/ton $470.75/ton $ (36.72/ton) (7.8)%
Feed Grade PM (Carolina) $470.68/ton $543.30/ton $ (72.62/ton) (13.4)%
Pet Food PM (Southeast) $584.15/ton $680.69/ton $ (96.54/ton) (14.2)%
BFT (Chicago) $ 34.79/cwt $ 43.15/cwt $ (8.36/cwt) (19.4)%
PG (Southeast) $ 30.69/cwt $ 38.73/cwt $ (8.04/cwt) (20.8)%
YG (Illinois) $ 27.70/cwt $ 35.84/cwt $ (8.14/cwt) (22.7)%
Bakery Segment:
Corn (Illinois) $4.33/bushel $6.09/bushel $(1.76/bushel) (28.9)%

the mix of raw materials used in production. For example, raw material from cattle yields more fat and protein than raw material from pork or poultry. Accordingly, the mix of finished products produced by the Company can vary from quarter to quarter depending on the type of raw material being received by the Company. Thus, the increased volume of poultry raw material and decreased volume of beef raw material in Fiscal 2013 resulted in decreased Fiscal 2013 yield. The Company cannot increase the production of protein or fat based on demand since the type of raw material available will dictate the yield of each finished product.
Energy Prices for Natural Gas Quoted on the NYMEX Index and Diesel Fuel. Natural gas and heating oil commodity prices are quoted
each day on the NYMEX exchange for future months of delivery of natural gas and delivery of diesel fuel. The prices are important to the Company because natural gas and diesel fuel are major components of U.S. factory operating and collection costs and natural gas and diesel fuel prices are an indicator of achievement of the Company's business plan.
Collection Fees and Collection Operating Expense. In the U.S., the Company charges collection fees which are included in net sales. Each month the Company monitors both the collection fee charged to suppliers, which is included in net sales, and collection expense, which is included in cost of sales. The importance of monitoring collection fees and collection expense is that they provide an indication of achievement of the Company's business plan. Furthermore, management monitors collection fees and collection expense so that the Company can consider implementing measures to mitigate against unforeseen increases in these expenses.
Factory Operating Expenses. The Company incurs factory operating expenses which are included in cost of sales. Each month the Company monitors factory operating expense. The importance of monitoring factory operating expense is that it provides an indication of achievement of the Company's business plan. Furthermore, when unforeseen expense increases occur, the Company can consider implementing measures to mitigate such increases.
Net Sales. The Company collects and processes animal by-products (fat, bones and offal), including hides, bakery residual and used cooking oil to produce its principal North American finished products of MBM, PM (feed grade and pet food), BFT, PG, YG, BBP and hides as well as a range of branded and value-added products. Sales are significantly affected by finished goods prices, quality and mix of raw material, and volume of raw material. Net sales include the sales of produced finished goods, collection fees, fees for grease trap services, and finished goods purchased for resale.
During Fiscal 2013, net sales were $ 1,802.3 million as compared to $ 1,772.5 million during Fiscal 2012. The Rendering segments' operations process animal by-products and used cooking oil into fats (primarily BFT, PG and YG), protein (primarily MBM and PM (feed grade and pet food)) and hides. Fat was approximately $ 777.9 million and $ 809.7 million of net sales for the year ended December 28, 2013 and December 29, 2012, respectively, and protein was approximately $ 552.9 million and $ 496.2 million of net sales for the year ended December 28, 2013 and December 29, 2012, respectively. The increase in Rendering segment sales of $ 51.7 million and the decrease in Bakery segment sales of $ 29.5 million accounted for the $ 22.2 million increase in sales. The increase in net sales was primarily due to the following (in millions of dollars):
Further detail regarding the $ 51.7 million increase in sales in the Rendering segment and the $ 29.5 million decrease in sales in the Bakery segment is as follows:
Page 49
Rendering Bakery Corporate Total
Increase in net sales due to acquisition of Rothsay $ 32.4 $ — $ — $ 32.4
Increase in other sales 23.3 — — 23.3 Increase in raw material volume 11.7 7.8 — 19.5 Purchase of finished product for resale 12.2 — — 12.2 Increase/(decrease) in finished product prices (19.6 ) (36.5 ) — (56.1 )
Decrease in yield (8.3 ) (0.8 ) — (9.1 )
$ 51.7 $ (29.5 ) $ — $ 22.2 Net change in net sales as a result of net sales
reclassification to cost of sales and operating expenses to conform to current year presentation 7.6
$ 29.8

Rendering
Net Sales from Acquisition of Rothsay : The Company's net sales increased by $ 32.4 million in the Rendering segment as a result of nine weeks of contribution from the acquisition of Rothsay. Other Sales : The $ 23.3 million increase in other Rendering segment sales was primarily due to increased revenues from the acquired TRS food residuals business and an increase in hide and pet food sales. Raw Material Volume : Rendering volumes have increased Rendering segment sales by approximately $ 11.7 million , which is a result of an increase in slaughter and processor rates of the Company's poultry raw material suppliers that more than offset lower volumes from the Company's beef suppliers in Fiscal 2013 as compared to Fiscal 2012. Purchases of Finished Product for Resale: The $ 12.2 million increase in sales resulted from the Company's purchasing more finished product for resale from third party suppliers in Fiscal 2013 as compared to the same period in Fiscal 2012. We purchase finished product from third party suppliers from time to time in order to complete a full shipment for a specific customer.
Finished Product Prices : Lower prices in the overall commodity market for soybean meal and soy oil, decreased demand from export and reduced corn values negatively impacted the Company's finished product prices for PM (pet food), BFT, PG and YG. The $ 19.6 million decrease in Rendering segment sales resulting from decreases in finished product prices for PM (pet food), BFT, PG and YG more than offset the increase in the finished product price for MBM and PM (feed grade). The market decreases were due to changes in supply/demand in the domestic and international markets for commodity proteins and fats, including PM (pet food), BFT, PG and YG, driven principally by the large Fiscal 2013 production of corn and soybeans. Yield: The $ 8.3 million decrease in the Rendering segment yield is primarily due to a decrease in the relative portion of beef offal in the raw material collected during Fiscal 2013 as compared to Fiscal 2012, which impacted yields since beef offal is a higher yielding material than poultry and pork offal.
Bakery
Raw Material Volume : Bakery segment volumes have increased Bakery segment sales by approximately $ 7.8 million , which is due to production increases by the Company's commercial bakery suppliers in Fiscal 2013 as compared to the same period in Fiscal 2012. Finished Product Prices : Lower prices in the commodity market for corn negatively impacted the Company's BBP finished product prices by approximately $ 36.5 million . The reason for the impact is that BBP formula contracts are priced relative to the price of corn. During the fourth quarter of fiscal 2013 the formula pricing arrangements in the Company's Bakery segment supply agreements significantly lagged the rapid decline of finished product prices through the processing and sales cycles. Yield : The $ 0.8 million decrease in the Bakery segment yield is primarily due to a decrease in the relative portion of dry based bakery residuals collected during Fiscal 2013 as compared to the same period in Fiscal 2012, which impacted yields since dry based bakery residuals are a higher yielding material than moist bakery residuals and available blending stock.
Cost of Sales and Operating Expenses. Cost of North American sales and operating expenses include the cost of raw material, the cost of product purchased for resale and the cost to collect raw material, which includes diesel fuel and processing costs including natural gas. The Company utilizes both fixed and formula pricing methods for the purchase of raw materials. Fixed prices are adjusted where possible for changes in competitive circumstances. Significant changes in finished goods market conditions impact finished product inventory values, while raw materials purchased under formula prices are generally correlated with specific finished goods prices, except in rapidly declining markets which can result in a delay in matching raw material purchase prices and end product sale prices. Energy costs, particularly diesel fuel and natural gas, are significant components of the Company's cost structure. The Company has the ability to burn alternative fuels at a majority of its North American plants to help manage the Company's price exposure to volatile energy markets.
During Fiscal 2013, cost of sales and operating expenses were $ 1,339.8 million as compared to $ 1,303.7 million during Fiscal 2012. The increase in Rendering segment cost of sales and operating expenses of $ 42.2 million , offset by the decrease in Bakery segment cost of sales and operating expenses of $ 13.7 million , accounted for substantially all of the $ 28.5 million increase in cost of sales and operating expenses. The increase in cost of sales and operating expenses was primarily due to the following (in millions of dollars):
Page 50

Further detail regarding the $ 42.2 million increase in cost of sales and operating expenses in the Rendering segment and the $ 13.7 million decrease in Bakery segment is as follows: Rendering
Other Cost of Sales : The $ 30.2 million increase in other costs of sales is primarily due to increased costs from the acquired food residuals business of TRS, an increase in payroll and incentive-related benefits, an increase in repairs and maintenance expense, an increase in hide costs and other sales costs increases. Costs of Sales and Operating Expenses from the Rothsay Acquisition : The Company's cost of sales and operating expenses increased by $19.6 million in the Rendering segment as a result of nine weeks of contribution from the Rothsay Acquisition. Purchases of Finished Product for Resale: The $ 11.8 million increase in cost of sales resulted from the Company's purchasing more finished product for resale from third party suppliers in Fiscal 2013 as compared to Fiscal 2012. Raw Material Volume: Production increases from the packers and processors who supply by-product we use as raw material resulted in higher raw material volumes available to be processed and formula pricing resulted in higher cost of sales of approximately $ 4.1 million . Energy Costs : Natural gas and diesel fuel are major components of our North American factory and collection operating costs, respectively. During Fiscal 2013 energy costs, primarily natural gas and diesel fuel, were higher as compared to Fiscal 2012 and are reflected in the $ 6.0 million increase in cost of sales. Raw Material Costs : A portion of the Company’s North American volume of Rendering segment raw material is acquired on a formula basis. Under a formula arrangement, the cost of raw material is tied to the finished product market for MBM, PM (both feed grade and pet food), BFT, PG and YG. Although there was a higher demand for soybean meal and fish meal, which resulted in an increase in prices of the Company's finished products for MBM and PM (feed grade), the price decrease for our fats (BFT, PG and YG) and corresponding formula pricing more than offset the protein meal increase, resulting in a decrease in the cost of raw material of approximately $ 29.5 million in Fiscal 2013 as compared to Fiscal 2012.
Bakery
Raw Material Costs : The Company’s Bakery segment raw material is acquired on a formula basis. Under these formula arrangements, the cost of raw material is tied to the market value of corn. Since finished product prices overall for corn were lower in Fiscal 2013 as compared to the same period in Fiscal 2012, the Bakery segment raw material cost decreased approximately $ 12.6 million . Other Costs of Sales: The $ 5.5 million decrease in other costs of sales is mainly due to a reduction to cost of sales as a result of our corn hedging strategy, that was partially offset by an increase in payroll and incentive-related benefits and an increase in repairs and maintenance costs. See “Item 7A - Quantitative and Qualatative Disclosures about Market Risk”.
Page 51
Rendering Bakery Corporate Total
Increase/(decrease) in other cost of sales $ 30.2 $ (5.5 ) $ (0.7 ) $ 24.0 Increase in cost of sales and operating expense
due to the Rothsay Acquisition 19.6 — — 19.6 Purchase of finished product for resale 11.8 — — 11.8 Increase in raw material volume 4.1 3.7 — 7.8 Increase in energy costs, primarily natural gas and diesel fuel 6.0 0.7 0.7 7.4 Decrease in raw material costs (29.5 ) (12.6 ) — (42.1 )
$ 42.2 $ (13.7 ) $ — $ 28.5 Net change in net sales as a result of net sales
reclassification to cost of sales and operating expenses to conform to current year presentation 7.6
$ 36.1
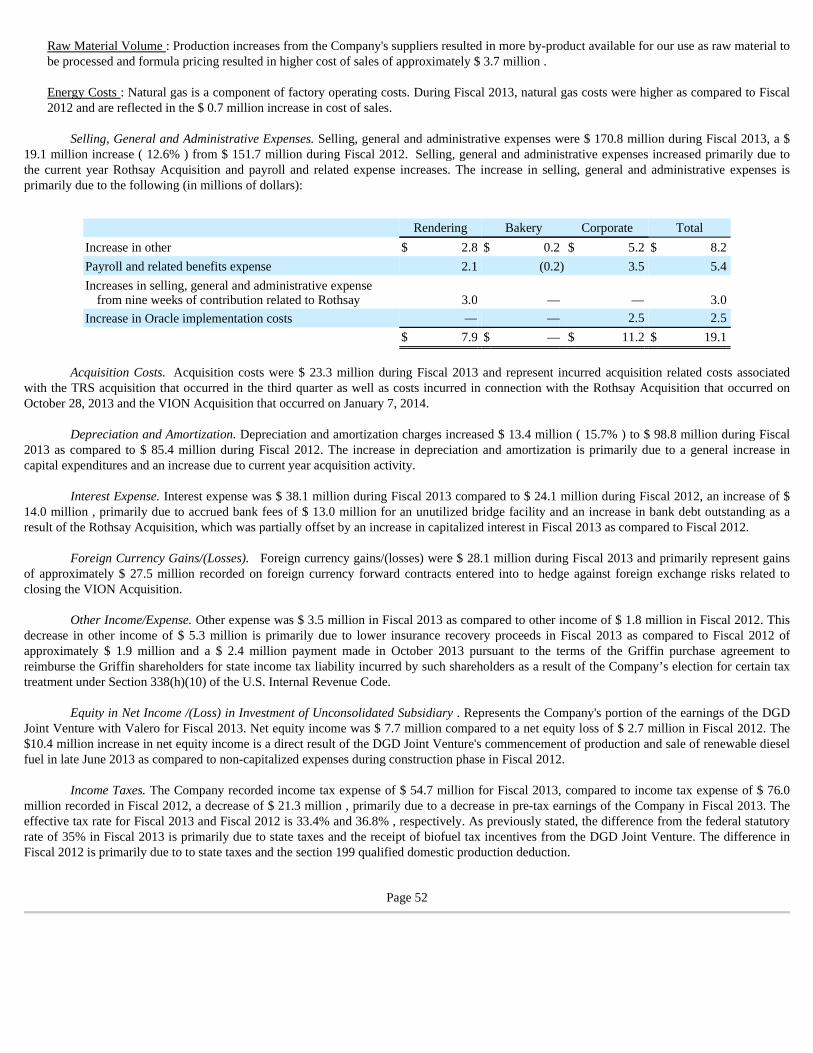
Raw Material Volume : Production increases from the Company's suppliers resulted in more by-product available for our use as raw material to be processed and formula pricing resulted in higher cost of sales of approximately $ 3.7 million . Energy Costs : Natural gas is a component of factory operating costs. During Fiscal 2013, natural gas costs were higher as compared to Fiscal 2012 and are reflected in the $ 0.7 million increase in cost of sales.
Selling, General and Administrative Expenses. Selling, general and administrative expenses were $ 170.8 million during Fiscal 2013, a $ 19.1 million increase ( 12.6% ) from $ 151.7 million during Fiscal 2012. Selling, general and administrative expenses increased primarily due to the current year Rothsay Acquisition and payroll and related expense increases. The increase in selling, general and administrative expenses is primarily due to the following (in millions of dollars):
Acquisition Costs. Acquisition costs were $ 23.3 million during Fiscal 2013 and represent incurred acquisition related costs associated
with the TRS acquisition that occurred in the third quarter as well as costs incurred in connection with the Rothsay Acquisition that occurred on October 28, 2013 and the VION Acquisition that occurred on January 7, 2014.
Depreciation and Amortization. Depreciation and amortization charges increased $ 13.4 million ( 15.7% ) to $ 98.8 million during Fiscal
2013 as compared to $ 85.4 million during Fiscal 2012. The increase in depreciation and amortization is primarily due to a general increase in capital expenditures and an increase due to current year acquisition activity.
Interest Expense. Interest expense was $ 38.1 million during Fiscal 2013 compared to $ 24.1 million during Fiscal 2012, an increase of $ 14.0 million , primarily due to accrued bank fees of $ 13.0 million for an unutilized bridge facility and an increase in bank debt outstanding as a result of the Rothsay Acquisition, which was partially offset by an increase in capitalized interest in Fiscal 2013 as compared to Fiscal 2012.
Foreign Currency Gains/(Losses). Foreign currency gains/(losses) were $ 28.1 million during Fiscal 2013 and primarily represent gains of approximately $ 27.5 million recorded on foreign currency forward contracts entered into to hedge against foreign exchange risks related to closing the VION Acquisition.
Other Income/Expense. Other expense was $ 3.5 million in Fiscal 2013 as compared to other income of $ 1.8 million in Fiscal 2012. This
decrease in other income of $ 5.3 million is primarily due to lower insurance recovery proceeds in Fiscal 2013 as compared to Fiscal 2012 of approximately $ 1.9 million and a $ 2.4 million payment made in October 2013 pursuant to the terms of the Griffin purchase agreement to reimburse the Griffin shareholders for state income tax liability incurred by such shareholders as a result of the Company’s election for certain tax treatment under Section 338(h)(10) of the U.S. Internal Revenue Code.
Equity in Net Income /(Loss) in Investment of Unconsolidated Subsidiary . Represents the Company's portion of the earnings of the DGD
Joint Venture with Valero for Fiscal 2013. Net equity income was $ 7.7 million compared to a net equity loss of $ 2.7 million in Fiscal 2012. The $10.4 million increase in net equity income is a direct result of the DGD Joint Venture's commencement of production and sale of renewable diesel fuel in late June 2013 as compared to non-capitalized expenses during construction phase in Fiscal 2012.
Income Taxes. The Company recorded income tax expense of $ 54.7 million for Fiscal 2013, compared to income tax expense of $ 76.0
million recorded in Fiscal 2012, a decrease of $ 21.3 million , primarily due to a decrease in pre-tax earnings of the Company in Fiscal 2013. The effective tax rate for Fiscal 2013 and Fiscal 2012 is 33.4% and 36.8% , respectively. As previously stated, the difference from the federal statutory rate of 35% in Fiscal 2013 is primarily due to state taxes and the receipt of biofuel tax incentives from the DGD Joint Venture. The difference in Fiscal 2012 is primarily due to to state taxes and the section 199 qualified domestic production deduction.
Page 52
Rendering Bakery Corporate Total
Increase in other $ 2.8 $ 0.2 $ 5.2 $ 8.2 Payroll and related benefits expense 2.1 (0.2 ) 3.5 5.4 Increases in selling, general and administrative expense
from nine weeks of contribution related to Rothsay 3.0 — — 3.0 Increase in Oracle implementation costs — — 2.5 2.5
$ 7.9 $ — $ 11.2 $ 19.1

FINANCING, LIQUIDITY, AND CAPITAL RESOURCES Indebtedness
Certain Debt Outstanding at January 3, 2015. On January 3, 2015, debt outstanding under the Company's Amended Credit Agreement and the Company's 5.375% Notes consists of the following (in thousands):
Senior Secured Credit Facilities . On January 6, 2014, Darling, Darling International Canada Inc. ("Darling Canada") and Darling
International NL Holdings B.V. ("Darling NL") entered into a Second Amended and Restated Credit Agreement (the "Amended Credit Agreement"), restating its then existing Amended and Restated Credit Agreement dated September 27, 2013 (the "Former Credit Agreement"), with the lenders from time to time party thereto, JPMorgan Chase Bank, N.A., as Administrative Agent, and the other agents from time to time party thereto. For more information regarding the Amended Credit Agreement see Note 10 of Notes to Consolidated Financial Statements.
Senior Notes due 2022. On December 18, 2013, Darling Escrow Corporation ("Darling Escrow Sub"), a Delaware corporation and wholly-
owned subsidiary of Darling, entered into a Purchase Agreement (the "Original Purchase Agreement"), with the initial purchasers party thereto (the "Initial Purchasers"), for the sale of $500.0 million aggregate principal amount of its 5.375% Notes due 2022 (the "5.375% Private Notes"). On January 2, 2014, the 5.375% Notes, which were offered in a private offering in connection with the VION Acquisition, were issued pursuant to a 5.375% Notes Indenture, dated as of January 2, 2014 (the "Original Indenture"), among Darling Escrow Sub, the Subsidiary Guarantors (as defined in the Original Indenture) party
Page 53
5.375% Notes:
5.375 % Notes due 2022 $ 500,000
Amended Credit Agreement:
Term Loan A $ 312,161 Term Loan B $ 1,205,669 Revolving Credit Facility:
Maximum availability $ 1,000,000 Borrowings outstanding 101,863 Letters of credit issued 32,198 Availability $ 865,939
• As of January 3, 2015, the Company had availability of $ 865.9 million under the revolving loan facility, taking into account an aggregate of $ 101.9 million outstanding borrowings and letters of credit issued of $ 32.2 million .
• As of January 3, 2015, the Company has borrowed all $350.0 million under the term loan A facility and repaid approximately CAD$ 7.5 million and $ 10.0 million , which when repaid, cannot be reborrowed. The term loan A facility is repayable in quarterly installments as follows: for the first eight quarters following January 6, 2014, 1.25% of the original principal amount of the term loan A facility, for the ninth through sixteenth quarters following January 6, 2014, 1.875% of the original principal amount of the term loan A facility, and for each quarterly installment after such sixteenth installment until September 27, 2018, 3.75% of the original principal amount of the term loan A facility. The term loan A facility will mature on September 27, 2018.
• As of January 3, 2015, the Company has borrowed all $1.3 billion under the terms of the term loan B facility and repaid approximately € 3.8 million and $ 4.5 million , which when repaid, cannot be reborrowed. The term loan B facility is repayable in quarterly installments of 0.25% of the aggregate principal amount of the relevant term loan B facility on the last day of each March, June, September and December of each year commencing on the last day of each month falling on or after the last day of the first full quarter following January 6, 2014, and continuing until the last day of each quarter period ending immediately prior to January 7, 2021; and one final installment in the amount of the relevant term loan B facility then outstanding, due on January 7, 2021. The term loan B facility will mature on January 7, 2021.
• The interest rate applicable to any borrowings under the term loan A facility and the revolving loan facility will equal either LIBOR/euro interbank offered rate/CDOR plus 2.50% per annum or base rate/Canadian prime rate plus 1.50% per annum, subject to certain step-downs based on Company's total leverage ratio. The interest rate applicable to any borrowings under the term loan B facility will equal (a) for U.S. dollar term loans, either the base rate plus 1.50% or LIBOR plus 2.50%, and (b) for euro term loans, the euro interbank offered rate plus 2.75%, in each case subject to a step-down based on our total leverage ratio. For term loan B loans, the LIBOR rate cannot be less than 0.75%.

thereto from time to time and U.S. Bank National Association, as trustee (the "Trustee"), with the gross proceeds from the offering of the 5.375% Notes and certain additional amounts deposited in an escrow account pending the satisfaction of certain conditions, including the completion of the VION Acquisition, which occurred on January 7, 2014.
On January 8, 2014, Darling Escrow Sub merged (the "Notes Merger") with and into Darling (with Darling as the survivor of the Notes
Merger), pursuant to an Agreement and Plan of Merger, dated January 8, 2014, between Darling Escrow Sub and Darling. In connection with the completion of the Notes Merger, pursuant to the provisions of the Original Indenture and the Original Purchase Agreement, Darling Escrow Sub, Darling and certain of Darling's subsidiaries entered into a supplemental indenture with the Trustee (the "Supplemental Indenture," and together with the Original Indenture, the ("Indenture"). For a description of the terms of the 5.375% Notes see Note 10 of Notes to Consolidated Financial Statements.
Senior Notes due 2018. On December 17, 2010, Darling issued $250.0 million aggregate principal amount of its 8.5% Notes under an
indenture with U.S. Bank National Association, as trustee. On February 7, 2014, the Company completed the redemption of the 8.5% Notes for $280.4 million, which included a redemption premium of approximately $27.3 million and accrued and unpaid interest of approximately $3.1 million.
The classification of long-term debt in the Company’s January 3, 2015 consolidated balance sheet is based on the contractual repayment terms of the 5.375% Notes and debt issued under the Amended Credit Agreement.
As a result of the Company's borrowings under its Amended Credit Agreement and the Indenture, the Company is highly leveraged.
Investors should note that, in order to make scheduled payments on the indebtedness outstanding under the Amended Credit Agreement and the 5.375% Notes, and otherwise, the Company will rely in part on a combination of dividends, distributions and intercompany loan repayments from the Company's direct and indirect U.S. and foreign subsidiaries. The Company is prohibited under the Amended Credit Agreement and the Indenture from entering (or allowing such subsidiaries to enter) into contractual limitations on the Company's subsidiaries’ ability to declare dividends or make other payments or distributions to the Company. The Company has also attempted to structure the Company's consolidated indebtedness in such a way as to maximize the Company's ability to move cash from the Company's subsidiaries to Darling or another subsidiary that will have fewer limitations on the ability to make upstream payments, whether to Darling or directly to the Company's lenders as a Guarantor. Nevertheless, applicable laws under which the Company's direct and indirect subsidiaries are formed may provide limitations on such dividends, distributions and other payments. In addition, regulatory authorities in various countries where the Company operates or where the Company imports or exports products may from time to time impose import/export limitations, foreign exchange controls or currency devaluations that may limit the Company's access to profits from the Company's subsidiaries or otherwise negatively impact the Company's financial condition and therefore reduce the Company's ability to make required payments under Amended Credit Agreement, the 5.375% Notes, or otherwise. In addition, fluctuations in foreign exchange values may have a negative impact on the Company's ability to repay indebtedness denominated in U.S. or Canadian dollars or euros. See “Risk Factors - Our business may be adversely impacted by fluctuations in exchange rates, which could affect our ability to comply with our financial covenants” and “ - Our ability to repay our indebtedness depends in part on the performance of our subsidiaries, including our non-guarantor subsidiaries, and their ability to make payments or distributions” in Item 1A of this Annual Report on Form 10-K for the fiscal year ended January 3, 2015.
Working Capital and Capital Expenditures On January 3, 2015 , the Company had working capital of $ 569.6 million and its working capital ratio was 2.18 to 1 compared to working
capital of $ 950.7 million and a working capital ratio of 6.38 to 1 on December 28, 2013 . The decrease in working capital is primarily due to a decrease in cash and cash equivalents and working capital from the VION Acquisition. At January 3, 2015 , the Company had unrestricted cash of $ 108.8 million and funds available under the revolving credit facility of $ 865.9 million , compared to unrestricted cash of $ 870.9 million and funds available under the revolving credit facility of $ 680.7 million at December 28, 2013 . The Company diversifies its cash investments by limiting the amounts deposited with any one financial institution and invests primarily in government-backed securities.
Net cash provided by operating activities was $ 275.2 million and $ 210.7 million for the fiscal years ended January 3, 2015 and
December 28, 2013 , respectively, a decrease of $ 64.5 million due primarily to decrease in net income of approximately $ 40.7 million and changes in operating assets and liabilities that include a decrease in cash from income taxes refundable/payable of approximately $ 7.2 million , a decrease in cash used by accounts receivable of approximately $ 3.4 million , a decrease in cash used by inventory and prepaid expenses of approximately $ 13.3 million . Cash used by investing activities was $ 2,323.8 million during fiscal 2014, compared to $ 895.4 million in fiscal 2013, an increase of $ 1,428.4 million , primarily due to cash paid for the VION Acquisition. Net cash provided by financing activities was $ 1,275.6 million during fiscal 2014 compared to cash provided
Page 54

by financing activities of $ 1,457.4 million in fiscal 2013 , a decrease in cash provided of $ 181.8 million primarily due to repayment on revolver borrowings in fiscal 2014.
Capital expenditures of $ 228.9 million were made during fiscal 2014 as compared to $ 118.3 million in fiscal 2013 , an increase of $
110.6 million , or 93.5% , due primarily to capital expenditures from entities acquired in the VION Acquisition and Rothsay Acquisition during fiscal 2014 . The Company expects to incur approximately $ 250.0 million in capital expenditures in fiscal 2015. Additionally, included in the planned capital projects are costs associated with the Company's initiation of a new ERP system. As of January 3, 2015, the Company had spent approximately $ 37.3 million in capital expenditures for software and design costs related to the implementation of the Oracle E Business Suite ERP system. The implementation is expected to be completed in 2016. The expected cash flow impact of this project will be in the range of approximately $ 40.0 million to $ 42.0 million . These costs are expected to be financed using cash flows from operations. Capital expenditures related to compliance with environmental regulations were $ 34.3 million in fiscal 2014 , $ 4.7 million in fiscal 2013 and $ 3.1 million in fiscal 2012 .
Accrued Insurance and Pension Plan Obligations Based upon the annual actuarial estimate, current accruals and claims paid during fiscal 2014 , the Company has accrued approximately $
8.2 million as of January 3, 2015 that it expects will become due during the next twelve months in order to meet obligations related to the Company's self insurance reserves and accrued insurance obligations, which are included in current accrued expenses at January 3, 2015 . The self insurance reserve is composed of estimated liability for claims arising for workers’ compensation and for auto liability and general liability claims. The self insurance reserve liability is determined annually, based upon a third party actuarial estimate. The actuarial estimate may vary from year to year, due to changes in costs of health care, the pending number of claims and other factors beyond the control of management of the Company.
Based upon current actuarial estimates, the Company expects to make payments of approximately $ 0.4 million in order to meet minimum pension funding requirements to its domestic plans in fiscal 2015. In addition, the Company expects to make payments of approximately $ 6.1 million under its foreign pension plans in fiscal 2015 . The minimum pension funding requirements are determined annually, based upon a third party actuarial estimate. The actuarial estimate may vary from year to year, due to fluctuations in return on investments or other factors beyond the control of management of the Company or the administrator of the Company’s pension funds. No assurance can be given that the minimum pension funding requirements will not increase in the future. The Company has made required and tax deductible discretionary contributions to its domestic pension plans in fiscal 2014 and fiscal 2013 of approximately $ 0.3 million and $ 4.0 million , respectively. Additionally, the Company has made required and tax deductible discretionary contributions to its foreign pension plans in fiscal 2014 of approximately $ 6.8 million , as compared to no contributions in fiscal 2013 .
The U.S. Pension Protection Act of 2006 ("PPA") went into effect in January 2008. The stated goal of the PPA is to improve the funding of U.S. pension plans. U.S. plans in an under-funded status are required to increase employer contributions to improve the funding level within PPA timelines. The impact of recent volatility in the world equity and other financial markets have had and could continue to have a material negative impact on U.S. pension plan assets and the status of required funding under the PPA. The Company participates in various U.S. multiemployer pension plans which provide defined benefits to certain employees covered by labor contracts. These plans are not administered by the Company and contributions are determined in accordance with provisions of negotiated labor contracts to meet their pension benefit obligations to their participants. The Company's contributions to each individual U.S. multiemployer plan represent less than 5% of the total contributions to each such plan. Based on the most currently available information, the Company has determined that, if a withdrawal were to occur, withdrawal liabilities on two of the U.S. plans in which the Company currently participates could be material to the Company, with one of these material plans certified as critical or red zone. With respect to the other U.S. multiemployer pension plans in which the Company participates and which are not individually significant, four plans have certified as critical or red zone and two have certified as endangered or yellow zone and one has certified as seriously endangered or Orange zone as defined by the PPA. The Company has received notices of withdrawal liability from two U.S. multiemployer pension plans in which it participated. As a result, the Company has an accrued aggregate current liability of approximately $ 2.0 million representing the present value of scheduled withdrawal liability payments under these multiemployer plans. While the Company has no ability to calculate a possible current liability for under-funded multiemployer plans that could terminate or could require additional funding under the PPA, the amounts could be material.
DGD Joint Venture
The Company announced on January 21, 2011 that a wholly-owned subsidiary of Darling entered into a limited liability company
agreement with Valero to form the DGD Joint Venture. The DGD Joint Venture is owned 50% / 50% with Valero and was formed to design, engineer, construct and operate the DGD Facility, which is capable of producing approximately 11,000 barrels per day of input feedstock to produce renewable diesel fuel and certain other co-products, and is located adjacent to Valero's
Page 55

refinery in Norco, Louisiana. The DGD Joint Venture reached mechanical completion and began the production of renewable diesel in late June 2013. On August 3, 2014, the facility shutdown as a result of a fire incident. The facility resumed operations on September 18, 2014. The DGD Joint Venture anticipates that the fire incident will be covered under its property and casualty insurance policies and the financial exposure is limited to the deductible. The DGD Joint Venture does not expect to file a business interruption claim.
On May 31, 2011, the DGD Joint Venture and Diamond Green Diesel LLC, a wholly-owned subsidiary of the DGD Joint Venture
(“Opco”), entered into (i) a facility agreement (the “Facility Agreement”) with Diamond Alternative Energy, LLC, a wholly-owned subsidiary of Valero (the “Lender”), and (ii) a loan agreement (the “Loan Agreement”) with the Lender, which provided the DGD Joint Venture with a 14 year multiple advance term loan facility of approximately $ 221.3 million (the “JV Loan”) to support the design, engineering and construction of the DGD Facility, which is now in production. The Facility Agreement and the Loan Agreement prohibit the Lender from assigning all or any portion of the Facility Agreement or the Loan Agreement to unaffiliated third parties. Opco has also pledged substantially all of its assets, consisting of substantially all of the plant, property and equipment of the DGD Facility, to the Lender, and the DGD Joint Venture has pledged all of Opco's equity interests to the Lender, until the JV Loan has been paid in full and the JV Loan has terminated in accordance with its terms.
Based on the sponsor support agreements executed in connection with the Facility Agreement and the Loan Agreement relating to the
DGD Joint Venture with Valero, the Company has contributed a total of approximately $ 111.7 million for the completion of the DGD Facility including the Company's portion of cost overruns and working capital funding. As of the date of this report, it is anticipated that substantially all contributions have been made, except for possible additional working capital funding. As of January 3, 2015 , under the equity method of accounting, the Company has an investment in the DGD Joint Venture of approximately $ 178.9 million on the consolidated balance sheet. The DGD Joint Venture has not yet distributed any earnings to its venture partners. Distribution of earnings to the venture partners is prohibited until certain conditions required under the DGD Joint Venture’s Loan Agreement are satisfied, including prepayments of principal by the DGD Joint Venture upon qualifying events. In addition, the DGD Joint Venture has no mandatory distributions to its joint venture partners.
Financial Impact of VION Acquisition On January 7, 2014, the Company acquired the VION Ingredients business division of VION Holding by purchasing all of the shares of
the VION Companies. The VION Ingredients business is now conducted under the name Darling Ingredients International. Darling Ingredients International is a worldwide leader in the development and production of specialty ingredients from animal by-products for applications in animal feed, pet food, fuel, bioenergy, fertilizer, food and pharmaceuticals. Darling Ingredients International operates a global network of 68 production facilities across five continents covering all aspects of animal by-product processing through six brands: Rendac (fuel), Sonac (proteins, fats, edible fats and blood products), Ecoson (bioenergy), Rousselot (gelatin), CTH (natural casings) and Best Hides (hides and skins). Darling Ingredients International’s specialized portfolio of over 400 products covers all animal origin raw material types and thereby offers a comprehensive, single source solution for suppliers. Darling Ingredients International’s business has leading positions across Europe with operations in the Netherlands, Belgium, Germany, Poland and Italy under the Rendac and Sonac brand names. Value-added products include edible fats, blood products and plasma meals, bone products, protein meals and fats. Rousselot is a global leading market provider of gelatin for the food, pharmaceutical and technical industries with operations in Europe, the United States, South America and China. CTH is a market leader in natural casings for the sausage industry with operations in Europe, China and the United States. The purchase price for the transaction was approximately €1.6 billion in cash. The purchase price was financed through (i) borrowings under the Amended Credit Agreement; (ii) proceeds from the Company’s $874.0 million public common stock offering; and (iii) proceeds from the private offering of $500.0 million aggregate principal amount of the 5.375% Notes.
As a result of the VION Acquisition, the Company has a substantial amount of indebtedness, which could make it more difficult for us to
satisfy our obligations to our financial lenders and our contractual and commercial commitments, limit our ability to obtain additional financing to fund future working capital, capital expenditures, acquisitions or other general corporate requirements on commercially reasonable terms or at all, require us to use a substantial portion of our cash flows from operations to pay principal and interest on our indebtedness instead of other purposes, thereby reducing the amount of our cash flows from operations available for working capital, capital expenditures, acquisitions and other general corporate purposes, increase our vulnerability to adverse economic, industry and business conditions, expose us to the risk of increased interest rates as certain of our borrowings are at variable rates of interest, limit our flexibility in planning for, or reacting to, changes in our business and the industry in which we operate, place us at a competitive disadvantage compared to other, less leveraged competitors, and/or increase our cost of borrowing.
Page 56

Cash Flows and Liquidity Risks Management believes that the Company’s cash flows from operating activities consistent with the level generated in fiscal 2014,
unrestricted cash and funds available under the Amended Credit Agreement, will be sufficient to meet the Company’s working capital needs and maintenance and compliance-related capital expenditures, scheduled debt and interest payments, income tax obligations, and other contemplated needs through the next twelve months. Numerous factors could have adverse consequences to the Company that cannot be estimated at this time, such as those factors discussed below under the heading "Forward Looking Statements". These factors coupled with volatile prices for natural gas and diesel fuel, general performance of the U.S. and global economies, disturbances in world financial, credit, commodities and stock markets, and any decline in consumer confidence, including the inability of consumers and companies to obtain credit due to lack of liquidity in the financial markets, among others, could negatively impact the Company's results of operations in fiscal 2015 and thereafter. The Company reviews the appropriate use of unrestricted cash periodically. Except for expenditures related to the Company's ongoing installation activities with respect to its planned new ERP system project and cost related to integration of Rothsay and Darling Ingredients International, no decision has been made as to non-ordinary course cash usages at this time; however, potential usages could include: opportunistic capital expenditures and/or acquisitions and joint ventures; investments relating to the Company’s renewable energy strategy, including, without limitation, potential investments in additional renewable diesel and/or biodiesel projects; investments in response to governmental regulations relating to human and animal food safety or other regulations; unexpected funding required by the legislation, regulation or mass termination of multiemployer plans; and paying dividends or repurchasing stock, subject to limitations under the Amended Credit Agreement and the 5.375 % Notes, as well as suitable cash conservation to withstand adverse commodity cycles.
Each of the factors described above has the potential to adversely impact the Company's liquidity in a variety of ways, including through
reduced raw materials availability, reduced finished product prices, reduced sales, potential inventory buildup, increased bad debt reserves, potential impairment charges and/or higher operating costs.
Sales prices for the principal products that the Company sells are typically influenced by sales prices for agricultural-based ingredients, the prices of which are based on established commodity markets and are subject to volatile changes. Any decline in these prices has the potential to adversely impact the Company's liquidity. Any of a decline in raw material availability, a decline in agricultural-based alternative ingredients prices, increases in energy prices or the impact of U.S. and foreign regulation (including, without limitation, China), changes in foreign exchange rates, imposition of currency controls and currency devaluations has the potential to adversely impact the Company's liquidity. A decline in commodities prices, a rise in energy prices, a slowdown in the U.S. or international economy or other factors, could cause the Company to fail to meet management's expectations or could cause liquidity concerns. CONTRACTUAL OBLIGATIONS AND OTHER COMMERCIAL COMMIT MENTS
The following table summarizes the Company’s expected material contractual payment obligations, including both on- and off-balance
sheet arrangements at January 3, 2015 (in thousands):
Page 57
Total Less than
1 Year 1 – 3 Years
3 – 5 Years
More than 5 Years
Contractual obligations(a):
Long-term debt obligations (b) $ 2,119,028 $ 28,264 $ 64,095 $ 378,706 $ 1,647,963 Operating lease obligations (c) 158,074 32,280 54,541 42,214 29,039 Capital lease obligations (c) 8,560 2,873 4,161 1,360 166 Estimated interest payable (d) 432,183 73,231 143,258 128,984 86,710 Purchase commitments (e) 116,069 116,069 — — — Pension funding obligation (f) 6,464 6,464 — — — Other obligations 24,852 23,264 710 434 444
Total $ 2,865,230 $ 282,445 $ 266,765 $ 551,698 $ 1,764,322
(a) The above table does not reflect uncertain tax positions at January 3, 2015 . The Company's uncertain tax position is approximately $ 8.1 million .
(b) Represents debt obligations outstanding as of January 3, 2015. See Note 10 to the consolidated financial statements.
(c) See Note 9 to the consolidated financial statements.
(d) Interest payable was calculated using the current rate for the debt that was outstanding as of January 3, 2015.
(e) Purchase commitments were determined based on specified contracts for natural gas, diesel fuel and finished product purchases.

The Company's off-balance sheet contractual obligations and commercial commitments as of January 3, 2015 relate to operating lease
obligations, letters of credit, foreign bank guarantees, forward purchase agreements and employment agreements. The Company has excluded these items from the balance sheet in accordance with U.S. GAAP.
The following table summarizes the Company’s other commercial commitments, including both on- and off-balance sheet arrangements that are part of the Company's Amended Credit Agreement and other foreign bank guarantees that are not a part of the Company's Amended Credit Agreement at January 3, 2015 (in thousands):
OFF BALANCE SHEET OBLIGATIONS
Based upon the underlying purchase agreements, the Company has commitments to purchase $ 116.1 million of commodity products, consisting of approximately $ 111.9 million of finished and raw material products and approximately $ 4.2 million of natural gas and diesel fuel, during the next twelve months, which are not included in liabilities on the Company’s balance sheet at January 3, 2015 . These purchase agreements are entered into in the normal course of the Company’s business and are not subject to derivative accounting. The commitments will be recorded on the balance sheet of the Company when delivery of these commodities occurs and ownership passes to the Company during fiscal 2015 , in accordance with U.S. GAAP.
Based upon underlying lease agreements, the Company is obligated to pay approximately $ 32.3 million for operating leases during fiscal
2015 , which are not included in liabilities on the Company’s balance sheet at January 3, 2015 . These lease obligations are included in cost of sales or selling, general and administrative expense on the Company’s Statement of Operations as the underlying lease obligation comes due, in accordance with U.S. GAAP. CRITICAL ACCOUNTING POLICIES
The Company follows certain significant accounting policies when preparing its consolidated financial statements. A complete summary
of these policies is included in Note 1 of Notes to Consolidated Financial Statements.
Certain of the policies require management to make significant and subjective estimates or assumptions that may deviate from actual results. In particular, management makes estimates regarding valuation of inventories, estimates of useful life of long-lived assets related to depreciation and amortization expense, estimates regarding fair value of the Company’s reporting units and future cash flows with respect to assessing potential impairment of both long-lived assets and goodwill, self-insurance, environmental and litigation reserves, pension liability, estimates of income tax expense and estimates of expense related to stock options granted. Each of these estimates is discussed in greater detail in the following discussion. Revenue Recognition
The Company recognizes revenue on sales when products are shipped and the customer takes ownership and assumes risk of loss. Certain
customers may be required to prepay prior to shipment in order to maintain payment protection against certain foreign and domestic sales. These amounts are recorded as unearned revenue and revenue is recognized when the products have shipped and the customer takes ownership and assumes risk of loss. The Company has formula arrangements with certain suppliers whereby the charge or credit for raw materials is tied to published finished product commodity prices after deducting a fixed processing fee incorporated into the formula and is recorded as a cost of sale by line of business. The Company recognizes revenue related to grease trap servicing and industrial residual removal in the fiscal month the trap service or industrial residual removal occurs.
Page 58
(f) Pension funding requirements are determined annually based upon a third party actuarial estimate. The Company expects to make approximately $ 6.5 million in required contributions to domestic and foreign pension plans in fiscal 2015 . The Company is not able to estimate pension funding requirements beyond the next twelve months. The accrued pension benefit liability was approximately $ 66.9 million at the end of fiscal 2014 . The Company knows certain of the multiemployer pension plans that have not terminated to which it contributes and which are not administered by the Company were under-funded as of the latest available information, and while the Company has no ability to calculate a possible current liability for the under-funded multiemployer plan to which the Company contributes, the amounts could be material.
Other commercial commitments:
Standby letters of credit $ 32,198 Foreign bank guarantees 11,173 Total other commercial commitments: $ 43,371
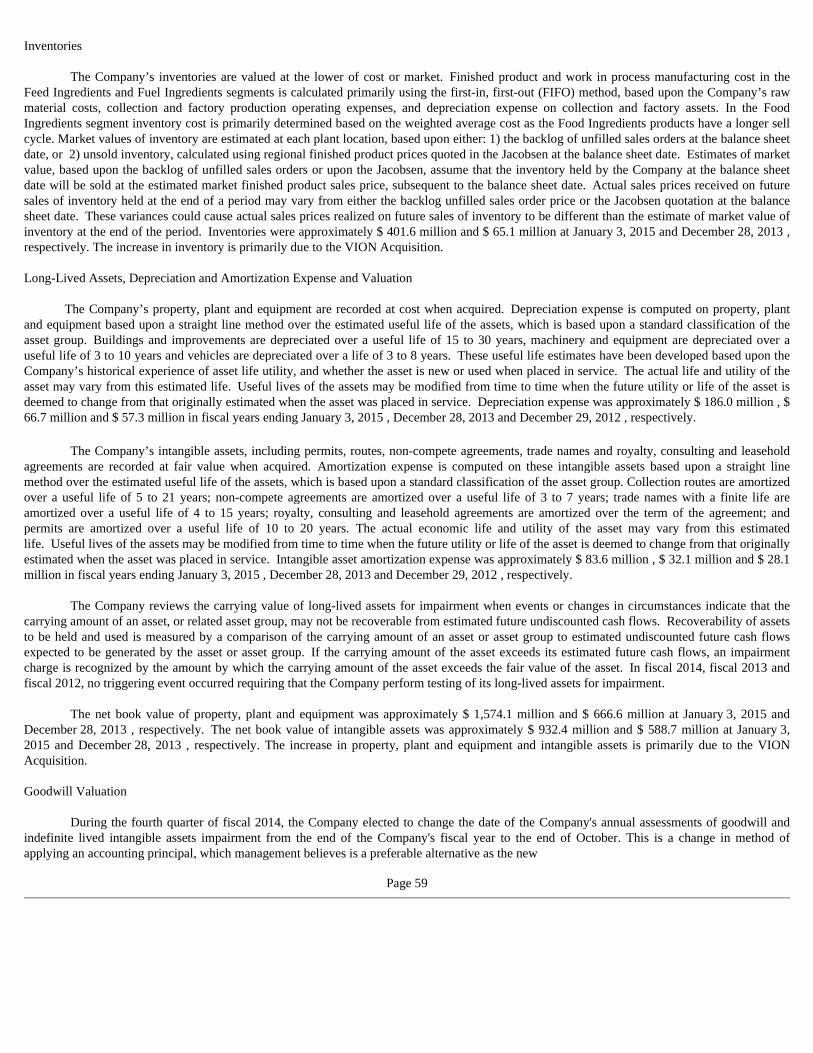
Inventories
The Company’s inventories are valued at the lower of cost or market. Finished product and work in process manufacturing cost in the Feed Ingredients and Fuel Ingredients segments is calculated primarily using the first-in, first-out (FIFO) method, based upon the Company’s raw material costs, collection and factory production operating expenses, and depreciation expense on collection and factory assets. In the Food Ingredients segment inventory cost is primarily determined based on the weighted average cost as the Food Ingredients products have a longer sell cycle. Market values of inventory are estimated at each plant location, based upon either: 1) the backlog of unfilled sales orders at the balance sheet date, or 2) unsold inventory, calculated using regional finished product prices quoted in the Jacobsen at the balance sheet date. Estimates of market value, based upon the backlog of unfilled sales orders or upon the Jacobsen, assume that the inventory held by the Company at the balance sheet date will be sold at the estimated market finished product sales price, subsequent to the balance sheet date. Actual sales prices received on future sales of inventory held at the end of a period may vary from either the backlog unfilled sales order price or the Jacobsen quotation at the balance sheet date. These variances could cause actual sales prices realized on future sales of inventory to be different than the estimate of market value of inventory at the end of the period. Inventories were approximately $ 401.6 million and $ 65.1 million at January 3, 2015 and December 28, 2013 , respectively. The increase in inventory is primarily due to the VION Acquisition. Long-Lived Assets, Depreciation and Amortization Expense and Valuation
The Company’s property, plant and equipment are recorded at cost when acquired. Depreciation expense is computed on property, plant and equipment based upon a straight line method over the estimated useful life of the assets, which is based upon a standard classification of the asset group. Buildings and improvements are depreciated over a useful life of 15 to 30 years, machinery and equipment are depreciated over a useful life of 3 to 10 years and vehicles are depreciated over a life of 3 to 8 years. These useful life estimates have been developed based upon the Company’s historical experience of asset life utility, and whether the asset is new or used when placed in service. The actual life and utility of the asset may vary from this estimated life. Useful lives of the assets may be modified from time to time when the future utility or life of the asset is deemed to change from that originally estimated when the asset was placed in service. Depreciation expense was approximately $ 186.0 million , $ 66.7 million and $ 57.3 million in fiscal years ending January 3, 2015 , December 28, 2013 and December 29, 2012 , respectively.
The Company’s intangible assets, including permits, routes, non-compete agreements, trade names and royalty, consulting and leasehold
agreements are recorded at fair value when acquired. Amortization expense is computed on these intangible assets based upon a straight line method over the estimated useful life of the assets, which is based upon a standard classification of the asset group. Collection routes are amortized over a useful life of 5 to 21 years; non-compete agreements are amortized over a useful life of 3 to 7 years; trade names with a finite life are amortized over a useful life of 4 to 15 years; royalty, consulting and leasehold agreements are amortized over the term of the agreement; and permits are amortized over a useful life of 10 to 20 years. The actual economic life and utility of the asset may vary from this estimated life. Useful lives of the assets may be modified from time to time when the future utility or life of the asset is deemed to change from that originally estimated when the asset was placed in service. Intangible asset amortization expense was approximately $ 83.6 million , $ 32.1 million and $ 28.1 million in fiscal years ending January 3, 2015 , December 28, 2013 and December 29, 2012 , respectively.
The Company reviews the carrying value of long-lived assets for impairment when events or changes in circumstances indicate that the carrying amount of an asset, or related asset group, may not be recoverable from estimated future undiscounted cash flows. Recoverability of assets to be held and used is measured by a comparison of the carrying amount of an asset or asset group to estimated undiscounted future cash flows expected to be generated by the asset or asset group. If the carrying amount of the asset exceeds its estimated future cash flows, an impairment charge is recognized by the amount by which the carrying amount of the asset exceeds the fair value of the asset. In fiscal 2014, fiscal 2013 and fiscal 2012, no triggering event occurred requiring that the Company perform testing of its long-lived assets for impairment.
The net book value of property, plant and equipment was approximately $ 1,574.1 million and $ 666.6 million at January 3, 2015 and December 28, 2013 , respectively. The net book value of intangible assets was approximately $ 932.4 million and $ 588.7 million at January 3, 2015 and December 28, 2013 , respectively. The increase in property, plant and equipment and intangible assets is primarily due to the VION Acquisition. Goodwill Valuation
During the fourth quarter of fiscal 2014, the Company elected to change the date of the Company's annual assessments of goodwill and indefinite lived intangible assets impairment from the end of the Company's fiscal year to the end of October. This is a change in method of applying an accounting principal, which management believes is a preferable alternative as the new
Page 59

date of the assessment is more closely aligned with Company's strategic planning process. The change in assessment date did not delay, accelerate or avoid a potential impairment charge in 2014. The Company performed the annual goodwill and indefinite-lived intangible assets impairment assessments at October 25, 2014 and concluded that the Company's goodwill for all reporting units and all recorded indefinite-lived intangible assets were not impaired as of that date. Goodwill and indefinite lived assets are tested annually or more frequently if events or changes in circumstances indicate that the asset might be impaired. The Company follows a two-step process for testing impairment. First, the fair value of each reporting unit is compared to its carrying value to determine whether an indication of impairment exists. If impairment is indicated, then the fair value of the reporting unit’s goodwill is determined by allocating the unit’s fair value of its assets and liabilities (including any unrecognized intangible assets) as if the reporting unit had been acquired in a business combination. The amount of impairment for goodwill is measured as the excess of its carrying value over its implied fair value.
Based on the Company’s annual impairment testing at October 25, 2014 of fiscal 2014 and year end of fiscal 2013 and fiscal 2012, the fair values of the Company’s reporting units containing goodwill exceeded the related carrying value. However, the fair value of seven of the Company's nine reporting units was less than 30% of its carrying value, which was substantially less than the percentage by which the fair values of the Company's other two reporting units with goodwill exceeded their carrying values. It is possible, depending upon a number of factors that are not determinable at this time or within the control of the Company, that the fair value of these seven reporting units could decrease in the future and result in an impairment to goodwill. The amount of goodwill allocated to these reporting units was approximately $ 930.7 million . The Company's management believes the biggest risk to these reporting units is decreasing finished product prices and an economic slowdown that would impact raw material suppliers. Goodwill was approximately $ 1,320.4 million and $ 701.6 million at January 3, 2015 and December 28, 2013 , respectively. The increase in goodwill is primarily due to the VION Acquisition. Self Insurance, Environmental and Legal Reserves
The Company’s workers compensation, auto and general liability policies contain significant deductibles or self insured retentions. The Company estimates and accrues for its expected ultimate claim costs related to accidents occurring during each fiscal year and carries this accrual as a reserve until these claims are paid by the Company. In developing estimates for self insured losses, the Company utilizes its staff, a third party actuary and outside counsel as sources of information and judgment as to the expected undiscounted future costs of the claims. The Company accrues reserves related to environmental and litigation matters based on estimated undiscounted future costs. With respect to the Company’s self insurance, environmental and litigation reserves, estimates of reserve liability could change if future events are different than those included in the estimates of the actuary, consultants and management of the Company. At January 3, 2015 and December 28, 2013 , the reserves for self insurance, environmental and litigation contingencies aggregated to approximately $ 54.9 million and $ 35.5 million , respectively. The Company has insurance recovery receivables of approximately $ 11.4 million and $ 8.8 million , respectively, related to these liabilities.
Pension Liability
The Company has retirement and pension plans covering a substantial number of its domestic and foreign employees. Most retirement benefits to employees are provided by the Company under separate final-pay noncontributory and contributory defined benefit pension plans for all salaried and hourly employees (excluding those employees covered by a union-sponsored plan), who meet service and age requirements. Defined benefits are based principally on length of service and earnings patterns during the five years preceding retirement. Pension expense and pension liability recorded by the Company is based upon an annual actuarial estimate provided by a third party administrator. Factors included in estimates of current year pension expense and pension liability at the balance sheet date include estimated future service period of employees, estimated future pay of employees, estimated future retirement ages of employees, and the projected time period of pension benefit payments. Two of the most significant assumptions used to calculate future pension obligations are the discount rate applied to pension liability and the expected rate of return on pension plan assets. These assumptions and estimates are subject to the risk of change over time, and each factor has inherent uncertainties which neither the actuary nor the Company is able to control or to predict with certainty. Effective January 1, 2012, the Company's Board of Directors authorized the Company to proceed with the restructuring of its domestic retirement benefit program to include the closing of Darling's domestic salaried and hourly defined benefit plans to new participants as well as the freezing of service and wage accruals thereunder effective December 31, 2011 (a curtailment of these plans for financial reporting purposes) and the enhancing of benefits under the Company's domestic defined contribution plans. The Company-sponsored domestic hourly union plan has not been curtailed; however, several locations of the Company-sponsored domestic hourly union plan have been curtailed as a result of collective bargaining renewals for those sites. See Note 15 of Notes to Consolidated Financial Statements for information on the Company's domestic and foreign pension plans.
The discount rate applied to the Company’s pension liability is the interest rate used to calculate the present value of the pension benefit obligation. The weighted average discount rate was 2.79% and 4.66% at January 3, 2015 and December 28, 2013 , respectively. The net periodic benefit cost for fiscal 2015 would increase by approximately $ 2.4 million if the discount rate was
Page 60

0.5% lower at a weighted average of 2.29% . The net periodic benefit cost for fiscal 2015 would decrease by approximately $ 2.0 million if the discount rate was 0.5% higher at a weighted average of 3.29% .
The expected rate of return on the Company’s pension plan assets is the interest rate used to calculate future returns on investment of the plan assets. The expected return on plan assets is a long-term assumption whose accuracy can only be assessed over a long period of time. The weighted average expected return on pension plan assets was 5.06% and 7.35% for fiscal 2014 and fiscal 2013, respectively. During fiscal 2014, the Company’s actual return on pension plan assets was a gain of $ 67.1 million or approximately 23.1% of pension plan assets as compared to fiscal 2013 where the Company’s actual return on pension plan assets was a gain of $ 13.1 million or approximately 12.3% of pension plan assets.
The Company has recorded a net pension liability of approximately $ 66.9 million and $ 11.1 million at January 3, 2015 and December 28, 2013 , respectively. The Company’s net pension cost was approximately $ 6.1 million , $ 3.9 million and $ 3.9 million for the fiscal years ending January 3, 2015 , December 28, 2013 and December 29, 2012 , respectively. The projected net periodic pension expense for fiscal 2015 is expected to increase by approximately $ 4.5 million as compared to fiscal 2014. Income Taxes
In calculating net income, the Company includes estimates in the calculation of income tax expense, the resulting tax liability and in future realization of deferred tax assets that arise from temporary differences between financial statement reporting and tax recognition of revenue and expense. The Company’s deferred tax assets include a net operating loss carry-forward which is limited to approximately $ 0.7 million per year in future utilization due to the change in control resulting from the May 2002 recapitalization of the Company. Valuation allowances for deferred tax assets are recorded when it is more likely than not that deferred tax assets will not be realized.
Stock Option Expense
The calculation of expense of stock options issued utilizes the Black-Scholes mathematical model which estimates the fair value of the option award to the holder and the compensation expense to the Company, based upon estimates of volatility, risk-free rates of return at the date of issue and projected vesting of the option grants. The Company recorded compensation expense related to stock options expense for the year ended January 3, 2015 , December 28, 2013 and December 29, 2012 of approximately $ 2.3 million , $ 1.3 million and $ 1.0 million , respectively. NEW ACCOUNTING PRONOUNCEMENTS
In May 2014, the FASB issued Accounting Standards Update ("ASU") No. 2014-09, Revenue from Contracts with Customers (Topic 606), which will supersede nearly all existing revenue recognition guidance under GAAP. The new ASU introduces a new five-step revenue recognition model in which an entity should recognize revenue to depict the transfer of promised goods or services to customers in an amount that reflects the consideration to which the entity expects to be entitled in exchange for those goods or services. In addition, this ASU requires disclosures sufficient to enable the users to understand the nature, amount, timing, and uncertainty of revenue and cash flows arising from contracts with customers, including qualitative and quantitative disclosures about contracts with customers, significant judgments and changes in judgments, and assets recognized from the costs to obtain or fulfill a contract. This ASU allows for either full retrospective or modified retrospective adoption and will become effective for the Company for the annual reporting period beginning after December 15, 2016, with early adoption not permitted. The Company is currently evaluating the impact of this standard.
In July 2013, the FASB issued ASU No. 2013-11, Presentation of an Unrecognized Tax Benefit When a Net Operating Loss Carryforward,
a Similar Tax Loss, or a Tax Credit Carryforward Exists. The ASU amends ASC Topic 740, Income Taxes The new standard requires, unless certain conditions exist, an unrecognized tax benefit to be presented as a reduction to a deferred tax asset in the financial statements for a net operating loss carryforward, a similar tax loss, or a tax credit carryforward. The standard will become effective for the Company prospectively for annual periods beginning after December 15, 2013, and interim periods within those years, with early adoption permitted. Retrospective application is also permitted. The Company adopted this standard in the first quarter of fiscal 2014. The adoption did not have a material impact on the Company's consolidated financial statements.
FORWARD LOOKING STATEMENTS
This Annual Report on Form 10-K includes “forward-looking” statements that involve risks and uncertainties. The words "believe," "anticipate," "expect," "estimate," "intend," "could," "may," "will," "should," "planned," "potential," and similar expressions identify forward-looking statements. All statements other than statements of historical facts included in this report,
Page 61

including, without limitation, the statements under the sections entitled "Business," "Management's Discussion and Analysis of Financial Condition and Results of Operations" and "Legal Proceedings" and located elsewhere herein regarding industry prospects and the Company's financial position are forward-looking statements. Actual results could differ materially from those discussed in the forward-looking statements as a result of certain factors, including many that are beyond the control of the Company. Although the Company believes that the expectations reflected in these forward-looking statements are reasonable, it can give no assurance that these expectations will prove to be correct.
In addition to those factors discussed under the heading "Risk Factors" in Item 1A of this report and elsewhere in this report, and in the
Company's other public filings with the SEC, important factors that could cause actual results to differ materially from the Company's expectations include: existing and unknown future limitations on the ability of the Company's direct and indirect subsidiaries to upstream their profits to the Company for payments on the Company's indebtedness or other purposes; unanticipated costs or operating problems related to the acquisition and integration of Rothsay and Darling Ingredients International (including transactional costs and integration of the new ERP system); global demands for bio-fuels and grain and oilseed commodities, which have exhibited volatility, and can impact the cost of feed for cattle, hogs and poultry, thus affecting available rendering feedstock and selling prices for the Company’s products; reductions in raw material volumes available to the Company due to weak margins in the meat production industry as a result of higher feed costs, reduced consumer demand or other factors, reduced volume from food service establishments, reduced demand for animal feed, or otherwise; reduced finished product prices; changes to worldwide government policies relating to renewable fuels and GHG emissions that adversely affect programs like RFS2 and tax credits for biofuels both in the Unites States and abroad; possible product recall resulting from developments relating to the discovery of unauthorized adulterations to food or food additives; the occurrence of Bird Flu, H1N1, BSE, PED or other diseases associated with animal origin in the United States or elsewhere; unanticipated costs and/or reductions in raw material volumes related to the Company’s compliance with the existing or unforeseen new U.S. or foreign (including, without limitation, China) regulations (including new or modified animal feed, Bird Flu, PED or BSE or similar or unanticipated regulations) affecting the industries in which the Company operates or its value added products; risks associated with the DGD Joint Venture, including possible unanticipated operating disruptions; risks relating to possible third party claims of intellectual property infringement; increased contributions to the Company’s pension and benefit plans, including multiemployer and employer-sponsored defined benefit pension plans as required by legislation, regulation or other applicable U.S. or foreign law or resulting from a U.S. mass withdrawal event; bad debt write-offs; loss of or failure to obtain necessary permits and registrations; continued or escalated conflict in the Middle East, North Korea, Ukraine or elsewhere; and/or unfavorable export or import markets. These factors, coupled with volatile prices for natural gas and diesel fuel, climate conditions, currency exchange fluctuations, general performance of the U.S. and global economies, disturbances in world financial, credit, commodities and stock markets, and any decline in consumer confidence and discretionary spending, including the inability of consumers and companies to obtain credit due to lack of liquidity in the financial markets, among others, could negatively impact the Company's results of operations. Among other things, future profitability may be affected by the Company’s ability to grow its business, which faces competition from companies that may have substantially greater resources than the Company The Company cautions readers that all forward-looking statements speak only as of the date made, and the Company undertakes no obligation to update any forward looking statements, whether as a result of changes in circumstances, new events or otherwise.
ITEM 7A. QUANTITATIVE AND QUALITATIVE DISCLOSURES ABOUT MARKET RISK
Market risks affecting the Company include exposures to changes in prices of the finished products the Company sells, interest rates on debt, availability of raw material supplies and the price of natural gas and diesel fuel used in the Company's plants. Raw materials available to the Company are impacted by seasonal factors, including holidays, when raw material volume declines; warm weather, which can adversely affect the quality of raw material processed and finished products produced; and cold weather, which can impact the collection of raw material. Predominantly all of the Company’s finished products are commodities that are generally sold at prices prevailing at the time of sale. Additionally, with acquisition of foreign entities we are exposed to foreign currency exchange risks, imposition of currency controls and the possibility of currency devaluation.
The Company makes limited use of derivative instruments to manage cash flow risks related to natural gas usage, diesel fuel usage,
inventory, forecasted sales and foreign currency exchange rates. The Company does not use derivative instruments for trading purposes. Natural gas swaps and options are entered into with the intent of managing the overall cost of natural gas usage by reducing the potential impact of seasonal weather demands on natural gas that increases natural gas prices. Heating oil swaps and options are entered into with the intent of managing the overall cost of diesel fuel usage by reducing the potential impact of seasonal weather demands on diesel fuel that increases diesel fuel prices. Corn options and future contracts are entered into with the intent of managing U.S. forecasted sales of BBP by reducing the impact of changing prices. Foreign currency forward contracts are entered into to mitigate the foreign exchange rate risk for transactions designated in a currency other than the local functional currency. The interest rate swaps and the natural gas swaps are subject to the requirements of FASB authoritative guidance. Some of the Company's natural gas and diesel fuel instruments are not subject to the requirements of FASB authoritative guidance because some of the natural gas and diesel fuel instruments qualify as normal purchases as defined in FASB authoritative guidance. At January 3, 2015 , the Company had corn option contracts contracts outstanding that qualified and were designated for hedge accounting as well as corn option contracts, heating oil swap contracts and foreign currency forward contracts that did not qualify and were not designated for hedge accounting.
In fiscal 2013 and fiscal 2014 , the Company has entered into natural gas swap contracts that are considered cash flow hedges. Under the
terms of the natural gas swap contracts, the Company fixed the expected purchase cost of a portion of its plants expected natural gas usage. As of January 3, 2015 , all contracts have settled and there are no remaining outstanding contracts.
In fiscal 2013 and fiscal 2014 , the Company entered into corn option contracts that are considered cash flow hedges. Under the terms of
the corn option contracts, the Company hedged a portion of its U.S. forecasted sales of BBP into the second quarter of fiscal 2015 . As of January 3, 2015 , the aggregate fair value of these corn option contracts was $ 0.2 million and is included in other current assets on the balance sheet, with an
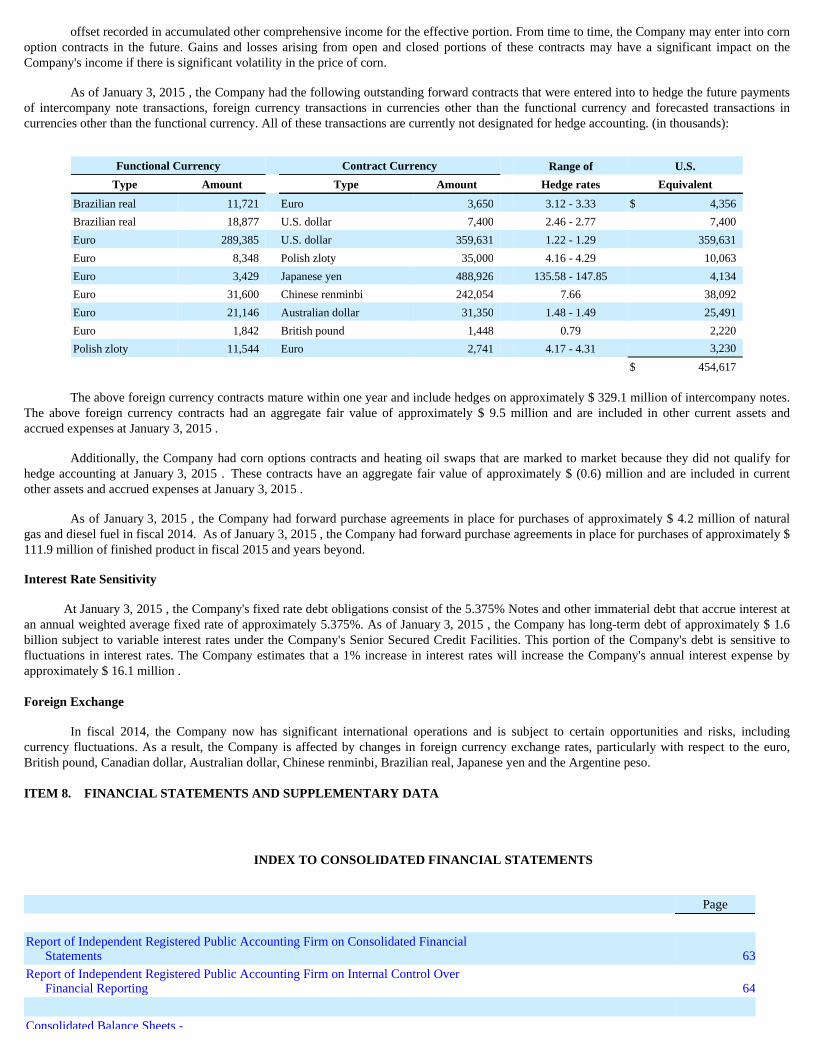
offset recorded in accumulated other comprehensive income for the effective portion. From time to time, the Company may enter into corn option contracts in the future. Gains and losses arising from open and closed portions of these contracts may have a significant impact on the Company's income if there is significant volatility in the price of corn.
As of January 3, 2015 , the Company had the following outstanding forward contracts that were entered into to hedge the future payments
of intercompany note transactions, foreign currency transactions in currencies other than the functional currency and forecasted transactions in currencies other than the functional currency. All of these transactions are currently not designated for hedge accounting. (in thousands):
The above foreign currency contracts mature within one year and include hedges on approximately $ 329.1 million of intercompany notes.
The above foreign currency contracts had an aggregate fair value of approximately $ 9.5 million and are included in other current assets and accrued expenses at January 3, 2015 .
Additionally, the Company had corn options contracts and heating oil swaps that are marked to market because they did not qualify for
hedge accounting at January 3, 2015 . These contracts have an aggregate fair value of approximately $ (0.6) million and are included in current other assets and accrued expenses at January 3, 2015 .
As of January 3, 2015 , the Company had forward purchase agreements in place for purchases of approximately $ 4.2 million of natural gas and diesel fuel in fiscal 2014. As of January 3, 2015 , the Company had forward purchase agreements in place for purchases of approximately $ 111.9 million of finished product in fiscal 2015 and years beyond.
Interest Rate Sensitivity
At January 3, 2015 , the Company's fixed rate debt obligations consist of the 5.375% Notes and other immaterial debt that accrue interest at an annual weighted average fixed rate of approximately 5.375%. As of January 3, 2015 , the Company has long-term debt of approximately $ 1.6 billion subject to variable interest rates under the Company's Senior Secured Credit Facilities. This portion of the Company's debt is sensitive to fluctuations in interest rates. The Company estimates that a 1% increase in interest rates will increase the Company's annual interest expense by approximately $ 16.1 million .
Foreign Exchange
In fiscal 2014, the Company now has significant international operations and is subject to certain opportunities and risks, including currency fluctuations. As a result, the Company is affected by changes in foreign currency exchange rates, particularly with respect to the euro, British pound, Canadian dollar, Australian dollar, Chinese renminbi, Brazilian real, Japanese yen and the Argentine peso. ITEM 8. FINANCIAL STATEMENTS AND SUPPLEMENTARY D ATA
INDEX TO CONSOLIDATED FINANCIAL STATEMENTS
Functional Currency Contract Currency Range of U.S.
Type Amount Type Amount Hedge rates Equivalent
Brazilian real 11,721 Euro 3,650 3.12 - 3.33 $ 4,356 Brazilian real 18,877 U.S. dollar 7,400 2.46 - 2.77 7,400 Euro 289,385 U.S. dollar 359,631 1.22 - 1.29 359,631 Euro 8,348 Polish zloty 35,000 4.16 - 4.29 10,063 Euro 3,429 Japanese yen 488,926 135.58 - 147.85 4,134 Euro 31,600 Chinese renminbi 242,054 7.66 38,092 Euro 21,146 Australian dollar 31,350 1.48 - 1.49 25,491 Euro 1,842 British pound 1,448 0.79 2,220 Polish zloty 11,544 Euro 2,741 4.17 - 4.31 3,230 $ 454,617
Page
Report of Independent Registered Public Accounting Firm on Consolidated Financial Statements 63
Report of Independent Registered Public Accounting Firm on Internal Control Over Financial Reporting 64
Consolidated Balance Sheets -

All other schedules are omitted since the required information is not present or is not present in amounts sufficient to require submission of the schedule, or because the information required is included in the consolidated financial statements and notes thereto.
Page 62
January 3, 2015 and December 28, 2013 66
Consolidated Statements of Operations -
Three years ended January 3, 2015 67
Consolidated Statements of Comprehensive Income -
Three years ended January 3, 2015 68
Consolidated Statements of Stockholders’ Equity -
Three years ended January 3, 2015 69
Consolidated Statements of Cash Flows -
Three years ended January 3, 2015 70
Notes to Consolidated Financial Statements 71

DARLING INGREDIENTS INC. AND SUBSIDIARIES
Report of Independent Registered Public Accounting Firm
The Board of Directors and Stockholders Darling Ingredients Inc.:
We have audited the accompanying consolidated balance sheets of Darling Ingredients Inc. and subsidiaries (Company) as of January 3, 2015 and December 28, 2013, and the related consolidated statements of operations, comprehensive income/ (loss), stockholders’ equity, and cash flows for each of the years in the three-year period ended January 3, 2015. These consolidated financial statements are the responsibility of the Company’s management. Our responsibility is to express an opinion on these consolidated financial statements based on our audits.
We conducted our audits in accordance with the standards of the Public Company Accounting Oversight Board (United States). Those standards require that we plan and perform the audit to obtain reasonable assurance about whether the financial statements are free of material misstatement. An audit includes examining, on a test basis, evidence supporting the amounts and disclosures in the financial statements. An audit also includes assessing the accounting principles used and significant estimates made by management, as well as evaluating the overall financial statement presentation. We believe that our audits provide a reasonable basis for our opinion.
In our opinion, the consolidated financial statements referred to above present fairly, in all material respects, the financial position of Darling Ingredients Inc. and subsidiaries as of January 3, 2015 and December 28, 2014, and the results of their operations and their cash flows for each of the years in the three-year period ended January 3, 2015, in conformity with U.S. generally accepted accounting principles.
As discussed in Note 1 to the consolidated financial statements, the Company has elected to change the date of the Company’s annual assessments of goodwill and indefinite lived intangible assets impairment in 2014.
We also have audited, in accordance with the standards of the Public Company Accounting Oversight Board (United States), Darling Ingredients Inc.’s internal control over financial reporting as of January 3, 2015, based on criteria established in Internal Control - Integrated Framework (2013) issued by the Committee of Sponsoring Organizations of the Treadway Commission (COSO), and our report dated March 4, 2015 expressed an unqualified opinion on the effectiveness of the Company’s internal control over financial reporting.
/s/ KPMG LLP
Dallas, Texas March 4, 2015
Page 63
DARLING INGREDIENTS INC. AND SUBSIDIARIES
Report of Independent Registered Public Accounting Firm The Board of Directors and Stockholders Darling Ingredients Inc.:
We have audited Darling Ingredients Inc.’s (Company) internal control over financial reporting as of January 3, 2015, based on criteria established in Internal Control - Integrated Framework (2013) issued by the Committee of Sponsoring Organizations of the Treadway Commission (COSO). Darling Ingredients Inc.’s management is responsible for maintaining effective internal control over financial reporting and for its assessment of the effectiveness of internal control over financial reporting, included in the accompanying Management’s Annual Report on Internal Control over Financial Reporting (Item 9A). Our responsibility is to express an opinion on the Company’s internal control over financial reporting based on our audit.
We conducted our audit in accordance with the standards of the Public Company Accounting Oversight Board (United States). Those standards require that we plan and perform the audit to obtain reasonable assurance about whether effective internal control over financial reporting was maintained in all material respects. Our audit included obtaining an understanding of internal control over financial reporting, assessing the risk that a material weakness exists, and testing and evaluating the design and operating effectiveness of internal control based on the assessed risk. Our audit also included performing such other procedures as we considered necessary in the circumstances. We believe that our audit provides a reasonable basis for our opinion.
A company’s internal control over financial reporting is a process designed to provide reasonable assurance regarding the reliability of financial reporting and the preparation of financial statements for external purposes in accordance with generally accepted accounting principles. A company’s internal control over financial reporting includes those policies and procedures that (1) pertain to the maintenance of records that, in reasonable detail, accurately and fairly reflect the transactions and dispositions of the assets of the company; (2) provide reasonable assurance that transactions are recorded as necessary to permit preparation of financial statements in accordance with generally accepted accounting principles, and that receipts and expenditures of the company are being made only in accordance with authorizations of management and directors of the company; and (3) provide reasonable assurance regarding prevention or timely detection of unauthorized acquisition, use, or disposition of the company’s assets that could have a material effect on the financial statements.
Because of its inherent limitations, internal control over financial reporting may not prevent or detect misstatements. Also, projections of any evaluation of effectiveness to future periods are subject to the risk that controls may become inadequate because of changes in conditions, or that the degree of compliance with the policies or procedures may deteriorate.
In our opinion, Darling Ingredients Inc. maintained, in all material respects, effective internal control over financial reporting as of January 3, 2015, based on criteria established in Internal Control - Integrated Framework (2013) issued by the Committee of Sponsoring Organizations of the Treadway Commission (COSO).
Page 64
During 2014, the Company acquired VION Ingredients and management excluded from its assessment of the effectiveness of Company’s internal control over financial reporting as of January 3, 2015, VION Ingredients’ internal control over financial reporting associated with total assets of $2,849 million and total revenues of $2,065 million included in the consolidated financial statements of Darling Ingredients Inc. and subsidiaries as of and for the year ended January 3, 2015. Our audit of internal control over financial reporting of the Company also excluded an evaluation of the internal control over financial reporting of VION Ingredients.
We also have audited, in accordance with the standards of the Public Company Accounting Oversight Board (United States), the consolidated balance sheets of Darling Ingredients Inc. and subsidiaries as of January 3, 2015 and December 28, 2013, and the related consolidated statements of operations, comprehensive income / (loss), stockholders’ equity, and cash flows for each of the years in the three-year period ended January 3, 2015, and our report dated March 4, 2015 expressed an unqualified opinion on those consolidated financial statements.
/s/ KPMG LLP
Dallas, Texas March 4, 2015
Page 65

DARLING INGREDIENTS INC. AND SUBSIDIARIES
Consolidated Balance Sheets
January 3, 2015 and December 28, 2013 (in thousands, except share and per share data)
ASSETS
January 3, 2015
December 28, 2013
Current assets:
Cash and cash equivalents $ 108,784 $ 870,857 Restricted cash 343 354
Accounts receivable, less allowance for bad debts of $10,835 at January 3, 2015 and $2,241 at December 28, 2013 409,779 112,844
Inventories 401,613 65,133 Prepaid expenses 44,629 14,223 Income taxes refundable 22,140 14,512 Other current assets 21,324 32,290 Deferred income taxes 45,001 17,289
Total current assets 1,053,613 1,127,502
Property, plant and equipment, net 1,574,116 666,573 Intangible assets, less accumulated amortization of $184,909 at January 3, 2015 and $105,070 at December 28, 2013 932,413 588,664 Goodwill 1,320,419 701,637 Investment in unconsolidated subsidiaries 202,712 115,114 Other assets 71,009 44,643 Deferred income taxes 16,431 — $ 5,170,713 $ 3,244,133
LIABILITIES AND STOCKHOLDERS’ EQUITY Current liabilities:
Current portion of long-term debt $ 54,401 $ 19,888 Accounts payable, principally trade 168,518 43,742 Income taxes payable 4,363 — Accrued expenses 256,119 113,174 Deferred income taxes 642 —
Total current liabilities 484,043 176,804
Long-term debt, net of current portion 2,098,039 866,947 Other noncurrent liabilities 114,700 40,671 Deferred income taxes 422,797 138,759
Total liabilities 3,119,579 1,223,181
Commitments and contingencies
Stockholders’ equity: Common stock, $.01 par value; 250,000,000 shares authorized, 166,213,793 and
165,261,003 shares issued at January 3, 2015 and December 28, 2013, respectively 1,662 1,653 Additional paid-in capital 1,479,637 1,454,250 Treasury stock, at cost; 1,501,130 and 993,578 shares at January 3, 2015 and December 28, 2013, respectively (23,207 ) (13,271 )
Accumulated other comprehensive loss (177,060 ) (29,423 )
Retained earnings 671,958 607,743 Total Darling's stockholders’ equity 1,952,990 2,020,952
Noncontrolling interests 98,144 — Total stockholders’ equity 2,051,134 2,020,952
$ 5,170,713 $ 3,244,133

The accompanying notes are an integral part of these consolidated financial statements.
Page 66

DARLING INGREDIENTS INC. AND SUBSIDIARIES
Consolidated Statements of Operations
Three years ended January 3, 2015 (in thousands, except per share data)
The accompanying notes are an integral part of these consolidated financial statements.
Page 67
January 3,
2015 December 28,
2013 December 29,
2012
Net sales $ 3,956,443 $ 1,802,268 $ 1,772,552 Costs and expenses:
Cost of sales and operating expenses 3,123,171 1,339,819 1,303,727 Selling, general and administrative expenses 374,580 170,825 151,713 Depreciation and amortization 269,517 98,787 85,371 Acquisition and integration costs 24,667 23,271 —
Total costs and expenses 3,791,935 1,632,702 1,540,811 Operating income 164,508 169,566 231,741
Other expense: Interest expense (135,416 ) (38,108 ) (24,054 )
Foreign currency gains/(losses) (13,548 ) 28,107 — Other income/(expense), net 299 (3,547 ) 1,760
Total other expense (148,665 ) (13,548 ) (22,294 )
Equity in net income/(loss) of unconsolidated subsidiaries 65,609 7,660 (2,662 )
Income from operations before income taxes 81,452 163,678 206,785
Income taxes 13,141 54,711 76,015
Net income 68,311 108,967 130,770
Net (income)/loss attributable to noncontrolling interests (4,096 ) — —
Net income attributable to Darling $ 64,215 $ 108,967 $ 130,770
Net income per share: Basic $ 0.39 $ 0.91 $ 1.11
Diluted $ 0.39 $ 0.91 $ 1.11

DARLING INGREDIENTS INC. AND SUBSIDIARIES
CONSOLIDATED STATEMENTS OF COMPREHENSIVE INCOME/(LO SS)
Three years ended January 3, 2015 (in thousands)
The accompanying notes are an integral part of these consolidated financial statements.
Page 68
January 3, 2015 December 28,
2013 December 29,
2012
Net income $ 68,311 $ 108,967 $ 130,770 Other comprehensive income/(loss), net of tax:
Foreign currency translation (125,884 ) (14,502 ) — Pension adjustments (20,381 ) 15,140 (1,169 )
Natural gas swap derivative adjustments (113 ) 127 391 Corn option derivative adjustments (1,259 ) 1,141 194 Interest rate swap derivative adjustments — — 159
Total other comprehensive income/(loss), net of tax (147,637 ) 1,906 (425 )
Total comprehensive income/(loss) (79,326 ) 110,873 130,345 Comprehensive income attributable to noncontrolling interests 6,200 — —
Comprehensive income/(loss) attributable to Darling $ (73,126 ) $ 110,873 $ 130,345
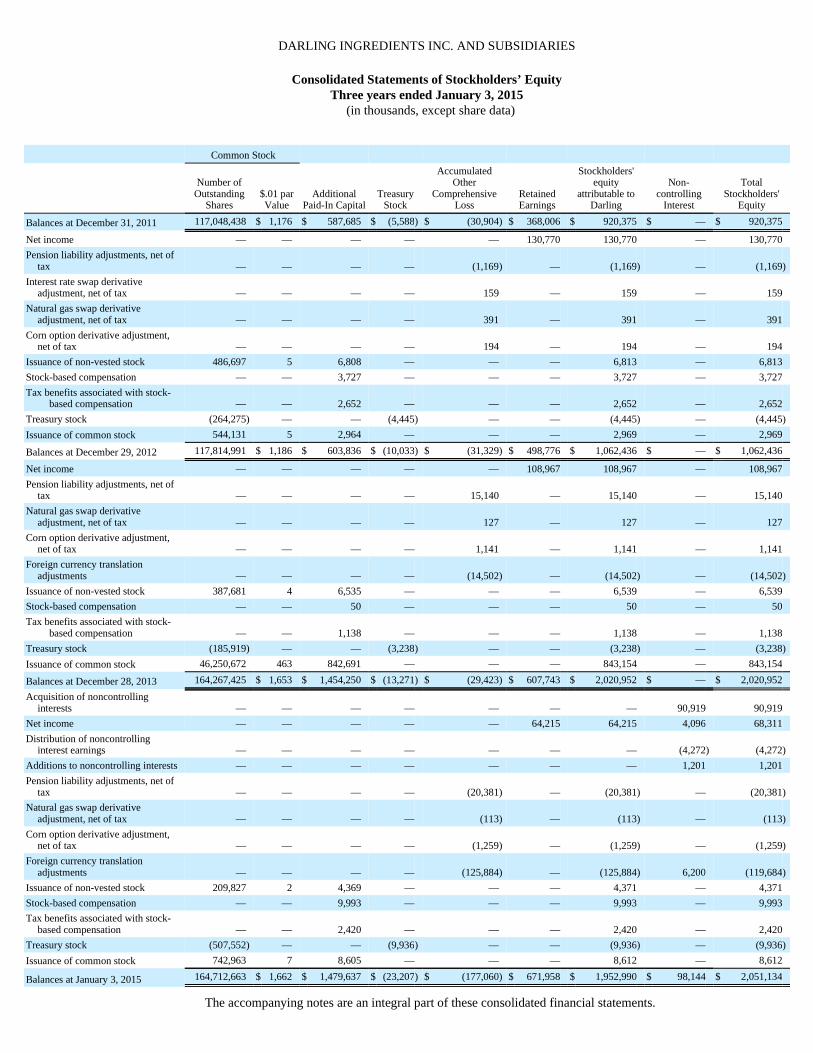
DARLING INGREDIENTS INC. AND SUBSIDIARIES
Consolidated Statements of Stockholders’ Equity
Three years ended January 3, 2015 (in thousands, except share data)
The accompanying notes are an integral part of these consolidated financial statements.
Common Stock
Number of Outstanding
Shares $.01 par Value
Additional Paid-In Capital
Treasury Stock
Accumulated Other
Comprehensive Loss
Retained Earnings
Stockholders' equity
attributable to Darling
Non-controlling
Interest
Total Stockholders'
Equity
Balances at December 31, 2011 117,048,438 $ 1,176 $ 587,685 $ (5,588 ) $ (30,904 ) $ 368,006 $ 920,375 $ — $ 920,375 Net income — — — — — 130,770 130,770 — 130,770 Pension liability adjustments, net of
tax — — — — (1,169 ) — (1,169 ) — (1,169 )
Interest rate swap derivative adjustment, net of tax — — — — 159 — 159 — 159
Natural gas swap derivative adjustment, net of tax — — — — 391 — 391 — 391
Corn option derivative adjustment, net of tax — — — — 194 — 194 — 194
Issuance of non-vested stock 486,697 5 6,808 — — — 6,813 — 6,813 Stock-based compensation — — 3,727 — — — 3,727 — 3,727 Tax benefits associated with stock-
based compensation — — 2,652 — — — 2,652 — 2,652 Treasury stock (264,275 ) — — (4,445 ) — — (4,445 ) — (4,445 )
Issuance of common stock 544,131 5 2,964 — — — 2,969 — 2,969 Balances at December 29, 2012 117,814,991 $ 1,186 $ 603,836 $ (10,033 ) $ (31,329 ) $ 498,776 $ 1,062,436 $ — $ 1,062,436 Net income — — — — — 108,967 108,967 — 108,967 Pension liability adjustments, net of
tax — — — — 15,140 — 15,140 — 15,140 Natural gas swap derivative
adjustment, net of tax — — — — 127 — 127 — 127 Corn option derivative adjustment,
net of tax — — — — 1,141 — 1,141 — 1,141 Foreign currency translation
adjustments — — — — (14,502 ) — (14,502 ) — (14,502 )
Issuance of non-vested stock 387,681 4 6,535 — — — 6,539 — 6,539 Stock-based compensation — — 50 — — — 50 — 50 Tax benefits associated with stock-
based compensation — — 1,138 — — — 1,138 — 1,138 Treasury stock (185,919 ) — — (3,238 ) — — (3,238 ) — (3,238 )
Issuance of common stock 46,250,672 463 842,691 — — — 843,154 — 843,154 Balances at December 28, 2013 164,267,425 $ 1,653 $ 1,454,250 $ (13,271 ) $ (29,423 ) $ 607,743 $ 2,020,952 $ — $ 2,020,952 Acquisition of noncontrolling
interests — — — — — — — 90,919 90,919 Net income — — — — — 64,215 64,215 4,096 68,311 Distribution of noncontrolling
interest earnings — — — — — — — (4,272 ) (4,272 )
Additions to noncontrolling interests — — — — — — — 1,201 1,201 Pension liability adjustments, net of
tax — — — — (20,381 ) — (20,381 ) — (20,381 )
Natural gas swap derivative adjustment, net of tax — — — — (113 ) — (113 ) — (113 )
Corn option derivative adjustment, net of tax — — — — (1,259 ) — (1,259 ) — (1,259 )
Foreign currency translation adjustments — — — — (125,884 ) — (125,884 ) 6,200 (119,684 )
Issuance of non-vested stock 209,827 2 4,369 — — — 4,371 — 4,371 Stock-based compensation — — 9,993 — — — 9,993 — 9,993 Tax benefits associated with stock-
based compensation — — 2,420 — — — 2,420 — 2,420 Treasury stock (507,552 ) — — (9,936 ) — — (9,936 ) — (9,936 )
Issuance of common stock 742,963 7 8,605 — — — 8,612 — 8,612 Balances at January 3, 2015 164,712,663 $ 1,662 $ 1,479,637 $ (23,207 ) $ (177,060 ) $ 671,958 $ 1,952,990 $ 98,144 $ 2,051,134

Page 69

DARLING INGREDIENTS INC. AND SUBSIDIARIES
Consolidated Statements of Cash Flows
Three years ended January 3, 2015 (in thousands)
January 3,
2015 December 28,
2013 December 29,
2012
Cash flows from operating activities:
Net income $ 68,311 $ 108,967 $ 130,770 Adjustments to reconcile net income to net cash provided by operating activities:
Depreciation and amortization 269,517 98,787 85,371 Deferred income taxes (21,216 ) 24,593 10,338 Loss/(gain) on sale of assets (2,437 ) (1,245 ) 1,099 Gain on insurance proceeds from insurance settlement (1,550 ) (1,981 ) (4,272 )
Increase/(decrease) in long-term pension liability 9,593 (9,010 ) 2,790 Stock-based compensation expense 20,807 9,433 8,904 Write-off deferred loan costs 4,330 — 725 Deferred loan cost amortization 9,949 3,451 3,042 Equity in net (income)/loss of unconsolidated subsidiary (65,609 ) (7,660 ) 2,662 Unrealized gain on foreign currency hedge — (27,516 ) —
Changes in operating assets and liabilities, net of effects from acquisitions:
Accounts receivable 982 4,424 (2,324 )
Income taxes refundable (22,451 ) (15,316 ) 17,845 Inventories and prepaid expenses (11,194 ) 2,059 (15,168 )
Accounts payable and accrued expenses (31,223 ) 8,521 3,923 Other 47,363 13,214 3,832
Net cash provided by operating activities 275,172 210,721 249,537 Cash flows from investing activities:
Capital expenditures (228,918 ) (118,307 ) (115,413 )
Acquisitions, net of cash acquired (2,094,400 ) (734,075 ) (3,000 )
Investment in unconsolidated subsidiary — (44,959 ) (43,424 )
Gross proceeds from sale of property, plant and equipment and other assets 9,262 2,358 3,870 Proceeds from insurance settlement 1,550 1,981 4,272 Payments related to routes and other intangibles (11,288 ) (2,423 ) (137 )
Net cash used in investing activities (2,323,794 ) (895,425 ) (153,832 )
Cash flows from financing activities: Proceeds from long-term debt 1,842,184 344,704 — Payments on long-term debt (333,762 ) (580 ) (30,032 )
Borrowings from revolving credit facility 170,143 293,235 — Payments on revolving credit facility (351,589 ) (5,000 ) — Net cash overdraft financing 4,077 — — Deferred loan costs (45,223 ) (13,320 ) — Issuance of common stock 416 840,558 72 Minimum withholding taxes paid on stock awards (10,026 ) (3,289 ) (4,084 )
Excess tax benefits from stock-based compensation 2,420 1,138 2,652 Addition of noncontrolling interest 1,201 — — Distributions to noncontrolling interests (4,272 ) — —
Net cash provided/(used) in financing activities 1,275,569 1,457,446 (31,392 )
Effect of exchange rate changes on cash flows 10,980 (5,134 ) — Net increase/(decrease) in cash and cash equivalents (762,073 ) 767,608 64,313 Cash and cash equivalents at beginning of year 870,857 103,249 38,936 Cash and cash equivalents at end of year $ 108,784 $ 870,857 $ 103,249 Supplemental disclosure of cash flow information:
Accrued capital expenditures $ 1,340 $ 1,163 $ —

The accompanying notes are an integral part of these consolidated financial statements.
Page 70
Cash paid during the year for: Interest, net of capitalized interest $ 104,834 $ 21,554 $ 20,181
Income taxes, net of refunds $ 28,315 $ 31,405 $ 43,491
Non-cash financing activities
Debt issued for service contract assets $ — $ — $ 226

DARLING INGREDIENTS INC. AND SUBSIDIARIES
Notes to Consolidated Financial Statements
NOTE 1. GENERAL
(a) NATURE OF OPERATIONS
On May 6, 2014, the stockholders of Darling International Inc. approved changing the name of the company from Darling International Inc. to Darling Ingredients Inc. The change became effective on May 6, 2014. Darling Ingredients Inc., a Delaware corporation ("Darling", and together with its subsidiaries, the "Company"), is a global developer and producer of sustainable natural ingredients from edible and inedible bio-nutrients, creating a wide range of ingredients and customized specialty solutions for customers in the pharmaceutical, food, pet food, feed, technical, fuel, bioenergy and fertilizer industries. As further discussed in Note 2, on January 7, 2014, the Company acquired the VION Ingredients business division ("VION Ingredients") of VION Holding, N.V., a Dutch limited liability company ("VION"), by purchasing all of the shares of VION Ingredients International (Holding) B.V., and VION Ingredients Germany GmbH, and 60% of Best Hides GmbH (collectively, the "VION Companies"), pursuant to a Sale and Purchase Agreement dated October 5, 2013, as amended, between Darling and VION (the "VION Acquisition"). The VION Ingredients business is now conducted under the name Darling Ingredients International. In addition, on October 28, 2013, Darling completed the acquisition of substantially all of the assets of Rothsay ("Rothsay"), a division of Maple Leaf Foods, Inc. ("MFI"), a Canadian corporation, pursuant to an Acquisition Agreement between MFI and Darling dated August 23, 2013 (the "Rothsay Acquisition"). The Company’s business is now conducted through a global network of over 200 locations across five continents. Effective December 29, 2013, the Company's business operations were reorganized into three new segments, Feed Ingredients, Food Ingredients and Fuel Ingredients, in order to better align its business with the underlying markets and customers that the Company serves. All historical periods have been recast to reflect the changes to the segment reporting structure. Comparative segment revenues and related financial information are presented in Note 20 to the consolidated financial statements.
The consolidated financial statements include the accounts of Darling and its consolidated subsidiaries. Noncontrolling interests represents the outstanding ownership interest in the Company's consolidated subsidiaries that are not owned by the Company. In the accompanying Consolidated Statements of Operations, the noncontrolling interest in net income/(loss) of the consolidated subsidiaries is shown as an allocation of the Company's net income and is presented separately as "Net income/(loss) attributable to noncontrolling interests". In the Company's Consolidated Balance Sheets, noncontrolling interests represents the ownership interests in the Company consolidated subsidairies' net assets held by parties other than the Company. These ownership interests are presented separately as "Noncontrolling interests" within "Stockholders' Equity." All significant intercompany balances and transactions have been eliminated in consolidation.
The Company has a 52 / 53 week fiscal year ending on the Saturday nearest December 31. Fiscal years for the consolidated financial statements included herein are for the 53 weeks ended January 3, 2015 , the 52 weeks ended December 28, 2013 , and the 52 weeks ended December 29, 2012 .
The Company considers all short-term highly liquid instruments, with an original maturity of three months or less, to be cash equivalents.
The Company maintains allowances for doubtful accounts for estimated losses resulting from customers’ non-payment of trade accounts receivable owed to the Company. These trade receivables arise in the ordinary course of business from sales of raw material, finished product or services to the Company’s customers. The estimate
Page 71
(b) SUMMARY OF SIGNIFICANT ACCOUNTING POLICIES
(1) Basis of Presentation
(2) Fiscal Year
(3) Cash and Cash Equivalents
(4) Accounts Receivable and Allowance for Doubtful Accounts

DARLING INGREDIENTS INC. Notes to Consolidated Financial Statements (continued)
of allowance for doubtful accounts is based upon the Company’s bad debt experience, prevailing market conditions, and aging of trade accounts receivable, among other factors. If the financial condition of the Company’s customers deteriorates, resulting in the customers’ inability to pay the Company’s receivables as they come due, additional allowances for doubtful accounts may be required.
Inventories are stated at the lower of cost or market. Cost is primarily determined using the first-in, first-out (FIFO) method for the Feed Ingredients and Fuel Ingredients segments. In the Food Ingredients segment cost is primarily determined based on the weighted average cost.
Property, Plant and Equipment
Property, plant and equipment are recorded at cost. Depreciation is computed by the straight-line method over the estimated useful lives of assets: 1) Buildings and improvements, 15 to 30 years; 2) Machinery and equipment, 3 to 10 years; 3) Vehicles, 3 to 8 years; and 4) Aircraft, 7 to 10 years.
Maintenance and repairs are charged to expense as incurred and expenditures for major renewals and improvements are capitalized. Intangible Assets
Intangible assets with indefinite lives, and therefore, not subject to amortization, consist of trade names acquired in the acquisition of Griffin Industries Inc. on December 17, 2010 (which was subsequently converted to a limited liability company) and its subsidiaries ("Griffin") and trade names acquired in the VION Acquisition. Intangible assets subject to amortization consist of: 1) collection routes which are made up of groups of suppliers of raw materials in similar geographic areas from which the Company derives collection fees and a dependable source of raw materials for processing into finished products; 2) permits that represent licensing of operating plants that have been acquired, giving those plants the ability to operate; 3) non-compete agreements that represent contractual arrangements with former competitors whose businesses were acquired; 4) trade names; and 5) royalty, consulting , land use rights and leasehold agreements. Amortization expense is calculated using the straight-line method over the estimated useful lives of the assets ranging from: 5 to 21 years for collection routes; 10 to 20 years for permits; 3 to 7 years for non-compete covenants; and 4 to 15 years for trade names. Royalty, consulting, land use rights and leasehold agreements are amortized over the term of the agreement.
The Company reviews the carrying value of long-lived assets for impairment when events or changes in circumstances indicate that the carrying amount of an asset, or related asset group, may not be recoverable from estimated future undiscounted cash flows. Recoverability of assets to be held and used is measured by a comparison of the carrying amount of an asset or asset group to estimated undiscounted future cash flows expected to be generated by the asset or asset group. If the carrying amount of the asset exceeds its estimated future cash flows, an impairment charge is recognized by the amount for which the carrying amount of the asset exceeds the fair value of the asset. In fiscal 2014 , 2013 and 2012 no such events occurred requiring that the Company perform testing of its long-lived assets for impairment.
During the fourth quarter of fiscal 2014, the Company elected to change the date of the Company's annual assessments of goodwill and indefinite lived intangible assets impairment from the end of the Company's fiscal year to the end of October. This is a change in method of applying an accounting principal, which management believes is a preferable alternative as the new date of the assessment is more closely aligned with Company's strategic planning process. The change in assessment date did not delay, accelerate or avoid a potential impairment charge in 2014. The Company performed the annual goodwill and indefinite-lived intangible assets impairment assessments at October 25, 2014 and concluded that the Company's goodwill for all reporting units
Page 72
(5) Inventories
(6) Long Lived Assets
(7) Impairment of Long-Lived Assets and Long-Lived Assets to Be Disposed of
(8) Goodwill
DARLING INGREDIENTS INC. Notes to Consolidated Financial Statements (continued)
and all recorded indefinite-lived intangible assets were not impaired as of that date. Goodwill and indefinite lived assets are tested annually or more frequently if events or changes in circumstances indicate that the asset might be impaired. The Company follows a two-step process for testing impairment. First, the fair value of each reporting unit is compared to its carrying value to determine whether an indication of impairment exists. If impairment is indicated, then the fair value of the reporting unit’s goodwill is determined by allocating the unit’s fair value of its assets and liabilities (including any unrecognized intangible assets) as if the reporting unit had been acquired in a business combination. The amount of impairment for goodwill is measured as the excess of its carrying value over its implied fair value.
In fiscal 2014 , 2013 and 2012 , the fair values of the Company’s reporting units containing goodwill exceeded the related carrying values. Goodwill was approximately $ 1,320.4 million and $ 701.6 million at January 3, 2015 and December 28, 2013 , respectively. See Note 6 for further information on the Company’s goodwill.
Environmental expenditures incurred to mitigate or prevent environmental impacts that have yet to occur and that otherwise may result from future operations are capitalized. Expenditures that relate to an existing condition caused by past operations and that do not contribute to current or future revenues are expensed or charged against established environmental reserves. Reserves are established when environmental impacts have been identified which are probable to require mitigation and/or remediation and the costs are reasonably estimable.
The Company accounts for income taxes using the asset and liability method. Under the asset and liability method, deferred tax assets and liabilities are recognized for the future tax consequences attributable to differences between the financial statement carrying amounts of existing assets and liabilities and their respective tax bases. Deferred tax assets and liabilities are measured using enacted tax rates expected to apply to taxable income in the years in which those temporary differences are expected to be recovered or settled. The effect on deferred tax assets and liabilities of a change in tax rates is recognized in income in the period that includes the enactment date.
The Company periodically assesses whether it is more likely than not that it will generate sufficient taxable income to realize its deferred income tax assets. In making this determination, the Company considers all available positive and negative evidence and makes certain assumptions. The Company considers, among other things, its deferred tax liabilities, the overall business environment, its historical earnings and losses, current industry trends and its outlook for taxable income in future years. The Company recognizes tax benefits from uncertain tax positions only if it is more likely than not that the tax position will be sustained upon examination by the relevant taxing authority. Adjustments are made to the reserves for uncertain tax positions when facts and circumstances change or additional information is available. Judgment is required to assess the impact of ongoing audits conducted by tax authorities in determining the Company’s consolidated income tax provision. The Company recognizes accrued interest and penalties on tax related matters as a component of income tax expense.
Basic income per common share is computed by dividing net income by the weighted average number of common shares including non-vested and restricted shares with participation rights outstanding during the period. Diluted income per common share is computed by dividing net income by the weighted average number of common shares outstanding during the period increased by dilutive common equivalent shares determined using the treasury stock method. As a result of the use of the weighted average number of shares outstanding during fiscal 2013, the full effect of the issuance of 46,000,000 shares during the fourth quarter of fiscal 2013 as discussed in Note 13, is not included in the below earnings per share calculations for fiscal 2013 .
Page 73
(9) Environmental Expenditures
(10) Income Taxes
(11) Earnings per Share

DARLING INGREDIENTS INC. Notes to Consolidated Financial Statements (continued)
For fiscal 2014 , 2013 and 2012 , respectively, 319,240 , 135,733 and 207,890 outstanding stock options were excluded from diluted income per common share as the effect was antidilutive. For fiscal 2014 , 2013 and 2012 , respectively, 751,444 , 57,257 and 105,486 non-vested stock were excluded from diluted income per common share as the effect was antidilutive.
The Company recognizes compensation expense in an amount equal to the fair value of the share-based payments (e.g., stock options and non-vested and restricted stock) granted to employees and non-employee directors or by incurring liabilities to an employee or other supplier (a) in amounts based, at least in part, on the price of the entity’s shares or other equity instruments, or (b) that require or may require settlement by issuing the entity’s equity shares or other equity instruments.
Total stock-based compensation recognized in the statement of operations for the years ended January 3, 2015 , December 28, 2013 and December 29, 2012 was approximately $ 20.9 million , $ 9.4 million and $ 8.9 million , respectively, which is included in selling, general and administrative expenses, and the related income tax benefit recognized was approximately $ 5.9 million , $ 3.7 million and $ 3.5 million , respectively. See Note 14 for further information on the Company’s stock-based compensation plans.
The benefits of tax deductions in excess of recognized compensation expense are reported as a financing cash flow. For the year ended January 3, 2015 , December 28, 2013 and December 29, 2012 the Company recognized $ 2.4 million , $ 1.1 million and $ 2.7 million as an increase in financing cash flows related to such deductions.
The preparation of the consolidated financial statements in conformity with U.S. generally accepted accounting principles requires management to make estimates and assumptions that affect the reported amounts of assets and liabilities and disclosure of contingent assets and liabilities at the date of the consolidated financial statements and the reported amounts of revenues and expenses during the reporting period. Actual results could differ from those estimates.
If it is at least reasonably possible that the estimate of the effect on the financial statements of a condition, situation, or set of circumstances that exist at the date of the financial statements will change in the near term due to one or more future confirming events, and the effect of the change would be material to the financial statements, the Company will disclose the nature of the uncertainty and include an indication that it is at least reasonably possible that a change in the estimate will occur in the near term. If the estimate involves certain loss contingencies, the disclosure will also include an estimate of the probable loss or range of loss or state that an estimate cannot be made.
Page 74
Net Income per Common Share (in thousands)
January 3, December 28, December 29, 2015 2013 2012
Income Shares Per-Share Income Shares Per-
Share Income Shares Per-
Share
Basic:
Net income attributable to Darling $ 64,215 164,627 $ 0.39 $ 108,967 119,526 $ 0.91 $ 130,770 117,592 $ 1.11
Diluted:
Effect of dilutive securities Add: Option shares in the money and
dilutive effect of nonvested stock — 806 — — 848 — — 806 — Less: Pro-forma treasury shares — (374) — — (450) — — (309) — Diluted:
Net income attributable to Darling $ 64,215 165,059 $ 0.39 $ 108,967 119,924 $ 0.91 $ 130,770 118,089 $ 1.11
(12) Stock Based Compensation
(13) Use of Estimates
DARLING INGREDIENTS INC. Notes to Consolidated Financial Statements (continued)
The carrying amount of cash and cash equivalents, accounts receivable, accounts payable and accrued expenses approximates fair value due to the short maturity of these instruments. The Company's 5.375% Senior Notes due 2022, term loans and revolver borrowings outstanding at January 3, 2015 , as described in Note 10 have a fair value based on market valuation from a third-party bank. The carrying amount for the Company’s other debt is not deemed to be significantly different than the carrying value. See Note 17 for financial instruments' fair values.
The Company makes limited use of derivative instruments to manage cash flow risks related to interest expense, natural gas usage, diesel fuel usage, inventory, forecasted sales and foreign currency exchange rates. The Company does not use derivative instruments for trading purposes. Interest rate swaps are entered into with the intent of managing overall borrowing costs by reducing the potential impact of increases in interest rates on floating-rate long-term debt. Natural gas swaps and options are entered into with the intent of managing the overall cost of natural gas usage by reducing the potential impact of seasonal weather demands on natural gas that increases natural gas prices. Heating oil swaps and options are entered into with the intent of managing the overall cost of diesel fuel usage by reducing the potential impact of seasonal weather demands on diesel fuel that increases diesel fuel prices. Corn options and future contracts are entered into with the intent of managing forecasted sales of BBP by reducing the impact of changing prices. Foreign currency forward contracts are entered into to mitigate the foreign exchange rate risk for transactions designated in a currency other than the local functional currency.
Entities are required to report all derivative instruments in the statement of financial position at fair value. The accounting for changes in the fair value (i.e., gains or losses) of a derivative instrument depends on whether it has been designated and qualifies as part of a hedging relationship and, if so, on the reason for holding the instrument. If certain conditions are met, entities may elect to designate a derivative instrument as a hedge of exposures to changes in fair value, cash flows or foreign currencies. If the hedged exposure is a cash flow exposure, the effective portion of the gain or loss on the derivative instrument is reported initially as a component of other comprehensive income (outside of earnings) and is subsequently reclassified into earnings when the forecasted transaction affects earnings. Any amounts excluded from the assessment of hedge effectiveness as well as the ineffective portion of the gain or loss is reported in earnings immediately. If the derivative instrument is not designated as a hedge, the gain or loss is recognized in earnings in the period of change. Hedge accounting treatment ceases if or when the hedge transaction is no longer probable of occurring or the hedge relationship correlation no longer qualifies for hedge accounting.
At January 3, 2015 , the Company had corn options outstanding that qualified and were designated for hedge accounting as well as heating oil swaps and options, corn options and foreign currency forward contracts that did not qualify and were not designated for hedge accounting.
The Company recognizes revenue on sales when products are shipped and the customer takes ownership and assumes risk of loss. Certain customers may be required to prepay prior to shipment in order to maintain payment protection against certain foreign and domestic sales. These amounts are recorded as unearned revenue and revenue is recognized when the products have shipped and the customer takes ownership and assumes risk of loss. The Company has formula arrangements with certain suppliers whereby the charge or credit for raw materials is tied to published finished product commodity prices after deducting a fixed processing fee incorporated into the formula and is recorded as a cost of sale by line of business. The Company recognizes revenue related to grease trap servicing and industrial residual removal in the fiscal month the trap service or industrial residual removal occurs.
The Company announced on January 21, 2011 that a wholly-owned subsidiary of Darling entered into a limited liability company agreement with a wholly-owned subsidiary of Valero Energy Corporation ("Valero") to form Diamond Green Diesel Holdings LLC (the "DGD Joint Venture"). The Company has related party sale
Page 75
(14) Financial Instruments
(15) Derivative Instruments
(16) Revenue Recognition
(17) Related Party Transactions

DARLING INGREDIENTS INC. Notes to Consolidated Financial Statements (continued)
transactions with the DGD Joint Venture. Additionally, Darling through its wholly-owned subsidiary Griffin Industry LLC ("Griffin"), leases two real properties located in Butler, Kentucky and real properties located in each of Jackson, Mississippi and Henderson, Kentucky from Martom Properties, LLC, an entity owned in part by Martin W. Griffin, the Company’s Executive Vice President – Chief Operations Officer, North America. See Note 9 and Note 22 for further information on the Company's related party transactions.
Foreign currency translation is included as a component of accumulated other comprehensive income and reflects the
adjustments resulting from translating the foreign currency denominated financial statements of foreign subsidiaries into U.S. dollars. The functional currency of the Company's foreign subsidiaries is the currency of the primary economic environment in which the entity operates, which is generally the local currency of the country. Accordingly, assets and liabilities of the foreign subsidiaries are translated to U.S. dollars at fiscal year end exchange rates, including intercompany foreign currency transactions that are of long-term investment nature. Income and expense items are translated at average exchange rates occurring during the period. Changes in exchange rates that affect cash flows and the related receivables or payables are recognized as transaction gains and losses in determining net income. The Company incurred net foreign currency translation losses of approximately $ 125.9 million and $ 14.5 million in fiscal year 2014 and fiscal 2013, respectively and no currency translation in fiscal year 2012. The large increase in translation losses on the balance sheet has occurred primarily as a result of the strengthening of the U.S. dollar when compared to the Company's largest foreign currencies, the euro and Canadian dollar. In addition, the Company incurred foreign currency gains/(losses) in the statement of operations of approximately $ (13.5) million and $ 28.1 million in fiscal 2014 and fiscal 2013, respectively, with $ 12.6 million loss being recorded in fiscal 2014 upon settlement of foreign exchange contracts that did not qualify for hedge accounting to mitigate the foreign exchange rate risk of the acquisition price of the VION Acquisition and $ 27.5 million gain being recorded in fiscal 2013 representing the unrealized gain on the foreign exchange rate risk of the acquisition price on the foreign exchange contracts of the VION Acquisition that was recorded as an other current asset on the balance sheet at December 28, 2013.
Certain prior year amounts have been reclassified to conform to the current year presentation.
The Company evaluates subsequent events from the end of the most recent fiscal year through the date the consolidated financial statements are issued.
NOTE 2. ACQUISITIONS
On January 7, 2014, the Company acquired the VION Ingredients business division from VION by purchasing shares of the VION Companies as described in Note 1, pursuant to a Sale and Purchase Agreement dated October 5, 2013, as amended, between Darling and VION. The VION Ingredients business is now conducted under the name Darling Ingredients International. Darling Ingredients International is a worldwide leader in the development and production of specialty ingredients from animal by-products for applications in pharmaceuticals, food, pet food, feed, fuel, bioenergy and fertilizer. Darling Ingredients International operates a global network of 68 production facilities across five continents covering all aspects of animal by-product processing through six brands: Rendac (bioenergy), Sonac (bone products, proteins, fats, edible fats and plasma products), Ecoson (bioenergy), Rousselot (gelatin and collagen hydrolysates), CTH (natural casings) and Best Hides (hides and skins). Darling Ingredients International’s specialized portfolio of over 400 products covers all animal origin raw material types and thereby offers a comprehensive, single source solution for suppliers. Darling Ingredients International’s business has leading positions across Europe with operations in the Netherlands, Belgium, Germany, Poland and Italy under the Rendac and Sonac brand names. Value-added products include edible fats, blood plasma powder, hemoglobin, bone products, protein meals and fats. Rousselot is a global leading market provider of gelatin for the pharmaceutical, food and technical industries with operations in Europe, the United States, South America and China. CTH is a market leader in natural casings for the sausage industry with operations in Europe, China and the United States. The purchase of the VION Companies allows the Company to have a global reach. The purchase price for the transaction was approximately€ 1.6 billion in cash (approximately $ 2.2 billion at the exchange rate of € 1.00 :USD$ 1.3605 ). The purchase price was financed through (i) borrowings under the Company’s senior secured revolving credit facility and term loan facilities; (ii) proceeds from the Company’s
Page 76
(18) Foreign Currency Translation and Remeasurement
(19) Reclassification
(20) Subsequent Events

DARLING INGREDIENTS INC. Notes to Consolidated Financial Statements (continued)
$ 874.0 million public common stock offering in the fourth quarter of fiscal 2013; and (iii) proceeds from the private offering of $ 500.0 million aggregate principal amount of the Company’s 5.375% Senior Notes due 2022, that closed on January 2, 2014.
The following table summarizes the fair value of the assets acquired and liabilities assumed in the VION Acquisition as of January 7, 2014 (in thousands):
During the fourth quarter of fiscal 2014, the Company completed the purchase accounting for the VION Acquisition. Subsequent to the preliminary purchase price allocation in the first quarter of fiscal 2014, the Company made adjustments to the provisional amounts to increase working capital of approximately $ 84.0 million , decrease property, plant and equipment of approximately $ 27.3 million , decrease identifiable intangibles of $ 17.6 million , decrease goodwill of approximately $ 72.1 million and increase other of approximately $ 27.0 million . The impact of these adjustments during the measurement period did not have a material impact to earnings for fiscal 2014 or any quarterly period during the year. Goodwill of approximately $ 223.2 million was assigned to the Feed Ingredients segment, approximately $ 375.6 million was assigned to the Food Ingredients segment and approximately $ 103.8 million was assigned to the Fuel Ingredients segment, respectively. Of the VION Acquisition goodwill, approximately 33% is expected to be deductible for tax purposes. Identifiable intangibles include trademarks and trade names with indefinite lives of approximately $ 32.0 million and definite lived intangible assets including routes of approximately $ 190.2 million with a weighted average useful life of 10 years, $ 225.6 million in permits with a weighted average useful life of 15 years and patents and other intangibles of approximately $ 16.5 million with a weighted average useful life of 25 years. The VION Acquisition is a taxable stock sale and as a result there were deferred taxes that were created. The amount of revenue and income/loss from the VION Acquisition included in the Company’s consolidated statement of operations for the year ended January 3, 2015 were $ 2.1 billion and a income of approximately $ 19.6 million , respectively. On October 28, 2013 , Darling completed the acquisition of substantially all of the assets of Rothsay for approximately CAD $ 640.2 million (approximately USD$ 612.6 million at the exchange rate of CAD$ 1.00 :USD$ 0.9569 ) comprised of cash of CAD$ 644.5 million less a contingent receivable of approximately CAD$ 4.3 million due to over payment for working capital, which was returned by MFI in fiscal 2014. The cash portion of the Rothsay Acquisition was funded through a combination of borrowings under Darling's senior secured revolving credit facility and term loan facility. Rothsay has a network of five rendering plants in Manitoba, Ontario and Nova Scotia and a biodiesel operation in Quebec, Canada. The Rothsay Acquisition not only adds significant scale by expanding the Company's geographic footprint into Canada, but also provides the Company with an opportunity for synergies through transferring best practices between Rothsay and the Company's existing operations and improving efficiencies.
Page 77
Accounts receivable $ 337,278 Inventory 375,306 Prepaid expense 23,135 Other current assets 3,525 Deferred tax assets 48,639 Property plant and equipment 981,009 Identifiable intangibles 464,193 Goodwill 702,672 Investment in unconsolidated subsidiaries 27,069 Other long term assets 1,101 Accounts payable (210,477 )
Current portion of long-term debt (26,347 )
Accrued expenses (149,345 )
Deferred tax liability (350,003 )
Long Term debt obligations (4,109 )
Other noncurrent liabilities (57,721 )
Noncontrolling interests (90,919 )
Purchase price, net of cash acquired of $91.2 million $ 2,075,006

DARLING INGREDIENTS INC. Notes to Consolidated Financial Statements (continued)
The following table summarizes the fair value of the assets acquired and liabilities assumed in the Rothsay Acquisition as of October 28, 2013 (in thousands):
During the fourth quarter of fiscal 2014, the Company completed the purchase accounting for the Rothsay Acquisition. In the Rothsay Acquisition, goodwill of approximately $ 224.6 million was assigned to the Feed Ingredients segment and approximately $ 38.2 million was assigned to the Fuel Ingredients segment. Approximately 75% of the goodwill recorded in the Rothsay Acquisition is expected to be deductible for tax purposes. Identifiable intangibles include definite lived intangible assets including routes of approximately $ 172.6 million with a weighted average useful life of 21 years, $ 55.6 million in permits with a weighted average useful life of 13 years, trade names of approximately $ 9.0 million with a weighted average useful life of 4 years and $ 3.2 million in non-compete with a weighted average useful life of 7 years.
The amount of Rothsay's revenue and ncome/loss included in the Company’s consolidated statement of operations for the year ended January 3, 2015 were $ 207.0 million and income of approximately $ 15.9 million , which includes certain integration costs allocated to the business, respectively. The Company also incurred selling and general administrative expenses as part of the VION Acquisition and the Rothsay Acquisition for consulting and legal expenses and integration expenses in the amount of approximately $ 24.4 million and $ 22.2 million during fiscal 2014 and fiscal 2013, respectively. As a result of the Rothsay Acquisition and the VION Acquisition, effective October 28, 2013 and January 7, 2014, respectively, the Company began including the operations of the Rothsay Acquisition and the VION Acquisition into the Company's consolidated financial statements. The following table presents selected pro forma information, for comparative purposes, assuming the Rothsay Acquisition and the VION Acquisition had occurred on December 30, 2012 for the periods presented (unaudited) (in thousands, except per share data):
The selected unaudited pro forma information is not necessarily indicative of the consolidated results of operations for future periods or the results of operations that would have been realized had the VION Acquisition and the Rothsay Acquisition actually occurred on December 30, 2012 and excludes certain nonrecurring transactions directly related to the acquisitions.
The Company also incurred selling and general administrative expenses as part of the Rothsay Acquisition for consulting and legal expenses in the amount of approximately $ 10.8 million . Additionally, approximately $ 14.4 million was capitalized as deferred loan costs, which are included in other assets on the Company’s consolidated balance sheets in fiscal 2013.
Page 78
Accounts receivable $ 13,220 Inventory 5,479 Other current assets 312 Property, plant and equipment 138,175 Identifiable intangibles 240,386 Goodwill 262,797 Accounts payable (12,159 )
Accrued expenses (5,701 )
Deferred tax liability (15,031 )
Capital lease obligations (10,741 )
Other non-current liabilities (4,102 )
Purchase price, net of cash acquired $ 612,635
December 28, 2013
Net sales $ 4,178,258 Income from continuing operations 259,765 Net income attributable to Darling 169,101 Earnings per share
Basic $ 1.03 Diluted $ 1.02


DARLING INGREDIENTS INC. Notes to Consolidated Financial Statements (continued)
The Company notes the acquisitions discussed below are not considered related businesses, therefore are not required to be treated as a single business combination. Pro forma results of operations for these acquisitions have not been presented because the effect of each acquisition individually or in the aggregate is not deemed material to revenues and net income of the Company for any fiscal period presented. On October 1, 2014, the Company acquired substantially all of the assets of Custom Blenders Arkansas, LLC, an Indiana limited liability company, Custom Blenders Georgia, LLC, a Georgia limited liability company, Custom Blenders Indiana, Inc., an Indiana corporation, and Custom Blenders Texas, LLC, an Indiana limited liability company (collectively "Custom Blenders"), one of the leading bakery residuals recyclers in the United States. The acquisition includes Custom Blenders' operations in Indiana, Georgia, Texas, and Arkansas. The acquisition will provide significant synergies to the Company's suppliers and customers in the Feed Ingredients segment. The Company paid approximately $ 18.8 million in cash for assets consisting of property, plant and equipment of approximately $ 3.2 million , intangible assets of approximately $ 8.6 million , goodwill of approximately $ 5.4 million and inventory of approximately $ 1.6 million . The identifiable intangibles have a weighted average life of 14 years.
On August 26, 2013 , a wholly-owned subsidiary of Darling, Darling AWS LLC, a Delaware limited liability company, acquired all of the shares of Terra Holding Company, a Delaware corporation, and its wholly owned subsidiaries, Terra Renewal Services, Inc., an Arkansas corporation ("TRS"), and EV Acquisition, Inc., an Arkansas corporation (the "Terra Transaction"). The Terra Transaction will increase the Company's rendering portfolio by adding to the Company's existing rendering segments grease collection businesses and adds an industrial residuals business as a new line of service for the Company's rendering raw material suppliers within the Feed Ingredients segment.
Effective August 26, 2013 , the Company began including the operations acquired in the Terra Transaction into the Company's consolidated financial statements. The Company paid approximately $ 122.1 million in cash for assets and assumed liabilities consisting of property, plant and equipment of $ 27.7 million , intangible assets of $ 46.2 million , goodwill of $ 61.1 million , deferred tax liability of $ 19.5 million and working capital of $ 6.6 million on the closing date. The goodwill from the Terra Transaction was assigned to the Feed Ingredients segment and is not deductible for tax purposes, though TRS has approximately $ 5.2 million of goodwill deductible for tax purposes related to prior acquisitions. The identifiable intangibles have a weighted average life of 12 years. On June 8, 2012, the Company completed its acquisition of substantially all of the assets of RVO BioPur, LLC ("BioPur") for approximately $ 3.0 million including property plant and equipment of $ 0.6 million and intangible assets of $ 2.4 million . Headquartered in Waterbury, Connecticut, BioPur provides used cooking oil collection and grease trap services to restaurants and food service establishments in the New England area of the Company's existing East coast operations. The identifiable intangibles have a weighted average life of 9 years.
NOTE 3. INVENTORIES A summary of inventories follows (in thousands):
Following the VION Acquisition, the Company began to carry larger amounts of inventories as compared to historical periods due to the VION Acquisition. Additionally, certain products acquired in the VION Acquisition, primarily in the gelatin and casing businesses traditionally have required longer processing periods to produce the end product and thus have greater available inventory than Darling's historical products require. The Company's work in process inventory represents inventory in the Food Ingredients segment that is in various stages of processing.
Page 79
January 3, 2015 December 28, 2013
Finished product $ 255,130 $ 57,681 Work in process 98,936 — Supplies and other 47,547 7,452
$ 401,613 $ 65,133
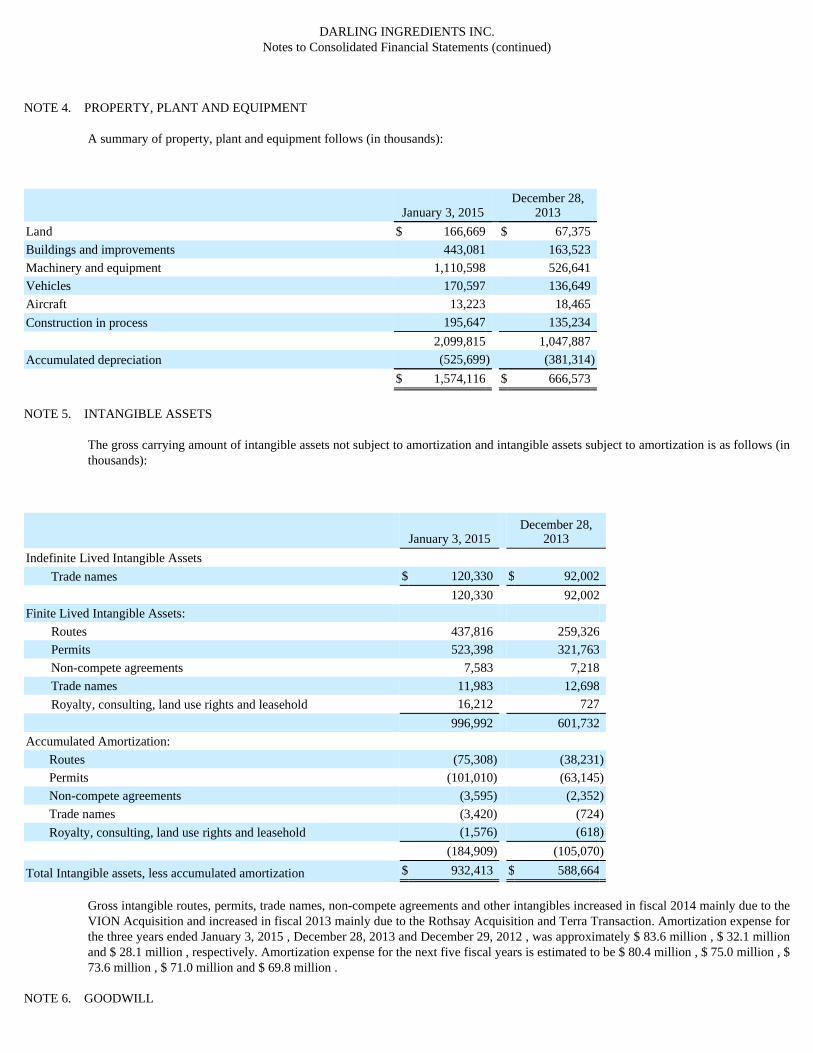
DARLING INGREDIENTS INC. Notes to Consolidated Financial Statements (continued)
NOTE 4. PROPERTY, PLANT AND EQUIPMENT
A summary of property, plant and equipment follows (in thousands):
NOTE 5. INTANGIBLE ASSETS
The gross carrying amount of intangible assets not subject to amortization and intangible assets subject to amortization is as follows (in thousands):
Gross intangible routes, permits, trade names, non-compete agreements and other intangibles increased in fiscal 2014 mainly due to the VION Acquisition and increased in fiscal 2013 mainly due to the Rothsay Acquisition and Terra Transaction. Amortization expense for the three years ended January 3, 2015 , December 28, 2013 and December 29, 2012 , was approximately $ 83.6 million , $ 32.1 million and $ 28.1 million , respectively. Amortization expense for the next five fiscal years is estimated to be $ 80.4 million , $ 75.0 million , $ 73.6 million , $ 71.0 million and $ 69.8 million .
NOTE 6. GOODWILL
January 3, 2015 December 28,
2013
Land $ 166,669 $ 67,375 Buildings and improvements 443,081 163,523 Machinery and equipment 1,110,598 526,641 Vehicles 170,597 136,649 Aircraft 13,223 18,465 Construction in process 195,647 135,234 2,099,815 1,047,887 Accumulated depreciation (525,699 ) (381,314 )
$ 1,574,116 $ 666,573
January 3, 2015
December 28, 2013
Indefinite Lived Intangible Assets
Trade names $ 120,330 $ 92,002 120,330 92,002 Finite Lived Intangible Assets:
Routes 437,816 259,326 Permits 523,398 321,763 Non-compete agreements 7,583 7,218 Trade names 11,983 12,698 Royalty, consulting, land use rights and leasehold 16,212 727
996,992 601,732 Accumulated Amortization:
Routes (75,308 ) (38,231 )
Permits (101,010 ) (63,145 )
Non-compete agreements (3,595 ) (2,352 )
Trade names (3,420 ) (724 )
Royalty, consulting, land use rights and leasehold (1,576 ) (618 )
(184,909 ) (105,070 )
Total Intangible assets, less accumulated amortization $ 932,413 $ 588,664

Changes in the carrying amount of goodwill (in thousands):
Page 80

DARLING INGREDIENTS INC. Notes to Consolidated Financial Statements (continued)
Certain of the Company's rendering facilities are highly dependent on one or few suppliers. It is reasonably possible that certain of those suppliers could cease their operations or choose a competitor’s services, which could have a significant impact on these facilities.
The process of evaluating goodwill for impairment involves the determination of the fair value of the Company's reporting units. In fiscal 2014 , fiscal 2013 and fiscal 2012 , the fair values of the Company’s reporting units containing goodwill exceeded the related carrying value pursuant to a quantitative assessment completed as of October 25, 2014.
NOTE 7. INVESTMENT IN UNCONSOLIDATED SUBSIDIARIES
The Company announced on January 21, 2011 that a wholly-owned subsidiary of Darling entered into a limited liability company agreement with Valero to form the DGD Joint Venture. The DGD Joint Venture is owned 50% / 50% with Valero and was formed to design, engineer, construct and operate a renewable diesel plant (the "DGD Facility"), which is capable of producing approximately 11,000 barrels per day of input feedstock to produce renewable diesel fuel and certain other co-products, and is located adjacent to Valero's refinery in Norco, Louisiana. The DGD Joint Venture reached mechanical completion and began the production of renewable diesel in late June 2013. On August 3, 2014, the facility shutdown as a result of a fire incident. The facility resumed operations on September 18, 2014. The DGD Joint Venture anticipates that the fire incident will be covered under its property and casualty insurance policies and the financial exposure is limited to the deductible. The DGD Joint Venture does not expect to file a business interruption claim. On May 31, 2011, the DGD Joint Venture and Diamond Green Diesel LLC, a wholly-owned subsidiary of the DGD Joint Venture ("Opco"), entered into (i) a facility agreement (the "Facility Agreement") with Diamond Alternative Energy, LLC, a wholly-owned subsidiary of Valero (the "Lender"), and (ii) a loan agreement (the "Loan Agreement") with the Lender, which will provide the DGD Joint Venture with a 14 year multiple advance term loan facility of approximately $ 221.3 million (the "JV Loan") to support the design, engineering and construction of the DGD Facility, which is now in production. The Facility Agreement and the Loan Agreement prohibit the Lender from assigning all or any portion of the Facility Agreement or the Loan Agreement to unaffiliated third parties. Opco has also pledged substantially all of its assets to the Lender, and the DGD Joint Venture has pledged all of Opco's equity interests to the Lender, until the JV Loan has been paid in full and the JV Loan has terminated in accordance with its terms. Based on the sponsor support agreements executed in connection with the Facility Agreement and the Loan Agreement relating to the DGD Joint Venture with Valero, the Company has contributed a total of approximately $ 111.7 million for the construction of the DGD Facility including the Company's portion of cost overruns and working capital funding. In addition to the DGD Joint Venture, the Company has investments in other unconsolidated subsidiaries that were acquired in the VION Acquisition that are insignificant to the Company. Selected financial information for the Company's DGD Joint Venture is as follows:
Page 81
Feed Ingredients Food
Ingredients Fuel Ingredients Total
Balance at December 29, 2012
Goodwill $ 396,807 $ — $ 476 $ 397,283 Accumulated impairment losses (15,914 ) — — (15,914 )
380,893 — 476 381,369 Goodwill acquired during year 288,471 — 38,198 326,669 Foreign currency translation (5,467 ) — (934 ) (6,401 )
Balance at December 28, 2013
Goodwill 679,811 — 37,740 717,551 Accumulated impairment losses (15,914 ) — — (15,914 )
663,897 — 37,740 701,637 Goodwill acquired during year 225,889 375,633 103,806 705,328 Foreign currency translation (42,192 ) (29,480 ) (14,874 ) (86,546 )
Balance at January 3, 2015 Goodwill 863,508 346,153 126,672 1,336,333 Accumulated impairment losses (15,914 ) — — (15,914 )
$ 847,594 $ 346,153 $ 126,672 $ 1,320,419


DARLING INGREDIENTS INC. Notes to Consolidated Financial Statements (continued)
As of January 3, 2015 , under the equity method of accounting, the Company has an investment in the DGD Joint Venture of approximately $ 178.9 million on the consolidated balance sheet and has recorded approximately $ 63.8 million and $ 7.7 million in equity net income and $ 2.7 million in equity net losses in the unconsolidated subsidiary for the years ended January 3, 2015 , December 28, 2013 and December 29, 2012 , respectively. Biodiesel blenders registered with the Internal Revenue Service were eligible for a tax incentive in the amount of $ 1.00 per gallon of renewable diesel blended with petroleum diesel to produce a mixture containing 0.1% diesel fuel. As a blender, the DGD Joint Venture has recorded approximately $ 126.0 million and approximately $ 50.4 million in blender credits, for its fiscal years ended December 31, 2014 and December 31, 2013 respectively. These blenders credits were recorded by the DGD Joint Venture as a reduction of total costs and expenses in the above table. In fiscal 2014, the DGD Joint Venture booked all blenders tax credits in the fourth quarter.
NOTE 8. ACCRUED EXPENSES
Accrued expenses consist of the following (in thousands):
(in thousands) December 31, 2014 December 31, 2013
Assets:
Total current assets $ 216,991 $ 106,332 Property, plant and equipment, net 373,117 382,011 Other assets 2,092 92
Total assets $ 592,200 $ 488,435
Liabilities and members' equity:
Total current portion of long term debt $ 57,514 $ 8,511 Total other current liabilities 21,313 36,702 Total long term debt 155,273 212,787 Total other long term liabilities 339 207 Total members' equity 357,761 230,228
Total liabilities and member's equity $ 592,200 $ 488,435
Year Ended December 31,
(in thousands) 2014 2013 2012
Revenues:
Operating revenues $ 487,834 $ 213,552 $ — Expenses:
Total costs and expenses 342,743 189,216 5,324 Operating income 145,091 24,336 (5,324 )
Other income 82 33 — Interest and debt expense, net (17,640 ) (9,049 ) —
Net income/(loss) $ 127,533 $ 15,320 $ (5,324 )
January 3, 2015 December 28,
2013
Compensation and benefits $ 92,863 $ 38,902 Utilities and sewage 18,441 6,802 Accrued income, ad valorem, and franchise taxes 15,615 3,651
Reserve for self insurance, litigation, environmental and tax matters (Note 19) 10,041 7,878
Medical claims liability 5,229 5,960 Accrued operating expenses 55,877 9,512 Accrued acquisition costs — 4,306 Accrued financing fees — 18,592
Accrued interest payable 13,869 —

Page 82
Other accrued expense 44,184 17,571
$ 256,119 $ 113,174
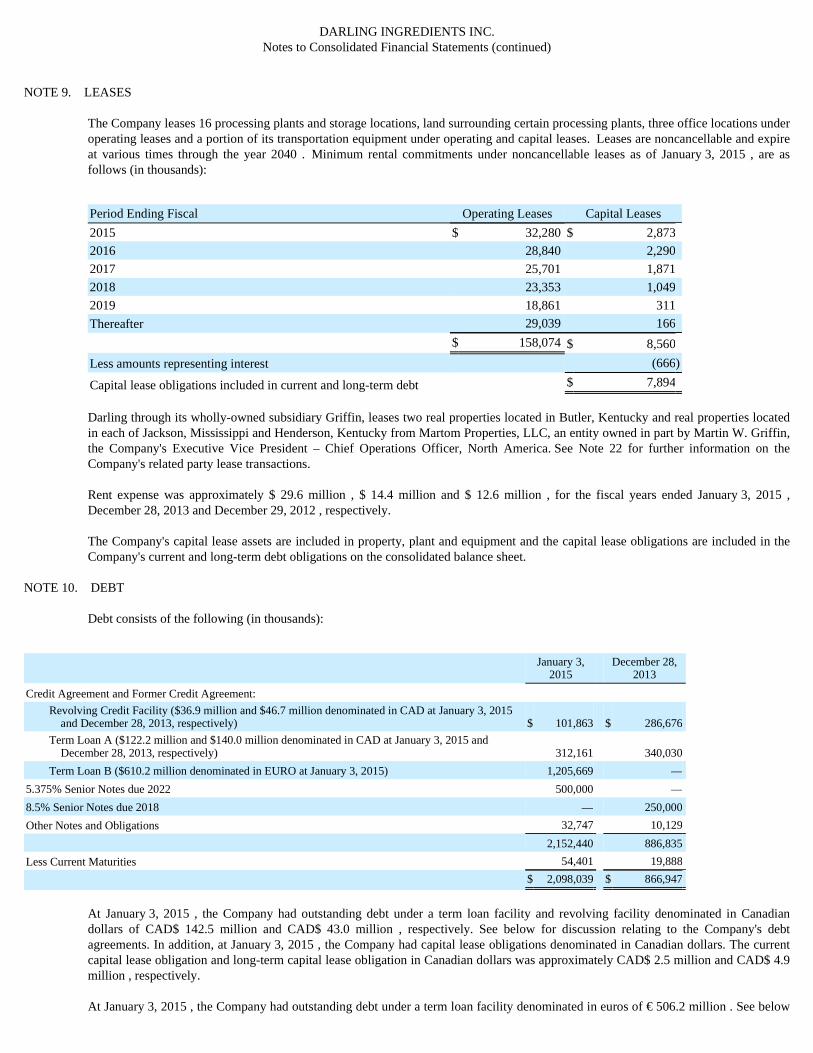
DARLING INGREDIENTS INC. Notes to Consolidated Financial Statements (continued)
NOTE 9. LEASES
The Company leases 16 processing plants and storage locations, land surrounding certain processing plants, three office locations under operating leases and a portion of its transportation equipment under operating and capital leases. Leases are noncancellable and expire at various times through the year 2040 . Minimum rental commitments under noncancellable leases as of January 3, 2015 , are as follows (in thousands):
Darling through its wholly-owned subsidiary Griffin, leases two real properties located in Butler, Kentucky and real properties located in each of Jackson, Mississippi and Henderson, Kentucky from Martom Properties, LLC, an entity owned in part by Martin W. Griffin, the Company's Executive Vice President – Chief Operations Officer, North America. See Note 22 for further information on the Company's related party lease transactions. Rent expense was approximately $ 29.6 million , $ 14.4 million and $ 12.6 million , for the fiscal years ended January 3, 2015 , December 28, 2013 and December 29, 2012 , respectively. The Company's capital lease assets are included in property, plant and equipment and the capital lease obligations are included in the Company's current and long-term debt obligations on the consolidated balance sheet.
NOTE 10. DEBT
Debt consists of the following (in thousands):
At January 3, 2015 , the Company had outstanding debt under a term loan facility and revolving facility denominated in Canadian dollars of CAD$ 142.5 million and CAD$ 43.0 million , respectively. See below for discussion relating to the Company's debt agreements. In addition, at January 3, 2015 , the Company had capital lease obligations denominated in Canadian dollars. The current capital lease obligation and long-term capital lease obligation in Canadian dollars was approximately CAD$ 2.5 million and CAD$ 4.9 million , respectively. At January 3, 2015 , the Company had outstanding debt under a term loan facility denominated in euros of € 506.2 million . See below
Period Ending Fiscal Operating Leases Capital Leases
2015 $ 32,280 $ 2,873 2016 28,840 2,290 2017 25,701 1,871 2018 23,353 1,049 2019 18,861 311 Thereafter 29,039 166
$ 158,074 $ 8,560 Less amounts representing interest (666 )
Capital lease obligations included in current and long-term debt $ 7,894
January 3,
2015 December 28,
2013
Credit Agreement and Former Credit Agreement: Revolving Credit Facility ($36.9 million and $46.7 million denominated in CAD at January 3, 2015
and December 28, 2013, respectively) $ 101,863 $ 286,676 Term Loan A ($122.2 million and $140.0 million denominated in CAD at January 3, 2015 and
December 28, 2013, respectively) 312,161 340,030 Term Loan B ($610.2 million denominated in EURO at January 3, 2015) 1,205,669 —
5.375% Senior Notes due 2022 500,000 — 8.5% Senior Notes due 2018 — 250,000 Other Notes and Obligations 32,747 10,129 2,152,440 886,835 Less Current Maturities 54,401 19,888
$ 2,098,039 $ 866,947

for discussion relating to the Company's debt agreements. In addition, at January 3, 2015 , the
Page 83

DARLING INGREDIENTS INC. Notes to Consolidated Financial Statements (continued)
Company had capital lease obligations denominated in euros. The current capital lease obligation and long-term capital lease obligation in euros was approximately € 0.3 million and € 0.9 million , respectively.
Senior Secured Credit Facilities . On January 6, 2014 , Darling, Darling International Canada Inc. ("Darling Canada") and Darling International NL Holdings B.V. ("Darling NL") entered into a Second Amended and Restated Credit Agreement (the "Amended Credit Agreement"), restating its then existing Amended and Restated Credit Agreement dated September 27, 2013 (the "Former Credit Agreement"), with the lenders from time to time party thereto, JPMorgan Chase Bank, N.A., as Administrative Agent, and the other agents from time to time party thereto. The Amended Credit Agreement provides for senior secured credit facilities in the aggregate principal amount of $ 2.65 billion comprised of (i) the Company's $ 350.0 million term loan A facility (ii) the Company's $ 1.3 billion term loan B facility and (iii) the Company's $ 1.0 billion five -year revolving loan facility (approximately $ 250.0 million of which will be available for a letter of credit sub-facility and $ 50.0 million of which will be available for a swingline sub-facility) (collectively, the "Senior Secured Credit Facilities"). The Amended Credit Agreement also permits Darling and the other borrowers thereunder to incur ancillary facilities provided by any revolving lender party to the Senior Secured Credit Facilities (with certain restrictions). Up to $ 350.0 million of the revolving loan facility is available to be borrowed by Darling in U.S. dollars, Canadian dollars, euros and other currencies to be agreed and available to each applicable lender, to be borrowed by Darling Canada in Canadian dollars and to be borrowed by Darling NL, Darling Ingredients International Holding B.V. ("Darling BV") and CTH Germany GmbH ("CTH") in U.S. dollars, euros and other currencies to be agreed and available to each applicable lender. On January 6, 2014, $ 600.0 million of the term loan B facility was borrowed in U.S. dollars by Darling and the euro equivalent of $ 700.0 million of the term loan B facility was borrowed in euros by Darling NL. The proceeds of the term loan B facility and a portion of the revolving loan facility were used by Darling to pay a portion of the consideration for the VION Acquisition. The revolving loan facility will also be used for working capital needs, general corporate purposes and other purposes not prohibited by the Amended Credit Agreement. As of January 3, 2015 , The Company has borrowed all $ 350.0 million of the term loan A facility which, when repaid, cannot be reborrowed. The term loan A facility is repayable in quarterly installments as follows: for the first eight quarters following January 6, 2014 , 1.25% of the original principal amount of the term loan A facility, for the ninth through sixteenth quarters following January 6, 2014 , 1.875% of the original principal amount of the term loan A facility, and for each quarterly installment after such sixteenth installment until September 27, 2018 , 3.75% of the original principal amount of the term loan A facility. The term loan A facility will mature on September 27, 2018 . As of January 3, 2015 , the Company has borrowed all $ 1.3 billion under the terms of the term loan B facility, which when repaid, cannot be reborrowed. The term loan B facility is repayable in quarterly installments of 0.25% of the aggregate principal amount of the relevant term loan B facility on the last day of each March, June, September and December of each year commencing on the last day of each month falling on or after the last day of the first full quarter following January 6, 2014 and continuing until the last day of each quarter period ending immediately prior to January 7, 2021; and one final installment in the amount of the relevant term loan B facility then outstanding, due on January 7, 2021. The term loan B facility will mature on January 7, 2021.
The interest rate applicable to any borrowings under the term loan A facility and the revolving loan facility will equal either LIBOR/euro interbank offered rate/CDOR plus 2.50% per annum or base rate/Canadian prime rate plus 1.50% per annum, subject to certain step-downs based on the Company's total leverage ratio. The interest rate applicable to any borrowings under the term loan B facility will equal (a) for U.S. dollar term loans, either the base rate plus 1.50% or LIBOR plus 2.50% , and (b) for euro term loans, the euro interbank offered rate plus 2.75% , in each case subject to a step-down based on Darling’s total leverage ratio. For term loan B loans, the LIBOR rate shall not be less than 0.75% . At January 3, 2015 , the Company had $ 190.0 million outstanding under the term loan A facility and $ 65.0 million under the revolver at LIBOR plus a margin of 2.50% per annum for a total of 2.6875% per annum. The Company had $ 595.5 million outstanding under the term loan B facility at LIBOR plus a margin of 2.50% per annum for a total of 3.25% per annum. The Company had CAD$ 142.5 million outstanding under the term loan A Facility and CAD$ 43.0 million outstanding under the revolver at CDOR plus a margin of 2.50% per annum for a total of 3.8960% per annum. The Company had € 506.2 million outstanding under the term loan B facility at LIBOR plus a margin of 2.75% per annum for a total of 3.50% per annum. As of January 3, 2015 , the Company had availability of $ 865.9 million under the Amended Credit Agreement taking into account amounts borrowed and letters of credit issued of $ 32.2 million . The Company also has foreign bank guarantees that are not part of the Company's Amended Credit Agreement
Page 84

DARLING INGREDIENTS INC. Notes to Consolidated Financial Statements (continued)
in the amount of approximately $ 11.2 million at January 3, 2015. In addition, the Company has capitalized approximately $ 39.6 million of deferred loan costs in fiscal year 2014. The Amended Credit Agreement contains various customary representations and warranties by the Company, which include customary use of materiality, material adverse effect and knowledge qualifiers. The Amended Credit Agreement also contains (a) certain affirmative covenants that impose certain reporting and/or performance obligations on Darling and its subsidiaries, (b) certain negative covenants that generally prohibit, subject to various exceptions, Darling and its restricted subsidiaries from taking certain actions, including, without limitation, incurring indebtedness, making investments, incurring liens, paying dividends and engaging in mergers and consolidations, sale and leasebacks and asset dispositions, (c) financial covenants, which include a maximum total leverage ratio, a maximum secured leverage ratio and a minimum interest coverage ratio and (d) customary events of default (including a change of control) for financings of this type. Obligations under the Senior Secured Credit Facilities may be declared due and payable upon the occurrence and during the continuance of customary events of default.
Pursuant to the Second Amended and Restated Security Agreement, dated as of January 6, 2014 (the "Security Agreement"), by and among Darling, its domestic subsidiaries signatory thereto and any other domestic subsidiary who may become a party thereto and JPMorgan Chase Bank, N.A., as administrative agent, the Senior Secured Credit Facilities are secured, subject to certain carveouts and exceptions, by a first priority lien on substantially all of the assets of Darling and such domestic subsidiaries. The obligations of Darling Canada, Darling NL, Darling BV, CTH and any other foreign borrower under the Senior Secured Credit Facilities are also secured by a first priority lien on certain assets of certain of Darling’s foreign subsidiaries organized in Canada, Belgium, Germany, the Netherlands and Brazil, subject to certain carveouts and exceptions. Pursuant to the Second Amended and Restated Guaranty Agreement, dated as of January 6, 2014 (the "Guaranty Agreement"), (a) the obligations of Darling under the Senior Secured Credit Facilities are guaranteed by certain of Darling’s wholly-owned domestic subsidiaries and (b) the obligations of Darling Canada, Darling NL, Darling BV, CTH and any other foreign borrower under the Senior Secured Credit Facilities are guaranteed by Darling and certain of its domestic and foreign wholly-owned subsidiaries, in each case subject to certain carveouts and exceptions (collectively, the "Credit Agreement Guarantors"). Senior Notes due 2022. On December 18, 2013 , Darling Escrow Corporation ("Darling Escrow Sub"), a Delaware corporation and wholly-owned subsidiary of Darling, entered into a purchase agreement (the “Original Purchase Agreement”) with the initial purchasers party thereto (the "Initial Purchasers"), for the sale of $ 500.0 million aggregate principal amount of its 5.375% Notes due 2022.(the " 5.375% Private Notes"). On January 2, 2014 , the 5.375% Notes, which were offered in a private offering in connection with the VION Acquisition, were issued pursuant to a 5.375% Notes Indenture, dated as of January 2, 2014 (the "Original Indenture"), among Darling Escrow Sub, the Subsidiary Guarantors (as defined in the Original Indenture) party thereto from time to time and U.S. Bank National Association, as trustee (the "Trustee"), with the gross proceeds from the offering of the 5.375% Notes and certain additional amounts deposited in an escrow account pending the satisfaction of certain conditions, including the completion of the VION Acquisition, which occurred on January 7, 2014. On January 8, 2014 (the "Notes Closing Date"), Darling Escrow Sub merged (the "Notes Merger") with and into Darling (with Darling as the survivor of the Notes Merger), pursuant to an Agreement and Plan of Merger, dated January 8, 2014 , between Darling Escrow Sub and Darling. In connection with the completion of the Notes Merger, pursuant to the provisions of the Original Indenture and the Original Purchase Agreement, Darling Escrow Sub, Darling and certain of Darling’s subsidiaries: Craig Protein Division, Inc. ("Craig Protein"), Darling AWS LLC, Darling National LLC ("Darling National"), Darling Northstar LLC, Darling Global Holdings Inc., EV Acquisition, Inc., Griffin Industries LLC ("Griffin"), Terra Holding Company and TRS (such subsidiaries and together with any other Darling Subsidiaries that guarantee the 5.375% Notes, the "Notes Guarantors") entered into a supplemental indenture with the Trustee (the "Supplemental Indenture," and together with the Original Indenture, the "Indenture"), pursuant to which, upon effectiveness of the Notes Merger, Darling assumed all the obligations of Darling Escrow Sub under the 5.375% Private Notes and the Indenture and the Notes Guarantors guaranteed the 5.375% Private Notes and agreed to be bound by the terms of the Indenture applicable to subsidiary guarantors of the 5.375% Private Notes. In addition, in accordance with the provisions of the Original Purchase Agreement, upon the completion of the Notes Merger, Darling and the Notes Guarantors became parties to the Original Purchase Agreement, by entering into a Joinder to the Purchase Agreement, dated as of the Notes Closing Date (together with the Original Purchase Agreement, the "Purchase Agreement"), with the Initial Purchasers. Upon satisfaction of the escrow release conditions on the Closing Date, the proceeds from the offering of the 5.375% Private
Page 85

DARLING INGREDIENTS INC. Notes to Consolidated Financial Statements (continued)
Notes were released from the escrow account in accordance with Darling’s written instructions. Darling used a portion of the proceeds from the offering of the 5.375% Private Notes to pay the Initial Purchasers’ commission related to the offering of the 5.375% Private Notes and certain fees and expenses (including bank fees and expenses) related to the financing of the VION Acquisition and for purposes of satisfying, discharging and redeeming its 8.5% Notes due 2018 described below. Darling used the remaining proceeds of the 5.375% Private Notes to pay certain other fees and expenses related to the completion of the VION Acquisition and its related financings, to repay a portion of the borrowings under its revolving credit facility used to fund a portion of the consideration for the VION Acquisition and for general corporate purposes.
The Purchase Agreement contains customary representations, warranties and agreements by Darling and the Notes Guarantors. In addition, Darling and the Notes Guarantors have agreed to indemnify the Initial Purchasers against certain liabilities, including liabilities under the Securities Act of 1933, as amended (the "Securities Act"), or to contribute to payments the Initial Purchasers may be required to make because of any of those liabilities. In connection with the assumption of the 5.375% Private Notes by Darling and the guarantee of the 5.375% Private Notes by the Notes Guarantors, on the Notes Closing Date, Darling and the Notes Guarantors became parties to, and Darling assumed all of Darling Escrow Sub’s obligations under, a registration rights agreement, dated as of January 2, 2014 (the "Registration Rights Agreement"). In satisfaction of Darling’s obligations under the Registration Rights Agreement, Darling and the Notes Guarantors completed a registered exchange offer for the 5.375% Private Notes under the Securities Act during the third quarter of 2014. The terms of the notes issued in exchange for the 5.375% Private Notes and guaranteed by the Notes Guarantors (the “5.375% Public Notes” and together with the 5.375% Private Notes, the “5.375% Notes") are substantially identical in all material respects to the 5.375% Private Notes, except that transfer restrictions, registration rights and additional interest provisions relating to the 5.375% Private Notes do not apply to the 5.375% Public Notes. The 5.375% Notes will mature on January 15, 2022 . Darling will pay interest on the 5.375% Notes on January 15 and July 15 of each year, commencing on July 15, 2014. Interest on the 5.375% Notes will accrue at a rate of 5.375% per annum and be payable in cash. Other than for extraordinary events such as change of control and defined assets sales, the Company is not required to make mandatory redemption or sinking fund payments on the 5.375% Notes. The 5.375% Notes are currently guaranteed on an unsecured senior basis by the Notes Guarantors, which constitute all of Darling’s existing restricted subsidiaries that are Credit Agreement Guarantors (other than Darling’s foreign subsidiaries). Under the Indenture, each restricted subsidiary of Darling (other than Darling’s foreign subsidiaries and certain of Darling’s subsidiaries that engage solely in the financing of receivables and are so designated by Darling) is required to guarantee the 5.375% Notes (a) if the Amended Credit Agreement is outstanding and such restricted subsidiary guarantees the Amended Credit Agreement and (b) if the Amended Credit Agreement is not outstanding, if such restricted subsidiary incurs or guarantees certain indebtedness in excess of $ 50.0 million . The 5.375% Notes and the guarantees thereof rank equally in right of payment to any existing and future senior debt of Darling and the Notes Guarantors, including debt that is secured by the collateral for the Amended Credit Agreement. The 5.375% Notes and the guarantees thereof will be effectively junior to existing and future debt of Darling and the Notes Guarantors that is secured by assets that do not constitute collateral for the Amended Credit Agreement, to the extent of the value of the assets securing such debt. The 5.375% Notes and the guarantees thereof will be structurally subordinated to all of the existing and future liabilities (including trade payables) of each of the subsidiaries of Darling that do not guarantee the 5.375% Notes. Darling may at any time and from time to time purchase the 5.375% Notes in the open market or otherwise. Darling may redeem some or all of the 5.375% Notes at any time prior to January 15, 2017, at a redemption price equal to 100% of the principal amount of the 5.375% Notes redeemed, plus accrued and unpaid interest to the redemption date and an Applicable Premium as specified in the Indenture. On and after January 15, 2017, Darling may redeem all or, from time to time, a part of the 5.375% Notes (including any additional Notes), upon not less than 30 nor more than 60 days' notice at the following redemption prices (expressed as a percentage of principal amount), plus accrued and unpaid interest on the 5.375% Notes, if any, to, but excluding, the applicable redemption date (subject to the right of holders of record on the relevant record date to receive interest due on the relevant interest payment date), if redeemed during the twelve-month period beginning on January 15 of the years indicated below:
Page 86

DARLING INGREDIENTS INC. Notes to Consolidated Financial Statements (continued)
In addition, prior to January 15, 2017, Darling may on one or more occasions redeem up to 40% of the original principal amount of the 5.375% Notes (calculated after giving effect to the issuance of any additional 5.375% Notes) with the net cash proceeds of one or more equity offerings at a redemption price equal to 105.375% of the principal amount thereof, plus accrued and unpaid interest, if any, to, but excluding, the redemption date (subject to the right of holders of record on the relevant record date to receive interest due on the relevant interest payment date); provided that at least 50% of the original principal amount of the 5.375% Notes (calculated after giving effect to the issuance of any additional 5.375% Notes) remains outstanding after each such redemption; provided further that the redemption occurs within 90 days after the closing of such equity offering.
The Indenture contains covenants limiting Darling’s ability and the ability of its restricted subsidiaries to, among other things: incur additional indebtedness or issue preferred stock; pay dividends on or make other distributions or repurchases of Darling’s capital stock or make other restricted payments; create restrictions on the payment of dividends or other amounts from Darling’s restricted subsidiaries to Darling or Darling’s other restricted subsidiaries; make loans or investments; enter into certain transactions with affiliates; create liens; designate Darling’s subsidiaries as unrestricted subsidiaries; and sell certain assets or merge with or into other companies or otherwise dispose of all or substantially all of Darling’s assets. The Indenture also provides for customary events of default, including, without limitation, payment defaults, covenant defaults, cross acceleration defaults to certain other indebtedness in excess of specified amounts, certain events of bankruptcy and insolvency and judgment defaults in excess of specified amounts. If any such event of default occurs and is continuing under the Indenture, the Trustee or the holders of at least 25% in principal amount of the total outstanding 5.375% Notes may declare the principal, premium, if any, interest and any other monetary obligations on all the then outstanding 5.375% Notes issued under the Indenture to be due and payable immediately. Senior Notes due 2018. On December 17, 2010, Darling issued $ 250.0 million aggregate principal amount of its 8.5% Senior Notes due 2018 (the “8.5% Notes”) under an indenture with U.S. Bank National Association, as trustee. On February 7, 2014, the Company completed the redemption of the 8.5% Notes for $ 280.4 million , which included a redemption premium of approximately $ 27.3 million and accrued and unpaid interest of approximately $ 3.1 million . The Amended Credit Agreement, 5.375% Notes and the 8.5% Notes consisted of the following elements at January 3, 2015 and December 28, 2013 , respectively (in thousands):
The Company's financial covenants under the Amended Credit Agreement were first effective for fiscal quarter ended June 28, 2014, which is the first full fiscal quarter after January 6, 2014. As of January 3, 2015 , the Company believes
Year Percentage
2017 104.031%
2018 102.688%
2019 101.344%
2020 and thereafter 100.000%
January 3, 2015 December 28,
2013
Senior Notes:
5.375% Notes due 2022 $ 500,000 $ — 8.5% Notes due 2018 $ — $ 250,000
Amended Credit Agreement: Term Loan A $ 312,161 $ 340,030 Term Loan B $ 1,205,669 $ — Revolving Credit Facility:
Maximum availability $ 1,000,000 $ 1,000,000 Borrowings outstanding 101,863 286,676 Letters of credit issued 32,198 32,662
Availability $ 865,939 $ 680,662

Page 87

DARLING INGREDIENTS INC. Notes to Consolidated Financial Statements (continued)
it is in compliance with all of the financial covenants under the Amended Credit Agreement, as well as all of the other covenants contained in the Amended Credit Agreement and the Indenture.
Maturities of long-term debt at January 3, 2015 follow (in thousands):
Bridge Facility . During 2013, the Company entered into a Bridge Facility (the "Bridge Facility") commitment with the parties to the Senior Secured Facilities in the aggregate principal amount not to exceed $ 1.3 billion . The proceeds of the Bridge Facility if drawn were to be used to finance the VION Acquisition. The Bridge Facility was available to ensure that the VION Acquisition would close if either or both of certain contemplated unsecured financing and the contemplated issuance of the Company's stock did not occur prior to the closing of the VION Acquisition. The Company accrued a commitment fee of approximately $ 13.0 million for the Bridge Facility. The Company recorded the commitment fee as interest expense in December 2013 when it was determined that the Bridge Facility would not be utilized.
NOTE 11. OTHER NONCURRENT LIABILITIES
Other noncurrent liabilities consist of the following (in thousands):
NOTE 12. INCOME TAXES
U.S. and foreign income from operations before income taxes are as follows (in thousands):
Income tax expense attributable to income from continuing operations before income taxes consists of the following (in thousands):
Page 88
Contractual
Debt Payment
2015 $ 54,401 2016 39,288 2017 29,678 2018 367,876 2019 12,624 thereafter 1,648,573
$ 2,152,440
January 3, 2015 December 28,
2013
Accrued pension liability (Note 15) $ 65,929 $ 11,097 Reserve for self insurance, litigation, environmental and tax
matters (Note 19) 44,832 27,603 Other 3,939 1,971
$ 114,700 $ 40,671
January 3,
2015 December 28,
2013 December 29,
2012
United States $ 58,972 $ 174,470 $ 206,785 Foreign 22,480 (10,792 ) —
Income from operations before income taxes $ 81,452 $ 163,678 $ 206,785

DARLING INGREDIENTS INC. Notes to Consolidated Financial Statements (continued)
Income tax expense for the years ended January 3, 2015 , December 28, 2013 and December 29, 2012 , differed from the amount computed by applying the statutory U.S. federal income tax rate to income from continuing operations before income taxes as a result of the following (in thousands):
The tax effects of temporary differences that give rise to significant portions of the deferred tax assets and deferred tax liabilities at January 3, 2015 and December 28, 2013 are presented below (in thousands):
Page 89
January 3,
2015 December 28,
2013 December 29,
2012
Current:
Federal $ 1,134 $ 8,109 $ 54,982 State (884 ) 7,213 10,368 Foreign 24,770 482 58
Total current 25,020 15,804 65,408 Deferred:
Federal 886 40,396 10,015 State 1,235 505 592 Foreign (14,000 ) (1,994 ) —
Total deferred (11,879 ) 38,907 10,607
$ 13,141 $ 54,711 $ 76,015
January 3,
2015 December 28,
2013 December 29,
2012
Computed "expected" tax expense $ 28,508 $ 57,287 $ 72,375 State income taxes, net of federal benefit 228 5,017 7,124 Section 199 qualified domestic
production deduction — (619 ) (4,830 )
Change in valuation allowance 5,420 507 254 Non-deductible compensation expenses 1,622 106 253 Deferred tax on unremitted foreign
earnings 1,956 — — Sub-Part F income 3,786 — — Foreign rate differential (9,754 ) 694 — Biofuel tax incentives (22,546 ) (9,342 ) — Non-deductible transaction costs 4,107 996 — Other, net (186 ) 65 839
$ 13,141 $ 54,711 $ 76,015
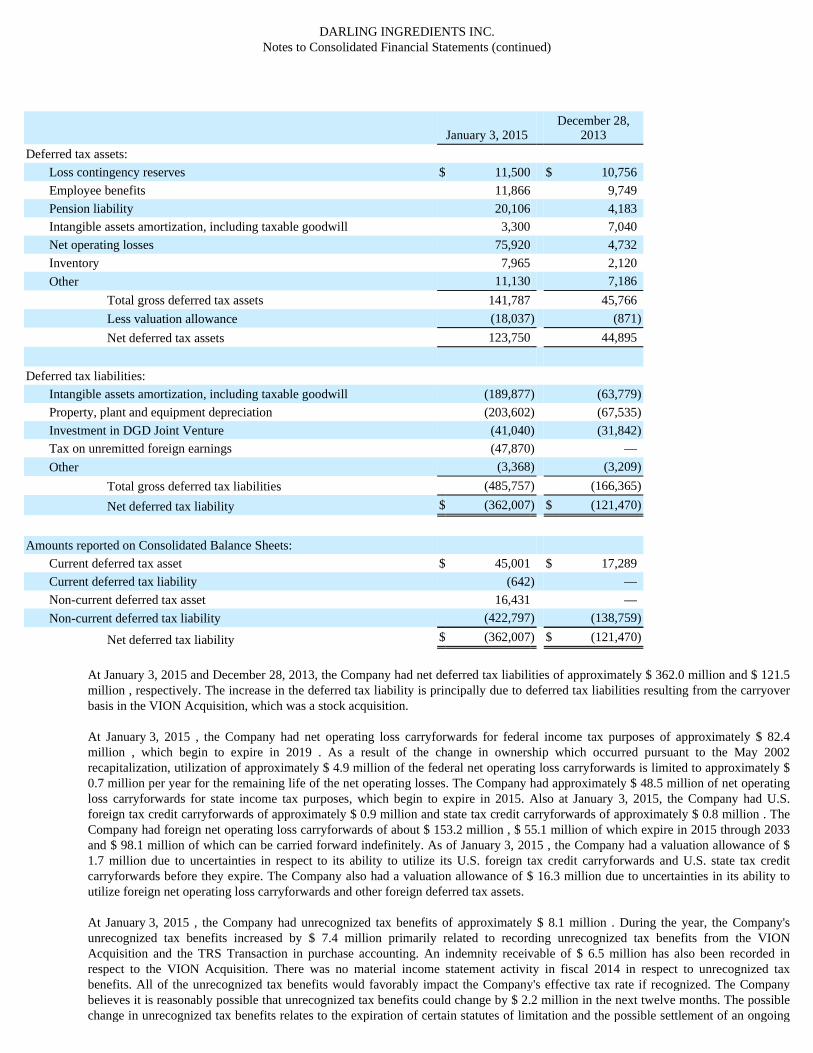
DARLING INGREDIENTS INC. Notes to Consolidated Financial Statements (continued)
At January 3, 2015 and December 28, 2013, the Company had net deferred tax liabilities of approximately $ 362.0 million and $ 121.5 million , respectively. The increase in the deferred tax liability is principally due to deferred tax liabilities resulting from the carryover basis in the VION Acquisition, which was a stock acquisition. At January 3, 2015 , the Company had net operating loss carryforwards for federal income tax purposes of approximately $ 82.4 million , which begin to expire in 2019 . As a result of the change in ownership which occurred pursuant to the May 2002 recapitalization, utilization of approximately $ 4.9 million of the federal net operating loss carryforwards is limited to approximately $ 0.7 million per year for the remaining life of the net operating losses. The Company had approximately $ 48.5 million of net operating loss carryforwards for state income tax purposes, which begin to expire in 2015. Also at January 3, 2015, the Company had U.S. foreign tax credit carryforwards of approximately $ 0.9 million and state tax credit carryforwards of approximately $ 0.8 million . The Company had foreign net operating loss carryforwards of about $ 153.2 million , $ 55.1 million of which expire in 2015 through 2033 and $ 98.1 million of which can be carried forward indefinitely. As of January 3, 2015 , the Company had a valuation allowance of $ 1.7 million due to uncertainties in respect to its ability to utilize its U.S. foreign tax credit carryforwards and U.S. state tax credit carryforwards before they expire. The Company also had a valuation allowance of $ 16.3 million due to uncertainties in its ability to utilize foreign net operating loss carryforwards and other foreign deferred tax assets. At January 3, 2015 , the Company had unrecognized tax benefits of approximately $ 8.1 million . During the year, the Company's unrecognized tax benefits increased by $ 7.4 million primarily related to recording unrecognized tax benefits from the VION Acquisition and the TRS Transaction in purchase accounting. An indemnity receivable of $ 6.5 million has also been recorded in respect to the VION Acquisition. There was no material income statement activity in fiscal 2014 in respect to unrecognized tax benefits. All of the unrecognized tax benefits would favorably impact the Company's effective tax rate if recognized. The Company believes it is reasonably possible that unrecognized tax benefits could change by $ 2.2 million in the next twelve months. The possible change in unrecognized tax benefits relates to the expiration of certain statutes of limitation and the possible settlement of an ongoing
January 3, 2015 December 28,
2013
Deferred tax assets:
Loss contingency reserves $ 11,500 $ 10,756 Employee benefits 11,866 9,749 Pension liability 20,106 4,183 Intangible assets amortization, including taxable goodwill 3,300 7,040 Net operating losses 75,920 4,732 Inventory 7,965 2,120 Other 11,130 7,186
Total gross deferred tax assets 141,787 45,766 Less valuation allowance (18,037 ) (871 )
Net deferred tax assets 123,750 44,895
Deferred tax liabilities:
Intangible assets amortization, including taxable goodwill (189,877 ) (63,779 )
Property, plant and equipment depreciation (203,602 ) (67,535 )
Investment in DGD Joint Venture (41,040 ) (31,842 )
Tax on unremitted foreign earnings (47,870 ) — Other (3,368 ) (3,209 )
Total gross deferred tax liabilities (485,757 ) (166,365 )
Net deferred tax liability $ (362,007 ) $ (121,470 )
Amounts reported on Consolidated Balance Sheets:
Current deferred tax asset $ 45,001 $ 17,289 Current deferred tax liability (642 ) — Non-current deferred tax asset 16,431 — Non-current deferred tax liability (422,797 ) (138,759 )
Net deferred tax liability $ (362,007 ) $ (121,470 )

income tax audit. The Company recognizes accrued interest and penalties, as appropriate, related to unrecognized tax benefits as a component of income tax expense. As of January 3, 2015, interest and penalties related to unrecognized tax benefits
Page 90

DARLING INGREDIENTS INC. Notes to Consolidated Financial Statements (continued)
were $ 2.5 million . These interest and penalties related to the unrecognized tax benefits from the Vion Acquisition and were primarily recorded in purchase accounting. A reconciliation of the beginning and ending amounts of unrecognized tax benefits is as follows (in thousands):
In fiscal 2014, the Company's major taxing jurisdictions are U.S. (federal and state), Belgium, Brazil, Canada, China, France, Germany and the Netherlands. The Company is subject to regular examination by various tax authorities and although the final outcome of these examinations is not yet determinable, the Company does not anticipate that any of the examinations will have a significant impact on the Company's results of operations or financial position. The statute of limitations for the Company's major jurisdictions is open for varying periods, but is generally closed through the 2005 tax year. Prior to fiscal 2014, the Company did not have significant operations outside of the U.S. During fiscal 2013, the Company began operations in Canada through the Rothsay Acquisition. During fiscal 2014, the Company began operations in the other major taxing jurisdictions through the VION Acquisition. The Company expects to indefinitely reinvest the earnings of its foreign subsidiaries outside the U.S. and has generally not provided deferred income taxes on the accumulated earnings of its foreign subsidiaries. At January 3, 2015, the amount of foreign subsidiary earnings indefinitely reinvested outside of the U.S. for which no deferred incomes taxes have been provided is not significant.
NOTE 13. STOCKHOLDERS' EQUITY AND STOCK-BASED COMPENSATION On November 26, 2013 a special meeting of the stockholders was held and a proposal to approve an amendment to Darling's restated certificate of incorporation, as amended, to increase the total number of authorized shares of common stock, par value $ 0.01 , from 150,000,000 to 250,000,000 was approved. On December 18, 2013, the Company offered and closed on the sale of 46,000,000 shares of its common stock at a price to the public of $ 19.00 per share, pursuant to an underwriting agreement dated December 12, 2013. The Company used the net proceeds of approximately $ 840.5 million to pay for a portion of the VION Acquisition, which closed on January 7, 2014. On May 8, 2012, the shareholders approved the Company's 2012 Omnibus Incentive Plan (the "2012 Omnibus Plan"). The 2012 Omnibus Plan replaced the Company's 2004 Omnibus Incentive Plan (the "2004 Omnibus Plan") for future grants. Under the 2012 Omnibus Plan, the Company is allowed to grant stock options, stock appreciation rights, non-vested and restricted stock (including performance stock), restricted stock units (including performance units), other stock-based awards, non-employee director awards, dividend equivalents and cash-based awards. There are up to 11,066,544 common shares available under the 2012 Omnibus Plan which may be granted to participants in any plan year (as such term is defined in the 2012 Omnibus Plan). Some of those shares are subject to outstanding awards as detailed in the tables below. To the extent these outstanding awards are forfeited or expire without exercise, the shares will be returned to and available for future grants under the 2012 Omnibus Plan. The 2012 Omnibus Plan’s purpose is to attract, retain and motivate employees, directors and third party service providers of the Company and to encourage them to have a financial interest in the Company. The 2012 Omnibus Plan is administered by the Compensation Committee (the "Committee") of the Board of Directors. The Committee has the authority to select plan participants, grant awards, and determine the terms and conditions of such awards as provided in the 2012 Omnibus Plan. The Committee has adopted an executive compensation program that includes a long-term incentive component (the "LTIP") for the Company's key employees, as a subplan under the terms of the 2012 Omnibus Plan. The principal purpose of the LTIP is to encourage the Company's executives to enhance the value of the Company and, hence, the price of the Company’s stock and the stockholders' return. In addition, the LTIP is designed to create retention incentives for the individual and to provide an opportunity for increased equity ownership by executives. The Committee awarded dollar value performance based restricted stock and stock option opportunities under the LTIP in each of fiscal 2014 , 2013 and 2012 to certain of the Company's key employees, including the Chief Executive Officer and other executive officers. The restricted stock and stock options underlying the LTIP are issued only if a predetermined financial objective is met by the Company. The Company met the financial objective for fiscal 2013 and fiscal 2012 and those shares and options were issued in accordance with the terms of the LTIP. See "Fiscal 2012 Long-Term Incentive Opportunity Awards" below for a discussion of the fiscal 2014 LTIP award opportunities. The Company’s stock options granted under the 2012 Omnibus Plan generally terminate 10 years after date of grant. At January 3, 2015 , the number of common shares available for issuance under the 2012 Omnibus Plan was
January 3, 2015 December 28,
2013
Balance at beginning of Year $ 652 $ — Change in tax positions related to current year — 652 Change in tax positions related to prior years 7,935 — Expiration of the Statute of Limitations (457 ) —
Balance at end of year $ 8,130 $ 652

8,829,322 . The following is a summary of stock-based compensation granted during the years ended January 3, 2015 , December 28, 2013 and December 29, 2012 . Nonqualified Stock Options . On March 6, 2012, the Company's board of directors granted 135,733 nonqualified stock options in the aggregate under the Company's LTIP to certain of the Company's employees. The exercise price for the March 6, 2012 stock options was $16.98 per share (fair market value at the close of the trading day immediately preceding the grant date). All of these awards vest 25 percent upon grant and 25 percent on each of the first three anniversary dates of the grant thereafter. On March 5, 2013, the Company's board of directors granted 195,634 nonqualified stock options in the aggregate under the Company's LTIP to certain of the Company's employees. The exercise price for the March 5, 2013 stock options was $ 16.53 per share (fair market value at the close of the trading day immediately preceding the grant date). All of these awards vest 25 percent upon grant and 25 percent on each of the first three anniversary dates of the grant thereafter. On March 4, 2014, the Company's board of directors granted 163,078 nonqualified stock options in the aggregate under the Company’s LTIP to certain of the Company’s employees. The exercise price for the March 4, 2014 stock options was $19.94 per share (fair market value at the close of the trading day immediately preceding the grant date). All of these awards vest 25 percent upon grant and 25 percent on each of the first three anniversary dates of the grant thereafter.
Incentive Stock Options . For fiscal 2014 , 2013 and 2012 none of the options issued were incentive stock options.
A summary of all stock option activity as of January 3, 2015 and changes during the year ended is presented below.
The fair value of each stock option grant under the Company's stock option plan was estimated on the date of grant using the Black Scholes option-pricing model with the following weighted average assumptions and results for fiscal 2014 , 2013 and 2012 .
The expected lives for options granted during fiscal 2014 , 2013 and 2012 were computed using the simplified method. At January 3, 2015 , $ 15.9 million of total future equity-based compensation expense (determined using the Black-Scholes option pricing model and Monte Carlo model for non-vested stock grants with performance based incentives) related to outstanding non-vested options and stock awards is expected to be recognized over a weighted average period of 1.8 years.
For the year ended January 3, 2015 , the amount of cash received from the exercise of options was approximately $ 0.4 million and the related tax benefits were approximately $ 2.4 million . For the year ended December 28, 2013 and December 29, 2012 , the amount of cash received from the exercise of options was insignificant and approximately $ 0.1 million , respectively, and the related tax benefits were approximately $ 0.7 million and $ 2.7 million , respectively. The total intrinsic value of options exercised for the years ended January 3, 2015 , December 28, 2013 and December 29, 2012 was approximately $ 4.5 million , $ 0.2 million and $ 3.3 million , respectively. The fair value of shares vested for the years ended January 3, 2015 , December 28, 2013 and December 29, 2012 was approximately $ 19.6 million , $ 8.2 million and $ 8.1 million , respectively. At January 3, 2015 , the aggregate intrinsic value of options outstanding was approximately $ 3.3 million and the aggregate intrinsic value of options exercisable was approximately $ 3.1 million .
Number of
shares
Weighted-avg. exercise price
per share
Weighted-avg. remaining
contractual life
Options outstanding at December 28, 2013 906,251 $ 9.97
Granted 163,078 19.94
Exercised (343,550 ) 6.18
Forfeited (29,603 ) 16.89
Expired — —
Options outstanding at January 3, 2015 696,176 $ 13.88 6.2 years
Options exercisable at January 3, 2015 528,009 $ 12.50 5.5 years
Weighted Average 2014 2013 2012
Expected dividend yield 0.0% 0.0% 0.0%
Risk-free interest rate 1.77% 1.01% 1.14%
Expected term 5.75 years 5.75 years 5.75 years
Expected volatility 43.7% 59.8% 62.0%
Fair value of options granted $8.93 $9.04 $9.16

Non-Vested Stock, Restricted Stock Unit and Performance Share Unit Awards . On March 6, 2012, the Company's board of directors granted 375,041 shares of stock under the 2004 Omnibus Plan, 300,041 shares of which were under the Company's LTIP and 75,000 shares of which were granted as discretionary grants to other employees not part of the Company's LTIP. At the March 6, 2012 grant date 93,761 shares vested immediately and the remaining stock awards vest over the next three anniversary dates of the grants in equal installments. On May 8, 2012, the Company's board of directors granted 5,000 shares of stock under the 2004 Omnibus Plan to a newly employed officer of the Company. At the May 8, 2012 grant date 1,250 shares vested immediately and the remaining shares vest over the next three anniversary dates of the grant in equal installments. On September 1, 2012, the Company's board of directors granted 50,000 shares of stock under the 2012 Omnibus Plan to the Company's new Chief Financial Officer. At the September 1, 2012 grant date 25,000 shares vested immediately and the remaining shares vest over the next three anniversary dates of the grant in equal installments. On March 5, 2013, the Company's board of directors granted 495,575 shares of stock under the 2012 Omnibus Plan, 449,575 shares of which were under the Company's LTIP and 46,000 shares of which were granted as a discretionary grants to other employees not part of the Company's LTIP. At the March 5, 2013 grant date 123,894 shares vested immediately and the remaining stock awards vest over the next three anniversary dates of the grants in equal installments. On August 5, 2013 the Company's board of directors granted 24,000 shares to one of the Company's officers. At the August 5, 2013 grant date 8,000 shares vested immediately and the remaining shares vest over the next two anniversary dates of the grant in equal installments provided that certain performance measures are achieved. On March 4, 2014, the Company's board of directors granted 424,158 shares of stock under the 2012 Omnibus Plan, 377,658 shares of which were under the Company's LTIP and 46,500 shares of which were granted as a discretionary grants to other employees not part of the Company's LTIP. At the March 4, 2014 grant date 106,042 shares vested immediately and the remaining stock awards vest over the next three anniversary dates of the grants in equal installments. On May 6, 2014, the Company's board of directors granted 3,000 shares of stock under the 2012 Omnibus Plan to a newly employed officer of the Company. At the May 6, 2014 grant date 750 shares vested immediately and the remaining shares vest over the next three anniversary dates of the grant in equal installments. On June 4, 2014, the Company's board of directors granted 7,500 shares of stock under the 2012 Omnibus Plan to a newly hired key employee of the Company. At the June 4, 2014 grant date 1,875 shares vested immediately and the remaining shares vest over the next three anniversary dates of the grant in equal installments. On September 8, 2014, the Company's board of directors granted 4,000 shares of stock under the 2012 Omnibus Plan to a key employee of the Company. At the September 8, 2014 grant date 1,000 shares vested immediately and the remaining shares vest over the next three anniversary dates of the grant in equal installments. On June 3, 2014, the Company granted 5,500 non-vested restricted stock units under the Company's 2012 Omnibus Plan to key foreign-based employees of the Company with each restricted stock unit equivalent to one share of common stock. At the June 3, 2014 grant date, 1,375 of the restricted stock units vested immediately and stock was issued, with the remaining restricted stock units vesting over the next three years in equal installments on March 4 of fiscal years 2015, 2016 and 2017, respectively. On June 19, 2014, the Company granted 17,500 non-vested restricted stock units under the Company's 2012 Omnibus Plan to key foreign-based employees of the Company, with each restricted stock unit equivalent to one share of common stock. At the June 19, 2014 grant date, 4,375 of the restricted stock units vested immediately and stock was issued, with the remaining restricted stock units vesting over the next three years in equal installments on March 4 of 2015, 2016 and 2017, respectively. In connection with the closing of the VION Acquisition, in January 2014, the Company made awards of Performance Share Units (PSUs) and common stock under the Company’s 2012 Omnibus Incentive Plan to certain of the Company’s executives selected by the Committee. The awards covered an aggregate of 975,000 shares of the Company’s common stock. For North American-based executives, each award was in the form of PSUs for a specified number of shares of common stock of the Company. For European-based executives, each award was in the form of a combination of fully vested shares (representing 25% of the total award given to the European-based executives), and PSUs for a specified number of shares common stock of the Company (representing the other 75% of the award). On January 7, 2014, the Company issued 118,750 fully vested shares that were granted to the European-based executives. Performance Units will vest in three equal installments on the first, second and third anniversaries of the closing of the VION Acquisition based on attainment of specified levels of adjusted EBITDA for the Company and/or Darling Ingredients International for fiscal years 2014, 2015 and 2016, respectively. If the target level of adjusted EBITDA for the fiscal year for both the Company and/or Darling Ingredients International is not achieved (subject to a near miss provision contained in the award agreements that provides for a portion of the shares to be paid out under certain circumstances), the installment for the related vesting date will be forfeited. Generally, an award recipient must remain employed with the Company and its subsidiaries through each vesting date to become vested in the award on that vesting date, subject to the performance requirements described above. If an award recipient terminates employment before a vesting date for any reason other than death or disability, any unvested portion of the award will be forfeited. In case of termination of employment due to death or disability, a prorated portion (based upon the award recipient’s actual period of service prior to the vesting date) of the award will vest on each vesting date based on actual performance results. On November 11, 2010, the Committee approved a 2010 Special Incentive Program (the "2010 Special Incentive Program") for certain key employees of the Company pursuant to the Company's 2004 Omnibus Plan, conditioned upon the closing of the Griffin merger. Under the 2010 Special Incentive Program, certain key employees (the "Participating Employees") upon successful completion of the Griffin merger became eligible to receive a total of 640,000 . As of January 3, 2015 all shares granted have been issued except for 6,667 shares that have been forfeited. A summary of the Company’s non-vested stock, restricted stock unit and performance share unit awards as of January 3, 2015 , and changes during the year ended is as follows:

Nonemployee Director Restricted Stock and Restricted Stock Unit Awards. On February 24, 2011, the Company's Board of Directors approved an Amended and Restated Non-Employee Director Restricted Stock Award Plan (the "Director Restricted Stock Plan") pursuant to and in accordance with the 2004 Omnibus Plan in order to attract and retain highly qualified persons to serve as non-employee directors and to more closely align such directors' interests with the interests of the stockholders of the Company by providing a portion of their compensation in the form of Company common stock. Under the Director Restricted Stock Plan, $ 60,000 in restricted Company common stock was awarded to each non-employee director on the fourth business day after the Company released its earnings for its prior completed fiscal year (the "Date of Award"). The amount of restricted stock to be issued was calculated using the closing price of the Company’s common stock on the third business day after the Company released its earnings. The restricted stock was subject to a right of repurchase at $ 0.01 per share upon termination of the holder as a member of the Company's board of directors for cause and was not transferable. These restrictions lapse with respect to 100% of the restricted stock upon the earliest to occur of (i) ten years after the date of award, (ii) a Change of Control (as defined in the 2004 Omnibus Plan), and (iii) termination of the non-employee director's service with the Company, other than for "cause" (as defined in the Director Restricted Stock Plan). On March 5, 2013, the Company issued 21,780 shares of restricted stock in the aggregate to its non-employee directors under the Director Restricted Stock Plan. On March 6, 2012, the Company issued 21,204 shares of restricted stock in the aggregate to its non-employee directors under the Director Restricted Stock Plan. Beginning in fiscal 2014, the Board discontinued grants to non-employee directors under the Director Restricted Stock Plan described above, and in lieu thereof, as an additional element of annual non-employee director compensation, pursuant to the 2012 Omnibus Plan, each non-employee director now receives $ 90,000 of restricted stock units immediately following the Company’s annual meeting of stockholders at which such directors are elected. The number of restricted stock units to be issued is calculated using the closing price of the Company’s stock on the date of its annual meeting. The award vests (and is no longer subject to forfeiture) on the first to occur of (i) the first anniversary of the grant date, (ii) the date of the annual shareholders meeting next following the grant date, (iii) the grantee’s separation from service as a result of death or disability, or (iv) a change of control. The award will become "payable" in shares of the Company’s stock in a single lump sum payment as soon as possible following a grantee’s separation from service, subject to a grantee’s right to elect a deferral under certain circumstances. If a grantee ceases to be a director for any reason other than death or disability prior to vesting, the grantee will receive a prorated amount of the award up to the date of separation. Accordingly, under this program, on May 6, 2014 the Company granted 22,680 restricted stock units in the aggregate to its non-employee directors, and on September 25, 2014 the Company issued 2,998 restricted stock units, representing a prorated amount of the annual grant, to a newly appointed director. A summary of the Company’s non-employee director restricted stock awards as of January 3, 2015 , and changes during the year ended is as follows:
Fiscal 2014 Long-Term Incentive Opportunity Awards . The Committee awarded dollar value performance based restricted stock and stock option opportunities under the LTIP for fiscal 2014 to certain of the Company's key employees, including the Chief Executive Officer, the Chief Operating Officer and certain of its Executive Vice Presidents (the "2014 Restricted Stock and Option Awards"). The restricted stock and stock options underlying the 2014 Restricted Stock and Option Awards are issued only if a predetermined financial objective is met by the Company. The Company met the financial objective for fiscal 2014 . Accordingly, in accordance with the terms of the 2014 Restricted Stock and Option Awards, it is anticipated that the earned amount of restricted stock and stock options will be granted and issued to the recipients on the fourth business day after the Company releases its annual financial results for fiscal 2014 . The amount of restricted stock and stock options to be issued to the Company's senior management was predetermined using a discounted per share price. The "Discounted Per Share Price" is derived by discounting the closing market price
Non-Vested
Shares
Weighted Average Grant Date Fair Value
Stock awards outstanding December 28, 2013 821,207 $ 14.93 Shares granted 1,436,658 20.73 Shares vested (861,772 ) 16.43 Shares forfeited (138,920 ) 19.90
Stock awards outstanding January 3, 2015 1,257,173 $ 19.98
Restricted
Shares
Weighted Average Grant Date Fair Value
Stock awards outstanding December 28, 2013 130,238 $ 10.75 Restricted shares granted 25,678 19.67 Restricted shares where the restriction lapsed — — Restricted shares forfeited — —
Stock awards outstanding January 3, 2015 155,916 $ 12.22
of the Company's common stock as of the last trading day of the immediately preceding fiscal year to account for forfeiture of the restricted stock based on, among other things, the probability of the failure of the restricted stock to be granted and the failure of the Company to meet the required performance measures. The stock options will have an exercise price equal to the fair market value of the Company's common stock on the third business day after the Company releases its annual financial results. The above 2014 Restricted Stock and Option Awards were deemed equity classified in fiscal 2014 as the shares are known, but have not yet been granted. In addition, a portion of the fiscal 2014 LTIP stock awards are treated as a liability until the grant date when the number of shares to be issued is known, and then it becomes equity classified. At January 3, 2015 , the Company recorded a liability of approximately $ 0.4 million on the balance sheet for the long-term incentive opportunities.
NOTE 14. COMPREHENSIVE INCOME
The Company follows FASB authoritative guidance for reporting and presentation of comprehensive income or loss and its components. Other comprehensive income (loss) is derived from adjustments that reflect pension adjustments, natural gas derivative adjustments, corn option adjustments, foreign currency translation adjustments and interest rate swap derivative adjustments. The components of other comprehensive income (loss) and the related tax impacts for the years ended January 3, 2015 , December 28, 2013 and December 29, 2012 are as follows (in thousands):
Page 91

DARLING INGREDIENTS INC. Notes to Consolidated Financial Statements (continued)
Before-Tax Tax (Expense) Net-of-Tax
Amount or Benefit Amount
Year Ended December 29, 2012
Defined Benefit Pension Plans
Actuarial (loss)/gain recognized $ (6,768 ) $ 2,623 $ (4,145 )
Amortization of actuarial loss 4,756 (1,844 ) 2,912 Actuarial prior service cost recognized — — — Amortization of prior service costs 103 (39 ) 64
Total defined benefit pension plans (1,909 ) 740 (1,169 )
Natural gas swap derivatives
Loss/(gain) reclassified to net income 1,267 (491 ) 776 Gain/(loss) recognized in other comprehensive income (loss) (628 ) 243 (385 )
Total natural gas derivatives 639 (248 ) 391 Corn option derivatives
Gain/(loss) recognized in other comprehensive income (loss) 317 (123 ) 194 Total corn options 317 (123 ) 194
Interest swap derivatives
Loss reclassified to net income 260 (101 ) 159 Other comprehensive income/(loss) $ (693 ) $ 268 $ (425 )
Year Ended December 28, 2013
Defined Benefit Pension Plans
Actuarial (loss)/gain recognized $ 18,773 $ (6,904 ) $ 11,869 Amortization of actuarial loss 5,202 (2,018 ) 3,184 Amortization of prior service costs 142 (55 ) 87
Total defined benefit pension plans 24,117 (8,977 ) 15,140 Natural gas swap derivatives
Loss/(gain) reclassified to net income (41 ) 16 (25 )
Gain/(loss) recognized in other comprehensive income (loss) 248 (96 ) 152 Total natural gas derivatives 207 (80 ) 127
Corn option derivatives
Loss/(gain) reclassified to net income (5,486 ) 2,129 (3,357 )
Gain/(Loss) recognized in other comprehensive income 7,350 (2,852 ) 4,498 Total corn options 1,864 (723 ) 1,141
Foreign currency translation (14,502 ) — (14,502 )
Other comprehensive income/(loss) $ 11,686 $ (9,780 ) $ 1,906
Year Ended January 3, 2015
Defined Benefit Pension Plans
Actuarial (loss)/gain recognized $ (34,547 ) $ 12,001 $ (22,546 )
Amortization of actuarial loss 2,078 (806 ) 1,272 Actuarial prior service cost recognized 1,140 (261 ) 879 Amortization of prior service costs 23 (9 ) 14
Total defined benefit pension plans (31,306 ) 10,925 (20,381 )
Natural gas swap derivatives
Loss/(gain) reclassified to net income (196 ) 76 (120 )
Gain/(loss) recognized in other comprehensive income (loss) 11 (4 ) 7 Total natural gas derivatives (185 ) 72 (113 )
Corn option derivatives
Loss/(gain) reclassified to net income (3,868 ) 1,501 (2,367 )
Gain/(Loss) recognized in other comprehensive income 1,812 (704 ) 1,108

Page 92
Total corn options (2,056 ) 797 (1,259 )
Foreign currency translation (125,884 ) — (125,884 )
Other comprehensive income/(loss) $ (159,431 ) $ 11,794 $ (147,637 )

DARLING INGREDIENTS INC. Notes to Consolidated Financial Statements (continued)
The following table presents changes in each component of accumulated comprehensive income (loss) as of January 3, 2015 as follows (in thousands):
NOTE 15. EMPLOYEE BENEFIT PLANS
The Company has retirement and pension plans covering a substantial number of its domestic and foreign employees. Most retirement benefits are provided by the Company under separate final-pay noncontributory and contributory defined benefit and defined contribution plans for all salaried and hourly employees (excluding those covered by union-sponsored plans) who meet service and age requirements. Although various defined benefit formulas exist for employees, generally these are based on length of service and earnings patterns during employment. Effective January 1, 2012, the Company's Board of Directors authorized the Company to proceed with the restructuring of its domestic retirement benefit program to include the closing of Darling's domestic salaried and hourly defined benefit plans to new participants as well as the freezing of service and wage accruals thereunder effective December 31, 2011 (a curtailment of these plans for financial reporting purposes) and the enhancing of benefits under the Company's domestic defined contribution plans. The Company-sponsored domestic hourly union plan has not been curtailed; however, several locations of the Company-sponsored domestic hourly union plan have been curtailed as a result of collective bargaining renewals for those sites.
As a result of the Rothsay Acquisition, certain employees of MFI became employees of the Company. Pursuant to the terms of the Acquisition Agreement between MFI and Darling dated August 23, 2013, the pension benefits of these employees in respect to service prior to October 28, 2013 remain the responsibility of MFI. Benefits and rights accruing to these employees on and after October 28, 2013 (including earning increases on benefits accrued for non-Quebec employees prior to October 28, 2013) are the responsibility of
Fiscal Year Ended
January 3, 2015 December 28,
2013 December 29,
2012 Statement of Operations
Classification
Derivative instruments
Natural gas swap derivatives $ 196 $ 41 $ (1,267 ) Cost of sales and operating expenses
Corn option derivatives 3,868 5,486 — Cost of sales and operating expenses
Interest rate swap derivatives — — (260 ) Interest expense
4,064 5,527 (1,527 ) Total before tax
(1,577 ) (2,145 ) 592 Income taxes
2,487 3,382 (935 ) Net of tax
Defined benefit pension plans Amortization of prior service cost $ (23 ) $ (142 ) $ (103 ) (a)
Amortization of actuarial loss (2,078 ) (5,202 ) (4,756 ) (a)
(2,101 ) (5,344 ) (4,859 ) Total before tax
815 2,073 1,883 Income taxes
(1,286 ) (3,271 ) (2,976 ) Net of tax
Total reclassifications $ 1,201 $ 111 $ (3,911 ) Net of tax
(a) These items are included in the computation of net periodic pension cost. See Note 15 Employee Benefit Plans for additional information.
Fiscal Year Ended January 3, 2015
Foreign Currency Derivative Defined Benefit
Translation Instruments Pension Plans Total
Accumulated Other Comprehensive Income/(loss) December 28, 2013, net of tax $ (14,502 ) $ 1,448 $ (16,369 ) $ (29,423 )
Other comprehensive gain before reclassifications (125,884 ) 1,115 (21,667 ) (146,436 )
Amounts reclassified from accumulated other comprehensive income/(loss) — (2,487 ) 1,286 (1,201 )
Net current-period other comprehensive income (125,884 ) (1,372 ) (20,381 ) (147,637 )
Accumulated Other Comprehensive Income/(loss) January 3, 2015, net of tax $ (140,386 ) $ 76 $ (36,750 ) $ (177,060 )

the Company.
Page 93

DARLING INGREDIENTS INC. Notes to Consolidated Financial Statements (continued)
Additionally, as a result of the VION Acquisition, employees of VION Ingredients became employees of Darling Ingredients International. Pursuant to the terms of the Sale and Purchase Agreement dated October 3, 2013, as amended, between Darling and VION, Darling assumed approximately $ 28.9 million of unfunded pension and insignificant postretirement benefit plan obligations. The Company maintains defined contribution plans both domestically and at its foreign entities. The Company's matching portion and annual employer contributions to the Company's domestic defined contribution plans for fiscal 2014 , 2013 and 2012 were approximately $ 9.2 million , $ 8.2 million and $ 7.2 million , respectively. The Company's matching portion and annual employer contributions to the Company's foreign defined contribution plans for fiscal 2014 and 2013 were approximately $ 3.5 million and $ 0.1 million , respectively. The Company recognizes the over-funded or under-funded status of the Company's defined benefit post-retirement plans as an asset or liability in the Company's balance sheet, with changes in the funded status recognized through comprehensive income in the year in which they occur. The following table sets forth the plans’ funded status for the Company's domestic and foreign defined benefit plans and amounts recognized in the Company's consolidated balance sheets based on the measurement date ( January 3, 2015 and December 28, 2013 ) (in thousands):
January 3,
2015 December 28,
2013
Change in projected benefit obligation:
Projected benefit obligation at beginning of period $ 129,966 $ 137,797 Acquisitions 199,996 4,102 Service cost 5,208 507 Interest cost 13,214 5,307 Employee contributions 1,946 20 Plan amendments (1,371 ) — Actuarial loss 88,592 (12,904 )
Benefits paid (13,045 ) (4,761 )
Other (29,364 ) (102 )
Projected benefit obligation at end of period 395,142 129,966
Change in plan assets: Fair value of plan assets at beginning of period 118,898 106,519 Acquisitions 171,117 — Actual return on plan assets 67,090 13,147 Employer contributions 7,061 3,973 Employee contributions 1,946 20 Benefits paid (13,045 ) (4,761 )
Other (24,847 ) — Fair value of plan assets at end of period 328,220 118,898
Funded status (66,922 ) (11,068 )
Net amount recognized $ (66,922 ) $ (11,068 )
Amounts recognized in the consolidated balance sheets consist of:
Noncurrent assets $ — $ 29 Current liability (993 ) — Noncurrent liability (65,929 ) (11,097 )
Net amount recognized $ (66,922 ) $ (11,068 )
Amounts recognized in accumulated other

Page 94
comprehensive loss consist of: Net actuarial loss $ 59,207 $ 26,738 Prior service cost/(credit) (1,131 ) 32
Net amount recognized (a) $ 58,076 $ 26,770

DARLING INGREDIENTS INC. Notes to Consolidated Financial Statements (continued)
The amounts included in "Other" in the above table reflect the impact of foreign exchange translation for plans in Argentina, Brazil, Belgium, Canada, France, Germany, Japan, Netherlands and United Kingdom. The Company's domestic pension plan benefits comprise approximately 37% and 97% of the projected benefit obligation for fiscal 2014 and fiscal 2013, respectively. Additionally, the Company has made required and tax deductible discretionary contributions to its domestic pension plans in fiscal 2014 and fiscal 2013 of approximately $ 0.3 million and approximately $ 4.0 million , respectively. The Company made required and tax deductible discretionary contributions to its foreign pension plans in fiscal 2014 of approximately $ 6.8 million . In fiscal 2013 no contributions were made to the foreign plans.
Net pension cost includes the following components (in thousands):
Amounts recognized in accumulated other comprehensive income (loss) for the year ended (in thousands):
The estimated amount that will be amortized from accumulated other comprehensive loss into net periodic pension cost in fiscal 2015 is as follows (in thousands):
Weighted average assumptions used to determine benefit obligations were:
Page 95
(a) Amounts do not include deferred taxes of $ 21.3 million and $ 10.4 million at January 3, 2015 and December 28, 2013 , respectively.
January 3,
2015 December 28,
2013
Projected benefit obligation $ 395,142 $ 129,966 Accumulated benefit obligation 376,043 125,939 Fair value of plan assets 328,220 118,898
January 3,
2015 December 28,
2013 December 29,
2012
Service cost $ 5,208 $ 507 $ 326 Interest cost 13,214 5,307 5,451 Expected return on plan assets (14,439 ) (7,277 ) (6,709 )
Net amortization and deferral 2,094 5,261 4,845 Curtailment 7 83 14
Net pension cost $ 6,084 $ 3,881 $ 3,927
2014 2013
Actuarial (loss)/gain recognized:
Reclassification adjustments $ 1,272 $ 3,184 Actuarial (loss)/gain recognized during the period (22,546 ) 11,869
Prior service (cost) credit recognized: Reclassification adjustments 14 87 Prior service cost arising during the period 879 —
$ (20,381 ) $ 15,140
2015
Net actuarial loss $ 5,142 Prior service cost (81 )
$ 5,061

DARLING INGREDIENTS INC. Notes to Consolidated Financial Statements (continued)
Weighted average assumptions used to determine net periodic benefit cost for the employee benefit pension plans were:
Consideration was made to the long-term time horizon for the (U.S. and Canada's) plans' benefit obligations as well as the related asset class mix in determining the expected long-term rate of return. Historical returns are also considered, over the long-term time horizon, in determining the expected return. Considering the overall asset mix of approximately 60% equity and 40% fixed income with equity exposure on a declining trend since the implementation of the glide path for two of the U.S. plans the Company believes it is reasonable to expect a long-term rate of return of 7.1% for the (U.S. and Canada's) plans' investments as a whole. The remaining foreign plans' assets are principally invested under insurance contracts arrangements which have weighted average expected long-term rate of returns of 3.8% .
The investment objectives have been established in conjunction with a comprehensive review of the current and projected financial requirements. The primary investment objectives are: 1) to have the ability to pay all benefit and expense obligations when due; 2) to maximize investment returns within reasonable and prudent levels of risk in order to minimize contributions; and 3) to maintain flexibility in determining the future level of contributions.
Investment results are the most critical element in achieving funding objectives; however, contributions are used as a supplemental source of funding as deemed appropriate.
The investment guidelines are based upon an investment horizon of greater than ten years; therefore, interim fluctuations are viewed with this perspective. The strategic asset allocation is based on this long-term perspective and the plans' funded status. However, because the participants’ average age is somewhat older than the typical average plan age, consideration is given to retaining some short-term liquidity. Analysis of the cash flow projections of the plans indicates that benefit payments will continue to exceed contributions. The results of a thorough asset-liability study completed during 2012 established a dynamic asset allocation glide path (the "Glide Path") by which the U.S. plans' asset allocations are determined. The Glide Path designates intervals based on funded status which contain a corresponding allocation to equities/real assets and fixed income. As the U.S. plans' funded status improves, the allocations become more conservative, and the opposite is true when the funded status declines.
The equity allocation is invested in stocks traded on one of the U.S. stock exchanges or in foreign companies whose stock is traded outside the U.S. and/or companies that conduct the major portion of their business outside the U.S. Securities convertible into such stocks, convertible bonds and preferred stock, may also be purchased. The portfolio may invest in American Depository Receipts ("ADR"). The majority of the equities are invested in mutual funds that are well-diversified amount growth and value stocks, as well as large, mid, and small cap assets. This mix is balanced based on the understanding that large cap stocks are historically less volatile than small cap stocks: however, smaller cap stocks have historically outperformed larger cap stocks. The emerging markets portion of the equity allocation is held below 10% due to greater volatility in the asset class. Risk adjusted returns are the primary driver of allocation choices within these asset classes. The portfolio is well-diversified in terms of companies, industries and countries.
Page 96
January 3,
2015 December 28,
2013 December 29,
2012
Discount rate 2.79% 4.66% 3.90%
Rate of compensation increase 1.82% 3.00% —%
January 3,
2015 December 28,
2013 December 29,
2012
Discount rate 4.15% 3.96% 4.50%
Rate of increase in future compensation levels 1.70% —% —%
Expected long-term rate of return on assets 5.06% 7.35% 7.35%
Fixed Income 35% - 80%
Equities 20% - 65%


DARLING INGREDIENTS INC. Notes to Consolidated Financial Statements (continued)
The diversified asset portion of the allocation will invest in securities with a goal to out pace inflation and preserve their value. The securities in this allocation may consist of inflation-indexed bonds, securities of real estate companies, commodity index-linked notes, fixed-income securities, securities of natural resource companies, master limited partnerships, publicly-listed infrastructure companies, and floating rate debt.
All investment objectives are expected to be achieved over a market cycle anticipated to be a period of five to seven years. Reallocations are performed on a monthly basis to retain target allocation ranges. On a quarterly basis the plans' funded status will be recalculated to determine which Glide Path interval allocation is appropriate. The following table presents fair value measurements for the Company's defined benefit plans’ assets as categorized using the fair value hierarchy under FASB authoritative guidance (in thousands):
The majority of the U.S. and Canada plan pension assets are invested in mutual funds; however, some assets are invested in pooled separate accounts ("PSA") which have similar mutual fund counterparts. PSA accounts are generally used to access lower fund management expenses when compared to their mutual fund counterparts. The mutual funds are generally invested in institutional shares, retirement shares, or A-shares with no loads. The fair value of each mutual fund and PSA is based on the market value of the underlying investments. The majority of the foreign pension assets are held under insurance contracts where the investment risk for the accumulated benefit obligation rests with the insurer, which the Company has no specific detailed asset information. Contributions
The Company's funding policy for employee benefit pension plans is to contribute annually not less than the minimum amount required nor more than the maximum amount that can be deducted for federal income tax purposes. Contributions are intended to provide not only for benefits attributed to service to date but also for those expected to be earned in the future.
Based on current actuarial estimates, the Company expects to make payments of approximately $ 6.5 million to meet funding requirements for its domestic and foreign pension plans in fiscal 2015 .
Page 97
Total
Quoted Prices in Active Markets for
Identical Assets
Significant Other Observable
Inputs
Significant Unobservable
Inputs
(In thousands of dollars) Fair Value (Level 1) (Level 2) (Level 3)
Balances as December 28, 2013
Fixed Income:
Long Term $ 60,654 $ 22,906 $ 37,748 $ — Short Term 771 — 771 —
Equity Securities: Domestic equities 40,028 38,137 1,891 — International equities 17,445 16,465 980 —
Totals $ 118,898 77,508 $ 41,390 $ —
Balances as January 3, 2015
Fixed Income: Long Term $ 71,820 $ 23,619 $ 48,201 $ — Short Term 1,419 — 1,419 —
Equity Securities: Domestic equities 41,813 35,946 5,867 — International equities 18,259 16,953 1,306 —
Insurance contracts 194,909 — — 194,909
Totals $ 328,220 $ 76,518 $ 56,793 $ 194,909

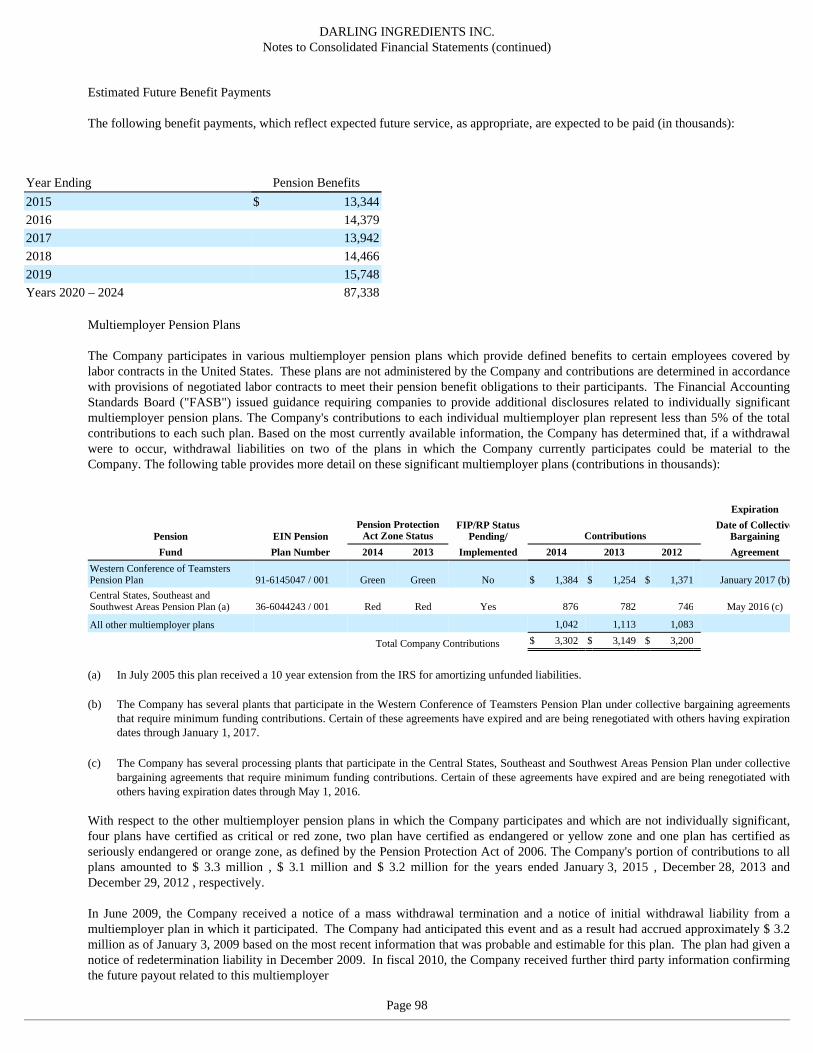
DARLING INGREDIENTS INC. Notes to Consolidated Financial Statements (continued)
Estimated Future Benefit Payments The following benefit payments, which reflect expected future service, as appropriate, are expected to be paid (in thousands):
Multiemployer Pension Plans The Company participates in various multiemployer pension plans which provide defined benefits to certain employees covered by labor contracts in the United States. These plans are not administered by the Company and contributions are determined in accordance with provisions of negotiated labor contracts to meet their pension benefit obligations to their participants. The Financial Accounting Standards Board ("FASB") issued guidance requiring companies to provide additional disclosures related to individually significant multiemployer pension plans. The Company's contributions to each individual multiemployer plan represent less than 5% of the total contributions to each such plan. Based on the most currently available information, the Company has determined that, if a withdrawal were to occur, withdrawal liabilities on two of the plans in which the Company currently participates could be material to the Company. The following table provides more detail on these significant multiemployer plans (contributions in thousands):
With respect to the other multiemployer pension plans in which the Company participates and which are not individually significant, four plans have certified as critical or red zone, two plan have certified as endangered or yellow zone and one plan has certified as seriously endangered or orange zone, as defined by the Pension Protection Act of 2006. The Company's portion of contributions to all plans amounted to $ 3.3 million , $ 3.1 million and $ 3.2 million for the years ended January 3, 2015 , December 28, 2013 and December 29, 2012 , respectively. In June 2009, the Company received a notice of a mass withdrawal termination and a notice of initial withdrawal liability from a multiemployer plan in which it participated. The Company had anticipated this event and as a result had accrued approximately $ 3.2 million as of January 3, 2009 based on the most recent information that was probable and estimable for this plan. The plan had given a notice of redetermination liability in December 2009. In fiscal 2010, the Company received further third party information confirming the future payout related to this multiemployer
Page 98
Year Ending Pension Benefits
2015 $ 13,344 2016 14,379 2017 13,942 2018 14,466 2019 15,748 Years 2020 – 2024 87,338
Expiration
Pension EIN Pension Pension Protection
Act Zone Status FIP/RP Status
Pending/ Contributions Date of Collective
Bargaining
Fund Plan Number 2014 2013 Implemented 2014 2013 2012 Agreement
Western Conference of Teamsters Pension Plan 91-6145047 / 001 Green Green No $ 1,384 $ 1,254 $ 1,371 January 2017 (b)
Central States, Southeast and Southwest Areas Pension Plan (a) 36-6044243 / 001 Red Red Yes 876 782 746 May 2016 (c)
All other multiemployer plans 1,042 1,113 1,083
Total Company Contributions $ 3,302 $ 3,149 $ 3,200
(a) In July 2005 this plan received a 10 year extension from the IRS for amortizing unfunded liabilities.
(b) The Company has several plants that participate in the Western Conference of Teamsters Pension Plan under collective bargaining agreements that require minimum funding contributions. Certain of these agreements have expired and are being renegotiated with others having expiration dates through January 1, 2017.
(c) The Company has several processing plants that participate in the Central States, Southeast and Southwest Areas Pension Plan under collective bargaining agreements that require minimum funding contributions. Certain of these agreements have expired and are being renegotiated with others having expiration dates through May 1, 2016.

DARLING INGREDIENTS INC. Notes to Consolidated Financial Statements (continued)
plan. As a result, the Company reduced its liability to approximately $ 1.2 million . In fiscal 2010, another underfunded multiemployer plan in which the Company participates gave notification of partial withdrawal liability. As of January 3, 2015 , the Company has an accrued liability of approximately $ 0.8 million representing the present value of scheduled withdrawal liability payments under this multiemployer plan. While the Company has no ability to calculate a possible current liability for under-funded multiemployer plans that could terminate or could require additional funding under the Pension Protection Act of 2006, the amounts could be material.
NOTE 16. DERIVATIVES
The Company’s operations are exposed to market risks relating to commodity prices that affect the Company’s cost of raw materials, finished product prices and energy costs and the risk of changes in interest rates and foreign currency exchange rates. The Company makes limited use of derivative instruments to manage cash flow risks related to interest expense, natural gas usage, diesel fuel usage, inventory, forecasted sales and foreign currency exchange rates. The Company does not use derivative instruments for trading purposes. Interest rate swaps are entered into with the intent of managing overall borrowing costs by reducing the potential impact of increases in interest rates on floating-rate long-term debt. Natural gas swaps and options are entered into with the intent of managing the overall cost of natural gas usage by reducing the potential impact of seasonal weather demands on natural gas that increases natural gas prices. Heating oil swaps and options are entered into with the intent of managing the overall cost of diesel fuel usage by reducing the potential impact of seasonal weather demands on diesel fuel that increases diesel fuel prices. Corn options and future contracts are entered into with the intent of managing forecasted sales of BBP by reducing the impact of changing prices. Foreign currency forward contracts are entered into to mitigate the foreign exchange rate risk for transactions designated in a currency other than the local functional currency. At January 3, 2015 , the Company had corn options outstanding that qualified and were designated for hedge accounting as well as heating oil swaps and options, corn options and foreign currency forward contracts that did not qualify and were not designated for hedge accounting.
Entities are required to report all derivative instruments in the statement of financial position at fair value. The accounting for changes in the fair value (i.e., gains or losses) of a derivative instrument depends on whether it has been designated and qualifies as part of a hedging relationship and, if so, on the reason for holding the instrument. If certain conditions are met, entities may elect to designate a derivative instrument as a hedge of exposures to changes in fair value, cash flows or foreign currencies. If the hedged exposure is a cash flow exposure, the effective portion of the gain or loss on the derivative instrument is reported initially as a component of other comprehensive income (outside of earnings) and is subsequently reclassified into earnings when the forecasted transaction affects earnings. Any amounts excluded from the assessment of hedge effectiveness as well as the ineffective portion of the gain or loss are reported in earnings immediately. If the derivative instrument is not designated as a hedge, the gain or loss is recognized in earnings in the period of change. In November 2013, the Company entered into foreign currency exchange forward contracts that did not qualify for hedge accounting to mitigate the foreign exchange rate risk of the expected acquisition price of the VION Acquisition . Under the terms of the exchange contracts, the Company exchanged U.S. dollars for € 1.0 billion at a fixed weighted average price of approximately 1.346 with a maturity date of early January 2014. The foreign currency contract was not designated for hedge accounting. In the fourth quarter of fiscal 2013 the Company recorded an unrealized gain of $ 27.5 million and upon settlement of the exchange contracts recorded a loss in the first quarter of fiscal 2014 of $ 12.6 million . Cash Flow Hedges
In fiscal 2013 and fiscal 2014 , the Company has entered into natural gas swap contracts that are considered cash flow hedges. Under the terms of the natural gas swap contracts the Company fixed the expected purchase cost of a portion of its plants expected natural gas usage in fiscal 2015 . As of January 3, 2015 , all of the fiscal 2013 contracts and fiscal 2014 contracts have expired and settled according to the contracts with activity disclosed below. In fiscal 2013 and fiscal 2014 , the Company entered into corn option contracts that are considered cash flow hedges. Under the terms of the corn option contracts the Company hedged a portion of it's forecasted sales of BBP into the second quarter of fiscal 2015 . As of January 3, 2015 , all fiscal 2013 contracts and some of the fiscal 2014 contracts have settled while the remaining contract positions and activity are disclosed below. From time to time, the Company may enter into corn option contracts in the future.
Page 99

DARLING INGREDIENTS INC. Notes to Consolidated Financial Statements (continued)
As of January 3, 2015 , the Company had the following outstanding forward contract amounts that were entered into to hedge the future payments of intercompany note transactions, foreign currency transactions in currencies other than the functional currency and forecasted transactions in currencies other than the functional currency. All of these transactions are currently not designated for hedge accounting. (in thousands):
The Company estimates the amount that will be reclassified from accumulated other comprehensive gain at January 3, 2015 into earnings over the next 12 months will be approximately $ 0.1 million . As of January 3, 2015 , no amounts have been reclassified into earnings as a result of the discontinuance of cash flow hedges.
The following table presents the fair value of the Company’s derivative instruments as of January 3, 2015 and December 28, 2013 (in thousands):
Page 100
Functional Currency Contract Currency
Type Amount Type Amount
Brazilian real 11,721 Euro 3,650 Brazilian real 18,877 U.S. Dollar 7,400 Euro 289,385 U.S. Dollar 359,631 Euro 8,348 Polish zloty 35,000 Euro 3,429 Japanese yen 488,926 Euro 31,600 Chinese renminbi 242,054 Euro 21,146 Australian dollar 31,350 Euro 1,842 British pound 1,448 Polish zloty 11,544 Euro 2,741
Derivatives Designated Balance Sheet Asset Derivatives Fair Value
as Hedges Location January 3, 2015 December 28, 2013
Natural gas swaps Other current assets $ — $ 120 Corn options Other current assets 247 2,349
Total derivatives designated as hedges $ 247 $ 2,469
Derivatives not Designated as
Hedges
Foreign currency contracts Other current assets $ 11,559 $ 27,516 Corn options and futures Other current assets 69 — Heating oil swaps Other current assets 353 43
Total derivatives not designated as hedges $ 11,981 $ 27,559
Total asset derivatives $ 12,228 $ 30,028
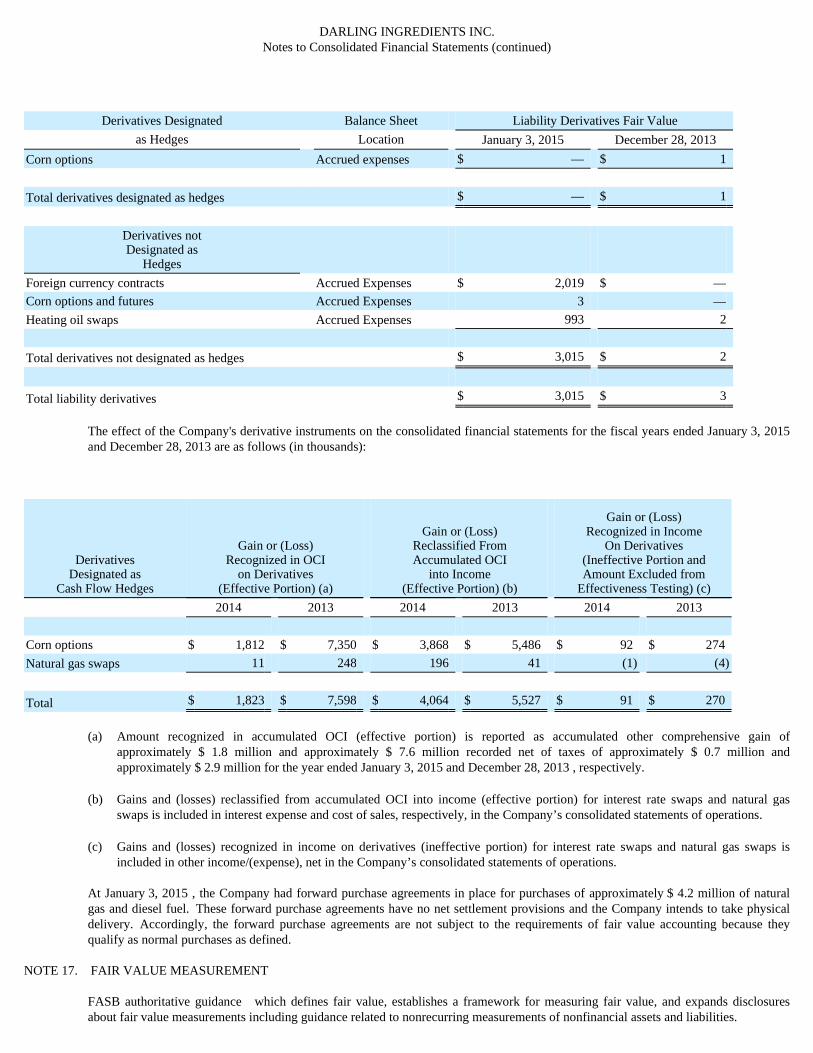
DARLING INGREDIENTS INC. Notes to Consolidated Financial Statements (continued)
The effect of the Company's derivative instruments on the consolidated financial statements for the fiscal years ended January 3, 2015 and December 28, 2013 are as follows (in thousands):
At January 3, 2015 , the Company had forward purchase agreements in place for purchases of approximately $ 4.2 million of natural gas and diesel fuel. These forward purchase agreements have no net settlement provisions and the Company intends to take physical delivery. Accordingly, the forward purchase agreements are not subject to the requirements of fair value accounting because they qualify as normal purchases as defined.
NOTE 17. FAIR VALUE MEASUREMENT
FASB authoritative guidance which defines fair value, establishes a framework for measuring fair value, and expands disclosures about fair value measurements including guidance related to nonrecurring measurements of nonfinancial assets and liabilities.
Derivatives Designated Balance Sheet Liability Derivatives Fair Value
as Hedges Location January 3, 2015 December 28, 2013
Corn options Accrued expenses $ — $ 1
Total derivatives designated as hedges $ — $ 1
Derivatives not Designated as
Hedges Foreign currency contracts Accrued Expenses $ 2,019 $ — Corn options and futures Accrued Expenses 3 — Heating oil swaps Accrued Expenses 993 2
Total derivatives not designated as hedges $ 3,015 $ 2
Total liability derivatives $ 3,015 $ 3
Derivatives Designated as
Cash Flow Hedges
Gain or (Loss) Recognized in OCI
on Derivatives (Effective Portion) (a)
Gain or (Loss)
Reclassified From Accumulated OCI
into Income (Effective Portion) (b)
Gain or (Loss) Recognized in Income
On Derivatives (Ineffective Portion and Amount Excluded from
Effectiveness Testing) (c)
2014 2013 2014 2013 2014 2013
Corn options $ 1,812 $ 7,350 $ 3,868 $ 5,486 $ 92 $ 274 Natural gas swaps 11 248 196 41 (1 ) (4 )
Total $ 1,823 $ 7,598 $ 4,064 $ 5,527 $ 91 $ 270
(a) Amount recognized in accumulated OCI (effective portion) is reported as accumulated other comprehensive gain of approximately $ 1.8 million and approximately $ 7.6 million recorded net of taxes of approximately $ 0.7 million and approximately $ 2.9 million for the year ended January 3, 2015 and December 28, 2013 , respectively.
(b) Gains and (losses) reclassified from accumulated OCI into income (effective portion) for interest rate swaps and natural gas swaps is included in interest expense and cost of sales, respectively, in the Company’s consolidated statements of operations.
(c) Gains and (losses) recognized in income on derivatives (ineffective portion) for interest rate swaps and natural gas swaps is included in other income/(expense), net in the Company’s consolidated statements of operations.

The following table presents the Company's financial instruments that are measured at fair value on a recurring and nonrecurring basis as of January 3, 2015 and are categorized using the fair value hierarchy under FASB authoritative guidance. The fair value hierarchy has three levels based on the reliability of the inputs used to determine the fair value.
Derivative assets consist of the Company's heating oil option contracts, corn option contracts and foreign currency contracts, which represents the difference between the observable market rates of commonly quoted intervals for similar assets and liabilities in active markets and the fixed swap and option rate considering the instruments term, notional amount and credit risk. See Note 16 Derivatives for breakdown by instrument type. Derivative liabilities consist of the Company's heating oil swap contracts and corn option contracts, which represent the difference between the observable market rates of commonly quoted intervals for similar assets and liabilities in active markets and the fixed swap rate considering the instrument’s term, notional amount and credit risk. See Note 16 Derivatives for breakdown by instrument type. The carrying amount of cash and cash equivalents, accounts receivable, accounts payable and accrued expenses approximates fair value due to the short maturity of these instruments and as such have been excluded from the table above. The carrying amount for the Company's other debt is not deemed to be significantly different than the fair value and all other instruments have been recorded at fair value.
The fair value of the senior notes, term loan A, term loan B and revolver debt is based on market quotation from a third-party bank.
NOTE 18. CONCENTRATION OF CREDIT RISK
Concentration of credit risk is limited due to the Company's diversified customer base and the fact that the Company sells commodities. No single customer accounted for more than 10% of the Company’s net sales in fiscal years 2014 , 2013 and 2012 .
NOTE 19. CONTINGENCIES
The Company is a party to several lawsuits, claims and loss contingencies arising in the ordinary course of its business, including assertions by certain regulatory and governmental agencies related to permitting requirements and air, wastewater and storm water discharges from the Company's processing facilities.
The Company’s workers compensation, auto and general liability policies contain significant deductibles or self-insured retentions. The Company estimates and accrues its expected ultimate claim costs related to accidents occurring during each fiscal year and carries this accrual as a reserve until these claims are paid by the Company.
As a result of the matters discussed above, the Company has established loss reserves for insurance, environmental and litigation matters. At January 3, 2015 and December 28, 2013 , the reserves for insurance, environmental and litigation contingencies reflected on the balance sheet in accrued expenses and other non-current liabilities were approximately $ 54.9 million and $ 35.5 million , respectively. The Company has insurance recovery receivables of approximately $ 11.4 million and $ 8.8 million , as of January 3, 2015 and December 28, 2013 , respectively, related to these liabilities. The Company's management believes these reserves for contingencies are reasonable and sufficient based upon present governmental regulations and information currently available to management; however, there can be no assurance that final costs related to these matters will not exceed current estimates. The Company believes that the likelihood is remote that any additional liability from these lawsuits and claims that may not be covered by
Fair Value Measurements at January 3, 2015 Using
Quoted Prices in Active Markets for
Identical Assets
Significant Other Observable
Inputs
Significant Unobservable
Inputs
(In thousands of dollars) Total (Level 1) (Level 2) (Level 3)
Assets
Derivative assets $ 12,228 $ — $ 12,228 $ —
Total Assets 12,228 — 12,228 —
Liabilities
Derivative liabilities 3,015 — 3,015 — Senior Notes 493,750 — 493,750 — Term Loan A 310,600 — 310,600 — Term Loan B 1,198,546 — 1,198,546 — Revolver 100,335 — 100,335 —
Total Liabilities $ 2,106,246 $ — $ 2,106,246 $ —

insurance would have a material effect on the financial position, results of operations or cash flows.
Lower Passaic River Area . In December 2009, the Company, along with numerous other entities, received notice from the United States Environmental Protection Agency ("EPA") that the Company (as successor-in-interest to Standard Tallow Company) is considered a potentially responsible party with respect to alleged contamination in the lower Passaic River area which is part of the Diamond Alkali Superfund Site located in Newark, New Jersey. The Company’s designation as a potentially responsible party is based upon the operation of a former plant site located in Newark, New Jersey by Standard Tallow Company, an entity that the Company acquired in 1996. In the letter, EPA requested that the Company join a group of other parties in funding a remedial investigation and feasibility study at the site. As of the date of this report, the Company has not agreed to participate in the funding group. The Company's ultimate liability for investigatory costs, remedial costs and/or natural resource damages in connection with the lower Passaic River area cannot be determined at this time; however, as of the date of this report, there is nothing that leads the Company to believe that this matter will have a material effect on the Company's financial position, results of operations or cash flows. Fresno Facility Permit Issue. The Company has been named as a defendant and a real party in interest in a lawsuit filed on April 9, 2012 in the Superior Court of the State of California, Fresno County, styled Concerned Citizens of West Fresno vs. Darling International Inc. The complaint, as subsequently amended, alleges that the Company's Fresno facility is operating without a proper use permit and seeks, among other things, injunctive relief. The complaint had at one time also alleged that the Company's Fresno facility constitutes a continuing private and public nuisance, but the plaintiff has since amended the complaint to drop these allegations. The City of Fresno was also named as a defendant in the original complaint but has since had a judgment entered in its favor and is no longer a defendant in the lawsuit; however, in December 2013 the City of Fresno filed a motion to intervene as a plaintiff in this matter. The Superior Court heard the motion on February 4, 2014, and entered an order on February 18, 2014 denying the motion. Rendering operations have been conducted on the site since 1955, and the Company believes that it possesses all of the required federal, state and local permits to continue to operate the facility in the manner currently conducted and that its operations do not constitute a private or public nuisance. Accordingly, the Company intends to defend itself vigorously in this matter. Discovery has begun and this matter was scheduled for trial in July 2014; however, the parties have agreed to stay the litigation while they participate in a mediation process. While management cannot predict the ultimate outcome of this matter, management does not believe the outcome will have a material effect on the Company's financial condition, results of operations or cash flows.
NOTE 20. BUSINESS SEGMENTS
Effective December 29, 2013, the Company's business operations were reorganized into three industry segments: Feed Ingredients, Food Ingredients and Fuel Ingredients, in order to better align its business with the underlying markets and customers that the Company serves. All historical periods have been recast for the changes to the segment reporting structure. The Company sells its products domestically and internationally. The measure of segment profit (loss) includes all revenues, operating expenses (excluding certain amortization of intangibles), and selling, general and administrative expenses incurred at all operating locations and excludes general corporate expenses. Included in corporate activities are general corporate expenses and the amortization of intangibles. Assets of corporate activities include cash, unallocated prepaid expenses, deferred tax assets, prepaid pension, and miscellaneous other assets.
Feed Ingredients Feed Ingredients consists principally of (i) the Company's U.S. ingredients business, including the Company's used cooking oil, trap grease and food residuals collection businesses, the Rothsay ingredients business, and the ingredients and specialty products businesses conducted by Darling Ingredients International under the Sonac name (proteins, fats, technical fats and blood plasma products) and (ii) the Company's bakery residuals business. Feed Ingredients operations process animal by-products and used cooking oil into fats, protein and hides.
Page 101

DARLING INGREDIENTS INC. Notes to Consolidated Financial Statements (continued)
Food Ingredients Food Ingredients consists principally of (i) the gelatin and hydrolyzed collagen business conducted by Darling Ingredients International under the Rousselot name, (ii) the natural casings and meat-by-products business conducted by Darling Ingredients International under the CTH name and (iii) certain specialty products businesses conducted by Darling Ingredients International under the Sonac name.
Fuel Ingredients The Company's Fuel Ingredients segment consists of (i) the Company's biofuel business conducted under the Dar Pro® and Rothsay names (ii) the bioenergy business conducted by Darling Ingredients International under the Ecoson and Rendac names and (iii) the Company's investment in the DGD Joint Venture.
Business Segments (in thousands):
Feed
Ingredients Food Ingredients Fuel Ingredients Corporate Total
Fiscal Year Ended January 3, 2015
Net Sales $ 2,421,462 $ 1,248,352 $ 286,629 $ — $ 3,956,443 Cost of sales and operating expenses 1,864,835 1,029,488 228,848 — 3,123,171
Gross Margin 556,627 218,864 57,781 — 833,272
Selling, general and administrative expense 205,484 118,716 8,596 41,784 374,580 Acquisition costs — — — 24,667 24,667 Depreciation and amortization 158,871 73,274 27,898 9,474 269,517
Segment operating income/(loss) 192,272 26,874 21,287 (75,925 ) 164,508
Equity in net income of unconsolidated subsidiaries 1,842 — 63,767 — 65,609 Segment income 194,114 26,874 85,054 (75,925 ) 230,117
Total other expense (148,665 )
Income before income taxes $ 81,452
Segment assets at January 3, 2015 $ 2,667,369 $ 1,734,387 $ 693,921 $ 75,036 $ 5,170,713

Page 102
Feed
Ingredients Food Ingredients Fuel Ingredients Corporate Total
Fiscal Year Ended December 28, 2013
Net Sales $ 1,788,563 $ — $ 13,705 $ — $ 1,802,268 Cost of sales and operating expenses 1,329,057 — 10,762 — 1,339,819
Gross Margin 459,506 — 2,943 — 462,449
Selling, general and administrative expense 149,160 — 928 20,737 170,825 Acquisition costs — — — 23,271 23,271 Depreciation and amortization 93,120 — 368 5,299 98,787
Segment operating income/(loss) 217,226 — 1,647 (49,307 ) 169,566
Equity in net income of unconsolidated subsidiaries — — 7,660 — 7,660 Segment income 217,226 — 9,307 (49,307 ) 177,226
Total other expense (13,548 )
Income before income taxes $ 163,678
Segment assets at December 28, 2013 $ 1,986,564 $ — $ 179,722 $ 1,077,847 $ 3,244,133

DARLING INGREDIENTS INC. Notes to Consolidated Financial Statements (continued)
Business Segment Property, Plant and Equipment (in thousands):
Geographic Area Net Trade Revenues (in thousands):
Feed
Ingredients Food Ingredients Fuel Ingredients Corporate Total
Fiscal Year Ended December 29, 2012
Net Sales $ 1,766,611 $ — $ 5,941 $ — $ 1,772,552 Cost of sales and operating expenses 1,299,255 — 4,472 — 1,303,727
Gross Margin 467,356 — 1,469 — 468,825
Selling, general and administrative expense 123,483 — 326 27,904 151,713 Acquisition costs — — — — — Depreciation and amortization 81,122 — 122 4,127 85,371
Segment operating income/(loss) 262,751 — 1,021 (32,031 ) 231,741
Equity in net income of unconsolidated subsidiaries — — (2,662 ) — (2,662 )
Segment income 262,751 — (1,641 ) (32,031 ) 229,079
Total other expense (22,294 )
Income before income taxes $ 206,785
January 3,
2015 December 28,
2013 December 29,
2012
Depreciation and amortization:
Feed Ingredients $ 158,871 $ 93,120 $ 81,122 Food Ingredients 73,274 — — Fuel Ingredients 27,898 368 122 Corporate Activities 9,474 5,299 4,127
Total $ 269,517 $ 98,787 $ 85,371
Capital expenditures:
Feed Ingredients $ 135,923 $ 84,616 $ 84,344 Food Ingredients 61,657 — — Fuel Ingredients 21,392 162 66 Corporate Activities 9,946 33,529 31,003
Total (a) $ 228,918 $ 118,307 $ 115,413
(a) Excludes the capital assets acquired as part of the acquisition of assets related to VION Acquisition and Custom Blenders acquisition in fiscal 2014 of approximately $ 984.2 million , the Terra Transaction and the Rothsay Acquisition in fiscal 2013 of approximately $ 167.0 million and the BioPur acquisition in fiscal 2012 of approximately $ 0.6 million .
January 3,
2015 December 28,
2013 December 29,
2012
North America $ 2,131,978 $ 1,802,268 $ 1,772,552 Europe 1,438,320 — — China 229,876 — — South America 73,241 — —

Page 103
Other 83,028 — —
Total $ 3,956,443 $ 1,802,268 $ 1,772,552

DARLING INGREDIENTS INC. Notes to Consolidated Financial Statements (continued)
The Company attributes revenues from external customers to individual foreign countries based on the origin of the Company's shipments. Prior to fiscal 2014 , the Company did not have operations outside of North America. During fiscal 2014 , the Company acquired operations in Europe, China, South America and other countries of the world. Long-lived assets related to the Company's operations in North America, Europe, China, South American and other were as follows (in thousands):
NOTE 21. QUARTERLY FINANCIAL DATA (UNAUDITED AND IN THOUSANDS EXCEPT PER SHARE AMOUNTS):
Page 104
FY 2014
Long-Lived Assets
North America $ 2,422,050 Europe 1,407,402 China 186,994 South America 93,264 Other 7,390
Total $ 4,117,100
Year Ended January 3, 2015
First
Quarter (a), (b) Second
Quarter (a), (b) Third
Quarter (a), (b) Fourth
Quarter (b)
Net sales $ 946,292 $ 1,031,283 $ 978,665 $ 1,000,203 Operating income (564 ) 75,485 49,925 39,662 Income from operations before income taxes (69,296 ) 50,078 27,090 73,580 Net income (51,006 ) 34,575 15,954 68,788 Net (income)/loss attributable to minority
interests (1,797 ) (1,818 ) (1,636 ) 1,155 Net income/(loss) attributable to Darling (52,803 ) 32,757 14,318 69,943 Basic earnings per share (0.32 ) 0.20 0.09 0.42 Diluted earnings per share (0.32 ) 0.20 0.09 0.42
(a) Includes sales deductions reclassified from net sales to cost of sales in the amount of approximately $ 14.9 million in the first quarter of fiscal 2014, approximately $ 24.3 million in the second quarter of fiscal 2014 and approximately $ 22.9 million in the third quarter of fiscal 2014 to conform to the fiscal year ended January 3, 2015 presentation.
(b) Included in net income are $ 15.9 million in acquisition and integration costs in the first quarter of fiscal 2014, $ 4.2 million in acquisition and integration costs in the second quarter of fiscal 2014, $ 2.2 million in acquisition and integration costs in the third quarter of fiscal 2014 and $ 2.4 million in the fourth quarter of fiscal 2014 primarily relating to the VION Acquisition and Rothsay Acquisition. Included in net income in the first quarter of fiscal 2014 is approximately $ 12.6 million of loss on a foreign currency forward contract, approximately $ 27.3 million redemption premium to payoff the 8.5% Senior Notes due 2018 early and approximately $ 44.8 million of costs related to the VION Acquisition inventory step-up in value. In addition, included in net income are approximately $ 5.0 million in the second quarter of fiscal 2014 related to the VION Acquisition inventory step-up in value. Additionally, included in the net income for the fourth quarter of fiscal 2014 were the Company's portion of all tax credits recorded by the DGD Joint Venture and the Company's other processing facilities, which amounted to approximately $67.4 million .

DARLING INGREDIENTS INC. Notes to Consolidated Financial Statements (continued)
NOTE 22. RELATED PARTY TRANSACTIONS
Lease Agreements Darling through its wholly-owned subsidiary Griffin, leases two real properties located in Butler, Kentucky and real properties located in each of Jackson, Mississippi and Henderson, Kentucky from Martom Properties, LLC, an entity owned in part by Martin W. Griffin, the Company's Executive Vice President – Chief Operations Officer, North America. The lease term for each of the Butler properties and the Jackson property is thirty years, and the Company has the right to renew such leases for two additional terms of ten years each. The annual rental payment for each of the Butler properties is $ 30,000 for the first five years of the lease term and is increased by the increase in the consumer price index every five years thereafter. The annual rental payment for the Jackson property is $ 221,715 for the first five years of the lease term and is increased by the increase in the consumer price index every five years thereafter. The lease term for the Henderson property is ten years, and the Company has the right to renew such lease for four additional terms of five years each. The annual rental payment for the Henderson property is $ 60,000 for the first five years of the lease term and is increased by the increase in the consumer price index every five years thereafter. Under the terms of each lease, the Company has a right of first offer and right of first refusal for each of the properties. Raw Material Agreement The Company has entered into a Raw Material Agreement with the DGD Joint Venture pursuant to which the Company will offer to supply certain animal fats and used cooking oil at market prices, up to the DGD Joint Venture's full operational requirement of feedstock, but the DGD Joint Venture is not obligated to purchase the raw material offered by the Company. Additionally, the Company may offer other feedstocks to the DGD Joint Venture, such as inedible corn oil, purchased on a resale basis. For the years ended January 3, 2015 , December 28, 2013 and December 29, 2012, the Company has recorded sales to the DGD Joint Venture of approximately $ 159.8 million , $ 83.8 million and $ 0.3 million , respectively. At January 3, 2015 and December 28, 2013 , the Company has approximately $ 6.1 million and $ 14.6 million in outstanding receivables due from the DGD Joint Venture, respectively. In addition, the Company has eliminated additional sales of approximately $ 5.1 million and $ 3.7 million for the year ended January 3, 2015 and December 28, 2013, respectively to the DGD Joint Venture to defer the Company's portion of profit on those sales relating to inventory assets still remaining on the DGD Joint Venture's balance sheet at January 3, 2015 and December 28, 2013 of approximately $ 1.3 million and $ 0.6 million , respectively.
NOTE 23. NEW ACCOUNTING PRONOUNCEMENTS
In May 2014, the FASB issued Accounting Standards Update ("ASU") No. 2014-09, Revenue from Contracts with Customers (Topic 606), which will supersede nearly all existing revenue recognition guidance under GAAP. The new ASU introduces a new five-step revenue recognition model in which an entity should recognize revenue to depict the transfer of promised goods or services to customers in an amount that reflects the consideration to which the entity expects to be entitled in exchange for those goods or services. In addition, this ASU requires disclosures sufficient to enable the users to understand the nature, amount, timing, and uncertainty of revenue and cash flows arising from contracts with customers, including qualitative and quantitative disclosures about contracts with
Year Ended December 28, 2013
First
Quarter (c) Second
Quarter (c), (d) Third
Quarter (c), (d) Fourth
Quarter (c), (d)
Net sales $ 465,657 $ 443,542 $ 445,130 $ 447,939 Operating income 58,576 50,802 41,652 18,536 Income from operations before income taxes 52,823 42,753 45,024 23,078 Net income 32,405 26,418 27,651 22,493
Basic earnings per share 0.27 0.22 0.23 0.18 Diluted earnings per share 0.27 0.22 0.23 0.18
(c) Includes sales deductions reclassified from net sales to cost of sales in the amount of approximately $ 20.2 million in the first quarter of fiscal 2013, approximately $ 19.9 million in the second quarter of fiscal 2013, approximately $ 19.3 million in the third quarter of fiscal 2013 and $ 19.2 million in the fourth quarter of fiscal 2013 to conform to the fiscal year 2014 presentation.
(d) Included in net income are $ 0.8 million in transaction costs in the second quarter of fiscal 2013, $ 8.3 million in transaction costs in the third quarter of fiscal 2013 and $ 14.2 million in the fourth quarter of fiscal 2013 relating to the Terra Transaction, Rothsay Acquisition and the VION Acquisition. In addition, the fourth quarter of fiscal 2013 includes approximately $ 27.5 million of an unrealized gain on a foreign currency forward contract.

customers, significant judgments and changes in judgments, and assets recognized from the costs to obtain or fulfill a contract. This ASU allows for either full retrospective or modified retrospective adoption and will become effective for the Company for the annual reporting period beginning after December 15, 2016, with early adoption not permitted. The Company is currently evaluating the impact of this standard.
In July 2013, the FASB issued ASU No. 2013-11, Presentation of an Unrecognized Tax Benefit When a Net Operating Loss Carryforward, a Similar Tax Loss, or a Tax Credit Carryforward Exists. The ASU amends ASC Topic 740, Income Taxes The new standard requires, unless certain conditions exist, an unrecognized tax benefit to be presented as a reduction to a deferred tax asset in the financial statements for a net operating loss carryforward, a similar tax loss, or a tax credit carryforward. The standard will become effective for the Company prospectively for annual periods beginning after December 15, 2013, and interim periods within those years, with early adoption permitted. Retrospective application is also permitted. The Company adopted this standard in the first quarter of fiscal 2014. The adoption did not have a material impact on the Company's consolidated financial statements.
NOTE 24. GUARANTOR FINANCIAL INFORMATION
The Company's 5.375% Notes (see Note 10) are guaranteed on an unsecured basis by following Notes Guarantors, each of which is a 100% directly and indirectly owned subsidiary of Darling and which constitute all of Darling's existing restricted subsidiaries that are Credit Agreement Guarantors (other than Darling's foreign subsidiaries): Darling National, Griffin and its subsidiary Craig Protein, Darling AWS LLC, Terra Holding Company, Darling Global Holdings Inc., Darling Northstar LLC, TRS, EV Acquisition, Inc., Rousselot Inc., Rousselot Dubuque Inc., Sonac USA LLC and Rousselot Peabody Inc. The Notes Guarantors fully and unconditionally guaranteed the 5.375% Notes on a joint and several basis. The following financial statements present condensed consolidating financial data for (i) Darling, the "Issuer" of the 5.375% Notes, (ii) the combined Notes Guarantors, (iii) the combined other subsidiaries of the Company that did not guarantee the 5.375% Notes (the "Non-guarantors"), and (iv) eliminations necessary to arrive at the Company's consolidated financial statements, which include condensed consolidated balance sheets as of January 3, 2015 and December 28, 2013 , and the condensed consolidating statements of operations, the condensed consolidating statements of comprehensive income and the condensed consolidating statements of cash flows for the years ended January 3, 2015 , December 28, 2013 and December 29, 2012 .
Page 105

DARLING INGREDIENTS INC. Notes to Consolidated Financial Statements (continued)
Condensed Consolidating Balance Sheet As of January 3, 2015
(in thousands)
Page 106
Issuer Guarantors Non-guarantors Eliminations Consolidated
ASSETS Cash and cash equivalents $ 10,447 $ 14,460 $ 83,877 $ — $ 108,784 Restricted cash 103 — 240 — 343 Accounts receivable 30,237 604,486 320,040 (544,984 ) 409,779 Inventories 19,762 93,253 288,598 — 401,613 Income taxes refundable 18,647 — 3,493 — 22,140 Prepaid expenses 11,513 1,792 31,324 — 44,629 Other current assets 1,894 14 206,338 (186,922 ) 21,324 Deferred income taxes 42,497 — 2,504 — 45,001 Total current assets 135,100 714,005 936,414 (731,906 ) 1,053,613 Investment in subsidiaries 3,874,466 1,096,541 837,605 (5,808,612 ) — Property, plant and equipment, net 205,895 445,301 922,920 — 1,574,116 Intangible assets, net 21,903 366,315 544,195 — 932,413 Goodwill 21,860 549,950 748,609 — 1,320,419 Investment in unconsolidated subsidiaries — — 202,712 — 202,712 Other assets 56,404 575,656 538,460 (1,099,511 ) 71,009 Deferred income taxes — — 16,431 — 16,431 $ 4,315,628 $ 3,747,768 $ 4,747,346 $ (7,640,029 ) $ 5,170,713
LIABILITIES AND STOCKHOLDERS’ EQUITY Current portion of long-term debt $ 16,017 $ 55 $ 225,252 $ (186,923 ) $ 54,401 Accounts payable 540,784 11,349 127,994 (511,609 ) 168,518 Income taxes payable — — 4,363 — 4,363 Accrued expenses 88,840 34,842 165,812 (33,375 ) 256,119 Deferred income taxes — — 642 — 642 Total current liabilities 645,641 46,246 524,063 (731,907 ) 484,043 Long-term debt, net of current portion 1,334,556 — 1,862,994 (1,099,511 ) 2,098,039 Other noncurrent liabilities 56,849 1,979 55,872 — 114,700 Deferred income taxes 176,745 — 246,052 — 422,797 Total liabilities 2,213,791 48,225 2,688,981 (1,831,418 ) 3,119,579 Total stockholders' equity 2,101,837 3,699,543 2,058,365 (5,808,611 ) 2,051,134
$ 4,315,628 $ 3,747,768 $ 4,747,346 $ (7,640,029 ) $ 5,170,713

DARLING INGREDIENTS INC. Notes to Consolidated Financial Statements (continued)
Condensed Consolidating Balance Sheet As of December 28, 2013
(in thousands)
Page 107
Issuer Guarantors Non-guarantors Eliminations Consolidated
ASSETS Cash and cash equivalents $ 857,267 $ 6,117 $ 7,473 $ — $ 870,857 Restricted cash 102 — 252 — 354 Accounts receivable 41,464 484,091 16,092 (428,803 ) 112,844 Inventories 20,799 36,314 8,020 — 65,133 Income taxes refundable 14,397 — 115 — 14,512 Prepaid expenses 9,347 3,794 1,082 — 14,223 Other current assets 31,248 15 1,027 — 32,290 Deferred income taxes 15,107 — 2,182 — 17,289 Total current assets 989,731 530,331 36,243 (428,803 ) 1,127,502 Investment in subsidiaries 2,140,869 63,116 — (2,203,985 ) — Property, plant and equipment, net 172,533 356,772 137,268 — 666,573 Intangible assets, net 15,896 340,611 232,157 — 588,664 Goodwill 21,860 424,244 255,533 — 701,637 Investment in unconsolidated subsidiary — — 115,114 — 115,114 Other assets 40,588 373,699 1,352 (370,996 ) 44,643 $ 3,381,477 $ 2,088,773 $ 777,667 $ (3,003,784 ) $ 3,244,133
LIABILITIES AND STOCKHOLDERS’ EQUITY Current portion of long-term debt $ 10,000 $ 87 $ 9,801 $ — $ 19,888 Accounts payable 425,117 21,236 22,939 (425,550 ) 43,742 Accrued expenses 85,165 20,178 11,084 (3,253 ) 113,174 Total current liabilities 520,282 41,501 43,824 (428,803 ) 176,804 Long-term debt, net of current portion 680,000 55 557,888 (370,996 ) 866,947 Other noncurrent liabilities 36,381 — 4,290 — 40,671 Deferred income taxes 123,862 — 14,897 — 138,759 Total liabilities 1,360,525 41,556 620,899 (799,799 ) 1,223,181 Total stockholders' equity 2,020,952 2,047,217 156,768 (2,203,985 ) 2,020,952
$ 3,381,477 $ 2,088,773 $ 777,667 $ (3,003,784 ) $ 3,244,133

DARLING INGREDIENTS INC. Notes to Consolidated Financial Statements (continued)
Condensed Consolidating Statements of Operations For the year ended January 3, 2015
(in thousands)
Condensed Consolidating Statements of Operations For the year ended December 28, 2013
(in thousands)
Page 108
Issuer Guarantors Non-guarantors Eliminations Consolidated
Net sales $ 557,316 $ 1,620,054 $ 2,063,310 $ (284,237 ) $ 3,956,443 Cost and expenses:
Cost of sales and operating expenses 421,883 1,330,038 1,655,487 (284,237 ) 3,123,171 Selling, general and administrative expenses 145,258 54,070 175,252 — 374,580 Depreciation and amortization 31,183 83,957 154,377 — 269,517 Acquisition and integration costs 20,410 — 4,257 — 24,667
Total costs and expenses 618,734 1,468,065 1,989,373 (284,237 ) 3,791,935 Operating income (61,418 ) 151,989 73,937 — 164,508
Interest expense (97,912 ) 21,231 (58,554 ) (181 ) (135,416 )
Foreign currency gains/(losses) (12,244 ) (417 ) (887 ) — (13,548 )
Other income/(expense), net (3,717 ) (19 ) 3,854 181 299 Equity in net income of unconsolidated subsidiary — — 65,609 — 65,609 Earnings in investments in subsidiaries 223,790 — — (223,790 ) — Income/(loss) from operations before taxes 48,499 172,784 83,959 (223,790 ) 81,452 Income taxes (benefit) (15,716 ) 17,534 11,323 — 13,141 Net (income)/loss attributable to noncontrolling interests — — (4,096 ) — (4,096 )
Net income/(loss) $ 64,215 $ 155,250 $ 68,540 $ (223,790 ) $ 64,215
Issuer Guarantors Non-guarantors Eliminations Consolidated
Net sales $ 708,166 $ 1,288,824 $ 41,196 $ (235,918 ) $ 1,802,268 Cost and expenses:
Cost of sales and operating expenses 559,117 988,295 28,325 (235,918 ) 1,339,819 Selling, general and administrative expenses 91,723 76,016 3,086 — 170,825 Depreciation and amortization 24,794 68,139 5,854 — 98,787 Acquisition costs 14,074 — 9,197 — 23,271
Total costs and expenses 689,708 1,132,450 46,462 (235,918 ) 1,632,702 Operating income 18,458 156,374 (5,266 ) — 169,566
Interest expense (36,964 ) 3,281 (4,425 ) — (38,108 )
Foreign currency gains/(losses) 27,516 (42 ) 633 — 28,107 Other income/(expense), net (3,373 ) 55 (229 ) — (3,547 )
Equity in net loss of unconsolidated subsidiary — — 7,660 — 7,660 Earnings in investments in subsidiaries 105,178 — — (105,178 ) — Income/(loss) from operations before taxes 110,815 159,668 (1,627 ) (105,178 ) 163,678 Income taxes (benefit) 1,848 52,351 512 — 54,711
Net income/(loss) $ 108,967 $ 107,317 $ (2,139 ) $ (105,178 ) $ 108,967
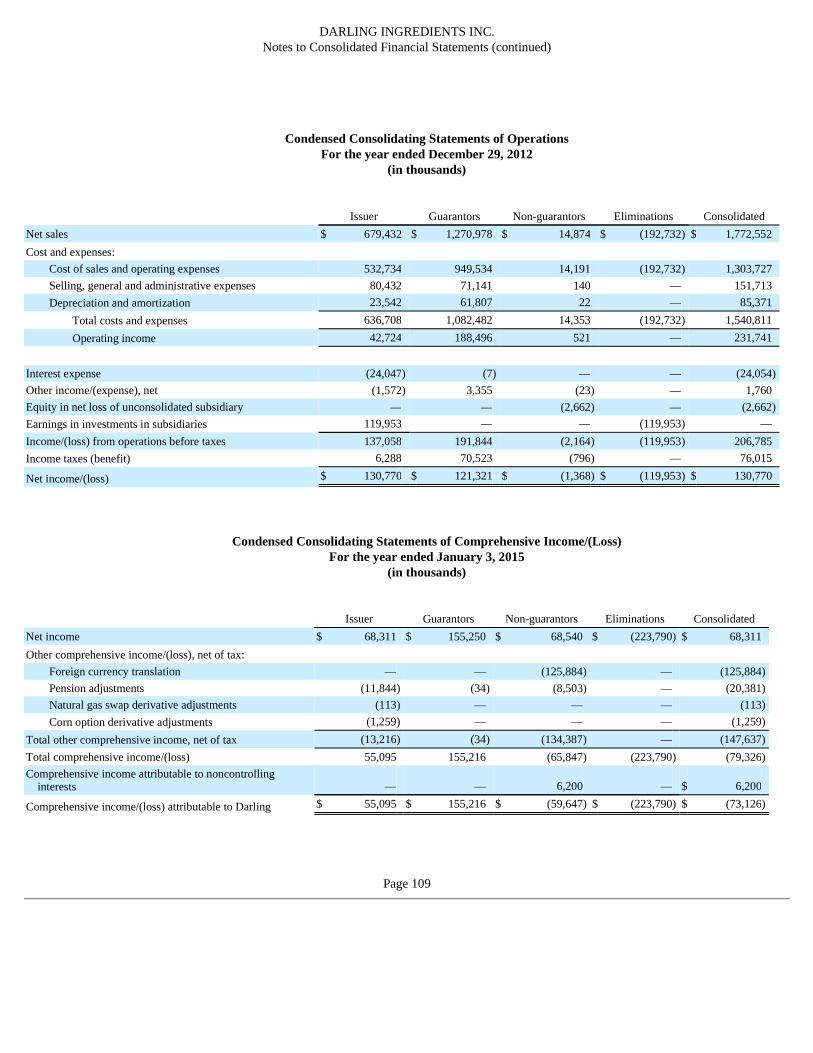
DARLING INGREDIENTS INC. Notes to Consolidated Financial Statements (continued)
Condensed Consolidating Statements of Operations For the year ended December 29, 2012
(in thousands)
Condensed Consolidating Statements of Comprehensive Income/(Loss) For the year ended January 3, 2015
(in thousands)
Page 109
Issuer Guarantors Non-guarantors Eliminations Consolidated
Net sales $ 679,432 $ 1,270,978 $ 14,874 $ (192,732 ) $ 1,772,552 Cost and expenses:
Cost of sales and operating expenses 532,734 949,534 14,191 (192,732 ) 1,303,727 Selling, general and administrative expenses 80,432 71,141 140 — 151,713 Depreciation and amortization 23,542 61,807 22 — 85,371
Total costs and expenses 636,708 1,082,482 14,353 (192,732 ) 1,540,811 Operating income 42,724 188,496 521 — 231,741
Interest expense (24,047 ) (7 ) — — (24,054 )
Other income/(expense), net (1,572 ) 3,355 (23 ) — 1,760 Equity in net loss of unconsolidated subsidiary — — (2,662 ) — (2,662 )
Earnings in investments in subsidiaries 119,953 — — (119,953 ) — Income/(loss) from operations before taxes 137,058 191,844 (2,164 ) (119,953 ) 206,785 Income taxes (benefit) 6,288 70,523 (796 ) — 76,015
Net income/(loss) $ 130,770 $ 121,321 $ (1,368 ) $ (119,953 ) $ 130,770
Issuer Guarantors Non-guarantors Eliminations Consolidated
Net income $ 68,311 $ 155,250 $ 68,540 $ (223,790 ) $ 68,311 Other comprehensive income/(loss), net of tax:
Foreign currency translation — — (125,884 ) — (125,884 )
Pension adjustments (11,844 ) (34 ) (8,503 ) — (20,381 )
Natural gas swap derivative adjustments (113 ) — — — (113 )
Corn option derivative adjustments (1,259 ) — — — (1,259 )
Total other comprehensive income, net of tax (13,216 ) (34 ) (134,387 ) — (147,637 )
Total comprehensive income/(loss) 55,095 155,216 (65,847 ) (223,790 ) (79,326 )
Comprehensive income attributable to noncontrolling interests — — 6,200 — $ 6,200
Comprehensive income/(loss) attributable to Darling $ 55,095 $ 155,216 $ (59,647 ) $ (223,790 ) $ (73,126 )

DARLING INGREDIENTS INC. Notes to Consolidated Financial Statements (continued)
Condensed Consolidating Statements of Comprehensive Income/(Loss)
For the year ended December 28, 2013 (in thousands)
Condensed Consolidating Statements of Comprehensive Income/(Loss) For the year ended December 29, 2012
(in thousands)
Page 110
Issuer Guarantors Non-guarantors Eliminations Consolidated
Net income $ 108,967 $ 107,317 $ (2,139 ) $ (105,178 ) $ 108,967 Other comprehensive income (loss), net of tax:
Foreign currency translation — — (14,502 ) — (14,502 )
Pension adjustments 15,060 — 80 — 15,140 Natural gas swap derivative adjustments 127 — — — 127 Corn option derivative adjustments 1,141 — — — 1,141
Total other comprehensive income, net of tax 16,328 — (14,422 ) — 1,906
Total comprehensive income (loss) $ 125,295 $ 107,317 $ (16,561 ) $ (105,178 ) $ 110,873
Issuer Guarantors Non-guarantors Eliminations Consolidated
Net income $ 130,770 $ 121,321 $ (1,368 ) $ (119,953 ) $ 130,770 Other comprehensive income (loss), net of tax:
Pension adjustments (1,169 ) — — — (1,169 )
Natural gas swap derivative adjustments 391 — — — 391 Corn option derivative adjustments 194 — — — 194 Interest rate swap derivative adjustments 159 — — — 159
Total other comprehensive income, net of tax (425 ) — — — (425 )
Total comprehensive income (loss) $ 130,345 $ 121,321 $ (1,368 ) $ (119,953 ) $ 130,345
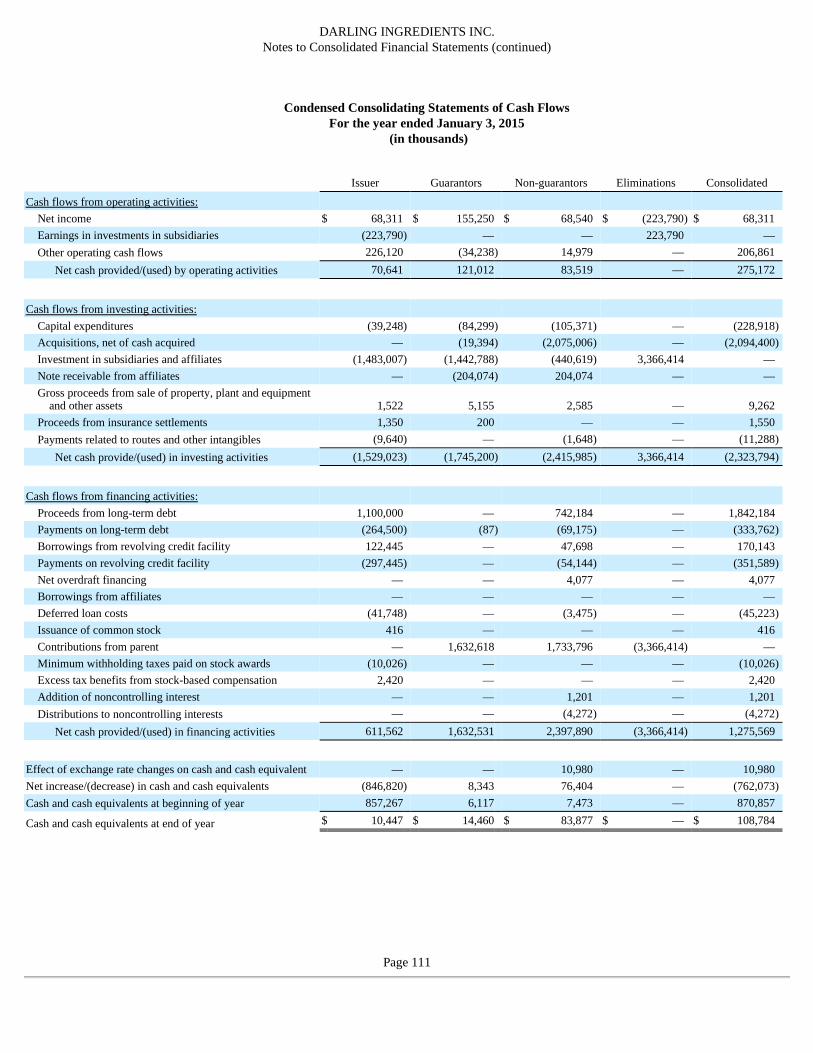
DARLING INGREDIENTS INC. Notes to Consolidated Financial Statements (continued)
Condensed Consolidating Statements of Cash Flows
For the year ended January 3, 2015 (in thousands)
Page 111
Issuer Guarantors Non-guarantors Eliminations Consolidated
Cash flows from operating activities: Net income $ 68,311 $ 155,250 $ 68,540 $ (223,790 ) $ 68,311 Earnings in investments in subsidiaries (223,790 ) — — 223,790 — Other operating cash flows 226,120 (34,238 ) 14,979 — 206,861
Net cash provided/(used) by operating activities 70,641 121,012 83,519 — 275,172
Cash flows from investing activities: Capital expenditures (39,248 ) (84,299 ) (105,371 ) — (228,918 )
Acquisitions, net of cash acquired — (19,394 ) (2,075,006 ) — (2,094,400 )
Investment in subsidiaries and affiliates (1,483,007 ) (1,442,788 ) (440,619 ) 3,366,414 — Note receivable from affiliates — (204,074 ) 204,074 — — Gross proceeds from sale of property, plant and equipment
and other assets 1,522 5,155 2,585 — 9,262 Proceeds from insurance settlements 1,350 200 — — 1,550 Payments related to routes and other intangibles (9,640 ) — (1,648 ) — (11,288 )
Net cash provide/(used) in investing activities (1,529,023 ) (1,745,200 ) (2,415,985 ) 3,366,414 (2,323,794 )
Cash flows from financing activities: Proceeds from long-term debt 1,100,000 — 742,184 — 1,842,184 Payments on long-term debt (264,500 ) (87 ) (69,175 ) — (333,762 )
Borrowings from revolving credit facility 122,445 — 47,698 — 170,143 Payments on revolving credit facility (297,445 ) — (54,144 ) — (351,589 )
Net overdraft financing — — 4,077 — 4,077 Borrowings from affiliates — — — — — Deferred loan costs (41,748 ) — (3,475 ) — (45,223 )
Issuance of common stock 416 — — — 416 Contributions from parent — 1,632,618 1,733,796 (3,366,414 ) — Minimum withholding taxes paid on stock awards (10,026 ) — — — (10,026 )
Excess tax benefits from stock-based compensation 2,420 — — — 2,420 Addition of noncontrolling interest — — 1,201 — 1,201 Distributions to noncontrolling interests — — (4,272 ) — (4,272 )
Net cash provided/(used) in financing activities 611,562 1,632,531 2,397,890 (3,366,414 ) 1,275,569
Effect of exchange rate changes on cash and cash equivalent — — 10,980 — 10,980 Net increase/(decrease) in cash and cash equivalents (846,820 ) 8,343 76,404 — (762,073 )
Cash and cash equivalents at beginning of year 857,267 6,117 7,473 — 870,857
Cash and cash equivalents at end of year $ 10,447 $ 14,460 $ 83,877 $ — $ 108,784

DARLING INGREDIENTS INC. Notes to Consolidated Financial Statements (continued)
Condensed Consolidating Statements of Cash Flows
For the year ended December 28, 2013 (in thousands)
Page 112
Issuer Guarantors Non-guarantors Eliminations Consolidated
Cash flows from operating activities: Net income/(loss) $ 108,967 $ 107,317 $ (2,139 ) $ (105,178 ) $ 108,967 Earnings in investments in subsidiaries (105,178 ) — — 105,178 — Other operating cash flows 135,315 (39,459 ) 5,898 — 101,754
Net cash provided by operating activities 139,104 67,858 3,759 — 210,721
Cash flows from investing activities: Capital expenditures (45,173 ) (68,716 ) (4,418 ) — (118,307 )
Acquisitions, net of cash acquired — (121,440 ) (612,635 ) — (734,075 )
Investment in subsidiaries and affiliates (600,537 ) (63,115 ) (44,959 ) 663,652 (44,959 )
Note receivable from affiliates — (370,996 ) — 370,996 — Gross proceeds from sale of property, plant and equipment
and other assets 1,329 1,029 — — 2,358 Proceeds from insurance settlements 1,531 450 — — 1,981 Payments related to routes and other intangibles (2,423 ) — — — (2,423 )
Net cash provided/(used) in investing activities (645,273 ) (622,788 ) (662,012 ) 1,034,648 (895,425 )
Cash flows from financing activities: Proceeds from long-term debt 200,000 — 144,704 — 344,704 Payments on long-term debt — (82 ) (498 ) — (580 )
Borrowings from revolving credit facility 245,000 — 48,235 — 293,235 Payments on revolving credit facility (5,000 ) — — — (5,000 )
Borrowings from affiliates — — 370,996 (370,996 ) — Deferred loan costs (11,916 ) — (1,404 ) — (13,320 )
Issuances of common stock 840,558 — — — 840,558 Contributions from parent — 555,552 108,100 (663,652 ) — Minimum withholding taxes paid on stock awards (3,289 ) — — — (3,289 )
Excess tax benefits from stock-based compensation 1,138 — — — 1,138 Net cash provided/(used) in financing activities 1,266,491 555,470 670,133 (1,034,648 ) 1,457,446
Effect of exchange rate changes on cash and cash equivalents — — (5,134 ) — (5,134 )
Net increase/(decrease) in cash and cash equivalents 760,322 540 6,746 — 767,608 Cash and cash equivalents at beginning of year 96,945 5,577 727 — 103,249
Cash and cash equivalents at end of year $ 857,267 $ 6,117 $ 7,473 $ — $ 870,857

DARLING INGREDIENTS INC. Notes to Consolidated Financial Statements (continued)
Condensed Consolidating Statements of Cash Flows
For the year ended December 29, 2012 (in thousands)
PART II ITEM 9. CHANGES IN AND DISAGREEMENTS WITH ACCOUNTA NTS ON ACCOUNTING AND FINANCIAL DISCLOSURE
None. ITEM 9A. CONTROLS AND PROCEDURES Evaluation of Disclosure Controls and Procedures .
As required by Rule 13a-15(b) under the Securities Exchange Act of 1934, as amended (the "Exchange Act"), the Company’s management, including the Chief Executive Officer and Chief Financial Officer, conducted an evaluation, as of the end of the period covered by this report, of the effectiveness of the design and operation of the Company’s disclosure controls and procedures. As defined in Rules 13a-15(e) and 15d-15(e) under the Exchange Act, disclosure controls and procedures are controls and other procedures of the Company that are designed to ensure that information required to be disclosed by the Company in the reports it files or submits under the Exchange Act is recorded, processed, summarized and reported, within the time periods specified in the SEC’s rules and forms. Disclosure controls and procedures include, without limitation, controls and procedures designed to ensure that information required to be disclosed by the Company in the reports it files or submits under the Exchange Act is accumulated and communicated to the Company’s management, including the Chief Executive Officer and Chief Financial Officer, as appropriate to allow timely decisions regarding required disclosure.
Based on management’s evaluation, the Chief Executive Officer and Chief Financial Officer concluded that the Company’s disclosure
Issuer Guarantors Non-guarantors Eliminations Consolidated
Cash flows from operating activities: Net income/(loss) $ 130,770 $ 121,321 $ (1,368 ) $ (119,953 ) $ 130,770 Earnings in investments in subsidiaries (119,953 ) — — 119,953 — Other operating cash flows 175,098 (56,445 ) 114 — 118,767
Net cash provided/(used) by operating activities 185,915 64,876 (1,254 ) — 249,537
Cash flows from investing activities: Capital expenditures (49,619 ) (65,794 ) — — (115,413 )
Acquisitions, net of cash acquired (3,000 ) — — — (3,000 )
Investment in subsidiaries and affiliates (43,449 ) — (43,424 ) 43,449 (43,424 )
Gross proceeds from sale of property, plant and equipment and other assets 2,083 1,787 — — 3,870
Proceeds from insurance settlements 1,305 2,967 — — 4,272 Payments related to routes and other intangibles (137 ) — — — (137 )
Net cash provided/(used) in investing activities (92,817 ) (61,040 ) (43,424 ) 43,449 (153,832 )
Cash flows from financing activities: Payments on long-term debt (30,000 ) (32 ) — — (30,032 )
Issuances of common stock 72 — — — 72 Contributions from parent — — 43,449 (43,449 ) — Minimum withholding taxes paid on stock awards (4,084 ) — — — (4,084 )
Excess tax benefits from stock-based compensation 2,652 — — — 2,652 Net cash provided/(used) in financing activities (31,360 ) (32 ) 43,449 (43,449 ) (31,392 )
Net increase/(decrease) in cash and cash equivalents 61,738 3,804 (1,229 ) — 64,313 Cash and cash equivalents at beginning of year 35,207 1,773 1,956 — 38,936
Cash and cash equivalents at end of year $ 96,945 $ 5,577 $ 727 $ — $ 103,249
controls and procedures were effective as of the end of the period covered by this report. Internal Control over Financial Reporting .
(a) Management’s Annual Report on Internal Control over Financial Reporting. Management of the Company is responsible for establishing and maintaining adequate internal control over financial reporting as defined in Rules 13a-15(f) and 15d-15(f) promulgated under the Exchange Act. Those rules define internal control over financial reporting as a process designed to provide reasonable assurance regarding the reliability of financial reporting and the preparation of financial statements for external purposes in accordance with generally accepted accounting principles and includes those policies and procedures that:
Because of its inherent limitations, internal control over financial reporting may not prevent or detect misstatements. Projections of any
evaluation of effectiveness to future periods are subject to the risk that controls may become inadequate because of changes in conditions, or that the degree of compliance with the policies or procedures may deteriorate.
The Company’s management assessed the effectiveness of the Company's internal control over financial reporting as of January 3, 2015 . In making this assessment, the Company's management used the criteria established in Internal Control-Integrated Framework issued by the Committee of Sponsoring Organizations of the Treadway Commission (COSO) (2013).
Based on their assessment, management has concluded that the Company’s internal control over financial reporting was effective at the reasonable assurance level as of January 3, 2015 .
In January 2014, the Company acquired Darling Ingredients International in the VION Acquisition. The Company is currently in the
process of integrating Darling Ingredients International pursuant to the Sarbanes-Oxley Act of 2002. The Company is evaluating changes to processes, information technology systems and other components of internal controls over financial reporting as part of its ongoing integration activities, and as a result, controls will be periodically changed. The Company believes, however, it will be able to maintain sufficient controls over the substantive results of its financial reporting throughout this integration process. Because of the size and complexity and the timing of the VION Acquisition, the internal controls over financial reporting of Darling Ingredients International will be excluded from management’s assessment of the Company’s internal control over financial reporting as of January 3, 2015, as permitted under SEC regulations.
KPMG LLP, the registered public accounting firm that audited the Company's financial statements, has issued an audit report on
management’s assessment of the Company’s internal control over financial reporting, which report is included herein.
(b) Attestation Report of the Registered Public Accounting Firm. The attestation report called for by Item 308(b) of Regulation S-K is incorporated herein by reference to Report of Independent Registered Public Accounting Firm on Internal Control Over Financial Reporting, included in Part II, Item 8. "Financial Statements and Supplementary Data" of this report.
(c) Changes in Internal Control over Financial Reporting . As required by Exchange Act Rule 13a-15(d), the Company's management, including the Chief Executive Officer and Chief Financial Officer, also conducted an evaluation of the Company's internal control over financial reporting to determine whether any change occurred during the last fiscal quarter of the period covered by this report that has materially affected, or is reasonably likely to materially affect, the Company’s internal control over financial reporting. Based on that evaluation there has been no change in the Company’s internal control over financial reporting during the last fiscal quarter of the period covered by this report. During the first three quarters of fiscal 2014, the Company has implemented new enterprise resource planning system and financial reporting tools that has materially affected, or is reasonably likely to materially affect, the Company's internal control over financial reporting and as a result related controls were modified as necessary. ITEM 9B. OTHER INFORMATION
None.
PART III ITEM 10. DIRECTORS, EXECUTIVE OFFICERS AND CORPORA TE GOVERNANCE
The information required by this Item with respect to Items 401, 405 and 407 of Regulation S-K will appear in the sections entitled
• Pertain to the maintenance of records that, in reasonable detail, accurately and fairly reflect the transactions and dispositions of the assets of the Company;
• Provide reasonable assurance that transactions are recorded as necessary to permit preparation of financial statements in accordance with generally accepted accounting principles, and that receipts and expenditures of the Company are being made only in accordance with authorizations of management and directors of the Company; and
• Provide reasonable assurance regarding prevention or timely detection of unauthorized acquisition, use or disposition of the Company’s assets that could have a material effect on the financial statements.

"Election of Directors," "Our Management - Executive Officers and Directors," "Section 16(a) Beneficial Ownership Reporting Compliance" and "Corporate Governance-Committees of the Board - Audit Committee" included in the Company’s definitive Proxy Statement relating to the 2015 annual meeting of stockholders, which information is incorporated herein by reference.
The Company has adopted the Darling International Inc. Code of Business Conduct ("Code of Business Conduct"), which is applicable to all of the Company’s employees, including its senior financial officers, the Chief Executive Officer, Chief Financial Officer, Controller, Treasurer and General Counsel. The Company has not granted any waivers to the Code of Business Conduct to date. A copy of the Company’s Code of Business Conduct has been posted on the “Investor” portion of our web site, at www.darlingii.com . Shareholders may request a free copy of our Code of Business Conduct from:
Brad Phillips Darling Ingredients Inc. 251 O’Connor Ridge Blvd, Suite 300 Irving, Texas 75038 Phone: 972-717-0300 Fax: 972-717-1588 Email: [email protected]
ITEM 11. EXECUTIVE COMPENSATION
The information required by this Item will appear in the sections entitled "Executive Compensation," "Compensation Committee Report" and "Corporate Governance - Compensation Committee Interlocks and Insider Participation" included in the Company’s definitive Proxy Statement relating to the 2015 annual meeting of stockholders, which information is incorporated herein by reference. ITEM 12. SECURITY OWNERSHIP OF CERTAIN BENEFICIAL OWNERS AND MANAGEMENT AND RELATED
STOCKHOLDER MATTERS
The information required by this Item with respect to Item 201(d) of Regulation S-K appears in Item 5 of this report. The information required by this Item with respect to Item 403 of Regulation S-K will appear in the section entitled "Security Ownership
of Certain Beneficial Owners and Management" included in the Company’s definitive Proxy Statement relating to the 2015 annual meeting of stockholders, which information is incorporated herein by reference. ITEM 13. CERTAIN RELATIONSHIPS AND RELATED TRANSA CTIONS, AND DIRECTOR INDEPENDENCE
The information required by this Item will appear in the sections entitled "Transactions with Related Persons, Promoters and Certain Control Persons," "Corporate Governance – Code of Business Conduct" and "Corporate Governance - Independent Directors" included in the Company's definitive Proxy Statement relating to the 2015 annual meeting of stockholders, which information is incorporated herein by reference. ITEM 14. PRINCIPAL ACCOUNTING FEES AND SERVICES
The information required by this Item will appear in the section entitled "Ratification of Selection of Independent Registered Public Accountant" included in the Company’s definitive Proxy Statement relating to the 2015 annual meeting of stockholders, which information is incorporated herein by reference.
PART IV
ITEM 15. EXHIBITS, FINANCIAL STATEMENT SCHEDULES
(a) Documents filed as part of this report:
(1) The following consolidated financial statements are included in Item 8.
Page
Report of Independent Registered Public Accounting Firm on Consolidated Financial Statements 63
Report of Independent Registered Public Accounting Firm on Internal Control Over Financial Reporting 64
Consolidated Balance Sheets -
All other schedules are omitted since the required information is not present or is not present in amounts sufficient to require submission of the schedule, or because the information required is included in the consolidated financial statements and notes thereto.
Page 113
January 3, 2015 and December 28, 2013 66
Consolidated Statements of Operations -
Three years ended January 3, 2015 67
Consolidated Statements of Comprehensive Income -
Three years ended January 3, 2015 68
Consolidated Statements of Stockholders’ Equity -
Three years ended January 3, 2015 69
Consolidated Statements of Cash Flows -
Three years ended January 3, 2015 70
Notes to Consolidated Financial Statements 71

(3) Exhibits
Exhibit No.
2.1 Agreement and Plan of Merger, dated as of November 9, 2010, by and among Darling International Inc., DG Acquisition Corp., Griffin Industries, Inc. and Robert A. Griffin, in his capacity as the Shareholders’ Representative (filed as Exhibit 2.1 to the Company’s Current Report on Form 8-K filed November 9, 2010 and incorporated herein by reference).
2.2 Acquisition Agreement, dated as of August 23, 2013, by and between Darling International Inc. and Maple Leaf Foods Inc. (the schedules and certain exhibits have been omitted pursuant to Item 601(b)(2) of Regulation S-K and will be furnished to the SEC upon request) (filed as Exhibit 2.1 to the Company’s Current Report on Form 8-K filed August 26, 2013 and incorporated herein by reference).
2.3 Sale and Purchase Agreement, dated as of October 5, 2013, by and between Darling International Inc. and VION Holding N.V. (certain immaterial schedules and exhibits have been omitted pursuant to Item 601(b)(2) of Regulation S-K and will be furnished to the Securities and Exchange Commission upon request) (filed as Exhibit 2.1 to the Company’s Current Report on Form 8-K filed October 10, 2013 and incorporated herein by reference).
3.1 Restated Certificate of Incorporation of the Company, as amended (filed as Exhibit 3.1 to the Company’s
Registration Statement on Form S-1 filed May 23, 2002 and incorporated herein by reference).
3.2 Certificate of Amendment of Restated Certificate of Incorporation of the Company (filed as Exhibit 3.2 to
the Company's Annual Report on Form 10-K filed March 2, 2011 and incorporated herein by reference).
3.3 Certificate of Amendment of Restated Certificate of Incorporation of the Company (filed as Exhibit 3.1 to
the Company's Current Report on Form 8-K filed November 27, 2013 and incorporated herein by reference).
3.4 Certificate of Amendment of Restated Certificate of Incorporation of the Company (filed as Exhibit 3.1 to
the Company's Current Report on Form 8-K filed May 7, 2014 and incorporated herein by reference).
3.5 Amended and Restated Bylaws of the Company (filed as Exhibit 3.2 to the Company’s Current Report on
Form 8-K filed May 7, 2014 and incorporated herein by reference).
4.1 Specimen Common Stock Certificate (filed as Exhibit 4.1 to the Company’s Registration Statement on Form
S-1 filed May 27, 1994 and incorporated herein by reference).
4.2 Certificate of Designation, Preferences and Rights of Series A Preferred Stock (filed as Exhibit 4.2 to the
Company’s Registration Statement on Form S-1 filed May 23, 2002 and incorporated herein by reference).
4.3 Senior Notes Indenture, dated as of January 2, 2014, by and among Darling Escrow Corporation, the subsidiary guarantors party thereto from time to time and U.S. Bank National Association, as trustee (filed as Exhibit 4.1 to the Company’s Current Report on Form 8-K filed January 10, 2014 and incorporated herein by reference).
4.4 Supplemental Indenture, dated as of January 8, 2014, by and among Darling Escrow Corporation, Darling International Inc., Craig Protein Division, Inc., Darling AWS LLC, Darling National LLC, Darling Northstar LLC, Darling Global Holdings Inc., EV Acquisition, Inc., Griffin Industries LLC, Terra Holding Company and Terra Renewal Services Inc. and U.S. Bank National Association, as trustee (filed as Exhibit 4.2 to the Company’s Current Report on Form 8-K filed January 10, 2014 and incorporated herein by reference).
4.5 Supplemental Indenture, dated as of April 4, 2014, by and among Darling International Inc., Craig Protein Division, Inc., Darling AWS LLC, Darling National LLC, Darling Northstar LLC, Darling Global Holdings Inc., EV Acquisition, Inc., Griffin Industries LLC, Terra Holding Company, Terra Renewal Services Inc., Rousselot Dubuque Inc., Rousselot Inc., Rousselot Peabody Inc., Sonac USA LLC and U.S. Bank National Association, as trustee (filed as Exhibit 4.5 to the Company’s Registration Statement on Form S-4 filed July 15, 2014 and incorporated herein by reference).
10.1 * Form of Indemnification Agreement (filed as Exhibit 10.7 to the Company’s Registration Statement on Form
S-1 filed on May 27, 1994, and incorporated herein by reference).

Page 114
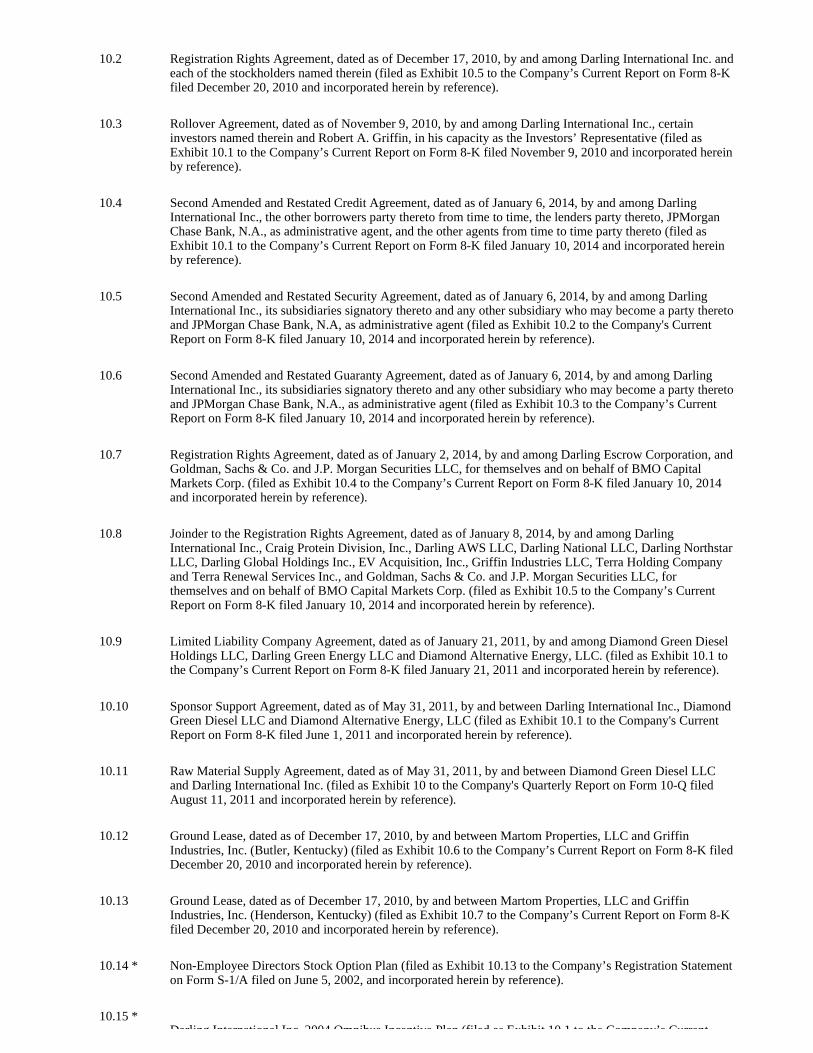
10.2 Registration Rights Agreement, dated as of December 17, 2010, by and among Darling International Inc. and each of the stockholders named therein (filed as Exhibit 10.5 to the Company’s Current Report on Form 8-K filed December 20, 2010 and incorporated herein by reference).
10.3 Rollover Agreement, dated as of November 9, 2010, by and among Darling International Inc., certain investors named therein and Robert A. Griffin, in his capacity as the Investors’ Representative (filed as Exhibit 10.1 to the Company’s Current Report on Form 8-K filed November 9, 2010 and incorporated herein by reference).
10.4 Second Amended and Restated Credit Agreement, dated as of January 6, 2014, by and among Darling International Inc., the other borrowers party thereto from time to time, the lenders party thereto, JPMorgan Chase Bank, N.A., as administrative agent, and the other agents from time to time party thereto (filed as Exhibit 10.1 to the Company’s Current Report on Form 8-K filed January 10, 2014 and incorporated herein by reference).
10.5 Second Amended and Restated Security Agreement, dated as of January 6, 2014, by and among Darling International Inc., its subsidiaries signatory thereto and any other subsidiary who may become a party thereto and JPMorgan Chase Bank, N.A, as administrative agent (filed as Exhibit 10.2 to the Company's Current Report on Form 8-K filed January 10, 2014 and incorporated herein by reference).
10.6 Second Amended and Restated Guaranty Agreement, dated as of January 6, 2014, by and among Darling International Inc., its subsidiaries signatory thereto and any other subsidiary who may become a party thereto and JPMorgan Chase Bank, N.A., as administrative agent (filed as Exhibit 10.3 to the Company’s Current Report on Form 8-K filed January 10, 2014 and incorporated herein by reference).
10.7 Registration Rights Agreement, dated as of January 2, 2014, by and among Darling Escrow Corporation, and Goldman, Sachs & Co. and J.P. Morgan Securities LLC, for themselves and on behalf of BMO Capital Markets Corp. (filed as Exhibit 10.4 to the Company’s Current Report on Form 8-K filed January 10, 2014 and incorporated herein by reference).
10.8 Joinder to the Registration Rights Agreement, dated as of January 8, 2014, by and among Darling International Inc., Craig Protein Division, Inc., Darling AWS LLC, Darling National LLC, Darling Northstar LLC, Darling Global Holdings Inc., EV Acquisition, Inc., Griffin Industries LLC, Terra Holding Company and Terra Renewal Services Inc., and Goldman, Sachs & Co. and J.P. Morgan Securities LLC, for themselves and on behalf of BMO Capital Markets Corp. (filed as Exhibit 10.5 to the Company’s Current Report on Form 8-K filed January 10, 2014 and incorporated herein by reference).
10.9 Limited Liability Company Agreement, dated as of January 21, 2011, by and among Diamond Green Diesel Holdings LLC, Darling Green Energy LLC and Diamond Alternative Energy, LLC. (filed as Exhibit 10.1 to the Company’s Current Report on Form 8-K filed January 21, 2011 and incorporated herein by reference).
10.10 Sponsor Support Agreement, dated as of May 31, 2011, by and between Darling International Inc., Diamond Green Diesel LLC and Diamond Alternative Energy, LLC (filed as Exhibit 10.1 to the Company's Current Report on Form 8-K filed June 1, 2011 and incorporated herein by reference).
10.11 Raw Material Supply Agreement, dated as of May 31, 2011, by and between Diamond Green Diesel LLC and Darling International Inc. (filed as Exhibit 10 to the Company's Quarterly Report on Form 10-Q filed August 11, 2011 and incorporated herein by reference).
10.12 Ground Lease, dated as of December 17, 2010, by and between Martom Properties, LLC and Griffin Industries, Inc. (Butler, Kentucky) (filed as Exhibit 10.6 to the Company’s Current Report on Form 8-K filed December 20, 2010 and incorporated herein by reference).
10.13 Ground Lease, dated as of December 17, 2010, by and between Martom Properties, LLC and Griffin Industries, Inc. (Henderson, Kentucky) (filed as Exhibit 10.7 to the Company’s Current Report on Form 8-K filed December 20, 2010 and incorporated herein by reference).
10.14 * Non-Employee Directors Stock Option Plan (filed as Exhibit 10.13 to the Company’s Registration Statement
on Form S-1/A filed on June 5, 2002, and incorporated herein by reference).
10.15 * Darling International Inc. 2004 Omnibus Incentive Plan (filed as Exhibit 10.1 to the Company’s Current

Page 115
Report on Form 8-K filed May 11, 2005 (Securities and Exchange Commission File No. 001-13323), and incorporated herein by reference).

10.16 * Amendment to Darling International Inc. 2004 Omnibus Incentive Plan (filed as Exhibit 10.1 to the Company’s Current Report on Form 8-K filed January 22, 2007 (Securities and Exchange Commission File No. 001-13323) and incorporated herein by reference).
10.17 * Darling International Inc. 2012 Omnibus Incentive Plan (filed as Exhibit 99 to the Company’s Registration
Statement on Form S-8 filed May 31, 2012 and incorporated herein by reference).
10.18 * 2010 Special Incentive Program (filed as Exhibit 10.1 to the Company’s Current Report on Form 8-K filed
November 17, 2010 and incorporated herein by reference).
10.19 * Form of Performance Unit Award Agreement under the Darling International Inc. 2012 Omnibus Incentive Plan (filed as Exhibit 10.1 to the Company’s Current Report on Form 8-K filed January 6, 2014 and incorporated herein by reference).
10.20 * Non-Employee Director Restricted Stock Award Plan (filed as Exhibit 10.2 to the Company’s Current Report on Form 8-K filed March 15, 2006 (Securities and Exchange Commission File No. 001-13323) and incorporated herein by reference).
10.21 * Amendment No. 1 to Non-Employee Director Restricted Stock Award Plan, effective as of January 15, 2009 (filed as Exhibit 10.4 to the Company’s Current Report on Form 8-K filed January 21, 2009 (Securities and Exchange Commission File No. 001-13323) and incorporated herein by reference).
10.22 * Amended and Restated Non-Employee Director Restricted Stock Award Plan, (filed as Exhibit 10.1 to the
Company’s Current Report on Form 8-K filed February 28, 2011 and incorporated herein by reference).
10.23 * Form of Notice of Grant of Restricted Stock Unit Award (Non-Employee Directors) under the Darling Ingredients Inc. 2012 Omnibus Incentive Plan (filed as Exhibit 10.1 to the Company’s Quarterly Report on Form 10-Q filed August 7, 2014 and incorporated herein by reference).
10.24 * Notice of Amendment to Grants and Awards, dated as of October 10, 2006 (filed as Exhibit 10.1 to the Company’s Current Report on Form 8-K filed October 10, 2006 (Securities and Exchange Commission File No. 001-13323) and incorporated herein by reference).
10.25 * Amended and Restated Employment Agreement, dated as of January 1, 2009, between Darling International Inc. and Randall C. Stuewe (filed as Exhibit 10.1 to the Company’s Current Report on Form 8-K filed January 21, 2009 (Securities and Exchange Commission File No. 001-13323), and incorporated herein by reference).
10.26 * Employment Agreement, dated as of February 12, 2014, between Darling International Netherlands BV and Dirk Kloosterboer (filed as Exhibit 10.1 to the Company’s Quarterly Report on Form 10-Q filed May 8, 2014 and incorporated herein by reference).
10.27 * Form of Senior Executive Termination Benefits Agreement (filed as Exhibit 10.1 to the Company’s Current Report on Form 8-K filed November 29, 2007 (Securities and Exchange Commission File No. 001-13323) and incorporated herein by reference).
10.28 * Form of Addendum to Senior Executive Termination Benefits Agreement (filed as Exhibit 10.2 to the Company’s Current Report on Form 8-K filed December 12, 2008 (Securities and Exchange Commission File No. 001-13323) and incorporated herein by reference).
10.29 * Form of Addendum to Senior Executive Termination Benefits Agreement (filed as Exhibit 10.4 to the
Company’s Current Report on Form 8-K filed December 13, 2010 and incorporated herein by reference).
10.30 * Senior Executive Termination Benefits Agreement, dated as of September 1, 2012, between Darling International Inc. and Colin Stevenson (filed as Exhibit 10.1 to the Company’s Current Report on Form 8-K filed July 6, 2012 and incorporated herein by reference).
10.31 * Amendment One to the Senior Executive Termination Benefits Agreement dated as of April 23, 2013 by and between Darling International Inc. and Colin Stevenson (filed as Exhibit 10.1 to the Company’s Current Report on Form 8-K filed April 23, 2013 and incorporated herein by reference).

Page 116
10.32 * Form of Senior Executive Termination Benefits Agreement between Darling Ingredients Inc. and John O. Muse (filed as Exhibit 10.1 to the Company’s Current Report on Form 8-K filed December 9, 2014 and incorporated herein by reference).

SIGNATURES
Pursuant to the requirements of Section 13 or 15(d) of the Securities Act of 1934, the Registrant has duly caused this report to be signed on
its behalf by the undersigned, thereunto duly authorized.
10.33 * Transitional Services Agreement dated December 27, 2013 by and between Darling International Inc. and John O. Muse (filed as Exhibit 10.1 to the Company’s Current Report on Form 8-K filed December 30, 2013 and incorporated herein by reference).
10.34 * Form of Indemnification Agreement between Darling International Inc. and its directors and executive officers (filed as Exhibit 10.1 to the Company’s Current Report on Form 8-K filed February 25, 2008 (Securities and Exchange Commission File No. 001-13323), and incorporated herein by reference).
10.35 Underwriting Agreement, dated December 12, 2013, between Darling International Inc. and Goldman, Sachs & Co., as representative of the several underwriters named in Schedule I thereto (filed as Exhibit 1.1 to the Company’s Current Report on Form 8-K filed December 13, 2013 and incorporated herein by reference).
14 Darling International Inc. Code of Business Conduct applicable to all employees, including senior executive officers (filed as Exhibit 14 to the Company’s Current Report on Form 8-K filed February 25, 2008 (Securities and Exchange Commission File No. 001-13323), and incorporated herein by reference).
18.1 Preferability letter regarding changes in accounting principle (filed herewith).
21 Subsidiaries of the Registrant (filed herewith).
23.1 Consent of KPMG LLP (filed herewith).
23.2 Consent of KPMG LLP (filed herewith).
31.1 Certification pursuant to Rule 13a-14(a) or Rule 15d-14(a) of the Securities Exchange Act of 1934, of
Randall C. Stuewe, the Chief Executive Officer of the Company (filed herewith).
31.2 Certification pursuant to Rule 13a-14(a) or Rule 15d-14(a) of the Securities Exchange Act of 1934, of John
O. Muse, the Chief Financial Officer of the Company (filed herewith).
32 Written Statement of Chief Executive Officer and Chief Financial Officer furnished pursuant to Section 906
of the Sarbanes-Oxley Act of 2002 (18 U.S.C. Section 1350) (filed herewith).
99.1 Consolidated Financial Statements of Diamond Green Diesel Holdings LLC and Subsidiary for the year
ended December 31, 2014 (filed herewith).
101 Interactive Data Files Pursuant to Rule 405 of Regulation S-T: (i) Consolidated Balance Sheets as of January 3, 2015 and December 28, 2013; (ii) Consolidated Statements of Operations for the years ended January 3, 2015, December 28, 2013 and December 29, 2012; (iii) Consolidated Statements of Comprehensive Income for the years ended January 3, 2015, December 28, 2013 and December 29, 2012; (iv) Consolidated Statements of Stockholders’ Equity for the years ended January 3, 2015, December 28, 2013 and December 29, 2012; (v) Consolidated Statements of Cash Flows for the years ended January 3, 2015, December 28, 2013 and December 29, 2012; (vi) Notes to the Consolidated Financial Statements.
The Exhibits are available upon request from the Company.
* Management contract or compensatory plan or arrangement.
DARLING INGREDIENTS INC.
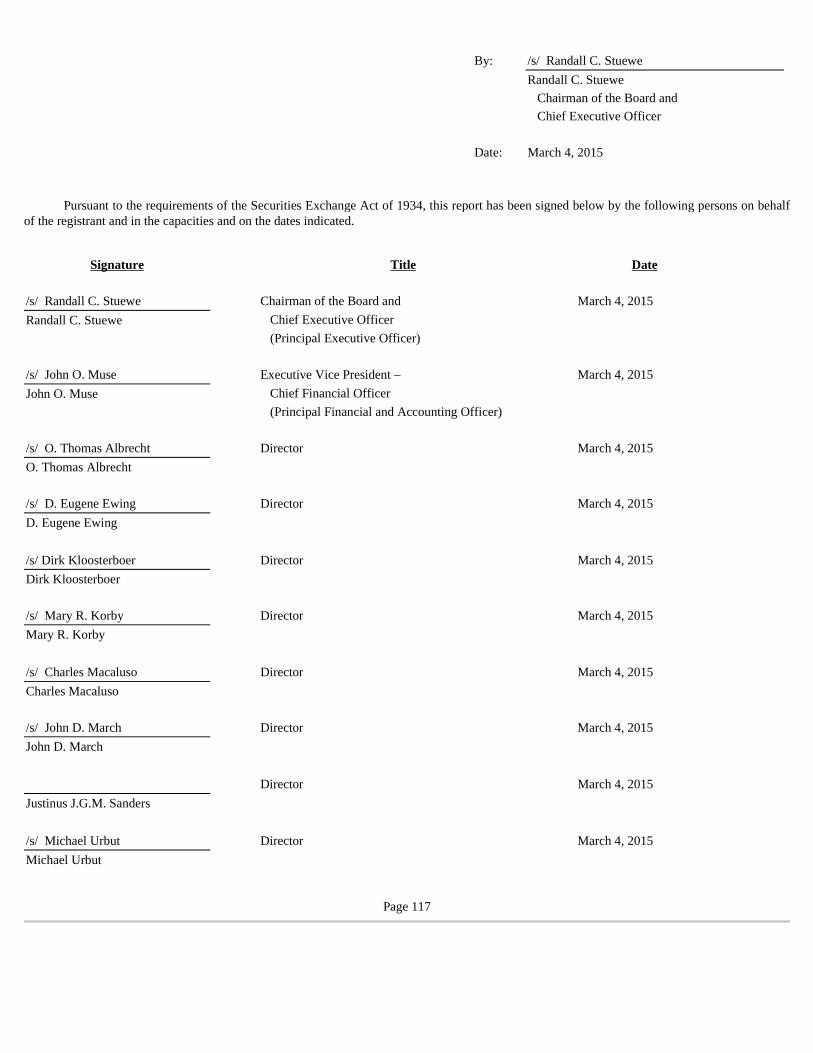
Pursuant to the requirements of the Securities Exchange Act of 1934, this report has been signed below by the following persons on behalf
of the registrant and in the capacities and on the dates indicated.
Page 117
By: /s/ Randall C. Stuewe
Randall C. Stuewe
Chairman of the Board and
Chief Executive Officer
Date: March 4, 2015
Signature Title Date
/s/ Randall C. Stuewe Chairman of the Board and March 4, 2015
Randall C. Stuewe Chief Executive Officer
(Principal Executive Officer)
/s/ John O. Muse Executive Vice President – March 4, 2015
John O. Muse Chief Financial Officer
(Principal Financial and Accounting Officer)
/s/ O. Thomas Albrecht Director March 4, 2015
O. Thomas Albrecht
/s/ D. Eugene Ewing Director March 4, 2015
D. Eugene Ewing
/s/ Dirk Kloosterboer Director March 4, 2015
Dirk Kloosterboer
/s/ Mary R. Korby Director March 4, 2015
Mary R. Korby
/s/ Charles Macaluso Director March 4, 2015
Charles Macaluso
/s/ John D. March Director March 4, 2015
John D. March
Director March 4, 2015
Justinus J.G.M. Sanders
/s/ Michael Urbut Director March 4, 2015
Michael Urbut

INDEX TO EXHIBITS
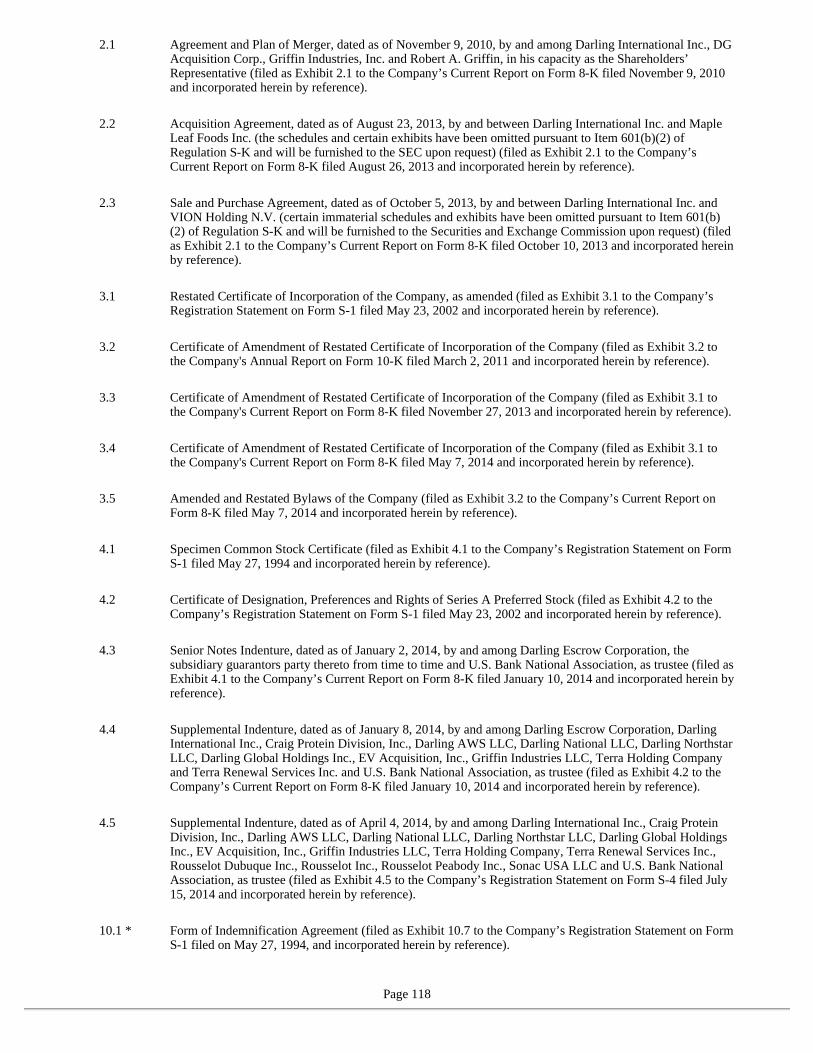
Page 118
2.1 Agreement and Plan of Merger, dated as of November 9, 2010, by and among Darling International Inc., DG Acquisition Corp., Griffin Industries, Inc. and Robert A. Griffin, in his capacity as the Shareholders’ Representative (filed as Exhibit 2.1 to the Company’s Current Report on Form 8-K filed November 9, 2010 and incorporated herein by reference).
2.2 Acquisition Agreement, dated as of August 23, 2013, by and between Darling International Inc. and Maple Leaf Foods Inc. (the schedules and certain exhibits have been omitted pursuant to Item 601(b)(2) of Regulation S-K and will be furnished to the SEC upon request) (filed as Exhibit 2.1 to the Company’s Current Report on Form 8-K filed August 26, 2013 and incorporated herein by reference).
2.3 Sale and Purchase Agreement, dated as of October 5, 2013, by and between Darling International Inc. and VION Holding N.V. (certain immaterial schedules and exhibits have been omitted pursuant to Item 601(b)(2) of Regulation S-K and will be furnished to the Securities and Exchange Commission upon request) (filed as Exhibit 2.1 to the Company’s Current Report on Form 8-K filed October 10, 2013 and incorporated herein by reference).
3.1 Restated Certificate of Incorporation of the Company, as amended (filed as Exhibit 3.1 to the Company’s
Registration Statement on Form S-1 filed May 23, 2002 and incorporated herein by reference).
3.2 Certificate of Amendment of Restated Certificate of Incorporation of the Company (filed as Exhibit 3.2 to
the Company's Annual Report on Form 10-K filed March 2, 2011 and incorporated herein by reference).
3.3 Certificate of Amendment of Restated Certificate of Incorporation of the Company (filed as Exhibit 3.1 to
the Company's Current Report on Form 8-K filed November 27, 2013 and incorporated herein by reference).
3.4 Certificate of Amendment of Restated Certificate of Incorporation of the Company (filed as Exhibit 3.1 to
the Company's Current Report on Form 8-K filed May 7, 2014 and incorporated herein by reference).
3.5 Amended and Restated Bylaws of the Company (filed as Exhibit 3.2 to the Company’s Current Report on
Form 8-K filed May 7, 2014 and incorporated herein by reference).
4.1 Specimen Common Stock Certificate (filed as Exhibit 4.1 to the Company’s Registration Statement on Form
S-1 filed May 27, 1994 and incorporated herein by reference).
4.2 Certificate of Designation, Preferences and Rights of Series A Preferred Stock (filed as Exhibit 4.2 to the
Company’s Registration Statement on Form S-1 filed May 23, 2002 and incorporated herein by reference).
4.3 Senior Notes Indenture, dated as of January 2, 2014, by and among Darling Escrow Corporation, the subsidiary guarantors party thereto from time to time and U.S. Bank National Association, as trustee (filed as Exhibit 4.1 to the Company’s Current Report on Form 8-K filed January 10, 2014 and incorporated herein by reference).
4.4 Supplemental Indenture, dated as of January 8, 2014, by and among Darling Escrow Corporation, Darling International Inc., Craig Protein Division, Inc., Darling AWS LLC, Darling National LLC, Darling Northstar LLC, Darling Global Holdings Inc., EV Acquisition, Inc., Griffin Industries LLC, Terra Holding Company and Terra Renewal Services Inc. and U.S. Bank National Association, as trustee (filed as Exhibit 4.2 to the Company’s Current Report on Form 8-K filed January 10, 2014 and incorporated herein by reference).
4.5 Supplemental Indenture, dated as of April 4, 2014, by and among Darling International Inc., Craig Protein Division, Inc., Darling AWS LLC, Darling National LLC, Darling Northstar LLC, Darling Global Holdings Inc., EV Acquisition, Inc., Griffin Industries LLC, Terra Holding Company, Terra Renewal Services Inc., Rousselot Dubuque Inc., Rousselot Inc., Rousselot Peabody Inc., Sonac USA LLC and U.S. Bank National Association, as trustee (filed as Exhibit 4.5 to the Company’s Registration Statement on Form S-4 filed July 15, 2014 and incorporated herein by reference).
10.1 * Form of Indemnification Agreement (filed as Exhibit 10.7 to the Company’s Registration Statement on Form
S-1 filed on May 27, 1994, and incorporated herein by reference).

10.2 Registration Rights Agreement, dated as of December 17, 2010, by and among Darling International Inc. and each of the stockholders named therein (filed as Exhibit 10.5 to the Company’s Current Report on Form 8-K filed December 20, 2010 and incorporated herein by reference).
10.3 Rollover Agreement, dated as of November 9, 2010, by and among Darling International Inc., certain investors named therein and Robert A. Griffin, in his capacity as the Investors’ Representative (filed as Exhibit 10.1 to the Company’s Current Report on Form 8-K filed November 9, 2010 and incorporated herein by reference).
10.4 Second Amended and Restated Credit Agreement, dated as of January 6, 2014, by and among Darling International Inc., the other borrowers party thereto from time to time, the lenders party thereto, JPMorgan Chase Bank, N.A., as administrative agent, and the other agents from time to time party thereto (filed as Exhibit 10.1 to the Company’s Current Report on Form 8-K filed January 10, 2014 and incorporated herein by reference).
10.5 Second Amended and Restated Security Agreement, dated as of January 6, 2014, by and among Darling International Inc., its subsidiaries signatory thereto and any other subsidiary who may become a party thereto and JPMorgan Chase Bank, N.A, as administrative agent (filed as Exhibit 10.2 to the Company's Current Report on Form 8-K filed January 10, 2014 and incorporated herein by reference).
10.6 Second Amended and Restated Guaranty Agreement, dated as of January 6, 2014, by and among Darling International Inc., its subsidiaries signatory thereto and any other subsidiary who may become a party thereto and JPMorgan Chase Bank, N.A., as administrative agent (filed as Exhibit 10.3 to the Company’s Current Report on Form 8-K filed January 10, 2014 and incorporated herein by reference).
10.7 Registration Rights Agreement, dated as of January 2, 2014, by and among Darling Escrow Corporation, and Goldman, Sachs & Co. and J.P. Morgan Securities LLC, for themselves and on behalf of BMO Capital Markets Corp. (filed as Exhibit 10.4 to the Company’s Current Report on Form 8-K filed January 10, 2014 and incorporated herein by reference).
10.8 Joinder to the Registration Rights Agreement, dated as of January 8, 2014, by and among Darling International Inc., Craig Protein Division, Inc., Darling AWS LLC, Darling National LLC, Darling Northstar LLC, Darling Global Holdings Inc., EV Acquisition, Inc., Griffin Industries LLC, Terra Holding Company and Terra Renewal Services Inc., and Goldman, Sachs & Co. and J.P. Morgan Securities LLC, for themselves and on behalf of BMO Capital Markets Corp. (filed as Exhibit 10.5 to the Company’s Current Report on Form 8-K filed January 10, 2014 and incorporated herein by reference).
10.9 Limited Liability Company Agreement, dated as of January 21, 2011, by and among Diamond Green Diesel Holdings LLC, Darling Green Energy LLC and Diamond Alternative Energy, LLC. (filed as Exhibit 10.1 to the Company’s Current Report on Form 8-K filed January 21, 2011 and incorporated herein by reference).
10.10 Sponsor Support Agreement, dated as of May 31, 2011, by and between Darling International Inc., Diamond Green Diesel LLC and Diamond Alternative Energy, LLC (filed as Exhibit 10.1 to the Company's Current Report on Form 8-K filed June 1, 2011 and incorporated herein by reference).
10.11 Raw Material Supply Agreement, dated as of May 31, 2011, by and between Diamond Green Diesel LLC and Darling International Inc. (filed as Exhibit 10 to the Company's Quarterly Report on Form 10-Q filed August 11, 2011 and incorporated herein by reference).
10.12 Ground Lease, dated as of December 17, 2010, by and between Martom Properties, LLC and Griffin Industries, Inc. (Butler, Kentucky) (filed as Exhibit 10.6 to the Company’s Current Report on Form 8-K filed December 20, 2010 and incorporated herein by reference).
10.13 Ground Lease, dated as of December 17, 2010, by and between Martom Properties, LLC and Griffin Industries, Inc. (Henderson, Kentucky) (filed as Exhibit 10.7 to the Company’s Current Report on Form 8-K filed December 20, 2010 and incorporated herein by reference).
10.14 * Non-Employee Directors Stock Option Plan (filed as Exhibit 10.13 to the Company’s Registration Statement
on Form S-1/A filed on June 5, 2002, and incorporated herein by reference).
10.15 * Darling International Inc. 2004 Omnibus Incentive Plan (filed as Exhibit 10.1 to the Company’s Current

Page 119
Report on Form 8-K filed May 11, 2005 (Securities and Exchange Commission File No. 001-13323), and incorporated herein by reference).

10.16 * Amendment to Darling International Inc. 2004 Omnibus Incentive Plan (filed as Exhibit 10.1 to the Company’s Current Report on Form 8-K filed January 22, 2007 (Securities and Exchange Commission File No. 001-13323) and incorporated herein by reference).
10.17 * Darling International Inc. 2012 Omnibus Incentive Plan (filed as Exhibit 99 to the Company’s Registration
Statement on Form S-8 filed May 31, 2012 and incorporated herein by reference).
10.18 * 2010 Special Incentive Program (filed as Exhibit 10.1 to the Company’s Current Report on Form 8-K filed
November 17, 2010 and incorporated herein by reference).
10.19 * Form of Performance Unit Award Agreement under the Darling International Inc. 2012 Omnibus Incentive Plan (filed as Exhibit 10.1 to the Company’s Current Report on Form 8-K filed January 6, 2014 and incorporated herein by reference).
10.20 * Non-Employee Director Restricted Stock Award Plan (filed as Exhibit 10.2 to the Company’s Current Report on Form 8-K filed March 15, 2006 (Securities and Exchange Commission File No. 001-13323) and incorporated herein by reference).
10.21 * Amendment No. 1 to Non-Employee Director Restricted Stock Award Plan, effective as of January 15, 2009 (filed as Exhibit 10.4 to the Company’s Current Report on Form 8-K filed January 21, 2009 (Securities and Exchange Commission File No. 001-13323) and incorporated herein by reference).
10.22 * Amended and Restated Non-Employee Director Restricted Stock Award Plan, (filed as Exhibit 10.1 to the
Company’s Current Report on Form 8-K filed February 28, 2011 and incorporated herein by reference).
10.23 * Form of Notice of Grant of Restricted Stock Unit Award (Non-Employee Directors) under the Darling Ingredients Inc. 2012 Omnibus Incentive Plan (filed as Exhibit 10.1 to the Company’s Quarterly Report on Form 10-Q filed August 7, 2014 and incorporated herein by reference).
10.24 * Notice of Amendment to Grants and Awards, dated as of October 10, 2006 (filed as Exhibit 10.1 to the Company’s Current Report on Form 8-K filed October 10, 2006 (Securities and Exchange Commission File No. 001-13323) and incorporated herein by reference).
10.25 * Amended and Restated Employment Agreement, dated as of January 1, 2009, between Darling International Inc. and Randall C. Stuewe (filed as Exhibit 10.1 to the Company’s Current Report on Form 8-K filed January 21, 2009 (Securities and Exchange Commission File No. 001-13323), and incorporated herein by reference).
10.26 * Employment Agreement, dated as of February 12, 2014, between Darling International Netherlands BV and Dirk Kloosterboer (filed as Exhibit 10.1 to the Company’s Quarterly Report on Form 10-Q filed May 8, 2014 and incorporated herein by reference).
10.27 * Form of Senior Executive Termination Benefits Agreement (filed as Exhibit 10.1 to the Company’s Current Report on Form 8-K filed November 29, 2007 (Securities and Exchange Commission File No. 001-13323) and incorporated herein by reference).
10.28 * Form of Addendum to Senior Executive Termination Benefits Agreement (filed as Exhibit 10.2 to the Company’s Current Report on Form 8-K filed December 12, 2008 (Securities and Exchange Commission File No. 001-13323) and incorporated herein by reference).
10.29 * Form of Addendum to Senior Executive Termination Benefits Agreement (filed as Exhibit 10.4 to the
Company’s Current Report on Form 8-K filed December 13, 2010 and incorporated herein by reference).
10.30 * Senior Executive Termination Benefits Agreement, dated as of September 1, 2012, between Darling International Inc. and Colin Stevenson (filed as Exhibit 10.1 to the Company’s Current Report on Form 8-K filed July 6, 2012 and incorporated herein by reference).
10.31 * Amendment One to the Senior Executive Termination Benefits Agreement dated as of April 23, 2013 by and between Darling International Inc. and Colin Stevenson (filed as Exhibit 10.1 to the Company’s Current Report on Form 8-K filed April 23, 2013 and incorporated herein by reference).

Page 120
10.32 * Form of Senior Executive Termination Benefits Agreement between Darling Ingredients Inc. and John O. Muse (filed as Exhibit 10.1 to the Company’s Current Report on Form 8-K filed December 9, 2014 and incorporated herein by reference).

Page 121
10.33 * Transitional Services Agreement dated December 27, 2013 by and between Darling International Inc. and John O. Muse (filed as Exhibit 10.1 to the Company’s Current Report on Form 8-K filed December 30, 2013 and incorporated herein by reference).
10.34 * Form of Indemnification Agreement between Darling International Inc. and its directors and executive officers (filed as Exhibit 10.1 to the Company’s Current Report on Form 8-K filed February 25, 2008 (Securities and Exchange Commission File No. 001-13323), and incorporated herein by reference).
10.35 Underwriting Agreement, dated December 12, 2013, between Darling International Inc. and Goldman, Sachs & Co., as representative of the several underwriters named in Schedule I thereto (filed as Exhibit 1.1 to the Company’s Current Report on Form 8-K filed December 13, 2013 and incorporated herein by reference).
14 Darling International Inc. Code of Business Conduct applicable to all employees, including senior executive officers (filed as Exhibit 14 to the Company’s Current Report on Form 8-K filed February 25, 2008 (Securities and Exchange Commission File No. 001-13323), and incorporated herein by reference).
18.1 Preferability letter regarding changes in accounting principle (filed herewith).
21 Subsidiaries of the Registrant (filed herewith).
23.1 Consent of KPMG LLP (filed herewith).
23.2 Consent of KPMG LLP (filed herewith).
31.1 Certification pursuant to Rule 13a-14(a) or Rule 15d-14(a) of the Securities Exchange Act of 1934, of
Randall C. Stuewe, the Chief Executive Officer of the Company (filed herewith).
31.2 Certification pursuant to Rule 13a-14(a) or Rule 15d-14(a) of the Securities Exchange Act of 1934, of John
O. Muse, the Chief Financial Officer of the Company (filed herewith).
32 Written Statement of Chief Executive Officer and Chief Financial Officer furnished pursuant to Section 906
of the Sarbanes-Oxley Act of 2002 (18 U.S.C. Section 1350) (filed herewith).
99.1 Consolidated Financial Statements of Diamond Green Diesel Holdings LLC and Subsidiary for the year
ended December 31, 2014 (filed herewith).
101 Interactive Data Files Pursuant to Rule 405 of Regulation S-T: (i) Consolidated Balance Sheets as of January 3, 2015 and December 28, 2013; (ii) Consolidated Statements of Operations for the years ended January 3, 2015, December 28, 2013 and December 29, 2012; (iii) Consolidated Statements of Comprehensive Income for the years ended January 3, 2015, December 28, 2013 and December 29, 2012; (iv) Consolidated Statements of Stockholders’ Equity for the years ended January 3, 2015, December 28, 2013 and December 29, 2012; (v) Consolidated Statements of Cash Flows for the years ended January 3, 2015, December 28, 2013 and December 29, 2012; (vi) Notes to the Consolidated Financial Statements.
The Exhibits are available upon request from the Company.
* Management contract or compensatory plan or arrangement.

Exhibit 18.1
March 4, 2015
Darling Ingredients Inc. Irving, Texas
Ladies and Gentlemen:
We have audited the consolidated balance sheets of Darling Ingredients Inc. (the Company) as of January 3, 2015 and December 28, 2013, and the related consolidated statements of operations, comprehensive income, stockholder’s equity, and cash flows for each of the 52/53 week fiscal years in the three-year period ended January 3, 2015, and have reported thereon under date of March 4, 2015. The aforementioned consolidated financial statements and our audit report thereon are included in the Company’s annual report on Form 10-K for the fiscal year ended January 3, 2015. As stated in note 1 to those financial statements, the Company changed the date of its annual assessment of goodwill and indefinite-lived intangible assets impairment from the end of its 52/53 week fiscal year to the end of fiscal October, and states that the newly adopted accounting principle is a preferable alternative as the new date of the assessment is more closely aligned with the Company’s strategic planning process. In accordance with your request, we have reviewed and discussed with Company officials the circumstances and business judgment and planning upon which the decision to make this change in the method of accounting is based.
With regard to the aforementioned accounting change, authoritative criteria have not been established for evaluating the preferability of one acceptable method of accounting over another acceptable method. However, for purposes of the Company’s compliance with the requirements of the Securities and Exchange Commission, we are furnishing this letter.
Based on our review and discussion, with reliance on management’s business judgment and planning, we concur that the newly adopted method of accounting is preferable in the Company’s circumstances.
Very truly yours,
/s/ KPMG LLP

Exhibit 21
Darling Ingredients Inc.
List of Significant Subsidiaries of the Registrant
The following are the significant subsidiaries of Darling Ingredients Inc. and the states in which they are organized.
Name Where Organized
Griffin Industries LLC Kentucky Craig Protein Division, Inc. Georgia Darling National LLC Delaware Darling Green Energy LLC Delaware Darling AWS LLC Delaware Terra Holding Company Delaware Terra Renewal Services, Inc. Arkansas EV Acquisition Inc. Arkansas Darling Northstar LLC Delaware Darling Global Holdings Inc. Delaware DII Holdings (Gibraltar) Limited Gibraltar Darling (GI) Limited Gibraltar Darling International NL CV The Netherlands Darling International Netherlands B.V. The Netherlands Darling International Canada Inc. Canada Darling International NL Holding B.V. The Netherlands Best Commodity Trade B.V. The Netherlands BestHides GmbH (60%) Germany B.V. CTH Groep The Netherlands Changchun Sonac Biology Co. Ltd (65%) China China Millers Ltd United Kingdom Combinatie Teijsen van de Hengel (CTH) BV The Netherlands CTH België BVBA Belgium CTH do Brasil Indústria e Comércio de subproduto animal Ltda Brazil CTH Espana SL Spain CTH Germany GmbH Germany CTH GmbH Germany CTH Porto - Industria Alimentar Unipessoal Lda Portugal CTH US Inc. Delaware Darling 5Q B.V. The Netherlands Darling 5Q GmbH Germany Darling 5Q UK Ltd United Kingdom Darling Ingredients Belgium Holding BVBA Belgium Darling Ingredients Germany Holding GmbH Germany


Darling Ingredients International Financial Services B.V. The Netherlands Darling Ingredients International Holding B.V. The Netherlands Darling Ingredients Nederland B.V. The Netherlands Darling Ingredients Nederland Holding B.V. The Netherlands Darling (Shanghai) Management Co. Ltd China Ecoson B.V. The Netherlands Ecoson II B.V. The Netherlands ecoson GmbH Germany ERS Germany GmbH Germany Global Ceramic Materials Ltd United Kingdom Harimex B.V. The Netherlands Harimex do Brazil Ltda Brazil Haripro SpA (50%) Italy Hepac B.V. The Netherlands Hide Service GmbH (50%) Germany HR-Service Nederland B.V. The Netherlands Hunan Teijsen Casings & Food Co. Ltd China IT Services B.V. The Netherlands Kanzler GmbH Germany LARU GmbH Germany MD Entsorgungsges. für Schlachtnebenprodukte mbH Germany Nederlandse Darmenhandel Nevada BV The Netherlands Nevada Darmen- und Schlachtnebenprodukte Handels GmbH Germany Qionglai Sonac Biology Co. Ltd (65%) China Rendac B.V. The Netherlands Rendac BVBA Belgium Rendac CES SA Luxemburg Rendac Icker GmbH & Co. KG Germany Rendac Jagel GmbH Germany Rendac Lingen GmbH Germany Rendac Rotenburg GmbH Germany Rendac Son B.V. The Netherlands Rendac Son II B.V. The Netherlands Rendac Transport BVBA Belgium Rendac UDES SPRL Belgium Rendac Udes Transport SPRL Belgium Rousselot (Da'an) Gelatin Co. Ltd (75%) China Rousselot (Guangdong) Gelatin Co. Ltd (75%) China Rousselot (M) SDN.BHD Malaysia Rousselot (Whenzou) Gelatin Co. Ltd (70%) China Rousselot (Zhejiang) Gelatin Co. Ltd (70%) China Rousselot Angouleme SAS France Rousselot Argentina SA Argentina Rousselot B.V. The Netherlands Rousselot BVBA Belgium Rousselot Dubuque Inc. Delaware


Rousselot Gelatin SL Spain Rousselot Gelatinas do Brasil Ltda Brazil Rousselot GmbH Germany Rousselot Inc. Delaware Rousselot Isle sur La Sorgue SAS France Rousselot Japan KK Japan Rousselot Jellice KK (51%) Japan Rousselot Peabody Inc. Massachusetts Rousselot SAS France Sanrec GmbH Germany Siping Sonac Biology Co. Ltd (65%) China SNP Handels- und Beteiligungs GmbH Germany SNP Verwaltungs- GmbH Germany Sobel GmbH Germany Sobel Luxembourg Sarl Luxemburg Sonac (China) Biology Co. Ltd (65%) China Sonac (Luohe) Biology Co. Ltd (65%) China Sonac Australia PTY, Ltd Australia Sonac Bad Bramstedt GmbH Germany Sonac België BVBA Belgium Sonac Bergheim GmbH Austria Sonac Bramstedt-Nord GmbH Germany Sonac Brünen GmbH Germany Sonac Burgum B.V. The Netherlands Sonac Eindhoven B.V. The Netherlands Sonac Elsholz GmbH Germany Sonac Erolzheim GmbH Germany Sonac Gelsenkirchen GmbH Germany Sonac Gent BVBA Belgium Sonac Harlingen B.V. The Netherlands Sonac Hides & Skins (UK) Ltd United Kingdom Sonac Kiel GmbH Germany Sonac Lingen GmbH Germany Sonac Loenen B.V. The Netherlands Sonac Mering GmbH Germany Sonac Osetnica Sp.z o.o. Poland Sonac Son B.V. The Netherlands Sonac Transport BVBA Belgium Sonac USA LLC Delaware Sonac Usnice Sp.z o.o. Poland Sonac Versmold GmbH Germany Sonac Vuren B.V. The Netherlands Suzhou Sonac Protein Co. Ltd (52%) China T&K Spolka z.o.o. (50.98%) Poland Vada BVBA Belgium Zhejiang Sonac Biology Co. Ltd (65%) China


Exhibit 23.1
Consent of Independent Registered Public Accounting Firm
The Board of Directors Darling Ingredients Inc.: We consent to the incorporation by reference in the registration statements on Form S-3 (Nos. 333-170668 and 333-192004), Form S-4 (No. 333-131494) and Form S-8 (Nos. 333-125875, 333-181786, 33-99868 and 33-99866) of Darling Ingredients Inc. (Company) of our reports dated March 4, 2015, with respect to the consolidated balance sheets of Darling Ingredients Inc. as of January 3, 2015 and December 28, 2013, and the related consolidated statements of operations, comprehensive income / (loss), stockholders’ equity, and cash flows for each of the years in the three-year period ended January 3, 2015, and the effectiveness of internal control over financial reporting as of January 3, 2015, which reports appear in the January 3, 2015 annual report on Form 10-K of Darling Ingredients Inc.
Our report on the consolidated financial statements refers to a change in the date of the Company’s annual assessment of goodwill and indefinite lived intangible assets impairment in 2014.
Our report on the effectiveness of internal control over financial reporting contains an explanatory paragraph stating that during 2014 the Company acquired VION Ingredients and management excluded from its assessment of the effectiveness of Company’s internal control over financial reporting as of January 3, 2015, VION Ingredients’ internal control over financial reporting associated with total assets of $2,849 million and total revenues of $2,065 million included in the consolidated financial statements of Darling Ingredients Inc. and subsidiaries as of and for the year ended January 3, 2015. Our audit of internal control over financial reporting of the Company also excluded an evaluation of the internal control over financial reporting of VION Ingredients.
/s/ KPMG LLP Dallas, Texas March 4, 2015
Exhibit 23.2
Consent of Independent Auditors
The Board of Directors Darling Ingredients Inc.: We consent to the incorporation by reference in the registration statements on Form S-3 (Nos. 333-170668 and 333-192004), Form S-4 (No. 333-131494), and Form S-8 (Nos. 333-125875, 333-181786, 33-99868, and 33-99866) on Form 10-K of Darling Ingredients Inc. of our report dated February 9, 2015, with respect to the consolidated balance sheets of Diamond Green Diesel Holdings LLC and subsidiary as December 31, 2014 and 2013, and the related consolidated statements of income, members' equity, and cash flows for each of the years in the two-year period ended December 31, 2014, not included herein, which report appears in the January 3, 2015 annual report on Form 10-K of Darling Ingredients Inc.
/s/ KPMG LLP
San Antonio, Texas March 4, 2015

EXHIBIT 31.1 CERTIFICATION I, Randall C. Stuewe, certify that:
/s/ Randall C. Stuewe -----------------------------------------------
Randall C. Stuewe Chief Executive Officer
1. I have reviewed this annual report on Form 10-K of Darling Ingredients Inc.;
2. Based on my knowledge, this report does not contain any untrue statement of a material fact or omit to state a material fact necessary to make the statements made, in light of the circumstance under which such statements were made, not misleading with respect to the period covered by this report;
3. Based on my knowledge, the financial statements, and other financial information included in this report, fairly present in all material respects the financial condition, results of operations and cash flows of the registrant as of, and for, the periods presented in this report;
4. The registrant's other certifying officer(s) and I are responsible for establishing and maintaining disclosure controls and procedures (as defined in Exchange Act Rules 13a-15(e) and 15d-15(e)) and internal control over financial reporting (as defined in Exchange Act Rules 13a-15(f) and 15d-15(f)) for the registrant and have:
(a) Designed such disclosure controls and procedures, or caused such disclosure controls and procedures to be designed under our supervision, to ensure that material information relating to the registrant, including its consolidated subsidiaries, is made known to us by others within those entities, particularly during the period in which this report is being prepared;
(b) Designed such internal control over financial reporting, or caused such internal control over financial reporting to be designed under our supervision, to provide reasonable assurance regarding the reliability of financial reporting and the preparation of financial statements for external purposes in accordance with generally accepted accounting principles;
(c) Evaluated the effectiveness of the registrant's disclosure controls and procedures and presented in this report our conclusions about the effectiveness of the disclosure controls and procedures, as of the end of the period covered by this report based on such evaluation; and
(d) Disclosed in this report any change in the registrant's internal control over financial reporting that occurred during the registrant's most recent fiscal quarter (the registrant's fourth fiscal quarter in the case of an annual report) that has materially affected, or is reasonably likely to materially affect, the registrant's internal control over financial reporting; and
5. The registrant's other certifying officer(s) and I have disclosed, based on our most recent evaluation of internal control over financial reporting, to the registrant's auditors and the audit committee of the registrant's board of directors (or persons performing the equivalent functions):
(a) All significant deficiencies and material weaknesses in the design or operation of internal control over financial reporting which are reasonably likely to adversely affect the registrant's ability to record, process, summarize and report financial information; and
(b) Any fraud, whether or not material, that involves management or other employees who have a significant role in the registrant's internal control over financial reporting.
Date: March 4, 2015

EXHIBIT 31.2 CERTIFICATION I, John O. Muse, certify that:
/s/ John O. Muse -----------------------------------------------
John O. Muse Chief Financial Officer
1. I have reviewed this annual report on Form 10-K of Darling Ingredients Inc.;
2. Based on my knowledge, this report does not contain any untrue statement of a material fact or omit to state a material fact necessary to make the statements made, in light of the circumstance under which such statements were made, not misleading with respect to the period covered by this report;
3. Based on my knowledge, the financial statements, and other financial information included in this report, fairly present in all material respects the financial condition, results of operations and cash flows of the registrant as of, and for, the periods presented in this report;
4. The registrant's other certifying officer(s) and I are responsible for establishing and maintaining disclosure controls and procedures (as defined in Exchange Act Rules 13a-15(e) and 15d-15(e)) and internal control over financial reporting (as defined in Exchange Act Rules 13a-15(f) and 15d-15(f)) for the registrant and have:
(a) Designed such disclosure controls and procedures, or caused such disclosure controls and procedures to be designed under our supervision, to ensure that material information relating to the registrant, including its consolidated subsidiaries, is made known to us by others within those entities, particularly during the period in which this report is being prepared;
(b) Designed such internal control over financial reporting, or caused such internal control over financial reporting to be designed under our supervision, to provide reasonable assurance regarding the reliability of financial reporting and the preparation of financial statements for external purposes in accordance with generally accepted accounting principles;
(c) Evaluated the effectiveness of the registrant's disclosure controls and procedures and presented in this report our conclusions about the effectiveness of the disclosure controls and procedures, as of the end of the period covered by this report based on such evaluation; and
(d) Disclosed in this report any change in the registrant's internal control over financial reporting that occurred during the registrant's most recent fiscal quarter (the registrant's fourth fiscal quarter in the case of an annual report) that has materially affected, or is reasonably likely to materially affect, the registrant's internal control over financial reporting; and
5. The registrant's other certifying officer(s) and I have disclosed, based on our most recent evaluation of internal control over financial reporting, to the registrant's auditors and the audit committee of the registrant's board of directors (or persons performing the equivalent functions):
(a) All significant deficiencies and material weaknesses in the design or operation of internal control over financial reporting which are reasonably likely to adversely affect the registrant's ability to record, process, summarize and report financial information; and
(b) Any fraud, whether or not material, that involves management or other employees who have a significant role in the registrant's internal control over financial reporting.
Date: March 4, 2015

EXHIBIT 32
CERTIFICATION PURSUANT TO
18 U.S.C. SECTION 1350,
AS ADOPTED PURSUANT TO
SECTION 906 OF THE SARBANES-OXLEY ACT OF 2002 In connection with the Annual Report of Darling Ingredients Inc. (the “Company”) on Form 10-K for the period ending January 3, 2015 as filed with the Securities and Exchange Commission on the date hereof (the “Report”), the undersigned, Randall C. Stuewe, Chief Executive Officer of the Company, and John O. Muse, Chief Financial Officer of the Company, each hereby certifies, pursuant to 18 U.S.C. §1350, as adopted pursuant to §906 of the Sarbanes-Oxley Act of 2002 (the “Act”), that: 1. The Report fully complies with the requirements of Section 13(a) or 15(d) of the Securities Exchange Act of 1934; and 2. The information contained in the Report fairly presents, in all material respects, the financial condition and results of operations of the Company. This certification is being furnished solely for purposes of compliance with the Act.
/s/ Randall C. Stuewe /s/ John O. Muse
Randall C. Stuewe John O. Muse
Chief Executive Officer Chief Financial Officer
Date: March 4, 2015 Date: March 4, 2015
Exhibit 99.1
DIAMOND GREEN DIESEL HOLDINGS LLC AND SUBSIDIARY
CONSOLIDATED FINANCIAL STATEMENTS
FOR THE YEAR ENDED DECEMBER 31, 2014

Independent Auditors' Report
The Board of Managers Diamond Green Diesel Holdings LLC and Subsidiary:
We have audited the accompanying consolidated financial statements of Diamond Green Diesel Holdings LLC and subsidiary, which comprise the consolidated balance sheets as of December 31, 2014 and December 31, 2013, and the related consolidated statements of income, members' equity, and cash flows for the years then ended, and the related notes to the consolidated financial statements.
Management's Responsibility for the Financial Statements
Management is responsible for the preparation and fair presentation of these consolidated financial statements in accordance with U.S. generally accepted accounting principles; this includes the design, implementation, and maintenance of internal control relevant to the preparation and fair presentation of consolidated financial statements that are free of material misstatement, whether due to fraud or error.
Auditor's Responsibility
Our responsibility is to express an opinion on these consolidated financial statements based on our audits. We conducted our audits in accordance with auditing standards generally accepted in the United States of America. Those standards require that we plan and perform the audit to obtain reasonable assurance about whether the consolidated financial statements are free from material misstatement.
An audit involves performing procedures to obtain audit evidence about the amounts and disclosures in the consolidated financial statements. The procedures selected depend on the auditors' judgment, including the assessment of the risks of material misstatement of the consolidated financial statements, whether due to fraud or error. In making those risk assessments, the auditor considers internal control relevant to the entity's preparation and fair presentation of the consolidated financial statements in order to design audit procedures that are appropriate in the circumstances, but not for the purpose of expressing an opinion on the effectiveness of the entity's internal control. Accordingly, we express no such opinion. An audit also includes evaluating the appropriateness of accounting policies used and the reasonableness of significant accounting estimates made by management, as well as evaluating the overall presentation of the consolidated financial statements.
We believe that the audit evidence we have obtained is sufficient and appropriate to provide a basis for our audit opinion.
Opinion In our opinion, the consolidated financial statements referred to above present fairly in all material respects, the financial position of Diamond Green Diesel Holdings LLC and subsidiary as of December 31, 2014 and 2013 and the results of their operations and their cash flows for the years then ended, in accordance with U.S. generally accepted accounting principles.
/s/ KPMG LLP
San Antonio, Texas February 9, 2015

DIAMOND GREEN DIESEL HOLDINGS LLC AND SUBSIDIARY
CONSOLIDATED BALANCE SHEETS
See Notes to Consolidated Financial Statements.
2
December 31,
2014 2013
ASSETS
Current assets:
Cash $ 21,900,560 $ 18,741,373 Receivables 145,503,729 38,590,323 Receivables—due from related party 15,886,271 19,339,732 Inventory 29,177,088 26,858,402 Prepaid expenses and other 4,523,370 2,801,636
Total current assets 216,991,018 106,331,466
Property, plant and equipment, at cost 397,255,675 390,643,657 Accumulated depreciation (24,138,264 ) (8,632,486 )
Property, plant and equipment, net 373,117,411 382,011,171
Deferred charges and other assets, net 2,091,950 92,415 Total assets $ 592,200,379 $ 488,435,052
LIABILITIES AND MEMBERS’ EQUITY
Current liabilities:
Current portion of related party debt $ 57,513,870 $ 8,511,469 Accounts payable 4,684,780 9,887,707
Accounts payable—due to related party 11,940,892 21,987,218 Accrued interest—due to related party 4,350,306 4,524,319 Taxes other than income taxes 121,208 100,628 Other accrued expenses 215,834 201,527 Total current liabilities 78,826,890 45,212,868
Related party debt, less current portion 155,272,851 212,786,720
Other long-term liabilities 339,128 207,332 Commitments
Members’ equity:
Paid-in capital 223,377,260 223,377,260 Retained earnings 134,384,250 6,850,872
Total members’ equity 357,761,510 230,228,132
Total liabilities and members’ equity $ 592,200,379 $ 488,435,052

DIAMOND GREEN DIESEL HOLDINGS LLC AND SUBSIDIARY
CONSOLIDATED STATEMENTS OF INCOME
See Notes to Consolidated Financial Statements.
3
Year Ended December 31,
2014 2013
Operating revenues $ 487,833,974 $ 213,552,384 Costs and expenses:
Cost of sales 286,537,869 152,354,710 Operating expenses 36,535,577 25,689,289 General and administrative expenses 1,483,100 987,500 Depreciation, amortization and accretion expense 18,186,189 8,644,110 Loss on disposal — 1,540,640
Total costs and expenses 342,742,735 189,216,249
Operating income 145,091,239 24,336,135 Other income, net 81,861 32,683 Interest and debt expense:
Incurred (17,688,724 ) (17,641,313 )
Capitalized 49,002 8,592,675
Interest and debt expense, net (17,639,722 ) (9,048,638 )
Net income $ 127,533,378 $ 15,320,180

DIAMOND GREEN DIESEL HOLDINGS LLC AND SUBSIDIARY
CONSOLIDATED STATEMENTS OF MEMBERS’ EQUITY
See Notes to Consolidated Financial Statements.
4
Diamond Darling Total Alternative Green Members’ Energy, LLC Energy LLC Equity
Balances as of December 31, 2012 $ 62,494,517 $ 62,494,517 $ 124,989,034 Members' contributions 44,959,459 44,959,459 89,918,918 Net income 7,660,090 7,660,090 15,320,180
Balances as of December 31, 2013 115,114,066 115,114,066 230,228,132
Net income 63,766,689 63,766,689 127,533,378
Balances as of December 31, 2014 $ 178,880,755 $ 178,880,755 $ 357,761,510

DIAMOND GREEN DIESEL HOLDINGS LLC AND SUBSIDIARY
CONSOLIDATED STATEMENTS OF CASH FLOWS
See Notes to Consolidated Financial Statements.
5
Year Ended December 31,
2014 2013
Cash flows from operating activities:
Net income $ 127,533,378 $ 15,320,180 Adjustments to reconcile net income to net cash used in
operating activities:
Depreciation, amortization and accretion expense 18,186,189 8,644,110 Inventory valuation adjustment (5,840,825 ) (4,201,416 )
Loss on disposal — 1,540,640 Other noncash expense 36,368 41,146 Increase in receivables (110,893,406 ) (38,590,323 )
(Increase) decrease in receivables—due from related party) 3,453,461 (19,339,732 )
(Increase) decrease in inventory 3,522,139 (22,391,079 )
Increase in prepaid expenses and other (1,721,734 ) (2,747,093 )
Increase (decrease) in accounts payable (2,704,736 ) 6,742,059 Increase (decrease) in accounts payable—due to related
party (10,046,057 ) 21,278,333 Increase (decrease) in accrued interest—due to related
party (223,015 ) 4,524,319 Increase in taxes other than income taxes 9,780 83,717 Increase in other accrued expenses 14,307 90,580
Net cash provided by (used in) operating activities 21,325,849 (29,004,559 )
Cash flows from investing activities:
Capital expenditures (11,090,332 ) (64,678,565 )
Deferred catalyst costs (2,544,861 ) — Proceeds from insurance 3,980,000 —
Net cash used in investing activities (9,655,193 ) (64,678,565 )
Cash flows from financing activities:
Proceeds from (repayments of) related party debt (8,511,469 ) 13,883,539 Members’ contributions — 89,918,918
Net cash provided by (used in) financing activities (8,511,469 ) 103,802,457 Net increase in cash 3,159,187 10,119,333 Cash as of beginning of year 18,741,373 8,622,040
Cash as of end of year $ 21,900,560 $ 18,741,373
Supplemental cash flow information:
Cash advance used to purchase computer equipment $ — $ 879,685 Accrued capital expenditures 623,806 3,111,465 Noncash interest:
Funded by related-party debt — 12,534,678 Capitalized 49,002 8,592,675
Interest paid 17,862,736 4,524,319

DIAMOND GREEN DIESEL HOLDINGS LLC AND SUBSIDIARY
NOTES TO CONSOLIDATED FINANCIAL STATEMENTS
1. BUSINESS DESCRIPTION Diamond Green Diesel Holdings LLC (DGD Holdings) was formed on January 21, 2011 as a joint venture between Diamond Alternative Energy, LLC, an indirect wholly owned subsidiary of Valero Energy Corporation (Valero), and Darling Green Energy LLC, a subsidiary of Darling International, Inc. (Darling). Diamond Alternative Energy, LLC and Darling Green Energy LLC are collectively referred to herein as the “Members.” DGD Holdings, through its wholly owned subsidiary Diamond Green Diesel LLC (DGD), operates a biomass-based diesel unit having a design feed capacity of 10,000 barrels per day that processes animal fats, used cooking oils, and other vegetable oils into renewable green diesel (the Plant). The Plant is located next to Valero’s St. Charles Refinery in Norco, Louisiana. DGD Holdings and DGD are collectively referred to herein as the “Company.” The Company completed construction of the Plant and began operations in June 2013. 2. SUMMARY OF SIGNIFICANT ACCOUNTING POLICIES Basis of Presentation and Consolidation These consolidated financial statements have been prepared in accordance with United States generally accepted accounting principles (GAAP). All significant intercompany accounts and transactions have been eliminated in consolidation. Management has evaluated subsequent events that occurred after December 31, 2014 through February 9, 2015, the date these consolidated financial statements were issued. Any material subsequent events that occurred during this time have been properly recognized or disclosed in these consolidated financial statements. Use of Estimates The preparation of financial statements in conformity with GAAP requires management to make estimates and assumptions that affect the amounts reported in the financial statements and accompanying notes. Actual results could differ from those estimates. On an ongoing basis, management reviews its estimates based on currently available information. Changes in facts and circumstances could result in revised estimates. Cash Cash consists of demand deposits with a financial institution.
6

DIAMOND GREEN DIESEL HOLDINGS LLC AND SUBSIDIARY
NOTES TO CONSOLIDATED FINANCIAL STATEMENTS (Continu ed) Receivables Trade receivables are carried at original invoice amount. The Company has not had any uncollectible receivables and therefore, no allowance for doubtful accounts was recorded as of December 31, 2014 and 2013. Inventory Inventory is valued at the lower of cost or market. The cost of feedstocks purchased for processing and refined products (primarily renewable green diesel) are determined under the last-in, first-out (LIFO) method using the dollar-value LIFO method. The cost of supplies are determined principally under the weighted-average cost method. Prepaid Expenses Prepaid expenses are costs incurred for which the services or goods will be received in a future period. The prepaid expenses are recorded as an asset when paid and recognized as an expense in the period the services or goods are utilized. Property, Plant and Equipment The cost of property, plant and equipment (property assets) purchased or constructed, including betterments of property assets, is capitalized. However, the cost of repairs to and normal maintenance of property assets is expensed as incurred. Betterments of property assets are those which extend the useful life, increase the capacity or improve the operating efficiency of the asset, or improve the safety of our operations. The cost of property assets constructed includes interest and certain overhead costs allocable to the construction activities. Depreciation of processing units is recorded on a straight-line basis over the estimated useful life using the composite method of depreciation. Also under the composite method of depreciation, the historical cost of a minor property asset (net of salvage value) that is retired or replaced is charged to accumulated depreciation and no gain or loss is recognized in income. However, a gain or loss is recognized in income for a major property asset that is retired, replaced or sold and for an abnormal disposition of a property asset (primarily involuntary conversions). Gains and losses are reflected in depreciation, amortization and accretion expense, unless such amounts are reported separately due to materiality. Depreciation of the administrative building and computer hardware is recorded on a straight-line basis over the estimated useful lives of the related assets using the component method of depreciation. Precious metals, which are used as a catalyst in the units to process feedstock into renewable green diesel, are not depreciated, but the cost of precious metals not recovered from the reclamation process are charged to operating expenses. Impairment of Assets Long-lived assets, which include property, plant and equipment, are tested for recoverability whenever events or changes in circumstances indicate that the carrying amount of the asset may not be recoverable. A long-lived asset is not recoverable if its carrying amount exceeds the sum of the undiscounted cash flows expected to result from its use and eventual disposition. If a long-lived asset is not recoverable, an impairment loss is recognized for the amount by which the carrying amount of the long-lived asset exceeds its fair value, with fair value determined based on discounted estimated net cash flows or other appropriate methods.
7

DIAMOND GREEN DIESEL HOLDINGS LLC AND SUBSIDIARY
NOTES TO CONSOLIDATED FINANCIAL STATEMENTS (Continu ed) Asset Retirement Obligation The Company records a liability, which is referred to as an asset retirement obligation, at fair value for the estimated cost to retire a tangible long-lived asset at the time that the Company incurs that liability, which is generally when the asset is purchased, constructed or leased. The Company records the liability when there is a legal obligation to incur costs to retire the asset and when a reasonable estimate of the fair value of the liability can be made. Deferred Charges and Other Assets “Deferred charges and other assets, net” include the following:
Revenue Recognition Revenues for products sold are recorded upon delivery of the products to the customers, which is the point at which title to the products is transferred, and when payment has either been received or collection is reasonably assured. The Renewable Identification Number (RIN), which is created at the time of production, is also sold along with the finished product. Product Shipping and Handling Costs Costs incurred for shipping and handling of products are included in cost of sales. Blenders Tax Credit Through December 31, 2014, biodiesel blenders registered with the Internal Revenue Service were eligible for a tax incentive in the amount of $1.00 per gallon of renewable diesel blended with petroleum diesel to produce a mixture containing at least 0.1 percent diesel fuel. Only blenders that produced and sold or used the qualified biodiesel mixture as a fuel in their trade or business were eligible for the tax credit. As a blender, the Company filed for $125,983,133 and $50,360,267 in credits related to this biodiesel blenders credit during the years ended December 31, 2014 and 2013, respectively. However, the biodiesel blenders credit expired on December 31, 2014. As such, unless the tax credit is extended by Congress, the Company will not receive this tax benefit during 2015. Operating Expenses Operating expenses primarily consist of costs charged to the Company by Valero in accordance with the Operations Agreement for day-to-day operations of the Plant, as further described in Note 10. In addition, operating expenses include maintenance expenses and chemicals. General and Administrative Expenses General and administrative expenses consist primarily of fees for administrative services provided by Valero, as further described in Note 10.
8
• fixed-bed catalyst costs, representing the cost of catalyst that is changed out at periodic intervals when the quality of the catalyst has deteriorated beyond its prescribed function, which are deferred when incurred and amortized on a straight-line basis over the estimated useful live of the specific catalyst; and
• utility deposits.

DIAMOND GREEN DIESEL HOLDINGS LLC AND SUBSIDIARY
NOTES TO CONSOLIDATED FINANCIAL STATEMENTS (Continu ed) Income Taxes The Company is a limited liability corporation and is not a taxpaying entity for federal income tax purposes. Accordingly, no provision for income taxes is made in these consolidated financial statements. Income or loss from the Company is taxable to the Members in their individual federal tax returns. Derivatives and Hedging All derivative instruments are recorded in the balance sheet as either assets or liabilities measured at their fair values. The gain or loss on the derivative instrument, if any, is recognized in income as incurred. The cash flow effects of the derivative instruments are reflected in operating activities in the statements of cash flows. See Note 12 for additional discussion. Concentration Risk The Company sold 74 percent and 82 percent of its renewable diesel to Valero and 10 percent and 11 percent to a third party customer for the years ended December 31, 2014 and 2013, respectively. No other customer individually represented more than 10 percent of operating revenues. The Company purchased 38 percent and 41 percent of its raw materials from Darling for the years ended December 31, 2014 and 2013, respectively. The Company purchased 16 percent and 10 percent from two third party suppliers, respectively, for the year ended December 31, 2014 and 10 percent from a third party supplier for the year ended December 31, 2013. See Note 10 for additional discussion of the Company’s contracts with Valero and Darling. 3. RECEIVABLES Receivables consisted of the following:
9
December 31,
2014 2013
Receivables—trade $ 9,188,305 $ 11,920,947 Blenders tax credit receivable 125,983,133 22,750,045 Insurance receivable (see Note 9) 6,358,343 — Commodity derivative contract receivables (see Note 11) 3,973,948 3,919,331
Total receivables $ 145,503,729 $ 38,590,323
Receivables—due from related party $ 15,886,271 $ 19,339,732

DIAMOND GREEN DIESEL HOLDINGS LLC AND SUBSIDIARY
NOTES TO CONSOLIDATED FINANCIAL STATEMENTS (Continu ed) 4. INVENTORIES Inventories consisted of the following:
As of December 31, 2014 and 2013, the carrying amounts of LIFO inventories exceeded their net realizable value (market value) by $5,840,825 and $4,201,416, respectively, resulting in a writedown of the LIFO inventories to a net realizable value of $29,177,088 and $26,858,402 in each respective year. The writedowns are reflected in cost of sales. 5. PROPERTY, PLANT AND EQUIPMENT Major classes of property, plant and equipment consisted of the following:
In 2013, the Company recorded a loss on disposal of $1,540,640 related to retirement of certain equipment that failed following installation and start up of the Plant’s steam generator due to improper design of the equipment. The Company replaced the two heat exchangers, piping and tanks with upgraded equipment, resulting in the write off of the associated net book value of the replaced equipment.
10
December 31,
2014 2013
Feedstocks $ 22,823,977 $ 22,791,153 Finished products 6,161,455 3,998,826 Supplies 191,656 68,423
Inventories $ 29,177,088 $ 26,858,402
December 31,
2014 2013
Processing units $ 386,758,525 $ 381,129,692 Administrative building 2,833,202 2,825,133 Precious metals 5,228,462 5,228,462 Computer hardware 1,319,686 1,319,686 Asset retirement obligation 177,993 92,000 Construction in progress 937,807 48,684
Property, plant and equipment, at cost 397,255,675 390,643,657 Accumulated depreciation (24,138,264 ) (8,632,486 )
Property, plant and equipment, net $ 373,117,411 $ 382,011,171

DIAMOND GREEN DIESEL HOLDINGS LLC AND SUBSIDIARY
NOTES TO CONSOLIDATED FINANCIAL STATEMENTS (Continu ed) Depreciation expense for the year ended December 31, 2014 was $17,631,427. Depreciation expense for the year ended December 31, 2013 was $8,644,110 and exceeded accumulated depreciation by $11,624 due to the depreciation related to the retirement of equipment discussed earlier. 6. DEFERRED CHARGES AND OTHER ASSETS
“Deferred charges and other assets, net” consists of catalyst costs, which are deferred and amortized as discussed in Note 1. Amortization expense for deferred catalyst costs was $545,328 for the year ended December 31, 2014. There was no amortization expense for the year ended December 31, 2013.
7. ASSET RETIREMENT OBLIGATION The Company recorded an asset retirement obligation for the estimated cost to remove all tangible long-lived assets from the leased premises as required by the Company’s lease agreement with Valero, which requires it to remove all improvements upon termination of the lease. This obligation was recorded upon completion of the Plant in June 2013. Changes in the asset retirement obligation were as follows:
The Company does not expect any short-term spending, and as a result, there is no current liability reported for asset retirement obligations as of December 31, 2014 and 2013. Accretion expense is reflected in depreciation, amortization and accretion expense. There are no assets that are legally restricted for purposes of settling the Company’s asset retirement obligations. 8. MEMBERS’ CONTRIBUTIONS AND DISTRIBUTIONS Pursuant to the Diamond Green Diesel Holdings LLC Amended and Restated Limited Liability Company Agreement, contributions were made prior to Plant start up based on the percentage of units held by each Member. Each Member holds 1,116,886 units, and therefore, owns a 50 percent ownership interest in DGD Holdings. Each Member receives one vote per unit. For the year ended December 31, 2013, each Member contributed $44,959,459 of cash to the Company. No contributions were made by the Members during 2014. Net income or loss of the Company for a fiscal year will be allocated between the Members based on the proportionate share of the Members’ ownership interests. Generally, the Company is prohibited from making
11
December 31,
2014 2013
Balance as of beginning of year $ 92,000 $ — Additions to accrual 85,993 92,000 Accretion expense 9,434 —
Balance as of end of year $ 187,427 $ 92,000

DIAMOND GREEN DIESEL HOLDINGS LLC AND SUBSIDIARY
NOTES TO CONSOLIDATED FINANCIAL STATEMENTS (Continu ed) distributions to its Members until certain conditions required by the loan from Valero (see Note 10) are satisfied. 9. COMMITMENTS AND CONTINGENCIES Leases The Company leases land from Valero in Norco, Louisiana on which the Plant was constructed, which is adjacent to Valero’s St. Charles refinery. See Note 10 for further discussion. In addition, the Company leases land next to the railroad on which the Company’s scale track is located. Rental expense for the agreement with The Kansas City Southern Railway Company was $17,314 and $16,810 for the years ended December 31, 2014 and 2013, respectively, and is reflected in operating expenses. Plant Fire On August 3, 2014, there was a fire in the ecofiner unit, which rendered the unit inoperable and required the Plant to be shutdown for 44 days. The Company incurred a loss of $11,338,343 and has filed a claim for property damage and expects to fully collect all amounts in excess of its $1 million deductible. As of December 31, 2014, $3,980,000 has been collected under the claim. An insurance receivable has been established as of December 31, 2014 for the remaining amount of $6,358,343 due under the claim. The Company is not eligible for business interruption as the policy only insured interruptions exceeding 45 days of disruption. These recoveries were reflected as an offset to operating expenses. 10. RELATED-PARTY TRANSACTIONS Overview The Company does not have any employees. It has entered into agreements with its Members, primarily Valero, to provide day-to-day operations, management and administrative functions. The Company has also obtained debt financing from Valero to fund the majority of the construction costs of the Plant. These related-party transactions cannot be presumed to be carried out on an arm’s length basis as the requisite conditions of competitive, free-market dealings may not exist. Following is a description of various agreements between the Company and its Members. Debt Agreement The Company has a loan facility with Valero, which allowed the Company to borrow up to an amount equal to 60 percent of the estimated construction costs of the Plant. The Company borrowed the maximum under the loan facility of $221,298,189. Interest on the loan facility accrues at a rate of 8 percent per annum. During the construction period, all unpaid interest was added to the principal balance outstanding under the loan installments, with the first payment paid on October 1, 2013. Principal payments are made in equal consecutive quarterly installments, with the first principal payment paid on July 1, 2014. In addition, the Company is required to make prepayments upon certain qualifying events. During 2014, there was a qualifying event which will require the Company to make a prepayment of $40,490,932 on the loan during 2015. There were no events during 2013 that required the Company to make a prepayment. The loan facility matures on April 30, 2027 and is secured by all property and equity interests of the Company. During the years ended December 31, 2014 and 2013, the Company paid $17,862,736 and $4,524,319, respectively, in interest on the loan.
12

DIAMOND GREEN DIESEL HOLDINGS LLC AND SUBSIDIARY
NOTES TO CONSOLIDATED FINANCIAL STATEMENTS (Continu ed) The amount reflected as related-party debt consists of the following:
Principal payments on the related-party debt as of December 31, 2014 were due as follows:
Lease Agreement As discussed in Note 9, the Company leases land from Valero. The lease is an operating lease and expires on May 31, 2031, with up to four optional renewal periods of five years each. As of December 31, 2014, future minimum rentals for the lease were as follows:
13
December 31, 2014 2013
Advances on loan facility $ 190,138,430 $ 198,649,898 Interest funded by loan facility 22,648,291 22,648,291
Total related-party debt 212,786,721 221,298,189 Less current portion (57,513,870 ) (8,511,469 )
Related-party debt, less current portion $ 155,272,851 $ 212,786,720
Year Ending December 31:
2015 $ 57,513,870 2016 17,022,938 2017 17,022,938 2018 17,022,938 2019 17,022,938 Thereafter 87,181,099
Total $ 212,786,721
Year Ending December 31:
2015 $ 328,052 2016 332,972 2017 337,967 2018 343,037 2019 348,182 2020 - 2031 4,364,481
Total minimum rental payments $ 6,054,691

DIAMOND GREEN DIESEL HOLDINGS LLC AND SUBSIDIARY
NOTES TO CONSOLIDATED FINANCIAL STATEMENTS (Continu ed) Rental expense is being recognized on a straight-line basis and was $359,573 for each of the years ended December 31, 2014 and 2013, and is reflected in operating expenses. Consulting Services Agreement Under the Consulting Services Agreement, Valero provided project management services to the Company through July 2013. Fees were charged in accordance with the billing rates included in the agreement (adjusted for inflation the first quarter of each calendar year). For the year ended December 31, 2013, the Company incurred $1,243,588, related to the Consulting Services Agreement, which is included in property, plant and equipment. This agreement ceased upon completion of the Plant. Operations Agreement Pursuant to the Operations Agreement, Valero operates the Plant and performs certain day-to-day operations and management functions for the Company as an independent contractor. During the 20-year term of the agreement, Valero charges for all dedicated operating and personnel costs, and for all routine and non-routine services in accordance with the contractual billing rates, which are adjusted for inflation annually on January 1. In addition, the Company pays Valero a monthly administrative fee, which began in June 2013 when the Company notified Valero and Darling that construction and testing of the Plant was complete and the Plant was ready to commence commercial service. The monthly administrative fee was $123,592 and $112,500 for the years ended December 31, 2014 and 2013, respectively. During 2011, the Company paid Valero an initial set up fee of $1,515,000. The initial set up fee was used in 2013 to purchase computer equipment in the amount of $879,685 and pay for services in the amount of $14,935. For the years ended December 31, 2014 and 2013, the Company recorded $1,483,100 and $987,500, respectively, of monthly administrative fees in general and administrative expenses. Other Agreements Effective July 2013, following notification by the Company that the Plant was ready to commence commercial service, three additional agreements became effective. Following the initial 20-year term, these agreements will automatically renew for a period of five years on an evergreen basis, unless terminated by one of the parties. Below is a description of the agreements. Raw Material Supply Agreement Under the Raw Material Supply Agreement, Darling is obligated to offer to supply all of the feedstock requirements to the Company. Darling will provide competitive pricing based on the delivery terms. However, the Company is not obligated to purchase all or any part of its feedstock requirements from Darling and will pursue the lowest cost feedstock supply to the Plant. For the years ended December 31, 2014 and 2013, the Company purchased $158,644,667 and $90,334,432, respectively, of raw materials from Darling. Product Offtake Agreement Under the Product Offtake Agreement, Valero is required to market all of the renewable green diesel produced at the Plant. Valero markets the renewable green diesel to third parties as well as to its affiliates and receives a marketing fee. In addition, Valero is required to purchase the recovered light ends liquid produced at the Plant. The Company has entered into long term contracts with Valero to sell renewable green diesel in varying amounts through December 2017. For the year ended December 31, 2014, the Company sold $324,338,555
14

DIAMOND GREEN DIESEL HOLDINGS LLC AND SUBSIDIARY
NOTES TO CONSOLIDATED FINANCIAL STATEMENTS (Continu ed) of renewable green diesel and $44,369,839 of recovered light ends liquid to Valero, which is recorded in operating revenues, and incurred $1,261,214 in marketing fees to Valero, which is recorded in cost of sales. For the year ended December 31, 2013, the Company sold $157,961,652 of renewable green diesel and $20,943,796 of recovered light ends liquid to Valero, and incurred $504,667 in marketing fees to Valero. Services and Utilities Supply Agreement Under the Services and Utilities Supply Agreement, Valero provides the Company with water, certain industrial gases which are produced or otherwise available at Valero’s St. Charles Refinery, and certain services, such as water treatment and terminalling services that are needed for the operation of the Plant. Prices charged by Valero are at prevailing market rates. The Company supplies Valero with steam produced at the Plant and charges Valero at prevailing market rates. For the years ended December 31, 2014 and 2013, the Company’s net purchases of industrial gases and other services from Valero was $26,921,929 and $10,460,047, respectively. The agreement allows these charges to be netted each month, with a net receivable from or payable to Valero each period which is settled 15 days after receipt of the invoice. Other For the years ended December 31, 2014 and 2013, the Company purchased $3,113,956 and $1,128,485 of feedstock from Valero. The Company also purchased $481,035 and $334,701 of ultra-low-sulfur diesel from Valero for the years ended December 31, 2014 and 2013, respectively. 11. FAIR VALUE MEASUREMENTS General GAAP requires that certain assets and liabilities be measured at fair value on a recurring or nonrecurring basis in our balance sheets, which are presented below under “ Recurring Fair Value Measurements. ” Recurring fair value measurements of assets or liabilities are those that GAAP requires or permits in the balance sheet at the end of each reporting period, such as derivative financial instruments. GAAP also requires the disclosure of the fair values of financial instruments when an option to elect fair value accounting has been provided, but such election has not been made. A debt obligation is an example of such a financial instrument. The disclosure of the fair values of financial instruments not recognized at fair value in the balance sheet is presented below under “ Other Financial Instruments. ” GAAP provides a framework for measuring fair value and establishes a three-level fair value hierarchy that prioritizes inputs to valuation techniques based on the degree to which objective prices in external active markets are available to measure fair value. Following is a description of each of the levels of the fair value hierarchy.
15
• Level 1 - Observable inputs, such as unadjusted quoted prices in active markets for identical assets or liabilities. • Level 2 - Inputs other than quoted prices included within Level 1 that are observable for the asset or liability, either directly or
indirectly. These include quoted prices for similar assets or liabilities in active markets and quoted prices for identical or similar assets or liabilities in markets that are not active.
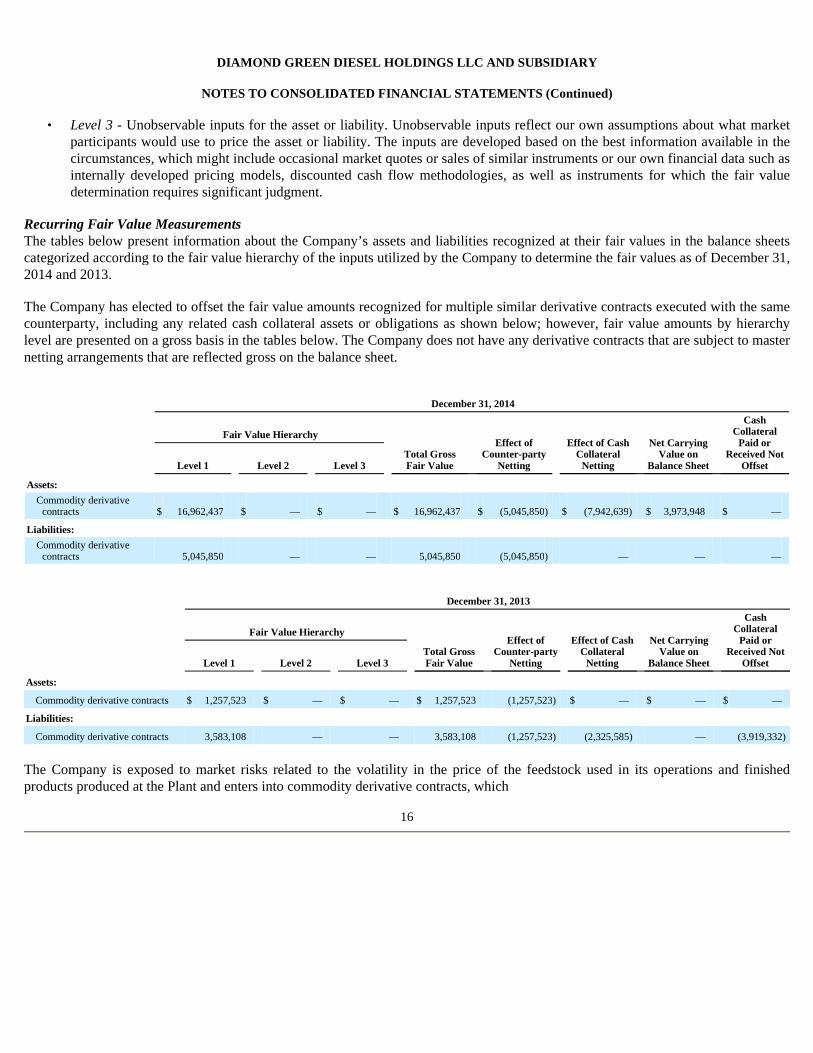
DIAMOND GREEN DIESEL HOLDINGS LLC AND SUBSIDIARY
NOTES TO CONSOLIDATED FINANCIAL STATEMENTS (Continu ed)
Recurring Fair Value Measurements The tables below present information about the Company’s assets and liabilities recognized at their fair values in the balance sheets categorized according to the fair value hierarchy of the inputs utilized by the Company to determine the fair values as of December 31, 2014 and 2013. The Company has elected to offset the fair value amounts recognized for multiple similar derivative contracts executed with the same counterparty, including any related cash collateral assets or obligations as shown below; however, fair value amounts by hierarchy level are presented on a gross basis in the tables below. The Company does not have any derivative contracts that are subject to master netting arrangements that are reflected gross on the balance sheet.
The Company is exposed to market risks related to the volatility in the price of the feedstock used in its operations and finished products produced at the Plant and enters into commodity derivative contracts, which
16
• Level 3 - Unobservable inputs for the asset or liability. Unobservable inputs reflect our own assumptions about what market participants would use to price the asset or liability. The inputs are developed based on the best information available in the circumstances, which might include occasional market quotes or sales of similar instruments or our own financial data such as internally developed pricing models, discounted cash flow methodologies, as well as instruments for which the fair value determination requires significant judgment.
December 31, 2014
Fair Value Hierarchy
Total Gross Fair Value
Effect of
Counter-party Netting
Effect of Cash
Collateral Netting
Net Carrying
Value on Balance Sheet
Cash
Collateral Paid or
Received Not Offset Level 1 Level 2 Level 3
Assets: Commodity derivative contracts $ 16,962,437 $ — $ — $ 16,962,437 $ (5,045,850 ) $ (7,942,639 ) $ 3,973,948 $ —
Liabilities: Commodity derivative contracts 5,045,850 — — 5,045,850 (5,045,850 ) — — —
December 31, 2013
Fair Value Hierarchy
Total Gross Fair Value
Effect of
Counter-party Netting
Effect of Cash
Collateral Netting
Net Carrying
Value on Balance Sheet
Cash
Collateral Paid or
Received Not Offset Level 1 Level 2 Level 3
Assets:
Commodity derivative contracts $ 1,257,523 $ — $ — $ 1,257,523 (1,257,523 ) $ — $ — $ — Liabilities:
Commodity derivative contracts 3,583,108 — — 3,583,108 (1,257,523 ) (2,325,585 ) — (3,919,332 )

DIAMOND GREEN DIESEL HOLDINGS LLC AND SUBSIDIARY
NOTES TO CONSOLIDATED FINANCIAL STATEMENTS (Continu ed) consist primarily of exchange-traded futures. See Note 12 for further discussion. These contracts are measured at fair value using the market approach. Exchange-traded futures are valued based on quoted prices from the exchange and are categorized in Level 1 of the fair value hierarchy. Other Financial Instruments Financial instruments that the Company recognizes in its balance sheets at their carrying amounts are shown in the table below:
The methods and significant assumptions used to estimate the fair value of these financial instruments are as follows:
12. PRICE RISK MANAGMENT ACTIVITIES The Company is exposed to market risks related to the volatility in the price of commodities and enters into derivative instruments to manage these risks. The only type of derivative instruments that the Company enters into are those related to the various commodities the Company purchases or produces as the Company is exposed to market risks related to the volatility in the price of the feedstock used in its operations and finished products produced at the Plant. All derivative instruments are recorded as either assets or liabilities measured at their fair values. When the Company enters into a derivative instrument, it is designated as an economic hedge. Economic hedges represent commodity derivative instruments that are used to manage price volatility in feedstock purchase contracts. Economic hedges are not designated as a fair value hedge or a cash flow hedge for accounting purposes, usually due to the difficulty of establishing the required documentation at the date that the derivative instrument is entered into that would allow the Company to achieve “hedge deferral accounting.” For the Company’s economic hedges, the derivative instrument is recorded at fair value and changes in the fair value of the derivative instrument are recognized currently in income. As of December 31, 2014, the Company had the following outstanding commodity derivative instruments that were entered into as economic hedges, which mature in 2015. The information presents the notional volume of outstanding contracts by type of instrument (volumes in thousands of barrels for ultra-low sulfur diesel and thousands of pounds for soybean oil).
17
December 31, 2014 December 31, 2013
Carrying Amount Fair
Value Carrying Amount Fair
Value
Financial assets:
Cash $ 21,900,560 $ 21,900,560 $ 18,741,373 $ 18,741,373 Financial liabilities:
Debt 212,786,721 224,211,971 221,298,189 227,398,358
• The fair value of cash is the carrying value due to the low level of credit risk of these assets (Level 1). • The fair value of debt is determined using the discounted cash flow method based on quoted prices provided by third-party
brokers (Level 3).

DIAMOND GREEN DIESEL HOLDINGS LLC AND SUBSIDIARY
NOTES TO CONSOLIDATED FINANCIAL STATEMENTS (Continu ed)
Fair Values of Derivative Instruments The following tables provide information about the fair values of the Company’s derivative instruments as of December 31, 2014 and 2013 and the line items in the balance sheets in which the fair values are reflected. See Note 11 for additional information related to the fair values of the Company’s derivative instruments.
Effect of Derivative Instruments on Statements of Income The following table provides information about the gain or loss recognized in income on the Company’s derivative instruments, and the line item in the financial statements in which such gains and losses are reflected.
18
Derivative Instrument Notional Contract
Volumes
Soybean oil:
Futures - long 94,920 Futures - short 178,920
Ultra-low-sulfur diesel:
Futures - long 224 Futures - short 648
December 31, 2014
Balance Sheet Location Asset Derivatives Liability Derivatives
Derivatives not designated as hedging instruments
Commodity contracts Receivables $ 16,962,437 $ 5,045,850
December 31, 2013
Balance Sheet Location Asset Derivatives Liability Derivatives
Derivatives not designated as hedging instruments
Commodity contracts Receivables $ 1,257,523 $ 3,583,108
Derivatives Designated as Economic Hedges
Location of Gain (Loss)
Recognized in Income on Derivatives
Year Ended December 31,
2014 2013
Commodity contracts Cost of sales $ 28,509,616 $ 459,331