DAQ and Signal Processing - National...
125
Measurement and Signal Processing Seminar 2011
-
Upload
truongthien -
Category
Documents
-
view
217 -
download
0
Transcript of DAQ and Signal Processing - National...
Measurement and
Signal Processing Seminar
2011
2
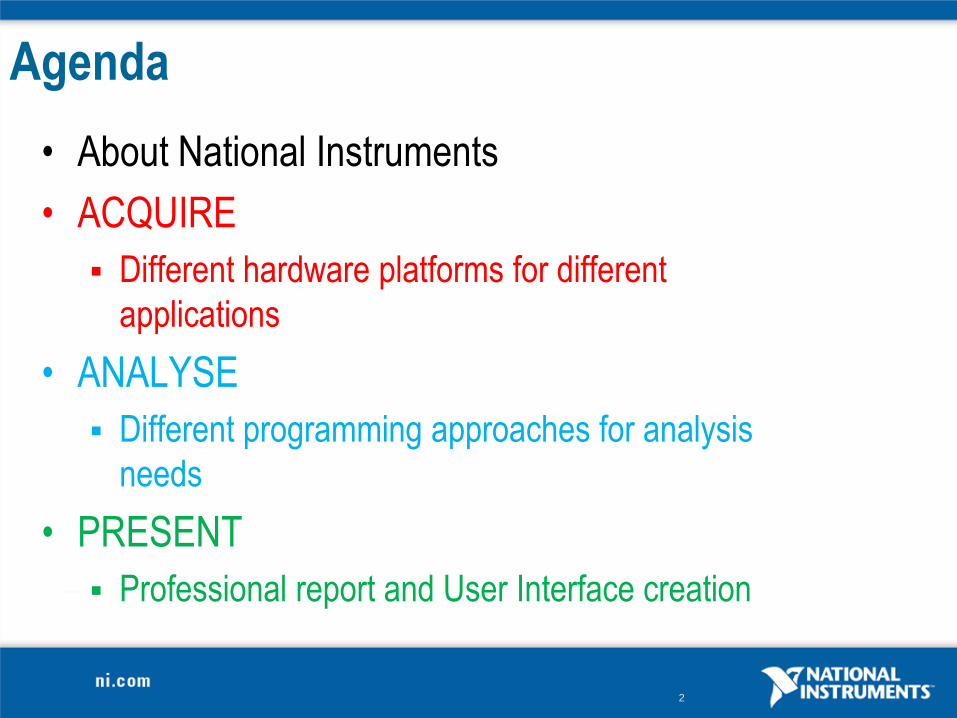
Agenda
• About National Instruments
• ACQUIRE
Different hardware platforms for different
applications
• ANALYSE
Different programming approaches for analysis
needs
• PRESENT
Professional report and User Interface creation
3
NI HQ
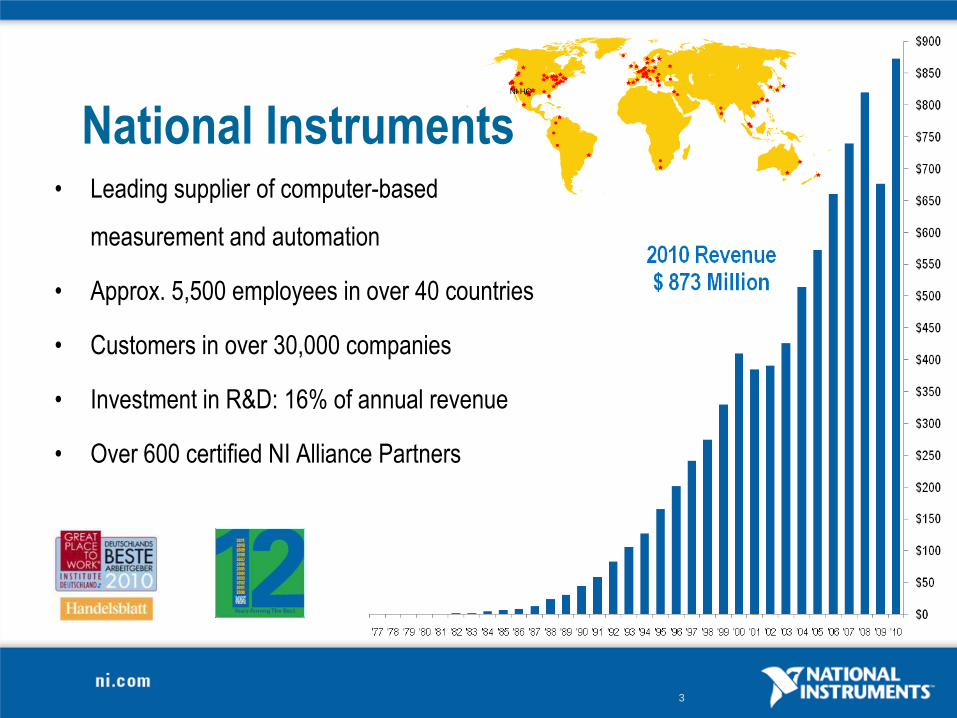
National Instruments• Leading supplier of computer-based
measurement and automation
• Approx. 5,500 employees in over 40 countries
• Customers in over 30,000 companies
• Investment in R&D: 16% of annual revenue
• Over 600 certified NI Alliance Partners
4
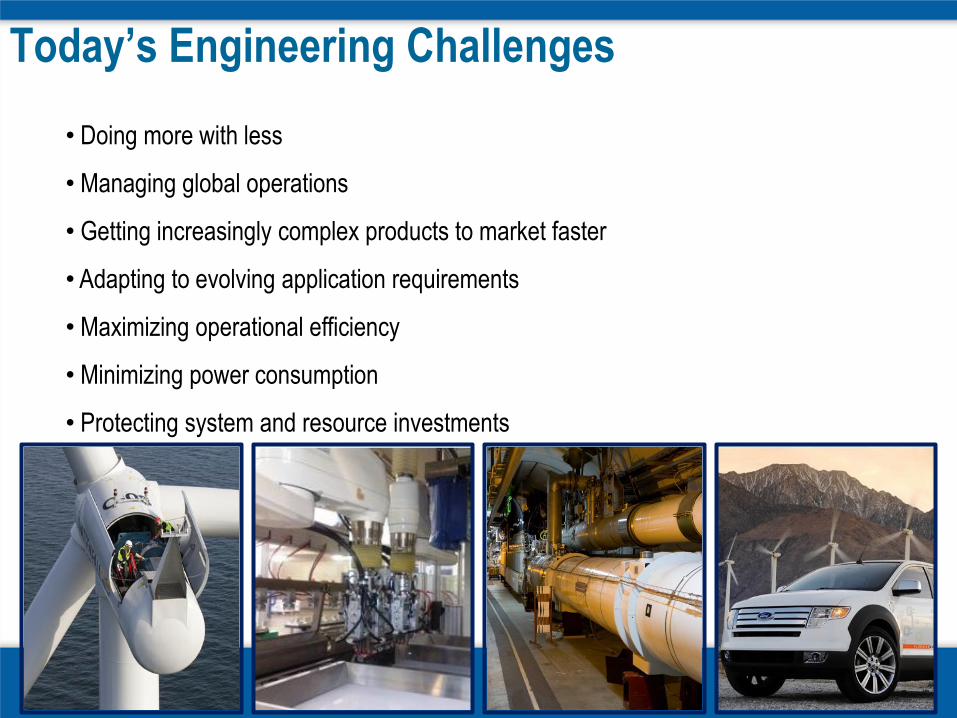
Today’s Engineering Challenges
• Doing more with less
• Managing global operations
• Getting increasingly complex products to market faster
• Adapting to evolving application requirements
• Maximizing operational efficiency
• Minimizing power consumption
• Protecting system and resource investments
5
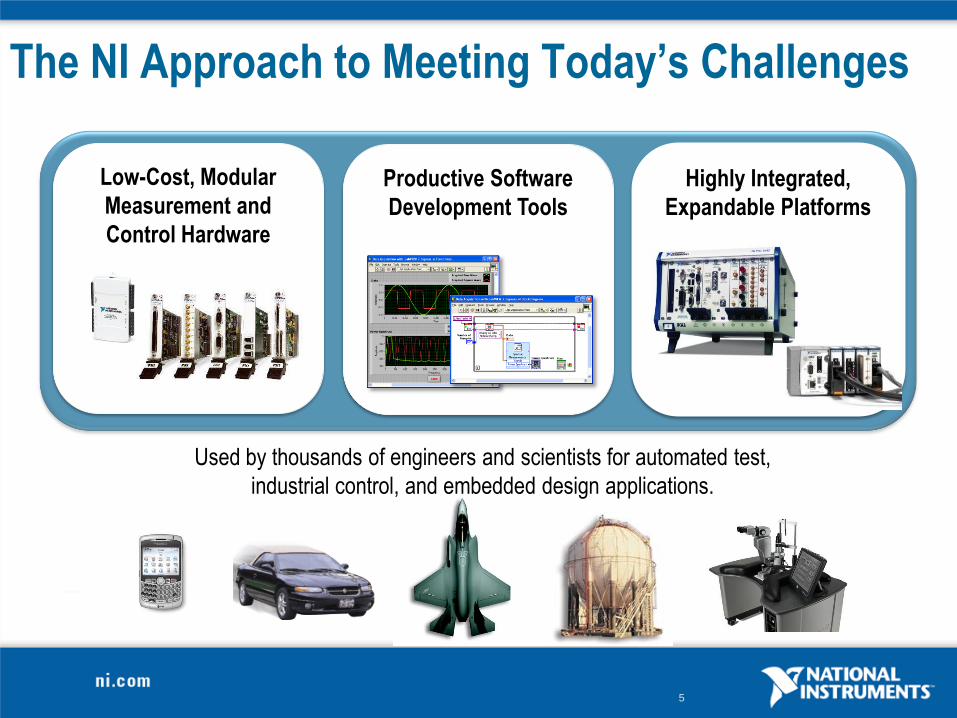
The NI Approach to Meeting Today’s Challenges
Low-Cost, Modular
Measurement and
Control Hardware
Productive Software
Development Tools
Highly Integrated,
Expandable Platforms
Used by thousands of engineers and scientists for automated test,
industrial control, and embedded design applications.
6
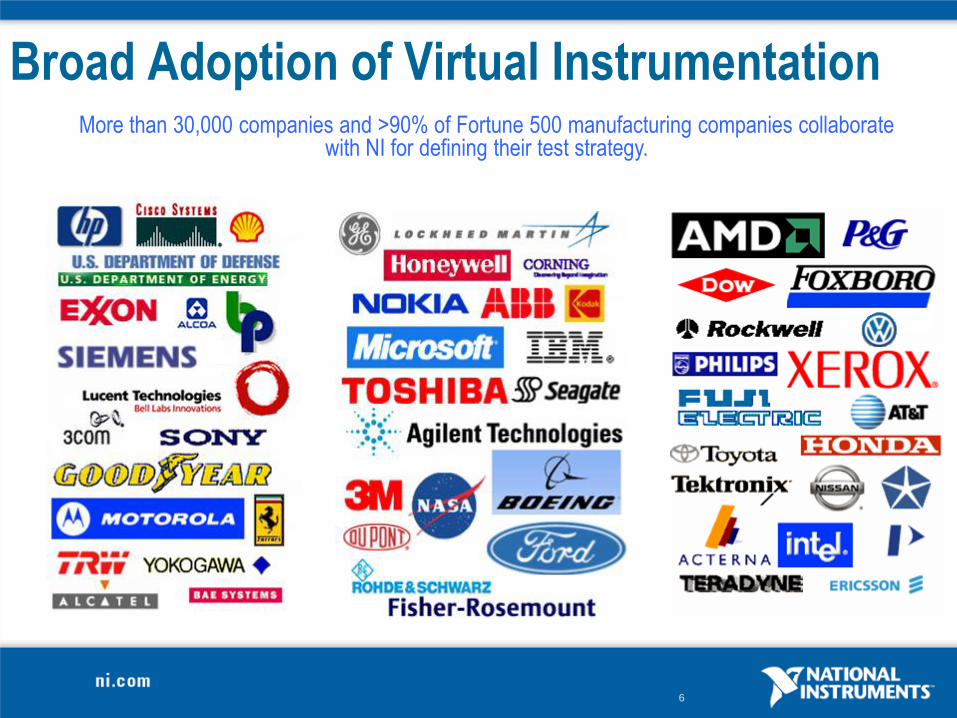
More than 30,000 companies and >90% of Fortune 500 manufacturing companies collaborate with NI for defining their test strategy.
Broad Adoption of Virtual Instrumentation

7
• Ab 20. März 2010:
Ausbrüche an
verschiedenen Stellen
• Ab 14. April Sperrung des
Flugverkehrs in Europa
• Ab wann ist eine sichere
Freigabe wieder möglich?
Eyjafjallajökull
8
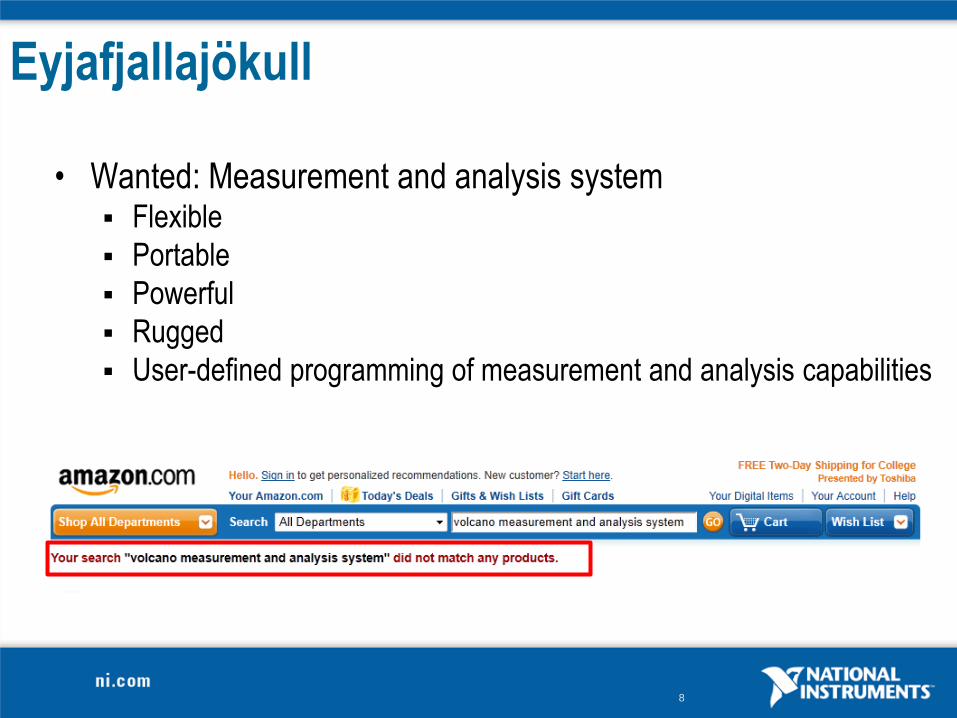
Eyjafjallajökull
• Wanted: Measurement and analysis system Flexible
Portable
Powerful
Rugged
User-defined programming of measurement and analysis capabilities
9
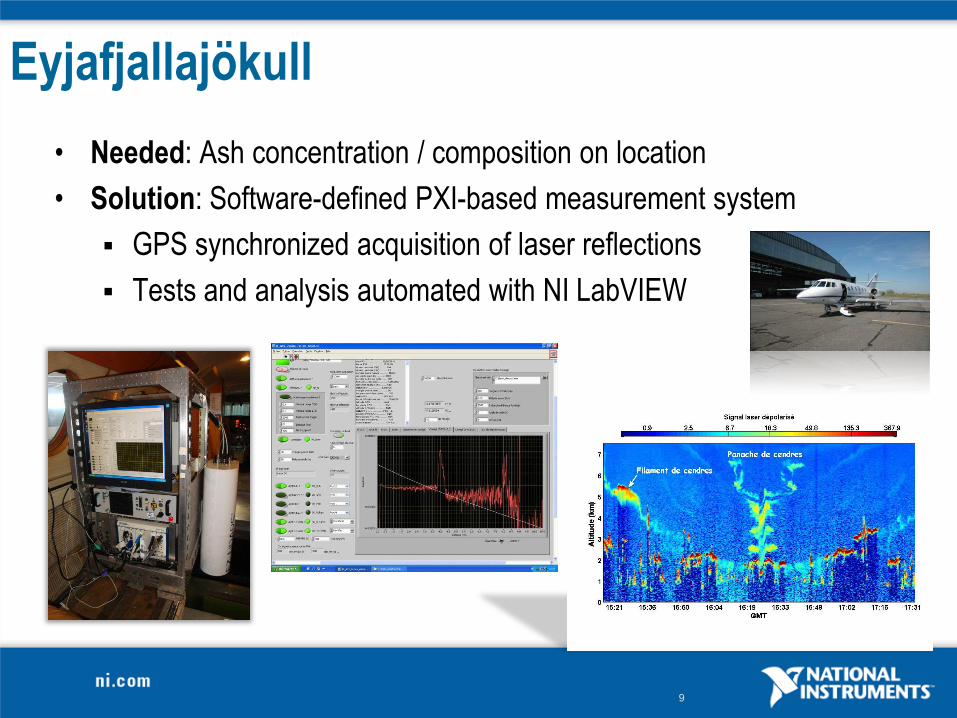
Eyjafjallajökull
• Needed: Ash concentration / composition on location
• Solution: Software-defined PXI-based measurement system
GPS synchronized acquisition of laser reflections
Tests and analysis automated with NI LabVIEW
10
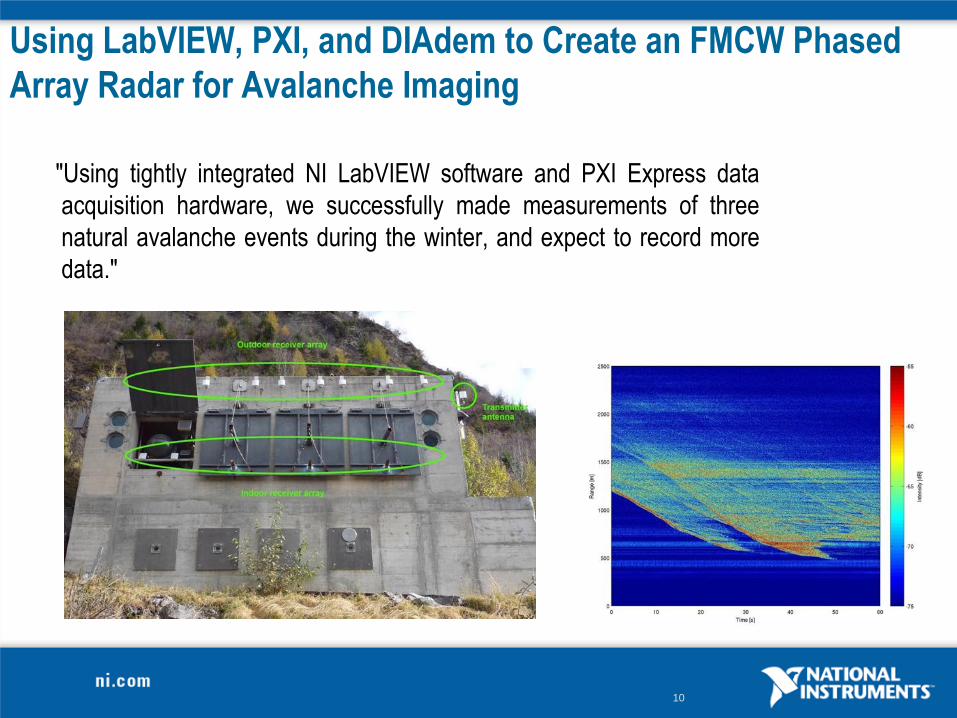
Using LabVIEW, PXI, and DIAdem to Create an FMCW Phased
Array Radar for Avalanche Imaging
"Using tightly integrated NI LabVIEW software and PXI Express data
acquisition hardware, we successfully made measurements of three
natural avalanche events during the winter, and expect to record more
data."
12
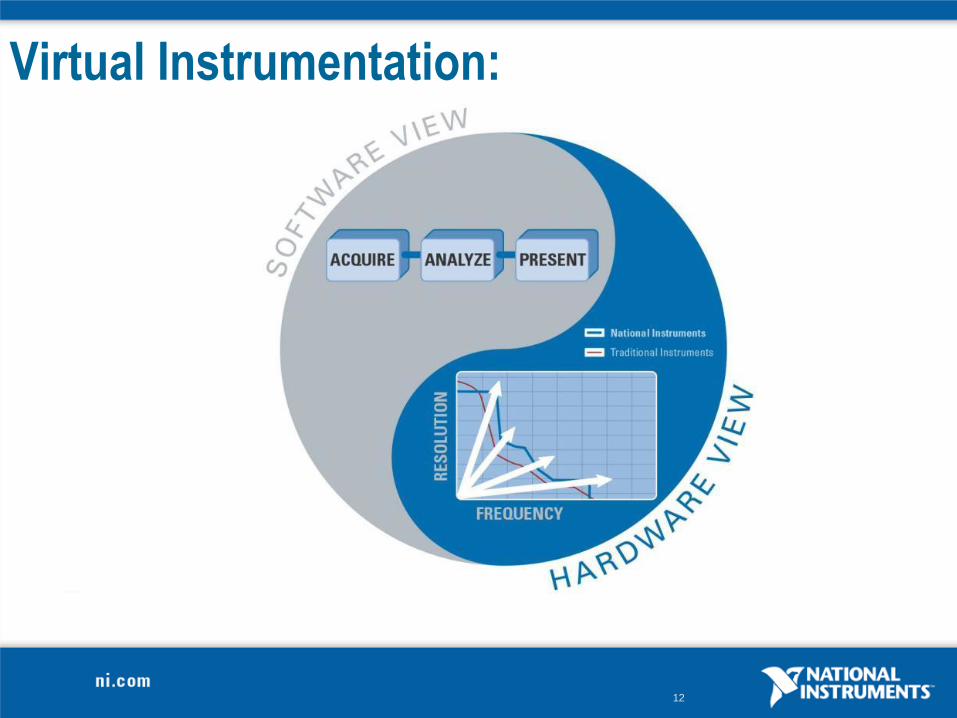
Virtual Instrumentation:
13
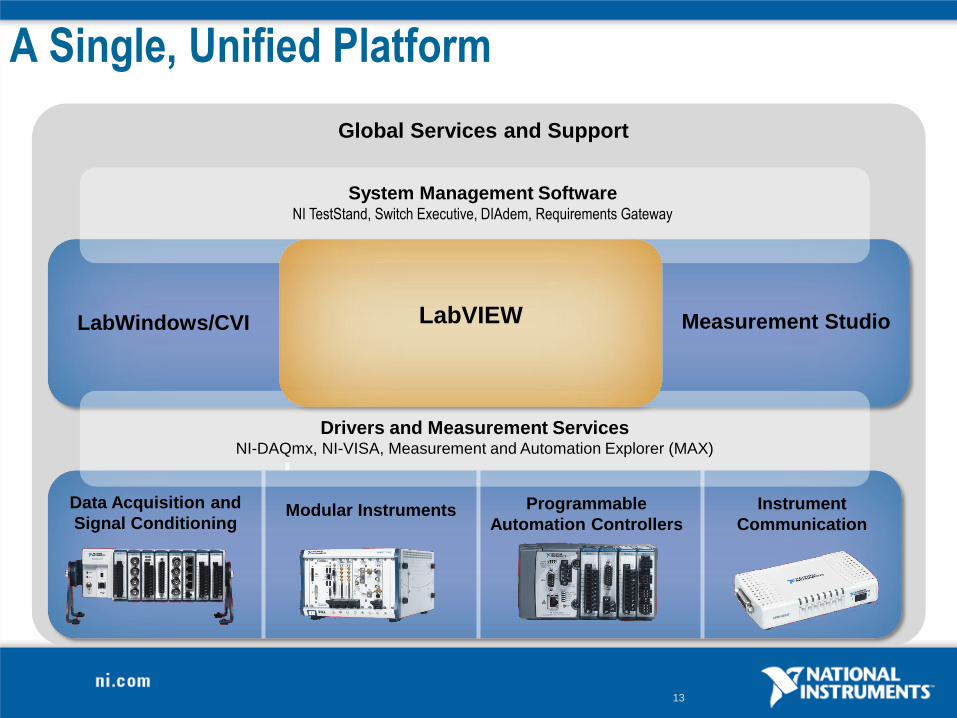
A Single, Unified Platform
Global Services and Support
System Management SoftwareNI TestStand, Switch Executive, DIAdem, Requirements Gateway
LabWindows/CVI Measurement Studio
Drivers and Measurement ServicesNI-DAQmx, NI-VISA, Measurement and Automation Explorer (MAX)
LabVIEW
Instrument
CommunicationModular Instruments Programmable
Automation Controllers
Data Acquisition and
Signal Conditioning
14
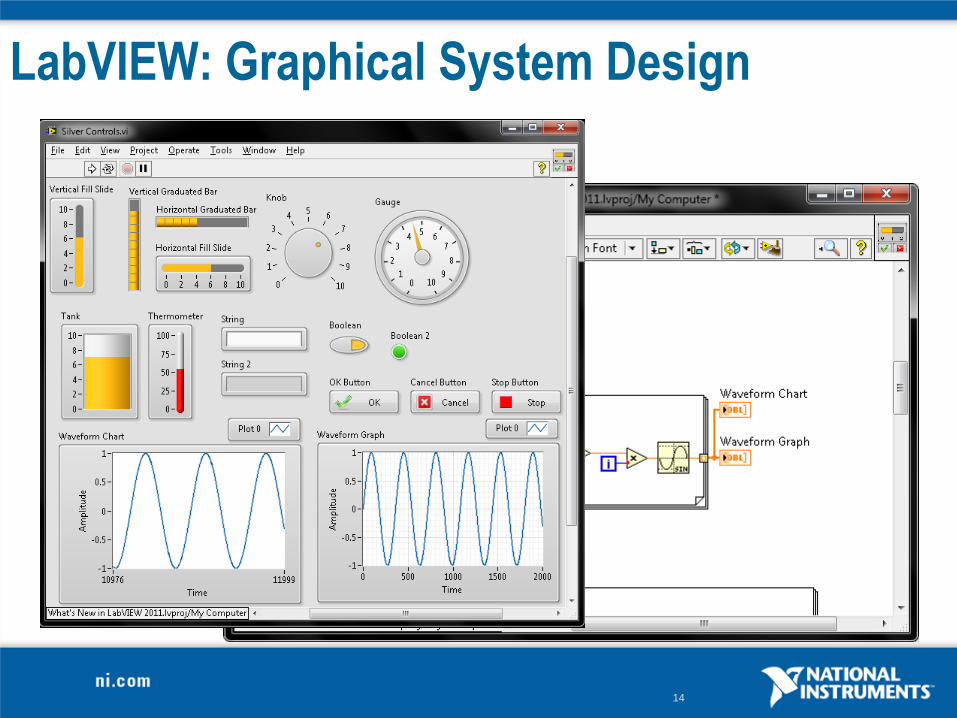
LabVIEW: Graphical System Design
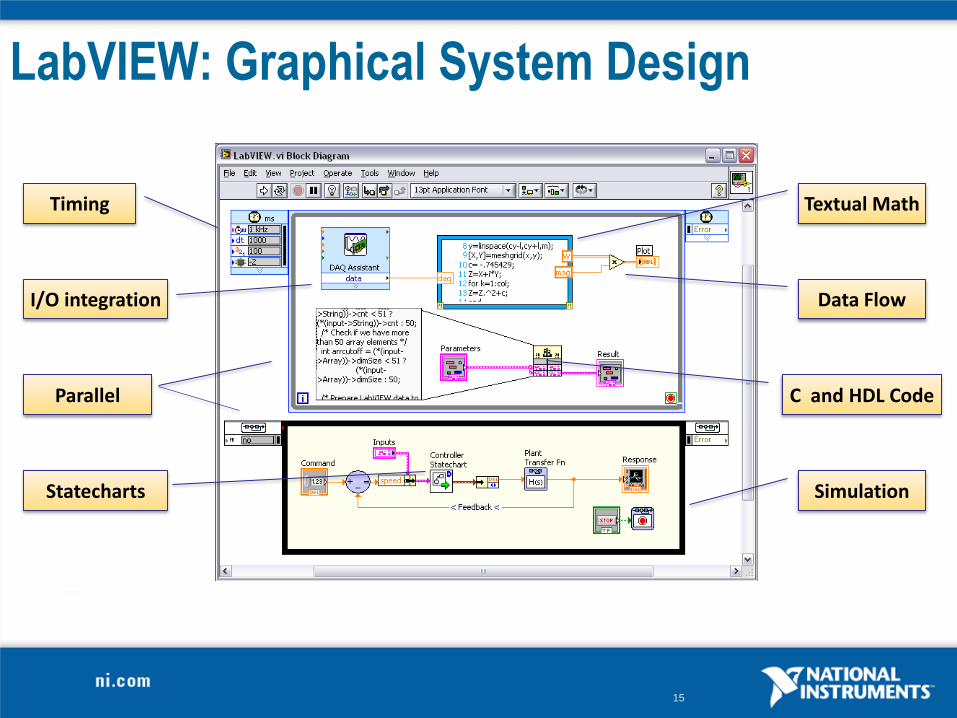
15
LabVIEW: Graphical System Design
Textual Math
Parallel
I/O integration
Statecharts
Timing
Simulation
Data Flow
C and HDL Code
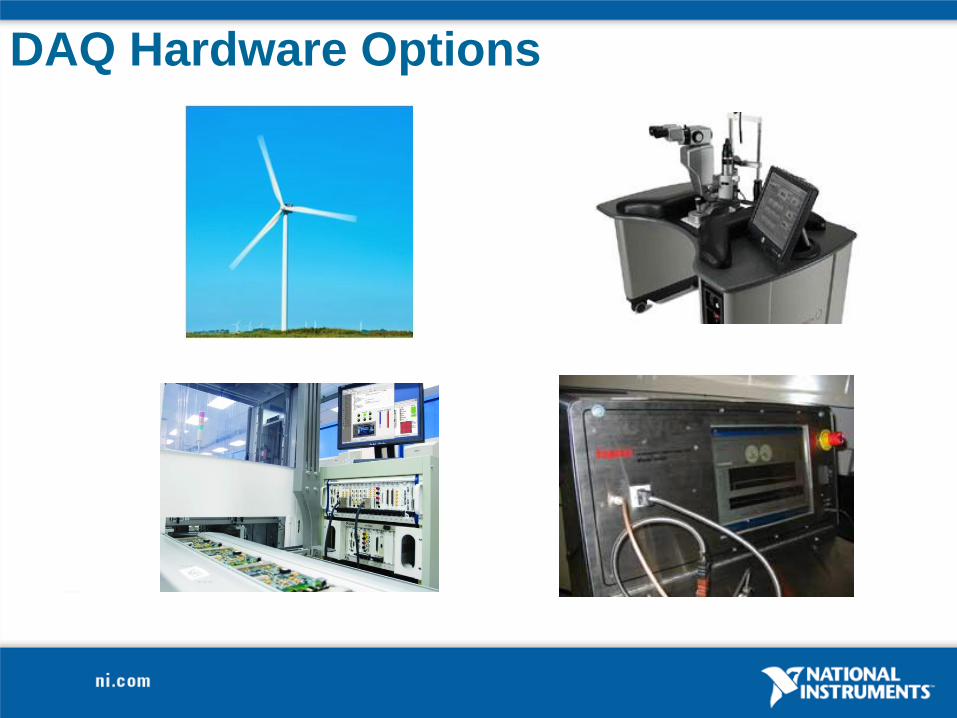
DAQ Hardware Options
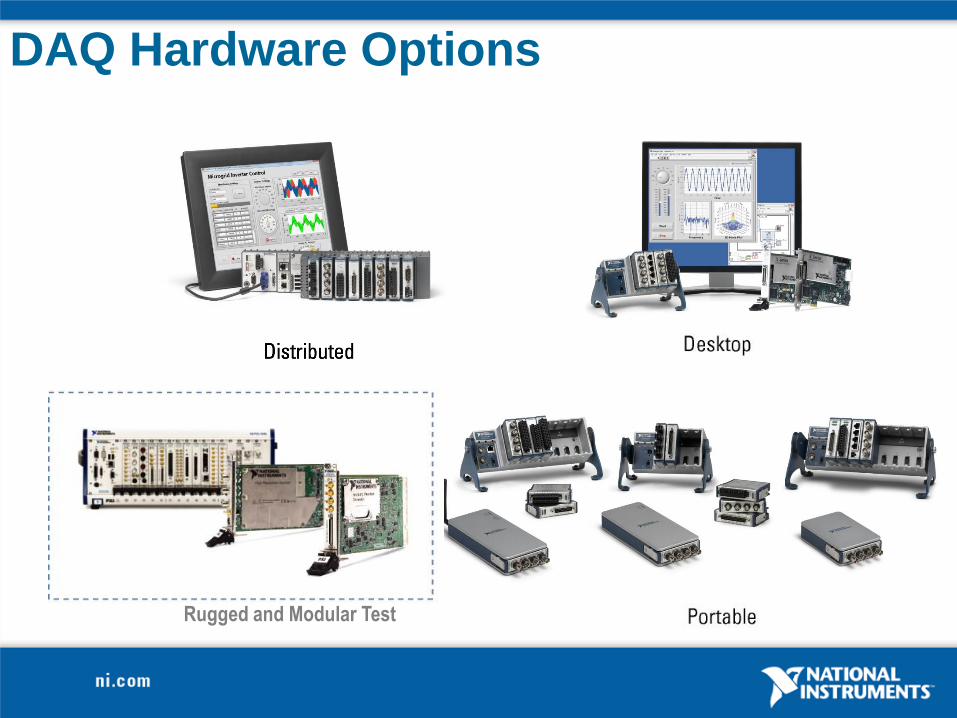
DAQ Hardware Options
Rugged and Modular Test
18
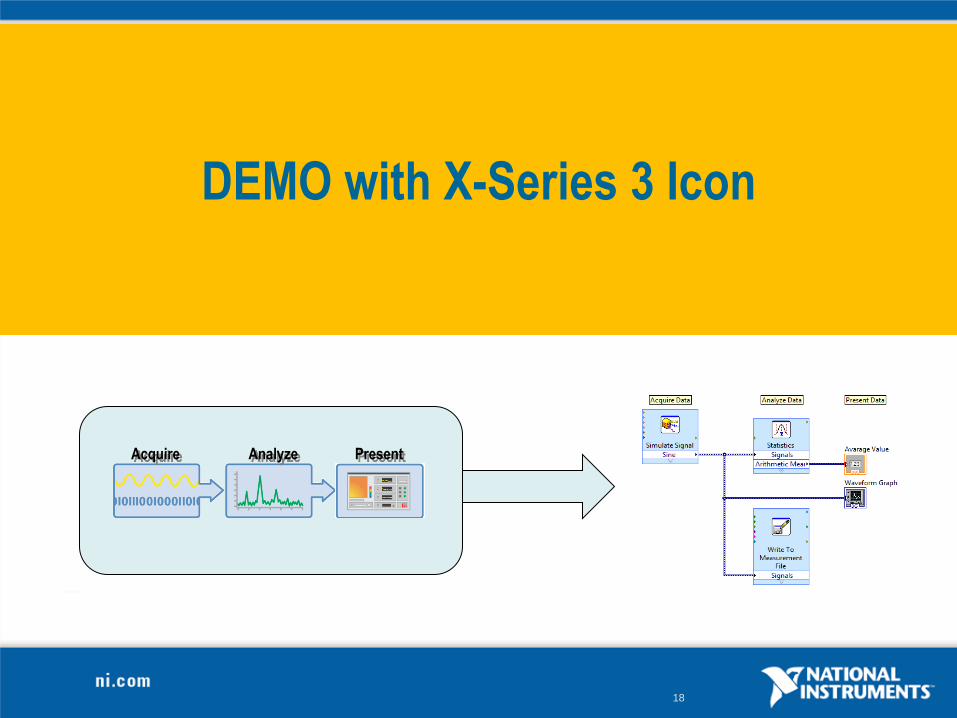
DEMO with X-Series 3 Icon
PresentAnalyzeAcquire
19
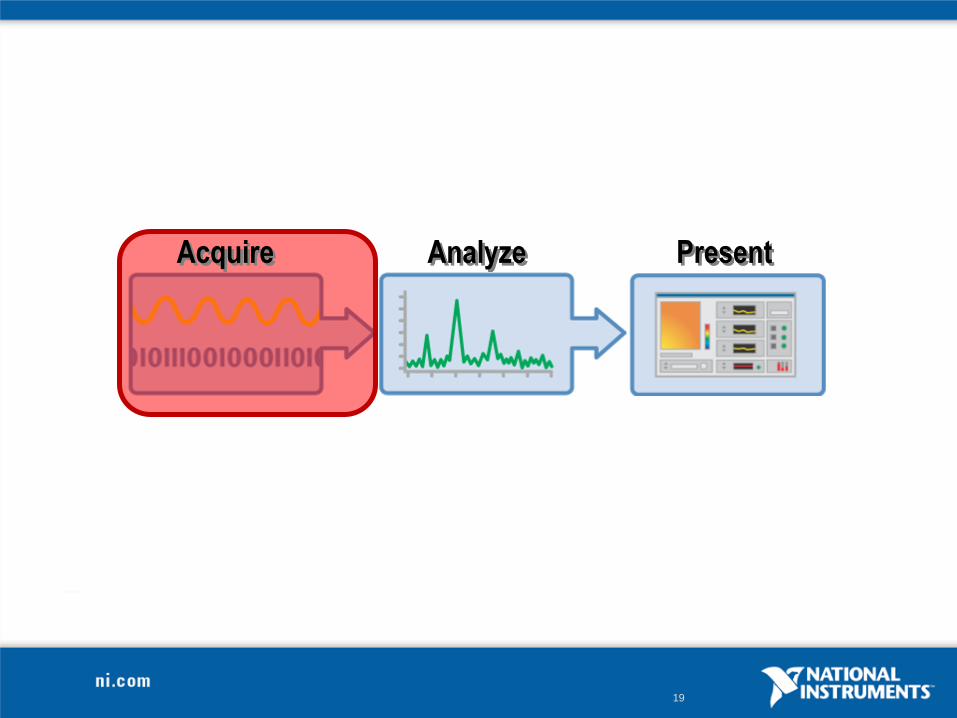
PresentAnalyzeAcquire
20
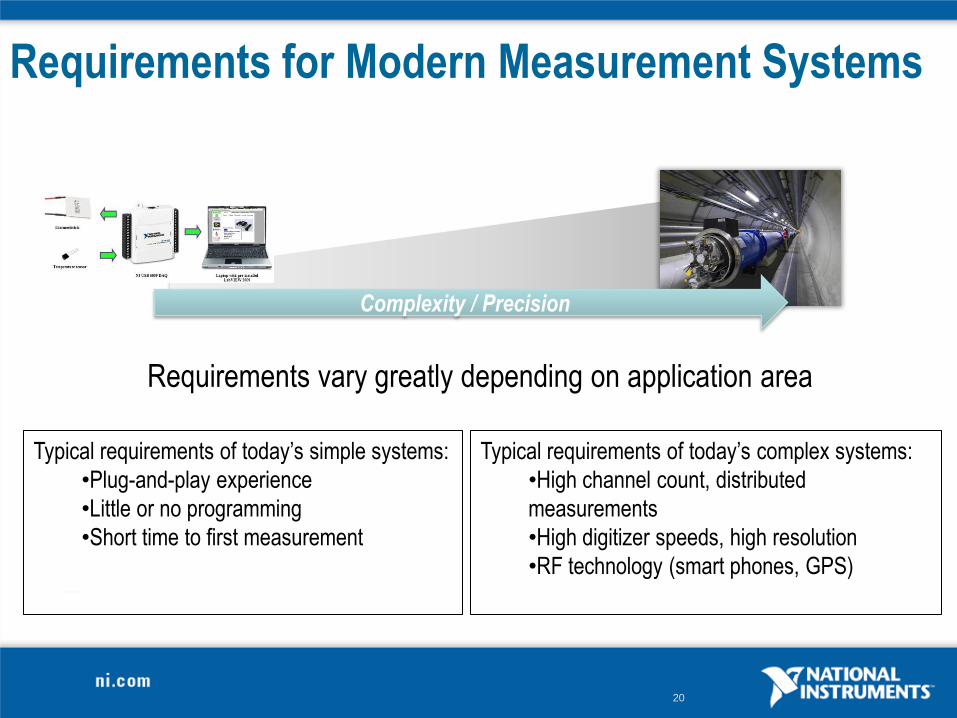
Requirements for Modern Measurement Systems
Requirements vary greatly depending on application area
Complexity / Precision
Typical requirements of today’s complex systems:
•High channel count, distributed
measurements
•High digitizer speeds, high resolution
•RF technology (smart phones, GPS)
Typical requirements of today’s simple systems:
•Plug-and-play experience
•Little or no programming
•Short time to first measurement
21
22
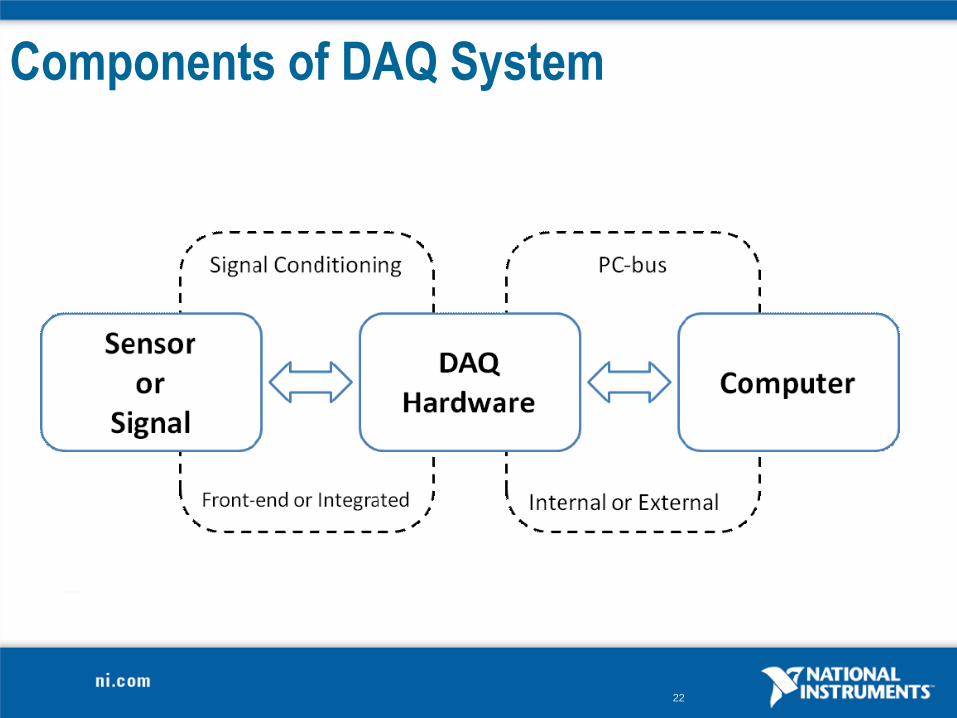
Components of DAQ System
23
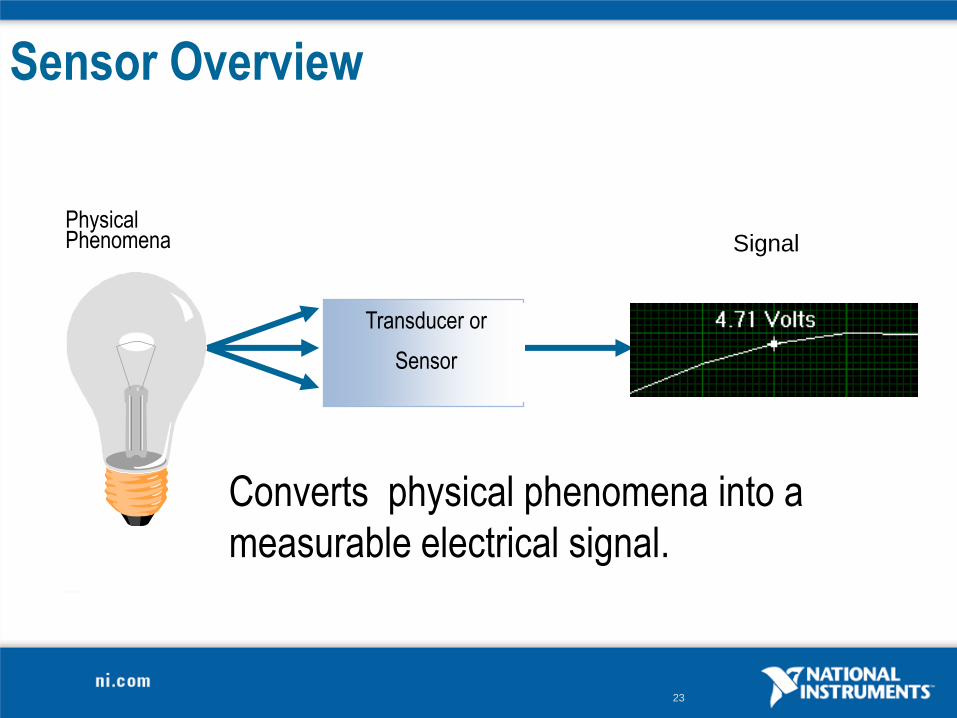
Sensor Overview
Converts physical phenomena into a
measurable electrical signal.
SignalPhysicalPhenomena
Transducer or
Sensor
24
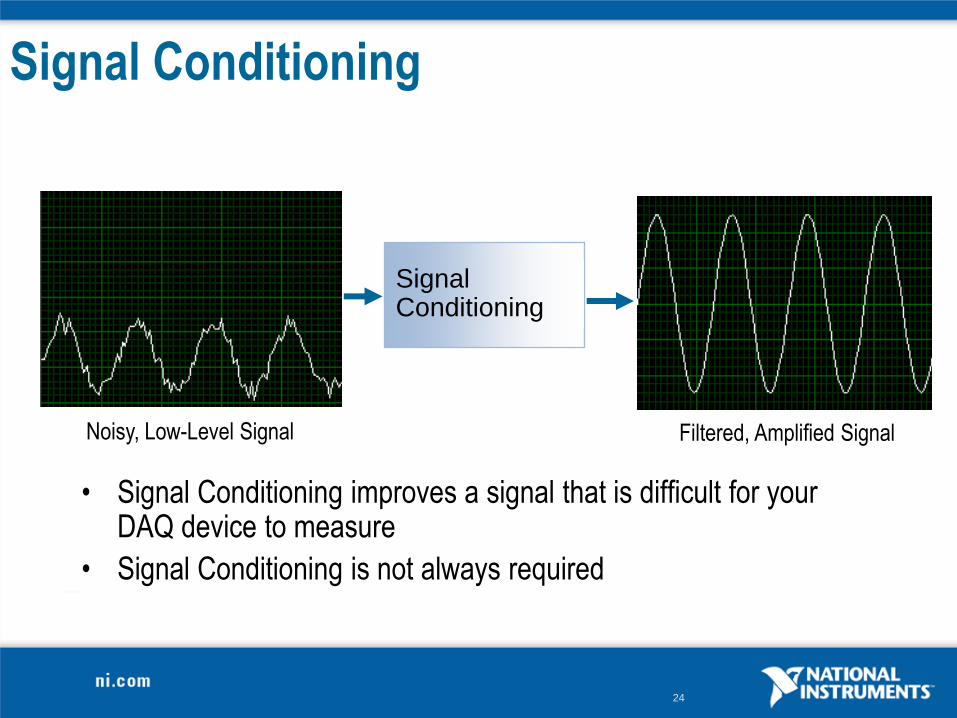
Signal Conditioning
• Signal Conditioning improves a signal that is difficult for your DAQ device to measure
• Signal Conditioning is not always required
Noisy, Low-Level Signal Filtered, Amplified Signal
Signal Conditioning
25
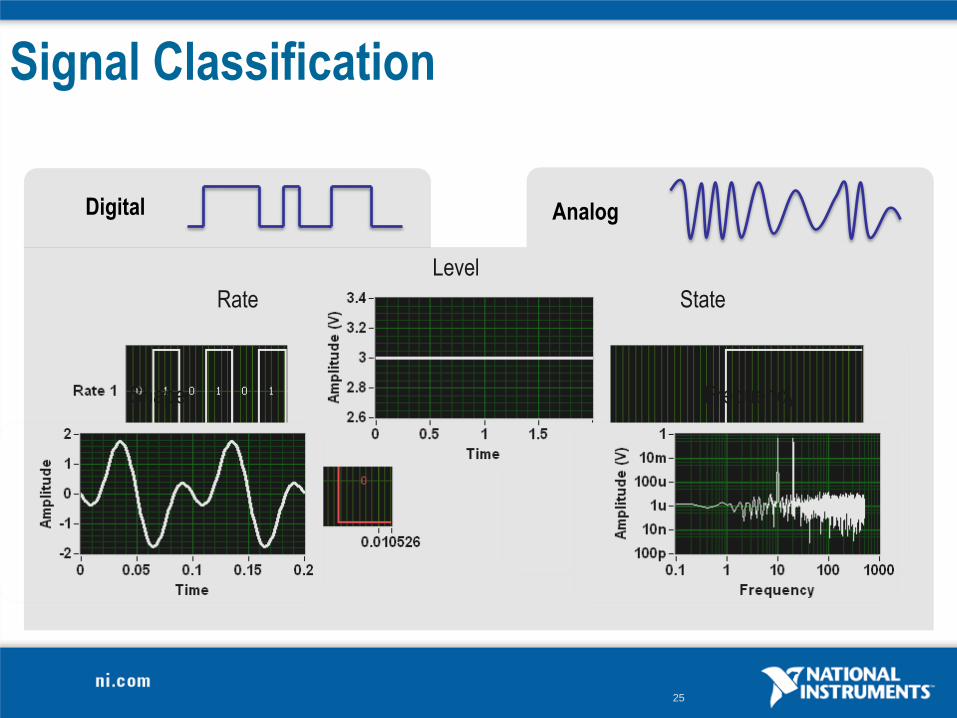
Signal Classification
Digital Analog
Rate State
Shape
Level
Frequency
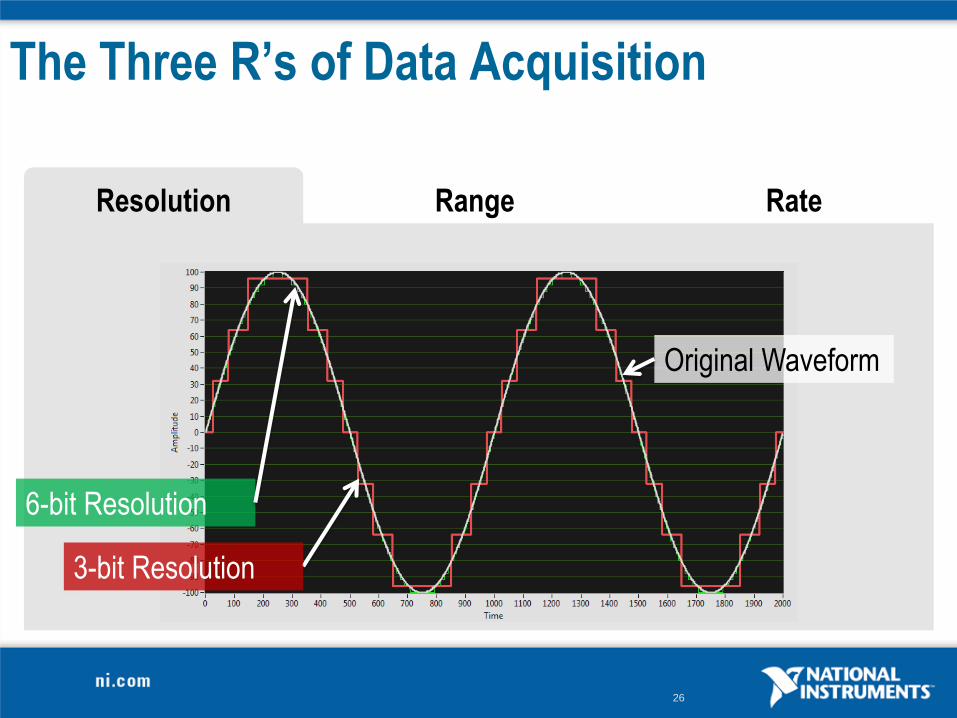
26
The Three R’s of Data Acquisition
Resolution Range Rate
3-bit Resolution
Original Waveform
6-bit Resolution
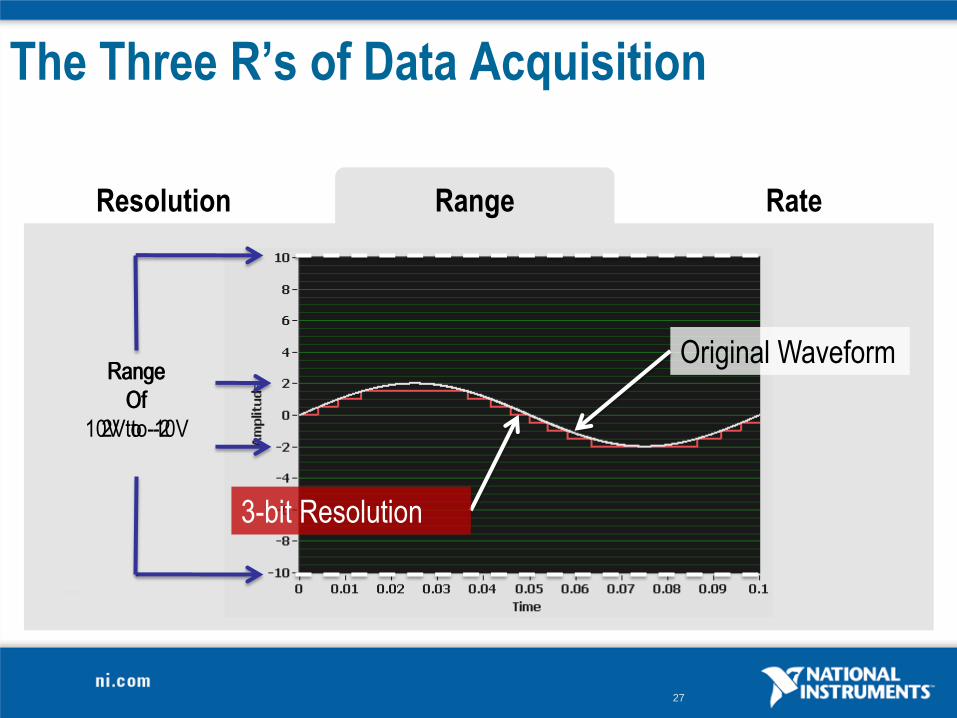
27
The Three R’s of Data Acquisition
Resolution Range Rate
3-bit Resolution
Original WaveformRange
Of
10V to -10V
Range
Of
2V to -2
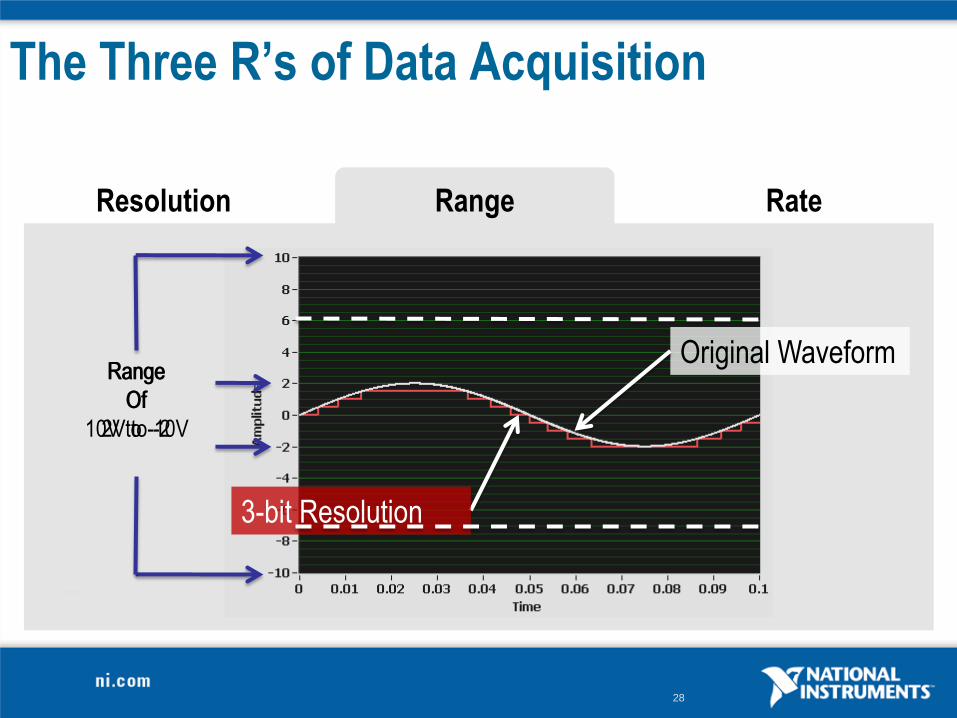
28
The Three R’s of Data Acquisition
Resolution Range Rate
3-bit Resolution
Original WaveformRange
Of
10V to -10V
Range
Of
2V to -2
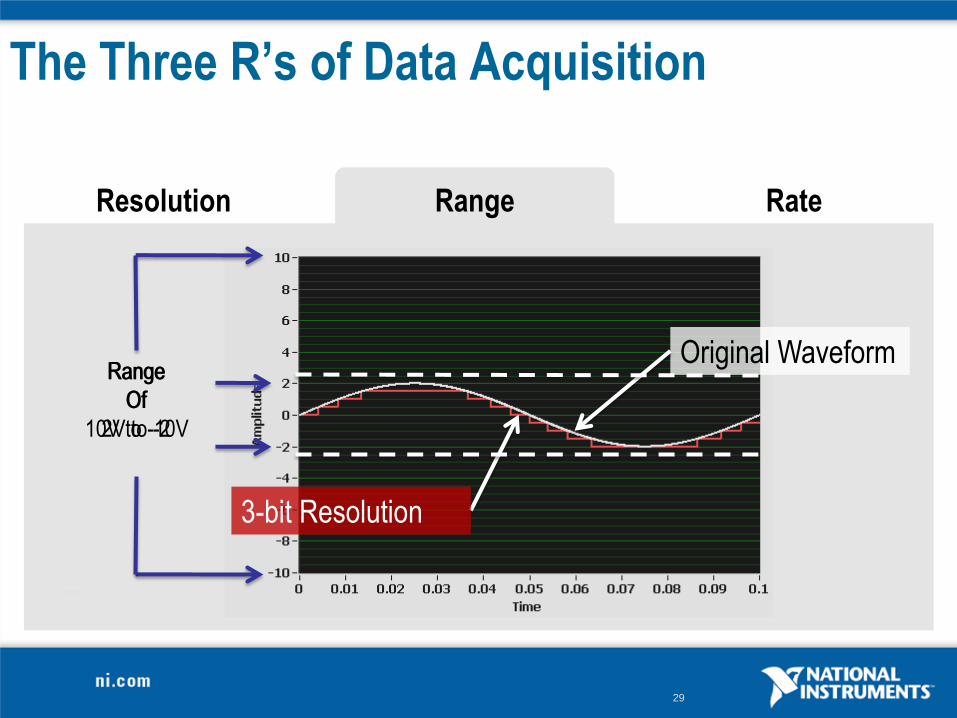
29
The Three R’s of Data Acquisition
Resolution Range Rate
3-bit Resolution
Original WaveformRange
Of
10V to -10V
Range
Of
2V to -2
30
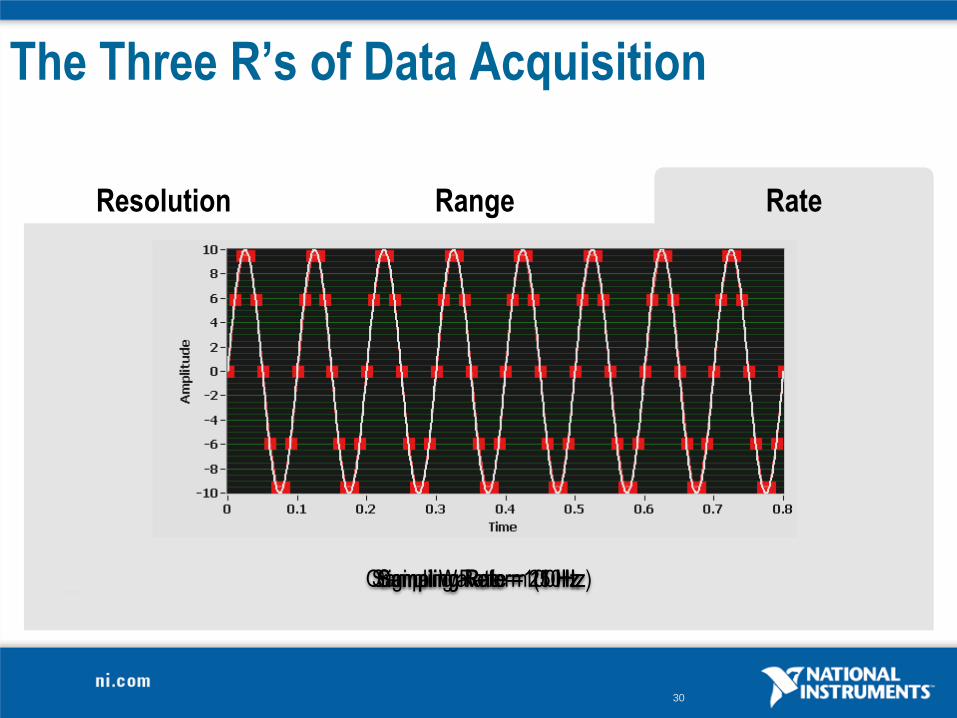
The Three R’s of Data Acquisition
Resolution Range Rate
Original Waveform (10Hz)Sampling Rate = 11 HzSampling Rate = 25 HzSampling Rate = 100 Hz
31
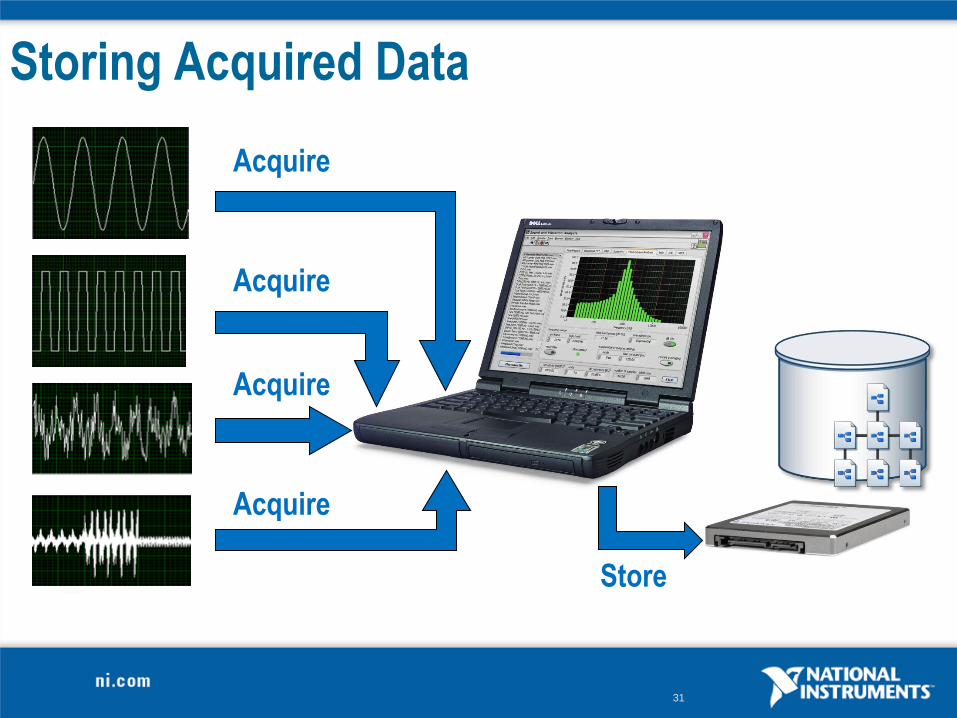
Storing Acquired Data
Acquire
Acquire
Acquire
Acquire
Store
32
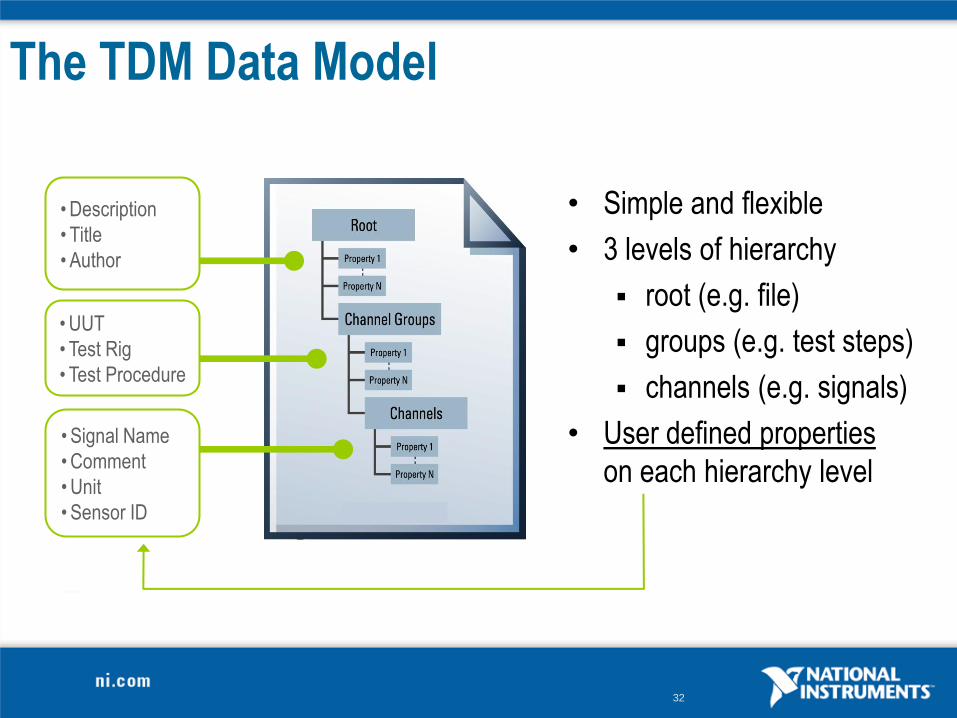
The TDM Data Model
• Simple and flexible
• 3 levels of hierarchy
root (e.g. file)
groups (e.g. test steps)
channels (e.g. signals)
• User defined properties
on each hierarchy level
• Description
• Title
• Author
• UUT
• Test Rig
• Test Procedure
• Signal Name
• Comment
• Unit
• Sensor ID
33
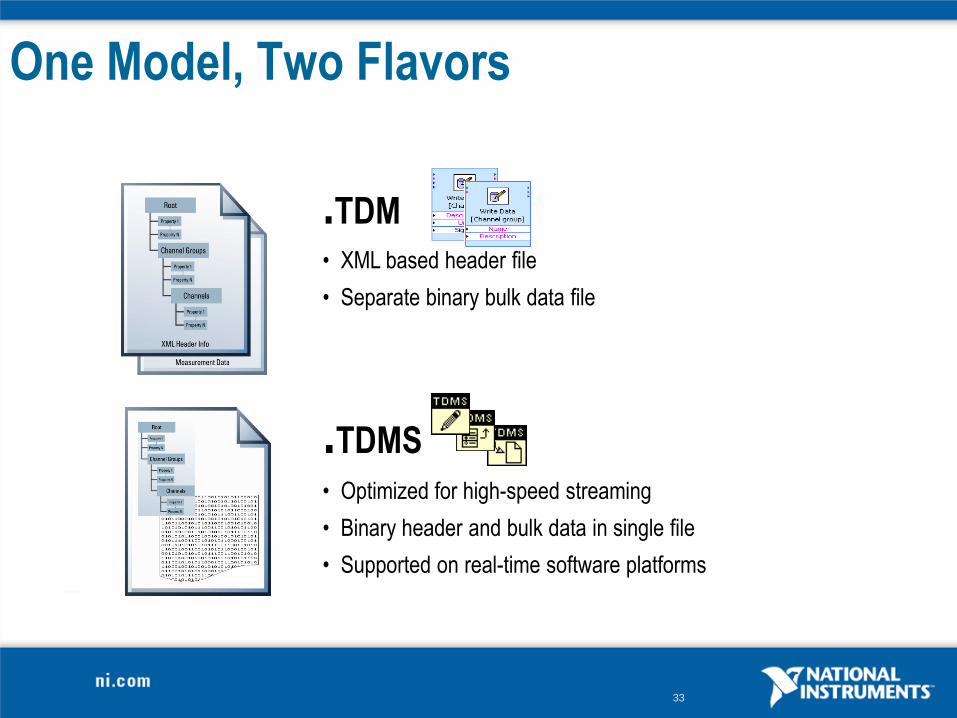
One Model, Two Flavors
.TDM
• XML based header file
• Separate binary bulk data file
.TDMS
• Optimized for high-speed streaming
• Binary header and bulk data in single file
• Supported on real-time software platforms
34
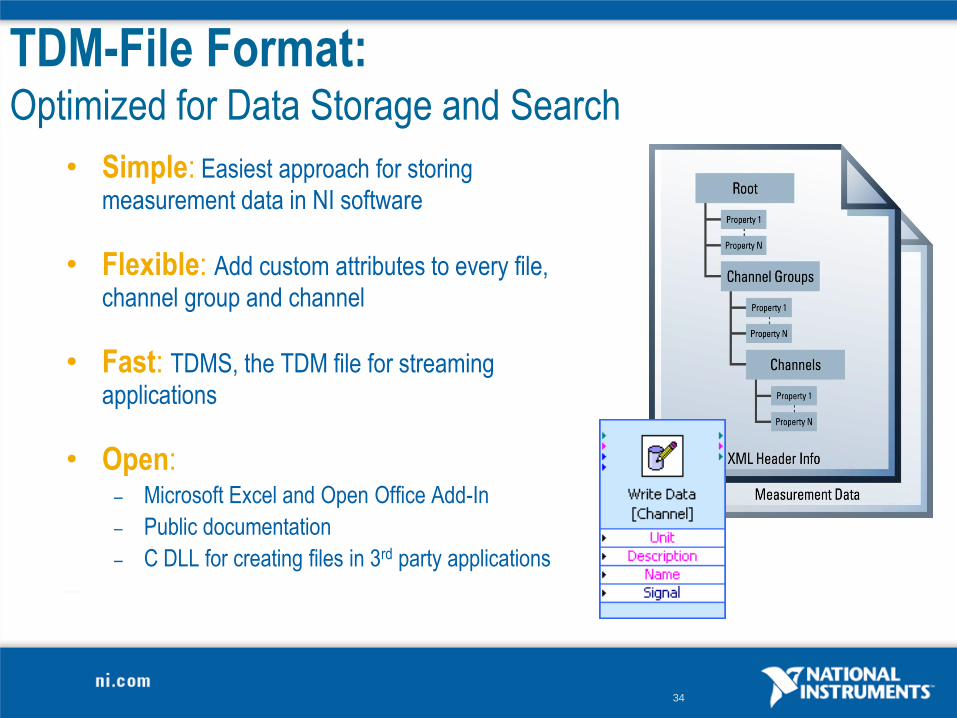
TDM-File Format: Optimized for Data Storage and Search
• Simple: Easiest approach for storing
measurement data in NI software
• Flexible: Add custom attributes to every file,
channel group and channel
• Fast: TDMS, the TDM file for streaming
applications
• Open:– Microsoft Excel and Open Office Add-In
– Public documentation
– C DLL for creating files in 3rd party applications
35
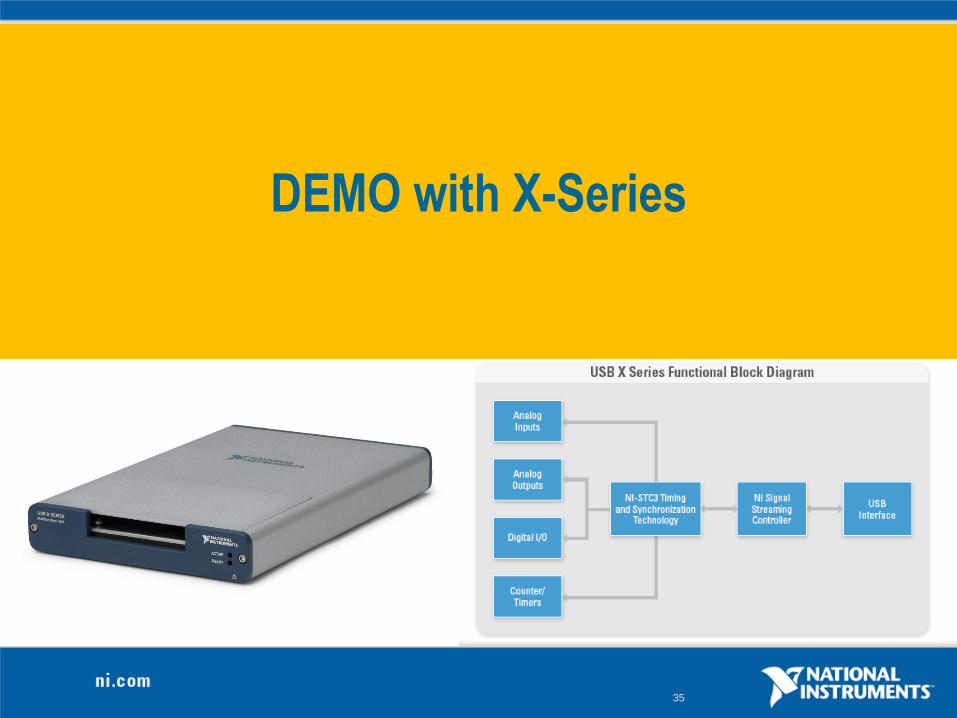
DEMO with X-Series
36
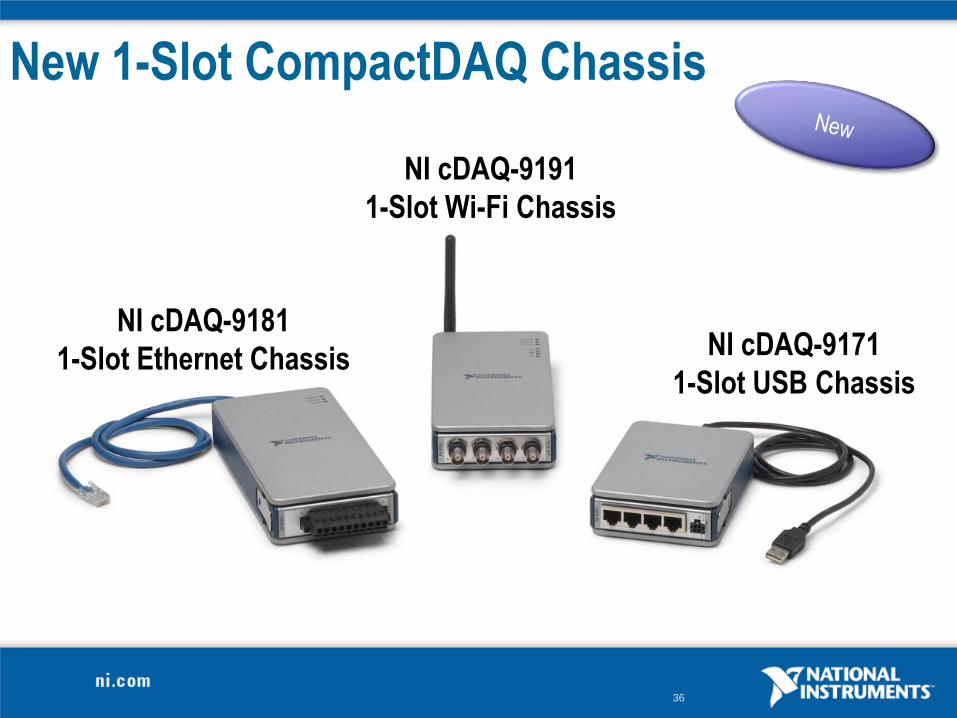
New 1-Slot CompactDAQ Chassis
NI cDAQ-9181
1-Slot Ethernet Chassis NI cDAQ-9171
1-Slot USB Chassis
NI cDAQ-9191
1-Slot Wi-Fi Chassis
37
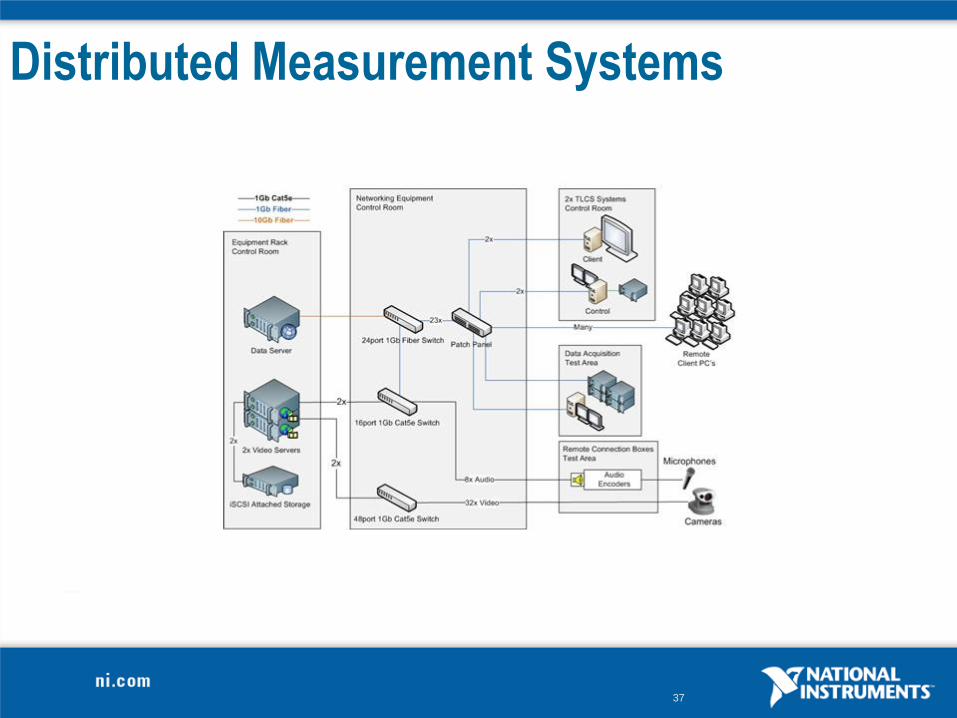
Distributed Measurement Systems
38
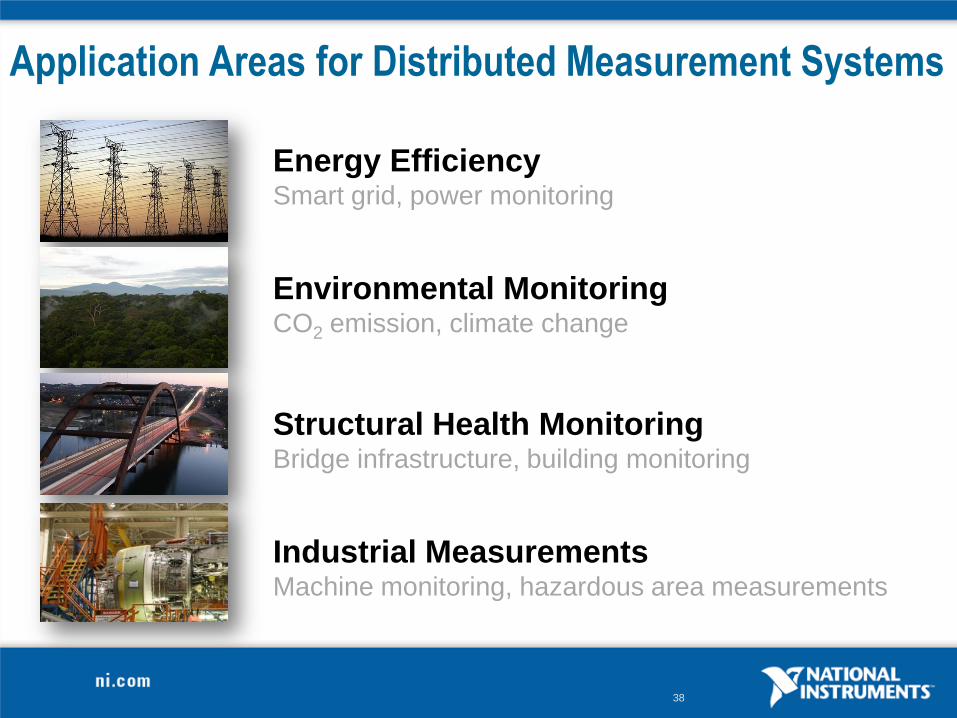
Application Areas for Distributed Measurement Systems
Energy EfficiencySmart grid, power monitoring
Environmental MonitoringCO2 emission, climate change
Structural Health Monitoring Bridge infrastructure, building monitoring
Industrial Measurements Machine monitoring, hazardous area measurements
39
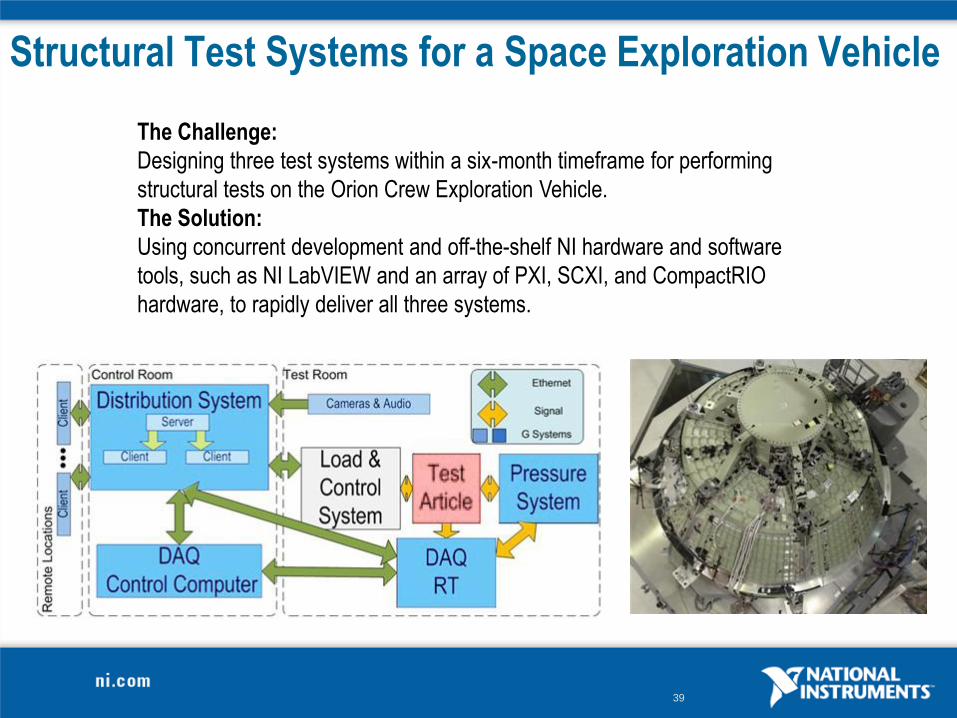
Structural Test Systems for a Space Exploration Vehicle
The Challenge:
Designing three test systems within a six-month timeframe for performing
structural tests on the Orion Crew Exploration Vehicle.
The Solution:
Using concurrent development and off-the-shelf NI hardware and software
tools, such as NI LabVIEW and an array of PXI, SCXI, and CompactRIO
hardware, to rapidly deliver all three systems.
40
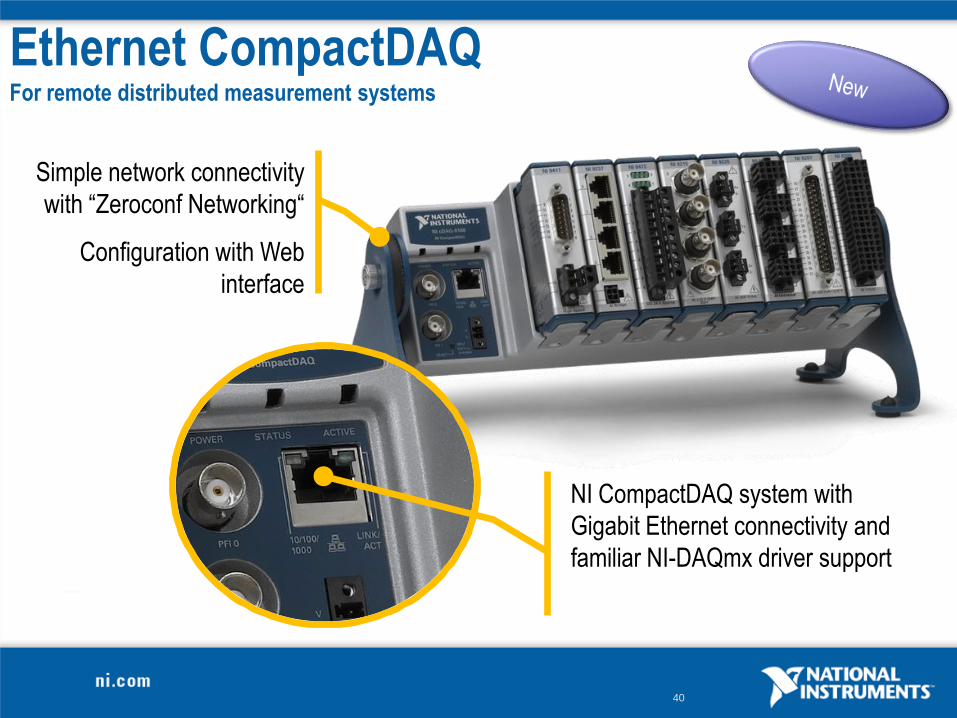
Ethernet CompactDAQFor remote distributed measurement systems
NI CompactDAQ system with
Gigabit Ethernet connectivity and
familiar NI-DAQmx driver support
Simple network connectivity
with “Zeroconf Networking“
Configuration with Web
interface
41
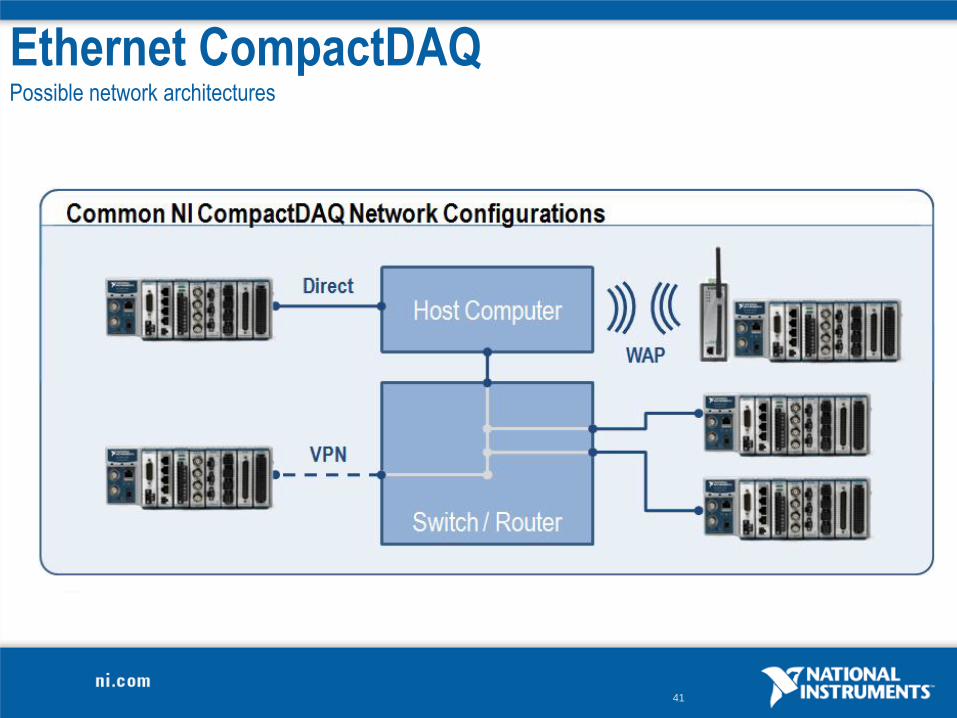
Ethernet CompactDAQPossible network architectures
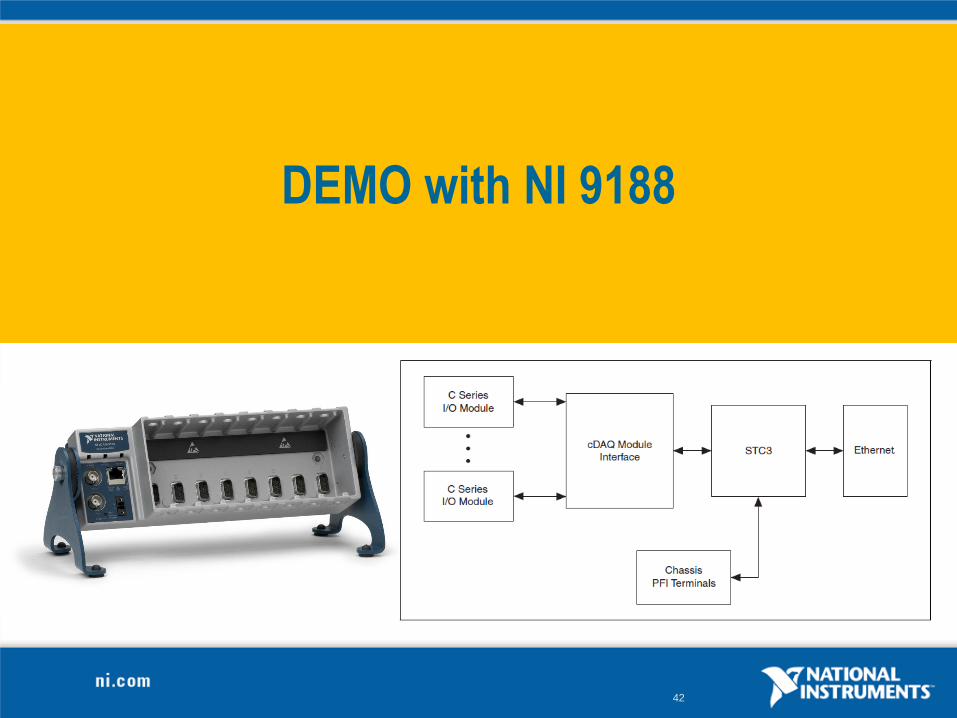
42
DEMO with NI 9188
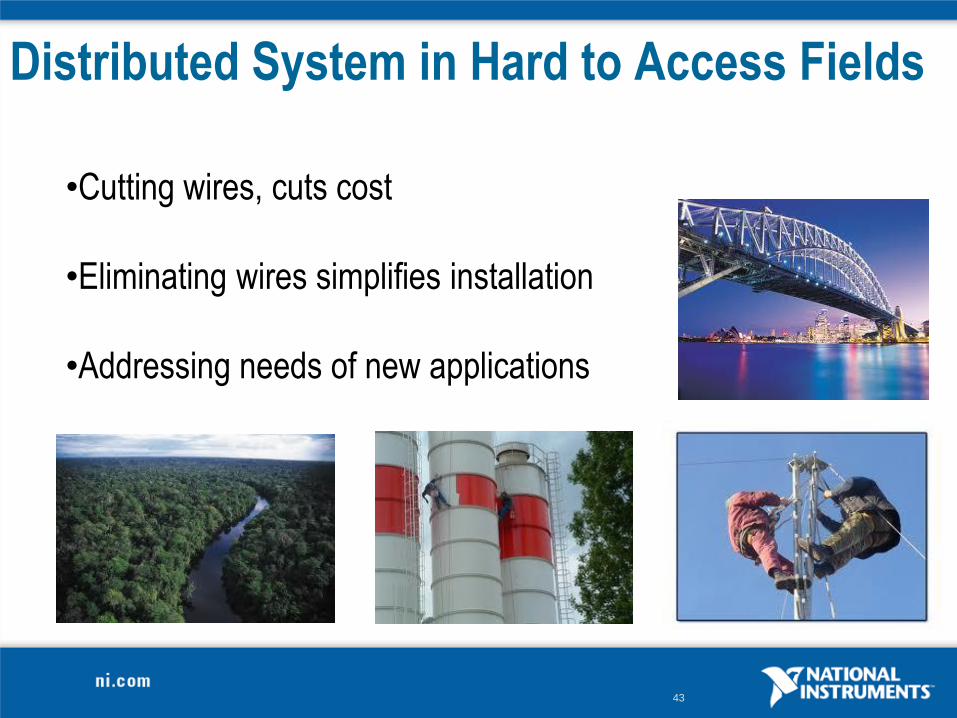
43
Distributed System in Hard to Access Fields
•Cutting wires, cuts cost
•Eliminating wires simplifies installation
•Addressing needs of new applications

44
Biofuels from Algae
• Algae converts sunshine into chemical
energy
• More efficient (water and land) than
crop-based biofuels

45
Biofuels from Algae
• Algae converts sunshine into chemical
energy
• More efficient (water and land) than
crop-based biofuels
“The newly released WSN product family combines many attractive features …wireless
networking, low power consumption, LabVIEW compatibility, and a flexible IO portfolio…”
46
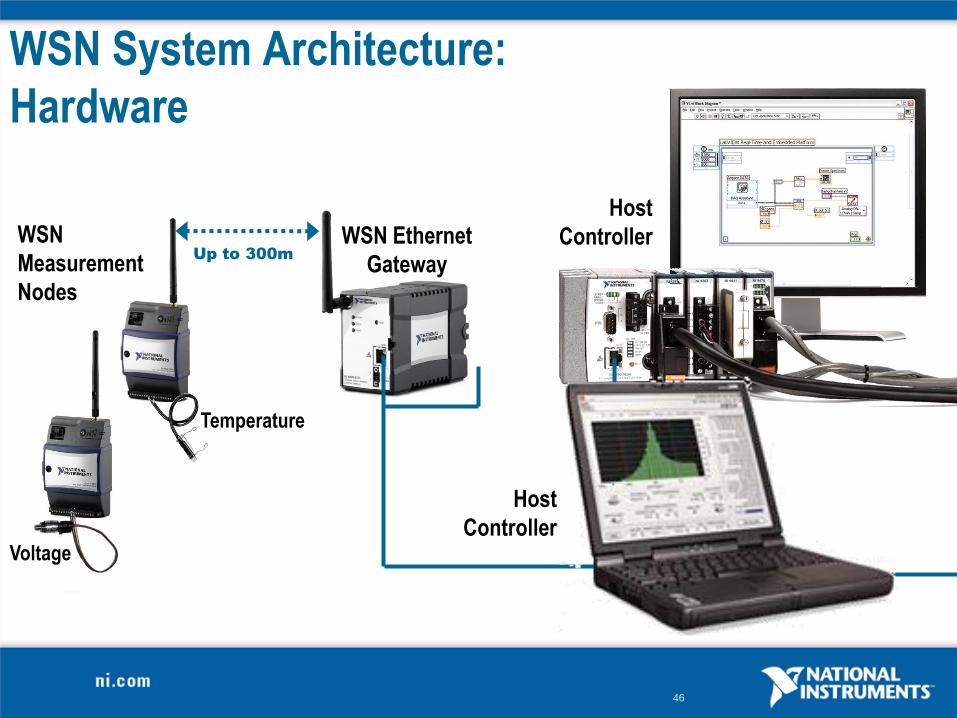
WSN System Architecture:
Hardware
WSN Ethernet
Gateway
Voltage
Temperature
Host
Controller
Up to 300m
WSN
Measurement
Nodes
Host
Controller
47
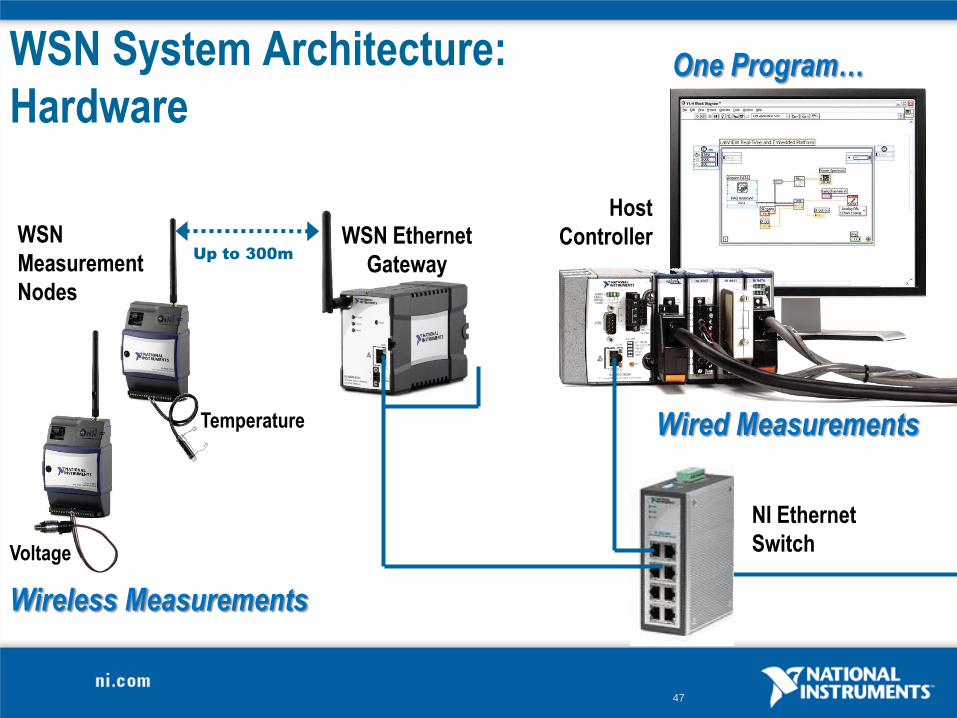
WSN System Architecture:
Hardware
WSN Ethernet
Gateway
Voltage
Temperature
NI Ethernet
Switch
Wired Measurements
Wireless Measurements
One Program…
Up to 300m
WSN
Measurement
Nodes
Host
Controller
48
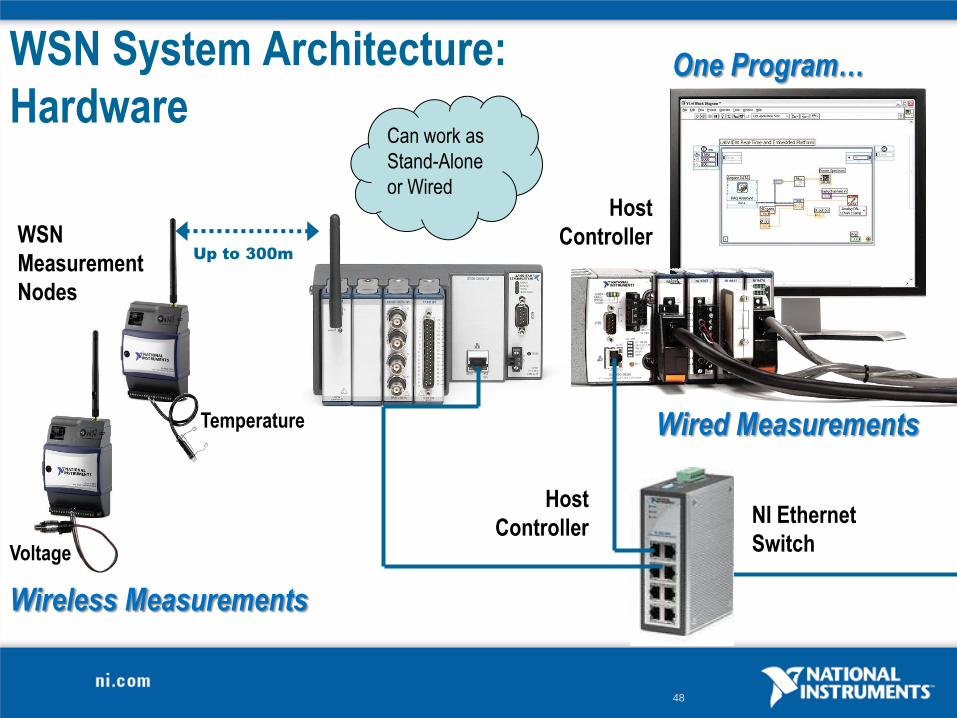
WSN System Architecture:
Hardware
WSN Ethernet
Gateway
Voltage
Temperature
Host
ControllerNI Ethernet
Switch
Wired Measurements
Wireless Measurements
One Program…
Up to 300m
WSN
Measurement
Nodes
Host
Controller
Can work as
Stand-Alone
or Wired
49
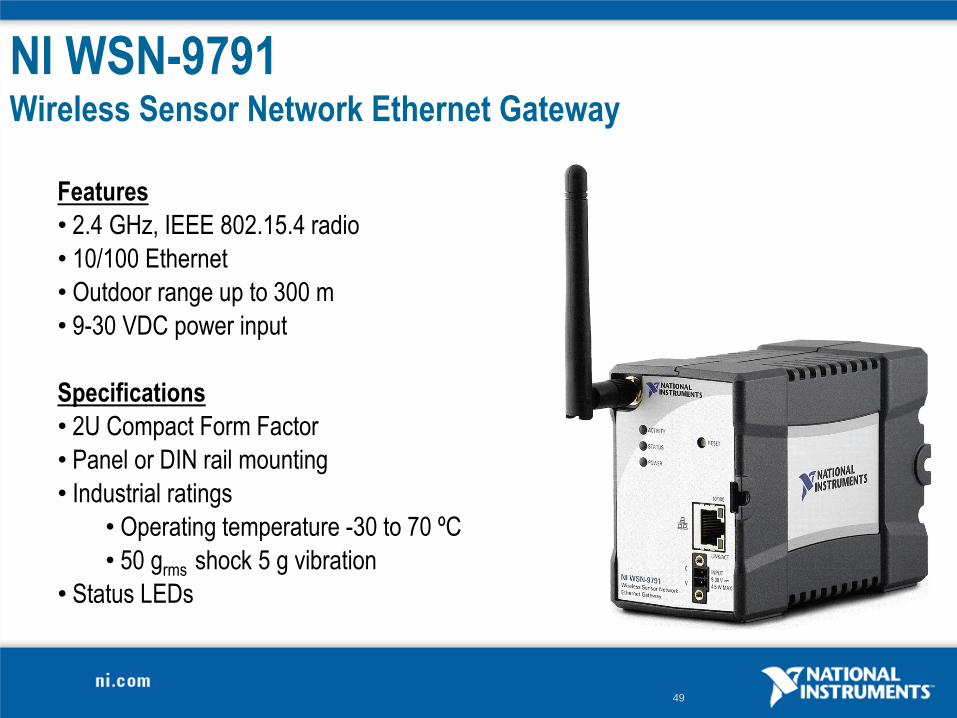
NI WSN-9791Wireless Sensor Network Ethernet Gateway
Features
• 2.4 GHz, IEEE 802.15.4 radio
• 10/100 Ethernet
• Outdoor range up to 300 m
• 9-30 VDC power input
Specifications
• 2U Compact Form Factor
• Panel or DIN rail mounting
• Industrial ratings
• Operating temperature -30 to 70 ºC
• 50 grms shock 5 g vibration
• Status LEDs
50
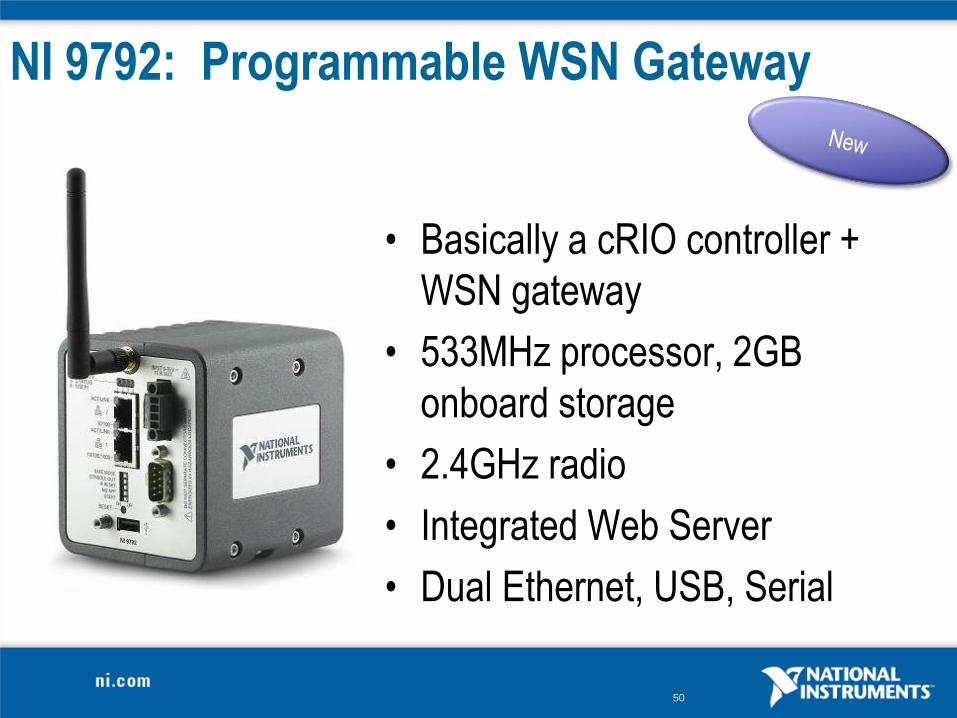
NI 9792: Programmable WSN Gateway
• Basically a cRIO controller +
WSN gateway
• 533MHz processor, 2GB
onboard storage
• 2.4GHz radio
• Integrated Web Server
• Dual Ethernet, USB, Serial
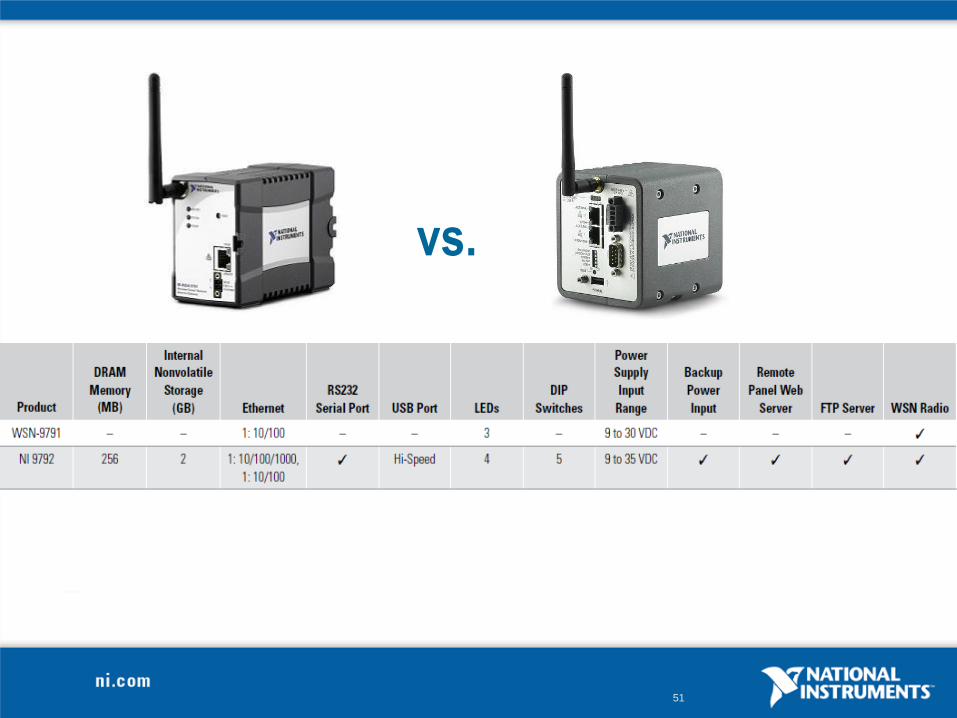
51
vs.
52
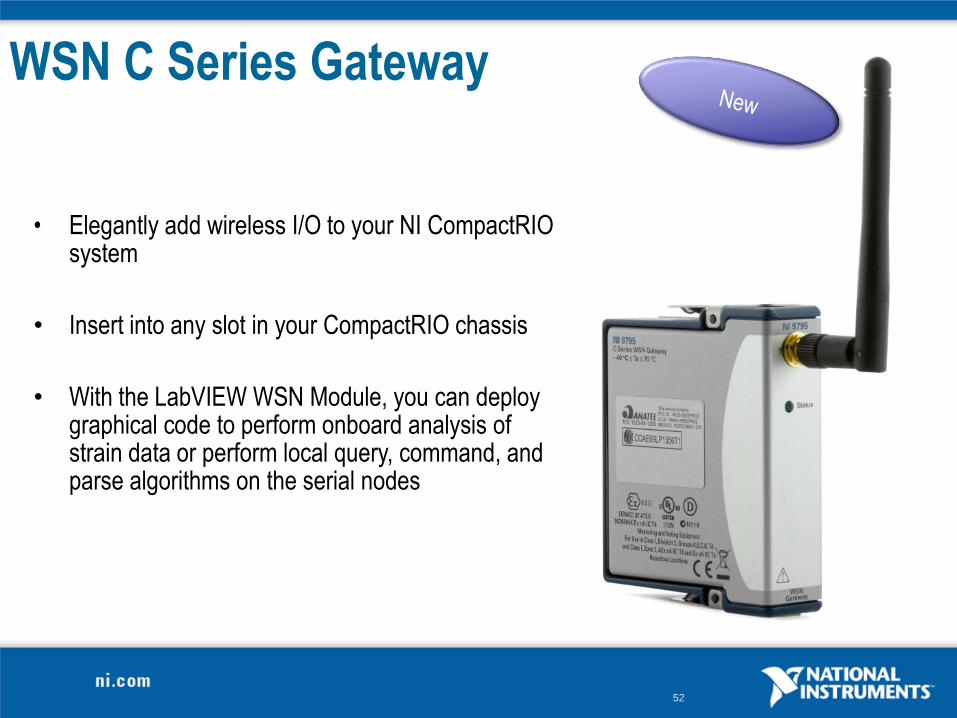
• Elegantly add wireless I/O to your NI CompactRIOsystem
• Insert into any slot in your CompactRIO chassis
• With the LabVIEW WSN Module, you can deploy graphical code to perform onboard analysis of strain data or perform local query, command, and parse algorithms on the serial nodes
WSN C Series Gateway
53
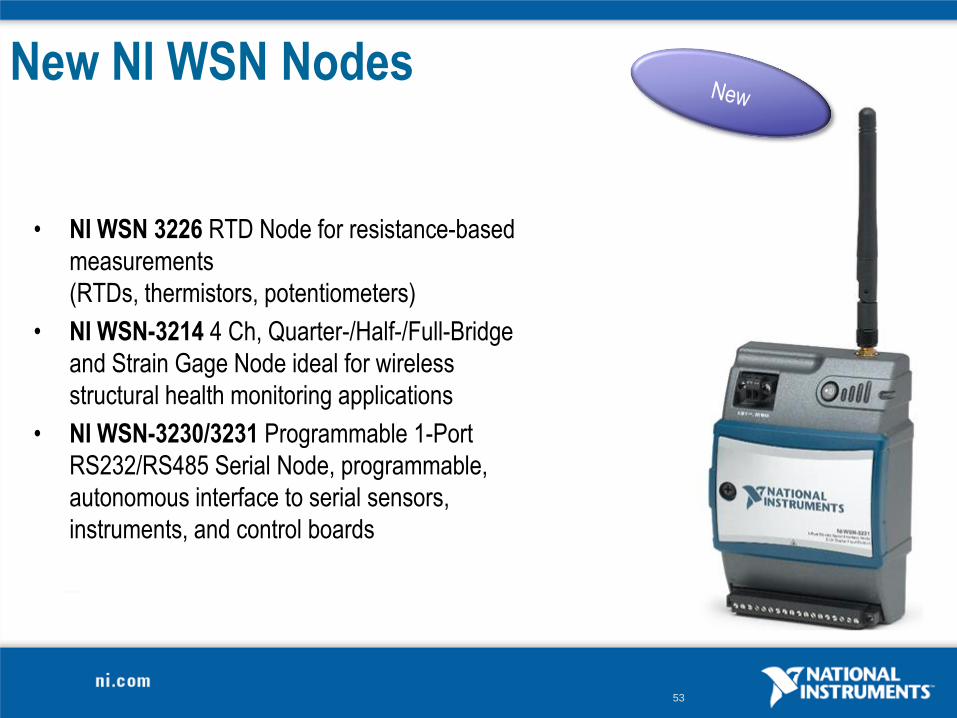
New NI WSN Nodes
• NI WSN 3226 RTD Node for resistance-based
measurements
(RTDs, thermistors, potentiometers)
• NI WSN-3214 4 Ch, Quarter-/Half-/Full-Bridge
and Strain Gage Node ideal for wireless
structural health monitoring applications
• NI WSN-3230/3231 Programmable 1-Port
RS232/RS485 Serial Node, programmable,
autonomous interface to serial sensors,
instruments, and control boards
54
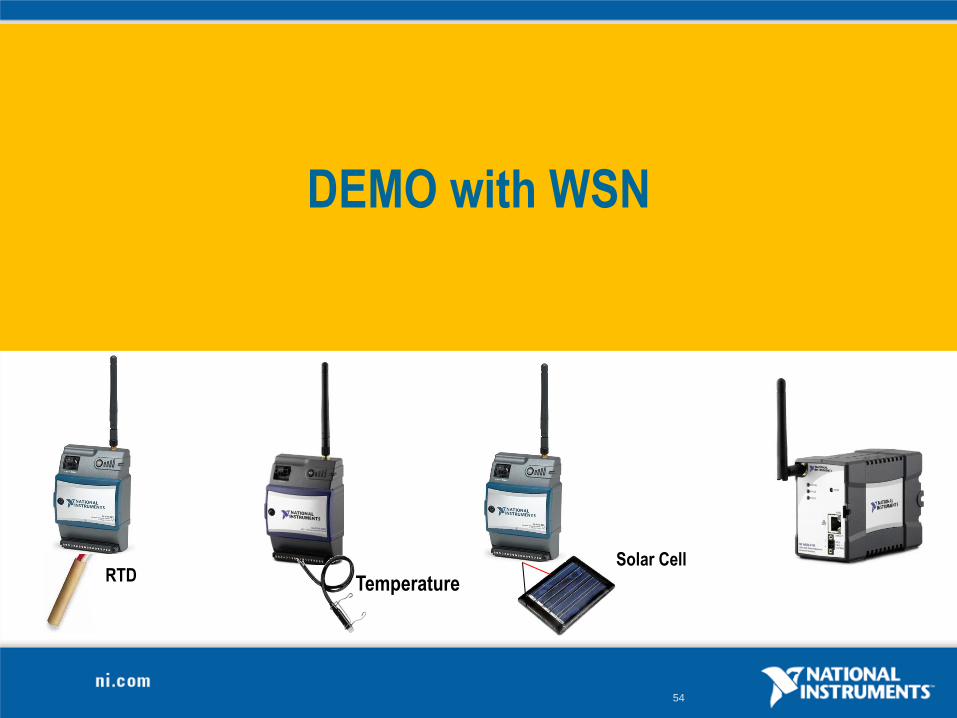
DEMO with WSN
TemperatureRTDSolar Cell
55
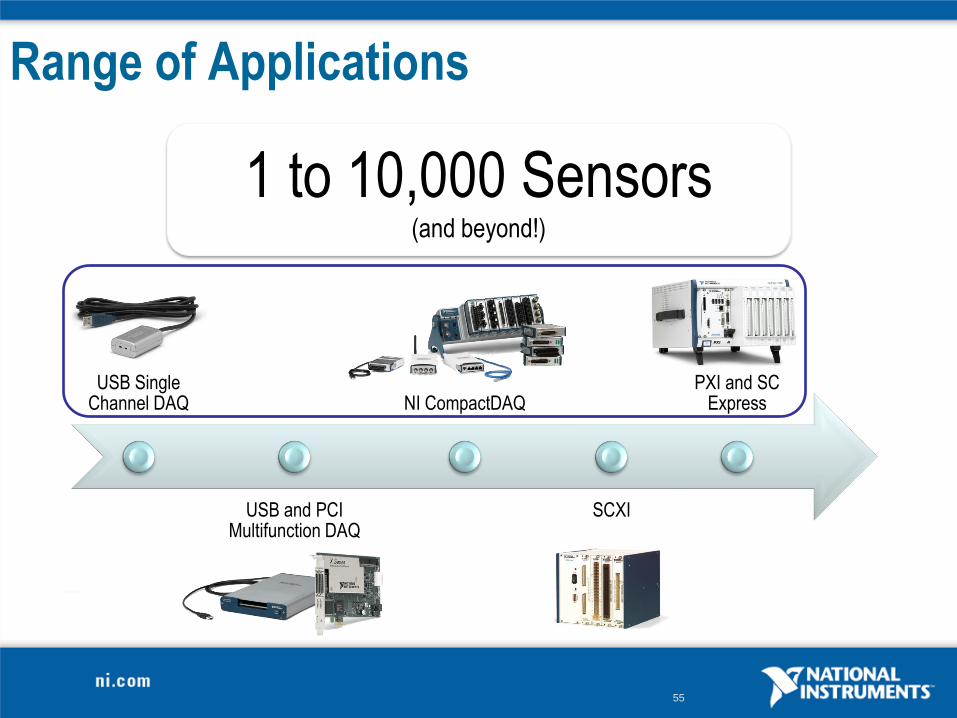
Range of Applications
1 to 10,000 Sensors(and beyond!)
USB Single Channel DAQ
USB and PCI Multifunction DAQ
NI CompactDAQ
SCXI
PXI and SC Express
56
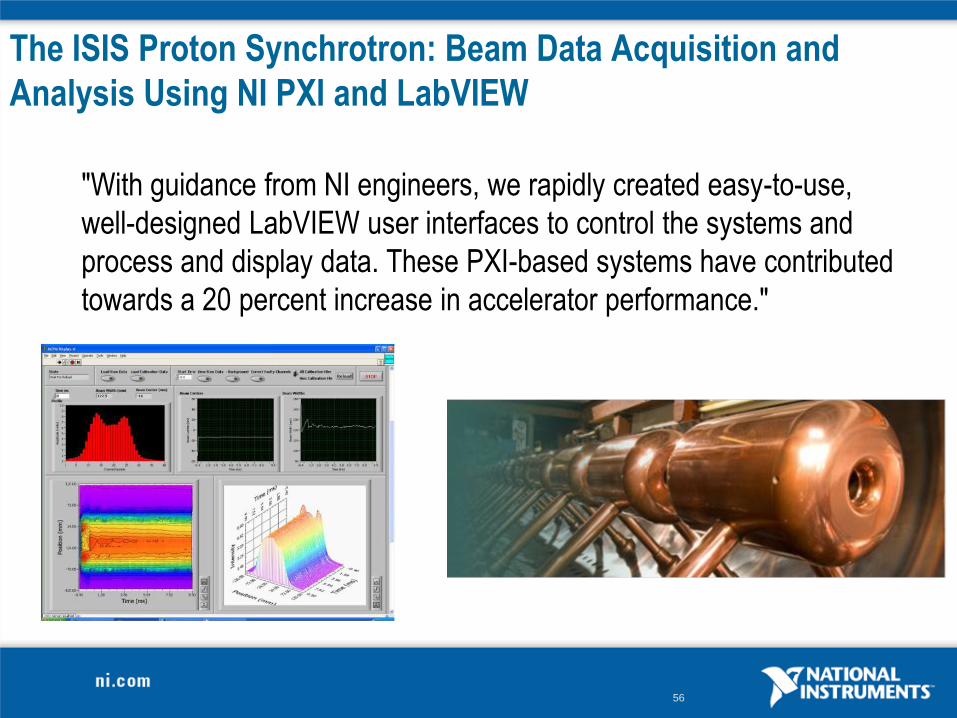
The ISIS Proton Synchrotron: Beam Data Acquisition and
Analysis Using NI PXI and LabVIEW
"With guidance from NI engineers, we rapidly created easy-to-use,
well-designed LabVIEW user interfaces to control the systems and
process and display data. These PXI-based systems have contributed
towards a 20 percent increase in accelerator performance."
57
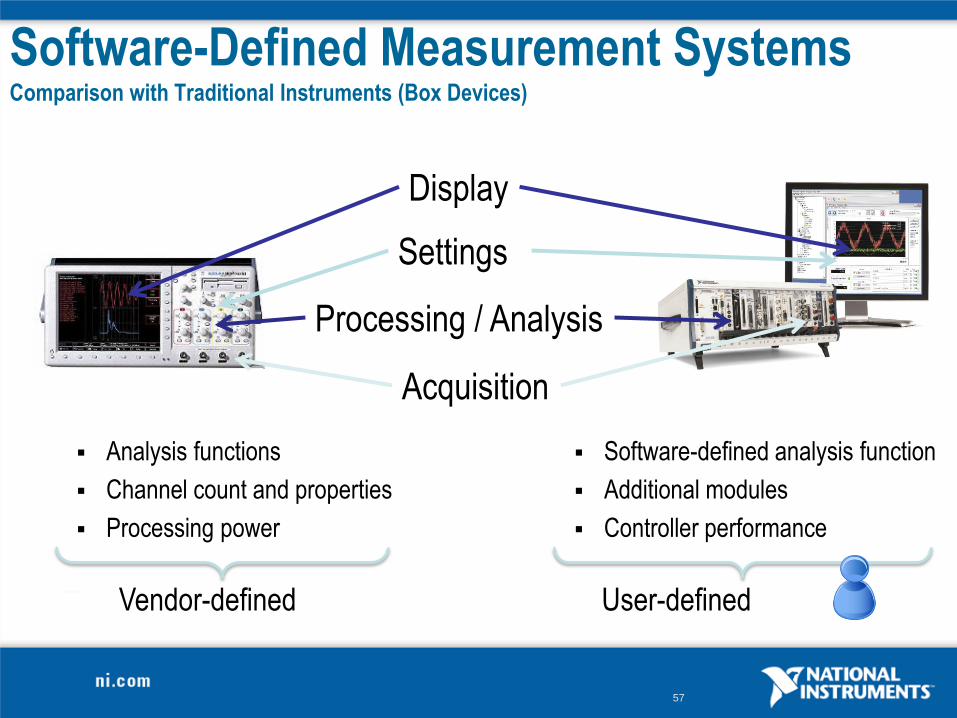
Analysis functions
Channel count and properties
Processing power
Software-defined analysis function
Additional modules
Controller performance
Software-Defined Measurement SystemsComparison with Traditional Instruments (Box Devices)
Acquisition
Display
Settings
Processing / Analysis
Vendor-defined User-defined
58
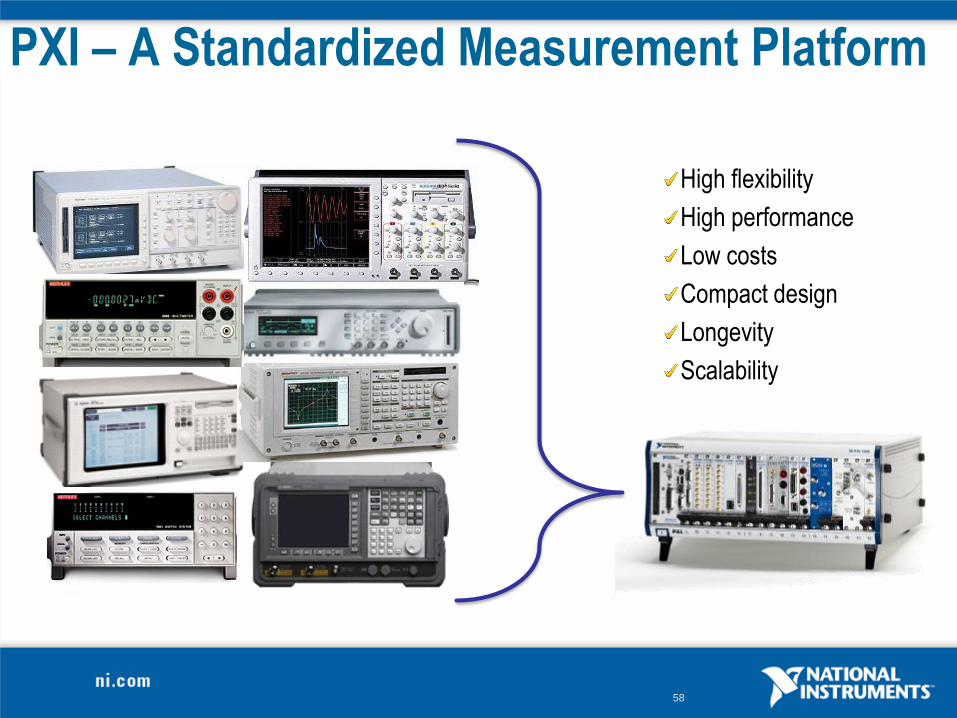
PXI – A Standardized Measurement Platform
High flexibility
High performance
Low costs
Compact design
Longevity
Scalability
59
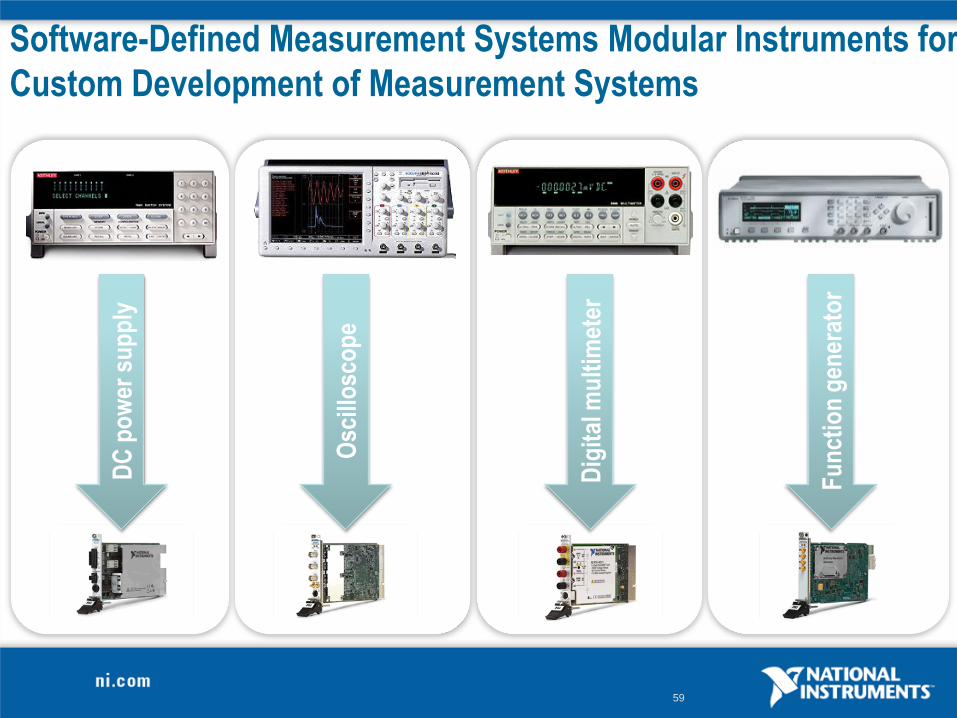
Software-Defined Measurement Systems Modular Instruments for
Custom Development of Measurement SystemsD
C p
ow
er s
up
ply
Osc
illo
sco
pe
Dig
ital
mu
ltim
eter
Fu
nct
ion
gen
erat
or
60
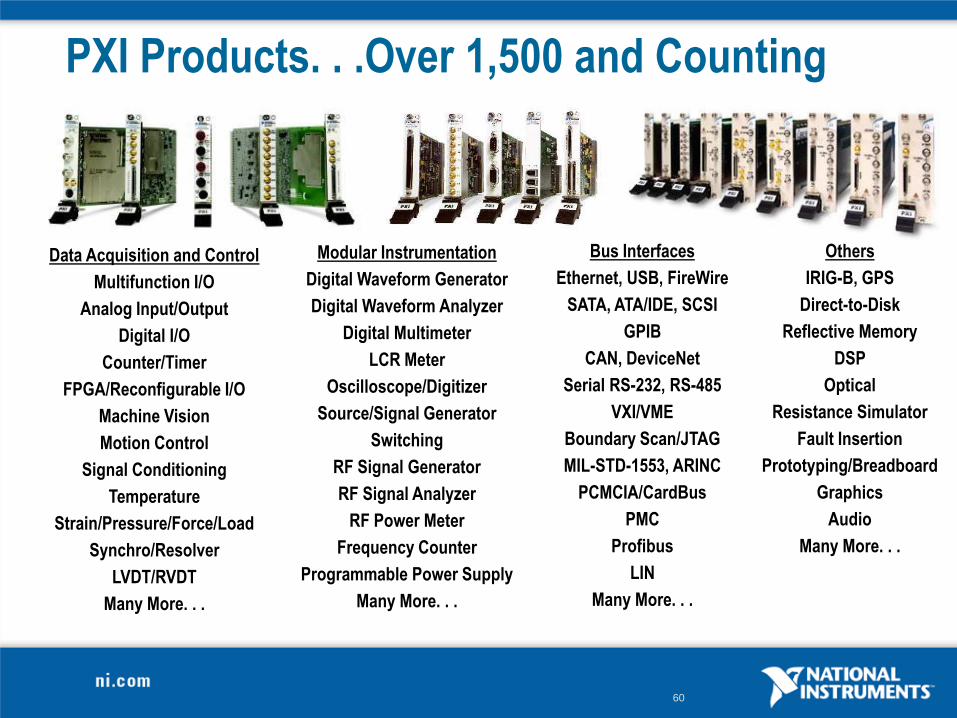
Data Acquisition and Control
Multifunction I/O
Analog Input/Output
Digital I/O
Counter/Timer
FPGA/Reconfigurable I/O
Machine Vision
Motion Control
Signal Conditioning
Temperature
Strain/Pressure/Force/Load
Synchro/Resolver
LVDT/RVDT
Many More. . .
Modular Instrumentation
Digital Waveform Generator
Digital Waveform Analyzer
Digital Multimeter
LCR Meter
Oscilloscope/Digitizer
Source/Signal Generator
Switching
RF Signal Generator
RF Signal Analyzer
RF Power Meter
Frequency Counter
Programmable Power Supply
Many More. . .
Bus Interfaces
Ethernet, USB, FireWire
SATA, ATA/IDE, SCSI
GPIB
CAN, DeviceNet
Serial RS-232, RS-485
VXI/VME
Boundary Scan/JTAG
MIL-STD-1553, ARINC
PCMCIA/CardBus
PMC
Profibus
LIN
Many More. . .
Others
IRIG-B, GPS
Direct-to-Disk
Reflective Memory
DSP
Optical
Resistance Simulator
Fault Insertion
Prototyping/Breadboard
Graphics
Audio
Many More. . .
PXI Products. . .Over 1,500 and Counting
61
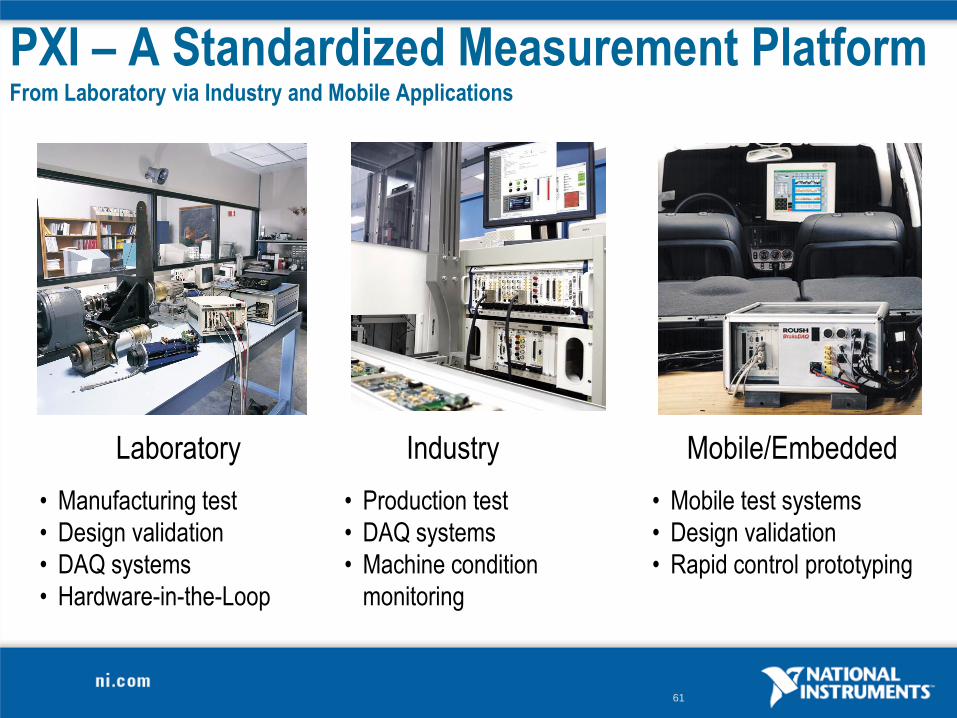
PXI – A Standardized Measurement PlatformFrom Laboratory via Industry and Mobile Applications
Mobile/EmbeddedLaboratory
• Manufacturing test
• Design validation
• DAQ systems
• Hardware-in-the-Loop
• Mobile test systems
• Design validation
• Rapid control prototyping
Industry
• Production test
• DAQ systems
• Machine condition
monitoring
62
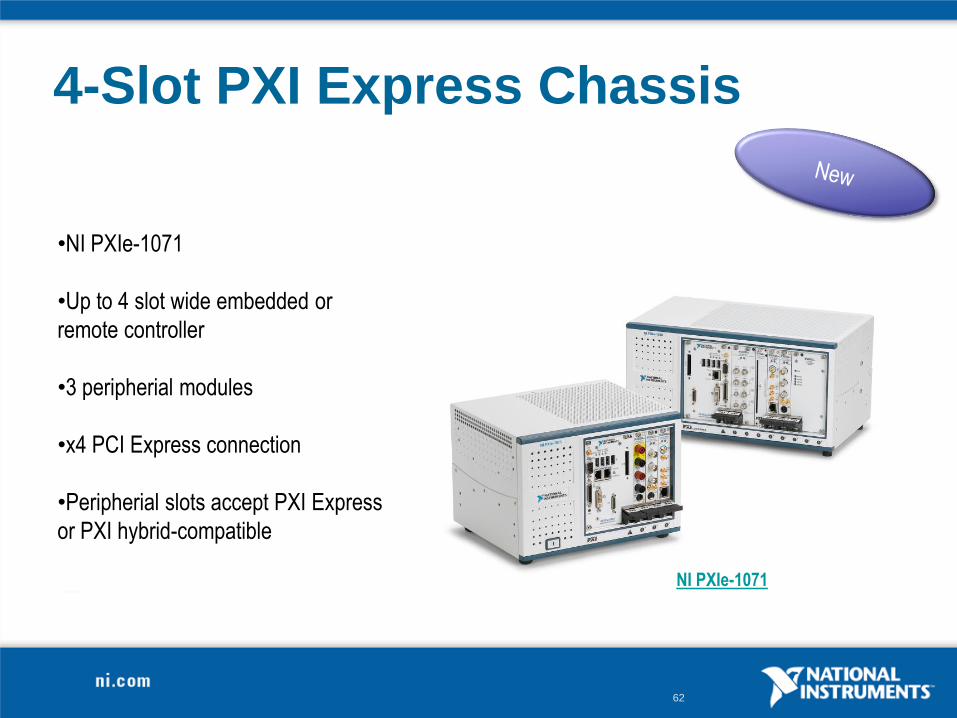
4-Slot PXI Express Chassis
NI PXIe-1071
•NI PXIe-1071
•Up to 4 slot wide embedded or
remote controller
•3 peripherial modules
•x4 PCI Express connection
•Peripherial slots accept PXI Express
or PXI hybrid-compatible
63
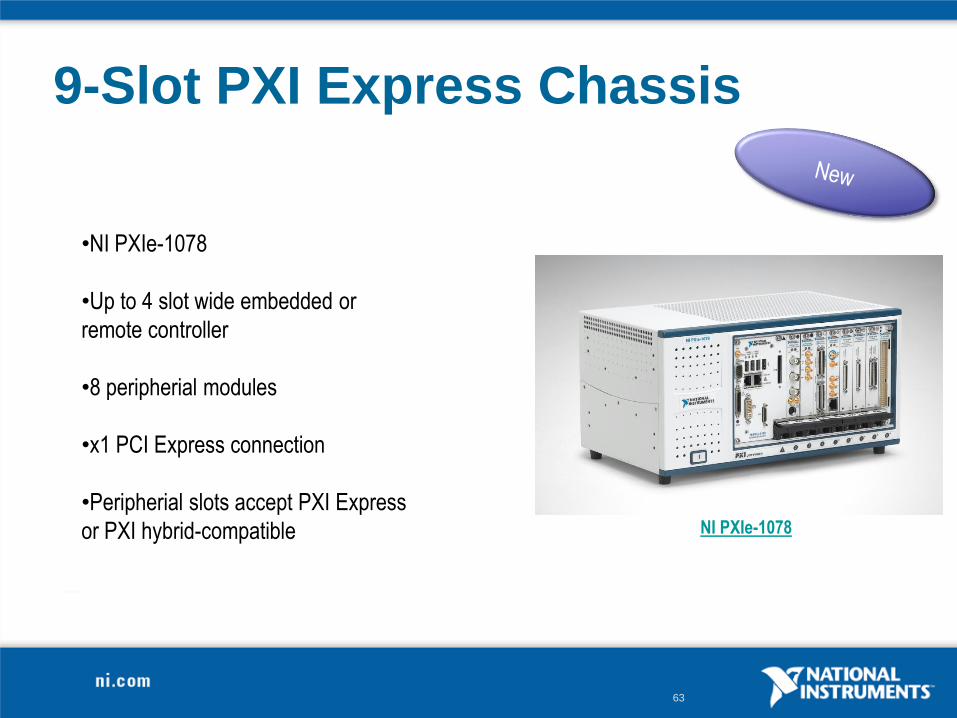
9-Slot PXI Express Chassis
NI PXIe-1078
•NI PXIe-1078
•Up to 4 slot wide embedded or
remote controller
•8 peripherial modules
•x1 PCI Express connection
•Peripherial slots accept PXI Express
or PXI hybrid-compatible
65
66
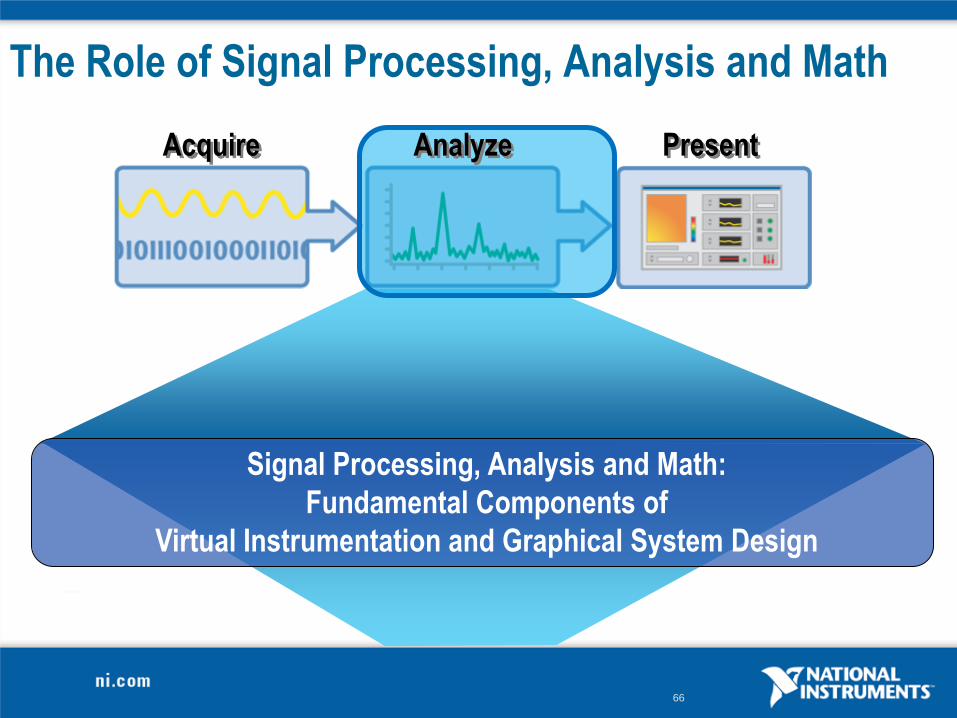
The Role of Signal Processing, Analysis and Math
Acquire Present
Signal Processing, Analysis and Math:
Fundamental Components of
Virtual Instrumentation and Graphical System Design
Analyze
67
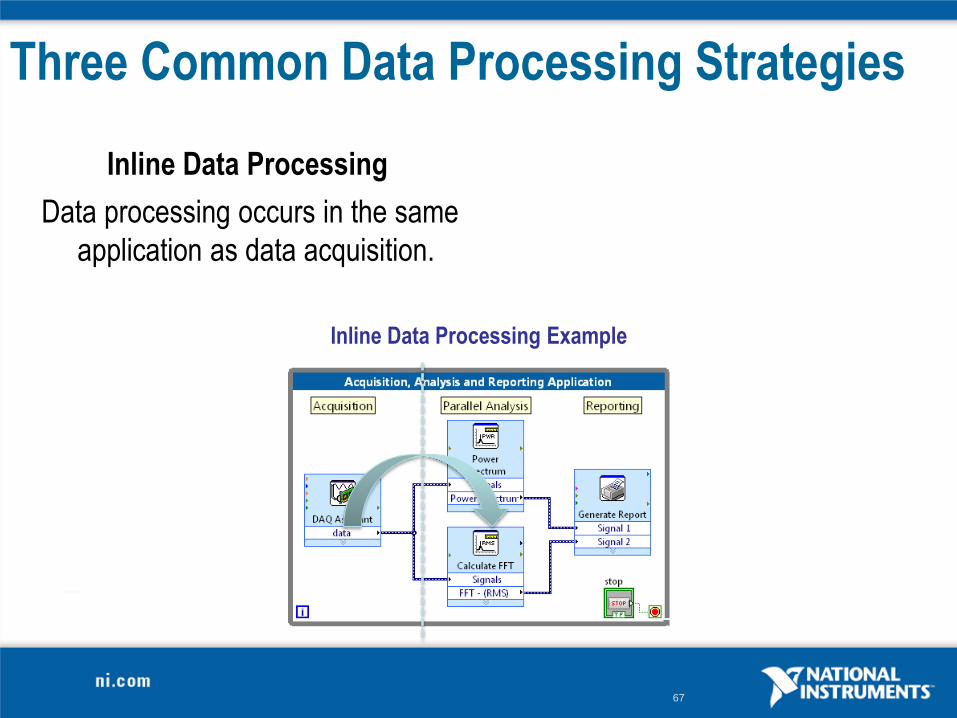
Three Common Data Processing Strategies
Inline Data Processing
Data processing occurs in the same
application as data acquisition.
Inline Data Processing Example
68
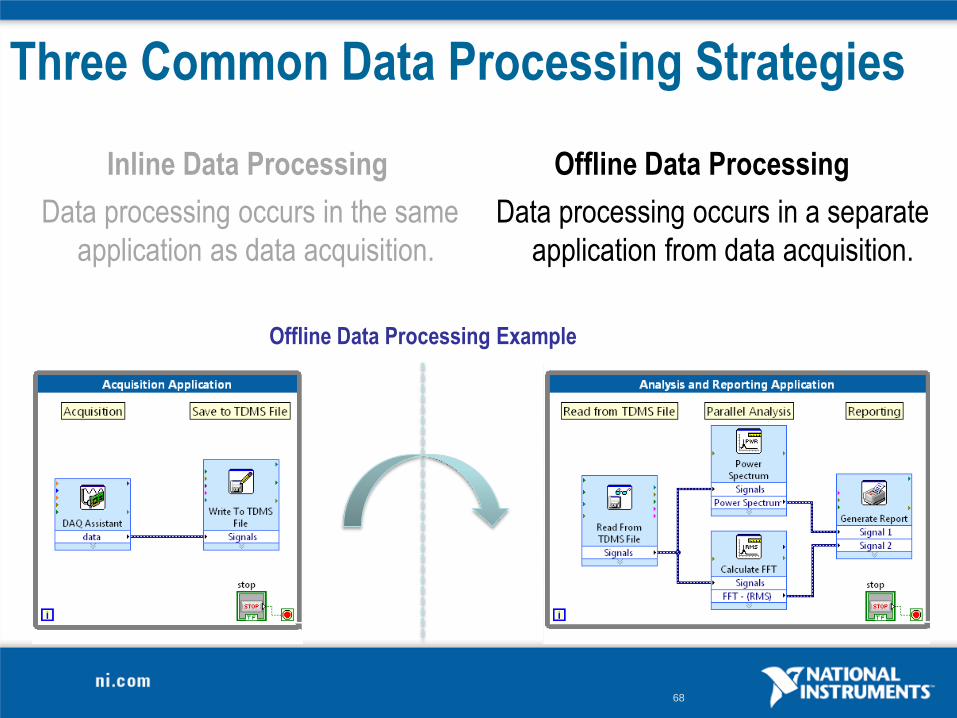
Three Common Data Processing Strategies
Inline Data Processing
Data processing occurs in the same
application as data acquisition.
Offline Data Processing
Data processing occurs in a separate
application from data acquisition.
Offline Data Processing Example
69
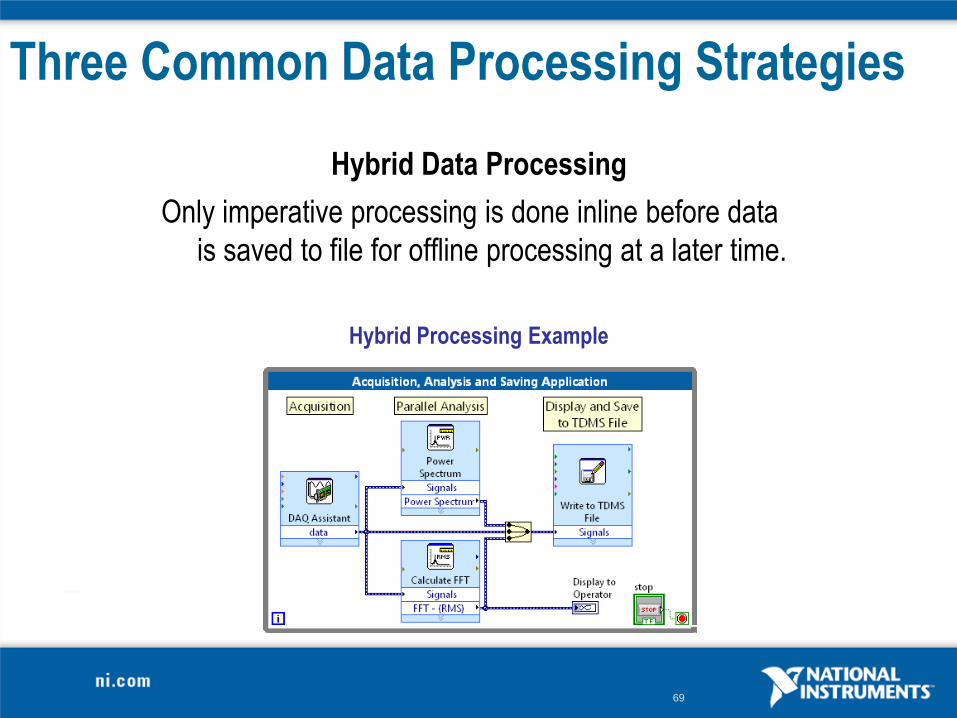
Three Common Data Processing Strategies
Hybrid Processing Example
Hybrid Data Processing
Only imperative processing is done inline before data
is saved to file for offline processing at a later time.
70
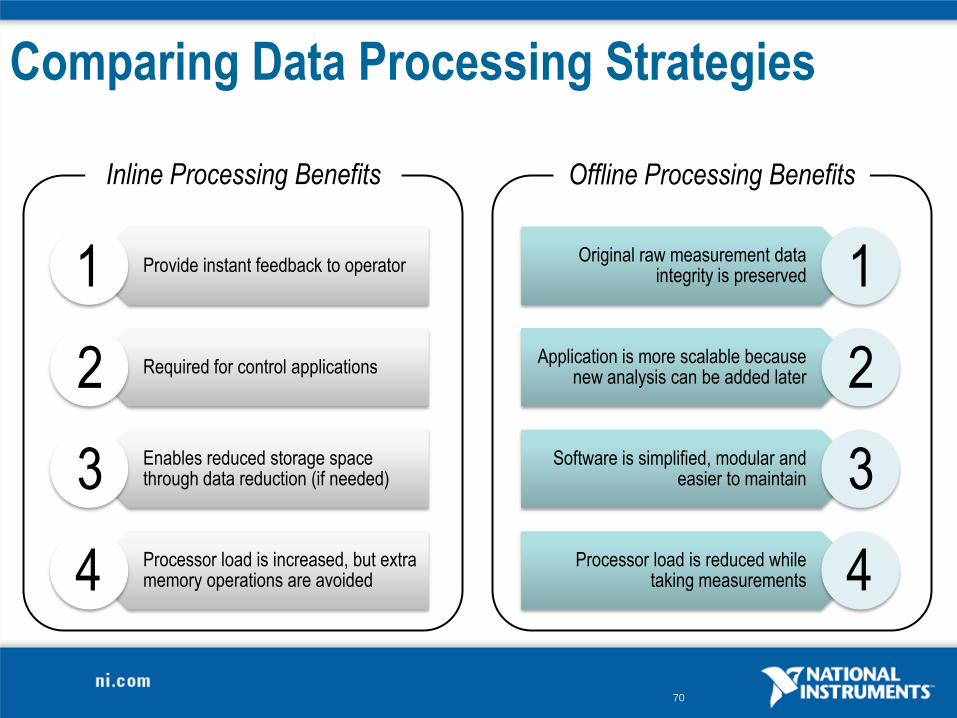
Comparing Data Processing Strategies
Provide instant feedback to operator
Required for control applications
Enables reduced storage space through data reduction (if needed)
Processor load is increased, but extra memory operations are avoided
Original raw measurement data integrity is preserved
Application is more scalable because new analysis can be added later
Software is simplified, modular and easier to maintain
Processor load is reduced while taking measurements
1
2
3
4
1
2
3
4
Inline Processing Benefits Offline Processing Benefits
71
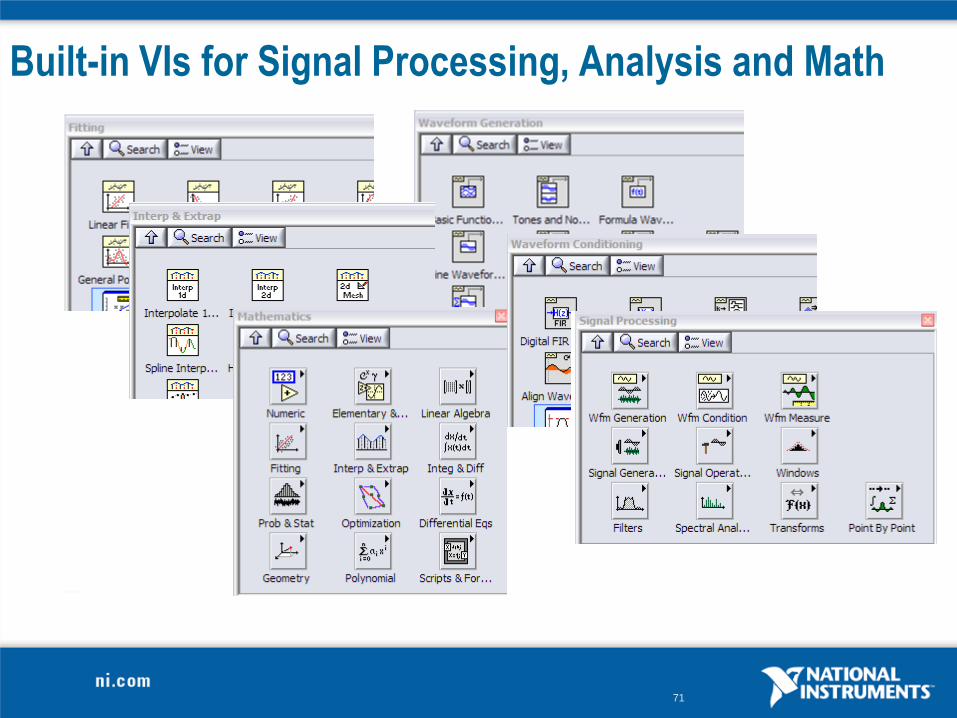
Built-in VIs for Signal Processing, Analysis and Math
72
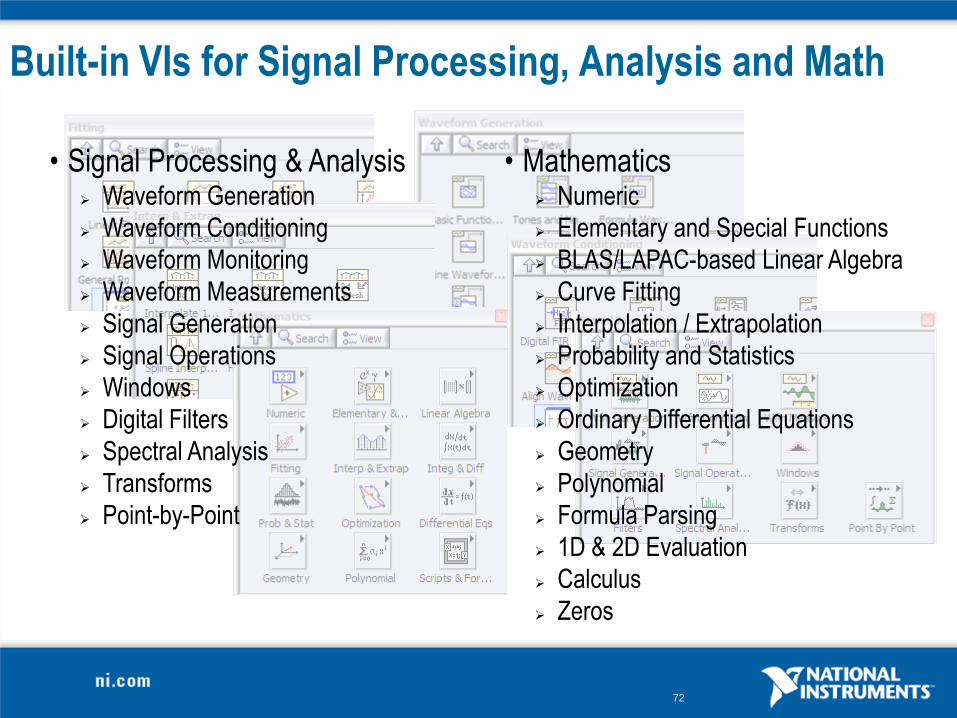
Built-in VIs for Signal Processing, Analysis and Math
• Signal Processing & Analysis Waveform Generation
Waveform Conditioning
Waveform Monitoring
Waveform Measurements
Signal Generation
Signal Operations
Windows
Digital Filters
Spectral Analysis
Transforms
Point-by-Point
• Mathematics Numeric
Elementary and Special Functions
BLAS/LAPAC-based Linear Algebra
Curve Fitting
Interpolation / Extrapolation
Probability and Statistics
Optimization
Ordinary Differential Equations
Geometry
Polynomial
Formula Parsing
1D & 2D Evaluation
Calculus
Zeros
73
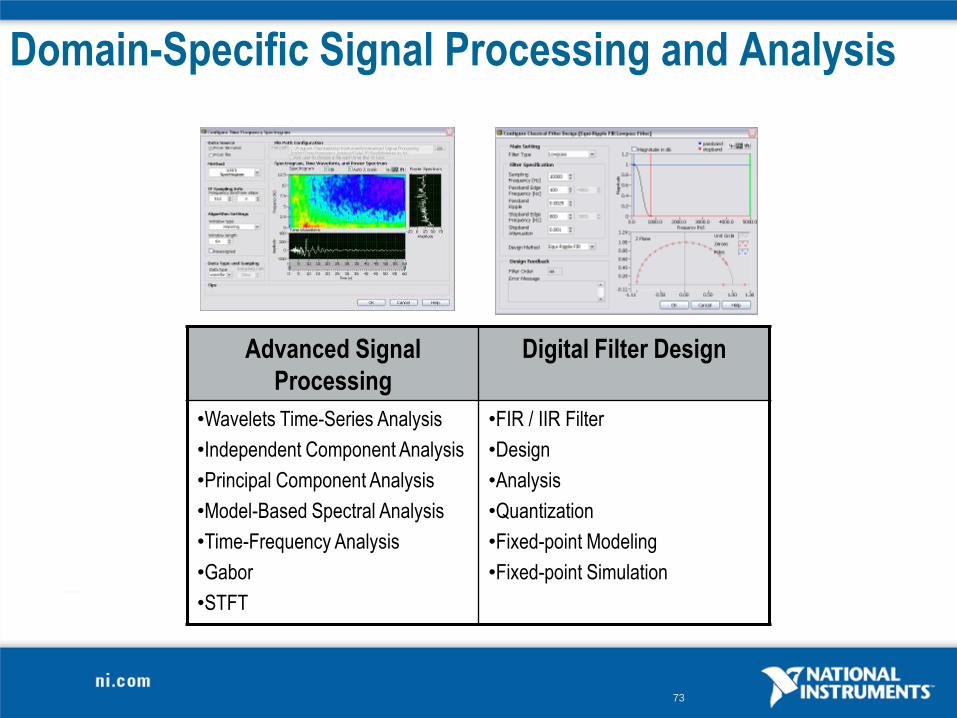
Domain-Specific Signal Processing and Analysis
Advanced Signal
Processing
Digital Filter Design
•Wavelets Time-Series Analysis
•Independent Component Analysis
•Principal Component Analysis
•Model-Based Spectral Analysis
•Time-Frequency Analysis
•Gabor
•STFT
•FIR / IIR Filter
•Design
•Analysis
•Quantization
•Fixed-point Modeling
•Fixed-point Simulation
75
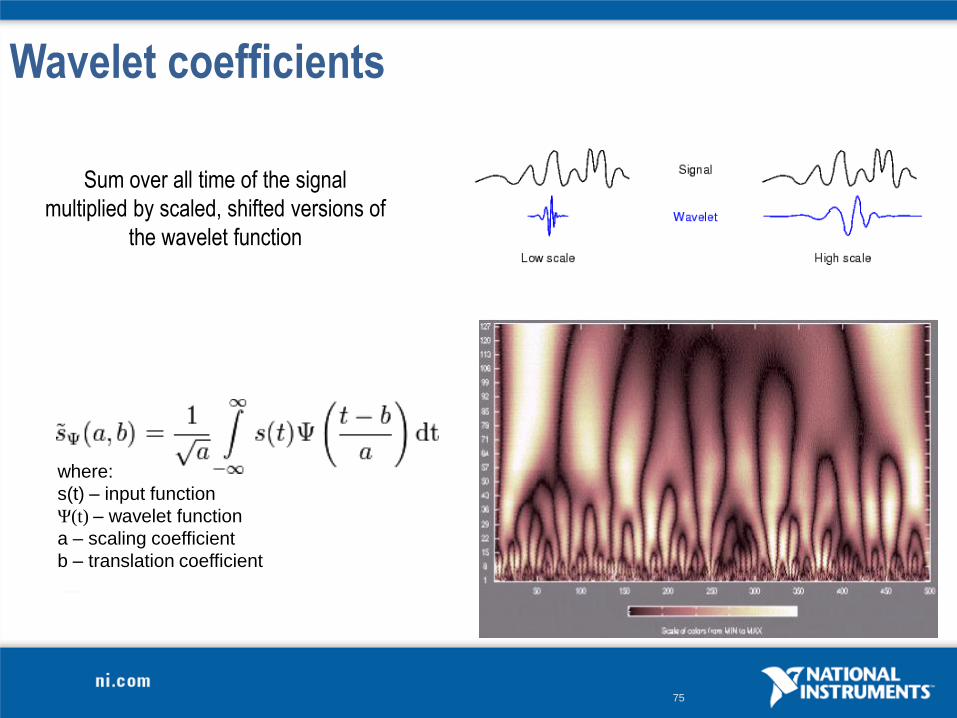
Wavelet coefficients
where:
s(t) – input function
Ψ(t) – wavelet function
a – scaling coefficient
b – translation coefficient
Sum over all time of the signal
multiplied by scaled, shifted versions of
the wavelet function
76
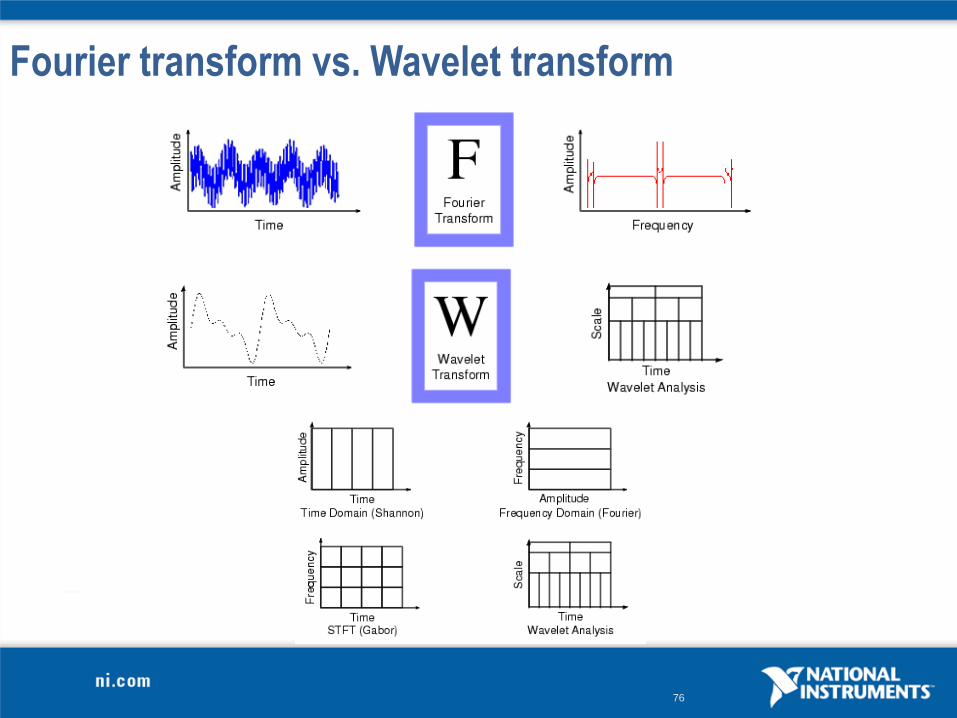
Fourier transform vs. Wavelet transform
77
Wavelet Applications
• Noise removal (denoise)
• Extracting high frequency content (detrend)
• Signal compression
• Compression post-processing
• Image analysis (edge detection)
• Seismic analysis
• Engine knock detection
78
DEMO with Wavelet Analysis
79
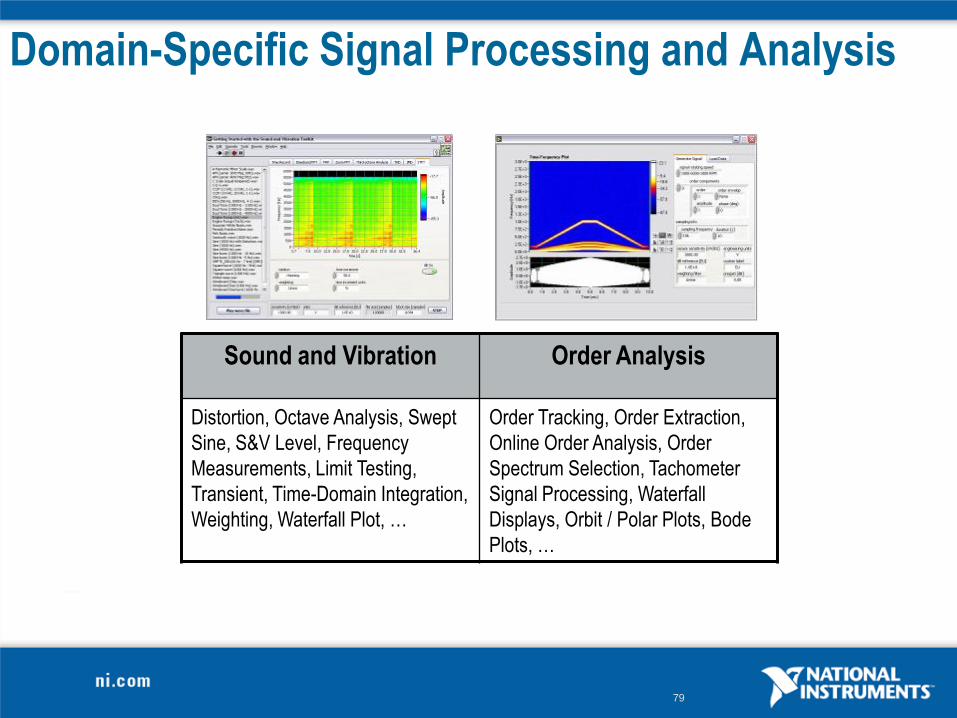
Sound and Vibration Order Analysis
Distortion, Octave Analysis, Swept
Sine, S&V Level, Frequency
Measurements, Limit Testing,
Transient, Time-Domain Integration,
Weighting, Waterfall Plot, …
Order Tracking, Order Extraction,
Online Order Analysis, Order
Spectrum Selection, Tachometer
Signal Processing, Waterfall
Displays, Orbit / Polar Plots, Bode
Plots, …
Domain-Specific Signal Processing and Analysis
80
DEMO with Order Tracking
DATA
Analyze
81
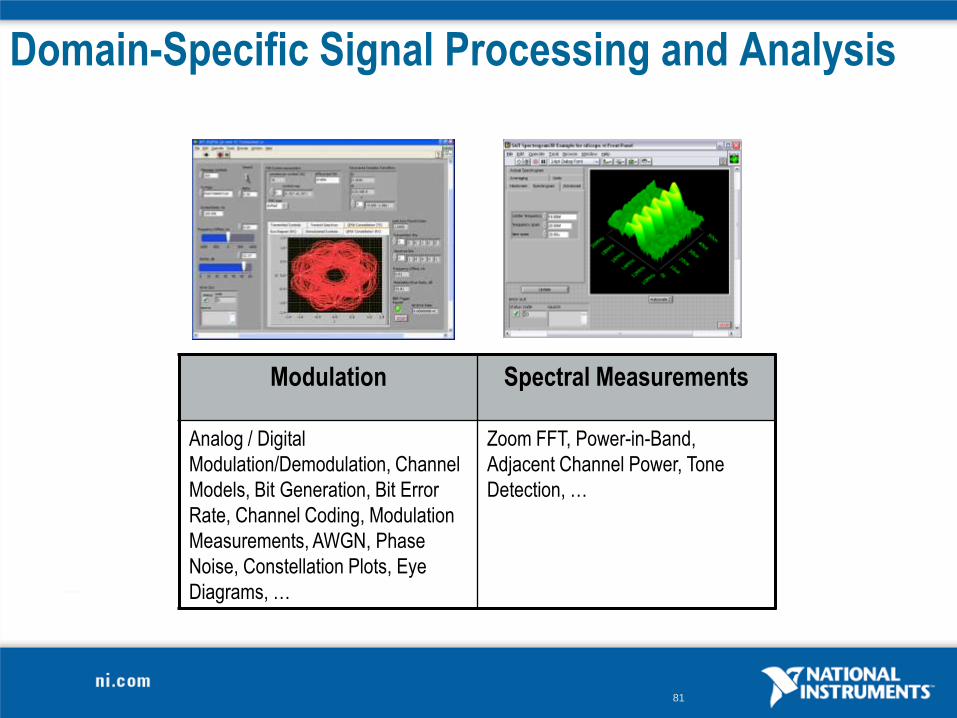
Modulation Spectral Measurements
Analog / Digital
Modulation/Demodulation, Channel
Models, Bit Generation, Bit Error
Rate, Channel Coding, Modulation
Measurements, AWGN, Phase
Noise, Constellation Plots, Eye
Diagrams, …
Zoom FFT, Power-in-Band,
Adjacent Channel Power, Tone
Detection, …
Domain-Specific Signal Processing and Analysis
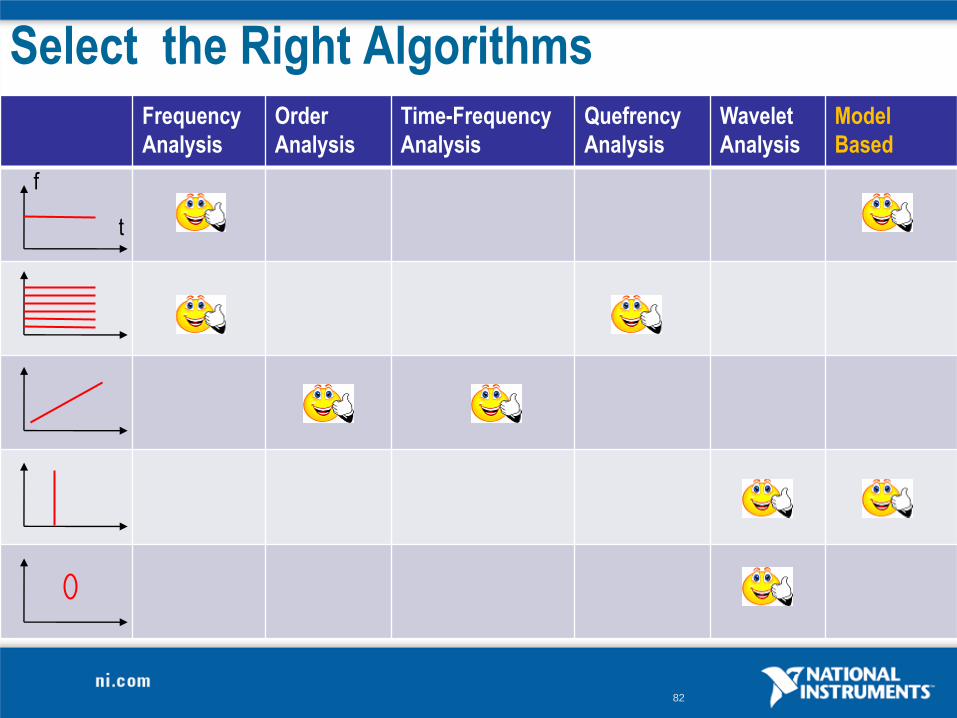
82
Select the Right AlgorithmsFrequency
Analysis
Order
Analysis
Time-Frequency
Analysis
Quefrency
Analysis
Wavelet
Analysis
Model
Based
t
f
83
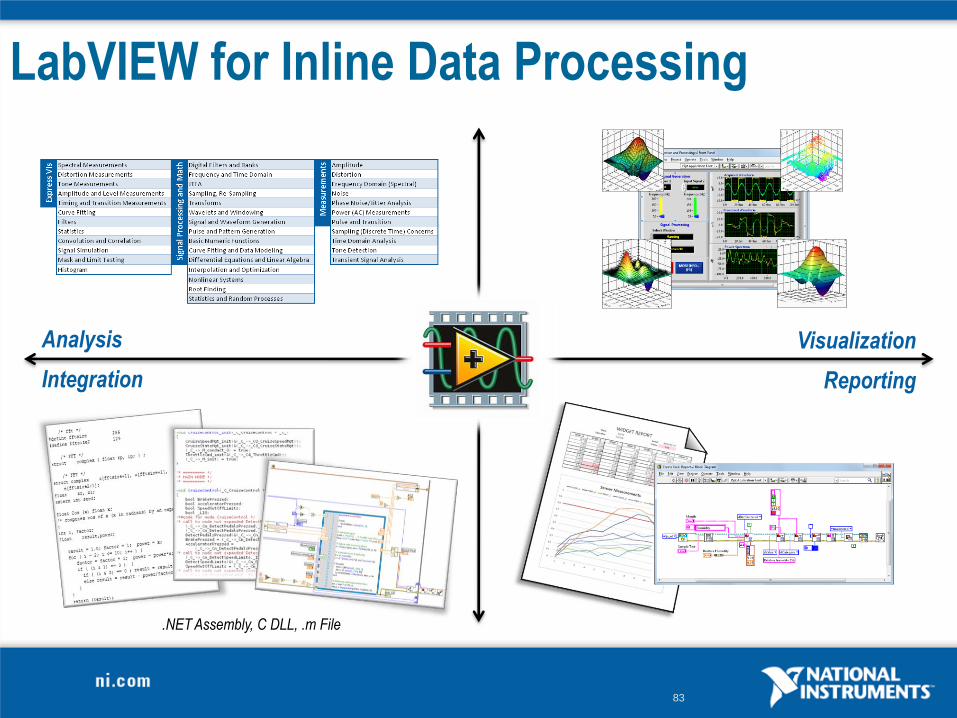
LabVIEW for Inline Data Processing
Visualization
Reporting
Analysis
Integration
.NET Assembly, C DLL, .m File
84
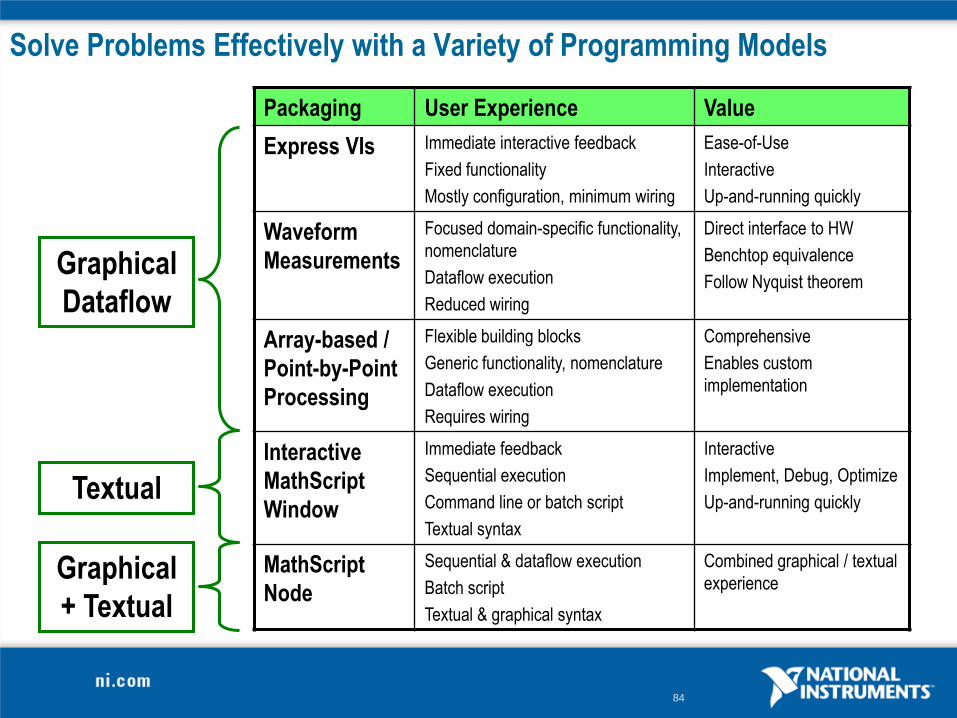
Solve Problems Effectively with a Variety of Programming Models
Packaging User Experience Value
Express VIs Immediate interactive feedback
Fixed functionality
Mostly configuration, minimum wiring
Ease-of-Use
Interactive
Up-and-running quickly
Waveform
Measurements
Focused domain-specific functionality,
nomenclature
Dataflow execution
Reduced wiring
Direct interface to HW
Benchtop equivalence
Follow Nyquist theorem
Array-based /
Point-by-Point
Processing
Flexible building blocks
Generic functionality, nomenclature
Dataflow execution
Requires wiring
Comprehensive
Enables custom
implementation
Interactive
MathScript
Window
Immediate feedback
Sequential execution
Command line or batch script
Textual syntax
Interactive
Implement, Debug, Optimize
Up-and-running quickly
MathScript
Node
Sequential & dataflow execution
Batch script
Textual & graphical syntax
Combined graphical / textual
experience
Graphical
Dataflow
Graphical
+ Textual
Textual
85
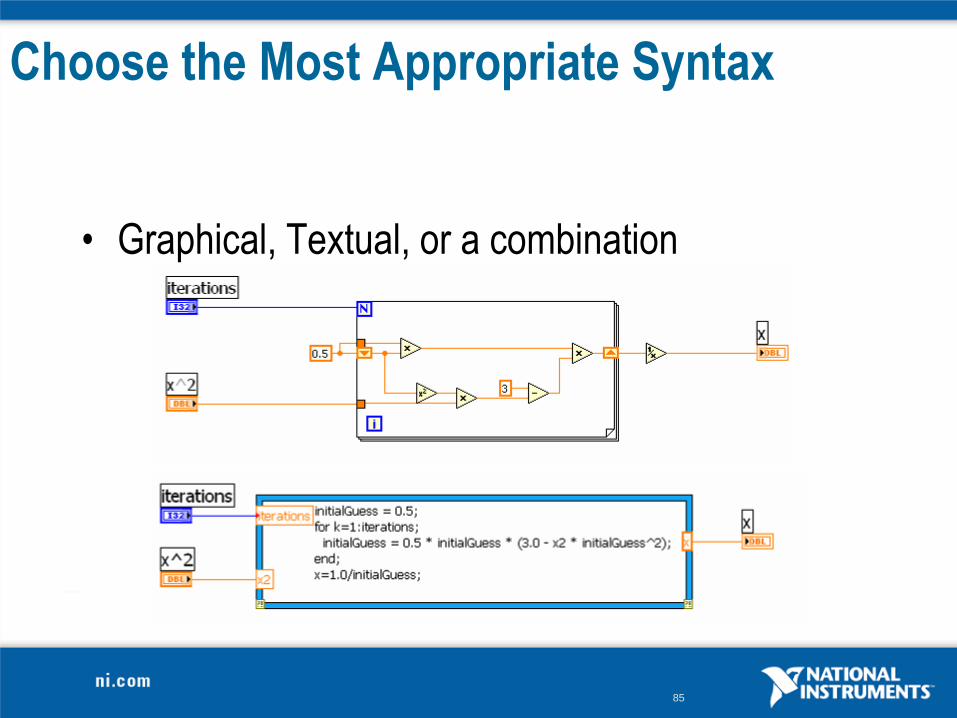
Choose the Most Appropriate Syntax
• Graphical, Textual, or a combination
86
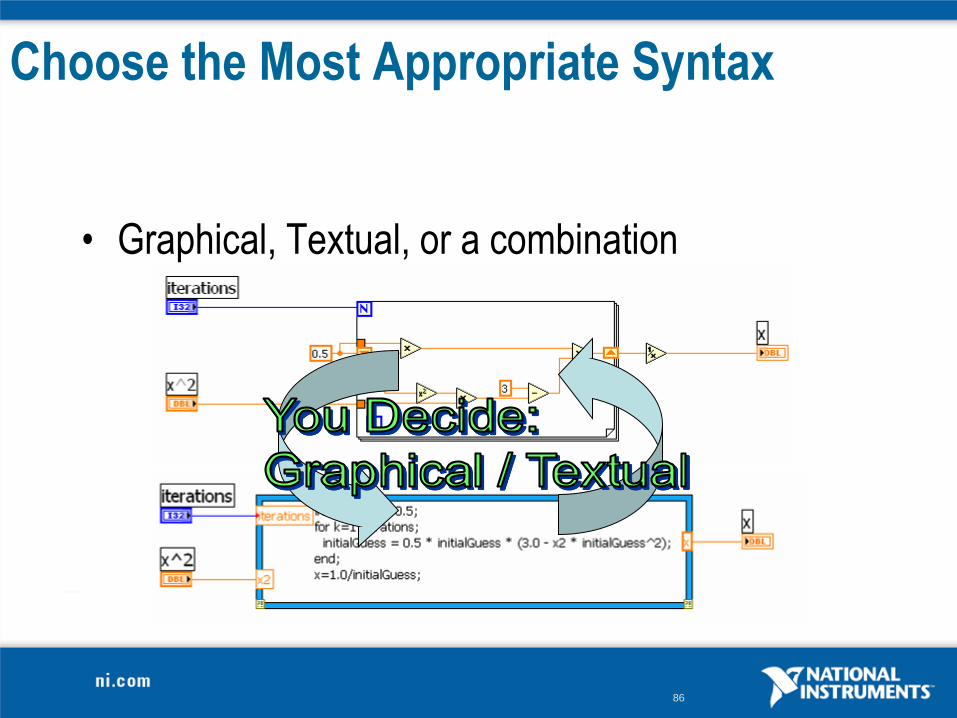
Choose the Most Appropriate Syntax
• Graphical, Textual, or a combination
87
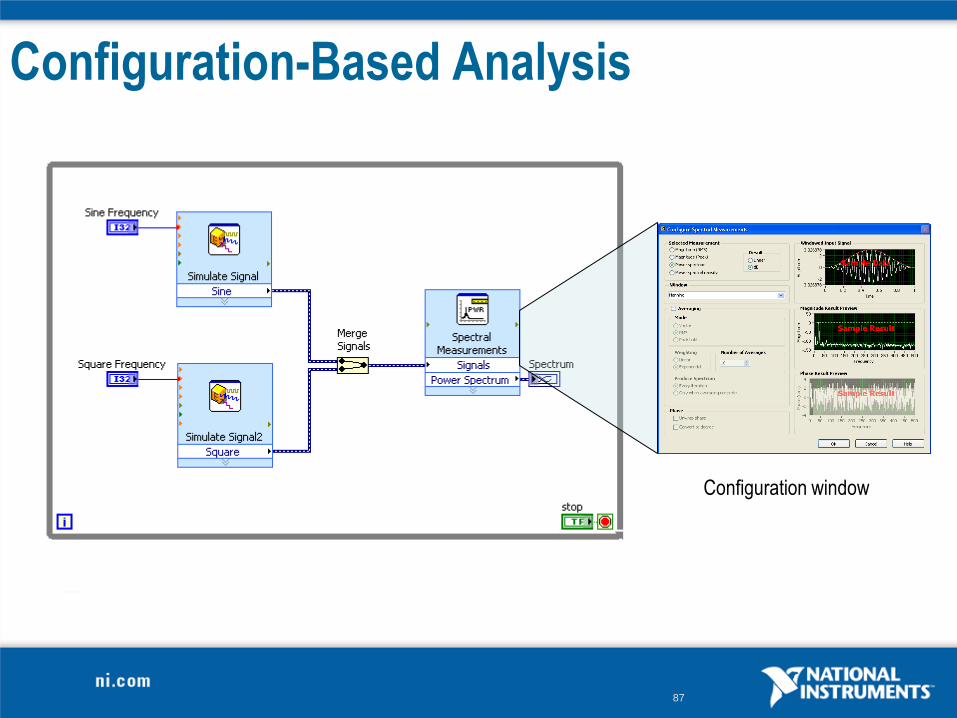
Configuration-Based Analysis
Configuration window
88
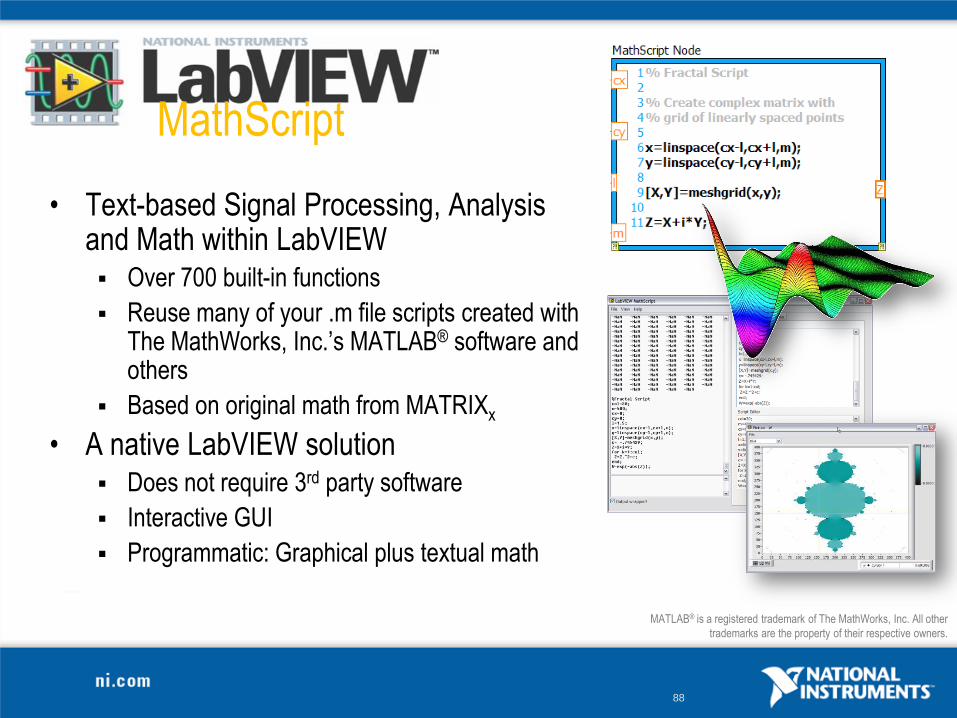
• Text-based Signal Processing, Analysis and Math within LabVIEW Over 700 built-in functions
Reuse many of your .m file scripts created with The MathWorks, Inc.’s MATLAB® software and others
Based on original math from MATRIXx
• A native LabVIEW solution Does not require 3rd party software
Interactive GUI
Programmatic: Graphical plus textual math
MathScript
MATLAB® is a registered trademark of The MathWorks, Inc. All other
trademarks are the property of their respective owners.
89
Interactive Math with the MathScript Window
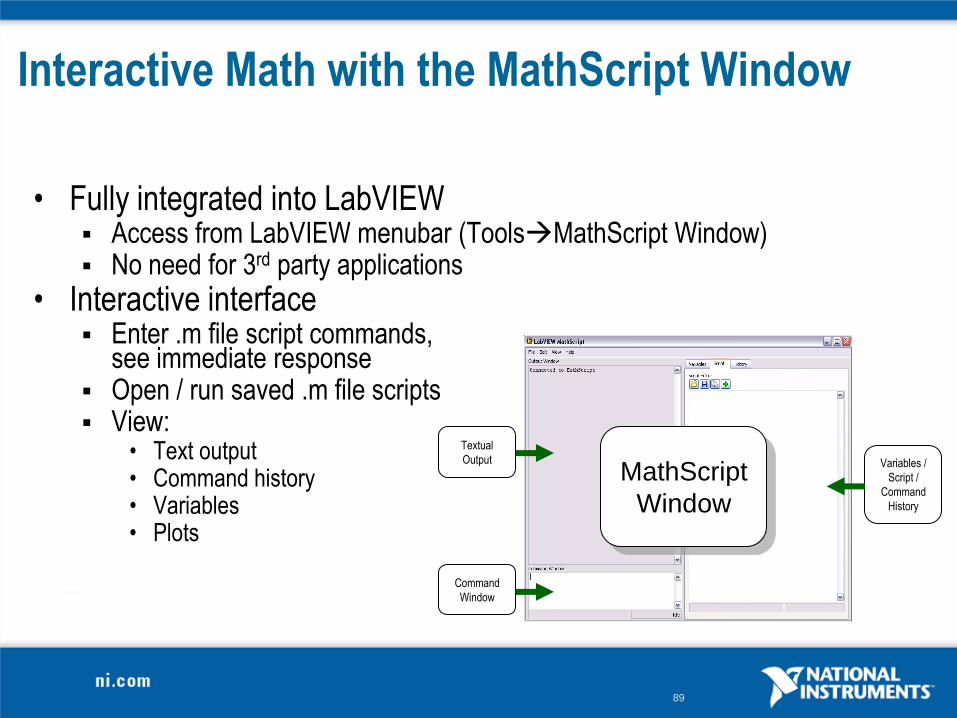
• Fully integrated into LabVIEW Access from LabVIEW menubar (ToolsMathScript Window) No need for 3rd party applications
• Interactive interface Enter .m file script commands,
see immediate response Open / run saved .m file scripts View:
• Text output• Command history• Variables• Plots
Textual
Output
Command
Window
MathScript
Window
Variables /
Script /
Command
History
90
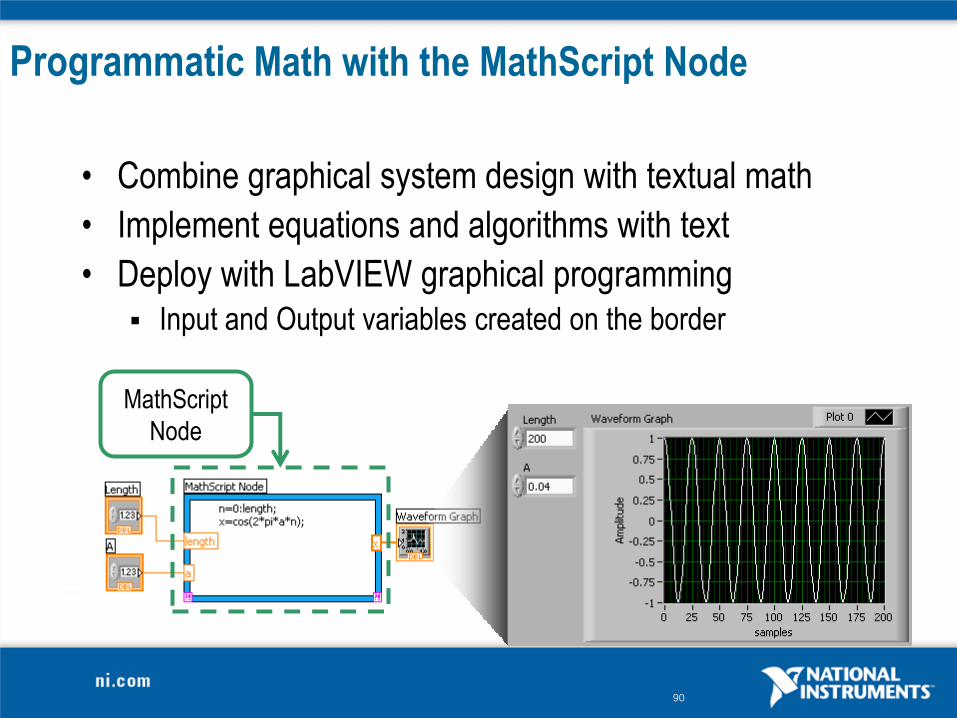
Programmatic Math with the MathScript Node
• Combine graphical system design with textual math
• Implement equations and algorithms with text
• Deploy with LabVIEW graphical programming Input and Output variables created on the border
MathScript
Node
91
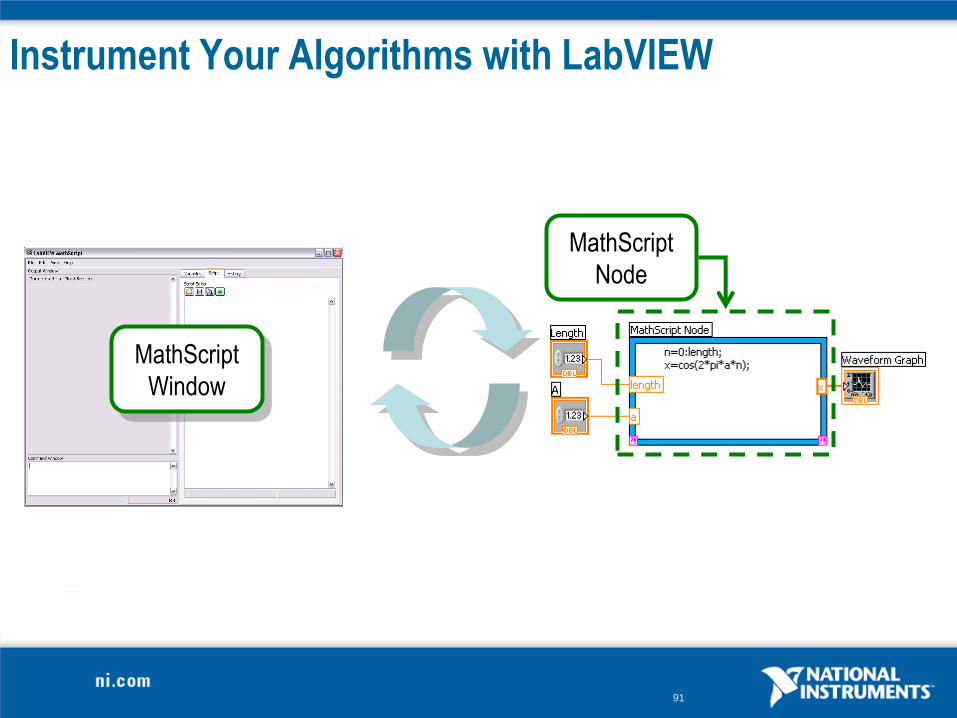
Instrument Your Algorithms with LabVIEW
MathScript
Window
MathScript
Node
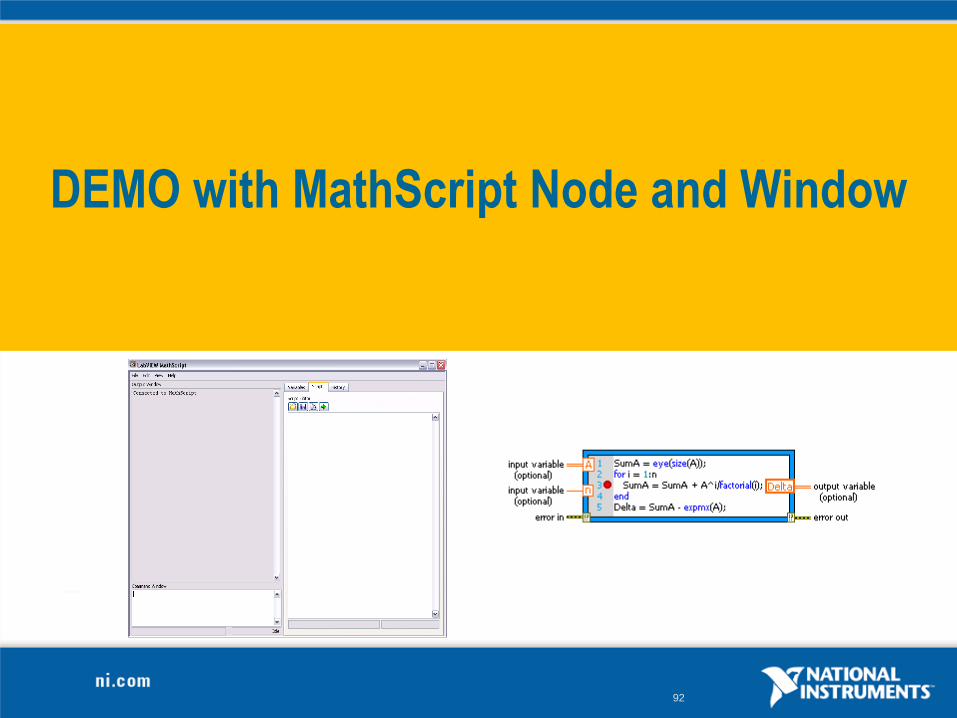
92
DEMO with MathScript Node and Window
93
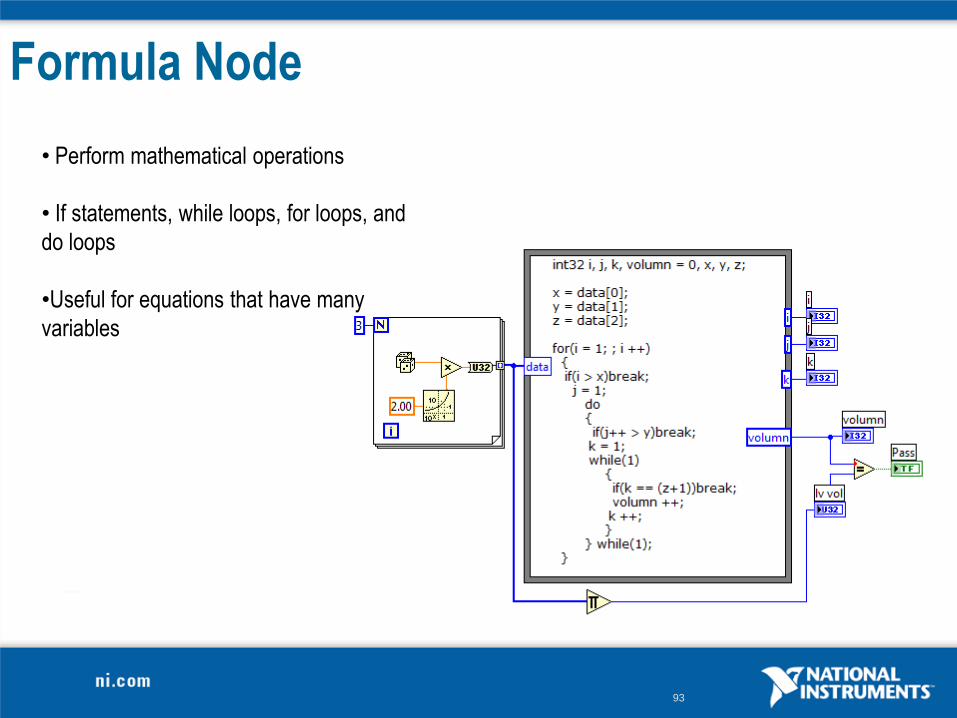
Formula Node
• Perform mathematical operations
• If statements, while loops, for loops, and
do loops
•Useful for equations that have many
variables
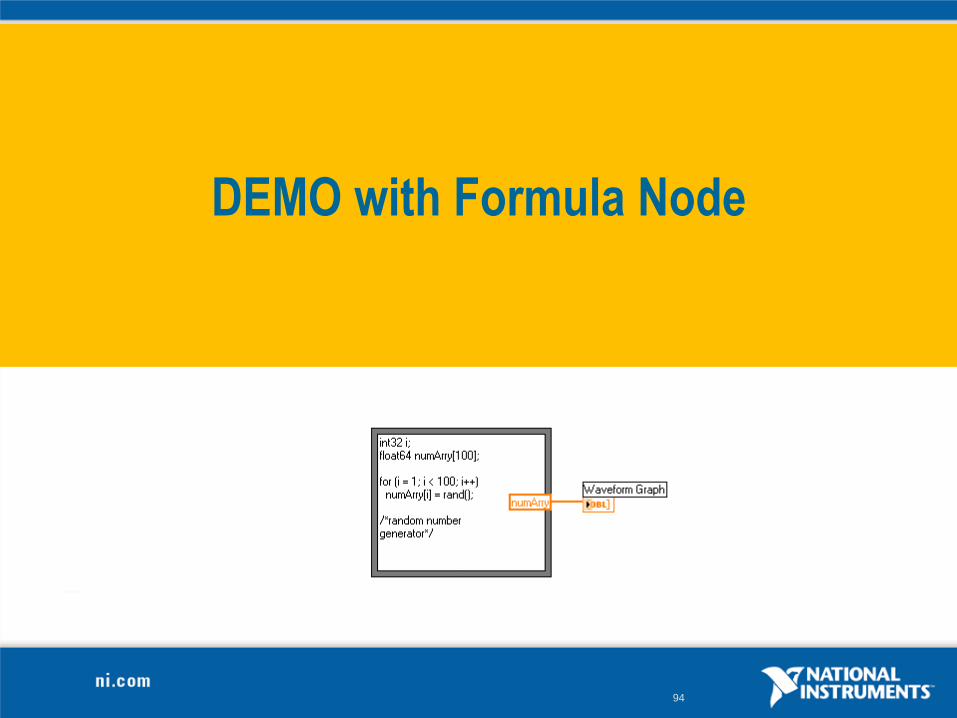
94
DEMO with Formula Node
95
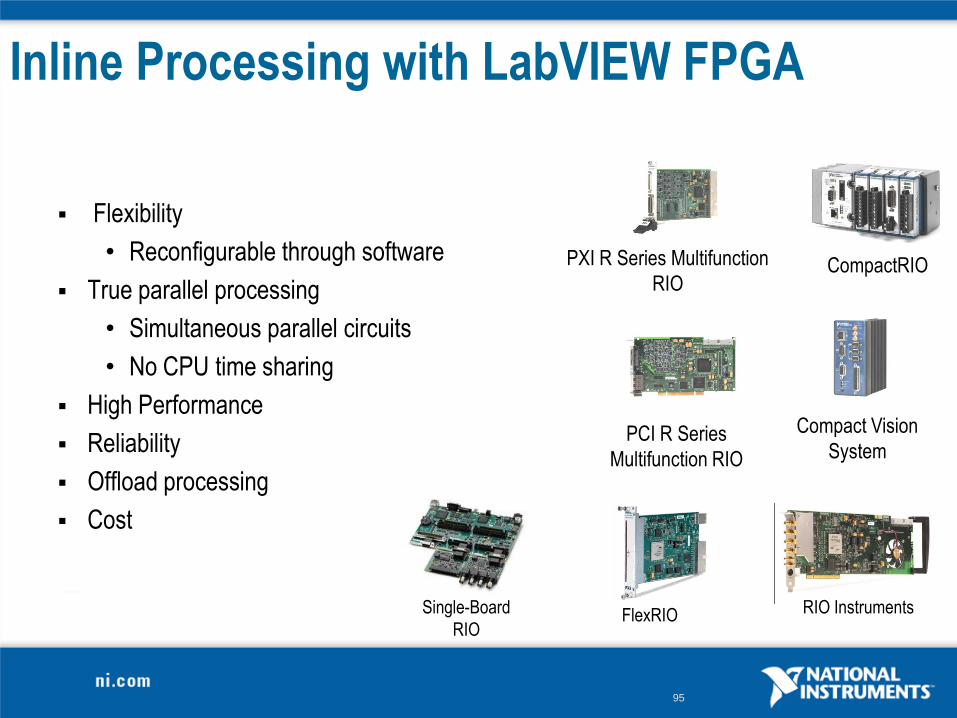
Inline Processing with LabVIEW FPGA
Flexibility
• Reconfigurable through software
True parallel processing
• Simultaneous parallel circuits
• No CPU time sharing
High Performance
Reliability
Offload processing
Cost
Compact Vision
SystemPCI R Series
Multifunction RIO
FlexRIO
PXI R Series Multifunction
RIOCompactRIO
RIO InstrumentsSingle-Board
RIO
96
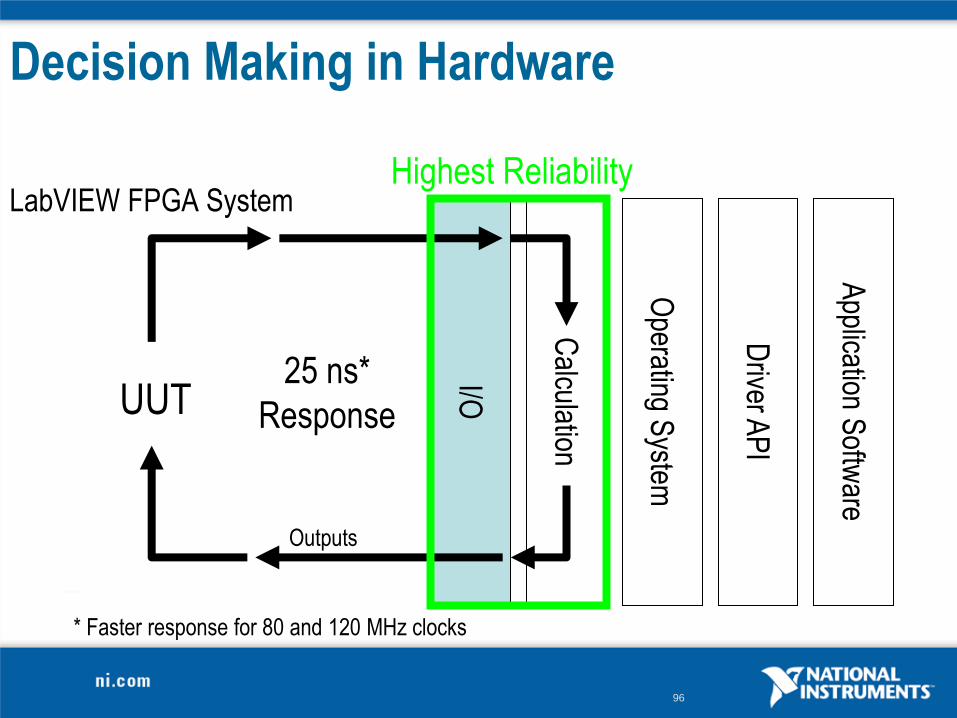
Decision Making in Hardware
LabVIEW FPGA System
I/O
Operating S
ystem
Driver A
PI
Application S
oftware
Calculation
25 ns*
Response
Outputs
UUT
* Faster response for 80 and 120 MHz clocks
Highest Reliability
97
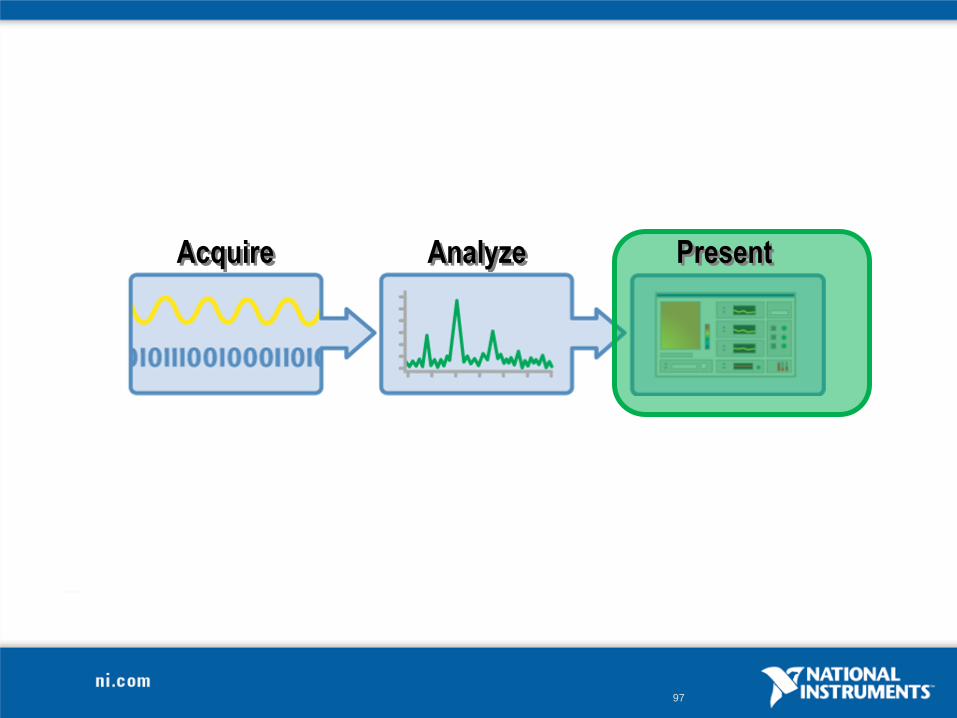
AnalyzeAcquire Present
98
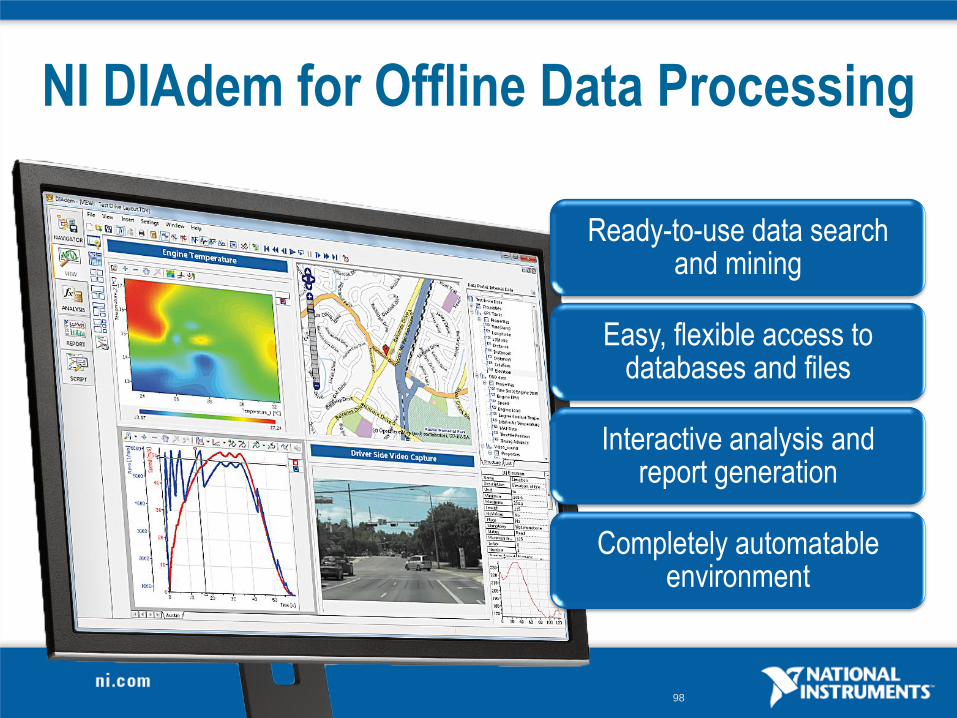
NI DIAdem for Offline Data Processing
Ready-to-use data search and mining
Easy, flexible access to databases and files
Interactive analysis and report generation
Completely automatable environment
99
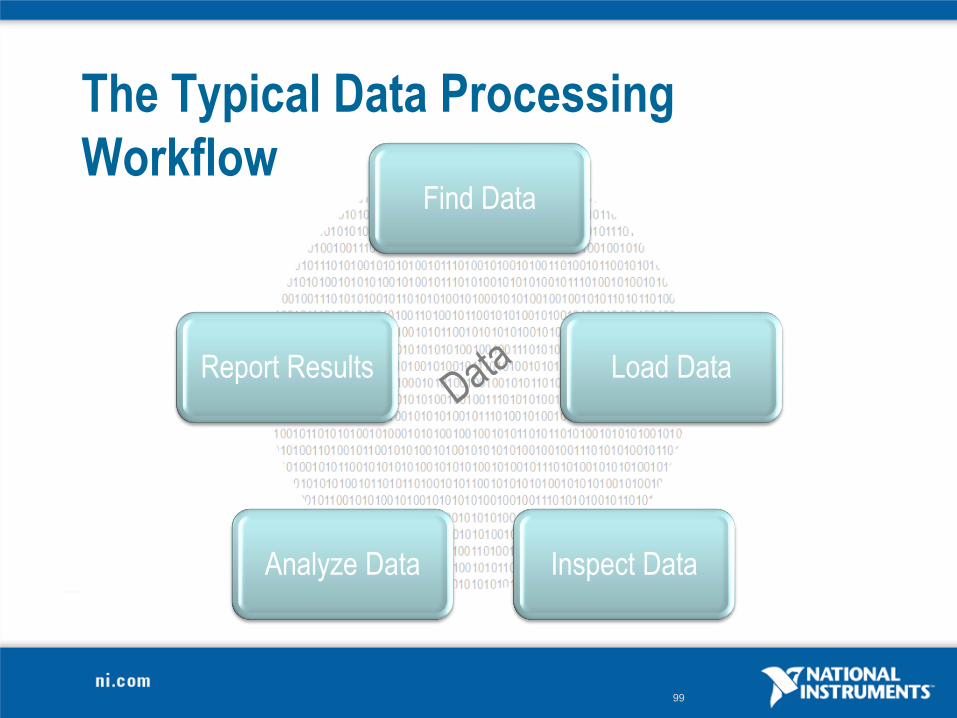
Report Results Load Data
Analyze Data Inspect Data
The Typical Data Processing
WorkflowFind Data
100
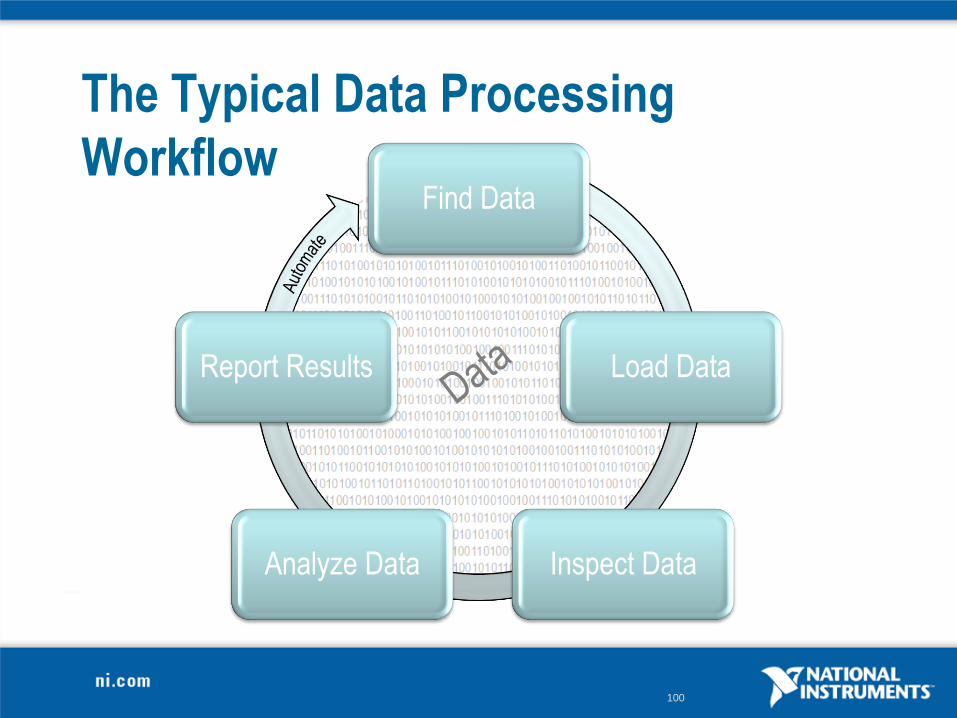
The Typical Data Processing
WorkflowFind Data
Load Data
Inspect DataAnalyze Data
Report Results
101
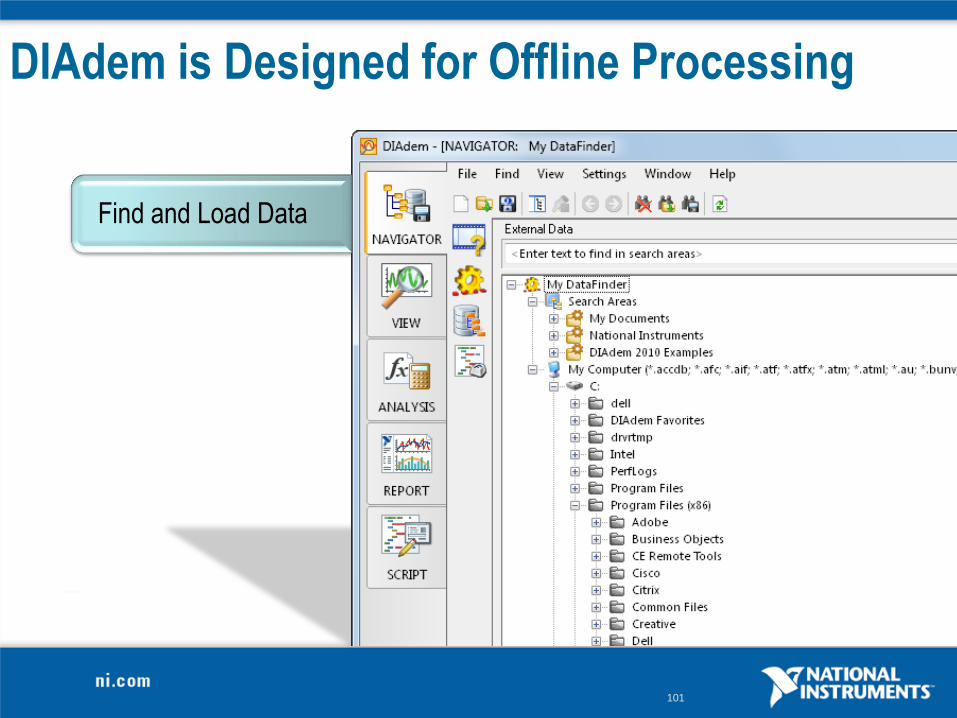
DIAdem is Designed for Offline Processing
Find and Load Data
102
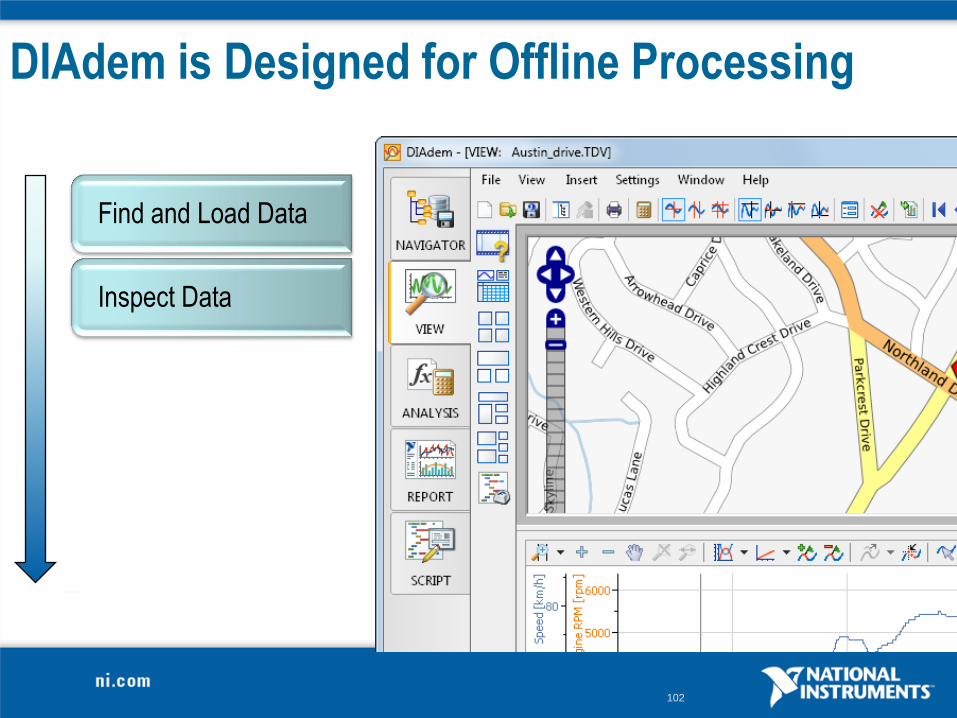
DIAdem is Designed for Offline Processing
Find and Load Data
Inspect Data
103
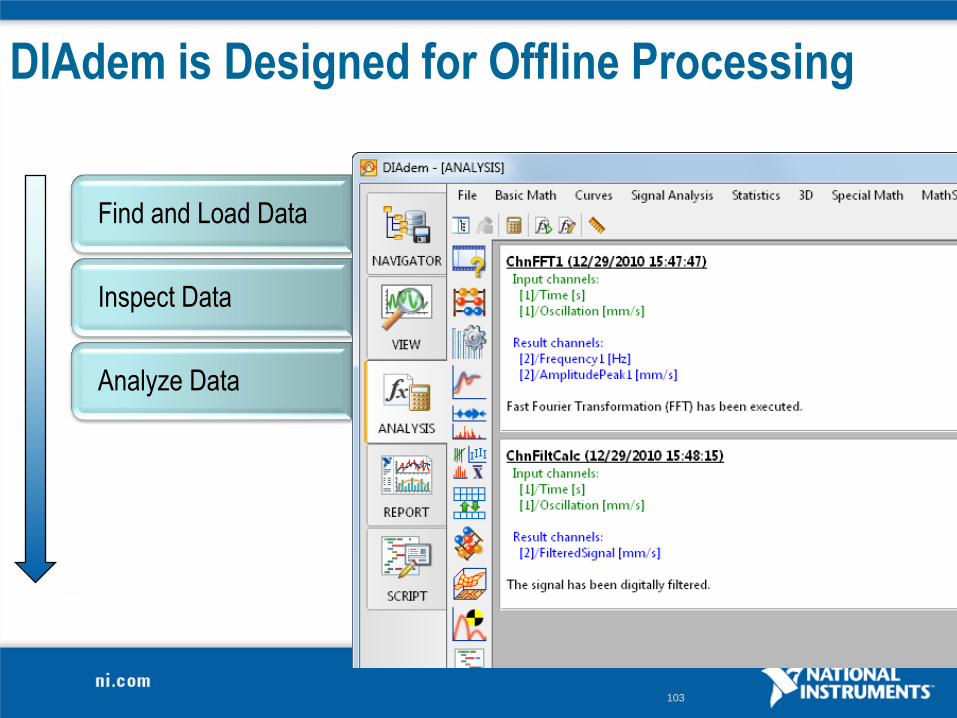
DIAdem is Designed for Offline Processing
Find and Load Data
Inspect Data
Analyze Data
104
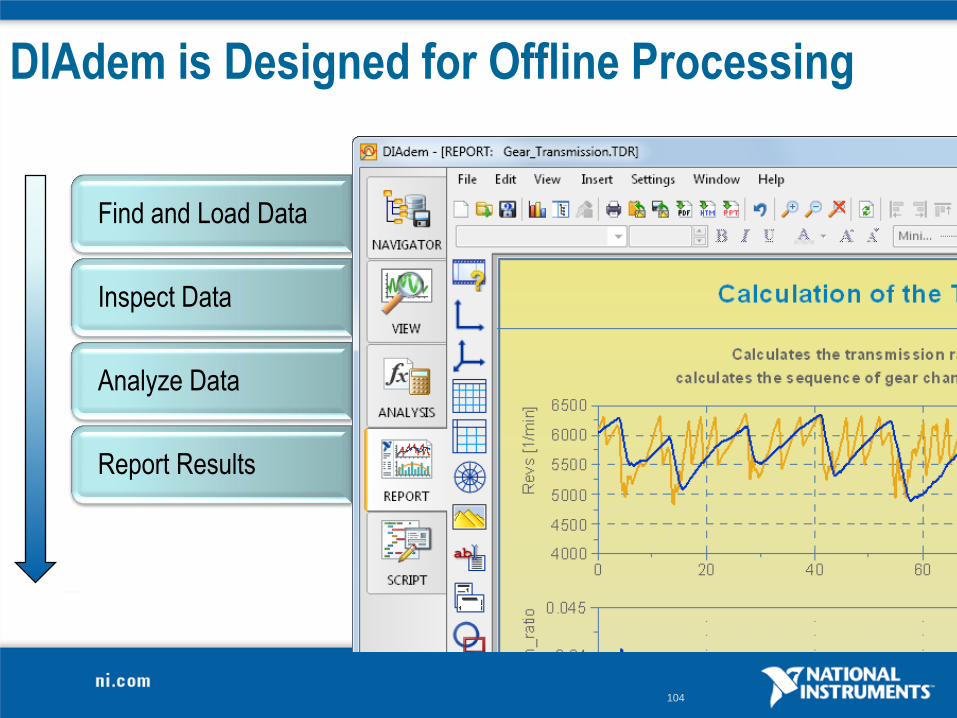
DIAdem is Designed for Offline Processing
Find and Load Data
Inspect Data
Analyze Data
Report Results
105
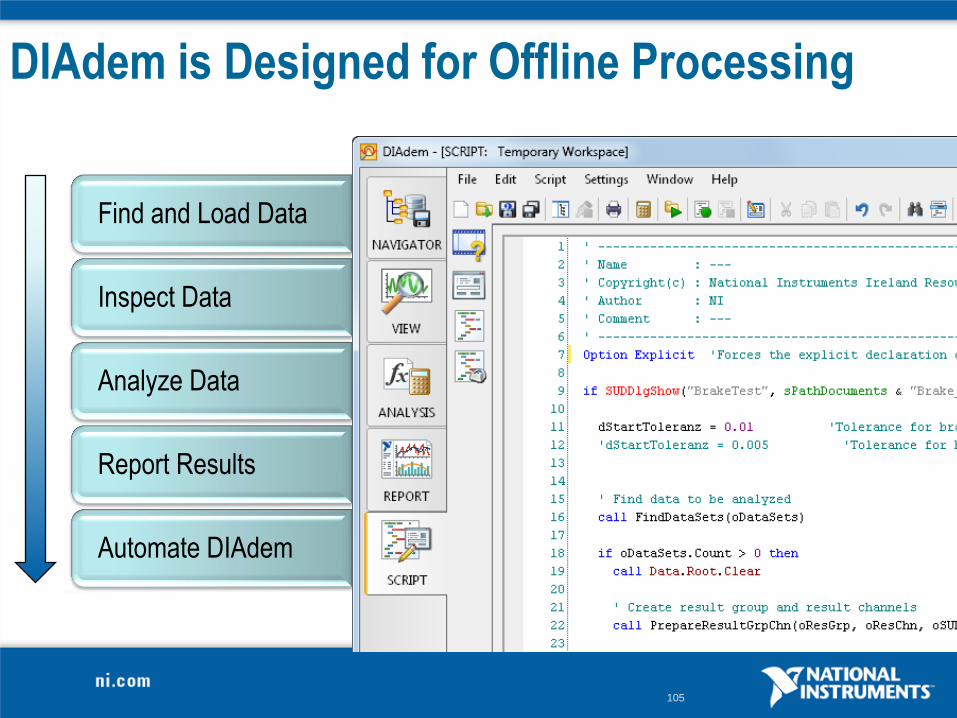
DIAdem is Designed for Offline Processing
Find and Load Data
Inspect Data
Analyze Data
Report Results
Automate DIAdem
106
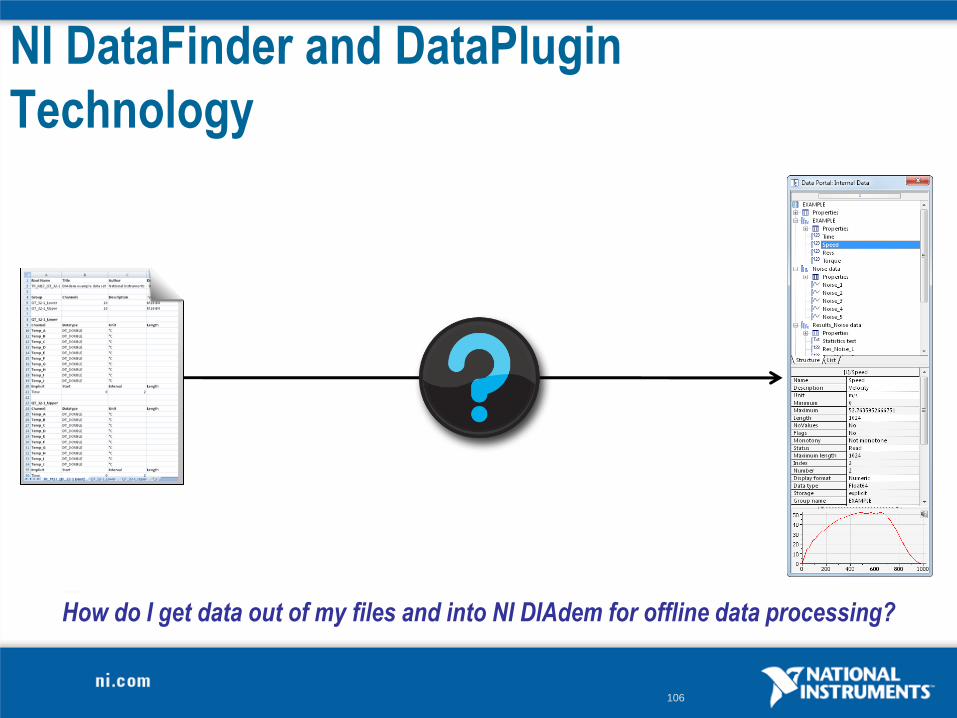
NI DataFinder and DataPlugin
Technology
How do I get data out of my files and into NI DIAdem for offline data processing?
107
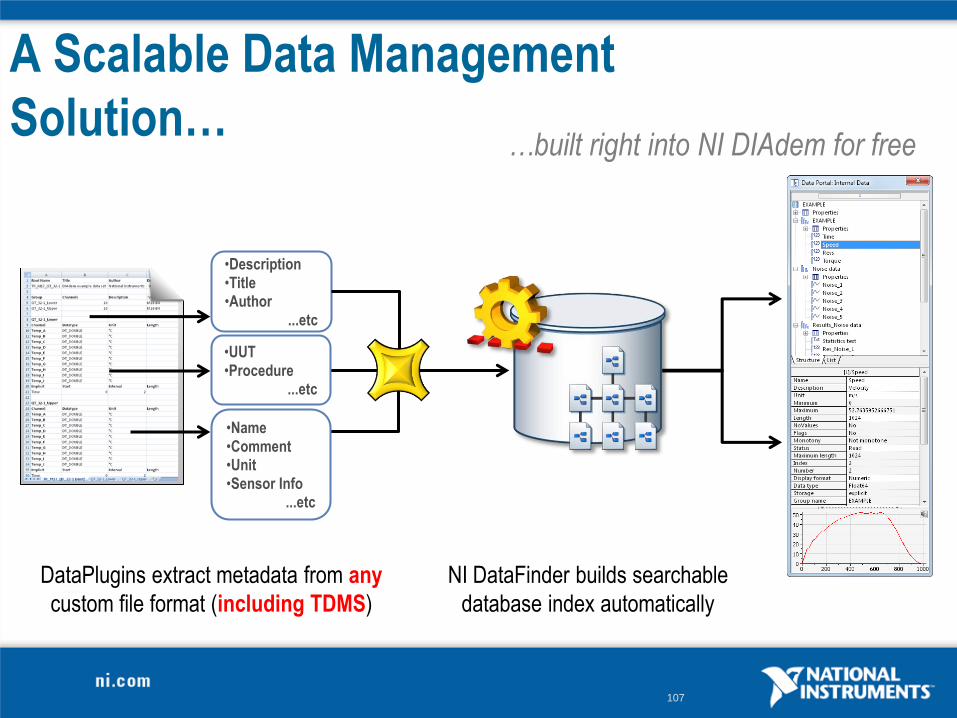
A Scalable Data Management
Solution…
•Description•Title•Author
...etc
•Name•Comment•Unit•Sensor Info
...etc
DataPlugins extract metadata from any
custom file format (including TDMS)
NI DataFinder builds searchable
database index automatically
•UUT•Procedure
...etc
…built right into NI DIAdem for free
108
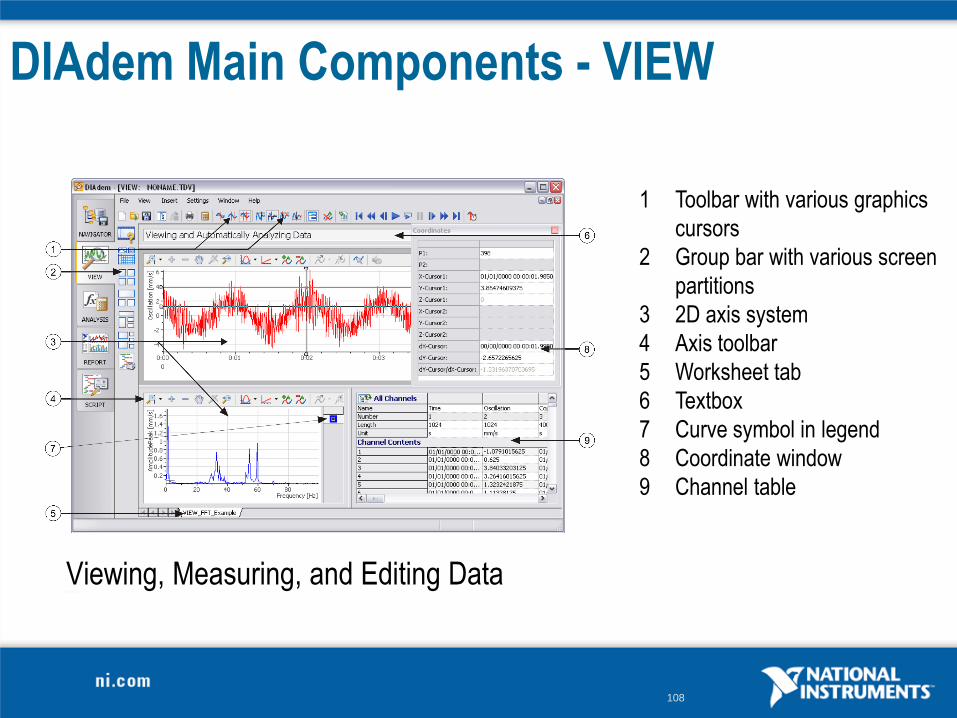
1 Toolbar with various graphics
cursors
2 Group bar with various screen
partitions
3 2D axis system
4 Axis toolbar
5 Worksheet tab
6 Textbox
7 Curve symbol in legend
8 Coordinate window
9 Channel table
Viewing, Measuring, and Editing Data
DIAdem Main Components - VIEW
109
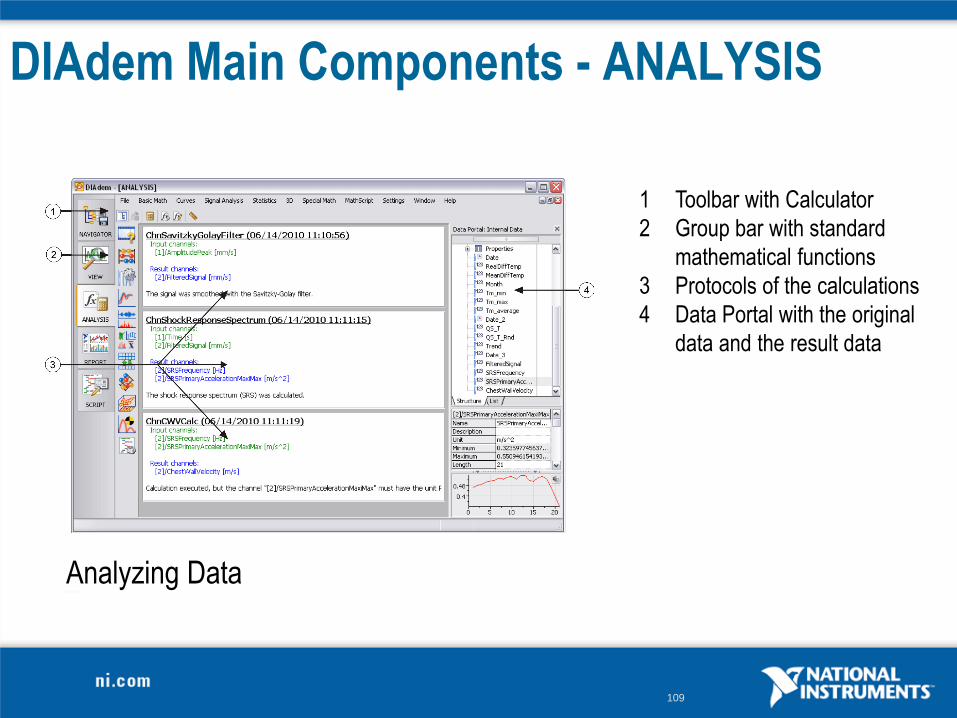
1 Toolbar with Calculator
2 Group bar with standard
mathematical functions
3 Protocols of the calculations
4 Data Portal with the original
data and the result data
Analyzing Data
DIAdem Main Components - ANALYSIS
110
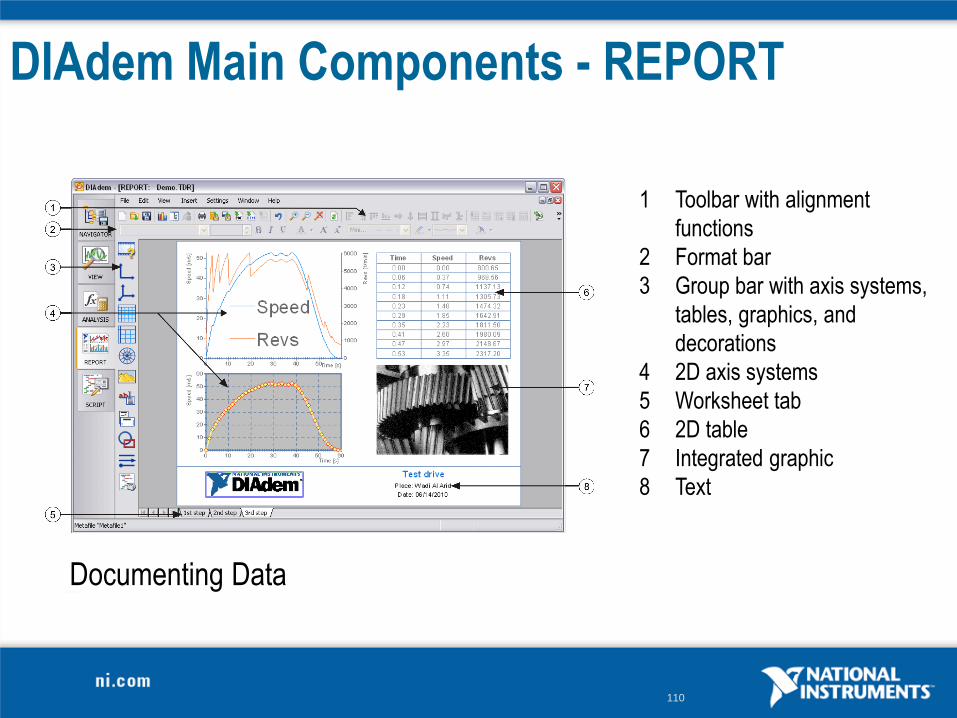
1 Toolbar with alignment
functions
2 Format bar
3 Group bar with axis systems,
tables, graphics, and
decorations
4 2D axis systems
5 Worksheet tab
6 2D table
7 Integrated graphic
8 Text
Documenting Data
DIAdem Main Components - REPORT
111
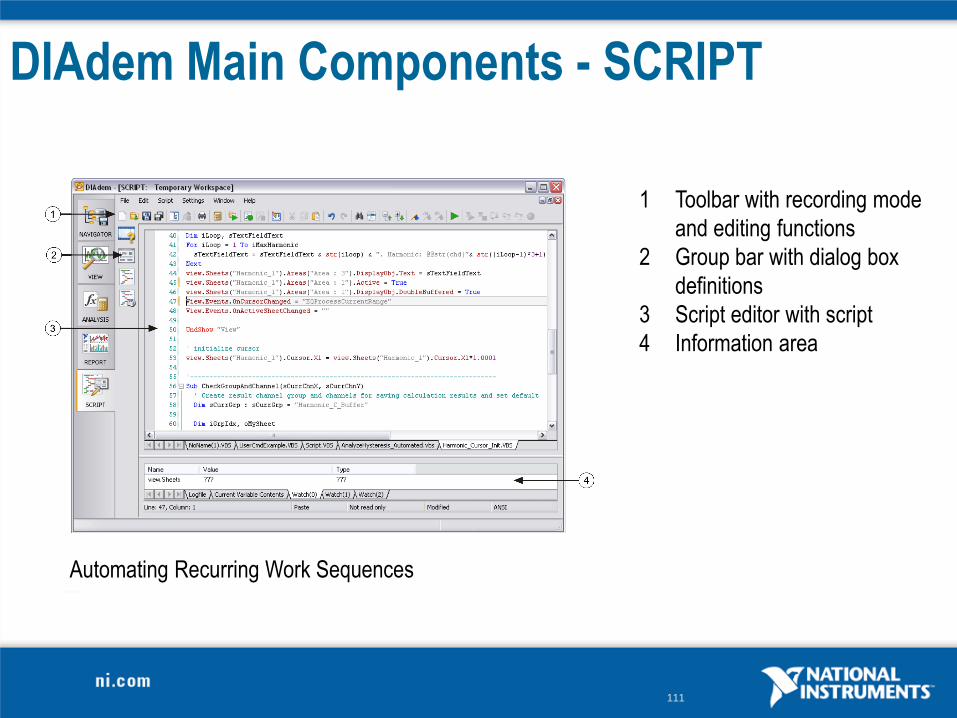
1 Toolbar with recording mode
and editing functions
2 Group bar with dialog box
definitions
3 Script editor with script
4 Information area
Automating Recurring Work Sequences
DIAdem Main Components - SCRIPT
112
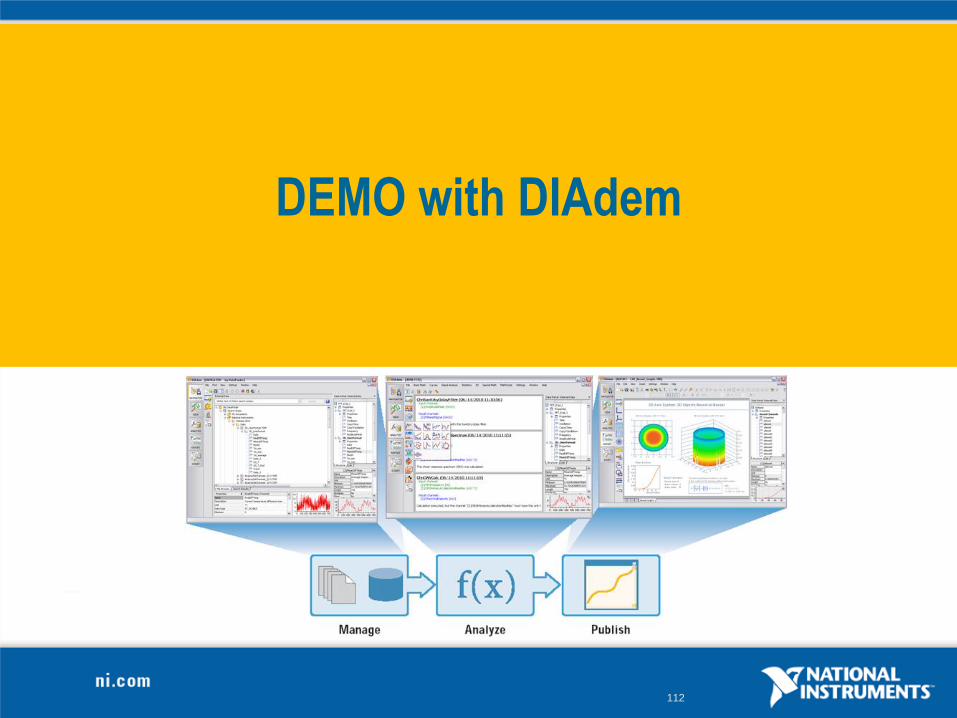
DEMO with DIAdem
113
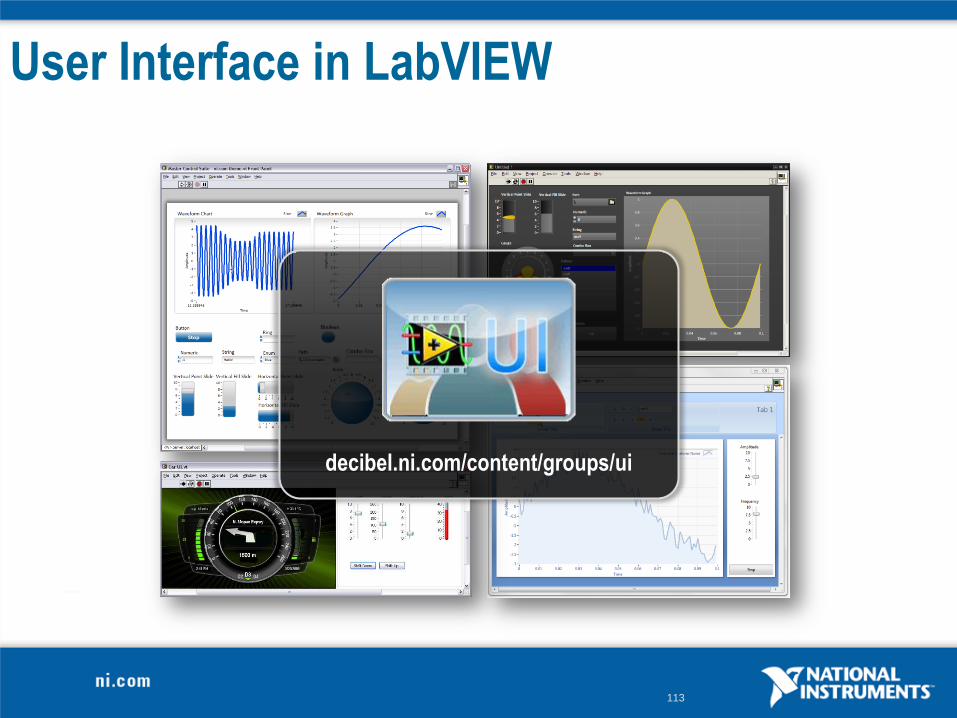
User Interface in LabVIEW
decibel.ni.com/content/groups/ui
114
Three Commandments to Think of
I. Think About Your User
II. Don’t Be Innovative
III. Less Is More
115
• Do they know as much as you (they never do)?
• How will they interact with the application?
• Why are they using your software?
The software (and UI) should support their goal
Think About Your User
116
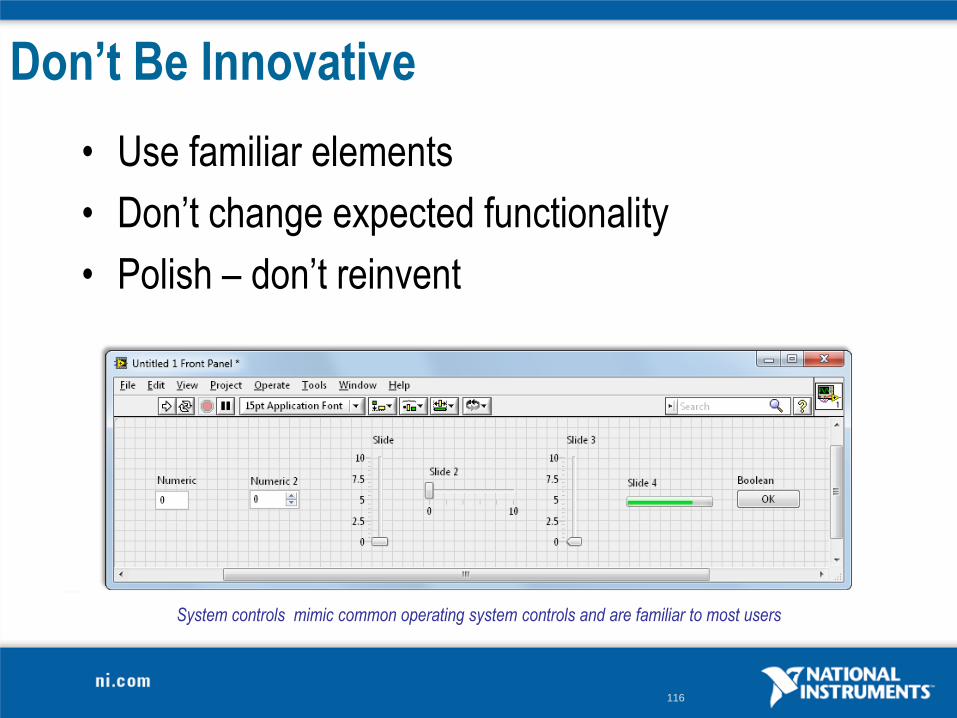
Don’t Be Innovative
• Use familiar elements
• Don’t change expected functionality
• Polish – don’t reinvent
System controls mimic common operating system controls and are familiar to most users
117
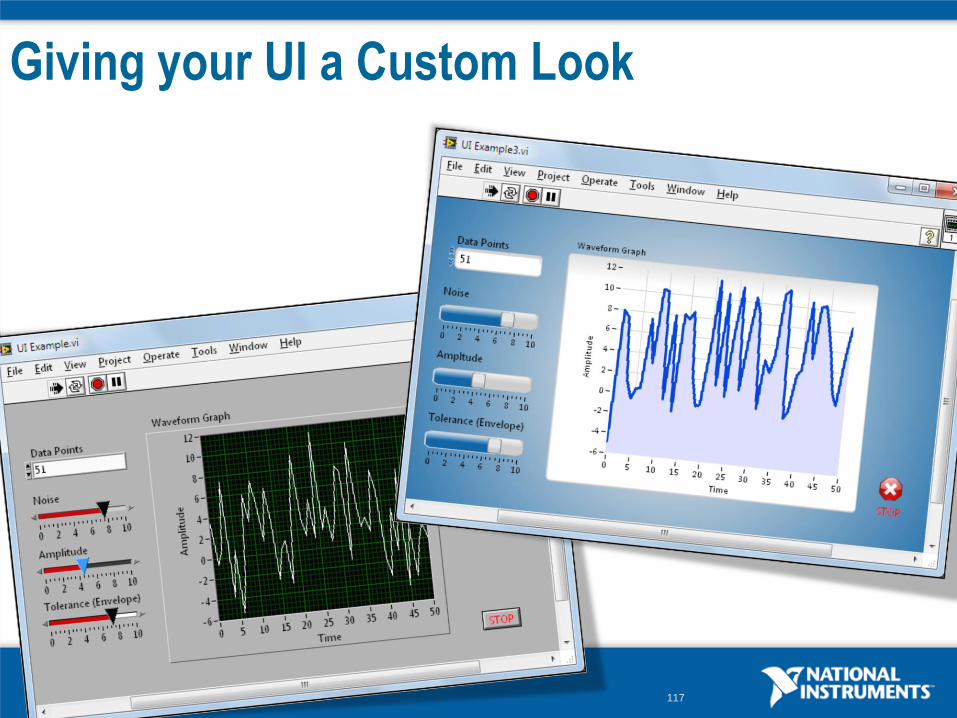
Giving your UI a Custom Look
118
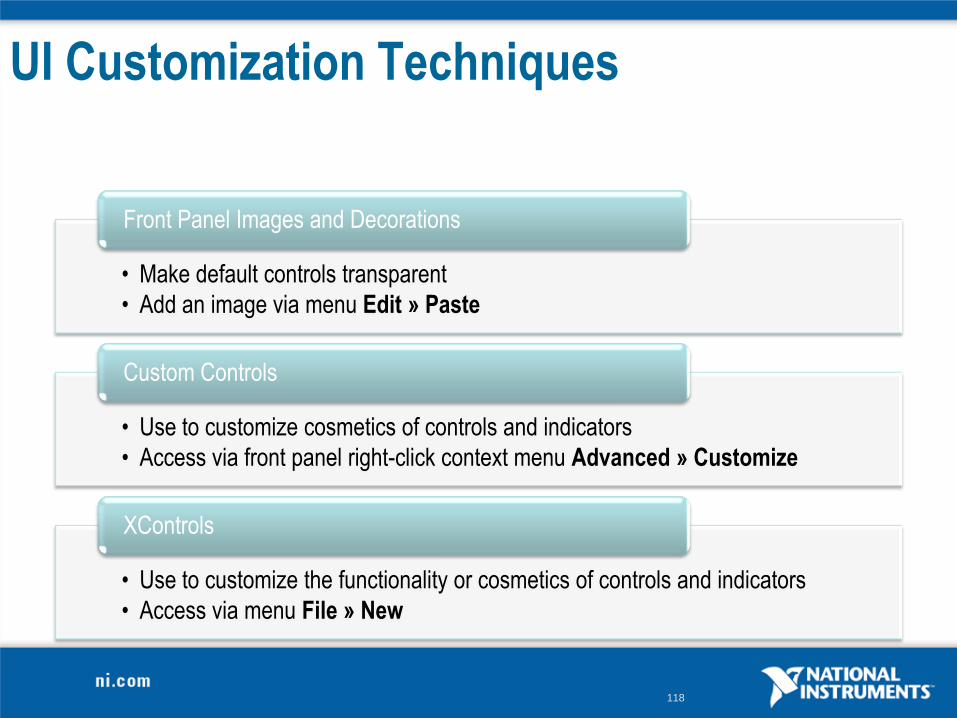
UI Customization Techniques
• Make default controls transparent
• Add an image via menu Edit » Paste
Front Panel Images and Decorations
• Use to customize cosmetics of controls and indicators
• Access via front panel right-click context menu Advanced » Customize
Custom Controls
• Use to customize the functionality or cosmetics of controls and indicators
• Access via menu File » New
XControls
119
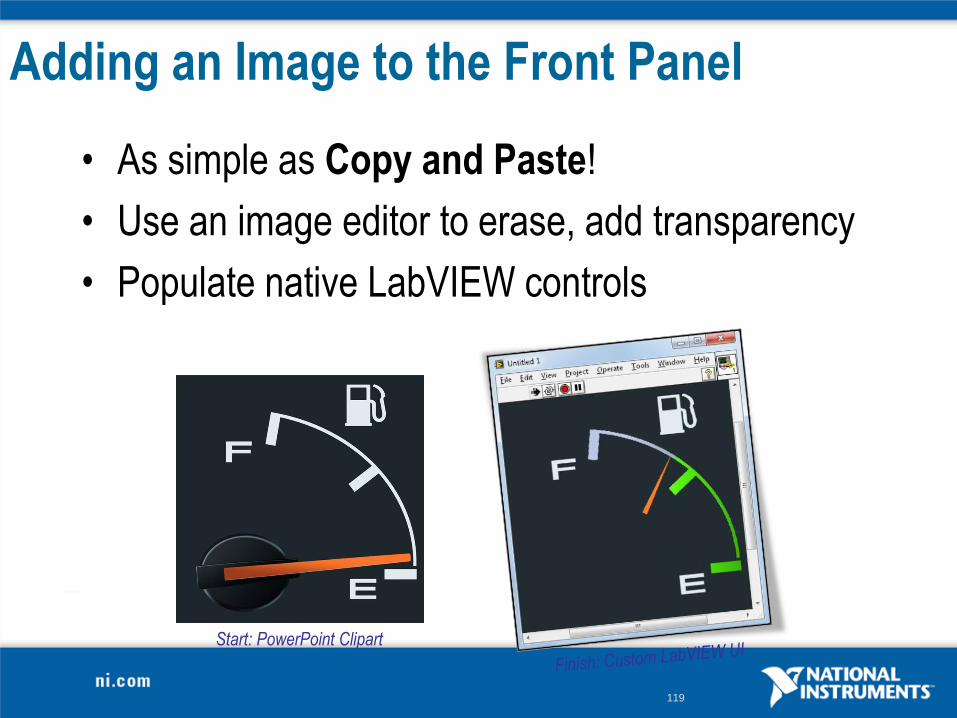
Adding an Image to the Front Panel
• As simple as Copy and Paste!
• Use an image editor to erase, add transparency
• Populate native LabVIEW controls
Start: PowerPoint Clipart
120
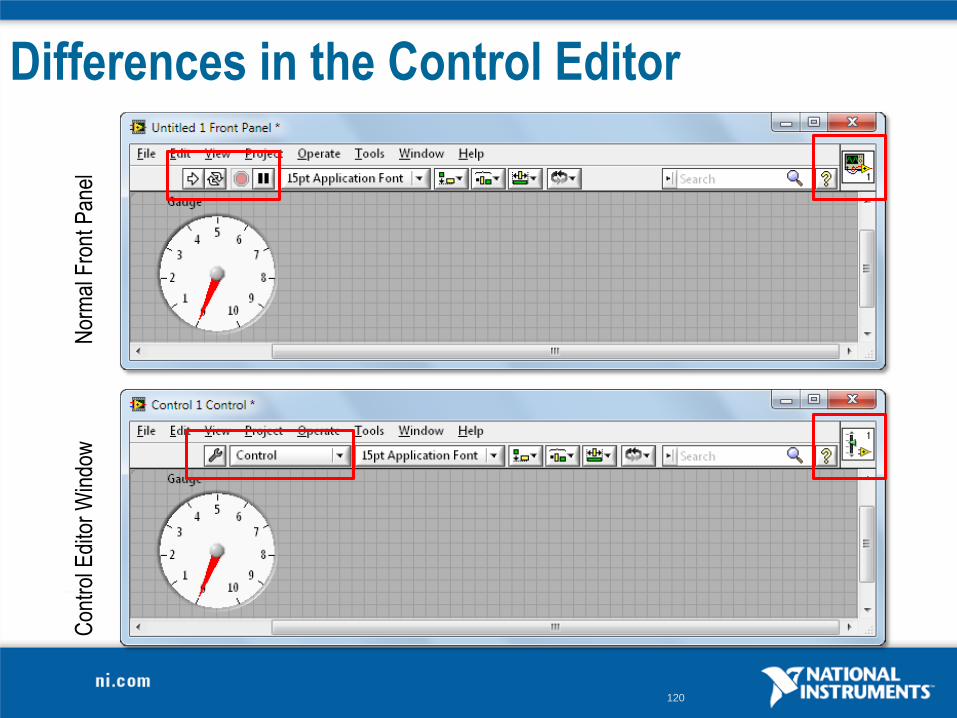
Differences in the Control EditorN
orm
al F
ront
Pan
elC
ontr
ol E
dito
r W
indo
w
121
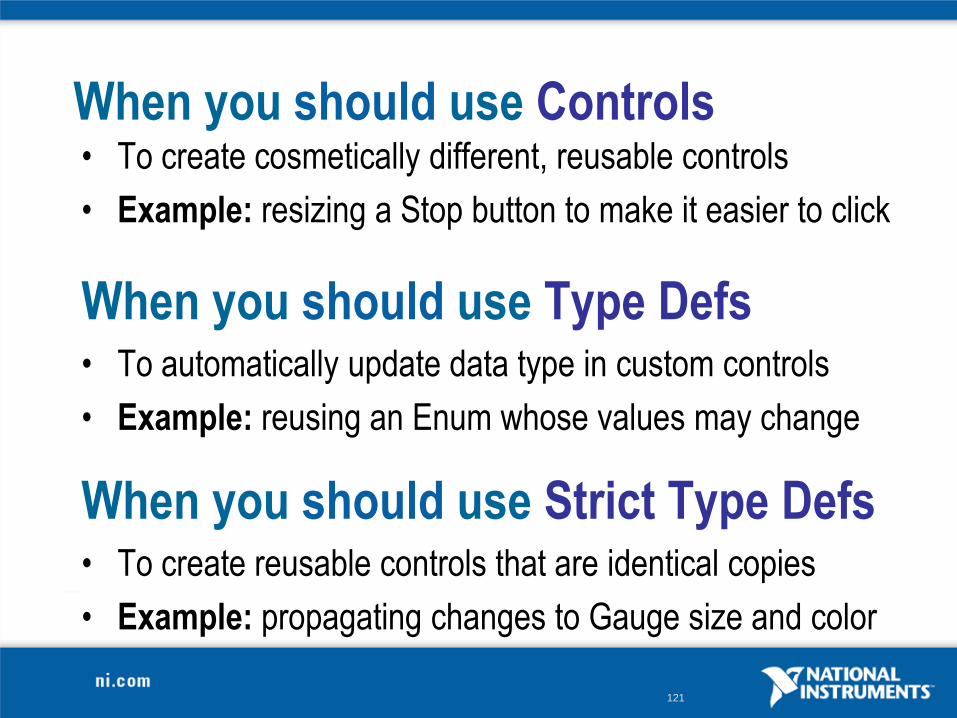
When you should use Controls• To create cosmetically different, reusable controls
• Example: resizing a Stop button to make it easier to click
When you should use Type Defs• To automatically update data type in custom controls
• Example: reusing an Enum whose values may change
When you should use Strict Type Defs• To create reusable controls that are identical copies
• Example: propagating changes to Gauge size and color
122
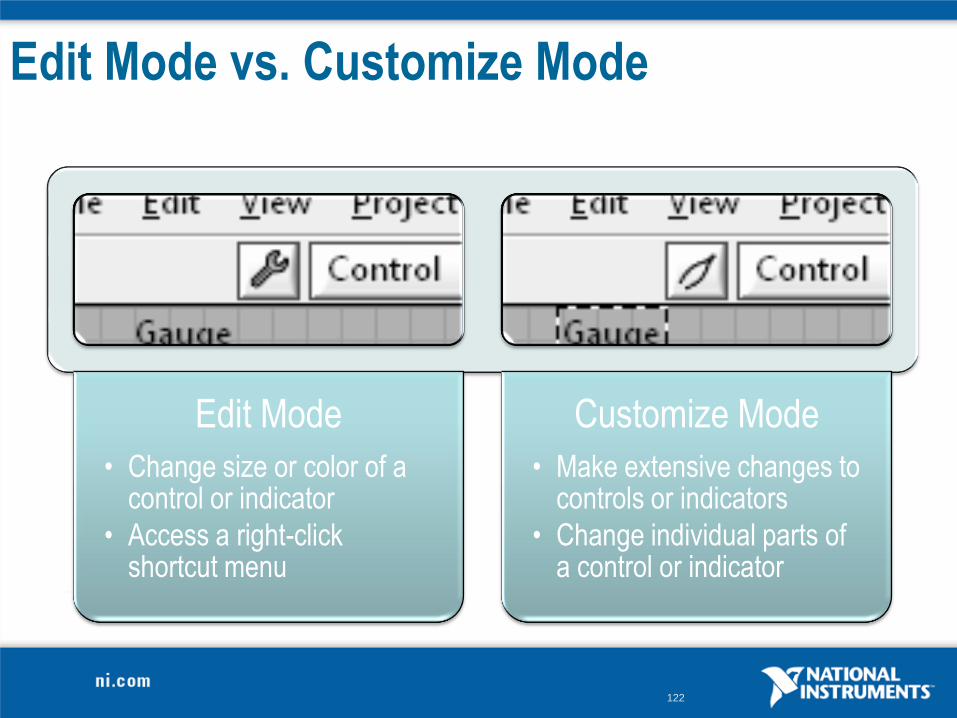
Edit Mode vs. Customize Mode
Edit Mode
• Change size or color of a control or indicator
• Access a right-click shortcut menu
Customize Mode
• Make extensive changes to controls or indicators
• Change individual parts of a control or indicator
123
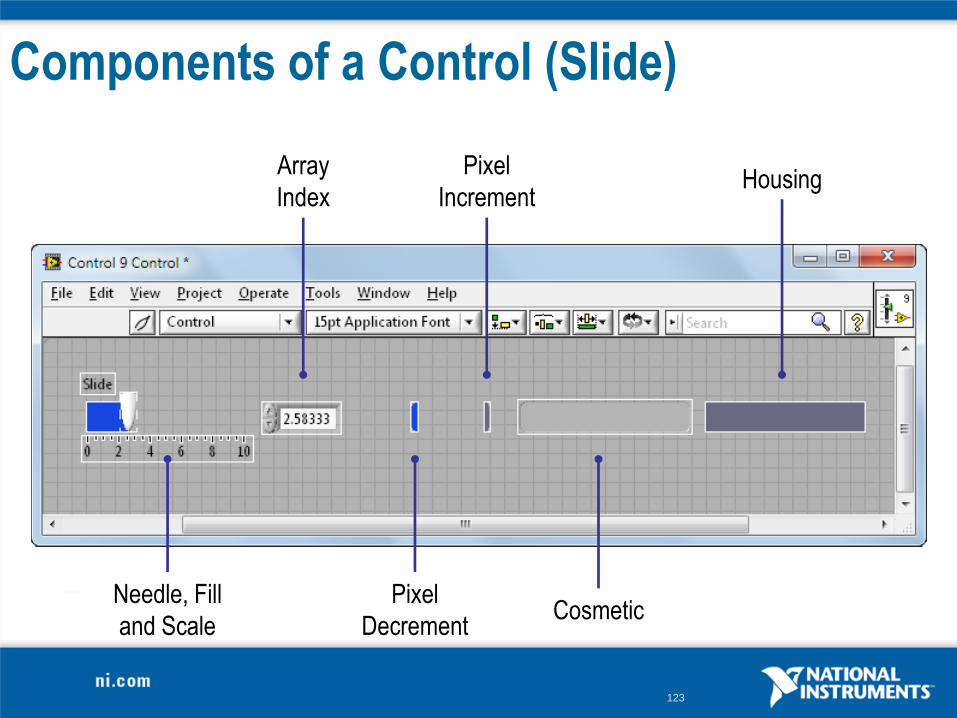
Components of a Control (Slide)
Needle, Fill
and Scale
Array
Index
Pixel
Decrement
Pixel
Increment
Cosmetic
Housing
124
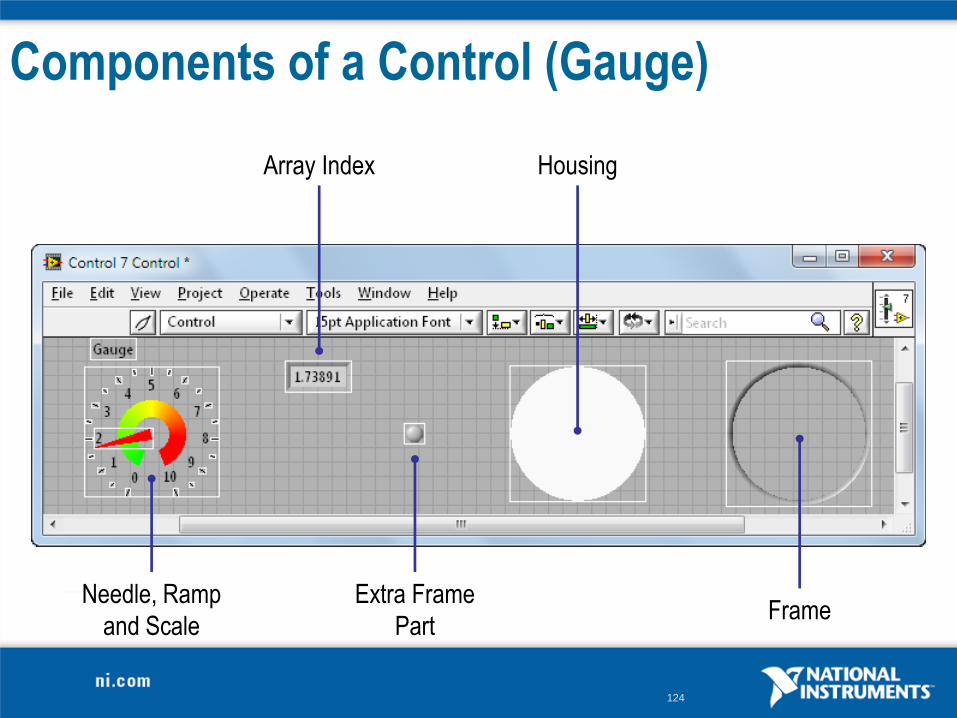
Components of a Control (Gauge)
Needle, Ramp
and Scale
Array Index
Extra Frame
Part
Housing
Frame
125
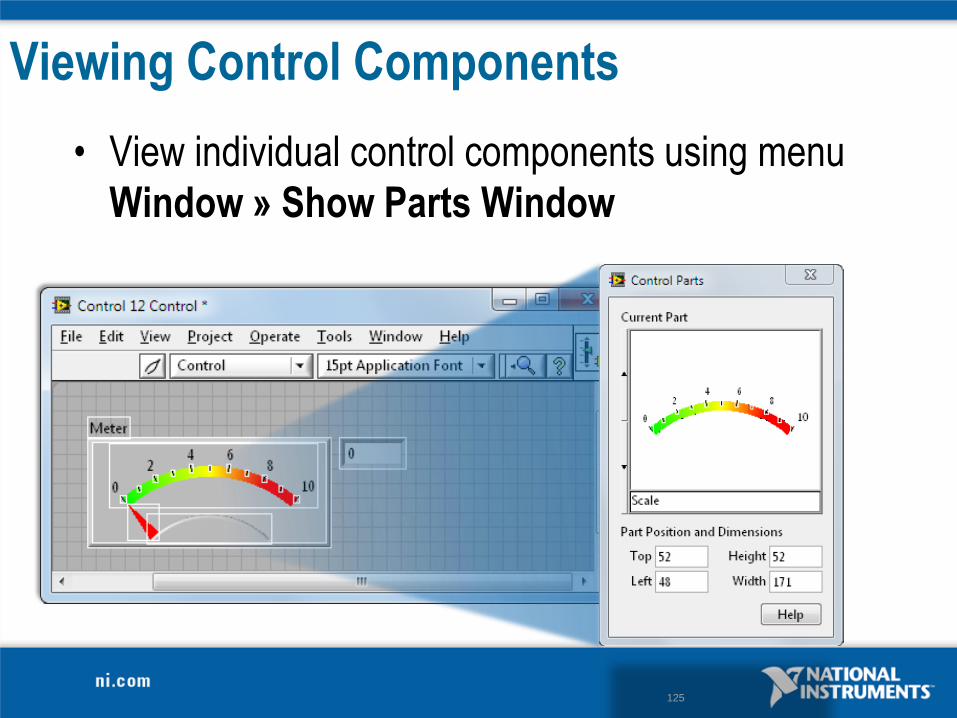
Viewing Control Components
• View individual control components using menu
Window » Show Parts Window
126
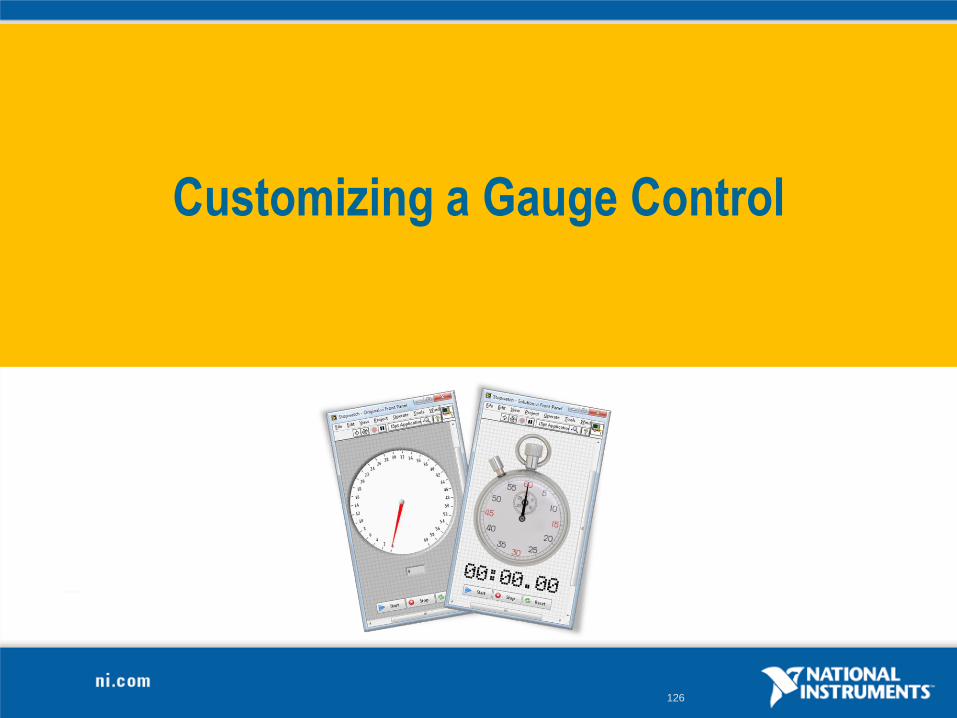
Customizing a Gauge Control
127
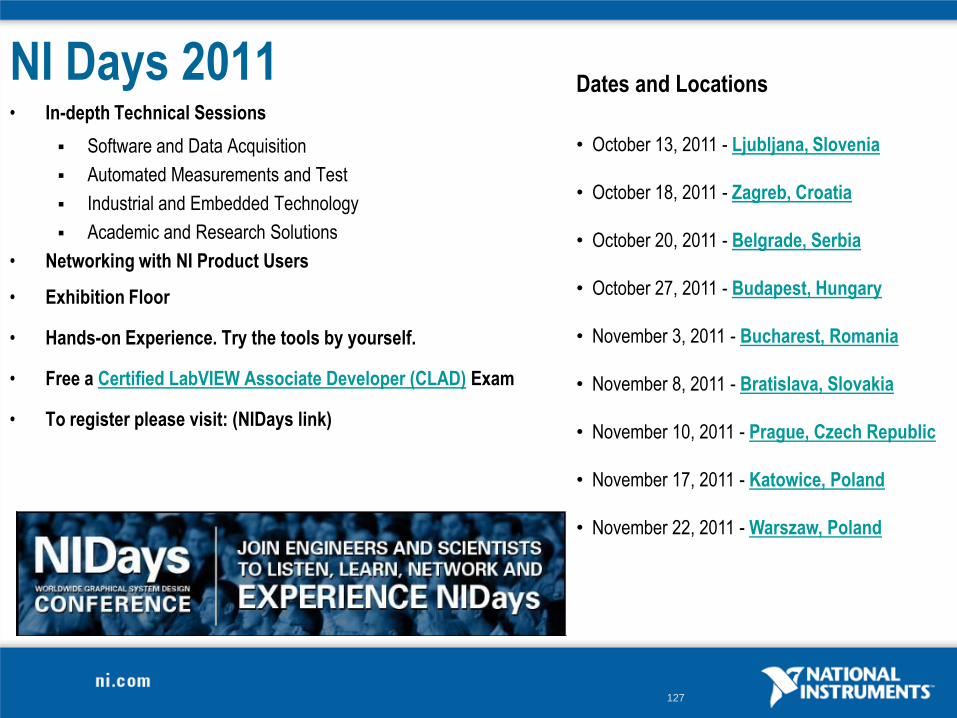
NI Days 2011• In-depth Technical Sessions
Software and Data Acquisition
Automated Measurements and Test
Industrial and Embedded Technology
Academic and Research Solutions
• Networking with NI Product Users
• Exhibition Floor
• Hands-on Experience. Try the tools by yourself.
• Free a Certified LabVIEW Associate Developer (CLAD) Exam
• To register please visit: (NIDays link)
Dates and Locations
• October 13, 2011 - Ljubljana, Slovenia
• October 18, 2011 - Zagreb, Croatia
• October 20, 2011 - Belgrade, Serbia
• October 27, 2011 - Budapest, Hungary
• November 3, 2011 - Bucharest, Romania
• November 8, 2011 - Bratislava, Slovakia
• November 10, 2011 - Prague, Czech Republic
• November 17, 2011 - Katowice, Poland
• November 22, 2011 - Warszaw, Poland
128
Thank you!