Wendy Plesniak, BWH Sebastien Barre, Kitware Mathieu Malaterre, Kitware Michael Halle, BWH
Introduction to ParaView
Dan Lipsa,R&D Engineer, Kitware Inc.
2
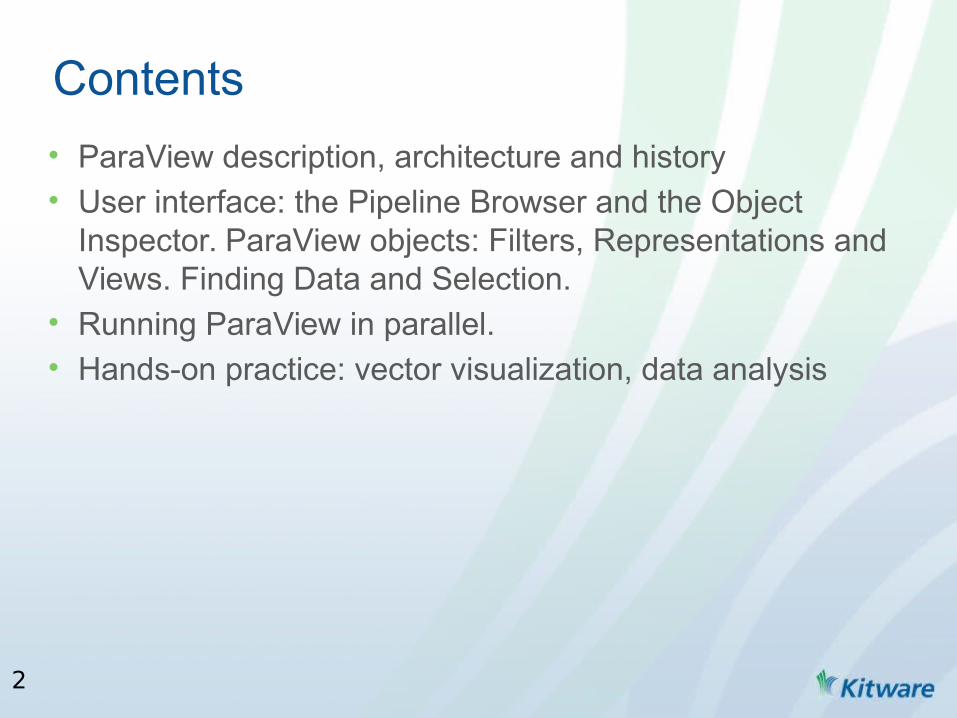
Contents
• ParaView description, architecture and history• User interface: the Pipeline Browser and the Object
Inspector. ParaView objects: Filters, Representations and Views. Finding Data and Selection.
• Running ParaView in parallel.• Hands-on practice: vector visualization, data analysis

3
An open-source application and architecture for display and analysis of scientific datasets.
• Application - you don’t have to write any code to analyze your data• Architecture - designed to be extensible if you want to code
Custom apps, plugins, python scripting, Catalyst, ParaViewWeb
• Open-source – BSD 3-clause license
• Display - excels at traditional scientific vis qualitative 3D rendering• Analysis - data drill down through charts, stats, all the way to values• ParaView – parallel - scales from notebooks to world’s largest
supercomputers
What is ParaView?

4
ParaView Architecture
Network

5
History
• 1999 LANL/Kitware project (via ASCI Views)– Build an end user tool from VTK (TCL-TK interface)– Make VTK scale– October 2002 first public release, version 0.6
• 2002-2005 Versions 0.6 through 2.6– Continued growth under DOE Tri Labs, Army Research
Lab and various other partnerships
• September 2005 ParaQ project started– Sandia, Kitware and CSimSoft– Make ParaView easier to use (Qt interface)– Add quantitative analysis– May 2007 version 3.0 released
• Continuing to evolve– 3.2, 3.4, 3.6, 3.8, 3.10, 3.12, 3.14, 3.98– 4.0.1, 4.1, 4.2, 4.3.1 (January 2015)
http://www.paraview.org/Wiki/ParaView_Release_Notes
6
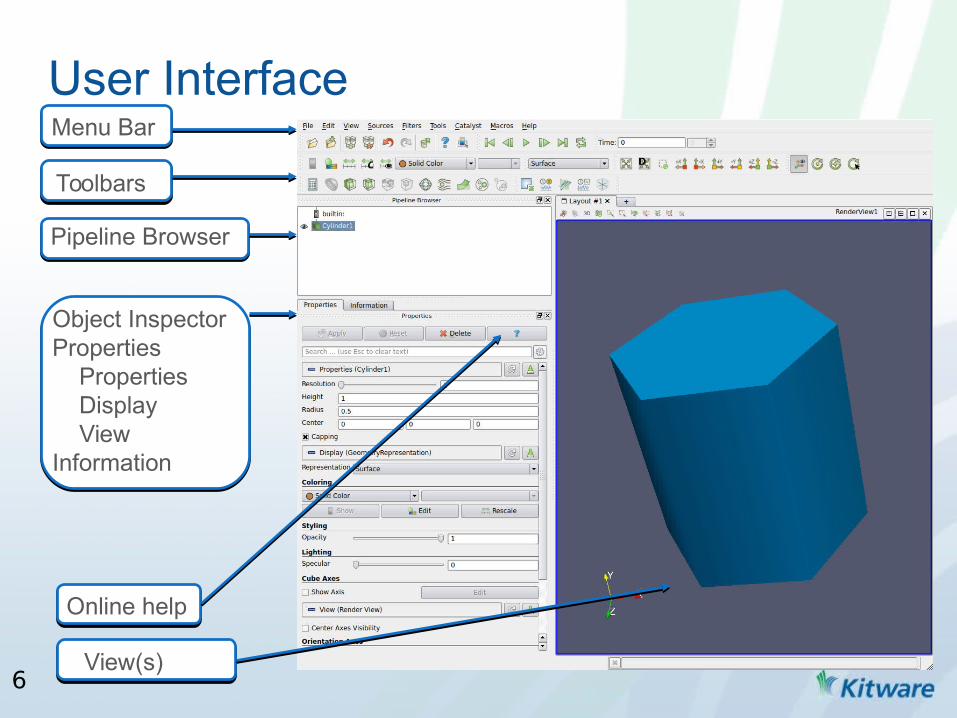
User InterfaceMenu Bar
Toolbars
Pipeline Browser
Object InspectorProperties Properties Display ViewInformation
View(s)
Online help

7
Help
• Online help
• The ParaView Guide (262 pages)• The ParaView Tutorial• ParaView Mailing Lists• ParaView Wiki• http://www.paraview.org/documentation/

8
How to Use ParaView
1. Read in data: File → Open, hit – Over 100 file formats supported– Help/Readers - readers compiled in
2. Add a filter to process data: – Tune filter properties, hit – Repeat Step 2 as needed
3. Tune Display (for all Filter,View pairs) and View (for all Views) parameters
4. Save datasets, rendered results (screenshot or animation) or application state
reader
file
slice
warp
Apply
ApplyEdit → Undo
Filter = an object that operates on data: reads its inputs and produces one or more outputsReader = reads a file and produces an outputSource = produces an output (Cylinder)Pipeline object = a filter, reader or source
display

9
Filter Properties and the Apply Button
• Active Filter properties• ParaView is meant to process large data – it might take a long time
when changing a filter property.
Toggle auto apply

10
ParaView Dataset TypesvtkStructuredGridvtkRectilinearGridvtkImageData
vtkUnstructuredGridvtkPolyDataMulti-blocksMulti-blocks
AMRAMR
Time-varying data
Time-varying data
- points, cells- values associated points and/or cells: scalars, vectors, tensors
11
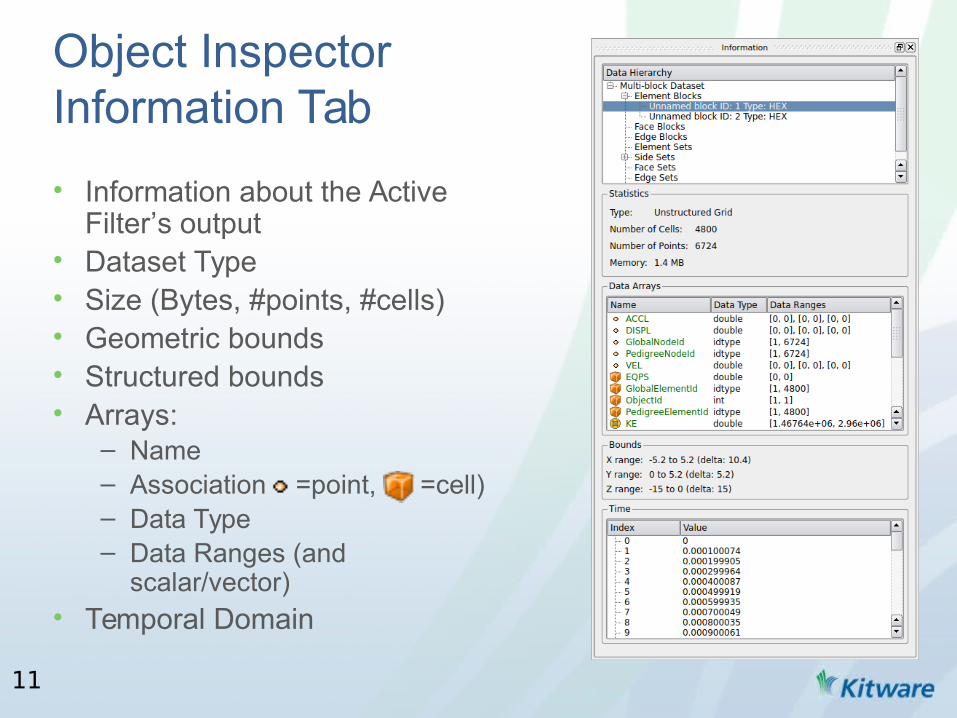
Object InspectorInformation Tab
• Information about the Active Filter’s output
• Dataset Type• Size (Bytes, #points, #cells)• Geometric bounds• Structured bounds• Arrays:
– Name– Association =point, =cell)– Data Type– Data Ranges (and
scalar/vector)• Temporal Domain

12
Multiple Views
Split (Vertical, Horizontal), Maximize, Close buttons Active view: Display and View properties pertain to it Right-click to link cameras
13
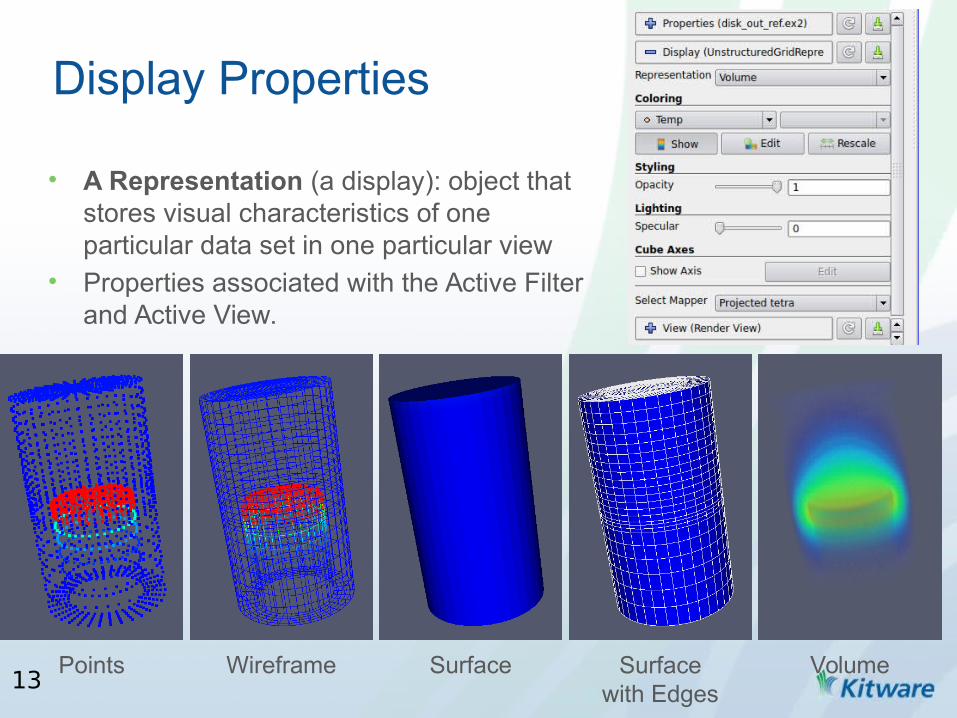
• A Representation (a display): object that stores visual characteristics of one particular data set in one particular view
• Properties associated with the Active Filter and Active View.
Display Properties
Points Wireframe Surface Surfacewith Edges
Volume

14
Color Map Editor
Rescale to data rangeRescale to custom rangeRescale to data range over all time-stepsInvert the transfer function
Choose preset
Save to preset
MappingScalar Range – Color Palette

15
Color Map (Transfer Function) Editor
16
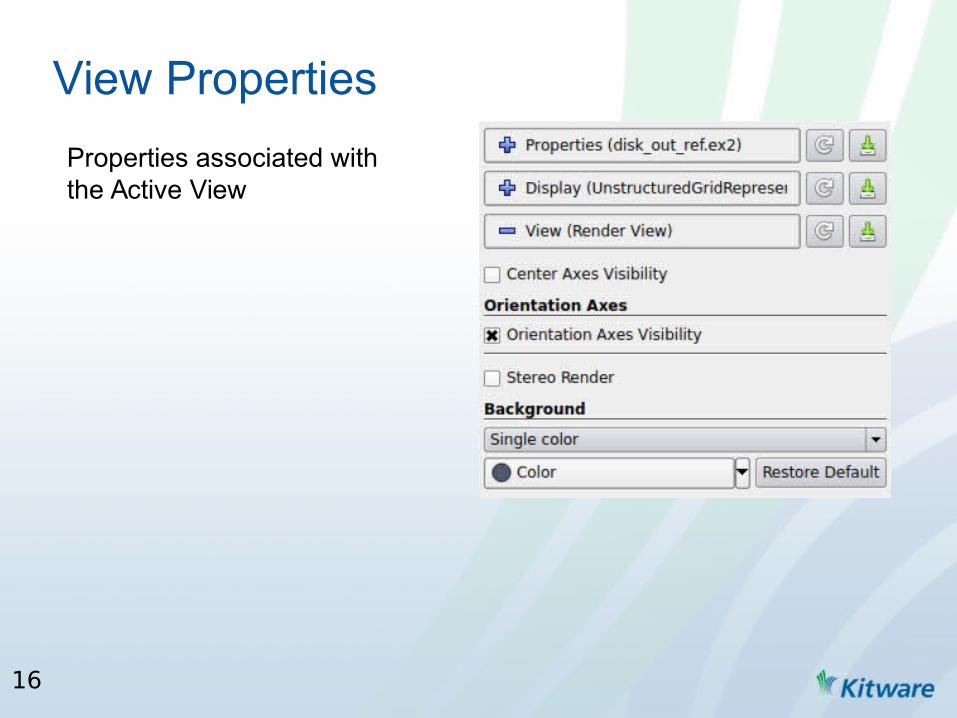
View Properties
Properties associated with the Active View

17
Find properties (for Filters, Displays and Views)
Advanced Properties
Search for properties Toggle on/off advanced
properties

18
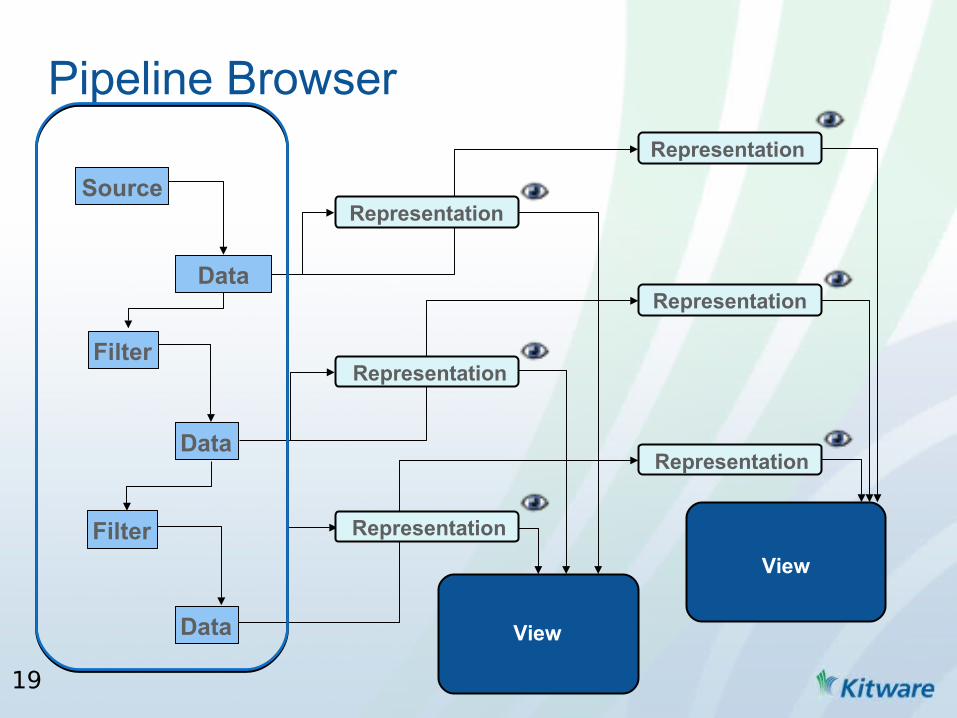
Multi-View Visualization Pipeline
Data
Filter
Source
Filter
Data View
Representation
View
DataRepresentation
Representation
Representation
Representation
Representation
19
Pipeline Browser
Data
Filter
Source
Filter
Data View
Representation
View
DataRepresentation
Representation
Representation
Representation
Representation

20
Filter Properties – acts on active filter
Data
Filter
Source
Filter
Data View
Representation
View
DataRepresentation
Representation
Representation
Representation
Representation
21
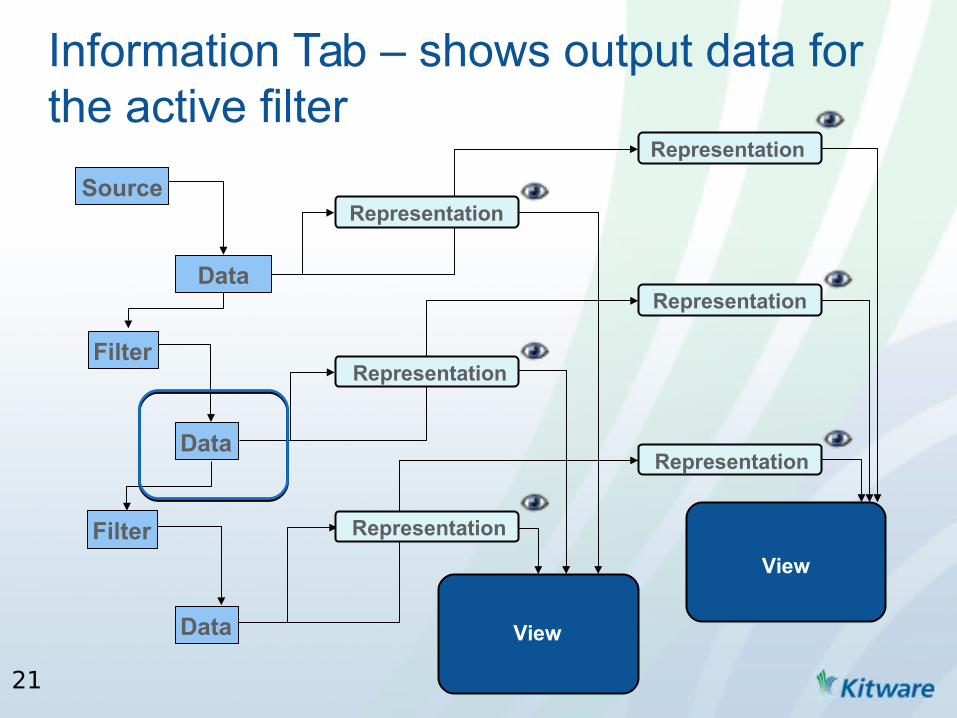
Information Tab – shows output data for the active filter
Data
Filter
Source
Filter
Data View
Representation
View
DataRepresentation
Representation
Representation
Representation
Representation
22
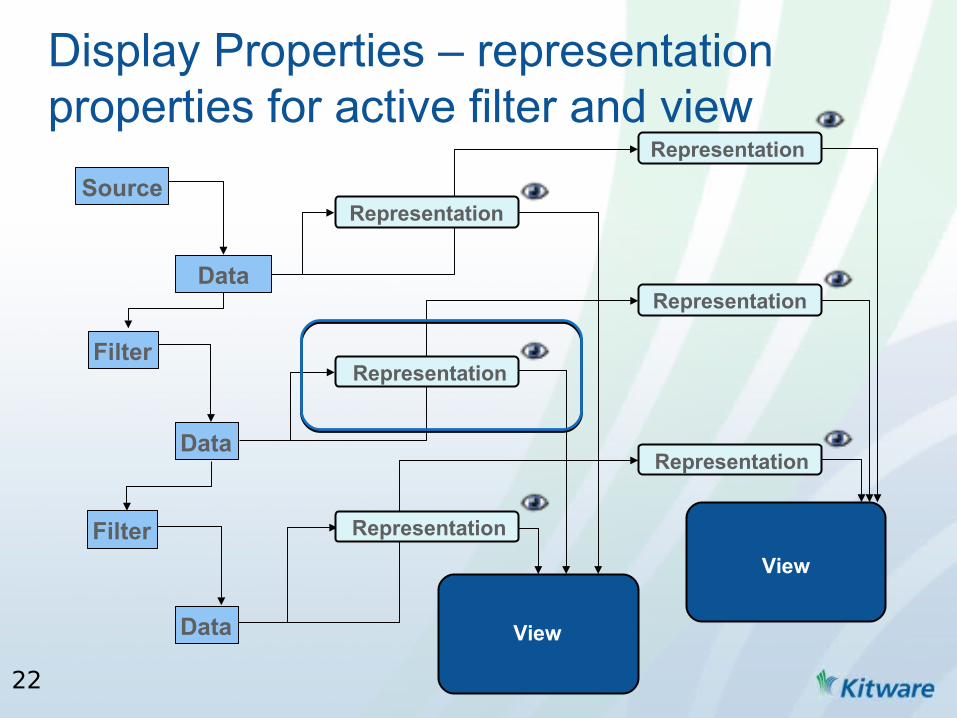
Display Properties – representation properties for active filter and view
Data
Filter
Source
Filter
Data View
Representation
View
DataRepresentation
Representation
Representation
Representation
Representation

23
View Properties – acts on active view
Data
Filter
Source
Filter
Data View
Representation
View
DataRepresentation
Representation
Representation
Representation
Representation

24
• Filters Menu– Recent– Common– Data Analysis– Statistical– Temporal– Alphabetical
• Quick Launch– PC/Linux CTRL-Space
– Mac ALT-Space
• Apply Undo/Redo
Filters
Calculator
Contour
Clip
Slice
Threshold
Extract Subset
Glyph
Stream Tracer
Warp By Vector
Group Datasets
Extract Group
25
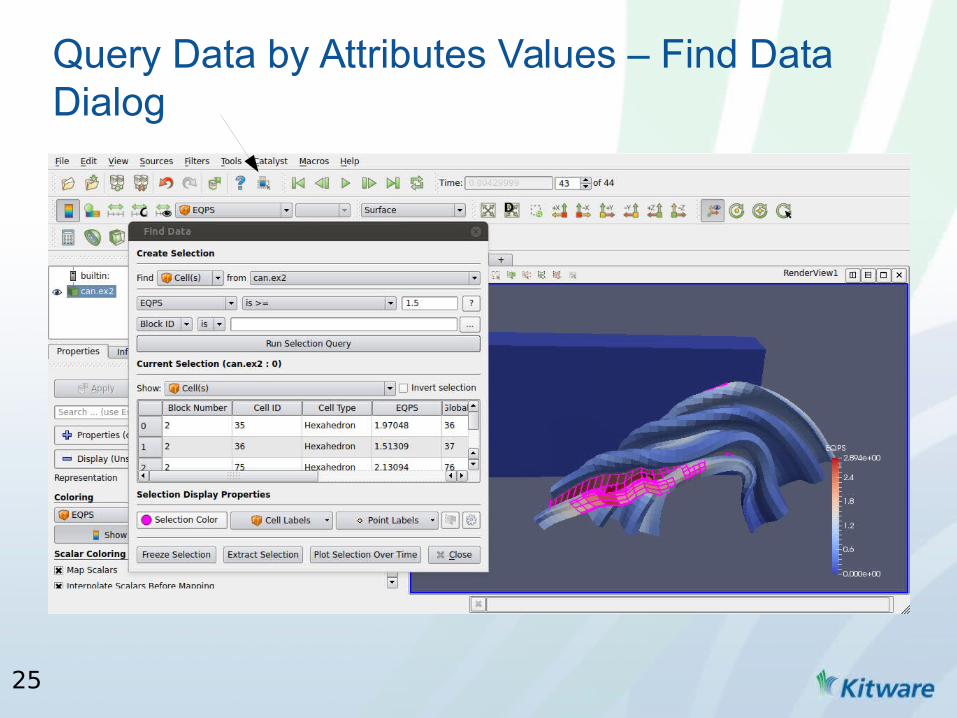
Query Data by Attributes Values – Find Data Dialog
26
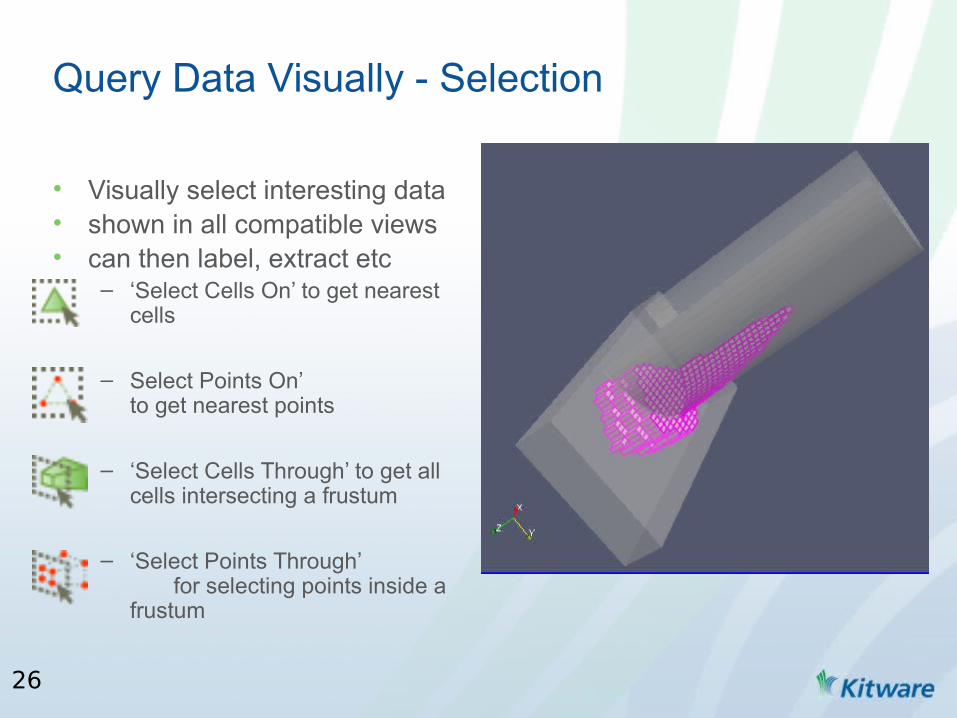
• Visually select interesting data• shown in all compatible views• can then label, extract etc
– ‘Select Cells On’ to get nearest cells
– Select Points On’ to get nearest points
– ‘Select Cells Through’ to get all cells intersecting a frustum
– ‘Select Points Through’ for selecting points inside a frustum
Query Data Visually - Selection
27
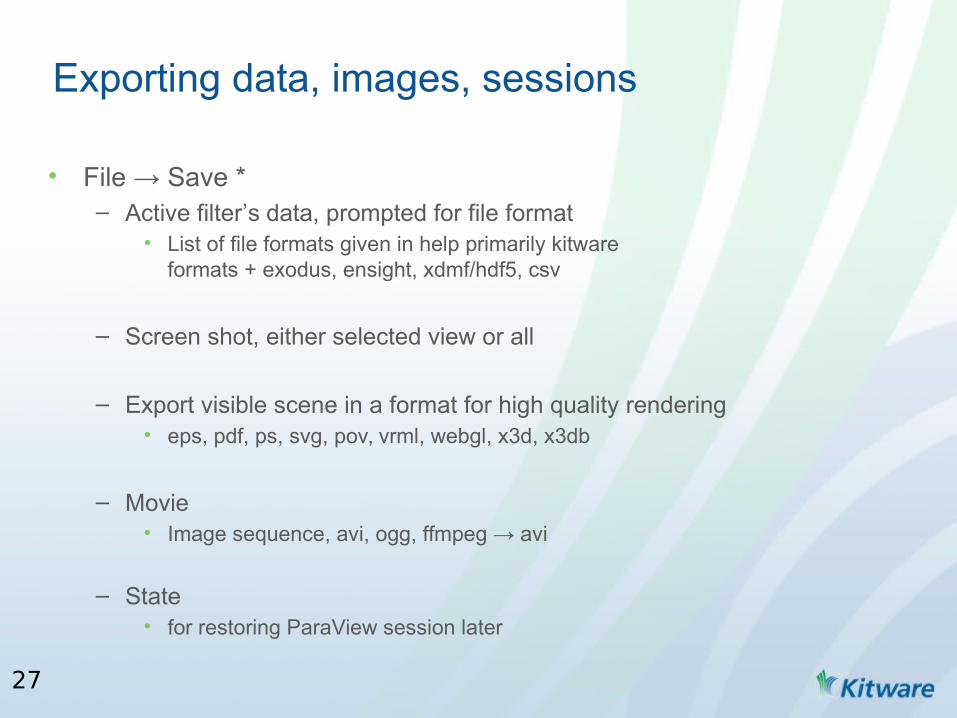
• File → Save *– Active filter’s data, prompted for file format
• List of file formats given in help primarily kitware formats + exodus, ensight, xdmf/hdf5, csv
– Screen shot, either selected view or all
– Export visible scene in a format for high quality rendering• eps, pdf, ps, svg, pov, vrml, webgl, x3d, x3db
– Movie• Image sequence, avi, ogg, ffmpeg → avi
– State• for restoring ParaView session later
Exporting data, images, sessions

What to Expect from Parallel Processing
• Amdahl’s Law
• Gustafson’s Law
aka Strong scaling If data size is fixed, don’t expect great scalability.
More processors != faster
aka Weak scaling As data size grows, you must have more resources.
More disk and IO = higher resolution possible
Speedup(CPUs) 1
Serial ParallelCPUs
Speedup(CPUs) = CPUs * Parallel + Serial
Serial + Parallel = 1 (percentage that you cannot/can parallelize)

29
What to Expect from Parallel Processing
• Parallel != Faster• Parallel → Larger Problem Size
30
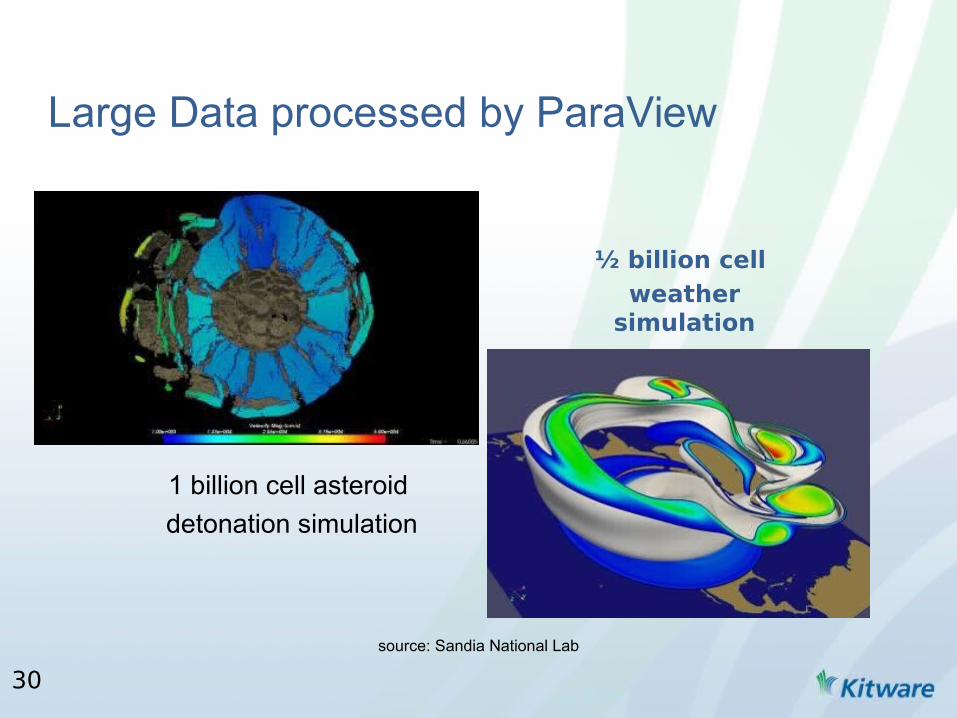
Large Data processed by ParaView
1 billion cell asteroid
detonation simulation
½ billion cell weather
simulation
source: Sandia National Lab

31
Reader
Filter
Filter
Reader
Filter
Filter
MPIX/N GB X/N GB
N component Data Parallelism for X GByte
…
Render ServerRender Server
Render ServerRender Server
ClientData ServerData Server
Data ServerData Server
Data ServerData Server
Depth Composite
Tile Display
Control, Display and Rendering
of Small Data

32
ParaView’s Running Modes
Builtin aka Standalone aka Serial
all components within one process (client may be GUI or pvpython)
paraview || pvpython
Combined Server
data processing and parallel rendering in MPI job of combined processes. control from TCP connected client.
mpiexec -n x pvserver &; paraview # or pvpython #+ Connect
Batch
server is an MPI job which directly runs a python script
mpiexec –n x pvbatch \vis_script.py
DS RS Client
ClientDS RSDS RS
DS RS
DS RSDS RS
DS RS
DS = data serverRS = render server
33
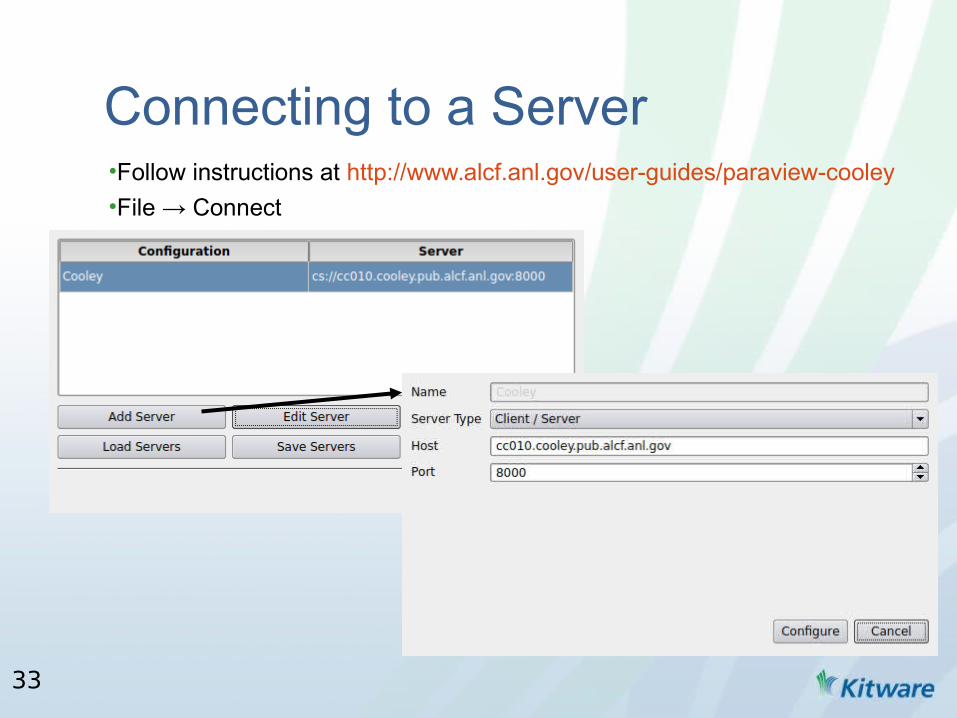
•Follow instructions at http://www.alcf.anl.gov/user-guides/paraview-cooley
•File → Connect
Connecting to a Server
34
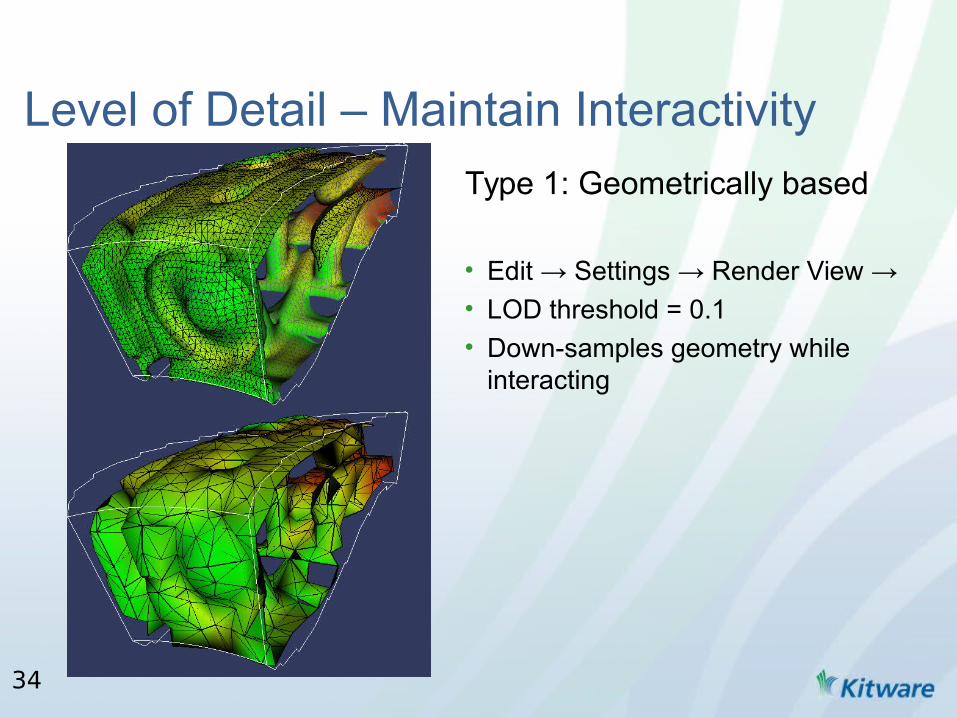
Level of Detail – Maintain Interactivity
Type 1: Geometrically based
• Edit → Settings → Render View → • LOD threshold = 0.1• Down-samples geometry while
interacting

35
Level of Detail – Maintain Interactivity
Type 2: Image Based
• Edit → Settings → Render View → • Remote Render Threshold = 0.1• Image Reduction Factor = 10• Down-samples pixels while interacting

36
• Load disk_out_ref.ex2– An exodus format file– Enable all variables
• Information tab– Multi-block (group of datasets)– Not time varying– Roughly 8000 cells and points, 2MB– 11.5 units in diameter, 20 units in
height
• Show as surface with edges to see structure
• Set opacity to 0.5• Looks like a cylinder with a recess
reader
file
view 1
representation
Hands on practice: vector visualization(see also http://www.paraview.org/Wiki/The_ParaView_Tutorial)

37
• Apply slice filter– Align with z and use
10 offset values
• Color by Temp• Show temp color key• Adjust opacity of reader(0.1) and
slice(1.0) so that you can see temperature variation clearly
Hands on practice: vector visualization
reader
slice
representation
representation
file
38
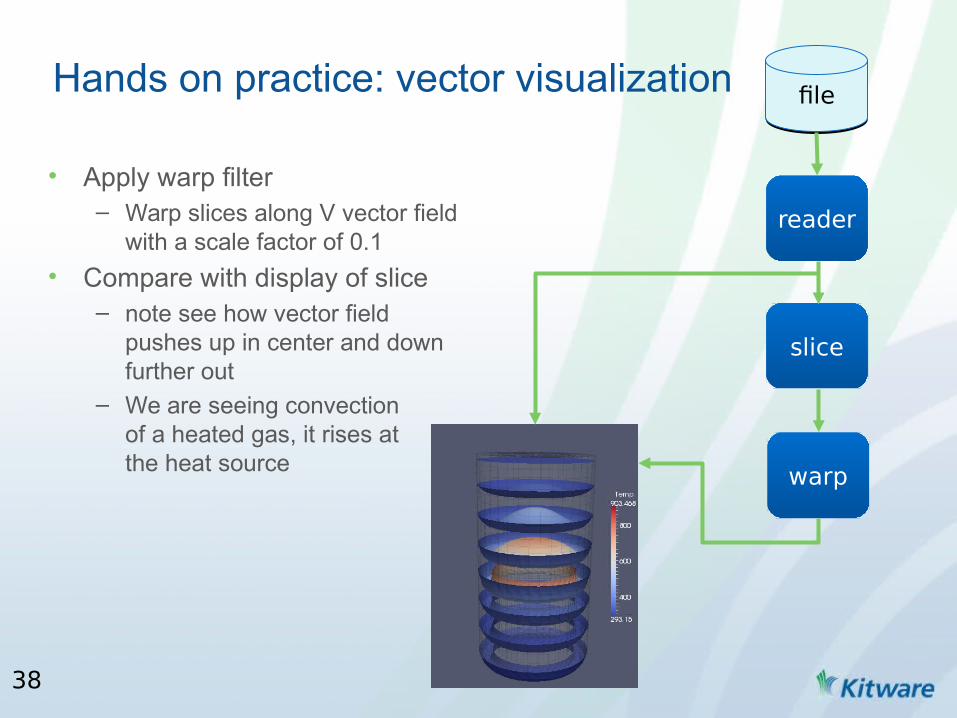
• Apply warp filter– Warp slices along V vector field
with a scale factor of 0.1
• Compare with display of slice– note see how vector field
pushes up in center and down further out
– We are seeing convectionof a heated gas, it rises atthe heat source
Hands on practice: vector visualization
reader
file
slice
warp
39
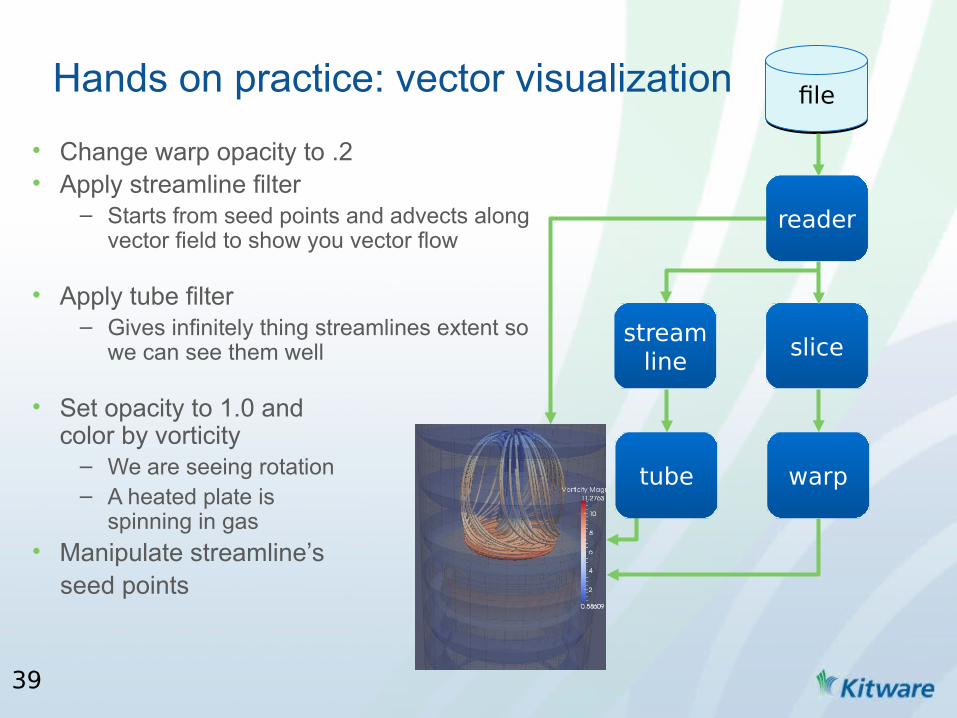
• Change warp opacity to .2• Apply streamline filter
– Starts from seed points and advects along vector field to show you vector flow
• Apply tube filter– Gives infinitely thing streamlines extent so
we can see them well
• Set opacity to 1.0 and color by vorticity
– We are seeing rotation– A heated plate is
spinning in gas• Manipulate streamline’s
seed points
Hands on practice: vector visualization
reader
file
slice
warp
stream line
tube
40
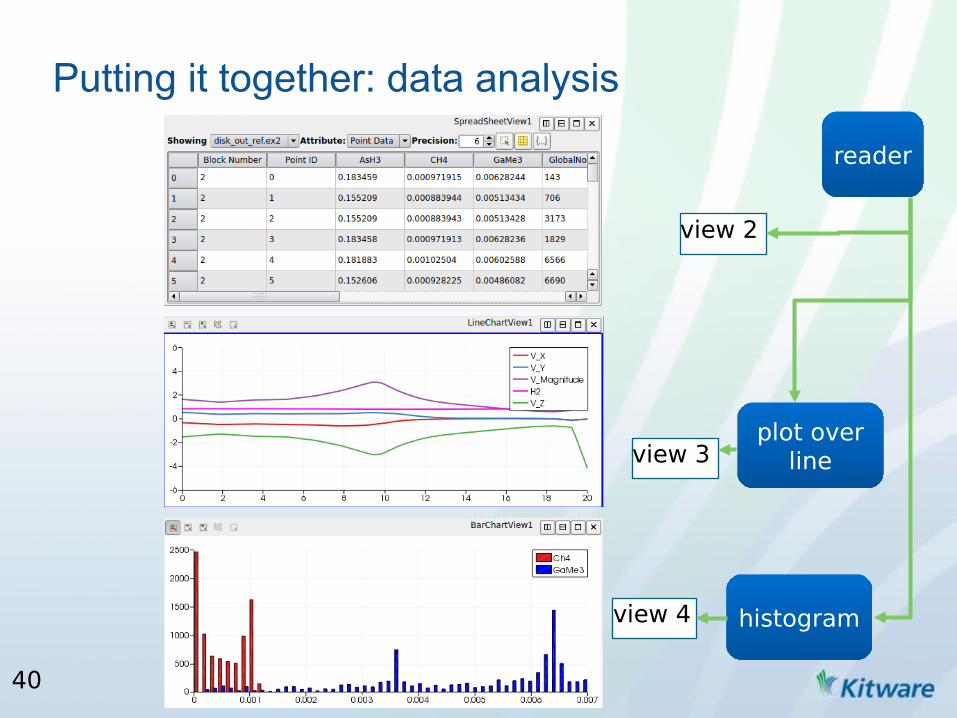
Putting it together: data analysis
reader
plot over line
histogram
view 3
view 2
view 4

41
Thank You.Questions?