Damp Heat Degradation of CIGS Solar Modules - DiVA...
77
Master Level Thesis European Solar Engineering School No. 222, June 2017 Damp Heat Degradation of CIGS Solar Modules Master thesis 15 hp, 2017 Solar Energy Engineering Author: Jose Cano Garcia Supervisors: Désirée Kroner Dorrit Roosen-Melsen Examiner: Ewa Wäckelgård Course Code: MÖ3031 Examination date: 08-06-2017 Dalarna University Energy and Environmental Technology
Transcript of Damp Heat Degradation of CIGS Solar Modules - DiVA...

Master Level Thesis
European Solar Engineering School
No. 222, June 2017
Damp Heat Degradation of CIGS Solar Modules
Title
Master thesis 15 hp, 2017 Solar Energy Engineering
Author: Jose Cano Garcia
Supervisors: Désirée Kroner Dorrit Roosen-Melsen
Examiner: Ewa Wäckelgård
Course Code: MÖ3031
Examination date: 08-06-2017
Dalarna University
Energy and Environmental
Technology

i

ii
Abstract
Due to the short period that some photovoltaic technologies have taken part on the solar energy market, it is crucial to evaluate the long term stability of solar cells belonging to those technologies in order to ensure a minimum lifetime of their performance. Accelerated degradation tests are thus carried out to achieve such goals. The present study analyzes the encapsulation effects on co-evaporated manufactured Copper Indium Gallium Selenide (CIGS) solar cells under damp heat conditions, consisting in 85 °C and 85 % relative humidity, during an approximated period of 1000 hours. The experimental procedure has been carried out at Solliance Solar Research facilities. Since the encapsulation packages play a critical role as a protection to achieve long term stability of the solar cells and modules, several packaging structures and materials has been taken into study. Thus, eighteen types of mini modules were manufactured including different combinations of encapsulants, front sheet foils, thin film protective barriers and CIGS cells from different manufacturers. The design of these mini modules and the manufacturing process to obtain them is also presented in this work. Various characterization techniques were carried out in order to acquire the required information about the solar cells and encapsulants performance along the damp heat degradation process. The results exposed that encapsulation packages including thin film barriers between the encapsulant and the front sheet foil allowed a longer solar cell lifetime due to their remarkable protection against moisture ingress. Moreover, the degradation of the molybdenum layer included in the CIGS cells was found as principal cause of efficiency decrement and end of performance of solar cells protected by regular encapsulant and front sheet foils. Some other findings in relation with the evaluated components are shown along the present study.

iii
Acknowledgment
I would like to thank all those I met during my period at Dalarna University, from teachers to friends, who made me grow professionally and personally and made me feel like at home. To all TNO and ECN employees that gave me the opportunity to develop this work and also taught me much more than I could have ever expected prior to my arrival to Solliance, specially to my supervisor Dorrit, and to Mirjam, Monique, Henk and Klaas. To my Solliance and SEAC colleagues for their friendship and help during my stay at the Netherlands.
And above all, of course, to my family. Nothing would be possible without their unconditional love and support.

iv
Contents
1 Introduction ................................................................................................................................... 1 Aims ......................................................................................................................................... 3 1.1 Method .................................................................................................................................... 3 1.2
2 Background .................................................................................................................................... 4
3 Experimental procedure ............................................................................................................... 5 Degradation and analysis techniques .................................................................................. 5 3.13.1.1. Degradation test conditions ........................................................................................ 5 3.1.2. Analysis techniques ....................................................................................................... 5 Materials and structures under evaluation .......................................................................... 6 3.2 Modules layout ....................................................................................................................... 8 3.3 Modules fabrication process .............................................................................................. 10 3.43.4.1. Cells shape obtainment per slide .............................................................................. 10 3.4.2. Thermography measurement .................................................................................... 12 3.4.3. Cells, TCO samples and Mo samples obtainment ................................................. 13 3.4.4. SiN deposition over cells surface .............................................................................. 14 3.4.5. Cutting .......................................................................................................................... 14 3.4.6. Gold (Au) contact deposition ................................................................................... 15 3.4.7. Contact pads obtainment ........................................................................................... 16 3.4.8. Electric conductive adhesive and wires placement ................................................ 16 3.4.9. Glass substrate and encapsulant ring obtainment .................................................. 16 3.4.10. Edge sealing and lamination .................................................................................... 17
4 Results ........................................................................................................................................... 21 Effect of lamination on cells .............................................................................................. 21 4.1 Jsc early values ...................................................................................................................... 22 4.2 Modules without thin-film barrier ..................................................................................... 23 4.3 Modules with SiN deposited on cells ................................................................................ 26 4.4 Modules with SiN barrier deposited on cells and not encapsulated ............................ 29 4.5 Modules with thin-film barriers on PET .......................................................................... 30 4.6 Voc performance ................................................................................................................. 32 4.7 Front contact delamination ................................................................................................ 34 4.8 Mo degradation .................................................................................................................... 35 4.9 Solliance and Nantes cells ................................................................................................ 35 4.10 Light transmission through encapsulants ....................................................................... 37 4.11 Repeatability ....................................................................................................................... 39 4.12
5 Conclusions and further work ................................................................................................... 41
6 Bibliography ................................................................................................................................. 43
Appendix A: electric parameters and curves .............................................................................. 44
Appendix B: JV curves of cells ..................................................................................................... 62
Appendix C: TCO and Mo resistance values and curves ......................................................... 67
Appendix D: Light transmission curves ...................................................................................... 69

v
Nomenclature
AlOx Aluminium Oxide CdS Cadmium Sulfide CIGS Copper Indium Gallium Selenide. It may refer to (a) thin-film solar cell or (b)
absorber layer included in solar cell
Eff Efficiency EVA Ethylene Vinyl Acetate FF Fill Factor i-ZnO intrinsic Zinc Oxide Jsc Short circuit current density JV Current density-Voltage Mo Molybdenum OCP Organic Coating for Planarization PECVD Plasma-Enhanced Chemical Vapor Deposition PET Polyethylene Terepthalate PIB Polyisobuttylene PO Polyolefin RH Relative Humidity (also referred as Saturation degree) Rs Series resistance Rsh Shunt resistance (or Parallel resistance) SiN Silicon Nitride SLG Soda Lime Glass TCO Transparent Conductive Oxide (i-ZnO + ZnO:Al layers) Voc Open circuit voltage WVTR Water Vapor Transmission Rate ZnO:Al Aluminium-doped Zinc Oxide

1
1 Introduction Since the early 19th century when the photovoltaic effect was observed for the first time in history to the present days the study, development and implementation of photovoltaics devices have experimented an incredibly growth. Technologies of the solar cells are usually divided into three groups or generations. First solar cells generation consist in monocrystalyne silicon and polycrystaline silicon cells which are based on silicon wafers and have a normal performance between 15 - 20 %. These solar cells are the dominant in the current market and are typically installed in rooftops or solar power plants. The main benefits of these solar cells are their good performance and their high stability, proven along years of usage. However, the disadvantages for some purposes are that they are rigid and also require a lot of production energy. (Solar facts and advice, 2013) The second generation solar cells, the so-called thin film solar cells at first point, are based on the technologies of amorphous silicon, CIGS and CdTe, which normally have a performance around 10 – 15 %. Second generation solar cells have a much lower material consumption since the material thickness varies from few nanometers to tens of micrometers. The main advantages of these cells in comparison with first generation are that cell structure is less susceptible when it is shaded and it offers bigger design flexibility for a large variety of applications. Moreover the color allows easy integration into most exterior designs, it has a lower price as a result of a lower material usage and it has a shorter payback time in terms of energy which provides production and resource savings. Solar cells of third generation use organic materials as small molecules or polymers and high performance experimental multi-junction solar. These technologies are still into development stage and they have very low commercial applications due to a very high price of production. (Solar facts and advice, 2013) The present study focuses on the research of second generation CIGS solar cells. The emergence of the third generation cells doesn’t stand for a decrease in the research and development of the previous generation technologies. Due to economic and energy points of view the lifetime expectations for a solar panel must meet 20 or 25 years as minimum. Thus, installations of technologies developed mostly in recent years have not been able to be proven in-situ in order to provide reliable information about the lifetime characteristics. To obtain proper values for lifetime expectation of a CIGS solar cell the degradation mechanisms have to be identified and analyzed. The next step is to recreate in some extent the fore mentioned mechanisms over the cell and analyze the consequent behavior of the cell. At that point it is needed to concern about what can be changed in the manufacturing process of the cell in order to obtain a better response when the degradation mechanisms reach the cell surface and what encapsulation and type of materials are most suitable in order to avoid the deterioration agents penetrate enough to affect the proper performance of the solar cell. There are several factors that lead to degradation of CIGS cells. Along this work the degradation due to damp heat at the encapsulation of the cells into solar modules will be under study. The structure of a typical CIGS solar cell, shown in Figure 1, is based on a soda lime glass (SLG), polyimide or metal foils substrate for mechanical stability; a molybdenum (Mo) back contact; the CIGS absorber and Cadmium Sulfide (CdS) buffer

2
for the photovoltaic effect generation; an intrinsic Zinc Oxide (i-ZnO) not conductive thin layer and an Aluminium-doped Zinc Oxide (ZnO:Al) front contact layer whit an antireflection coating. Both i-ZnO and ZnO:Al layers shape the socalled transparent conductive oxide (TCO). In order to create solar panels the CIGS solar cells acquire some extra frontal layers for protection and for an improvement in the mechanic properties. The mentioned layers consist in frontal protection, encapsulant and barrier thin film. The frontal protection is commonly glass or a front sheet made of a transparent polymeric film in case of flexible CIGS panels. The encapsulant is a transparent polymeric layer providing adhesion between the cell and the frontal protection with minimal gas inclusion. The barrier thin film is mostly used for flexible CIGS solar panels and consists in a transparent thin film providing water, oxygen, etc. barrier function.
Figure 1. Structure of a typical CIGS cell
In order to be able to develop a further study of the damp heat deterioration process over a flexible CIGS cell it is necessary to focus at a fist point in the cells deposited on a glass substrate since the qualitative requirements of a back protection are better accomplished by the use of glass instead of polymeric film. Thus, an analysis of what type of materials used as encapsulants and as thin film barriers present a greater protection against the deterioration due to damp heat and what type of encapsulation structure according to the position that thin film barrier takes places in the encapsulation will be developed in the present work. The elaboration of the analyzed CIGS solar cells and modules, degradation procedure, necessary methodology and facilities in order to satisfactorily obtain the cell performance before and after degradation and the collected data from analysis are provided by the Netherlands Organization for Applied Scientific Research (TNO). The company elaborates the mentioned research process within the Solliance Solar Research facilities sited in Eindhoven where the current study is developed.
3
Aims 1.1
The overall aim of this thesis is to evaluate the CIGS solar modules performance after accelerated processes of degradation by damp heat in order to obtain valuable information of what encapsulant procedures and materials are most suitable for a greater lifetime of the CIGS modules. The study comprises a stage of research within a greater research project than involves stages from CIGS solar cells manufacture by different deposition techniques to final performance of flexible CIGS solar panels. The study is based on the stage of degradation of encapsulated cells into small CIGS panels, procuring measured values of the cell behavior. The research does not allow a real calculation of the solar cell lifetime. It mainly provides information about the impact of the deterioration applied over the CIGS panel layers and to have a better understanding of how to improve the elements and structure used for CIGS modules.
Method 1.2
In order to obtain the desired information about the modules performance and to achieve the aims previously defined several steps are required:
Literature study on CIGS cells deterioration, life prediction for CIGS solar
modules, thin-film barriers and damp heat stability of encapsulated CIGS cells
among other related topics to gain a thorough understanding of the required work.
Design of the adequate layout of the CIGS cells and modules in order to obtain
the desired goals of research.
Manufacturing and encapsulation of CIGS solar cells into small modules by
following different patterns of encapsulation structure and by the use of different
materials.
Enforcement of accelerated process of degradation by damp heat during
predefined periods.
Several test methods in order to obtain valuable data about the changes in the solar
cell samples behavior in comparison with previous performance to the
deterioration process. The tests are carried out by the execution of electric
measurements obtaining IV curves, efficiency, open circuit voltage, current density,
fill factor, shunt resistance and series resistance at predefined irradiation, light
transmission and thermography measurements, etc.
Repetition of degradation and testing in order to acquire performance analysis in
several steps of the degradation process.
Processing and analysis of data obtained by the measurements.
Elaboration of results according with the information obtained during the
execution of the method and the obtained knowledge through the process.

4
2 Background According with the literature studied about the CIGS degradation, one can postulate an empirical kinetic model to fit the degradation rate by assuming that the rate of degradation is proportional to the concentration of water at the surface of the cell:
𝑅𝐷 = 𝑘𝑜𝑒(
−𝐸𝑎,𝑑𝑒𝑔
𝑅𝑇)
[𝑅𝐻𝑐𝑒𝑙𝑙
1 − 𝑅𝐻𝑐𝑒𝑙𝑙 + ɛ]
Equation 1
where 𝑅𝐷 is the degradation rate, ko is a rate constant, −𝐸𝑎,𝑑𝑒𝑔 is the thermal activation
energy of degradation, 𝑅 is the universal gas constant, ɛ is an small constant to prevent
infinite rate at 100 % relative humidity (RH), and 𝑇 is the temperature of the module. (Coyle, 2011) The humidity that the cell experiences at any time is simply
𝑅𝐻𝑐𝑒𝑙𝑙 = 𝐶𝐸
𝑆𝐸
Equation 2
where 𝐶𝐸 is the concentration of water in the encapsulant (g/cm3), and 𝑆𝐸 is the solubility of water in the encapsulant (g/cm3). (Coyle, 2011) Unfortunately many of the required values on these equations are missing for present study, as the rate constant, thermal activation energy of degradation or solubility of the thin film barriers. Thus, the calculus of the degradation rate at the different stages of the degradation process was not able to be achieved. For this reason the content of the present thesis is not completely consider as a quantitative but as a qualitative study. However, the theoretical framework provided by the equations allows a proper understanding of the degradation process that takes place at the cell level in relation with the encapsulant degree of saturation. A previous experiment with same aims as the present study was carried out at Solliance facilities. After the detailed analysis of the processed data extracted from the obtained results it was determined the necessity of designing a new experimental layout in order to avoid some flaws noticed along the experiment, as the moisture ingress through the edge or an incomplete protection of cell areas by the thin film barriers. The new planed layout was designed to prevent the previously observed defects and, especially, to ensure that the moisture ingress occurs through the front sheet foil surface and not due to the diffusion from the edges of the mini module.
5
3 Experimental procedure The types of mini modules, according to their characteristics, and their manufacturing process are fully described in this chapter. First of all, test and analyzing procedures are described.
Degradation and analysis techniques 3.1
The components of the mini modules under study were exposed to a standard degradation process along the experiment. Diverse analysis techniques were carried out during the time that the experiment took place in order to obtain valuable information about the degradation process of the module components
3.1.1. Degradation test conditions
Standard damp heat is a type of accelerated lifetime test for PV technologies, consisting in exposure to 85 °C and 85 % RH conditions. Damp heat test is one of the tests included in the certified qualification IEC 61646 for long term reliability of thin film PV modules. According to IEC 61646, 1000 hours of damp heat exposure should represent 25 years of field exposure in Miami. Nevertheless, similarities between real field conditions and accelerated tests are still under debate. (Theelen, 2015)
3.1.2. Analysis techniques
Current density-voltage (JV) Measuring the current-voltage (IV) curve is the most standard measurement for a solar cell. Usually a cell is illuminated, a voltage is applied and the current is measured. Due to the experimental character of the present study and the fact that the active area of the cells under study does not have the exact same dimensions, current density values are found more valuable for a proper cell performance comparison than current values. JV measurements were obtained using a solar simulator and controlled by using a JV runner software. The basic operating properties of the cells were obtained, including current density, voltage, fill factor, series resistance, shunt resistance and efficiency. The voltage was varied from -0.5 to +0.8 V in steps of 0.002 V and the current was measured, with a 1 ms delay between each reading. Lock-in thermography The lock-in thermography technique means that the heat sources in an object are active in a periodically pulsed manner, the object is imaged by an infrared camera, and all images captured in a certain acquisition time and sent to a computer. The object is heated by a Light Emitting Diode (LED) panel. Lock-in thermography is very useful for detecting shunts in a solar cell. Since shunts in a solar cell heat up easily than the rest of the solar cell area, they should be visible with this

6
set up. For consistency all measurements where done with a lock in frequency of 25 Hz, a camera frequency of 100 Hz and a measurement time of 500 ms. Photography The photographs are one of the simplest characterizations that have been performed. It is quick and very useful for documenting the evolution of the aspect of the samples during the degradation. Photographs were taken by the use of a scanner. Resistance Resistance values are easily measured by the use of a simple handheld multimeter with accuracy equal to ±0.1 %. The four pads of each sample are connected to the multimeter terminals.
Light Transmission Light transmission provides the percentage values of light transmitted through a material at certain wavelength. At first, the laser beam provides a baseline measurement. The modules are introduced and the laser beam provides transmission values by comparing the obtained light transmission through the materials with the baseline values. To ensure a proper comparison between the transmission values of the encapsulants, all measurements have been done at the same spot of the modules surface. The measurements were taken for wavelengths at range of absorption of CIGS material, from 300 nm to 1100 nm. Since the stack is attached to a SLG substrate the measuring beam provides the values of the light transmission through a package consisting in foil, thin film barrier (in case it is included), encapsulants and glass.
Materials and structures under evaluation 3.2
In order to evaluate the performance of different encapsulants and thin-film barriers as a protection for CIGS cells under damp heat degradation, 27 modules were manufactured using different materials and following all possible structures and combinations. To study the degradation mechanisms in different layers of a typical CIGS cell, each module includes:
3 solar cells
1 cell totally cover by the TCO layer
1 Mo layer surface Cells are not interconnected and their performances are analyzed independently. Modules including cells/surfaces obtained from Solliance facilities were manufactured twice with the same structure to find out if the results are repeatable.
7
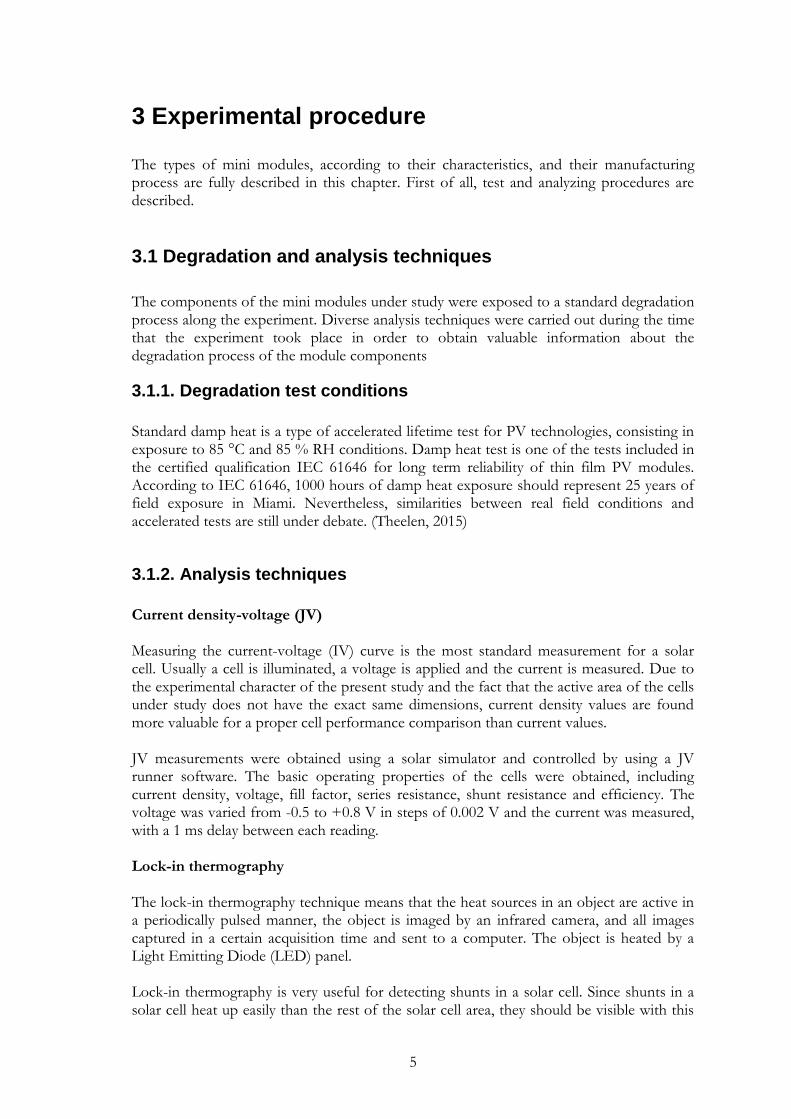
Materials under study are:
CIGS cells manufactured at Nantes University laboratories
CIGS cells manufactured at Solliance laboratories
Polyethylene Terepthalate (PET) front sheet foil (100 µm)
Ethylene Vinyl Acetate (EVA) encapsulant (200 µm)
Polyolefin (PO) encapsulant (200 µm)
Organic Coating for Planarization + Silicon Nitride (OCP+SiN) thin-film barrier on PET
SiN thin-film barrier (150 nm)
Aluminium Oxide (AlOx) thin-film barrier (20 nm) on PET (125 µm) Table 1 shows all manufactured modules and their characteristics.
Table 1. Module number and components
Module number
CIGS manufacturer
Encapsulant Thin-film
barrier type Thin-fim barrier location
1 Solliance EVA
1(2) Solliance EVA
2 Solliance PO
2(2) Solliance PO
3 Nantes EVA
4 Nantes PO
5 Solliance EVA SiN Deposited over cell surface
5(2) Solliance EVA SiN Deposited over cell surface
6 Solliance PO SiN Deposited over cell surface
6(2) Solliance PO SiN Deposited over cell surface
7 Nantes EVA SiN Deposited over cell surface
8 Nantes PO SiN Deposited over cell surface
9 Solliance EVA OCP + SiN Between front sheet and encapsulant
9(2) Solliance EVA OCP + SiN Between front sheet and encapsulant
10 Solliance PO OCP + SiN Between front sheet and encapsulant
10(2) Solliance PO OCP + SiN Between front sheet and encapsulant
11 Nantes EVA OCP + SiN Between front sheet and encapsulant
12 Nantes PO OCP + SiN Between front sheet and encapsulant
13 Solliance EVA AlOx Between front sheet and encapsulant
13(2) Solliance EVA AlOx Between front sheet and encapsulant
14 Solliance PO AlOx Between front sheet and encapsulant
14(2) Solliance PO AlOx Between front sheet and encapsulant
15 Nantes EVA AlOx Between front sheet and encapsulant
16 Nantes PO AlOx Between front sheet and encapsulant
17 Solliance SiN Deposited over cell surface
17(2) Solliance SiN Deposited over cell surface
18 Nantes SiN Deposited over cell surface

8
Modules layout 3.3
The structure of the mini modules consists of:
A 100x85 mm SLG substrate
Polyisobutylene (PIB) edge sealant in each side
An encapsulant layer covering the glass substrate
An square shaped ring made of encapsulant surrounding the cells/samples
Cells and samples surrounded by the encapsulant ring, on the middle of the mini module.
The required encapsulant depending on the module characteristics
The required PET foil depending on module characteristics. Figure 2 illustrates the modules final aspect, including a red dashed line indicating the cross-section for the view of Figure 3, where it is possible to observe the inner layers. As it can be observed the contact wires make their way to the outside by passing between the two edge sealant layers. A first look at the cross section reveals that there are differences in the height of the materials which would lead to not obtain a flat surface on the top of the modules. Nevertheless the lamination process carried out at the oven melt down the polymer materials and they reach the same height with respect to the glass substrate surface.
Figure 2. Final aspect of a mini module. From left to right: TCO sample, three solar cells and Mo sample

9
Figure 3. Overview of module cross section from red dashed line from Figure 2. The soda lime glass (SLG) substrate does not allow moisture diffusion through the back side. The PIB edge sealant and the thick encapsulant layer avoid the moisture ingress through the edges. Moisture only reaches the sample surface (in dark blue over the SLG at the up-right part of the figure) by diffusing through the PET and the thin encapsulant layer.
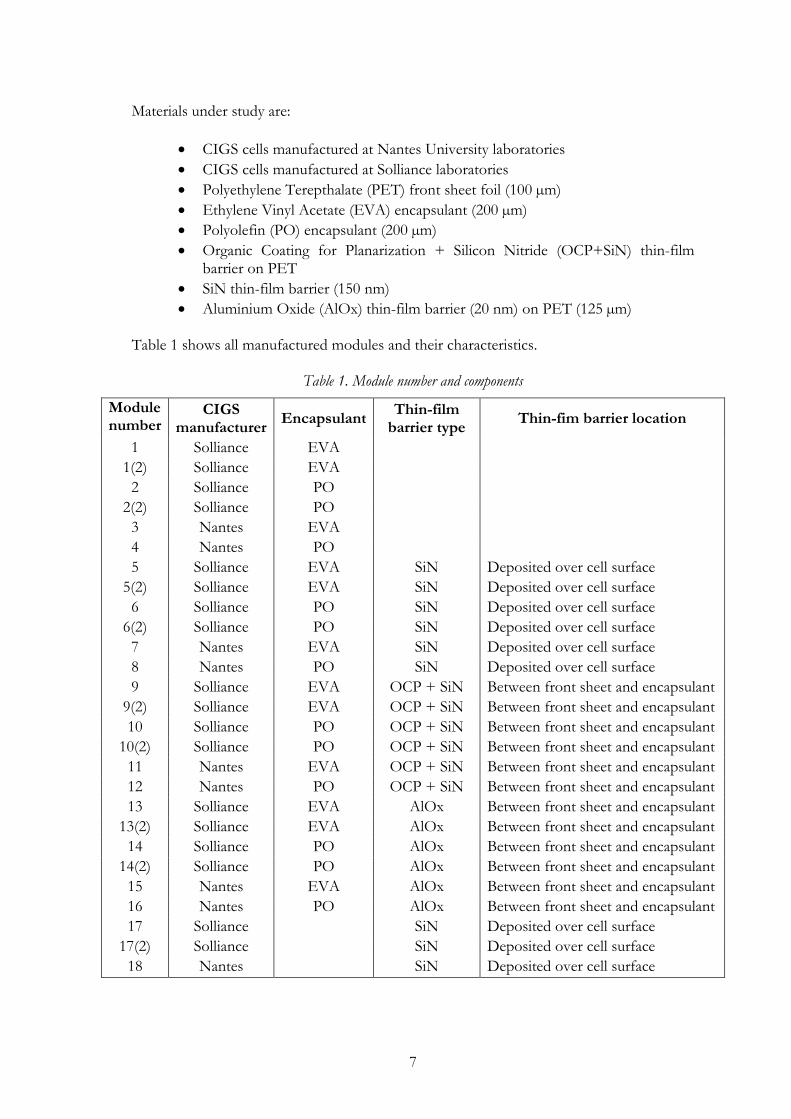
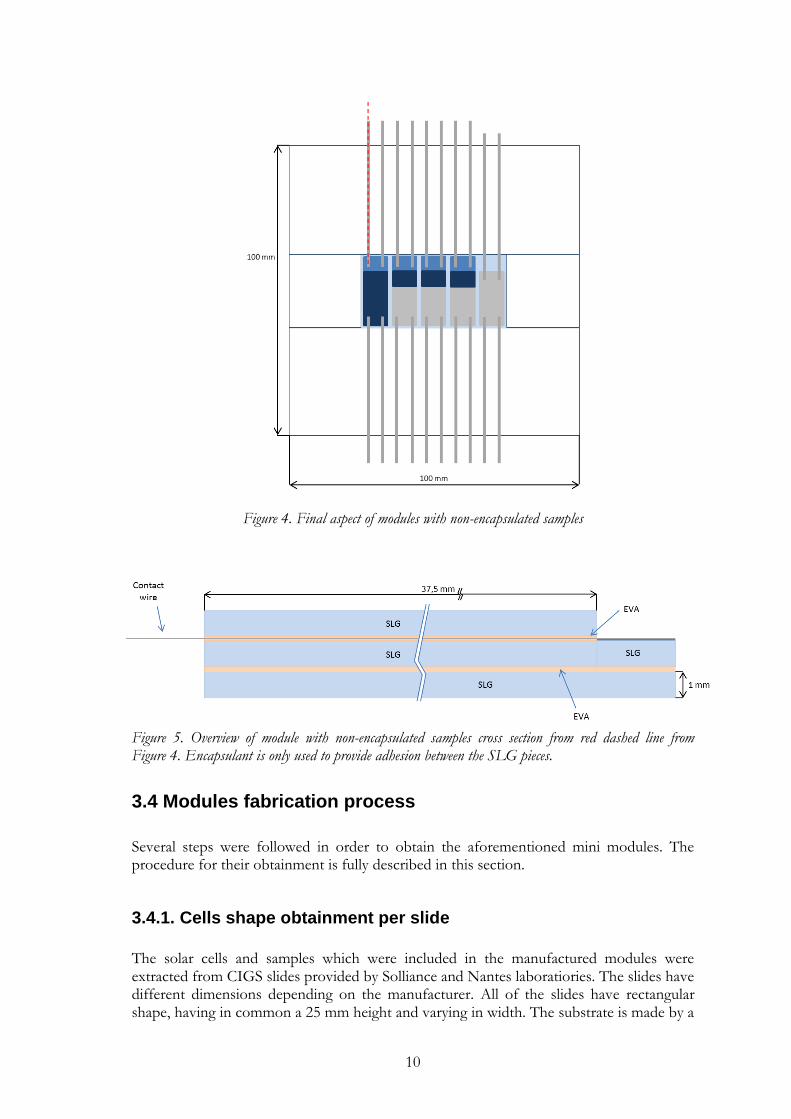
Modules 17, 17(2) and 18 were planned to contain cells and surfaces protected by SiN thin film barrier deposited on them and to not be protected by any encapsulant or foil. Their structure thus is different to the previously explained modules. To obtain a good mechanically stable structure for these 3 modules, the cells/surfaces are placed on a layer of 200 µm thick encapsulant which is at the same time placed on a 100x100 mm SLG substrate. The sides of the cells and surfaces are protected with four dummy glasses which also allow the pads to lay on them. The pads are protected by other dummy glasses over them, with an encapsulant layer in between bottom and top glasses to provide adhesion and protection. Once the modules are laminated in the oven they obtain a final look as it is shown in Figure 4, with a red dashed line indicating the cross-section for the view of Figure 5.
10
Figure 4. Final aspect of modules with non-encapsulated samples
Figure 5. Overview of module with non-encapsulated samples cross section from red dashed line from Figure 4. Encapsulant is only used to provide adhesion between the SLG pieces.
Modules fabrication process 3.4
Several steps were followed in order to obtain the aforementioned mini modules. The procedure for their obtainment is fully described in this section.
3.4.1. Cells shape obtainment per slide
The solar cells and samples which were included in the manufactured modules were extracted from CIGS slides provided by Solliance and Nantes laboratiories. The slides have different dimensions depending on the manufacturer. All of the slides have rectangular shape, having in common a 25 mm height and varying in width. The substrate is made by a

11
1 mm thick SLG rectangular plate. The first layer consists of a 19 mm height Mo layer. Then the whole area of the slide is covered by the rest of the solar cell layers (CIGS+CdS+TCO). Cells and samples are extracted from these slides by the further explained process. Nantes University also provides slides consisting of only the Mo layer on the SLG. Nantes slides Nantes provides CIGS slides with 75x25 mm and Mo slides with 100x25 mm. The areas close to the edges on the CIGS slides don’t have homogeneity enough to be used as cells. To provide shape to the future cells and samples some areas of the slides, in light blue in Figure 6, were removed by the use of laser.
Figure 6. Nantes CIGS slides after laser ablation. Light blue areas became bare SLG.
6 cells/surfaces per each slide were able to be obtained. At the end, 9 modules were produced including cells/surfaces manufactured by Nantes. Each module includes 3 cells, 1 cell totally covered by TCO and 1 Mo layer surface, leading to 45 cells/surfaces in total. 8 slides were provided from Nantes University (obtained from two different runs of the production line #1600 and #1601), resulting in 48 cells. From the 45 required cells/surfaces, 27 are cells, 9 are cells totally covered by TCO and 9 are Mo layer surfaces. Mo surfaces were not extracted from Nantes CIGS slides but from the Nantes Mo slides. Mo surfaces have the same size as the rest of cells/surfaces but it was possible to extract 10 from each slide since Mo slides dimensions are 100x25 mm as Figure 7 shows.
Figure 7. Nantes Mo slide after laser ablation. Mo layer was removed at light blue areas.

12
Solliance slides The dimensions of Solliance CIGS slides are 100x25 mm and, as the Nantes slides, areas close to the edges don’t have homogeneity enough to be used as cells. By the use of laser the areas shown in light blue on Figure 8 were removed.
Figure 8. Solliance CIGS slide after laser ablation
It is possible to obtain 8 cells from each slide. There must be 18 modules containing cells/surfaces manufactured by Solliance. Each module has 3 cells, 1 cell totally covered by TCO and 1 Mo layer surface, leading to 90 cells/surfaces in total. It means a minimum of 12 slides, resulting in 96 cells, were needed. Due to the necessity of covering some of the slides by a SiN thin film barrier, as it will be explained later on, and the high probability of failure during the cutting process into individual cells/surfaces, 18 slides manufactured at Solliance laboratories were provided. From the 90 required cells/surfaces, 54 are cells, 18 are cells totally covered by TCO and 18 are Mo layer surfaces. The process to obtain the Mo surfaces is done by scratching all the layers placed over the Mo layer. Important is to notice that there is a difference in shape between the Nantes Mo surfaces and the Solliance Mo surfaces. Solliance Mo layers are obtained once the rest of layers are scratched resulting in samples of 18x8 mm. Since Nantes Mo is provided as Mo layer slide, the samples size result is 23x8 mm.
3.4.2. Thermography measurement
After the laser ablation, thermography images were taken in order to find possible shunts in the rectangular shapes before converting them into cells, especially in the edges of the areas which became the active area. The results of the thermography can allow to decide which surfaces should remain as TCO samples and which should be selected to become cells and Mo surfaces, keeping the most shunted as TCO samples. In order to optimize the cells selection further JV measurements alongside the thermography images were taken into account. Lock in Thermography showed some shunted spots in the edges of the rectangular shapes, as it was expected to occur due to the usage of laser on CIGS (Deswaziere, 2017). Figure 9

13
shows the thermography image of one CIGS slide manufactured by Nantes after laser ablation. It is possible to observe the shunts as white lines and red spots placed at the edges of the rectangles.
Figure 9. Thermography image of Nantes CIGS slide after laser ablation. Warm colours as red or white, visible at the edges and corners of the rectangular shapes, indicate a higher temperature in contrast with the rest of the areas, in blue. The higher temperatures evidence shunts.
3.4.3. Cells, TCO samples and Mo samples obtainment
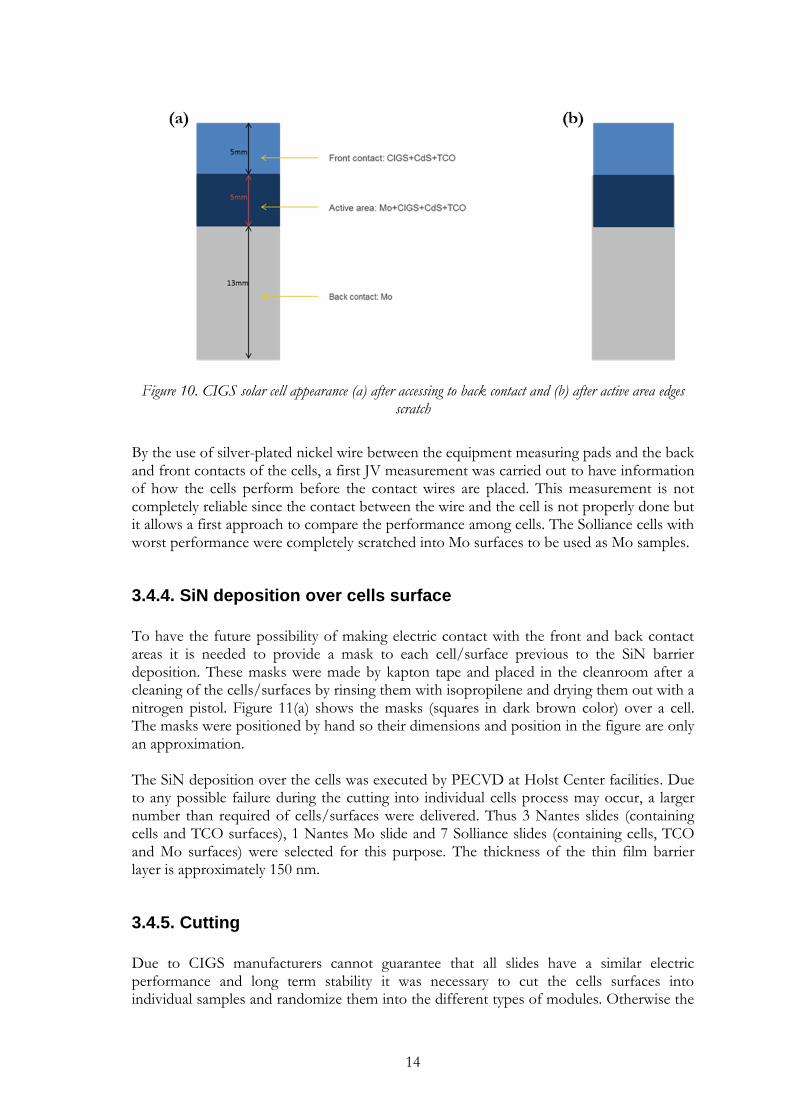
The surfaces which were not kept as TCO samples were converted into cells. In order to obtain the cells, a 13 mm long surface of CIGS+CdS+TCO layers were removed by scratching by the use of a blade, leaving only the Mo layer as the back contact of the cell. The resulting appearance is shown in Figure 10(a), where the light blue consists in CIGS+CdS+TCO and represents the top contact, the dark blue consists in Mo+CIGS+CdS+TCO and represents the active area, and the grey area consists in Mo and represents the back contact. In order to achieve a reliable JV curve measurement two small drops of silver paste were deposited on two cells, one drop on the Mo back contact and another on the TCO front contact of the cells. The silver paste allows a proper electric contact in order to obtain a JV curve. The measurement confirmed an extremely low electric performance due to the shunted spots. To supress this effect a small amount (around 0.5 mm) of TCO+CdS+CIGS placed in the edges of the active area was removed by scratch. This led to a final aspect shown in Figure 10(b). A new JV measurement showed a correct electric performance of the cells. Thus, the scratch of the active area edges was executed for the rest of the cells.
14
Figure 10. CIGS solar cell appearance (a) after accessing to back contact and (b) after active area edges scratch
By the use of silver-plated nickel wire between the equipment measuring pads and the back and front contacts of the cells, a first JV measurement was carried out to have information of how the cells perform before the contact wires are placed. This measurement is not completely reliable since the contact between the wire and the cell is not properly done but it allows a first approach to compare the performance among cells. The Solliance cells with worst performance were completely scratched into Mo surfaces to be used as Mo samples.
3.4.4. SiN deposition over cells surface
To have the future possibility of making electric contact with the front and back contact areas it is needed to provide a mask to each cell/surface previous to the SiN barrier deposition. These masks were made by kapton tape and placed in the cleanroom after a cleaning of the cells/surfaces by rinsing them with isopropilene and drying them out with a nitrogen pistol. Figure 11(a) shows the masks (squares in dark brown color) over a cell. The masks were positioned by hand so their dimensions and position in the figure are only an approximation. The SiN deposition over the cells was executed by PECVD at Holst Center facilities. Due to any possible failure during the cutting into individual cells process may occur, a larger number than required of cells/surfaces were delivered. Thus 3 Nantes slides (containing cells and TCO surfaces), 1 Nantes Mo slide and 7 Solliance slides (containing cells, TCO and Mo surfaces) were selected for this purpose. The thickness of the thin film barrier layer is approximately 150 nm.
3.4.5. Cutting
Due to CIGS manufacturers cannot guarantee that all slides have a similar electric performance and long term stability it was necessary to cut the cells surfaces into individual samples and randomize them into the different types of modules. Otherwise the

15
performance of some cells could be attributed to the module characteristics instead to the actual cells slide of origin. The cutting process was done by the use of diamond blade. The final look of every cell sample is shown in Figure 11(b).
Figure 11. (a) Cell with masks for SiN deposition and (b) final look of cell samples
3.4.6. Gold (Au) contact deposition
To ensure a proper electric contact with the wires, not incorporated to the samples yet, a Au layer of 60 nm was deposited on all cells/surfaces by the use of a Au sputtering tool. A mask made by a 200 µm thick PET foil was used on the top of each samples to allow the gold be deposited at the desired place. Since the mask was placed by hand the size of the deposited area varies from one sample to another. Nevertheless they keep a similar look as exhibit at Figure 12(a), except for Solliance Mo samples which have an appearance as shown in Figure 12(b) due to their smaller surface area once the rest of the layers were scratched.
Figure 12. Appearance after Au layer deposition of (a) cells and (b) Solliance Mo samples

16
At this point there were still more cells than required for the experiment so a new JV measurement was taken in order to decide which cells have the best performance and consequently be selected to be part of the experiment. In this case reliable JV measurements were carried out since the gold layer allowed a proper contact between the equipment measuring pads and the cells.
3.4.7. Contact pads obtainment
For the electric measurements, once the cells are encapsulated, four flat silver-plated nickel wires were needed to be added to the cell. The wires, also referred as pads, have a thickness of 50 µm and 2 mm width. Since the wires have to pass through the edge sealant layers leading to a lower adhesion between layers, the width of the wires was reduced to 1 mm by cutting them in half. Each of them was cut with a length of 5 cm.
3.4.8. Electric conductive adhesive and wires placement
Parts of the Au surfaces were covered by a small drop of an electrically conductive adhesive epoxy in order to obtain mechanical and electrical adhesion between the cell and the pads. For such deposition it was used a mask made by stain steel, leaving a thin layer of 1x2.5 mm. The epoxy used was EMS DB-1588-4. The contact wires were placed on the conductive adhesive with the help of small pieces of kapton tape, making the top of the wire match the conductive epoxy surface, and introduced in the oven for the curing process. Cure schedule of the product is 30 minutes at 120 °C. Once the conductive epoxy was cured the cells obtained a look as shown in Figure 13.
Figure 13. Overview of a cell with contact pads (tilted image in comparison with previous figures)
Since the cells and samples were ready for the lamination into modules, the first JV measurement included as a part of the experiment results was carried out. Additionally, a first measurement of the resistance of the TCO and Mo samples was obtained.
3.4.9. Glass substrate and encapsulant ring obtainment
Plates of 1 mm thick SLG cut with the dimensions of 100x85 mm were used as a main substrate for each module to lay the samples on. The cells and surfaces, which were placed together on the center of the glass substrate, are surrounded by a square shaped ring made by EVA or PO, depending on the module characteristics. Dimensions of the encapsulant ring are exhibit at Figure 14.

17
Figure 14 Dimensions of encapsulant square shaped ring
The encapsulant ring must have the same thickness than the CIGS cells. Due to the glass used as a substrate for CIGS cells is 1 mm thick and the encapsulants thickness is 200 µm, the mentioned rings were made by a stack of 5 layers of encapsulants, reaching thus the same thickness as the glass.
3.4.10. Edge sealing and lamination
The edge sealing was done by the use of the tape HelioSeal® PVS 101, provided by Kömmerling. This PIB tape is 0.5 mm thick and was positioned on the main substrate glass, along the external edge of the encapsulant ring, as indicated in Figure 15. An encapsulant layer was placed between the glass substrate and the encapsulant ring. The SLG substrate thus was previously prepared clean, dry and free of dust and grease.
Figure 15. Edge sealant and encapsulant ring

18
The lamination process was carried out at the oven at 145 °C during 11 minutes. Figure 16 shows the final aspect of Module 2 after the manufacturing process.
Figure 16. Final aspect of Module 2. From left to right: TCO sample, three solar cells (cell a, cell b, cell c according to the position on the module) and Mo sample
After the lamination of module 17, shown in Figure 17, some cracks in the upper glasses were observed, probably due to the pressure created on the sides during the vacuum process on the lamination oven. To avoid this problem in modules 17(2) and 18 the upper dummy glasses where replaced by PET, which still allows enough protection to the pads.

19
Figure 17. Final aspect of Module 17. From left to right: TCO sample, three solar cells (cell a, cell b, cell c according to the position on the module) and Mo sample
Nantes slides were provided in two production line runs, #1600 and #1601, of four slides each. The name of each cell/surface was written under each of them by scratching the glass surface. The names were assigned in accordance with the run, number of slide and position, being the number of slide a digit between 1 and 4 and the position that occupy in the slide a character between A and F, in alphabetic order. The name assigned to Solliance cells followed as well a similar pattern, taking in account that there are 19 Solliance slides. Cells and samples included in each module were selected randomly, trying to gather cells from different slides in each module. The final disposition due to the randomization of cells and surfaces on each module it is shown in Table 2.

20
Table 2. Module number and names of samples included
Module TCO Cell A Cell B Cell C Mo Module TCO Cell A Cell B Cell C Mo
1 CO 30 E CO 11 B CO 14 E CO 18 A CO 13 A 10 CO 30 F CO 05 F CO 13 G CO 14 F CO 13 H
1(2) CO 33 D CO 05 C CO 07 F CO 30 G CO 32 B 10(2) CO 30 H CO 07 D CO 11 A CO 17 F CO 11 D
2 CO 33 H CO 05 A CO 13 C CO 30 C CO 05 D 11 1600-2 E 1600-3 B 1601-2 D 1600-1 D MoN 02
2(2) CO 30 B CO 07 E CO 13 D CO 18 H CO 07 C 12 1601-2 E 1600-2 C 1600-3 D 1601-3 C MoN 06
3 1601-3 A 1600-2 D 1600-3 C 1601-2 B MoN 04 13 CO 14 C CO 11 H CO 17 A CO 17 C CO 11 G
4 1600-1 E 1600-2 A 1600-1 B 1601-3 D MoN 03 13(2) CO 33 G CO 07 H CO 11 F CO 33 E CO 07 A
5 CO 10 F CO 19 C CO 12 H CO 16 G CO 03 C 14 CO 14 A CO 05 E CO 17 G CO 18 E CO 33 A
5(2) CO 10 G CO 12 G CO 16 A CO 19 D CO 03 A 14(2) CO 33 B CO 13 B CO 17 B CO 30 D CO 32 C
6 CO 10 D CO 12 E CO 16 H CO 19 H CO 20 F 15 1600-3 E 1600-1 C 1600-2 B 1601-2 F MoN 07
6(2) CO 10 A CO 08 C CO 12 F CO 19 A CO 03 D 16 1600-3 F 1600-1 A 1601-2 C 1601-3 E MoN 05
7 1601-1 F 1601-1 A 1601-4 A 1601-4 C Mo 03 17 CO 03 E CO 16 B CO 16 E CO 12 A CO 03 B
8 1601-1 E 1600-4 A 1601-4 B 1601-4 E Mo 01 17(2) CO 03 F CO 12 D CO 16 D CO 16 F CO 20 A
9 CO 30 A CO 05 B CO 15 A CO 18 G CO 13 F 18 1601-1 C 1600-4 E 1601-4 D 1601-4 F Mo 02
9(2) CO 14 H CO 05 H CO 07 G CO 33 F CO 18 F After all modules were manufactured the first complete characterization was carried out, consisting of:
Photography of modules
JV curve of cells
Transmission of module encapsulant
Resistance of TCO and Mo samples Once this characterization was finished the modules where finally prepared to start the damp heat degradation process by introducing them into a climate chamber at 85 °C and 85 % RH. The modules where extracted from the climate chamber several times to develop characterization at different stages of the degradation process. Due to the already observed trends it is important to carry out more frequent measures at the early hours of the experiment and less frequent after a certain time of the degradation process. The selected time steps of degradation were: 5 hours, 20 hours, 36 hours, 74 hours, 140 hours, 230 hours, 641 hours, 800 hours and 1032 hours. During every degradation step were measured the JV curve parameters of cells, the resistance of the TCO and Mo layers, and scanning images of the modules were taken. On another hand and due to expected small changes in the values, the measurement of light transmission through encapsulants was carried out only before the degradation and at 230 hours, 800 hours and 1032 hours.
21
4 Results As aforementioned, in order to study the repeatability of the obtained results all modules including cells or surfaces manufactured by Solliance laboratories and same material structure have been manufactured twice. Due to the big amount of cells and surfaces under analysis, figures and tables along this section will show, in some cases, values of one of the modules which have been duplicated, for an easy and summarized exhibition of the results. Along this section several graphs of the main electric parameters of the cells will be presented. It is needed to explain that the values of the degradation time, at the x axis, start at -10 hours. This point represents the moment before the lamination process and 0 hours represent the moment after lamination and before the introduction into the climate chamber. All the processed data obtained from the measurements of the cells and samples along the present study are exhibit at the Appendix section.
Effect of lamination on cells 4.1
Before the required lamination process in order to obtain the mini modules was developed, the cells were characterized by the measurement of their JV performance. The obtained data allowed a first comparison between the electric performance of the cells before and after the lamination, since a JV measurement was carried out after the lamination process and before the damp heat degradation treatment. These values provide how the addition of encapsulant materials, PET, thin fil barriers and the lamination process may affect to the electric behavior of the cells. Table 3 shows the change in percentage of the most important electric parameters after the lamination process. These values represent the average of the three cells included in each module. Although values vary from cell to cell, even showing an improvement in some cases, in overall current density of most of the cells decreased between 0 and 4 % from their initial values. Voc values were also affected but in a lower percentage. Nevertheless most of FF values experienced in overall an improvement between 0 and 2.5 %.

22
Table 3. Average percentage change of Voc, Jsc, FF and Eff of cells after lamination process
Module ΔVoc (%) ΔJsc(%) ΔFF (%) ΔEff (%)
1 -0.5 0.3 0.3 0.0
2 -0.9 -2.8 0.7 -3.0
3 -0.5 -2.9 -0.1 -3.5
4 -0.1 -2.5 0.5 -2.0
5 0.7 -1.4 2.5 1.8
6 -0.5 -2.1 2.3 -0.3
7 -0.2 -1.5 0.8 -0.9
8 -0.5 -3.2 1.6 -1.9
9 -0.7 -2.9 1.0 -2.7
10 -0.4 -1.4 1.8 0.0
11 0.1 -3.9 -0.1 -3.8
12 -0.5 -3.0 0.9 -2.6
13 -1.3 -3.3 -0.5 -5.0
14 -1.7 -1.2 1.0 -1.9
15 -0.5 -1.3 0.2 -1.6
16 -0.4 -0.4 0.3 -0.5
17 0.0 -2.7 2.2 -0.6
18 -0.5 -1.1 0.5 -1.1 There was no observed correlation between the changes in these parameters and the materials used or the origin of the cells. At this point it is important to mention that measurements of the same cell at different occasions but in the same stage of degradation may provide slight differences values due to the uncertainty of the measurement equipment and human related factors.
Jsc early values 4.2
An unexpected phenomenon was observed during the first hours of degradation in all samples under study. JV measurements showed a decrement of the Jsc values between hour 5 and hour 20 of the damp heat process. This decrement varies between 4 and 10 % of the absolute value, depending on the sample, which results in a large decrease of the efficiency. The fact that the decrease was observed in all samples, at the exactly same time period and in such a large amount led to think that it is certainly an unnatural performance, according to literature and previous experiments (Theelen, 2015). After 20 hours of degradation the Jsc values of every samples become steady and only experienced further changes once the degradation of the cells is taking place. Figure 18(a) and Figure 18(b) show the Jsc values of the 150 first hours of degradation of the cells included in Module 1 and Module 16 as an example of the common Jsc performance of all cells.

23
Figure 18. Jsc values of first 150 hours of degradation of the three cells included in (a) Module 1and (b) Module 16
The best hypothesis that has been found is that arrangements in the JV measurement equipment, which took place between hours 5 and 20, affected the calibration and measuring process. Since this decrease did not occur due to degradation it is important to take into account its effects on the cells efficiency.
Modules without thin-film barrier 4.3
The first set of mini modules consist in the basic encapsulation of EVA or PO with a PET foil. All modules presented a big decrement in efficiency during the first 20 hours of degradation. This effect is observed in a larger scale for the cells manufactured at Solliance lab than those manufactures at Nantes facilities. Previous studies showed that for co-evaporated CIGS cells alkali-rich, as it is the case of the present samples, but not encapsulated, the most common parameter affecting the decrement in efficiency at the early hours of damp heat degradation is the Voc (Theelen, 2015). Cells packaged without thin film barriers, as it is the case, experienced a large decrement in Voc values during the first 20 hours of degradation. Beside the degradation during the early hours aforementioned, for Solliance manufactured cells encapsulated with EVA it is possible to observe a degradation trend in efficiency starting after 140 hours of damp heat which lead to a later end of performance of the cells. Figure 19(a) illustrates the efficiency trend of cells in Module 1. This end of functioning appears the earliest after 480 hours of degradation and the latest after 800 hours, depending on the cell. The main cause of the efficiency decrement is due to an increase of series resistance. Cells included in Module 1 showed a decrease in shunt resistance which start to affect the cells performance mostly after 230 hours of degradation. Although Module 1(2) also showed shunts in some cells, the decrease of this parameter was less pronounced than in Module 1. The optical analysis revealed that the reason for the end of electric performance of all these cells is the degradation of a line on the Mo layer. This line is placed right along the location of the edge of the active area, as it can be observed in all cells exposed on Figure 20, indicated within a red circle in one of them. Once the degradation of this specific line of Mo is completed the electric current has no possible path to reach the contacts and thus the electric measurement of the cells becomes impossible. This effect has been observed as well for Nantes cells encapsulated with EVA. Thus, beside the differences in the Mo sputtering conditions from both manufacturers, the

24
degradation of EVA leads to a faster corrosion of the Mo layer than the rest of the layers and more specifically at the aforementioned location. At the late stage of damp heat exposure it was also observed a higher degree of Mo degradation around the conductive epoxy edge. This effect was found as well more pronounced for the cells encapsulated with EVA than with PO. The Mo samples at these modules showed a slow increment in resistance followed by a faster increase after 480 hours of degradation. This effect has been found in all Mo surfaces for all samples included in modules not protected by a thin film barrier.
Figure 19. Efficiency curves of cells included at (a) Module 1 which includes Solliance cells, EVA and PET, (b) Module 2 which includes Solliance cells, PO and PET, (c) Module 3 which includes Nantes cells, EVA and PET and (c) Module 4 which includes Nantes cells, PO and PET. Legends at the right of each graph indicate the module number and the position of the cells on the module.
Figure 20. Back side view of cells included in (a) Module 1 and (b) Module 3 at 800 hours of degradation. Red circle indicates the degraded line of Mo along the active area edge, visible in the rest of cells
For modules 2 and 2(2), consisting in Solliance cells encapsulated with PO, the degradation of Mo is also visible but in a much lower degree, indicating that, even when the effect will eventually occur, the required time for it is longer. The same corrosion lines along the
25
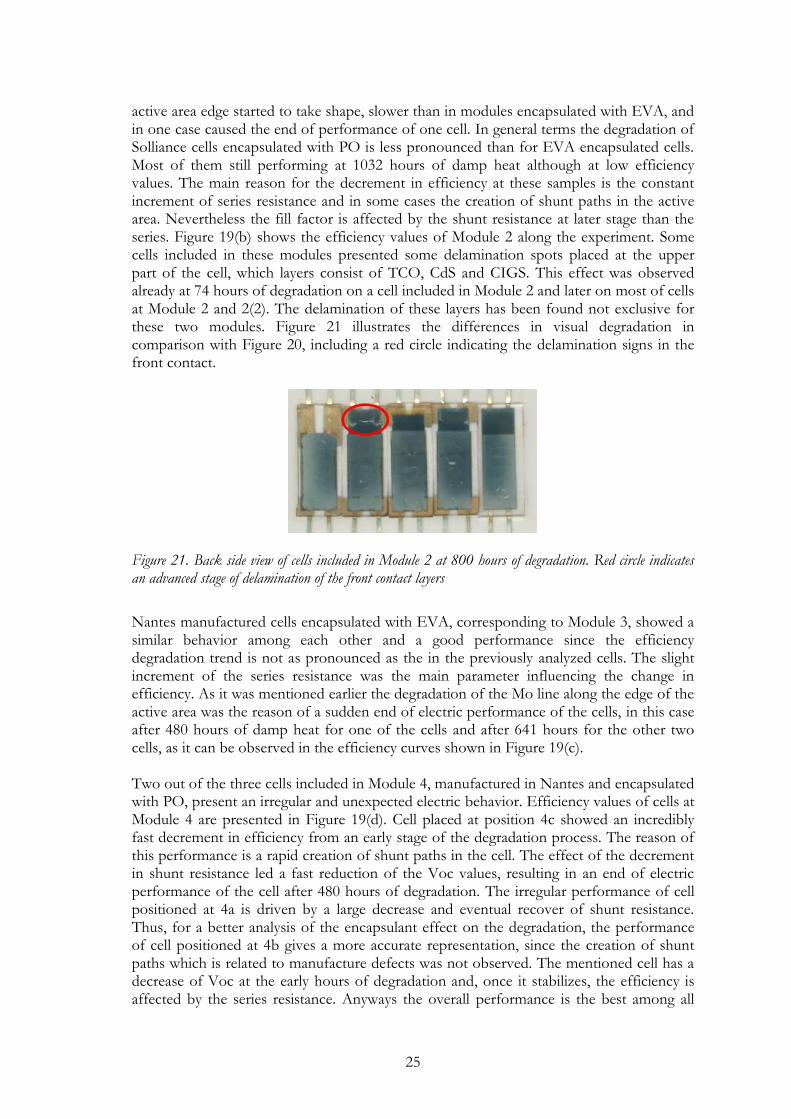
active area edge started to take shape, slower than in modules encapsulated with EVA, and in one case caused the end of performance of one cell. In general terms the degradation of Solliance cells encapsulated with PO is less pronounced than for EVA encapsulated cells. Most of them still performing at 1032 hours of damp heat although at low efficiency values. The main reason for the decrement in efficiency at these samples is the constant increment of series resistance and in some cases the creation of shunt paths in the active area. Nevertheless the fill factor is affected by the shunt resistance at later stage than the series. Figure 19(b) shows the efficiency values of Module 2 along the experiment. Some cells included in these modules presented some delamination spots placed at the upper part of the cell, which layers consist of TCO, CdS and CIGS. This effect was observed already at 74 hours of degradation on a cell included in Module 2 and later on most of cells at Module 2 and 2(2). The delamination of these layers has been found not exclusive for these two modules. Figure 21 illustrates the differences in visual degradation in comparison with Figure 20, including a red circle indicating the delamination signs in the front contact.
Figure 21. Back side view of cells included in Module 2 at 800 hours of degradation. Red circle indicates an advanced stage of delamination of the front contact layers
Nantes manufactured cells encapsulated with EVA, corresponding to Module 3, showed a similar behavior among each other and a good performance since the efficiency degradation trend is not as pronounced as the in the previously analyzed cells. The slight increment of the series resistance was the main parameter influencing the change in efficiency. As it was mentioned earlier the degradation of the Mo line along the edge of the active area was the reason of a sudden end of electric performance of the cells, in this case after 480 hours of damp heat for one of the cells and after 641 hours for the other two cells, as it can be observed in the efficiency curves shown in Figure 19(c). Two out of the three cells included in Module 4, manufactured in Nantes and encapsulated with PO, present an irregular and unexpected electric behavior. Efficiency values of cells at Module 4 are presented in Figure 19(d). Cell placed at position 4c showed an incredibly fast decrement in efficiency from an early stage of the degradation process. The reason of this performance is a rapid creation of shunt paths in the cell. The effect of the decrement in shunt resistance led a fast reduction of the Voc values, resulting in an end of electric performance of the cell after 480 hours of degradation. The irregular performance of cell positioned at 4a is driven by a large decrease and eventual recover of shunt resistance. Thus, for a better analysis of the encapsulant effect on the degradation, the performance of cell positioned at 4b gives a more accurate representation, since the creation of shunt paths which is related to manufacture defects was not observed. The mentioned cell has a decrease of Voc at the early hours of degradation and, once it stabilizes, the efficiency is affected by the series resistance. Anyways the overall performance is the best among all

26
cells encapsulated with EVA or PO and PET since efficiency remains at 9 % after 1032 hours of degradation.
Modules with SiN deposited on cells 4.4
In overall, cells protected with SiN barrier deposited on top of the cell performed slightly lower initial values than the cells without the barrier. This might be caused due to the PECVD process required to provide the SiN layer. Since the thin film barrier was deposited before the gold layer (which is needed for a proper electric contact), it was not possible to carry out a reliable JV measurement of the cells before and after the SiN deposition. Thus a comparison between the efficiency values before and after the PECVD process is missing and it is not possible to certainly attribute the lower efficiency values to this process. Figure 22 shows the efficiency values of module containing cells protected by SiN barrier on cells. After a first look at the efficiency of all modules including SiN deposited on cells manufactured by Solliance it is easy to identify that all of them contain one cell which electric performance don’t follow the same trend as the rest of analysed cells. These cells experienced a large decrement of the fill factor at the early hours of degradation due to a combination of series resistance and shunt resistance bad performance, leading to a drop in efficiency around the half of their initial values in the first 200 hours. They have in common that all of them where extracted from the same slide: CO19. The differences in the performance of these cells from the rest might be caused by a poorer manufacturing process or any possible damage occurred during the SiN barrier sputtering or the treatment followed until the obtainment of the modules.
Figure 22. Efficiency curves of cells included at (a) Module 5which includes Solliance cells with SiN, EVA and PET, (b) Module 6 which includes Solliance cells with SiN, PO and PET, (c) Module 7 which includes Nantes cells with SiN, EVA and PET and (d) Module 8 which includes Nantes cells with SiN, PO and PET.
27
Beside the performance of the mentioned cells, it was observed that the trend of efficiency decrement of SiN covered cells was similar to the cells not protected with a barrier, except for Solliance cells encapsulated with EVA. Since many of the cells which were not protected with a barrier had an early end of performance, the compared trend between them and the SiN covered cells refers to the degradation trend until 480 hours of degradation. This similarity was observed in both the efficiency values at that time and the percentage of total efficiency decrease from degradation start point. Not only the efficiency values were alike for these two types but also the series resistance also had a similar increasing rate. In order to have a better understanding of the similar increase rate of Rs, the TCO and Mo surfaces included in these modules were observed. The resistance values of TCO and Mo samples for both cases, non-barrier protected and samples with SiN barrier deposited on top, are presented at Figure 23. TCO samples experienced a constant decrement in their conductivity from the beginning of the degradation process, shown as increment of their resistance. The resistance values have a similar starting range, between 10 and 20 ohms, for both cases, and end up within a similar range of resistance values once the experiment is finished at 1032 hours. For the Mo samples it is possible to see that in overall, besides some exceptions, the resistance values start at a similar range and remain steady during the first 480 hours. After this period, the resistance of the samples started to increase for both types, the samples not protected with barrier and those which have a SiN thin film barrier on top. Nevertheless, the large initial decrement of Voc for the SiN barrier protected samples extended to the first 74 hours instead of the only 20 hours for the non-barrier protected.

28
Figure 23. Resistance curves of (a) TCO samples and (c) Mo samples at modules non-barrier protected, and resistance curves of (b) TCO samples and (d) Mo samples protected with SiN barrier.
Important is to point out that the SiN barrier avoided the Mo degradation line along the active area observed in the non-barrier protected cells. This protection prevented from an early end of performance. Nevertheless images showed a large Mo degradation underneath the conductive adhesive epoxy, starting at first along its edge, shown in Figure 24. This effect is easily observed at 480 hours of degradation and it was detected earlier in modules packaged with EVA than in modules packaged with PO. Moreover EVA encapsulated samples shown a faster degradation of the mentioned Mo areas. Of course the encapsulants of all the mentioned modules must have reached the same degree of moisture saturation at the same damp heat exposure time. Thus, it seems that the SiN barrier sputtered on cells avoid the sudden end of performance and provided a slower degradation rate at the early stage of the damp heat process but after 100 hours the barrier seems to have no longer protection effect.

29
Figure 24. Back side view of Module 5 at 1032 hours of degradation. Red circle indicates the degradation of Mo matching the area where the conductive epoxy is placed, visible in the rest of cells and the Mo sample.
In overall, the main cause of efficiency lost in the cells covered by SiN was the increase of series resistance, which became more pronounced after 480 hours of degradation in many cells. Cells obtained from slide CO19 have shown low values in shunt resistance at early stage of degradation.
Modules with SiN barrier deposited on cells and not 4.5encapsulated
Cells only protected by SiN deposited on top and without any type of encapsulant or foil experienced a short lifetime under damp heat conditions. The common pattern showed a large decrement of efficiency for the first 74 hours of degradation, driven mainly due to the Voc decrement, and followed by a less pronounces efficiency degradation, mainly driven by the increment of the series resistance. Six out of the nine cells presented an abrupt end of performance before 480 hours of degradation. Rest of the cells also experienced the sudden end of performance at different stages of the degradation process. The efficiency values of cells at Module 17(2) and Module 18 are presented in Figure 25.
Figure 25. Efficiency curves of cells included at (a) Module 17(2) which includes Solliance cells with SiN and (b) Module 18 which includes Nantes cells with SiN
Molybdenum resistance measurements of the Mo samples included in the modules revealed a very rapid decrease of conductivity from the early stage of degradation, showed in Figure 26(a). Unlike the non-barrier protected cells the end of electric performance does not occur due to Mo degradation along the active are edge in this case. As it was observed in the cells with SiN barrier deposited on top and encapsulated, the Mo start degrading first around the conductive epoxy edge and, in this case, much earlier and at a higher rate.
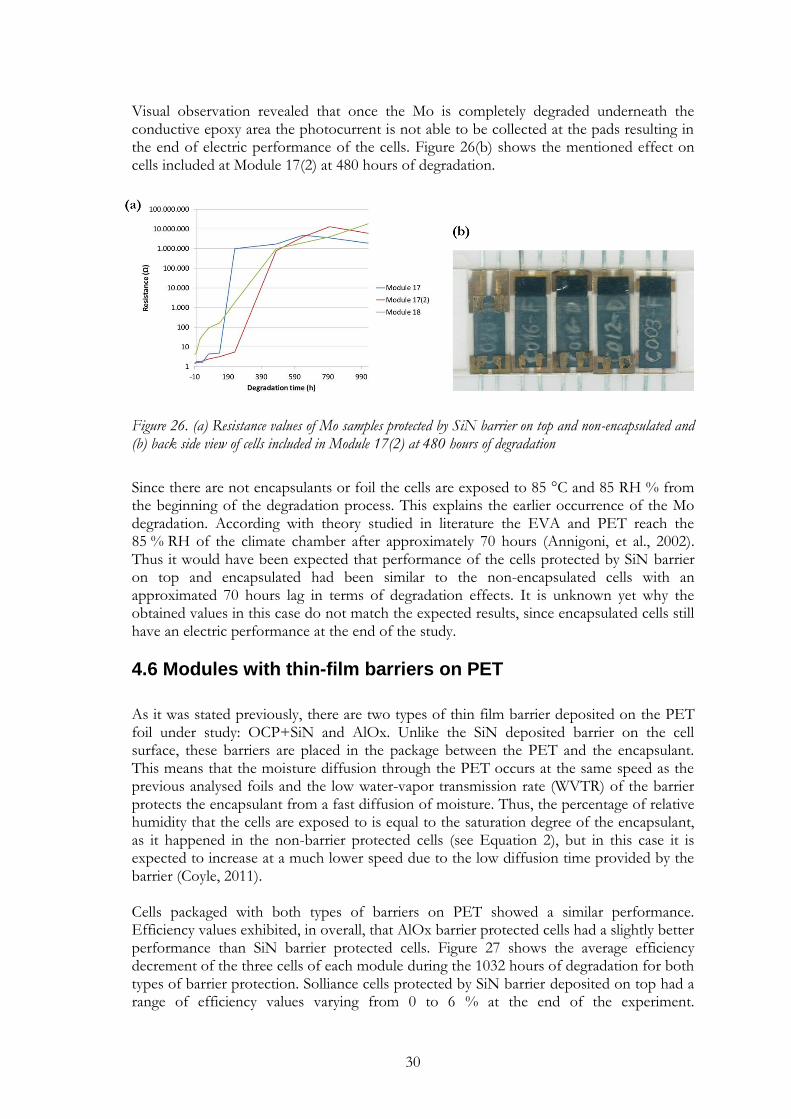
30
Visual observation revealed that once the Mo is completely degraded underneath the conductive epoxy area the photocurrent is not able to be collected at the pads resulting in the end of electric performance of the cells. Figure 26(b) shows the mentioned effect on cells included at Module 17(2) at 480 hours of degradation.
Figure 26. (a) Resistance values of Mo samples protected by SiN barrier on top and non-encapsulated and (b) back side view of cells included in Module 17(2) at 480 hours of degradation
Since there are not encapsulants or foil the cells are exposed to 85 °C and 85 RH % from the beginning of the degradation process. This explains the earlier occurrence of the Mo degradation. According with theory studied in literature the EVA and PET reach the 85 % RH of the climate chamber after approximately 70 hours (Annigoni, et al., 2002). Thus it would have been expected that performance of the cells protected by SiN barrier on top and encapsulated had been similar to the non-encapsulated cells with an approximated 70 hours lag in terms of degradation effects. It is unknown yet why the obtained values in this case do not match the expected results, since encapsulated cells still have an electric performance at the end of the study.
Modules with thin-film barriers on PET 4.6
As it was stated previously, there are two types of thin film barrier deposited on the PET foil under study: OCP+SiN and AlOx. Unlike the SiN deposited barrier on the cell surface, these barriers are placed in the package between the PET and the encapsulant. This means that the moisture diffusion through the PET occurs at the same speed as the previous analysed foils and the low water-vapor transmission rate (WVTR) of the barrier protects the encapsulant from a fast diffusion of moisture. Thus, the percentage of relative humidity that the cells are exposed to is equal to the saturation degree of the encapsulant, as it happened in the non-barrier protected cells (see Equation 2), but in this case it is expected to increase at a much lower speed due to the low diffusion time provided by the barrier (Coyle, 2011). Cells packaged with both types of barriers on PET showed a similar performance. Efficiency values exhibited, in overall, that AlOx barrier protected cells had a slightly better performance than SiN barrier protected cells. Figure 27 shows the average efficiency decrement of the three cells of each module during the 1032 hours of degradation for both types of barrier protection. Solliance cells protected by SiN barrier deposited on top had a range of efficiency values varying from 0 to 6 % at the end of the experiment.

31
Nevertheless, Solliance cells protected by SiN barrier on PET have final efficiency values in a range from 6 to 11 %; and AlOx barrier on PET protected Solliance cells preformed a range of efficiency values between 7 and 12 %. While the mentioned range values correspond to single cells, Figure 27 shows average values.
Figure 27. Average efficiency curves of cells included in (a) modules protected by OCP+SiN barrier on PET and (b) modules protected by AlOx barrier on PET
No visual changes were observed during the degradation time of the experiment. Cells, surfaces and pads did not evidence any sign of corrosion or oxidation nor experimented any change in colour, except some delamination of the front contact area observed in cells included in Module 14(2). This module showed a poor adhesion between the PET and the edge sealant, exhibited as bubbles between these two materials starting at 20 hours of degradation. Thus, the higher degradation rate of the cells included on it might be cause by the moisture ingress through the edge. Measurements of the resistance of the Mo layers showed steady values along the whole experiment process which means there were no changes in conductivity. This indicates that the saturation degree of the encapsulant have not reached yet a point which lead to a fast degradation rate. TCO surfaces had low but constant increment of the resistance from the beginning of the damp heat process. While the non-barrier protected cells had an average increment of 125 % of the resistance from the initial point to the end of the degradation process, the TCO surfaces included in modules protected with barriers on PET only experienced an average increase of 37 % of the resistance during the whole process. This lose in conductivity can be observed by comparing Figure 28(a), for TCO and Mo samples included in modules with OCP+SiN barrier on PET, and Figure 28(b), for samples in non-barrier and SiN barrier modules. Notice that the y-axis range of values is different in the figures for an easy observation of the curves.

32
Figure 28. Resistance values of (a) TCO samples and (b) Mo samples included in modules with OCP+SiN barrier on PET. The increase of the resistance is very low, in the case of the TCO samples, or inexistent, for the Mo samples, in comparison with TCO and Mo samples included the previously analyzed modules
Beside some series resistance increment and, even less frequent, shunt resistance decrement observed in some cells, the main parameter driving the decrease in efficiency is the Voc. This parameter decreases slowly until it reaches certain stability. This effect was observed in non-barrier protected cells and SiN deposited barrier protected cells.
Voc performance 4.7
As it was mentioned, non-encapsulated co-evaporated alkali rich CIGS cells normally experience a decrease of Voc during the first hours of degradation until it reach certain stability. This effect varies in magnitude depending on the cell. Thus it is expected that the Voc of cells obtained from the same CIGS slide, which properties are homogeneously distributed, would perform alike under the same degradation conditions. This effect occurred in some cells extracted from the same slide included in non-barrier packaged modules: Voc decrement curve and stabilization point match very similar values. The decrease of Voc and stabilization time for the SiN deposited barrier cells was slower and for cells protected by barriers on PET even much slower. Once the Voc values of cells obtained from the same slide and located in different modules are plotted in a graph it is possible to observe how the decrease and the stabilization point provide a certain correlation with the degradation level due to moisture ingress. The required time for Voc to stabilize does not relate with the degradation rate but with the total degradation degree. This occurs due to degradation rate is not constant in time until the encapsulant saturation stabilizes by reaching the 85 % RH of the climate chamber environment (see Equation 1 and Equation 2). Figure 29 shows the Voc performance of cells from slide CO05 included in modules without barrier (fast Voc decrement curves at early hours) and modules with SiN barrier on PET (slower Voc decrement curves). Figure 30 provide examples of the Voc performance through the JV curve analysis of two of the cells from Figure 29: JV curves of cell CO05A, positioned at Module 2a, and CO05H, positioned at Module 9(2) a, exhibit

33
how the Voc decrease until it reaches certain value, varying the required degradation time depending on the encapsulation package.
Figure 29. Voc curves of cells extracted from slide CO05. Cells included in modules without barrier, the red and blue curves, have a fast decrement of Voc followed by stabilization after 20 hours. Cells included in modules with barriers perform a smoother Voc decrement before its stabilization, reaching until 400 hours aproximately.
Figure 30. JV curves of (a) cell CO05A, positioned at Module 2 a, and (b) cell CO05H, positioned at Module 9(2)a. Voc of cell CO05A has a fast decrease from 5 to 20 hours and remains in a small range of values until other degradation mechanism take place starting at 641 hours. Nevertheless Voc of cell CO05H decrements is slower
As it can be observed in previous sections, the Voc values of cells from different slides included in the same type of encapsulation package don’t reach the stability at the same degradation time. This is due to the fact that cells from different slides have different electric performance and their response to moisture degradation varies from one to another. Thus it is not possible to determine a specific percentage of saturation of the encapsulant package used by observing the Voc performance but it can provide the approximation of the degradation evolution in time according with the moisture ingress.

34
Front contact delamination 4.8
Pictures from modules scanning showed that the delamination of the TCO, CdS and CIGS layers at the upper part of the cells starts at the edge of the electric conductive epoxy of the upper contacts and spread along the surrounding areas. The effect occurred in many cells packaged with EVA or PO and regular PET regardless if they were manufactured in Solliance or Nantes facilities. Important to mention is that, even when the delamination was observed in cells encapsulated with EVA, it has been found, in different degree, more frequently and in early stages of degradation on cells encapsulated with PO. Besides that visual observation revealed this delamination, the series resistance of these cells didn’t experience a larger increment once the first signs appeared. Anyways, the combination of other components degradation, as Mo degradation, makes difficult to analyse through the series resistance values the single effect of the mentioned delamination. Although, in the only two cells where the delamination extended further than around the conductive epoxy edges, a larger increment of series resistance was observed at the same time that the effect spread along the region. Some visual examples of the delamination evolution are exposed at Figure 31.
Figure 31. Evolution in time of the front contact area delamination of cells CO30C, 1601-4F and CO19A.
A good method to analyse the influence of the delamination on the series resistance could have been obtained by the measured resistance values of the TCO surface samples included in the modules affected. Nevertheless these samples did not present the mentioned effect as often and developed as some cells. The TCO samples in which the sign of delamination started to appear around the conductive epoxy edges did not show a large increment in series resistance at that specific degradation time. At 1032 hours of degradation, resistance values were obtained through the measurement of the electric conductivity between the two pads connected at the front contact of every cell and sample. Also the resistance between the two pads connected at the back contact of every cell and sample were measured. This measurement allowed thus to know the resistance between the terminals of the pads located at the TCO front contact. The obtained values showed certain correlation between the conductivity of the TCO along the terminals of the pads and the degree of delamination observed on the scanned pictures but, since the

35
delamination is not the only agent increasing the resistance of the TCO, it is hard to establish to what extent and in which stage of delamination the conductivity is affected. Further damp heat treatment will allow us to observe any possible strong correlation between the resistance increment of the TCO layer and the delamination stage of the mentioned layers.
Mo degradation 4.9
For cells and surfaces included in non-barrier protected modules Mo degradation seemed to be a significant factor in terms of series resistance increase along the degradation process and especially a decisive factor in relation with the end of electric performance. As it has been observed in previous studies Mo experiments a faster degradation on areas which has been submitted to stress or which the thickness of the layer has been reduced (Theelen, 2015). Thus the first visual signs of Mo degradation were found along the edge of the layer due to the laser ablation. In order to provide the required shape to cells it was also necessary to scratch areas of TCO, CdS and CIGS layers and thereby access to the back contact, in other words the Mo layer. This process starts by scratching a line that separates the active area from the rest of material to be removed. For this reason, the stress created on Mo along this line due to the scratching process, the degradation of Mo occurs earlier along the active area edge on modules encapsulated without barrier. This effect is critical since this line correspond to the P3 region on monolithic interconnected cells on real modules, shown in Figure 32. The SiN barrier deposited on top of the cells seems to prevent the Mo degradation at this location but on the other hand allowed its degradation underneath the conductive epoxy, starting from the edge of the epoxy. It is probably due to the stress the electric conductive epoxy creates on the Mo layer once it is cured at the oven the reason of the early degradation of Mo on these areas.
Figure 32. Typical monolithic interconnection of cells at CIGS modules
It has been found that the degradation of the Mo around the epoxy occurred at a much later degradation time and lower degree for the cells without a barrier than for the cells protected by the SiN barrier deposited on the surface
Solliance and Nantes cells 4.10
Due to the early end of performance of the cells encapsulated without barrier it is easier to obtain a comparative evaluation of the cells manufactured in Solliance and Nantes facilities by analyzing the thin film barrier protected cells. At previous sections, Figure 27 showed the efficiency values of the modules, counted as the average value of the three cells included in each, protected by OCP+SiN barrier on PET and AlOx barrier on PET.

36
Figure 33 also shows the efficiency average for modules with SiN barrier deposited on the top of the cells. It is possible to observe in the mentioned figures that Nantes cells have higher initial efficiency values than Solliance cells and how the degradation rate of the Nantes cells is lower during the long term exposure of damp heat.
Figure 33. Average efficiency curves of cells protected by SiN barrier on top. Module 7 and Module 8 contain Nantes cells, experiencing a lower degradation rate than Modules including Solliance cells.
As it was mentioned before, opposite to the Solliance cells performance, Nantes cells showed a very low Voc decrement at early hours. In cells from all modules except those protected by AlOx barrier on PET, the shunt resistance of the Solliance cells experiment a decrease in magnitude along the 1032 hours of degradation. Nevertheless the shunt resistance of Nantes cells remains steady and constant along the experiment period. Figure 34 shows the average Rsh value of the three cells included in each module for those protected by SiN barrier and OCP+SiN barrier on PET. Notice that except Module 9(2) all Solliance cells ended the experiment with lower shunt resistance values than Nantes cells. This effect was also observed in the previously developed experiment.
Figure 34. Average Rsh values of cells (a) protected by SiN barrier on top and (b) cells included in modules protected by OCP+SiN barrier on PET. Modules 7, 8, 11 and 12 contain Nantes cells, experiencing a lower Rsh decrease along the degradation time.

37
Light transmission through encapsulants 4.11
In order to study the effect of the encapsulant materials degradation in terms of their interaction with light, the transmission of light has been measured at four different stages of the damp heat process: before the degradation, at 230 hours, 800 hours and 1032 hours.
It is expected a reduction in light transmission values in relation with the degradation degree of the encapsulant materials due to the damp heat process. Previous experiments showed unexpected values of transmission measured by the equipment since, in some cases, encapsulants performed a lower transmission curves at early stage of degradation than after several hours of damp heat. In order to find out the reproducibility of the measurements, the same encapsulants stack were measured twice and the curves were compared. It was possible to observe that, for the same module at the same stage of degradation, the transmission values may vary from 0 to 10 % at the same wavelength value. The transmission curves for EVA encapsulants included in modules without barrier on PET showed a large decrease of light transmission between the measure before degradation and 280 hours of damp heat. Since more measurements between these two stages were not taken it is hard to define at which exact time the loose of light transmission is occurring. After 280 hours the transmission values remain within a similar range thus not experiencing any larger decrease. Figure 35(a) present the light transmission variation of Module 1, packaged with EVA and regular PET. Images showed that EVA encapsulants without barrier on PET started to turn into a yellowish colour before 140 hours of degradation. Along the damp heat process the colour intensifies turning into a darkest yellow. Figure 35(b) shows the aspect of Module 1 after 1032 hours of degradation. It was also observed that EVA encapsulant without barriers on PET presented what is supposed to be probably some liquid content according to the visual inspection before 641 hours of degradation. This liquid cannot be identified until the damp heat process reaches its end and the modules can be opened. Presumably it may contain acetic acid which has been widely reported as a common by-product of EVA degradation (Shioda, 2013).
Figure 35. (a) Light transmission curves of Module 1 and (b) its appearance at 1032 hours of degradation. Picture exhibit a yellowish color at the encapsulant ring of the module
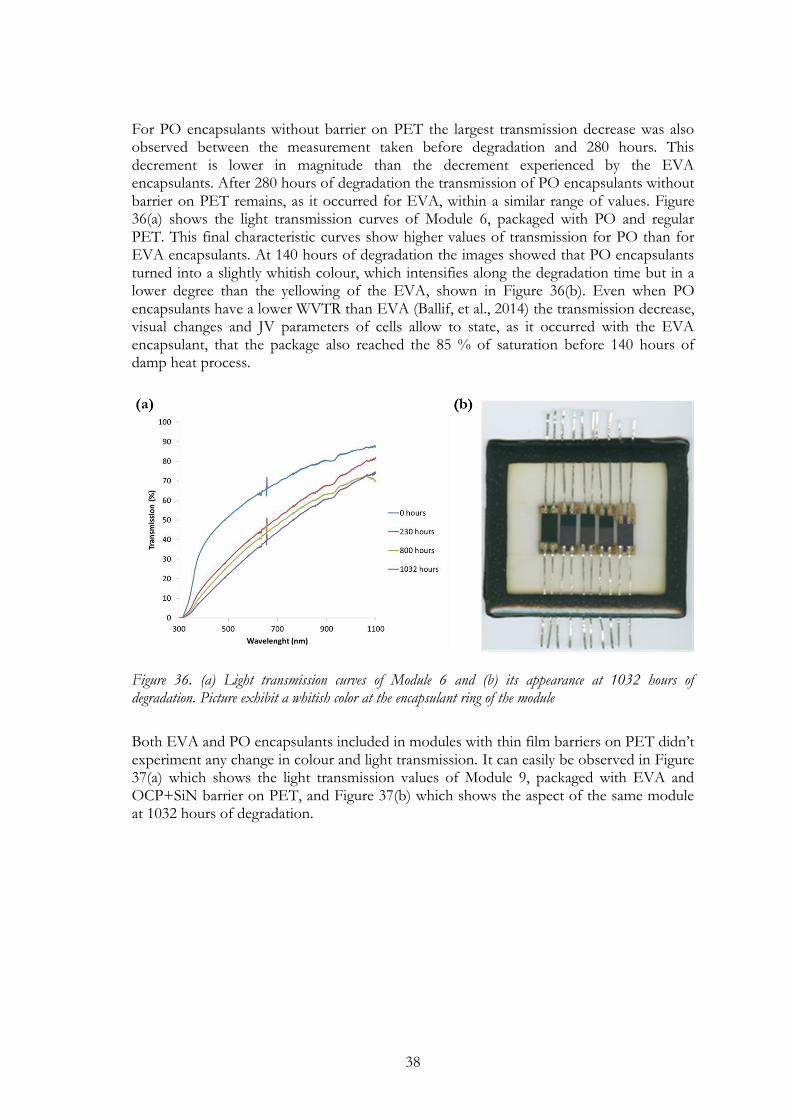
38
For PO encapsulants without barrier on PET the largest transmission decrease was also observed between the measurement taken before degradation and 280 hours. This decrement is lower in magnitude than the decrement experienced by the EVA encapsulants. After 280 hours of degradation the transmission of PO encapsulants without barrier on PET remains, as it occurred for EVA, within a similar range of values. Figure 36(a) shows the light transmission curves of Module 6, packaged with PO and regular PET. This final characteristic curves show higher values of transmission for PO than for EVA encapsulants. At 140 hours of degradation the images showed that PO encapsulants turned into a slightly whitish colour, which intensifies along the degradation time but in a lower degree than the yellowing of the EVA, shown in Figure 36(b). Even when PO encapsulants have a lower WVTR than EVA (Ballif, et al., 2014) the transmission decrease, visual changes and JV parameters of cells allow to state, as it occurred with the EVA encapsulant, that the package also reached the 85 % of saturation before 140 hours of damp heat process.
Figure 36. (a) Light transmission curves of Module 6 and (b) its appearance at 1032 hours of degradation. Picture exhibit a whitish color at the encapsulant ring of the module
Both EVA and PO encapsulants included in modules with thin film barriers on PET didn’t experiment any change in colour and light transmission. It can easily be observed in Figure 37(a) which shows the light transmission values of Module 9, packaged with EVA and OCP+SiN barrier on PET, and Figure 37(b) which shows the aspect of the same module at 1032 hours of degradation.

39
Figure 37. Light transmission curves of Module 9 and (b) its appearance at 1032 hours of degradation. No visible discoloration was observed
The transmission curves are in most cases consider within the measurement uncertainty range previously mentioned. At this point it is important to remark that in some cases the unexpected values observed in previous experiments were reproduced. Values of the measurements taken before degradation showed curves with lower percentage of transmission than the measurements taken once the degradation has started. It was also observed in some cases that the transmission percentage values exceeded the 100 %. Thus it seems some mistakes were performed during the measurements resulting in a not totally reliable data. Beside these possible failures, in average, most of light transmission values matched the expectations according to previous experiments.
Repeatability 4.12
The lower availability of CIGS cells manufactured by Nantes University led to produce two modules with the same characteristics only for those which include Solliance cells. Figure 38 shows the average efficiency values of the three cells included in the modules containing Solliance cells, presenting in each graph the modules with the same characteristics.
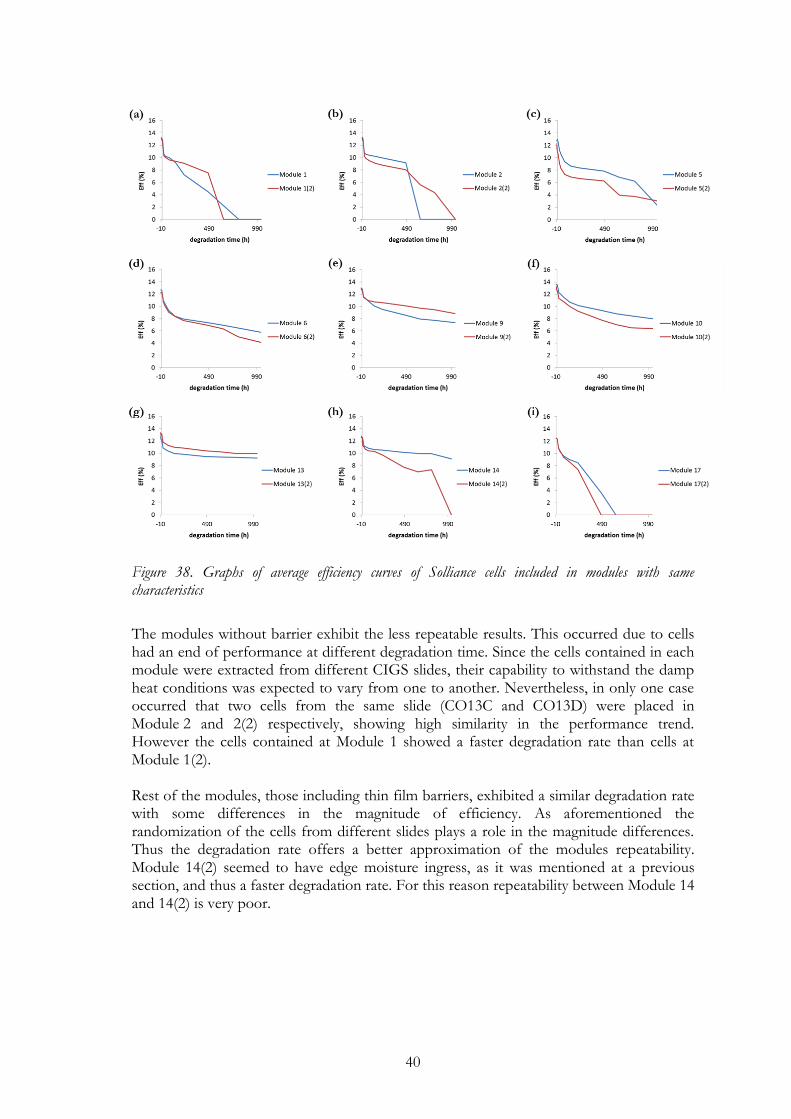
40
Figure 38. Graphs of average efficiency curves of Solliance cells included in modules with same characteristics
The modules without barrier exhibit the less repeatable results. This occurred due to cells had an end of performance at different degradation time. Since the cells contained in each module were extracted from different CIGS slides, their capability to withstand the damp heat conditions was expected to vary from one to another. Nevertheless, in only one case occurred that two cells from the same slide (CO13C and CO13D) were placed in Module 2 and 2(2) respectively, showing high similarity in the performance trend. However the cells contained at Module 1 showed a faster degradation rate than cells at Module 1(2). Rest of the modules, those including thin film barriers, exhibited a similar degradation rate with some differences in the magnitude of efficiency. As aforementioned the randomization of the cells from different slides plays a role in the magnitude differences. Thus the degradation rate offers a better approximation of the modules repeatability. Module 14(2) seemed to have edge moisture ingress, as it was mentioned at a previous section, and thus a faster degradation rate. For this reason repeatability between Module 14 and 14(2) is very poor.

41
5 Conclusions and further work Due to the low values of WVTR of the foil and encapsulants used, in the non-barrier protected modules the moisture ingress at the early stage of damp heat leads to faster cell properties degradation than for those cells packaged in modules protected by a thin film barrier. This indicates that the encapsulation stuck has a fast diffusion of moisture, as it was expected according with the literature studied (Annigoni, et al., 2002). It is hard to determine if the encapsulants have reached 85 % of saturation at the early stage of degradation or not since the required values to elaborate a theoretical approximation are missing. Nevertheless the Voc and the efficiency performance allow to consider a high degradation rate due to the saturation percentage of the encapsulants is already the same as the climate chamber relative humidity at 100 hours of degradation. As it was mentioned, theoretically EVA reaches the 85 % RH at around 70 hours of damp heat. Since the first signs of yellowish colour on EVA appeared after 100 hours of degradation approximately, it seems that the decolouration occurs a few hours after or once the encapsulant reaches the 85 % of saturation. According to the performance comparison during the first 480 hours of degradation between non-barrier protected cells and the cells with SiN deposited on top, the SiN seems to not provide much better protection against the moisture. This might be caused by a big amount of pinholes or defects on the layer or by a not thick enough SiN layer. However, the short term of the comparison do not enable to establish a strong relation between the performances of both types. Nevertheless, the prevention of the Mo degradation along the active area edge allows the abrupt end of electric performance resulting on a longer lifetime. However the degradation of the Mo underneath the conductive epoxy results in a decrease of the field factor and eventually in an end of electric performance. The effects of EVA degradation due to moisture ingress lead to a faster degradation of the cells. Previous studies indicated that the release of acetic acid from EVA as result of its degradation affect the CIGS and accelerate the degradation process. As far as it was observed in this study, Mo seems to be the component of the cells which is more affected by the EVA degradation. The lower WVTR of PO doesn’t provide a much longer lag in terms of encapsulant saturation degree but at least it decelerates the Mo degradation process in comparison with EVA encapsulants. Encapsulants protected by barriers on PET did not experiment any discoloration or change in light transmission which means that the 85 % of saturation was not reached. Thus, even when the JV curves of the cells proved that a certain degree of degradation is taking place, the visual changes, Mo and TCO resistance and transmission values showed that the encapsulants have not reach yet the 85 % RH. The cells degradation occurs due to a lower relative humidity than 85 % which lead to a low degradation rate. In general terms, the protection against moisture ingress was best accomplished by thin film barriers located on the PET foil for three main reasons. First reason is their low and stable WVTR values, easily observed in the cells electric performance as a low decrement in efficiency. Secondarily, the protection of the encapsulant did not led to a decrease in light transmission and thus in a decrement of Jsc. In terms of aesthetics, the prevention of decolouration of encapsulants plays also an important role. And third reason is that the cell does not have to withstand the effect of any possible substances released by the

42
degradation of the encapsulants. At 1032 hours of degradation AlOx on PET seems to perform a slightly better protection than OCP+SiN on PET. It has not been possible to certainly know yet why the degradation of the Mo around the epoxy occurred at a much later degradation time and lower degree for the cells without a barrier than for the cells protected by the SiN barrier deposited on the surface. A possible hypothesis is the sacrificial degradation of the Mo on the cells without SiN barrier. As it was observed in previous experiments and corroborated in the present study the overall performance of cells manufactured in Nantes is better than the Solliance manufactured cells. In order to enhance the long term electric performance of the cells manufactured at Solliance facilities is necessary to identify the mechanisms causing the prolonged decrease of the shunt resistance along the damp heat exposure. The present study analyses the results obtained for the first 1032 hours of damp heat degradation. Nevertheless the modules have been planned to been degraded until a total of 3000 hours. Further results will allow a more detailed analysis. Among others, it is expected to observe the differences that the long term of damp heat exposure may cause between the cells protected by OCP+SiN barrier on PET and AlOx barrier on PET or the evolution of the Mo degradation and which areas are more affected by this effect. Further experiments are recommended to be carried out in order to obtain proper explanation to all subjects that are not been able to be properly interpreted yet. The delamination of the front contact area in some of the cells under degradation is for instance an important issue which should be analysed to acquire a better understanding of the CIGS cells degradation mechanisms. It is also important to identify the liquid content observed after a certain time of damp heat exposure on the EVA encapsulants, in order to ascertain if it is in fact acetic acid or any other possible substance. Since the Mo degradation underneath the conductive epoxy, the principal failure mechanism of degradation for cells with deposited SiN barrier on top, was identified it is crucial to achieve a new design for the cell testing. The new design must avoid the lack of moisture protection in the areas where the degradation occurs at an early stage and thus allow a longer evaluation of the cells performance, hopefully fully protected by the SiN barrier.

43
6 Bibliography Advice, S. F. a., 2013. [Online] Available at: http://www.solar-facts-and-advice.com/solar-cells.html [Använd April 2016]. Annigoni, E. o.a., 2002. In-situ monitoring of moisture ingress in PV modules. [Online] Available at: http://www.swissolar.ch/fileadmin/user_upload/Tagungen/PV-Tagung_2015/Posterausstellung/P13_In-situ_monitoring.pdf [Använd January 2017]. Ballif, C. o.a., 2014. Impact of moisture ingress in PV modules on long-term performance: the role of EVA formulation, module design and climate. [Online] Available at: https://www.tuv.com/media/germany/10_industrialservices/pv_modulworkshop/pv_modulworkshop_2014/23_Ballif_Impact_of_Moisture_Ingress_in_PV_Modules.pdf [Använd October 2016]. Coyle, D. J., 2011. Life prediction for CIGS solar modules part 1: modeling moisture ingress and degradation.. Progress in Photovoltaics: Research and Applications, Jluy. Deswaziere, A., 2017. Analysis of the Local Composition of CIGS, Eindhoven: TNO internal report (not published). S. f. a. a., 2013. [Online] Available at: http://www.solar-facts-and-advice.com/solar-cells.html [Använd April 2016]. Shioda, T., 2013. Acetic acid production rate in EVA encapsulants and its influence on performance of PV modules. Gaithersburg, MD, u.n. Theelen, M., 2015. Chapter 5: Degradation mechanisms of the molybdenum back contact. i: Degradation of CIGS solar cells. Eindhoven: u.n. Theelen, M., 2015. Chapter 7: The impact of alcali elements on the degradation of CIGS solar cells. i: Degradation of CIGS solar cells. Eindhoven: u.n. Theelen, M., 2015. Stability of Cu(In,Ga)Se solar cells. i: Degradation of CIGS solar cells. Eindhoven: u.n.

44
Appendix A: electric parameters and curves
Module position Sample name -10 hours 0 hours 5 hours 20 hours 36 hours 74 hours 140 hours 230 hours 480 hours 641 hours 800 hours 1032 hours
1a CO 11 B 0.628 0.624 0.614 0.597 0.590 0.587 0.571 0.379 0.386 0.364 NaN 0
1b CO 14 E 0.633 0.633 0.621 0.612 0.610 0.606 0.608 0.601 0.534 0.416 0.267 0
1c CO 18 A 0.623 0.618 0.583 0.545 0.536 0.529 0.525 0.521 0.399 0.248 NaN 0
1(2)a CO 05 C 0.636 0.629 0.605 0.545 0.540 0.532 0.529 0.524 0.471 NaN NaN 0
1(2)b CO 07 F 0.632 0.628 0.613 0.550 0.541 0.531 0.529 0.528 0.516 0.517 NaN 0
1(2)c CO 30 G 0.615 0.614 0.601 0.590 0.588 0.583 0.583 0.582 0.567 0.547 0.540 0
2a CO 05 A 0.635 0.625 0.605 0.559 0.556 0.553 0.551 0.546 0.535 0.503 0.338 0.204
2b CO 13 C 0.627 0.627 0.610 0.601 0.596 0.586 0.581 0.577 0.572 0.000 0 0
2c CO 30 C 0.622 0.615 0.598 0.595 0.596 0.593 0.591 0.590 0.588 0.586 0.586 0.571
2(2)a CO 07 E 0.639 0.630 0.614 0.545 0.537 0.529 0.527 0.527 0.520 0.519 0.515 0.482
2(2)b CO 13 D 0.626 0.628 0.617 0.600 0.596 0.586 0.580 0.577 0.572 0.451 0.255 0
2(2)c CO 18 H 0.630 0.627 0.593 0.542 0.539 0.532 0.529 0.528 0.518 0.515 0.499 0.190
3a 1600-2 D 0.595 0.589 0.594 0.585 0.585 0.579 0.576 0.576 0.572 0.574 0 0
3b 1600-3 C 0.616 0.611 0.613 0.600 0.599 0.593 0.591 0.592 0.589 0.845 0 0
3c 1601-2 B 0.588 0.591 0.586 0.572 0.572 0.567 0.563 0.552 0.556 0.548 NaN NaN
4a 1600-2 A 0.592 0.589 0.587 0.497 0.514 0.575 0.573 0.573 0.571 0.233 0 0
4b 1600-1 B 0.591 0.586 0.583 0.575 0.571 0.563 0.557 0.554 0.547 0.546 0.552 0.557
4c 1601-3 D 0.602 0.608 0.604 0.585 0.569 0.554 0.507 0.355 0.149 0.000 0 0
5a CO 19 C 0.625 0.622 0.620 0.592 0.571 0.544 0.548 0.547 0.539 0.464 0.415 0.434
5b CO 12 H 0.615 0.620 0.617 0.597 0.584 0.564 0.554 0.549 0.540 0.530 0.530 0.434
5c CO 16 G 0.616 0.627 0.621 0.607 0.601 0.584 0.570 0.561 0.546 0.538 0.539 0.718
5(2)a CO 12 G 0.624 0.612 0.611 0.581 0.571 0.559 0.549 0.540 0.525 0.531 0.531 0.550
5(2)b CO 16 A 0.626 0.614 0.611 0.581 0.569 0.551 0.542 0.539 0.530 0.527 0.529 0.528
5(2)c CO 19 D 0.623 0.620 0.613 0.584 0.558 0.517 0.519 0.525 0.523 0.519 0.522 0.522
6a CO 12 E 0.620 0.615 0.613 0.591 0.580 0.561 0.550 0.543 0.531 0.525 0.526 0.516
6b CO 16 H 0.619 0.622 0.621 0.606 0.600 0.584 0.569 0.559 0.545 0.533 0.537 0.533
6c CO 19 H 0.630 0.624 0.616 0.589 0.570 0.535 0.524 0.530 0.527 0.522 0.525 0.520
6(2)a CO 08 C 0.622 0.624 0.623 0.599 0.587 0.569 0.557 0.550 0.538 0.536 0.535 0.529
6(2)b CO 12 F 0.622 0.620 0.618 0.594 0.581 0.560 0.544 0.540 0.529 0.523 0.525 0.522
6(2)c CO 19 A 0.617 0.618 0.612 0.592 0.578 0.552 0.530 0.526 0.529 0.532 0.546 0.545
7a 1601-1 A 0.565 0.567 0.563 0.552 0.553 0.550 0.549 0.548 0.543 0.540 0.542 0.545
7b 1601-4 A 0.587 0.583 0.585 0.572 0.567 0.560 0.559 0.558 0.555 0.553 0.556 0.557
7c 1601-4 C 0.600 0.598 0.600 0.587 0.580 0.572 0.569 0.568 0.564 0.561 0.564 0.566
8a 1600-4 A 0.587 0.577 0.582 0.553 0.549 0.543 0.540 0.538 0.533 0.530 0.529 0.527
8b 1601-4 B 0.594 0.594 0.594 0.581 0.574 0.565 0.562 0.563 0.561 0.560 0.562 0.563
8c 1601-4 E 0.606 0.607 0.609 0.596 0.592 0.582 0.576 0.576 0.572 0.571 0.572 0.573
9a CO 05 B 0.634 0.628 0.630 0.616 0.614 0.607 0.597 0.584 0.560 0.541 0.530 0.517
9b CO 15 A 0.641 0.635 0.634 0.624 0.618 0.598 0.569 0.548 0.534 0.528 0.532 0.534
9c CO 18 G 0.634 0.632 0.626 0.609 0.599 0.575 0.543 0.518 0.503 0.501 0.511 0.513
9(2)a CO 05 H 0.637 0.630 0.628 0.614 0.608 0.598 0.582 0.562 0.537 0.517 0.507 0.497
9(2)b CO 07 G 0.631 0.630 0.628 0.621 0.617 0.613 0.612 0.611 0.603 0.595 0.592 0.576
9(2)c CO 33 F 0.615 0.619 0.610 0.601 0.598 0.592 0.587 0.580 0.564 0.548 0.540 0.531
10a CO 05 F 0.637 0.633 0.633 0.614 0.607 0.588 0.566 0.550 0.531 0.518 0.514 0.504
10b CO 13 G 0.634 0.630 0.631 0.621 0.617 0.604 0.581 0.561 0.547 0.540 0.544 0.549
10c CO 14 F 0.637 0.635 0.633 0.620 0.614 0.595 0.568 0.550 0.538 0.534 0.539 0.544
10(2)a CO 07 D 0.634 0.632 0.631 0.623 0.621 0.610 0.588 0.565 0.525 0.507 0.508 0.511
10(2)b CO 11 A 0.626 0.623 0.619 0.609 0.606 0.596 0.572 0.555 0.533 0.518 0.520 0.511
10(2)c CO 17 F 0.621 0.617 0.608 0.595 0.588 0.573 0.549 0.538 0.538 0.543 0.551 0.552
11a 1600-3 B 0.605 0.604 0.606 0.597 0.597 0.589 0.579 0.575 0.569 0.568 0.569 0.565
11b 1601-2 D 0.587 0.586 0.584 0.576 0.574 0.566 0.562 0.561 0.557 0.556 0.559 0.559
11c 1600-1 D 0.575 0.578 0.574 0.569 0.568 0.563 0.561 0.557 0.549 0.541 0.544 0.542
12a 1600-2 C 0.601 0.594 0.594 0.591 0.591 0.586 0.586 0.580 0.575 0.572 0.572 0.565
12b 1600-3 D 0.621 0.615 0.615 0.609 0.607 0.602 0.597 0.589 0.582 0.577 0.579 0.575
12c 1601-3 C 0.601 0.604 0.602 0.594 0.590 0.584 0.581 0.577 0.573 0.568 0.571 0.571
13a CO 11 H 0.631 0.624 0.623 0.609 0.604 0.590 0.573 0.562 0.545 0.536 0.532 0.525
13b CO 17 A 0.620 0.613 0.613 0.597 0.595 0.589 0.588 0.589 0.586 0.586 0.589 0.588
13c CO 17 C 0.623 0.613 0.607 0.591 0.588 0.579 0.574 0.570 0.562 0.555 0.553 0.548
13(2)a CO 07 H 0.632 0.625 0.628 0.616 0.616 0.612 0.611 0.613 0.612 0.611 0.612 0.609
13(2)b CO 11 F 0.634 0.624 0.621 0.610 0.604 0.592 0.579 0.566 0.550 0.539 0.533 0.526
13(2)c CO 33 E 0.614 0.617 0.611 0.600 0.597 0.590 0.584 0.576 0.561 0.548 0.541 0.531
14a CO 05 E 0.637 0.624 0.628 0.613 0.611 0.606 0.600 0.593 0.578 0.568 0.556 0.523
14b CO 17 G 0.627 0.614 0.613 0.600 0.598 0.593 0.593 0.594 0.593 0.591 0.594 0.580
14c CO 18 E 0.634 0.628 0.617 0.604 0.599 0.591 0.583 0.572 0.556 0.540 0.531 0.508
14(2)a CO 13 B 0.621 0.617 0.616 0.607 0.604 0.599 0.596 0.593 0.577 0.540 0.543 0.545
14(2)b CO 17 B 0.627 0.612 0.608 0.596 0.593 0.587 0.584 0.582 0.573 0.540 0.552 0.566
14(2)c CO 30 D 0.621 0.610 0.604 0.591 0.585 0.571 0.558 0.547 0.533 0.532 0.542 0.528
15a 1600-1 C 0.587 0.581 0.607 0.573 0.573 0.570 0.568 0.568 0.564 0.562 0.563 0.559
15b 1600-2 B 0.602 0.597 0.614 0.593 0.593 0.590 0.589 0.589 0.584 0.581 0.585 0.581
15c 1601-2 F 0.580 0.581 0.603 0.575 0.572 0.566 0.563 0.560 0.554 0.548 0.549 0.548
16a 1600-1 A 0.589 0.582 0.580 0.575 0.574 0.572 0.572 0.573 0.568 0.558 0.554 0.543
16b 1601-2 C 0.588 0.587 0.585 0.580 0.578 0.573 0.571 0.569 0.562 0.559 0.560 0.555
16c 1601-3 E 0.602 0.602 0.600 0.594 0.593 0.589 0.588 0.588 0.583 0.581 0.577 0.569
17a CO 16 B 0.624 0.623 0.620 0.598 0.587 0.571 0.559 0.551 0.540 0.538 0.561 0.536
17b CO 16 E 0.615 0.620 0.617 0.605 0.598 0.581 0.569 0.558 0.599 NaN NaN NaN
17c CO 12 A 0.615 0.612 0.607 0.585 0.572 0.555 0.550 0.547 0.536 0.535 NaN NaN
17(2)a CO 12 D 0.619 0.611 0.612 0.588 0.577 0.557 0.542 0.534 0.000 0.000 NaN 0
17(2)b CO 16 D 0.620 0.623 0.622 0.601 0.589 0.571 0.560 0.551 NaN NaN 0 0
17(2)c CO 16 F 0.614 0.617 0.619 0.603 0.597 0.581 0.566 0.558 NaN NaN NaN NaN
18a 1600-4 E 0.540 0.536 0.539 0.513 0.513 0.505 0.505 0.505 0.531 0.000 0 0
18b 1601-4 D 0.604 0.603 0.607 0.592 0.588 0.580 0.577 0.576 0.571 0.569 0.569 0
18c 1601-4 F 0.603 0.599 0.603 0.597 0.597 0.590 0.587 0.584 0.629 0.000 0 0
Voc (V)

45

46

47
Module position Sample name -10 hours 0 hours 5 hours 20 hours 36 hours 74 hours 140 hours 230 hours 480 hours 641 hours 800 hours 1032 hours
1a CO 11 B 31.266 31.690 31.516 28.852 28.721 28.532 28.098 25.615 26.740 22.070 0.062 #VALUE!
1b CO 14 E 33.822 33.355 33.334 31.300 31.259 31.190 31.109 30.975 29.953 27.377 1.940 #VALUE!
1c CO 18 A 32.988 33.284 32.996 30.689 30.437 30.327 29.950 29.685 27.733 17.486 0.066 #VALUE!
1(2)a CO 05 C 34.672 33.234 33.932 30.635 30.448 30.055 29.838 29.663 28.358 0.056 0.064 #VALUE!
1(2)b CO 07 F 35.126 33.954 35.005 31.296 31.106 30.668 30.349 30.258 30.216 30.392 0.055 #VALUE!
1(2)c CO 30 G 33.495 32.330 33.209 30.678 30.631 30.452 30.448 30.363 29.998 29.501 13.461 #VALUE!
2a CO 05 A 33.180 33.190 33.647 30.038 29.783 29.704 29.815 29.875 30.045 29.478 23.983 13.989
2b CO 13 C 34.393 32.566 32.713 30.686 30.635 30.477 30.397 30.513 30.326 #VALUE! #VALUE! #VALUE!
2c CO 30 C 33.133 32.089 31.956 30.019 29.880 29.957 29.971 30.106 30.088 30.197 30.360 29.614
2(2)a CO 07 E 34.383 33.795 33.952 30.951 30.763 30.332 30.005 29.913 29.649 29.546 29.774 29.469
2(2)b CO 13 D 33.705 33.230 33.149 31.227 31.154 30.927 30.801 31.072 30.922 29.857 26.847 #VALUE!
2(2)c CO 18 H 33.290 32.979 33.458 30.232 29.955 29.640 29.153 28.958 28.255 27.952 26.907 12.203
3a 1600-2 D 37.781 36.331 36.505 34.173 34.376 33.649 33.438 33.451 33.410 33.485 #VALUE! #VALUE!
3b 1600-3 C 37.586 36.483 36.655 34.335 34.255 33.827 33.671 33.846 33.553 0.125 #VALUE! #VALUE!
3c 1601-2 B 36.530 35.809 35.558 33.436 33.597 33.457 33.209 33.142 32.787 32.528 0.068 0.062
4a 1600-2 A 37.423 35.806 34.983 30.945 31.448 32.504 32.541 32.685 32.697 26.438 #VALUE! #VALUE!
4b 1600-1 B 37.234 35.729 35.555 33.593 33.370 33.199 32.901 32.992 32.834 33.043 33.221 33.424
4c 1601-3 D 37.184 37.492 36.697 34.211 34.078 33.957 33.739 32.901 24.106 #VALUE! #VALUE! #VALUE!
5a CO 19 C 32.930 33.016 32.923 30.822 30.461 29.450 28.259 27.977 28.133 26.953 25.296 25.191
5b CO 12 H 34.718 33.629 33.589 31.358 31.344 31.066 31.005 31.253 30.651 30.544 30.623 28.081
5c CO 16 G 33.595 33.196 33.149 30.928 30.714 30.818 30.535 30.703 30.157 30.394 30.422 0.069
5(2)a CO 12 G 33.651 28.819 29.367 26.477 26.428 26.077 25.923 25.903 25.666 5.039 4.278 1.192
5(2)b CO 16 A 33.499 28.788 29.298 26.880 26.919 26.710 26.049 25.612 24.712 24.589 24.751 22.430
5(2)c CO 19 D 33.459 28.796 28.875 26.628 26.398 25.764 25.198 24.758 24.520 24.890 24.787 24.922
6a CO 12 E 33.868 33.186 33.187 30.664 30.734 30.548 30.471 30.429 30.022 30.005 29.904 29.450
6b CO 16 H 33.132 32.679 33.103 30.467 30.450 30.058 29.722 29.842 29.462 29.377 29.535 29.409
6c CO 19 H 33.765 32.763 32.652 30.509 30.422 29.890 28.625 28.101 27.702 27.840 27.776 27.731
6(2)a CO 08 C 33.398 32.464 33.147 30.699 30.646 30.255 30.205 30.246 29.836 29.726 29.607 29.565
6(2)b CO 12 F 33.620 32.797 32.976 30.594 30.471 30.030 29.605 29.642 28.987 28.883 28.811 28.371
6(2)c CO 19 A 32.704 32.639 33.000 30.564 30.464 30.343 29.221 27.764 26.903 25.547 12.706 5.619
7a 1601-1 A 37.822 36.983 36.884 34.770 34.758 34.663 34.466 34.330 33.852 33.829 33.810 33.375
7b 1601-4 A 35.059 34.512 34.812 32.349 32.405 31.813 31.458 31.438 31.008 31.125 31.065 30.809
7c 1601-4 C 35.885 35.620 35.146 32.890 32.849 32.684 32.459 32.439 31.739 31.821 31.658 31.350
8a 1600-4 A 38.028 36.093 36.403 33.864 33.926 33.525 33.336 33.270 32.762 32.376 32.205 31.284
8b 1601-4 B 34.657 34.137 34.384 32.312 32.138 31.516 31.198 31.178 30.902 31.058 31.104 31.071
8c 1601-4 E 35.895 34.852 35.436 33.179 32.845 32.750 32.412 32.387 31.622 31.829 31.207 30.787
9a CO 05 B 32.873 31.892 32.838 30.330 30.368 29.852 29.673 29.658 29.309 29.180 28.838 28.082
9b CO 15 A 33.506 32.312 33.305 31.279 31.233 30.291 30.125 30.355 29.737 29.514 29.850 29.303
9c CO 18 G 32.479 31.756 32.036 29.953 29.996 30.239 29.748 29.817 27.069 25.470 24.644 24.634
9(2)a CO 05 H 33.945 33.040 32.868 30.835 30.724 30.405 30.188 30.272 29.864 29.425 29.033 26.168
9(2)b CO 07 G 34.070 33.626 33.034 31.602 31.444 30.913 30.677 31.217 30.603 30.761 31.354 31.556
9(2)c CO 33 F 34.091 32.106 31.870 30.279 30.646 30.470 30.089 30.421 29.481 29.496 29.429 29.289
10a CO 05 F 33.482 33.199 32.847 30.738 30.656 30.136 29.939 29.910 29.535 29.168 28.877 28.077
10b CO 13 G 33.803 33.633 33.512 31.420 31.520 30.776 30.567 30.845 30.161 29.994 29.826 29.946
10c CO 14 F 34.504 33.540 33.465 31.476 31.135 31.235 31.024 31.193 30.282 29.918 30.225 29.455
10(2)a CO 07 D 34.360 32.399 32.652 30.502 30.650 30.387 30.281 30.206 29.451 27.754 26.581 26.154
10(2)b CO 11 A 35.673 33.566 34.092 31.936 32.091 31.118 30.769 31.049 30.455 30.443 31.124 30.971
10(2)c CO 17 F 33.281 31.497 31.531 29.882 29.649 29.432 29.010 29.046 26.909 27.757 27.330 27.890
11a 1600-3 B 38.307 36.700 35.726 33.786 33.976 33.059 32.823 32.826 32.441 32.550 32.661 32.986
11b 1601-2 D 36.198 35.649 34.791 33.377 33.525 32.253 32.231 32.557 31.979 32.136 32.903 33.239
11c 1600-1 D 38.623 36.398 36.354 34.604 34.434 34.062 34.055 34.365 33.213 33.165 33.904 33.698
12a 1600-2 C 36.884 35.268 35.034 32.893 32.785 32.486 32.312 32.226 32.032 32.024 32.555 32.173
12b 1600-3 D 38.197 36.559 35.925 34.139 33.772 33.224 32.955 32.994 32.548 32.567 32.349 33.028
12c 1601-3 C 37.924 37.783 36.617 34.842 34.475 34.603 34.545 34.379 33.853 33.902 33.663 34.390
13a CO 11 H 34.461 33.443 34.345 31.282 31.438 30.671 30.449 30.438 30.085 30.024 30.284 29.541
13b CO 17 A 32.804 31.503 32.415 29.971 30.176 29.823 29.585 29.850 29.568 30.086 30.443 30.487
13c CO 17 C 33.095 32.095 31.887 29.842 29.910 30.218 30.063 30.291 29.654 29.965 29.974 30.079
13(2)a CO 07 H 34.547 33.121 34.085 31.692 31.752 31.299 31.224 31.421 31.352 31.502 31.329 32.013
13(2)b CO 11 F 34.267 32.546 33.250 31.258 31.016 30.483 30.243 30.446 29.852 30.113 29.470 29.930
13(2)c CO 33 E 33.758 33.214 34.400 31.630 31.603 31.797 31.521 31.813 30.911 30.759 30.300 30.433
14a CO 05 E 34.437 33.828 34.929 32.221 32.304 31.777 31.668 31.823 31.620 31.671 31.580 30.703
14b CO 17 G 33.088 33.164 33.444 31.754 31.834 31.350 31.056 31.268 31.021 31.196 31.464 31.927
14c CO 18 E 34.168 33.496 33.235 31.790 31.464 31.844 31.793 31.963 31.279 31.285 31.795 29.547
14(2)a CO 13 B 34.588 33.795 34.119 31.785 31.924 31.397 31.299 31.465 31.042 30.275 29.607 30.952
14(2)b CO 17 B 33.098 32.787 32.989 30.534 30.506 30.130 29.969 30.219 29.860 28.760 27.884 29.411
14(2)c CO 30 D 33.320 33.312 33.287 31.057 31.098 30.913 30.583 30.595 30.064 30.260 30.029 31.197
15a 1600-1 C 38.000 37.112 34.186 34.932 34.834 34.481 34.311 34.343 34.216 34.305 34.456 34.408
15b 1600-2 B 36.980 36.260 36.268 34.320 34.195 33.634 33.427 33.536 33.186 33.253 33.732 34.023
15c 1601-2 F 36.553 36.719 33.880 34.428 34.486 34.422 34.131 34.322 33.703 33.651 34.397 34.307
16a 1600-1 A 37.886 36.908 37.053 34.248 34.300 34.062 33.922 34.001 33.648 33.448 33.855 34.038
16b 1601-2 C 37.031 37.405 37.266 34.728 34.671 34.342 34.065 34.352 34.048 34.366 33.951 34.488
16c 1601-3 E 37.095 37.283 37.444 34.363 34.321 34.453 34.400 34.775 34.188 34.771 34.047 34.373
17a CO 16 B 34.185 33.289 33.295 31.079 31.248 30.855 30.767 30.684 30.276 30.067 1.205 4.049
17b CO 16 E 34.081 33.045 32.974 31.076 31.240 30.779 30.419 30.416 0.523 0.107 0.080 0.070
17c CO 12 A 33.252 32.476 32.149 30.534 30.766 30.753 30.698 30.534 24.662 4.089 0.093 0.060
17(2)a CO 12 D 33.120 32.545 33.085 30.476 30.629 30.017 30.117 29.925 #VALUE! #VALUE! 0.056 #VALUE!
17(2)b CO 16 D 34.116 32.950 33.092 30.833 31.053 30.494 30.207 30.145 0.049 0.048 #VALUE! #VALUE!
17(2)c CO 16 F 33.651 32.711 32.893 30.527 30.669 30.392 30.047 29.461 0.095 0.062 0.079 0.069
18a 1600-4 E 33.301 33.308 33.255 30.726 30.874 30.587 30.732 30.804 1.200 #VALUE! #VALUE! #VALUE!
18b 1601-4 D 35.699 35.538 35.211 32.975 32.930 32.312 32.091 32.169 31.829 31.703 31.809 #VALUE!
18c 1601-4 F 36.929 35.956 35.186 33.234 33.247 32.718 32.750 32.657 1.014 #VALUE! #VALUE! #VALUE!
Jsc (mA/cm²)

48

49

50
Module position Sample name -10 hours 0 hours 5 hours 20 hours 36 hours 74 hours 140 hours 230 hours 480 hours 641 hours 800 hours 1032 hours
1a CO 11 B 65.84 65.56 63.76 61.06 58.42 58.54 48.39 30.62 32.08 27.83 0 0
1b CO 14 E 63.86 64.62 64.38 63.61 63.48 63.06 62.59 59.07 40.95 28.95 24.92 0
1c CO 18 A 61.21 61.23 60.85 54.26 52.69 51.80 51.11 50.40 32.58 25.71 0 0
1(2)a CO 05 C 61.40 60.68 62.33 57.90 57.23 55.96 54.81 52.45 40.50 0 0 0
1(2)b CO 07 F 61.02 61.60 64.54 59.09 57.79 56.30 55.42 54.35 52.99 50.75 NaN 0
1(2)c CO 30 G 62.37 62.93 61.79 61.49 61.34 61.00 60.75 59.17 52.91 44.76 25.57 0
2a CO 05 A 60.72 61.13 62.63 56.04 54.65 54.94 54.43 53.20 50.91 42.49 27.55 25.29
2b CO 13 C 64.92 66.11 65.26 63.84 63.32 62.35 61.36 59.96 56.90 0.00 0 0
2c CO 30 C 62.65 62.46 62.57 61.90 62.27 62.02 61.11 59.32 53.73 48.09 43.30 35.51
2(2)a CO 07 E 61.64 62.31 64.96 59.84 58.26 56.57 54.63 52.75 49.78 45.69 42.83 36.82
2(2)b CO 13 D 66.26 66.81 66.16 64.87 64.67 63.62 62.83 61.90 60.36 34.67 28.07 0
2(2)c CO 18 H 59.14 59.67 59.42 51.17 49.66 49.80 47.98 44.72 39.93 36.00 33.95 25.19
3a 1600-2 D 67.03 66.12 67.25 66.68 66.56 66.37 66.00 65.24 63.38 56.15 0 0
3b 1600-3 C 64.48 64.07 63.42 62.16 62.06 61.93 60.90 59.94 58.70 21.12 0 0
3c 1601-2 B 66.02 67.17 57.21 60.94 62.54 63.05 62.36 60.21 59.09 52.35 0 0
4a 1600-2 A 68.15 68.17 60.64 31.56 35.12 58.46 59.38 59.97 61.72 25.94 0 0
4b 1600-1 B 67.28 66.96 66.87 66.12 66.07 65.34 64.25 63.19 60.07 57.94 55.36 50.66
4c 1601-3 D 68.22 69.61 61.96 59.48 55.61 54.44 43.55 32.81 26.21 0 0 0
5a CO 19 C 59.12 60.28 57.93 55.99 53.80 45.51 41.47 40.96 41.13 33.06 30.04 30.51
5b CO 12 H 61.43 63.26 62.38 61.99 60.38 57.94 56.71 55.24 53.79 50.94 47.42 30.75
5c CO 16 G 62.08 63.60 63.45 62.53 62.07 58.97 55.89 54.23 51.45 50.29 47.78 19.80
5(2)a CO 12 G 59.96 62.15 61.24 60.11 56.67 54.45 54.58 52.88 50.00 18.23 19.83 22.00
5(2)b CO 16 A 56.87 59.99 58.77 57.24 54.37 53.01 52.01 51.13 50.20 45.01 40.33 28.85
5(2)c CO 19 D 59.07 61.24 59.36 58.02 55.00 46.86 42.40 41.91 42.32 43.17 42.98 42.88
6a CO 12 E 60.84 62.49 61.19 60.52 57.99 55.31 54.90 53.21 49.88 47.64 42.73 37.49
6b CO 16 H 62.33 63.53 62.95 62.23 61.62 59.34 55.76 53.86 51.77 48.82 45.92 41.14
6c CO 19 H 59.19 60.55 58.55 58.05 56.22 50.66 43.51 40.17 38.79 38.42 36.89 35.57
6(2)a CO 08 C 59.44 61.44 60.49 60.24 57.31 53.60 53.25 52.25 48.90 46.43 44.03 40.73
6(2)b CO 12 F 60.99 62.39 61.62 61.20 58.62 54.93 54.85 53.00 49.46 45.86 41.44 35.55
6(2)c CO 19 A 57.05 57.93 56.47 55.67 54.42 51.64 46.54 39.70 36.85 33.95 25.55 24.69
7a 1601-1 A 58.85 60.03 55.30 52.43 53.80 56.02 56.71 56.45 54.98 53.60 51.98 50.68
7b 1601-4 A 64.38 64.80 63.06 60.05 57.69 59.65 60.40 60.41 59.71 58.79 57.89 55.92
7c 1601-4 C 65.06 64.93 63.33 62.75 61.03 62.10 62.19 61.88 61.13 60.04 58.71 57.53
8a 1600-4 A 47.24 48.74 46.05 44.20 44.75 46.05 46.20 44.87 41.92 37.88 34.87 31.20
8b 1601-4 B 65.80 66.13 64.10 62.23 58.73 61.33 62.30 62.56 61.85 60.86 59.04 56.42
8c 1601-4 E 63.56 64.47 61.74 61.75 61.12 61.37 62.13 61.81 60.87 59.46 56.11 52.59
9a CO 05 B 61.22 61.65 61.55 60.20 60.19 60.63 60.90 59.52 57.75 56.11 55.41 54.36
9b CO 15 A 65.18 65.73 65.56 64.86 64.31 63.22 61.46 60.13 58.42 56.66 54.55 51.15
9c CO 18 G 59.46 60.28 59.56 58.84 58.83 57.82 54.91 53.22 50.88 48.50 48.69 48.59
9(2)a CO 05 H 60.73 61.34 61.80 60.32 59.91 59.71 59.56 58.51 56.92 55.48 53.84 52.07
9(2)b CO 07 G 61.43 61.28 62.06 60.75 60.08 60.18 60.25 60.92 62.00 62.28 61.96 60.72
9(2)c CO 33 F 60.90 62.37 61.56 60.53 60.10 59.18 58.98 58.40 58.61 57.83 56.74 56.14
10a CO 05 F 60.20 60.77 60.32 59.63 59.26 59.11 58.20 57.08 56.05 55.53 54.57 53.88
10b CO 13 G 66.90 67.43 67.49 67.16 66.84 66.38 65.15 63.05 60.62 57.55 54.60 52.05
10c CO 14 F 61.66 64.00 63.74 63.60 63.29 62.48 60.45 58.79 56.74 54.08 51.48 49.02
10(2)a CO 07 D 63.15 62.41 62.53 61.40 61.65 61.86 61.64 60.18 57.78 53.43 50.27 49.38
10(2)b CO 11 A 62.61 63.64 63.59 62.25 61.75 61.63 58.85 55.24 48.90 43.96 39.80 38.03
10(2)c CO 17 F 60.13 59.70 59.17 57.83 56.36 55.18 53.71 50.13 44.41 43.63 41.84 42.01
11a 1600-3 B 62.25 62.75 59.49 62.08 61.66 60.62 59.26 58.48 57.88 57.62 57.31 57.37
11b 1601-2 D 68.55 68.68 68.83 67.84 66.92 64.80 61.21 57.35 53.93 53.42 52.21 52.30
11c 1600-1 D 65.69 64.80 65.09 64.19 63.77 63.21 62.14 61.54 60.53 59.49 58.85 58.51
12a 1600-2 C 68.85 69.18 68.88 68.62 68.52 67.75 66.31 64.88 63.45 63.29 63.25 64.22
12b 1600-3 D 65.30 65.75 65.81 65.41 65.24 64.76 63.72 62.66 61.82 61.64 61.57 61.48
12c 1601-3 C 67.45 68.44 68.18 67.48 66.31 64.01 60.78 58.51 56.32 56.64 54.98 54.76
13a CO 11 H 66.19 66.24 65.45 64.76 64.07 63.39 62.11 61.41 60.30 59.50 58.63 57.86
13b CO 17 A 59.18 58.30 57.57 57.19 56.31 56.25 55.66 55.24 54.93 54.81 54.70 56.01
13c CO 17 C 58.20 58.11 57.93 56.68 56.07 55.35 54.84 54.58 54.25 53.68 53.28 52.96
13(2)a CO 07 H 61.02 61.47 61.58 60.30 60.29 59.89 59.44 59.25 58.80 59.43 59.83 60.78
13(2)b CO 11 F 63.97 64.39 63.82 62.47 62.13 61.40 60.51 59.82 58.81 58.18 57.44 56.75
13(2)c CO 33 E 62.60 62.84 62.69 61.50 61.39 60.42 59.96 59.59 59.16 58.52 57.87 56.88
14a CO 05 E 60.04 60.66 60.22 59.00 58.60 58.19 58.30 58.39 58.21 58.19 57.92 55.64
14b CO 17 G 58.44 59.00 58.77 57.13 56.73 56.12 55.36 54.77 54.51 54.55 55.72 55.82
14c CO 18 E 60.30 60.88 60.32 58.63 58.29 57.53 57.31 57.05 56.61 56.17 54.95 53.45
14(2)a CO 13 B 63.22 63.48 63.57 62.22 61.78 61.47 61.01 60.67 59.98 44.94 38.71 41.62
14(2)b CO 17 B 58.52 58.95 59.55 57.65 57.40 56.54 56.03 56.17 55.86 47.48 43.78 42.40
14(2)c CO 30 D 62.95 62.52 62.83 61.31 60.52 59.53 58.62 58.26 56.72 53.06 49.66 48.66
15a 1600-1 C 65.34 65.15 61.49 64.42 64.03 63.83 63.39 63.51 63.10 63.03 62.61 62.24
15b 1600-2 B 69.76 70.02 64.41 69.56 69.61 69.51 69.33 69.00 68.58 68.21 67.82 67.11
15c 1601-2 F 67.63 67.91 61.95 67.60 67.06 65.78 64.23 62.71 61.38 60.25 55.42 48.03
16a 1600-1 A 66.77 66.32 65.60 65.78 65.64 65.59 65.04 64.74 64.79 62.02 62.87 61.69
16b 1601-2 C 67.62 67.96 66.97 66.87 66.26 65.80 65.40 64.76 60.64 53.73 56.34 58.92
16c 1601-3 E 66.80 67.52 66.32 65.78 65.26 64.46 64.57 64.60 63.50 59.45 61.39 60.35
17a CO 16 B 60.47 61.39 60.95 56.71 53.20 51.94 50.74 48.91 46.25 43.04 21.44 18.64
17b CO 16 E 59.11 61.19 62.15 61.10 59.82 56.65 52.64 50.21 18.33 NaN 0 0
17c CO 12 A 59.98 60.90 60.92 59.40 56.81 55.54 54.66 51.85 24.20 21.21 0 0
17(2)a CO 12 D 62.26 62.32 61.41 60.77 58.71 54.93 53.61 49.85 0 0 0 0
17(2)b CO 16 D 57.32 59.36 58.71 58.09 55.62 52.21 49.30 45.20 0 0 0 0
17(2)c CO 16 F 61.67 63.14 61.12 60.05 58.51 55.66 51.94 40.75 0 0 0 0
18a 1600-4 E 53.11 53.21 51.97 49.96 49.83 49.84 48.13 46.46 23.27 0 0 0
18b 1601-4 D 65.59 65.92 63.23 60.19 58.71 59.80 61.07 60.91 58.32 55.00 50.76 0
18c 1601-4 F 58.82 59.27 56.99 58.65 59.82 60.43 59.74 56.70 16.78 0 0 0
FF (%)

51

52
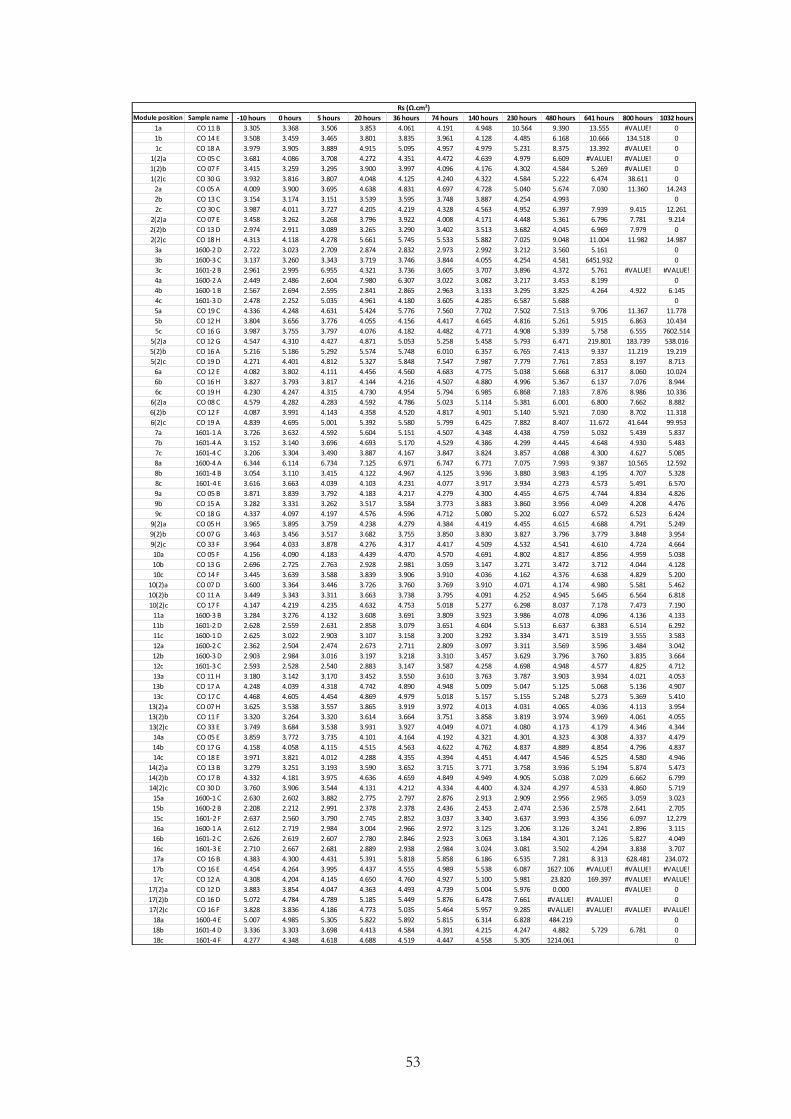
53
Module position Sample name -10 hours 0 hours 5 hours 20 hours 36 hours 74 hours 140 hours 230 hours 480 hours 641 hours 800 hours 1032 hours
1a CO 11 B 3.305 3.368 3.506 3.853 4.061 4.191 4.948 10.564 9.390 13.555 #VALUE! 0
1b CO 14 E 3.508 3.459 3.465 3.801 3.835 3.961 4.128 4.485 6.168 10.666 134.518 0
1c CO 18 A 3.979 3.905 3.889 4.915 5.095 4.957 4.979 5.231 8.375 13.392 #VALUE! 0
1(2)a CO 05 C 3.681 4.086 3.708 4.272 4.351 4.472 4.639 4.979 6.609 #VALUE! #VALUE! 0
1(2)b CO 07 F 3.415 3.259 3.295 3.900 3.997 4.096 4.176 4.302 4.584 5.269 #VALUE! 0
1(2)c CO 30 G 3.932 3.816 3.807 4.048 4.125 4.240 4.322 4.584 5.222 6.474 38.611 0
2a CO 05 A 4.009 3.900 3.695 4.638 4.831 4.697 4.728 5.040 5.674 7.030 11.360 14.243
2b CO 13 C 3.154 3.174 3.151 3.539 3.595 3.748 3.887 4.254 4.993 0.000 0.000 0
2c CO 30 C 3.987 4.011 3.727 4.205 4.219 4.328 4.563 4.952 6.397 7.939 9.415 12.261
2(2)a CO 07 E 3.458 3.262 3.268 3.796 3.922 4.008 4.171 4.448 5.361 6.796 7.781 9.214
2(2)b CO 13 D 2.974 2.911 3.089 3.265 3.290 3.402 3.513 3.682 4.045 6.969 7.979 0
2(2)c CO 18 H 4.313 4.118 4.278 5.661 5.745 5.533 5.882 7.025 9.048 11.004 11.982 14.987
3a 1600-2 D 2.722 3.023 2.709 2.874 2.832 2.973 2.992 3.212 3.560 5.161 0.000 0
3b 1600-3 C 3.137 3.260 3.343 3.719 3.746 3.844 4.055 4.254 4.581 6451.932 0.000 0
3c 1601-2 B 2.961 2.995 6.955 4.321 3.736 3.605 3.707 3.896 4.372 5.761 #VALUE! #VALUE!
4a 1600-2 A 2.449 2.486 2.604 7.980 6.307 3.022 3.082 3.217 3.453 8.199 0.000 0
4b 1600-1 B 2.567 2.694 2.595 2.841 2.865 2.963 3.133 3.295 3.825 4.264 4.922 6.145
4c 1601-3 D 2.478 2.252 5.035 4.961 4.180 3.605 4.285 6.587 5.688 0.000 0.000 0
5a CO 19 C 4.336 4.248 4.631 5.424 5.776 7.560 7.702 7.502 7.513 9.706 11.367 11.778
5b CO 12 H 3.804 3.656 3.776 4.055 4.156 4.417 4.645 4.816 5.261 5.915 6.863 10.434
5c CO 16 G 3.987 3.755 3.797 4.076 4.182 4.482 4.771 4.908 5.339 5.758 6.555 7602.514
5(2)a CO 12 G 4.547 4.310 4.427 4.871 5.053 5.258 5.458 5.793 6.471 219.801 183.739 538.016
5(2)b CO 16 A 5.216 5.186 5.292 5.574 5.748 6.010 6.357 6.765 7.413 9.337 11.219 19.219
5(2)c CO 19 D 4.271 4.401 4.812 5.327 5.848 7.547 7.987 7.779 7.761 7.853 8.197 8.713
6a CO 12 E 4.082 3.802 4.111 4.456 4.560 4.683 4.775 5.038 5.668 6.317 8.060 10.024
6b CO 16 H 3.827 3.793 3.817 4.144 4.216 4.507 4.880 4.996 5.367 6.137 7.076 8.944
6c CO 19 H 4.230 4.247 4.315 4.730 4.954 5.794 6.985 6.868 7.183 7.876 8.986 10.336
6(2)a CO 08 C 4.579 4.282 4.283 4.592 4.786 5.023 5.114 5.381 6.001 6.800 7.662 8.882
6(2)b CO 12 F 4.087 3.991 4.143 4.358 4.520 4.817 4.901 5.140 5.921 7.030 8.702 11.318
6(2)c CO 19 A 4.839 4.695 5.001 5.392 5.580 5.799 6.425 7.882 8.407 11.672 41.644 99.953
7a 1601-1 A 3.726 3.632 4.592 5.604 5.151 4.507 4.348 4.438 4.759 5.032 5.439 5.837
7b 1601-4 A 3.152 3.140 3.696 4.693 5.170 4.529 4.386 4.299 4.445 4.648 4.930 5.483
7c 1601-4 C 3.206 3.304 3.490 3.887 4.167 3.847 3.824 3.857 4.088 4.300 4.627 5.085
8a 1600-4 A 6.344 6.114 6.734 7.125 6.971 6.747 6.771 7.075 7.993 9.387 10.565 12.592
8b 1601-4 B 3.054 3.110 3.415 4.122 4.967 4.125 3.936 3.880 3.983 4.195 4.707 5.328
8c 1601-4 E 3.616 3.663 4.039 4.103 4.231 4.077 3.917 3.934 4.273 4.573 5.491 6.570
9a CO 05 B 3.871 3.839 3.792 4.183 4.217 4.279 4.300 4.455 4.675 4.744 4.834 4.826
9b CO 15 A 3.282 3.331 3.262 3.517 3.584 3.773 3.883 3.860 3.956 4.049 4.208 4.476
9c CO 18 G 4.337 4.097 4.197 4.576 4.596 4.712 5.080 5.202 6.027 6.572 6.523 6.424
9(2)a CO 05 H 3.965 3.895 3.759 4.238 4.279 4.384 4.419 4.455 4.615 4.688 4.791 5.249
9(2)b CO 07 G 3.463 3.456 3.517 3.682 3.755 3.850 3.830 3.827 3.796 3.779 3.848 3.954
9(2)c CO 33 F 3.964 4.033 3.878 4.276 4.317 4.417 4.509 4.532 4.541 4.610 4.724 4.664
10a CO 05 F 4.156 4.090 4.183 4.439 4.470 4.570 4.691 4.802 4.817 4.856 4.959 5.038
10b CO 13 G 2.696 2.725 2.763 2.928 2.981 3.059 3.147 3.271 3.472 3.712 4.044 4.128
10c CO 14 F 3.445 3.639 3.588 3.839 3.906 3.910 4.036 4.162 4.376 4.638 4.829 5.200
10(2)a CO 07 D 3.600 3.364 3.446 3.726 3.760 3.769 3.910 4.071 4.174 4.980 5.581 5.462
10(2)b CO 11 A 3.449 3.343 3.311 3.663 3.738 3.795 4.091 4.252 4.945 5.645 6.564 6.818
10(2)c CO 17 F 4.147 4.219 4.235 4.632 4.753 5.018 5.277 6.298 8.037 7.178 7.473 7.190
11a 1600-3 B 3.284 3.276 4.132 3.608 3.691 3.809 3.923 3.986 4.078 4.096 4.136 4.133
11b 1601-2 D 2.628 2.559 2.631 2.858 3.079 3.651 4.604 5.513 6.637 6.383 6.514 6.292
11c 1600-1 D 2.625 3.022 2.903 3.107 3.158 3.200 3.292 3.334 3.471 3.519 3.555 3.583
12a 1600-2 C 2.362 2.504 2.474 2.673 2.711 2.809 3.097 3.311 3.569 3.596 3.484 3.042
12b 1600-3 D 2.903 2.984 3.016 3.197 3.218 3.310 3.457 3.629 3.796 3.760 3.835 3.664
12c 1601-3 C 2.593 2.528 2.540 2.883 3.147 3.587 4.258 4.698 4.948 4.577 4.825 4.712
13a CO 11 H 3.180 3.142 3.170 3.452 3.550 3.610 3.763 3.787 3.903 3.934 4.021 4.053
13b CO 17 A 4.248 4.039 4.318 4.742 4.890 4.948 5.009 5.047 5.125 5.068 5.136 4.907
13c CO 17 C 4.468 4.605 4.454 4.869 4.979 5.018 5.157 5.155 5.248 5.273 5.369 5.410
13(2)a CO 07 H 3.625 3.538 3.557 3.865 3.919 3.972 4.013 4.031 4.065 4.036 4.113 3.954
13(2)b CO 11 F 3.320 3.264 3.320 3.614 3.664 3.751 3.858 3.819 3.974 3.969 4.061 4.055
13(2)c CO 33 E 3.749 3.684 3.538 3.931 3.927 4.049 4.071 4.080 4.173 4.179 4.346 4.344
14a CO 05 E 3.859 3.772 3.735 4.101 4.164 4.192 4.321 4.301 4.323 4.308 4.337 4.479
14b CO 17 G 4.158 4.058 4.115 4.515 4.563 4.622 4.762 4.837 4.889 4.854 4.796 4.837
14c CO 18 E 3.971 3.821 4.012 4.288 4.355 4.394 4.451 4.447 4.546 4.525 4.580 4.946
14(2)a CO 13 B 3.279 3.251 3.193 3.590 3.652 3.715 3.771 3.758 3.936 5.194 5.874 5.473
14(2)b CO 17 B 4.332 4.181 3.975 4.636 4.659 4.849 4.949 4.905 5.038 7.029 6.662 6.799
14(2)c CO 30 D 3.760 3.906 3.544 4.131 4.212 4.334 4.400 4.324 4.297 4.533 4.860 5.719
15a 1600-1 C 2.630 2.602 3.882 2.775 2.797 2.876 2.913 2.909 2.956 2.965 3.059 3.023
15b 1600-2 B 2.208 2.212 2.991 2.378 2.378 2.436 2.453 2.474 2.536 2.578 2.641 2.705
15c 1601-2 F 2.637 2.560 3.790 2.745 2.852 3.037 3.340 3.637 3.993 4.356 6.097 12.279
16a 1600-1 A 2.612 2.719 2.984 3.004 2.966 2.972 3.125 3.206 3.126 3.241 2.896 3.115
16b 1601-2 C 2.626 2.619 2.607 2.780 2.846 2.923 3.063 3.184 4.301 7.126 5.827 4.049
16c 1601-3 E 2.710 2.667 2.681 2.889 2.938 2.984 3.024 3.081 3.502 4.294 3.838 3.707
17a CO 16 B 4.383 4.300 4.431 5.391 5.818 5.858 6.186 6.535 7.281 8.313 628.481 234.072
17b CO 16 E 4.454 4.264 3.995 4.437 4.555 4.989 5.538 6.087 1627.106 #VALUE! #VALUE! #VALUE!
17c CO 12 A 4.308 4.204 4.145 4.650 4.760 4.927 5.100 5.981 23.820 169.397 #VALUE! #VALUE!
17(2)a CO 12 D 3.883 3.854 4.047 4.363 4.493 4.739 5.004 5.976 0.000 0.000 #VALUE! 0
17(2)b CO 16 D 5.072 4.784 4.789 5.185 5.449 5.876 6.478 7.661 #VALUE! #VALUE! 0.000 0
17(2)c CO 16 F 3.828 3.836 4.186 4.773 5.035 5.464 5.957 9.285 #VALUE! #VALUE! #VALUE! #VALUE!
18a 1600-4 E 5.007 4.985 5.305 5.822 5.892 5.815 6.314 6.828 484.219 0.000 0.000 0
18b 1601-4 D 3.336 3.303 3.698 4.413 4.584 4.391 4.215 4.247 4.882 5.729 6.781 0
18c 1601-4 F 4.277 4.348 4.618 4.688 4.519 4.447 4.558 5.305 1214.061 0.000 0.000 0
Rs (Ω.cm²)

54
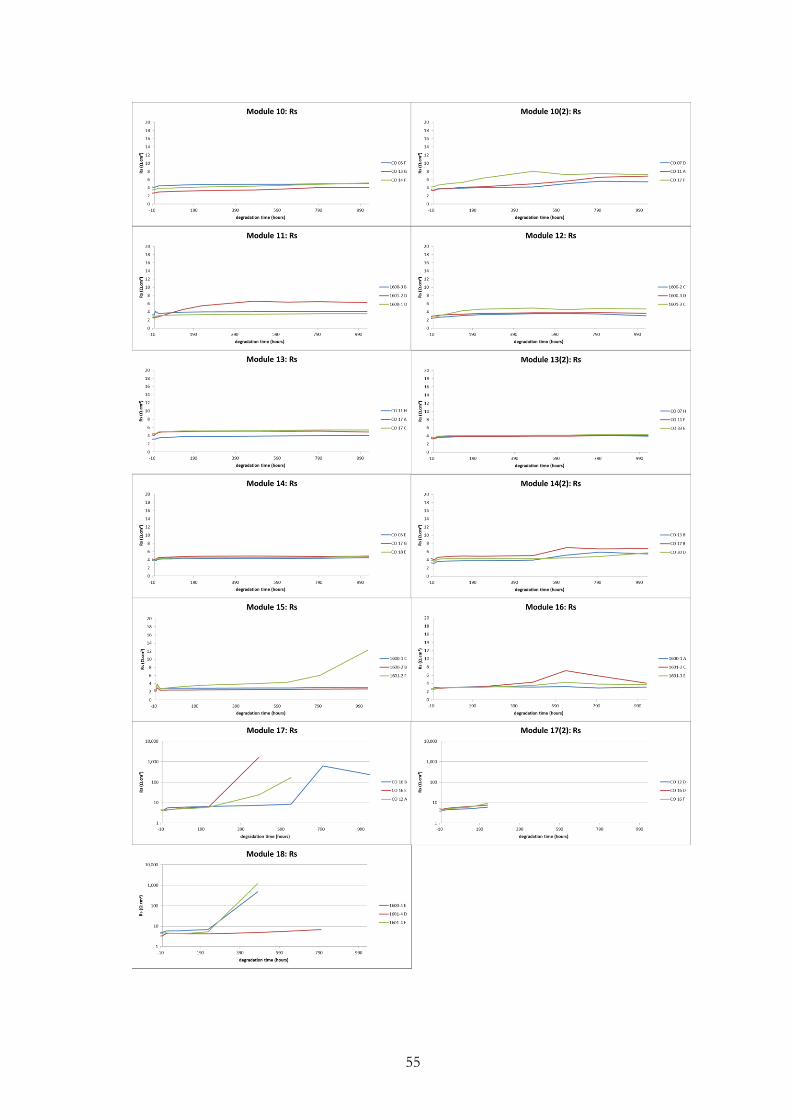
55

56
Module position Sample name -10 hours 0 hours 5 hours 20 hours 36 hours 74 hours 140 hours 230 hours 480 hours 641 hours 800 hours 1032 hours
1a CO 11 B 686.554 897.520 518.335 260.347 225.224 329.001 126.657 27.000 33.406 22.101 64298.404 #VALUE!
1b CO 14 E 544.090 952.766 1278.681 1120.434 962.469 819.107 1509.434 247.286 53.895 21.312 128.292 #VALUE!
1c CO 18 A 624.626 711.525 747.815 507.233 325.423 197.279 185.384 195.615 29.732 15.164 -35524.831 #VALUE!
1(2)a CO 05 C 353.204 548.884 882.568 509.943 508.233 399.063 288.752 204.172 47.668 122652.68 41788.143 #VALUE!
1(2)b CO 07 F 295.384 448.074 1314.539 485.061 447.737 339.938 272.064 243.298 242.218 233.969 -229040.73 #VALUE!
1(2)c CO 30 G 703.322 1594.831 663.125 728.724 867.820 1019.635 698.343 510.073 145.630 70.406 41.829 #VALUE!
2a CO 05 A 490.544 625.287 608.273 385.087 312.959 258.653 267.554 238.353 217.787 74.970 17.617 15.087
2b CO 13 C 1016.156 1074.379 1408.866 609.365 835.797 623.011 633.710 607.938 567.373 #VALUE! #VALUE! #VALUE!
2c CO 30 C 1326.995 1439.333 1045.638 1437.734 925.206 1454.701 1117.120 733.548 946.876 841.002 746.994 135.615
2(2)a CO 07 E 303.191 297.864 682.803 727.075 385.543 336.393 245.662 197.752 157.652 141.663 130.427 65.056
2(2)b CO 13 D 800.102 1241.357 874.539 725.931 811.705 661.509 727.717 933.439 581.603 38.126 12.646 #VALUE!
2(2)c CO 18 H 271.591 344.134 831.823 362.016 226.781 171.479 138.061 113.230 89.474 79.596 52.504 16.022
3a 1600-2 D 720.815 1162.270 -6981.632 722.558 710.904 934.764 904.761 943.797 992.665 932.533 #VALUE! #VALUE!
3b 1600-3 C 474.767 540.180 526.128 717.474 529.212 643.627 555.086 716.277 723.180 -23612.959 #VALUE! #VALUE!
3c 1601-2 B 513.443 4145.734 1505.251 1655.633 650.886 933.708 960.677 622.698 828.432 413.057 57997.432 -343634.10
4a 1600-2 A 768.089 722.969 169.116 30.270 40.771 265.305 468.935 463.187 736.678 9.352 #VALUE! #VALUE!
4b 1600-1 B 2555.136 760.908 894.781 765.073 552.356 523.919 475.584 485.681 489.142 459.393 621.783 637.608
4c 1601-3 D 813.037 859.597 2290.070 271.767 81.787 75.509 59.269 23.185 6.781 #VALUE! #VALUE! #VALUE!
5a CO 19 C 498.698 2082.112 567.773 828.464 646.465 189.185 91.226 78.058 85.314 38.455 26.188 28.070
5b CO 12 H 1289.220 1412.068 816.579 1008.241 803.970 640.380 554.160 546.526 435.818 380.718 340.298 25.667
5c CO 16 G 880.550 944.985 2732.813 964.272 1025.955 711.151 455.373 338.937 202.636 230.958 281.290 -57925.340
5(2)a CO 12 G 550.225 1573.505 664.210 853.663 425.483 319.783 368.366 290.143 253.643 67.630 85.297 499.290
5(2)b CO 16 A 481.869 534.467 1011.332 1120.233 559.890 380.205 272.422 190.234 378.338 312.471 239.052 40.664
5(2)c CO 19 D 495.835 1210.769 596.508 858.691 1703.497 231.054 120.053 108.800 110.242 119.150 132.079 143.167
6a CO 12 E 1152.789 788.614 1716.488 726.892 721.373 344.425 429.501 278.956 220.108 194.765 165.212 114.475
6b CO 16 H 442.458 1377.310 751.210 795.485 799.585 657.362 337.659 277.646 218.465 197.214 162.577 141.362
6c CO 19 H 576.605 601.256 876.399 797.300 647.434 279.569 100.323 76.865 69.597 69.816 64.965 61.953
6(2)a CO 08 C 391.416 858.534 707.021 831.914 513.558 323.882 289.257 281.779 194.625 162.425 139.568 131.634
6(2)b CO 12 F 1151.402 783.282 1183.156 1201.973 933.417 376.861 331.564 251.686 209.892 149.948 136.172 99.238
6(2)c CO 19 A 390.725 470.694 493.895 475.727 555.069 381.444 137.652 72.411 53.422 40.395 44.319 99.185
7a 1601-1 A 445.298 976.331 2946.767 990.198 977.245 618.712 495.820 492.247 520.728 656.808 581.160 563.725
7b 1601-4 A 732.556 688.850 962.356 1003.897 963.894 863.498 847.380 819.668 745.310 999.219 555.704 519.708
7c 1601-4 C 756.604 726.365 709.573 1485.016 2004.506 1035.145 823.196 732.930 593.634 518.691 524.676 792.720
8a 1600-4 A 635.896 739.170 575.131 379.118 406.296 424.766 318.611 325.294 228.890 154.091 121.239 73.463
8b 1601-4 B 516.898 540.891 981.373 1518.125 1190.228 832.333 973.176 664.227 593.028 528.033 523.929 548.191
8c 1601-4 E 907.160 -4669.468 1727.847 1528.973 1493.483 701.908 722.959 689.499 469.924 668.595 451.656 396.972
9a CO 05 B 387.005 444.238 422.747 505.697 620.776 758.209 902.215 608.898 567.266 536.682 391.026 216.013
9b CO 15 A 645.886 769.537 521.232 865.116 812.049 686.616 984.806 560.039 462.067 331.183 240.500 144.275
9c CO 18 G 434.709 417.356 353.676 477.486 474.522 551.038 550.887 453.996 191.219 124.259 105.452 104.309
9(2)a CO 05 H 406.141 1287.871 1005.821 664.640 572.362 563.345 732.776 633.966 608.638 389.511 237.570 148.330
9(2)b CO 07 G 385.418 402.435 438.078 327.662 403.381 398.198 407.572 463.396 517.015 734.671 1137.098 1446.017
9(2)c CO 33 F 666.670 950.541 4630.320 586.285 826.236 1143.126 888.807 963.071 936.120 647.628 437.928 369.256
10a CO 05 F 338.781 351.691 484.931 704.920 637.902 709.332 691.892 820.873 638.037 636.930 358.079 260.524
10b CO 13 G 639.476 1184.353 709.583 1004.381 1282.834 1635.368 895.521 886.568 632.679 369.649 231.576 148.348
10c CO 14 F 328.140 1289.942 1141.857 1308.644 1512.684 762.733 982.784 716.769 449.819 323.249 184.273 113.537
10(2)a CO 07 D 565.069 328.930 882.733 435.409 477.430 743.440 920.058 825.155 547.686 197.271 125.202 108.148
10(2)b CO 11 A 427.175 378.363 602.036 564.992 467.840 485.662 431.452 330.659 229.861 148.130 103.582 94.143
10(2)c CO 17 F 460.663 500.484 372.164 352.119 241.972 276.671 283.635 216.378 119.707 104.602 88.406 96.677
11a 1600-3 B 539.088 459.320 445.004 530.167 462.374 370.624 312.015 266.689 328.128 321.977 294.722 393.263
11b 1601-2 D 648.707 628.285 4205.087 1695.171 977.491 922.529 1414.956 1198.441 1397.697 1626.143 853.375 1449.014
11c 1600-1 D 802.639 1194.495 1673.736 582.697 950.385 907.139 645.385 602.497 525.252 507.498 453.103 492.951
12a 1600-2 C 1463.116 682.450 692.160 829.512 1032.437 1174.100 876.852 861.254 951.418 943.287 603.144 922.567
12b 1600-3 D 524.341 590.111 644.492 744.739 517.846 786.200 506.094 691.265 791.641 522.636 717.912 479.667
12c 1601-3 C 518.117 5320.408 630.191 838.299 959.771 1047.696 1365.927 1008.659 1162.063 1697.747 2099.319 800.041
13a CO 11 H 3230.651 1503.249 998.411 1035.816 726.710 856.384 894.158 921.485 549.665 607.505 367.738 317.273
13b CO 17 A 514.645 229.766 302.634 350.617 392.752 416.915 431.340 456.995 341.460 400.974 418.541 550.745
13c CO 17 C 461.107 300.532 276.808 350.606 349.425 394.673 300.665 456.523 456.044 501.754 350.312 452.748
13(2)a CO 07 H 309.977 341.139 500.540 409.748 403.093 394.025 464.859 472.052 528.706 606.815 778.229 743.072
13(2)b CO 11 F 267.368 231.864 250.618 290.045 255.595 262.712 246.319 262.254 260.973 241.464 244.365 196.658
13(2)c CO 33 E 1680.349 11179.397 939.201 1086.958 613.142 857.035 930.619 869.375 653.242 663.972 680.565 407.215
14a CO 05 E 348.517 401.915 475.964 340.704 457.164 499.108 595.290 559.771 998.140 574.415 581.345 353.756
14b CO 17 G 302.010 276.865 363.256 400.460 429.456 370.285 389.567 333.455 343.569 330.137 487.917 490.218
14c CO 18 E 394.410 475.989 358.493 399.413 397.697 499.752 578.221 535.517 581.461 786.244 585.263 228.815
14(2)a CO 13 B 742.959 522.566 747.067 707.975 502.050 781.705 740.407 730.659 570.618 141.741 81.373 91.099
14(2)b CO 17 B 493.147 497.230 348.793 397.577 483.127 449.754 463.068 451.329 503.325 165.664 78.939 86.559
14(2)c CO 30 D 975.908 1658.919 583.116 1329.608 861.640 1579.336 1195.228 838.780 436.900 251.036 140.740 189.229
15a 1600-1 C 326.630 481.789 447.145 351.461 325.623 334.568 375.344 412.372 360.235 444.081 347.124 449.505
15b 1600-2 B 987.985 2018.937 1400.498 1707.096 968.176 1119.040 983.561 3102.258 1065.677 1918.423 1468.647 910.343
15c 1601-2 F 618.437 951.406 1107.443 900.233 1151.914 1447.088 962.438 644.972 1327.434 1660.586 1880.715 947.754
16a 1600-1 A 917.446 951.247 1366.803 1328.587 876.880 1070.149 927.490 974.237 1198.557 613.488 405.890 361.186
16b 1601-2 C 4844.143 540.444 1065.734 859.239 657.396 732.860 874.301 1412.539 969.432 1259.760 1101.337 623.217
16c 1601-3 E 622.381 430.691 1119.225 912.765 588.694 498.446 666.227 603.019 789.620 603.157 1127.823 304.349
17a CO 16 B 622.805 1207.746 1030.431 938.369 537.511 448.989 464.838 295.567 272.442 237.727 393.341 86.745
17b CO 16 E 767.642 1878.370 1159.499 1369.353 2896.297 540.117 401.702 314.188 739.283 14990.581 9517.563 39676.484
17c CO 12 A 400.008 532.839 601.440 920.884 633.793 555.879 454.070 464.716 24.391 89.059 17699.122 37602.046
17(2)a CO 12 D 653.264 565.065 1084.890 1270.586 747.050 238.843 246.747 230.570 #VALUE! #VALUE! 328604.09 #VALUE!
17(2)b CO 16 D 2014.194 734.314 785.366 1016.303 665.610 423.713 292.867 208.199 45407.292 -169056.23 #VALUE! #VALUE!
17(2)c CO 16 F 859.248 1291.523 786.679 950.672 1423.786 846.351 363.343 142.030 -22280.485 3378.655 9241.888 -40775.285
18a 1600-4 E 358.336 275.873 496.666 330.331 385.995 400.615 334.106 352.946 374.983 #VALUE! #VALUE! #VALUE!
18b 1601-4 D 2858.356 967.071 1164.658 968.018 1326.604 769.164 849.776 1067.286 764.896 736.428 597.799 #VALUE!
18c 1601-4 F 2017.739 1469.157 1154.670 1574.932 1560.048 1046.205 1102.735 1078.576 374.035 #VALUE! #VALUE! #VALUE!
Rsh (Ω.cm²)

57

58
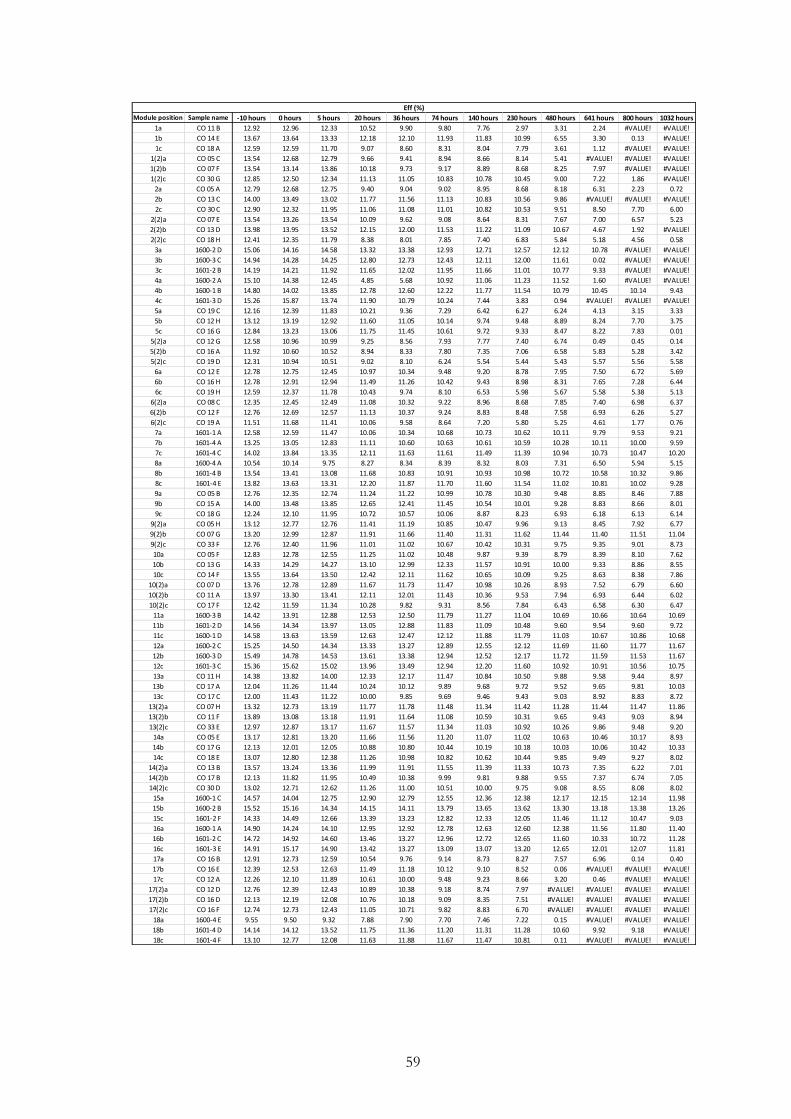
59
Module position Sample name -10 hours 0 hours 5 hours 20 hours 36 hours 74 hours 140 hours 230 hours 480 hours 641 hours 800 hours 1032 hours
1a CO 11 B 12.92 12.96 12.33 10.52 9.90 9.80 7.76 2.97 3.31 2.24 #VALUE! #VALUE!
1b CO 14 E 13.67 13.64 13.33 12.18 12.10 11.93 11.83 10.99 6.55 3.30 0.13 #VALUE!
1c CO 18 A 12.59 12.59 11.70 9.07 8.60 8.31 8.04 7.79 3.61 1.12 #VALUE! #VALUE!
1(2)a CO 05 C 13.54 12.68 12.79 9.66 9.41 8.94 8.66 8.14 5.41 #VALUE! #VALUE! #VALUE!
1(2)b CO 07 F 13.54 13.14 13.86 10.18 9.73 9.17 8.89 8.68 8.25 7.97 #VALUE! #VALUE!
1(2)c CO 30 G 12.85 12.50 12.34 11.13 11.05 10.83 10.78 10.45 9.00 7.22 1.86 #VALUE!
2a CO 05 A 12.79 12.68 12.75 9.40 9.04 9.02 8.95 8.68 8.18 6.31 2.23 0.72
2b CO 13 C 14.00 13.49 13.02 11.77 11.56 11.13 10.83 10.56 9.86 #VALUE! #VALUE! #VALUE!
2c CO 30 C 12.90 12.32 11.95 11.06 11.08 11.01 10.82 10.53 9.51 8.50 7.70 6.00
2(2)a CO 07 E 13.54 13.26 13.54 10.09 9.62 9.08 8.64 8.31 7.67 7.00 6.57 5.23
2(2)b CO 13 D 13.98 13.95 13.52 12.15 12.00 11.53 11.22 11.09 10.67 4.67 1.92 #VALUE!
2(2)c CO 18 H 12.41 12.35 11.79 8.38 8.01 7.85 7.40 6.83 5.84 5.18 4.56 0.58
3a 1600-2 D 15.06 14.16 14.58 13.32 13.38 12.93 12.71 12.57 12.12 10.78 #VALUE! #VALUE!
3b 1600-3 C 14.94 14.28 14.25 12.80 12.73 12.43 12.11 12.00 11.61 0.02 #VALUE! #VALUE!
3c 1601-2 B 14.19 14.21 11.92 11.65 12.02 11.95 11.66 11.01 10.77 9.33 #VALUE! #VALUE!
4a 1600-2 A 15.10 14.38 12.45 4.85 5.68 10.92 11.06 11.23 11.52 1.60 #VALUE! #VALUE!
4b 1600-1 B 14.80 14.02 13.85 12.78 12.60 12.22 11.77 11.54 10.79 10.45 10.14 9.43
4c 1601-3 D 15.26 15.87 13.74 11.90 10.79 10.24 7.44 3.83 0.94 #VALUE! #VALUE! #VALUE!
5a CO 19 C 12.16 12.39 11.83 10.21 9.36 7.29 6.42 6.27 6.24 4.13 3.15 3.33
5b CO 12 H 13.12 13.19 12.92 11.60 11.05 10.14 9.74 9.48 8.89 8.24 7.70 3.75
5c CO 16 G 12.84 13.23 13.06 11.75 11.45 10.61 9.72 9.33 8.47 8.22 7.83 0.01
5(2)a CO 12 G 12.58 10.96 10.99 9.25 8.56 7.93 7.77 7.40 6.74 0.49 0.45 0.14
5(2)b CO 16 A 11.92 10.60 10.52 8.94 8.33 7.80 7.35 7.06 6.58 5.83 5.28 3.42
5(2)c CO 19 D 12.31 10.94 10.51 9.02 8.10 6.24 5.54 5.44 5.43 5.57 5.56 5.58
6a CO 12 E 12.78 12.75 12.45 10.97 10.34 9.48 9.20 8.78 7.95 7.50 6.72 5.69
6b CO 16 H 12.78 12.91 12.94 11.49 11.26 10.42 9.43 8.98 8.31 7.65 7.28 6.44
6c CO 19 H 12.59 12.37 11.78 10.43 9.74 8.10 6.53 5.98 5.67 5.58 5.38 5.13
6(2)a CO 08 C 12.35 12.45 12.49 11.08 10.32 9.22 8.96 8.68 7.85 7.40 6.98 6.37
6(2)b CO 12 F 12.76 12.69 12.57 11.13 10.37 9.24 8.83 8.48 7.58 6.93 6.26 5.27
6(2)c CO 19 A 11.51 11.68 11.41 10.06 9.58 8.64 7.20 5.80 5.25 4.61 1.77 0.76
7a 1601-1 A 12.58 12.59 11.47 10.06 10.34 10.68 10.73 10.62 10.11 9.79 9.53 9.21
7b 1601-4 A 13.25 13.05 12.83 11.11 10.60 10.63 10.61 10.59 10.28 10.11 10.00 9.59
7c 1601-4 C 14.02 13.84 13.35 12.11 11.63 11.61 11.49 11.39 10.94 10.73 10.47 10.20
8a 1600-4 A 10.54 10.14 9.75 8.27 8.34 8.39 8.32 8.03 7.31 6.50 5.94 5.15
8b 1601-4 B 13.54 13.41 13.08 11.68 10.83 10.91 10.93 10.98 10.72 10.58 10.32 9.86
8c 1601-4 E 13.82 13.63 13.31 12.20 11.87 11.70 11.60 11.54 11.02 10.81 10.02 9.28
9a CO 05 B 12.76 12.35 12.74 11.24 11.22 10.99 10.78 10.30 9.48 8.85 8.46 7.88
9b CO 15 A 14.00 13.48 13.85 12.65 12.41 11.45 10.54 10.01 9.28 8.83 8.66 8.01
9c CO 18 G 12.24 12.10 11.95 10.72 10.57 10.06 8.87 8.23 6.93 6.18 6.13 6.14
9(2)a CO 05 H 13.12 12.77 12.76 11.41 11.19 10.85 10.47 9.96 9.13 8.45 7.92 6.77
9(2)b CO 07 G 13.20 12.99 12.87 11.91 11.66 11.40 11.31 11.62 11.44 11.40 11.51 11.04
9(2)c CO 33 F 12.76 12.40 11.96 11.01 11.02 10.67 10.42 10.31 9.75 9.35 9.01 8.73
10a CO 05 F 12.83 12.78 12.55 11.25 11.02 10.48 9.87 9.39 8.79 8.39 8.10 7.62
10b CO 13 G 14.33 14.29 14.27 13.10 12.99 12.33 11.57 10.91 10.00 9.33 8.86 8.55
10c CO 14 F 13.55 13.64 13.50 12.42 12.11 11.62 10.65 10.09 9.25 8.63 8.38 7.86
10(2)a CO 07 D 13.76 12.78 12.89 11.67 11.73 11.47 10.98 10.26 8.93 7.52 6.79 6.60
10(2)b CO 11 A 13.97 13.30 13.41 12.11 12.01 11.43 10.36 9.53 7.94 6.93 6.44 6.02
10(2)c CO 17 F 12.42 11.59 11.34 10.28 9.82 9.31 8.56 7.84 6.43 6.58 6.30 6.47
11a 1600-3 B 14.42 13.91 12.88 12.53 12.50 11.79 11.27 11.04 10.69 10.66 10.64 10.69
11b 1601-2 D 14.56 14.34 13.97 13.05 12.88 11.83 11.09 10.48 9.60 9.54 9.60 9.72
11c 1600-1 D 14.58 13.63 13.59 12.63 12.47 12.12 11.88 11.79 11.03 10.67 10.86 10.68
12a 1600-2 C 15.25 14.50 14.34 13.33 13.27 12.89 12.55 12.12 11.69 11.60 11.77 11.67
12b 1600-3 D 15.49 14.78 14.53 13.61 13.38 12.94 12.52 12.17 11.72 11.59 11.53 11.67
12c 1601-3 C 15.36 15.62 15.02 13.96 13.49 12.94 12.20 11.60 10.92 10.91 10.56 10.75
13a CO 11 H 14.38 13.82 14.00 12.33 12.17 11.47 10.84 10.50 9.88 9.58 9.44 8.97
13b CO 17 A 12.04 11.26 11.44 10.24 10.12 9.89 9.68 9.72 9.52 9.65 9.81 10.03
13c CO 17 C 12.00 11.43 11.22 10.00 9.85 9.69 9.46 9.43 9.03 8.92 8.83 8.72
13(2)a CO 07 H 13.32 12.73 13.19 11.77 11.78 11.48 11.34 11.42 11.28 11.44 11.47 11.86
13(2)b CO 11 F 13.89 13.08 13.18 11.91 11.64 11.08 10.59 10.31 9.65 9.43 9.03 8.94
13(2)c CO 33 E 12.97 12.87 13.17 11.67 11.57 11.34 11.03 10.92 10.26 9.86 9.48 9.20
14a CO 05 E 13.17 12.81 13.20 11.66 11.56 11.20 11.07 11.02 10.63 10.46 10.17 8.93
14b CO 17 G 12.13 12.01 12.05 10.88 10.80 10.44 10.19 10.18 10.03 10.06 10.42 10.33
14c CO 18 E 13.07 12.80 12.38 11.26 10.98 10.82 10.62 10.44 9.85 9.49 9.27 8.02
14(2)a CO 13 B 13.57 13.24 13.36 11.99 11.91 11.55 11.39 11.33 10.73 7.35 6.22 7.01
14(2)b CO 17 B 12.13 11.82 11.95 10.49 10.38 9.99 9.81 9.88 9.55 7.37 6.74 7.05
14(2)c CO 30 D 13.02 12.71 12.62 11.26 11.00 10.51 10.00 9.75 9.08 8.55 8.08 8.02
15a 1600-1 C 14.57 14.04 12.75 12.90 12.79 12.55 12.36 12.38 12.17 12.15 12.14 11.98
15b 1600-2 B 15.52 15.16 14.34 14.15 14.11 13.79 13.65 13.62 13.30 13.18 13.38 13.26
15c 1601-2 F 14.33 14.49 12.66 13.39 13.23 12.82 12.33 12.05 11.46 11.12 10.47 9.03
16a 1600-1 A 14.90 14.24 14.10 12.95 12.92 12.78 12.63 12.60 12.38 11.56 11.80 11.40
16b 1601-2 C 14.72 14.92 14.60 13.46 13.27 12.96 12.72 12.65 11.60 10.33 10.72 11.28
16c 1601-3 E 14.91 15.17 14.90 13.42 13.27 13.09 13.07 13.20 12.65 12.01 12.07 11.81
17a CO 16 B 12.91 12.73 12.59 10.54 9.76 9.14 8.73 8.27 7.57 6.96 0.14 0.40
17b CO 16 E 12.39 12.53 12.63 11.49 11.18 10.12 9.10 8.52 0.06 #VALUE! #VALUE! #VALUE!
17c CO 12 A 12.26 12.10 11.89 10.61 10.00 9.48 9.23 8.66 3.20 0.46 #VALUE! #VALUE!
17(2)a CO 12 D 12.76 12.39 12.43 10.89 10.38 9.18 8.74 7.97 #VALUE! #VALUE! #VALUE! #VALUE!
17(2)b CO 16 D 12.13 12.19 12.08 10.76 10.18 9.09 8.35 7.51 #VALUE! #VALUE! #VALUE! #VALUE!
17(2)c CO 16 F 12.74 12.73 12.43 11.05 10.71 9.82 8.83 6.70 #VALUE! #VALUE! #VALUE! #VALUE!
18a 1600-4 E 9.55 9.50 9.32 7.88 7.90 7.70 7.46 7.22 0.15 #VALUE! #VALUE! #VALUE!
18b 1601-4 D 14.14 14.12 13.52 11.75 11.36 11.20 11.31 11.28 10.60 9.92 9.18 #VALUE!
18c 1601-4 F 13.10 12.77 12.08 11.63 11.88 11.67 11.47 10.81 0.11 #VALUE! #VALUE! #VALUE!
Eff (%)

60

61

62
Appendix B: JV curves of cells

63

64

65

66

67
Appendix C: TCO and Mo resistance values and curves
Module Sample name -10 hours 0 hours 5 hours 20 hours 36 hours 74 hours 140 hours 230 hours 480 hours 641 hours 800 hours 1032 hours
1 CO 30 E 11.25 11 15.85 19.25 19.95 20.5 22.7 23.3 27.35 27.8 30.55 31.85
1(2) CO 33 D 12.9 12.55 13.7 16.55 17.55 19.85 23.25 24.35 26.6 24.5 28.6 32.9
2 CO 33 H 15.45 15.05 16.25 19.95 21.65 23.05 26.75 28.6 34.5 38.65 42 44.05
2(2) CO 30 B 11.75 11.3 15.15 18.15 18.2 19.25 21.15 24.8 34.6 41.85 50.15 14.7
3 1601-3 A 17.85 17.05 19.8 25.25 26.2 25.9 28.9 34.05 45.15 43.35 43.7 41.8
4 1600-1 E 25.1 24.3 26.15 27.35 27.65 19.25 30.8 31.05 36.05 36.8 40.25 41.75
5 CO 10 F 17.5 15.9 14.45 14.2 14.6 15.6 17.75 18.75 21.15 24.55 32.35 54.2
5(2) CO 10 G 20.75 21.9 15.9 14.6 15.85 18.95 21.15 23.75 26.25 30.35 37.2 47.65
6 CO 10 D 15.2 14.35 11.7 13.15 14.15 16.2 22.05 23.4 28.3 34.5 43.8 47.8
6(2) CO 10 A 16.95 16.9 18.15 20.75 21.85 25.7 29.9 33.1 40.5 45.3 43.75 45
7 1601-1 F 16.75 16.75 18.15 22.65 26.3 26.6 29.65 29 33.2 34.8 35 35.55
8 1601-1 E 19.35 17.9 20.3 25.3 26.45 25.7 26.5 27.95 32.3 33.05 36.95 40.1
9 CO 30 A 11.35 11.15 11.2 11.25 11.3 11.3 11.45 11.65 12.1 12.4 13.1 15.2
9(2) CO 14 H 8.2 8.15 8.2 8.25 8.45 8.7 9.2 9.45 10.05 10.45 11.2 13.15
10 CO 30 F 13.5 13.5 13.5 13.45 13.45 13.35 13.45 13.5 14.15 14.6 15.15 15.85
10(2) CO 30 H 13.5 13.25 13.25 13.2 13.05 12.95 12.9 12.9 13.1 13.35 13.85 15.8
11 1600-2 E 19 19.1 19.2 19.1 19.1 19 19.7 19.95 21.05 21.75 23.3 24.75
12 1601-2 E 10.05 10.35 10.5 10.45 10.6 10.6 11.15 11.25 11.9 12.1 12.55 13.55
13 CO 14 C 9.05 9.25 9.25 9.5 9.75 10.25 10.95 11.45 12.25 13.1 13.75 14.75
13(2) CO 33 G 12.75 12.7 12.7 12.8 12.85 13 13.35 13.6 14.25 14.65 15.1 15.55
14 CO 14 A 10.4 10.6 10.75 11.1 11.6 12.05 13.15 13.9 15.35 16.2 16.7 17.4
14(2) CO 33 B 11.2 11.05 11.1 11.15 11.2 11.2 11.7 11.7 12.05 18.9 24.9 69.6
15 1600-3 E 14.6 15.05 15.1 15.1 15.15 14.95 15.4 15.25 15.8 15.75 16.2 16.4
16 1600-3 F 19.4 19.5 20.6 19.55 19.55 19.5 20.55 19.6 22.1 22.65 24.9 29.75
17 CO 03 E 20.75 22.65 24.9 27.55 29.55 30.4 37.5 39.15 33.65 46.6 52.15 103
17(2) CO 03 F 21.3 21.75 22.5 24.4 26.15 28.6 33.35 37.25 41.4 44.6 49.05 52.8
18 1601-1 C 24.25 24.4 25.3 27.65 29.4 33.6 38.8 40.4 43.1 52.7 63.75
TCO (Ω)
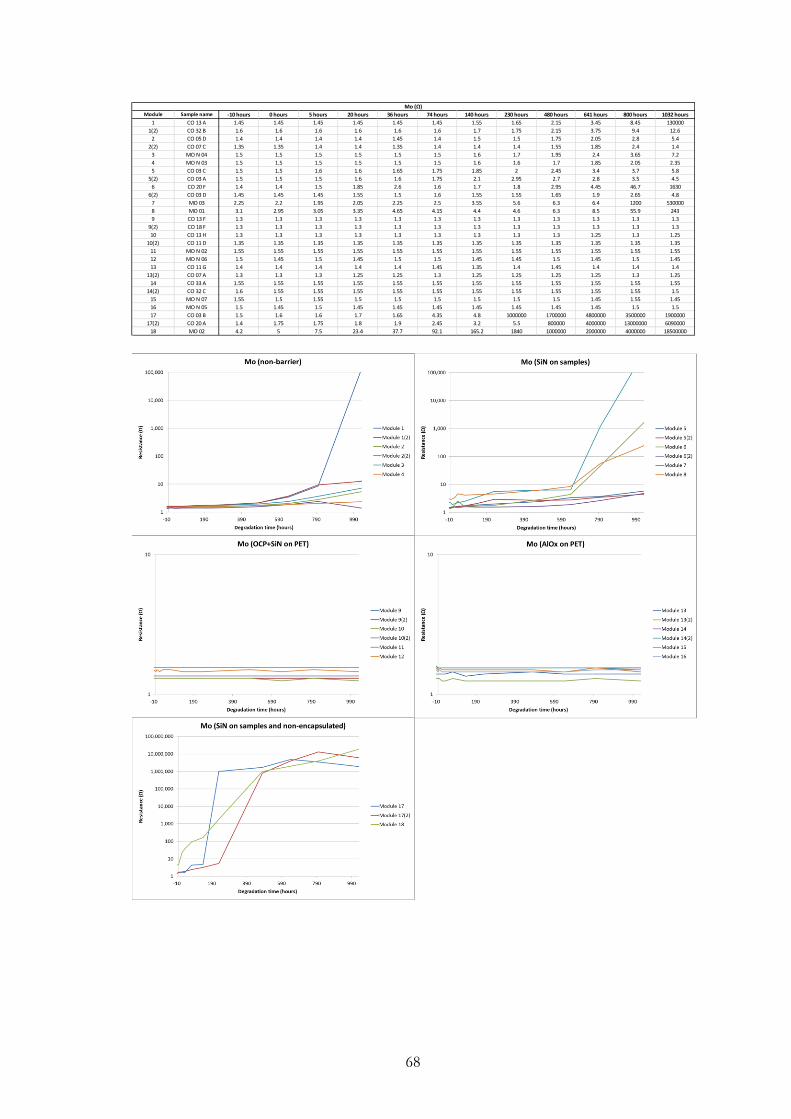
68
Module Sample name -10 hours 0 hours 5 hours 20 hours 36 hours 74 hours 140 hours 230 hours 480 hours 641 hours 800 hours 1032 hours
1 CO 13 A 1.45 1.45 1.45 1.45 1.45 1.45 1.55 1.65 2.15 3.45 8.45 130000
1(2) CO 32 B 1.6 1.6 1.6 1.6 1.6 1.6 1.7 1.75 2.15 3.75 9.4 12.6
2 CO 05 D 1.4 1.4 1.4 1.4 1.45 1.4 1.5 1.5 1.75 2.05 2.8 5.4
2(2) CO 07 C 1.35 1.35 1.4 1.4 1.35 1.4 1.4 1.4 1.55 1.85 2.4 1.4
3 MO N 04 1.5 1.5 1.5 1.5 1.5 1.5 1.6 1.7 1.95 2.4 3.65 7.2
4 MO N 03 1.5 1.5 1.5 1.5 1.5 1.5 1.6 1.6 1.7 1.85 2.05 2.35
5 CO 03 C 1.5 1.5 1.6 1.6 1.65 1.75 1.85 2 2.45 3.4 3.7 5.8
5(2) CO 03 A 1.5 1.5 1.5 1.6 1.6 1.75 2.1 2.95 2.7 2.8 3.5 4.5
6 CO 20 F 1.4 1.4 1.5 1.85 2.6 1.6 1.7 1.8 2.95 4.45 46.7 1630
6(2) CO 03 D 1.45 1.45 1.45 1.55 1.5 1.6 1.55 1.55 1.65 1.9 2.65 4.8
7 MO 03 2.25 2.2 1.95 2.05 2.25 2.5 3.55 5.6 6.3 6.4 1200 530000
8 MO 01 3.1 2.95 3.05 3.35 4.65 4.15 4.4 4.6 6.3 8.5 55.9 243
9 CO 13 F 1.3 1.3 1.3 1.3 1.3 1.3 1.3 1.3 1.3 1.3 1.3 1.3
9(2) CO 18 F 1.3 1.3 1.3 1.3 1.3 1.3 1.3 1.3 1.3 1.3 1.3 1.3
10 CO 13 H 1.3 1.3 1.3 1.3 1.3 1.3 1.3 1.3 1.3 1.25 1.3 1.25
10(2) CO 11 D 1.35 1.35 1.35 1.35 1.35 1.35 1.35 1.35 1.35 1.35 1.35 1.35
11 MO N 02 1.55 1.55 1.55 1.55 1.55 1.55 1.55 1.55 1.55 1.55 1.55 1.55
12 MO N 06 1.5 1.45 1.5 1.45 1.5 1.5 1.45 1.45 1.5 1.45 1.5 1.45
13 CO 11 G 1.4 1.4 1.4 1.4 1.4 1.45 1.35 1.4 1.45 1.4 1.4 1.4
13(2) CO 07 A 1.3 1.3 1.3 1.25 1.25 1.3 1.25 1.25 1.25 1.25 1.3 1.25
14 CO 33 A 1.55 1.55 1.55 1.55 1.55 1.55 1.55 1.55 1.55 1.55 1.55 1.55
14(2) CO 32 C 1.6 1.55 1.55 1.55 1.55 1.55 1.55 1.55 1.55 1.55 1.55 1.5
15 MO N 07 1.55 1.5 1.55 1.5 1.5 1.5 1.5 1.5 1.5 1.45 1.55 1.45
16 MO N 05 1.5 1.45 1.5 1.45 1.45 1.45 1.45 1.45 1.45 1.45 1.5 1.5
17 CO 03 B 1.5 1.6 1.6 1.7 1.65 4.35 4.8 1000000 1700000 4800000 3500000 1900000
17(2) CO 20 A 1.4 1.75 1.75 1.8 1.9 2.45 3.2 5.5 800000 4000000 13000000 6090000
18 MO 02 4.2 5 7.5 23.4 37.7 92.1 165.2 1840 1000000 2000000 4000000 18500000
Mo (Ω)

69
Appendix D: Light transmission curves
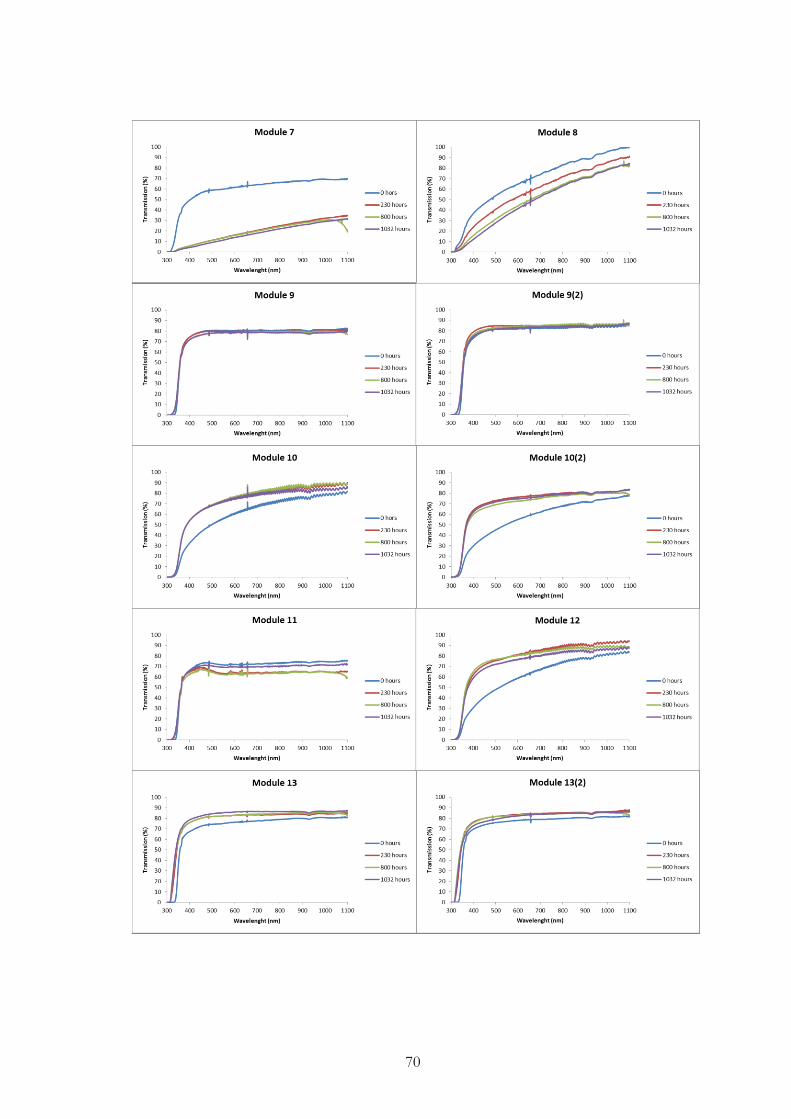
70

71