Damage Tolerance of Composite Sandwich Airframe … · DOT/FAA/AR-05/33 Office of Aviation Research...
81
DOT/FAA/AR-05/33 Office of Aviation Research Washington, D.C. 20591 Damage Tolerance of Composite Sandwich Airframe Structures— Additional Results October 2005 Final Report This document is available to the U.S. public through the National Technical Information Service (NTIS), Springfield, Virginia 22161. U.S. Department of Transportation Federal Aviation Administration
Transcript of Damage Tolerance of Composite Sandwich Airframe … · DOT/FAA/AR-05/33 Office of Aviation Research...

DOT/FAA/AR-05/33 Office of Aviation Research Washington, D.C. 20591
Damage Tolerance of Composite Sandwich Airframe Structures—Additional Results October 2005 Final Report This document is available to the U.S. public through the National Technical Information Service (NTIS), Springfield, Virginia 22161.
U.S. Department of Transportation Federal Aviation Administration

NOTICE
This document is disseminated under the sponsorship of the U.S. Department of Transportation in the interest of information exchange. The United States Government assumes no liability for the contents or use thereof. The United States Government does not endorse products or manufacturers. Trade or manufacturer's names appear herein solely because they are considered essential to the objective of this report. This document does not constitute FAA certification policy. Consult your local FAA aircraft certification office as to its use. This report is available at the Federal Aviation Administration William J. Hughes Technical Center's Full-Text Technical Reports page: actlibrary.tc.faa.gov in Adobe Acrobat portable document format (PDF).

Technical Report Documentation Page 1. Report No.
DOT/FAA/AR-05/33
2. Government Accession No. 3. Recipient's Catalog No.
5. Report Date
October 2005
4. Title and Subtitle
DAMAGE TOLERANCE OF COMPOSITE SANDWICH AIRFRAME STRUCTURES—ADDITIONAL RESULTS
6. Performing Organization Code
7. Author(s)
J.S. Tomblin, K.S. Raju, T. Walker, and J.F. Acosta
8. Performing Organization Report No.
10. Work Unit No. (TRAIS) 9. Performing Organization Name and Address
Wichita State University 1845 Fairmount Wichita KS 67260-0093
11. Contract or Grant No.
01-C-AW-WiSU-002 13. Type of Report and Period Covered
Final Report
12. Sponsoring Agency Name and Address
U.S. Department of Transportation Federal Aviation Administration Office of Aviation Research Washington, DC 20591
14. Sponsoring Agency Code
ACE-110
15. Supplementary Notes
The Federal Aviation Administration Airport and Aircraft Safety R&D Division Technical Monitor was Peter Shyprykevich. 16. Abstract
The behavior of sandwich panels with open holes subjected to in-plane tensile and compressive loads were investigated experimentally. The objective of this study was to establish whether the open-hole damage was more severe compared to an impact damage of equal planar size. Hole diameters of 1, 2, and 4 inches were selected as they represented the planar dimensions of impact damage that produced contrasting failure modes in sandwich panels. The experimental results indicated that the open holes are more severe when compared to impact damage created with different impactor sizes. Comparison with past data revealed that residual strengths of impact damaged sandwich panels tend to approach that of the open hole with increasing residual indentation depth. Similar to impact damage, the single facesheet holes in sandwich panels under compression produced distinct failure modes, which was a function of the hole diameter. A facesheet fracture failure mode was observed for small diameter holes (and through holes of all sizes investigated), while a local instability mode was observed for the 4-inch-diameter hole. The buckling mode seen in sandwich panels with 4-inch-diameter single facesheet holes appeared to blunt the strain concentration due to facesheet bending, resulting in higher compressive strengths compared to smaller size holes. Finally, the open-hole compressive strengths were significantly lower than the open-hole tensile strengths for s]CORE/)45/90[( 2 sandwich panels.
The impact damage resistance and damage tolerance of sandwich panels with facesheets fabricated using Toray P707AG-15 Unitape/epoxy and Toray T700S-12K plain weave fabric/epoxy systems were investigated. This study was intended to augment the observations on damage tolerance characteristics reported in previous studies. Three different facesheet configurations
SFF ]CORE/)90/45[( , SFTTF ]CORE/)45/0/0/45[( , and SFTTFTTF ]CORE/45/0/0/45/0/0/45[ were investigated. The sandwich panels exhibited damage resistance and tolerance characteristics that were similar to the earlier findings. The damage states were typical of blunt impactors, and thus, the behavior of these panels under compression was dominated by facesheet stiffness and core properties.
The FAA damage tolerance program was independently analysed by Mr. Tom Walker of NSE Composites. The primary emphasis of the evaluation was the residual strength prediction development effort, but also included a review of the residual strength test results. Recommendations addressing the program scope and the analysis method development and verification are in appendix C. 17. Key Words
Composites, Sandwich, Honeycomb, Damage tolerance, Impact, Open hole, Residual strength
18. Distribution Statement
This document is available to the public through the National Technical Information Service (NTIS), Springfield, Virginia 22161.
19. Security Classif. (of this report) Unclassified
20. Security Classif. (of this page) Unclassified
21. No. of Pages 81
22. Price
Form DOT F1700.7 (8-72) Reproduction of completed page authorized

iii
TABLE OF CONTENTS
Page EXECUTIVE SUMMARY ix 1. INTRODUCTION 1
2. TESTING OF SANDWICH PANELS WITH OPEN HOLES 2
2.1 Specimen Preparation 5 2.2 Compression Testing of Sandwich Panels With Open Holes 6
2.2.1 Compression Test Results 11 2.2.2 Failure Modes 14
2.3 Tension Tests of S2 ]CORE/)45/90[( Sandwich Panels With Open Holes 16
2.4 Comparison Between Tension and Compression Results for
S2 ]CORE/)45/90[( Panels 25
2.5 Comparison With Impact Test Data 26 3. IMPACT DAMAGE TOLERANCE OF SANDWICH PANELS WITH TORAY
FACESHEETS 29
4. CONCLUSIONS 33
5. REFERENCES 34
APPENDICES A—Compressive
B—Load Strain Plots for S2 ]CORE/)45/90[( Sandwich Panels Under Tensile Loading
C—NSE Composites’ Assessment of Research on Residual Strength of Thin-Gage Sandwich Structures With Damage

LIST OF FIGURES
Figure Page 1 Residual Strength Curve for Impact-Damaged Sandwich Panel Under
Compressive Loads and Range of Hole Sizes Used 2
2 Geometric Configurations of Tension and Compression Coupons 3
3 Drilling With Diamond-Coated Core Drills 5
4 Typical Hole-Edge Quality in a Sandwich Panel 5
5 Boundary Conditions Imposed on Compression Specimens 6
6 Schematic of Compression Test Fixture Used in the Study 7
7 Strain Gage Locations for Compression Specimens With Hole Diameters of 1 and 2 Inches 8
8 Strain Gage Locations for Compression Specimens With Hole Diameter of 4 Inches 8
9 Load Versus End Shortening Plots for S]CORE/)45/90[( Sandwich Panels 9
10 Load Versus End Shortening Plots for S2 ]CORE/)45/90[( Sandwich Panels 10
11 Load Versus End Shortening Plots for S3 ]CORE/)45/90[( Sandwich Panels 10
12 Load Versus Strain for S]CORE/)45/90[( Sandwich Specimen With 1-inch-Diameter Hole in a Single Facesheet 11
13 Compression Strength of Sandwich Panels With Open Holes 13
14 Average Far-Field Strains in Sandwich Panels With Open Holes Subjected to Compression Loading 13
15 Failure Mode in Sandwich Panels With Through Holes 14
16 Failure Mode in Sandwich Panels With a Hole in a Single Facesheet 15
17 Observed Failure Mode in Sandwich Panels With 4-inch-Diameter Hole in a Single Facesheet 15
18 Whiffle Tree Mechanism Used for Tension Loading of Sandwich Specimens 17
19 Details of Whiffle Tree Mechanism 18
iv

20 Strain Gage Location for Open-Hole Tension Specimens 19
21 Sandwich Specimen Mounted on the MTS Load Frame for Tension Testing 20
22 Load-Displacement Plots for Sandwich Specimen With 1-inch-Diameter Holes Under In-Plane Tension 20
23 Load-Displacement Plots for Sandwich Specimen With 2-inch-Diameter Holes Under In-Plane Tension 21
24 Load-Displacement Plots for Sandwich Specimen With 4-inch-Diameter Holes and a Width of 17 Inches Under In-Plane Tension 21
25 Load-Displacement Plots for Sandwich Specimen With 4-inch-Diameter Holes and a Width of 8.5 Inches Under In-Plane Tension 22
26 Load-Strain Plots for Sandwich Specimen With 4-inch-Diameter Hole in a Single Facesheet Under In-Plane Tension 23
27 Tensile Strength of Sandwich Panels With Open Holes 24
28 Average Far-Field Strains in Sandwich Panels With Open Holes Subjected to Tensile Loading 24
29 Comparison of Tension and Compressive Strengths of Sandwich Panels With Open Holes 25
30 Comparison of Normalized Tensile and Compressive Strengths of Sandwich Panels With Open Holes 26
31 Comparison of Open-Hole and Impact-Damaged Sandwich Panels With Two-Ply Facesheets 27
32 Comparison of Open-Hole and Impact-Damaged Sandwich Panels With Four-Ply Facesheets 27
33 Comparison of Open-Hole and Impact-Damaged Sandwich Panels With Six-Ply Facesheets 28
34 Comparison of Combined Open-Hole Data With Impact Damage Data 28
35 Planar Damage Diameter in Sandwich Panels Impacted With Different Energy Levels 30
36 Maximum Residual Indentation Depth in Sandwich Panels Impacted With Different Energy Levels 30
37 Residual Indentation Depth Versus Planar Damage Diameter for Sandwich Panels 31
v

38 Compression-After-Impact Strength Versus Planar Damage Diameter for Sandwich Panels Fabricated Using Toray Material for Facesheets 32
39 Normalized Compression-After-Impact Strength Versus Planar Damage Diameter for Sandwich Panels Fabricated Using Toray Material for Facesheets 32
40 Comparison of Residual Strength of Impact-Damaged Sandwich Panels With Facesheets Fabricated Using Toray and Newport Materials 33
vi
LIST OF TABLES
Table Page 1 Test Matrix for Open-Hole Compression Tests 4 2 Test Matrix for Open-Hole Tension Tests 4 3 Summary of Compression Test Results 12 4 Summary of Compression Failure Modes in Sandwich Panels 16 5 Summary of Tension Test Results 23
vii

LIST OF ACRONYMS
ADLs Allowable damage limits CAI Compression after impact CFRP Carbon fiber-reinforced plastic d/y Damage diameter-to-residual intention ratio FAA Federal Aviation Administration FWCF Finite width correction factor NDI Nondestructive inspection TOD Threshold of detectability TTO Through transmission ultrasonic WSU Wichita State University
viii

EXECUTIVE SUMMARY
The behavior of sandwich panels with open holes subjected to in-plane tensile and compressive loads were investigated experimentally. The objective of this study was to establish whether the open-hole damage was more severe compared to an impact damage of equal planar size. Hole diameters of 1, 2, and 4 inches were selected as they represented the planar dimensions of impact damage that produced contrasting failure modes in sandwich panels. The experimental results indicated that the open holes are more severe when compared to impact damage created with different impactor sizes. Comparison with past data revealed that residual strengths of impact-damaged sandwich panels tend to approach that of the open hole with increasing residual indentation depth. Similar to impact damage, the single facesheet holes in sandwich panels under compression produced distinct failure modes, which was a function of the hole diameter. A facesheet fracture failure mode was observed for small diameter holes (and through holes of all sizes investigated), while a local instability mode was observed for the 4-inch-diameter hole. The buckling mode seen in sandwich panels with 4-inch-diameter single facesheet holes appeared to blunt the strain concentration due to facesheet bending, resulting in higher compressive strengths compared to smaller size holes. Finally, the open-hole compressive strengths were significantly lower than the open-hole tensile strengths for S2 ]CORE/)45/90[( sandwich panels. The impact damage resistance and damage tolerance of sandwich panels with facesheets fabricated using the Toray P707AG-15 Unitape/epoxy and Toray T700S-12K plain weave fabric/epoxy systems were investigated. This study was intended to augment the observations on damage tolerance characteristics reported in previous studies. Three different facesheet configurations, SFF ]CORE/)90/45[( , SFTTF ]CORE/)45/0/0/45[( , and
SFTTFTTF ]CORE/45/0/0/45/0/0/45[ , were investigated. Plascore PN2-3/16-3.0 Nomex honeycomb material of nominal density 3 lb/ft3, nominal cell size of 3/16 inch, and 0.375 inch thick was used for the honeycomb core. The sandwich panels exhibited damage resistance and tolerance characteristics that were similar to the earlier findings. The damage states were typical of blunt impactors, and thus, the behavior of these panels under compression was dominated by facesheet stiffness and core properties. The damage states that produce facesheet fractures, delaminations, etc., may discriminate the material systems better than blunt object damage and is recommended for further study. Mr. Tom Walker of NSE Composites independently analyzed the Federal Aviation Administration damage tolerance program. The primary emphasis of the evaluation was the residual strength prediction development effort, but also included a review of the residual strength test results. Neither the testing nor analyses related to impact damage resistance were considered. Recommendations addressing the program scope and the analysis method development and verification are included in appendix C.
ix/x

1. INTRODUCTION.
The damage sustained due to localized accidental loadings has been shown to be a limiting constraint in the design process of a sandwich airframe structure. The use of thin skins with relatively compliant cores makes these sandwich structures vulnerable to impact damage. The low-velocity impact events have been shown [1] to produce very distinct damage states, which are governed by the impactor size. The damage states may vary from clearly visible severe localized skin damage to extensive core damage without any external indications, making it difficult to detect [1]. The latter damage states, which are typical of blunt impactors, were found to degrade the residual strength under compressive loading by up to 60% [1]. The failure mechanisms of impact-damaged sandwich panels may range from a pure compressive failure of the facesheet(s) to a local buckling-driven instability [1 and 2]. The particular combination of planar damage size and residual indentation depth was found to dictate the final failure mode under compression loading. The sandwich panel with an open-hole in the facesheet represents the case of complete loss of load path through the damage region and may represent the worst-case damage scenario. The open-hole behavior of symmetric laminates has been extensively studied experimentally [3 and 4] and models exist [3 and 4] to predict their behavior and failure modes under in-plane loading. Unlike solid laminates, the facesheets of sandwich panels are relatively thin and may become locally unstable due to stress raisers such as impact damage and holes. Further, the use of thin facesheets that may be individually unsymmetrical will introduce localized bending of the facesheet, due to coupling effects, especially with honeycomb core sandwich panels, where the transverse support is discontinuous. The lack of transverse core support near the hole boundary may alter the strain concentration associated with the hole and accommodate localized facesheet bending. In the present investigation, the location of the strength degradation curve associated with impact damage relative to that of sandwich panels with a hole in one of its facesheets and through holes were studied experimentally. The objective of the study was to determine if an open hole is more severe than a worst-case impact damage corresponding to the asymptote of the residual strength degradation curve shown in figure 1. Hole diameters of 1, 2, and 4 inches were selected for this study because they span the initial and asymptotic regions of the strength degradation curve as shown in figure 1. The study also addressed the finite width effects using a limited number of tests. The experimental results obtained form this study will help leverage the utilization of the existing residual strength data on impact-damaged sandwich panels, which were generated using specimens with fixed width. In addition, a limited amount of residual strength data was generated for sandwich panels whose facesheets were fabricated using Toray P707AG-15 Unitape/epoxy and Toray T700S-12K plain weave fabric/epoxy material systems to assess the validity of extending the observed residual strength trends to other material systems. NSE Composites conducted an independent assessment of the damage tolerance data generated during the previous phases of this program. NSE Composites also assessed the predictive capability of analytical models developed by Vizzini [5, 6, and 7] and Lacy [8] for compressive strength of impact-damaged sandwich panels was also assessed by NSE Composites. The summary of their assessments and recommendations is reported in appendix C.
1

0 1 2 3 4 5 6
TTU C-Scan Planar Damage Diameter 2Rdamage (in)
0
0.2
0.4
0.6
0.8
1
1.2N
orm
aliz
ed C
AI S
treng
th
[(90/45)n/ CORE]SSKIN : NB321/3K70 PWCFCORE : Plascore PN2-3/16-3.0
IMPACTOR DIAMETER1.00"3.00"
Strength Degradation Curve NCAI = f(2Rdamage)
Range of hole diameters selected for study
FIGURE 1. RESIDUAL STRENGTH CURVE FOR IMPACT-DAMAGED SANDWICH PANEL UNDER COMPRESSIVE LOADS AND RANGE OF HOLE SIZES USED
The current program is intended to support the development of a full-scale test article to be tested under combined loading. To augment the full-scale test program of impact-damaged sandwich panels, tensile and compressive tests will be conducted to obtain the residual properties for selected open-hole configurations. The details of the test program, results, and observations are presented in this report. 2. TESTING OF SANDWICH PANELS WITH OPEN HOLES.
The behavior of sandwich panels with open holes in their facesheets, under in-plane tensile and compressive loads, was studied experimentally. The tests were conducted to assess the severity of open holes in one or both facesheets of a sandwich panel, relative to that of the impact damage in Sn ]CORE/)45/90[( sandwich panels [1]. The comparisons were made between the compressive residual strengths of impact-damaged sandwich panels and sandwich panels with open holes. Further, the strengths of open-hole sandwich specimens were compared between tensile and compressive loads to identify the critical loading mode. The sandwich panels were fabricated using Newport NB321/3K70P plain weave carbon fabric/epoxy prepreg for facesheets and Plascore PN2-3/16-3.0 Nomex honeycomb material of 0.75 inch thickness for the sandwich core. The facesheets were bonded to the core using Hysol 9628.060 PSF NW film adhesive and
2

cured using a cocure-cobond autoclave process reported in reference 1. The sandwich panels with a stacking sequence of S]CORE/)45/90[( n (n = 1, 2, and 3) were investigated. The geometric configurations of compression and tension test specimens are illustrated in figure 2. The compression test specimen is characterized by the width, w, height, h, and hole diameter, DHOLE. The tensile test specimen is characterized by the width, w, gage length, L, and hole diameter, DHOLE. The total length of the tensile coupon is longer than the gage length due to the load-introduction/tab region. The test matrix for open-hole compression testing of sandwich panels is summarized in table 1. The compression testing was conducted for sandwich configurations with n=1, 2, and 3. The differences in the behavior of panels with a hole in one facesheet and through holes were studied for hole diameters of 1 and 2 inches. The ratio of width to hole diameter,
HOLEDw , and the ratio of height to diameter,
HOLEDh , were maintained
above a value of 4, to minimize finite width and height effects. The finite width effects was investigated for S2 ]CORE/(90/45)[ sandwich panels with a hole diameter of 4 inches. A total of 16 compression tests were conducted.
h
w
h/2
w/2
D HOLE
L
L/2
WW/2
D HOLE
TENSION SPECIMEN
COMPRESSION SPECIMEN
LOADING DIRECTION
FIGURE 2. GEOMETRIC CONFIGURATIONS OF TENSION AND COMPRESSION COUPONS
The test matrix for tension testing of sandwich panels with holes is summarized in table 2. The tensile tests were conducted for S2 ]CORE/)45/90[( sandwich panels with hole diameters of 1, 2, and 4 inches. Both hole configurations, hole in single facesheet and through holes, were studied for all the three hole diameters mentioned above. Unlike the compression tests, the ratio of length to diameter,
HOLEDL , was set at 10. The finite width effects was investigated for
3

S2 ]CORE/)45/90[( sandwich panels with a hole diameter of 4 inches. A total of eight tension tests were conducted.
TABLE 1. TEST MATRIX FOR OPEN-HOLE COMPRESSION TESTS
Sandwich Type
Hole Diameter
2RHOLE (in.) Hole Type
Panel Width, w
(in.)
Panel Height, h
(in.)
Ratio
HOLERw
2
1.00 8.5 10.5 8.5 2.00 8.5 10.5 4.25 4.00
Single Facesheet
17 30.0 4.25 1.00 8.5 10.5 8.5
S]CORE/)45/90[(
2.00 Through
8.5 10.5 4.25 1.00 8.5 10.5 8.5 2.00 8.5 10.5 4.25 4.00 17 30.0 4.25 4.00
Single Facesheet
8.5 30.0 2.125 1.00 8.5 10.5 8.5
S2 ]CORE/)45/90[(
2.00 Through
8.5 10.5 4.25 1.00 8.5 10.5 8.5 2.00 8.5 10.5 4.25 4.00
Single Facesheet
17 30.0 4.25 1.00 8.5 10.5 8.5
S3 ]CORE/)45/90[(
2.00 Through
8.5 10.5 4.25
TABLE 2. TEST MATRIX FOR OPEN-HOLE TENSION TESTS
Sandwich Type
Hole Diameter
2RHOLE (in.) Hole Type
Panel Width, w
(in.)
Panel Length, L
(in.) Ratio
HOLERb
2
1.00 8.5 10 8.50 2.00 8.5 20 4.25 4.00 17 40 4.25 4.00
Single Facesheet
8.5 40 2.125 1.00 8.5 10 8.5 2.00 8.5 20 4.25 4.00 17 40 4.25
S2 ]CORE/)45/90[(
4.00
Through
8.5 40 2.125 The details of the test specimen preparation, instrumentation, test fixturing, test procedures, and results are discussed in the following sections.
4

2.1 SPECIMEN PREPARATION. The strength of sandwich specimens (and laminates) with open holes is influenced by the presence of damage introduced by the hole-drilling process. It is well known that composites are susceptible to delaminations during the drilling process. The use of conventional drilling tools (see figure 3(a) is not suitable for laminated composites, especially with larger hole diameters. The cutting action of the drill bit induces matrix cracking and delaminations in a localized region along the edge of the hole. Further, the lack of proper core-side support to the facesheets, due to the discontinuous nature of honeycomb cores, increases the propensity of drilling-induced damage. In an effort to minimize the machining-induced damage around the hole boundary, UKAM Industrial Super Hard Tools’ Universal Metal bond core drills were used. These core drills (shown in figure 3(b)) are tubes with a layer of fine diamonds embedded in a metal matrix along the cutting edge. Unlike the conventional drilling process, the core drill grind the material away instead of shearing the material. The typical hole-edge quality obtained using a core drill is illustrated in figure 4.
FINE DIAMOND ENCASED IN METAL MATRIX
FACESHEET
CORE
DRILL BIT DIAMOND COATED HOLE CUTTER
CORE
FACESHEET
(a) (b)
FIGURE 3. DRILLING WITH DIAMOND-COATED CORE DRILLS
HOLE EDGE
HONEYCOMB CORE DEBRIS
FACESHEET
FIGURE 4. TYPICAL HOLE-EDGE QUALITY IN A SANDWICH PANEL
5

2.2 COMPRESSION TESTING OF SANDWICH PANELS WITH OPEN HOLES. The sandwich panels with open holes identified in table 1 were subjected to in-plane compressive loading. The boundary conditions along the loading and vertical edges are illustrated in figure 5. The loading edges were constrained from out-of-plane displacements and rotations about the x axis, while the vertical edges were constrained from out-of-plane displacements using knife-edge supports. The in-plane loads were introduced by applying displacements along the loading edge as shown in figure 5. The test fixture used in the investigation is illustrated in figure 6. The fixture consists of a horizontal base, uprights, and an adjustable alignment platen. A 17-4 PH stainless steel plate is mounted on the base to facilitate edge loading of specimens. The uprights are fastened to the base and provide stabilizing support to the vertical edges of the specimen. The vertical support is provided by using knife edges that are fastened to the uprights. The horizontal base of the fixture was mounted on the actuator of a 110-kip MTS servo hydraulic load frame. The load alignment platen was fastened to the load cell, which was in-turn mounted on the fixed crosshead of the machine.
CLAMPING AREA
CLAMPING AREA
KNIFE EDGESUPPORT
δy - applied displacment
A A
B
B
SECTION BB
SECTION AA
H
w
X
y
z
y
FIGURE 5. BOUNDARY CONDITIONS IMPOSED ON COMPRESSION SPECIMENS
6

STEEL BASE PLATE
BASE
CLAMPING EDGE
KNIFE EDGE
CLAMPING EDGE
ALIGNMENT PLATEN
ACTUATOR ROD
LOAD CELL
UPRIGHT
FIGURE 6. SCHEMATIC OF COMPRESSION TEST FIXTURE USED IN THE STUDY The open-hole sandwich specimens were instrumented with strain gages to observe the strain distributions near the hole and the far-field strains. Micro Measurements’ CEA-00-250BG-120 series strain gages were mounted at various locations as shown in figures 7 and 8. The primary purpose of the four far-field strain gages (gages 1 through 4) was to ensure uniform load distribution between the two facesheets and across the width of the specimen. The specimens were preloaded to a maximum load of 1000 lb, and the alignment platen was adjusted to ensure that the far-field strain gages were within 10% of each other. The near-field strain gages were used to obtain a measure of the strain gradients due to the stress concentration at the hole boundary. It must be noted that the strain gages have an active grid dimension of 0.1 by 0.35 inch. The strain values measured by these gages are, thus, an average of the strain distribution over the area of the gage.
7

Y
X
All dimensions in INCHES
GAGE #1 [FRONT]GAGE #2 [BACK]
1.0
1.5
8.5
10.5
5.25
0.5
0.125
GAGE #5 Ød
GAGE #3 [FRONT]GAGE #4 [BACK]
GAGE #6
1.0
FIGURE 7. STRAIN GAGE LOCATIONS FOR COMPRESSION SPECIMENS WITH HOLE DIAMETERS OF 1 AND 2 INCHES
2
2
2
2
30
15
GAGE #6 GAGE #5
0.5
0.125
GAGE #1 [FRONT]GAGE #2 [BACK]
1.0
GAGE #7
GAGE #8
GAGE #9 (BACK)
GAGE #3 [FRONT]GAGE #4 [BACK]
6.375
Ø4
SEE NOTE (1)
All dimensions in INCHES
NOTES (1). FOR SINGLE FACESHEET HOLES ONLY
FIGURE 8. STRAIN GAGE LOCATIONS FOR COMPRESSION SPECIMENS WITH HOLE DIAMETER OF 4 INCHES
8

The compression tests were conducted under stroke control with a nominal stroke rate of 0.025 in/min. The test control and data acquisition was accomplished using MTS Basic Testware. The load, end shortening, and strain readings were recorded at a rate of 2 Hz until failure. The behavior of open-hole sandwich specimens was characterized by their load versus end shortening responses, failure strength and modes, and strain distributions across the critical (minimum) cross section. The load versus end shortening plots for the various sandwich configurations are plotted in figures 9 through 11. The sandwich specimens with open holes exhibited a linear behavior up to failure. The S2 ]CORE/)45/90[( sandwich panels exhibited some nonlinearity during the initial loading stages, which are attributed to the initial slack in the load train. Sandwich specimens with identical heights (for a given facesheet type) exhibited almost equal stiffness, irrespective of the hole diameter. The sandwich specimens with a 4-inch-diameter hole were observed to be less stiff, due to the larger specimen height.
0.000 0.025 0.050 0.075 0.100 0.125End Shortening δy(inches)
0
200
400
600
800
1000
Com
pres
sive
For
ce R
esul
tant
Nyy
(lbf
/in)
[90/45/ CORE]S PANELSD=1" (SINGLE) W =8.5";H=10.5"D=1" (THROUGH) W =8.5";H=10.5"D=2" (SINGLE) W =8.5";H=10.5"D=2" (THROUGH) W =8.5";H=10.5"D=4" (SINGLE) W =17";H=30"
FIGURE 9. LOAD VERSUS END SHORTENING PLOTS FOR
S]CORE/)45/90[( SANDWICH PANELS The effects of the presence of a hole in the sandwich panels on the compressive response is better illustrated using the strain readings recorded during the tests. The strain gage readings are plotted against the compressive load for a S]CORE/)45/90[( sandwich specimen with a 1-inch-diameter hole in a single facesheet, as shown in figure 12. Similar to the load end shortening plots, the far-field strain response exhibits a linear behavior up to failure. But the strain gages close to the hole boundary along the minimum section exhibit a slight nonlinearity along with jumps in strain, indicating initiation/propagation of failure in the facesheets. The load-strain plots for individual specimens can be found in appendix A.
9

0.000 0.025 0.050 0.075 0.100 0.125End Shortening δy(inches)
0
400
800
1200
1600
2000C
ompr
essi
ve F
orce
Res
ulta
nt N
yy (l
bf/in
)
[(90/45)2/ CORE]S PANELSD=1" (SINGLE) W =8.5";H=10.5"D=1" (THROUGH) W =8.5";H=10.5"D=2" (SINGLE) W =8.5";H=10.5"D=2" (THROUGH) W =8.5";H=10.5"D=4" (SINGLE) W =17";H=30"D=4" (SINGLE) W =8.5";H=30"
FIGURE 10. LOAD VERSUS END SHORTENING PLOTS FOR
S2 ]CORE/)45/90[( SANDWICH PANELS
0.000 0.025 0.050 0.075 0.100 0.125End Shortening δy(inches)
0
1000
2000
3000
Com
pres
sive
For
ce R
esul
tant
Nyy
(lbf
/in)
[(90/45)3/ CORE]s PANELSD=1" (SINGLE) W =8.5";H=10.5"D=1" (THROUGH) W =8.5";H=10.5"D=2" (SINGLE) W =8.5";H=10.5"D=2" (THROUGH) W =8.5";H=10.5"D=4" (SINGLE) W =17";H=30"
FIGURE 11. LOAD VERSUS END SHORTENING PLOTS FOR
S3 ]CORE/)45/90[( SANDWICH PANELS
10

0 2000 4000 6000 8000 10000Compressive Strain εyy (μstrain)
0
200
400
600
800
Com
pres
sive
Loa
d R
esul
tant
Nyy
(lbf
/in)
[90/45/ CORE]S PANELHOLE DIAMETER : 1.00 inchHOLE TYPE : SINGLE FACESHEET
STRAIN GAGE #1STRAIN GAGE #2STRAIN GAGE #3STRAIN GAGE #4STRAIN GAGE #5STRAIN GAGE #6
10.5
8.5
Ø1
1.5
0.11.0
1.0 1.0
5.25
GAGE #1 [FRONT]GAGE #2 [BACK]
GAGE #3 [FRONT]GAGE #4 [BACK]
GAGE #5 GAGE #6
FIGURE 12. LOAD VERSUS STRAIN FOR S]CORE/)45/90[( SANDWICH SPECIMEN WITH 1-inch-DIAMETER HOLE IN A SINGLE FACESHEET
2.2.1 Compression Test Results.
The results from the compression testing of sandwich panels are summarized in table 3. The residual strengths are characterized in terms of the failure load, average far-field strains at failure, and the near-field (x=R+0.125; y=0) strain at failure. It must be noted that the near-field strain at failure are not necessarily the maximum strain reached at those locations, unless the facesheet fracture path cuts across the strain gage. The compressive strengths are plotted as a function of hole diameter for the three sandwich configurations in figure 13. The compressive strengths were observed to decrease as the hole diameter increases, except for the 4-inch-diameter hole case, which tended to have higher strengths. The compressive strengths of sandwich panels with holes in a single facesheet were consistently higher than the through hole panels. This difference was more pronounced in sandwich panels with thicker facesheets. The average far-field strain values at failure are plotted against hole diameter in figure 14. The failure strains were slightly higher for sandwich specimens with thinner facesheets. The failure strains, however, did not exhibit any correlation with the hole diameter particularly for single sheet holes. This is explained by the change of failure made with increase in hole diameter from through-the-hole failure to dimple propagation. This is caused by inward bending of the undamaged backside facesheet, which relieves the compressive stress concentration.
11

TAB
LE 3
. SU
MM
AR
Y O
F C
OM
PRES
SIO
N T
EST
RES
ULT
S
Sand
wic
h C
onfig
urat
ion
Hol
e D
iam
eter
2R
HO
LE
(in.)
Hol
e Ty
pe
Spec
imen
W
idth
, w
(in.)
2RH
OLE
/w
Hei
ght,
h (in
.)
Failu
re
Load
, Nyy
(lbf/i
n.)
Ave
rage
Far
-Fi
eld
Stra
in a
t Fa
ilure
(M
icro
stra
in)
ε yy(
R+0
.125
,0)
at F
ailu
re
(Mic
rost
rain
) N
one
N/A
8.
5 0.
00
10.5
14
00
6868
N
/A
1.0
8.5
0.12
10
.5
607
3508
68
60 (8
283)
2.
0 8.
5 0.
24
10.5
55
8 39
58
4068
(651
30
4.0
Sing
le
Face
shee
t 17
0.
24
30.0
66
5 38
58
1179
(680
4)
1.0
8.5
0.12
10
.5
604
2700
41
37 (9
983)
S]C
OR
E/)
45/90[(
2.0
Thro
ugh
8.5
0.24
10
.5
496
3070
38
17 (6
712)
N
one
8.
5 0.
00
10.5
28
80
6324
N
/A
1.0
8.5
0.12
10
.5
1136
36
68
2653
(706
9)
2.0
8.5
0.24
10
.5
973
2854
74
20
4.0
8.5
0.47
10
.5
1060
26
26
9975
4.
0
Sing
le
Face
shee
t
17
0.24
30
.0
1142
33
46
4731
(603
4)
1.0
8.5
0.12
10
.5
1234
32
76
6707
S2
]C
OR
E/
)45/
90[(
2.0
Thro
ugh
8.5
0.24
10
.5
882
2731
61
45 (6
504)
N
one
N/A
8.
5 0.
00
10.5
39
70
6512
N
/A
1.0
8.5
0.12
10
.5
1959
34
82
7016
2.
0 8.
5 0.
24
10.5
18
89
3707
81
74
4.0
Sing
le
Face
shee
t 17
0.
24
30.0
15
40
2670
34
42 (4
954)
1.
0 8.
5 0.
12
10.5
17
57
3082
63
24
S3
]C
OR
E/
)45/
90[(
2.0
Thro
ugh
8.5
0.24
10
.5
1414
29
72
7132
12
Not
e: N
umbe
rs in
par
enth
eses
indi
cate
max
imum
val
ue o
f stra
ins a
ttain
ed p
rior t
o fa
ilure
.

0 1 2 3 4 5HOLE DIAMETER 2RHOLE (inches)
0
1000
2000
3000
4000C
OM
PR
ES
SIV
E S
TRE
NG
TH N
YY (l
bf/in
)
SANDWICH / HOLE TYPE[(90/45)/ CORE]S / Single
[(90/45)/ CORE]S / Through
[(90/45)2/ CORE]S / Single
[(90/45)2/ CORE]S / Through
[(90/45)3/ CORE]S / Single
[(90/45)3/ CORE]S / Through
FIGURE 13. COMPRESSION STRENGTH OF SANDWICH PANELS WITH OPEN HOLES
0 1 2 3 4 5HOLE DIAMETER 2RHOLE (inches)
0
2000
4000
6000
8000
10000
AVE
RAG
E FA
R-F
IELD
STR
AIN
AT
FAIL
UR
E ε
YY (m
icro
stra
in)
SANDWICH / HOLE TYPE[(90/45)/ CORE]S / Single
[(90/45)/ CORE]S / Through
[(90/45)2/ CORE]S / Single
[(90/45)2/ CORE]S / Through
[(90/45)3/ CORE]S / Single
[(90/45)3/ CORE]S / Through
FIGURE 14. AVERAGE FAR-FIELD STRAINS IN SANDWICH PANELS WITH OPEN HOLES SUBJECTED TO COMPRESSION LOADING
13

2.2.2 Failure Modes.
The final failure modes in sandwich panels with open holes were observed to be dependent on the facesheet thickness, hole diameter, and the hole type. The typical failure mode in quasi-isotropic laminates with open holes under in-plane loading is a net section fracture. In the present investigation, three types of failure modes were observed and are described below. The failure modes observed for individual specimens are summarized in table 4. a. MODE A—The first failure mode was a facesheet fracture across the width. For panels
with holes, the fracture began at the hole boundary and traveled outwards. It was observed that the facesheet fracture did not initiate at the location of the hole boundary corresponding to the minimum cross section, but was offset by an angle ranging between 5 and 20, as illustrated in figure 15. This kind of failure mode was common to all sandwich configurations with through holes.
b. MODE B—This failure mode was observed for sandwich panels with 1- and 2-inch-
diameter holes in a single facesheet. The facesheet with hole fractured similar to mode A. After the fracture of the facesheet with hole, the load transfer occurred through the backside facesheet, resulting in a bucking failure of the backside facesheet as illustrated in figure 16. Bulging of backside facesheet was observed for these sandwich panels at failure.
c. MODE C—This failure mode was observed in sandwich panels with 4-inch-diameter
holes in a single facesheet. Upon loading of the sandwich panels, the unsupported (in the region of the hole) backside facesheet started to bend inwards forming a dimple. As the loading increased, the dimple amplitude in the backside facesheet increased, and promoted outward bulging of the front facesheet (facesheet with hole), in a localized region, as illustrated in figure 17. This resulted in a localized buckling mode where the dimple in the backside facesheet propagated in an unstable manner resulting in loss of load-carrying capability. The outward bulging of the front facesheet relieved the strain concentration at the edge of the hole. Thus, no facesheet fracture was observed for these sandwich configurations.
θ
FRONT BACK
θ
FRACTURE
FIGURE 15. FAILURE MODE IN SANDWICH PANELS WITH THROUGH HOLES
14

OUTWARD BUCKLING
FRONT BACK
FIGURE 16. FAILURE MODE IN SANDWICH PANELS WITH A HOLE IN A SINGLE FACESHEET
OUTWARD BULGING
BULGING PROPAGATION
DIMPLE FORMATION (INWARD BENDING)
DIMPLE GROWS IN AMPLITUDE
UNSTABLE DIMPLE PROAGATION
FRONT FRONT FRONT
BACK BACK BACK
INCREASING LOAD
FIGURE 17. OBSERVED FAILURE MODE IN SANDWICH PANELS WITH 4-inch-DIAMETER HOLE IN A SINGLE FACESHEET
15

TABLE 4. SUMMARY OF COMPRESSION FAILURE MODES IN SANDWICH PANELS
Sandwich Configuration
Hole Diameter 2RHOLE
(in.) Hole Type
Specimen Width, w
(in.)
Observed Failure Mode
None N/A 8.5 A 1 8.5 B 2 8.5 B 4
Single Facesheet
17 C 1 8.5 A
S]CORE/)45/90[(
2 Through
8.5 A None 8.5 A
1 8.5 B 2 8.5 B 4 8.5 C 4
Single Facesheet
17 C 1 8.5 A
S2 ]CORE/)45/90[(
2 Through
8.5 A None N/A 8.5 A
1 8.5 B 2 8.5 B 4
Single Facesheet
17 C 1 8.5 A
S3 ]CORE/)45/90[(
2 Through
8.5 A 2.3 TENSION TESTS OF S2 ]CORE/)45/90[( SANDWICH PANELS WITH OPEN HOLES.
The in-plane tension tests of S2 ]CORE/)45/90[( sandwich panels with open holes was conducted to study the differences in the strengths, strain distributions, and failure modes compared with in-plane compressive loading. The loads were introduced into the specimen using a whiffle tree arrangement illustrated in figures 18 and 19. The whiffle tree mechanism consists of two outer beams and an inner beam that are attached to the clevis block using a pin. A set of slider blocks ride the beams one either side of the clevis as shown in figure 19. The slider blocks can be positioned appropriately, and fastened to the beams, to load specimens of different widths. A pair of half-load links is then attached to the slider blocks using a pin. The half-load links are further attached to the triangular links, which in turn are fastened to the specimen attachment leaves. The load is divided into four equal portions along the width of the specimen due to the whiffle tree arrangement. The whiffle tree mechanisms on opposite ends of the specimen were fastened to the load cell and the actuator through a clevis pin attachment to eliminate any bending moments.
16

SPECIM EN
ATTACHM ENT LEAVES
M AIN BEAM (S)
CLEVIS
FIGURE 18. WHIFFLE TREE MECHANISM USED FOR TENSION LOADING OF SANDWICH SPECIMENS
The sandwich specimens with open holes were instrumented with strain gages at different locations, as shown in figure 20. The far-field strain gages were used to ensure uniform load distribution across the width and between the two facesheets. The near-field strain gages were used to obtain a measure of the strain distribution along the minimum cross section because of the strain concentration due to the presence of the hole. The strain gage on the back facesheet in sandwich specimens with holes in a single facesheet was intended to get a measure of the load transfer through the facesheet.
17

FIGURE 19. DETAILS OF WHIFFLE TREE MECHANISM
CLEVIS P
P/4 P/4 P/4 P/4
HALF LOAD LINK
OUTER BEAM
SPECIMEN ATTACHMENT LEAF
TRIANGULAR DISTRIBUTOR LINK
INNER BEAM
SLIDER BLOCK
18

2
GAGE #7
6.375
GAGE #8
0.51.0
0.125
GAGE #5 GAGE #6
GAGE #1 [FRONT]GAGE #2 [BACK]
GAGE #3 [FRONT]GAGE #4 [BACK]
GAGE #9
GAGE #10 (BACK)SEE NOTE (1)
All dimensions in INCHES NOTES (1). FOR SINGLE FACESHEET HOLES ONLY
2
20
40Ø4.00
FIGURE 20. STRAIN GAGE LOCATION FOR OPEN-HOLE TENSION SPECIMENS
The tension specimens were tested using a 110-kip capacity MTS servo hydraulic testing machine. The tests were conducted under stroke control at a constant stroke rate of 0.025 in/min. The test control and data acquisition was accomplished using MTS Basic Testware. The test set up for a typical sandwich specimen mounted on the MTS machine is illustrated in figure 21. The sandwich specimens with open holes were loaded continuously until failure, and the load, actuator displacement, and strain gage readings were recorded continuously at a rate of 5 Hz. The load versus actuator displacement plots for sandwich specimens with different hole diameters is shown in figures 22 through 25. It was observed that the sandwich specimens with holes in a single facesheet were marginally stiffer compared to the specimens with through holes of the same diameter. This indicates that the presence of an undamaged (uncut) facesheet contributes marginally to the global stiffness of the sandwich panel. However, the presence of an additional load path contributed to higher strengths when compared to the through hole specimens.
19

FIGURE 21. SANDWICH SPECIMEN MOUNTED ON THE MTS LOAD FRAME FOR TENSION TESTING
0 0.04 0.08 0.12 0.16 0.2Actuator displacment δ (inches)
0
1000
2000
3000
Tens
ile L
oad
Res
ulta
nt N
yy (l
bf/in
)
[(90/45)2/ CORE]S PANELSLength : 10 inchesWidth : 8.5 inchesHole Diameter : 1 inch
HOLE TYPESingle FacesheetThrough Hole
FIGURE 22. LOAD-DISPLACEMENT PLOTS FOR SANDWICH SPECIMEN WITH 1-inch-DIAMETER HOLES UNDER IN-PLANE TENSION
20

0 0.04 0.08 0.12 0.16 0.2Actuator displacment δ (inches)
0
1000
2000
3000
Tens
ile L
oad
Res
ulta
nt N
yy (l
bf/in
)
[(90/45)2/ CORE]S PANELSLength : 16 inchesWidth : 8.5 inchesHole Diameter : 2 inches
HOLE TYPESingle FacesheetThrough Hole
FIGURE 23. LOAD-DISPLACEMENT PLOTS FOR SANDWICH SPECIMEN WITH 2-inch-DIAMETER HOLES UNDER IN-PLANE TENSION
0 0.1 0.2 0.3 0.4 0.5Actuator displacment δ (inches)
0
1000
2000
3000
Tens
ile L
oad
Res
ulta
nt N
yy (l
bf/in
)
[(90/45)2/ CORE]S PANELSLength : 40 inchesWidth : 17 inchesHole Diameter : 4 inches
HOLE TYPESingle FacesheetThrough Hole
FIGURE 24. LOAD-DISPLACEMENT PLOTS FOR SANDWICH SPECIMEN WITH 4-inch-DIAMETER HOLES AND A WIDTH OF 17 INCHES UNDER IN-PLANE TENSION
21

0 0.1 0.2 0.3 0.4Actuator displacment δ (inches)
0
1000
2000
3000
Tens
ile L
oad
Res
ulta
nt N
yy (l
bf/in
)
[(90/45)2/ CORE]S PANELSLength : 30 inchesWidth : 8.5 inchesHole Diameter : 4 inches
HOLE TYPESingle FacesheetThrough Hole
FIGURE 25. LOAD-DISPLACEMENT PLOTS FOR SANDWICH SPECIMEN WITH 4-inch-DIAMETER HOLES AND A WIDTH OF 8.5 INCHES UNDER IN-PLANE TENSION
The typical load versus strain plot for a sandwich panel is illustrated in figure 26. The far-field strain gages (gages 1 through 4) were almost identical up to failure, indicating an even distribution of load. The strain concentration due to the presence of the hole is picked up by strain gages 5 through 7. Strain gage 10, which is mounted transverse to the loading direction at the hole boundary (see figure 20), indicates compressive strains in the facesheet due to the Poisson effect. The compressive strains, however, were not high enough to induce localized facesheet buckling. The load versus strain plots for other tension specimens can be found in appendix B. The results from the sandwich panel tension tests are summarized in table 5. The residual properties are characterized in terms of the failure load, average far-field strains at failure, and the near-field (x=R+0.125; y=0) strain at failure. The tensile strengths are plotted as a function of hole diameter in figure 27. The tensile strengths were observed to decrease as the hole diameter increases. The tensile strengths of sandwich panels with holes in a single facesheet were marginally higher than the through hole panels. The average far-field strain values at failure are plotted against hole diameter in figure 28. The failure strains exhibit the same trends as the strength, decreasing with increasing hole diameter.
22

-4000 0 4000 8000 12000 16000Measured Strain ε (microstrain)
0
1000
2000
3000
Tens
ile L
oad
Res
ulta
nt N
yy (l
bf/in
)
[(90/45)2/ CORE]S PANELSLength : 40 inchesWidth : 17 inchesHole Diameter : 4 inches (single facesheet)
STRAIN GAGE I.D.STRAIN GAGE #1STRAIN GAGE #2STRAIN GAGE #3STRAIN GAGE #4STRAIN GAGE #5STRAIN GAGE #6STRAIN GAGE #7STRAIN GAGE #8STRAIN GAGE #9STRAIN GAGE #10
FIGURE 26. LOAD-STRAIN PLOTS FOR SANDWICH SPECIMEN WITH 4-inch-DIAMETER HOLE IN A SINGLE FACESHEET UNDER IN-PLANE TENSION
TABLE 5. SUMMARY OF TENSION TEST RESULTS
Hole Diameter 2RHOLE
(in.) Hole Type
Specimen Width, w
(in.) 2RHOLE/w
Gage Length, h
(in.)
Failure Load, Nyy
(lbf/in)
Average Far-Field Strain at Failure
(Microstrain)
εyy(R+0.125,0) at Failure
(Microstrain)
None N/A 1.0 N/A 12.0 4770.00 13000 N/A
1 8.5 0.12 10.5 2614.00 6573 12570
2 8.5 0.24 20.0 2362.00 5954 11972
4 17.0 0.24 40.0 2252.32 5507 11981
4
Single Facesheet
8.5 0.47 40.0 2072.57 5141 12635
1 8.5 0.12 10.5 2352.90 6445 39853*
2 8.5 0.24 20.0 2230.00 5534 13079
4 17.0 0.24 40.0 1976.47 4968 12024
4
Through
8.5 0.47 40.0 1494.00 3746 11147
*Facesheet cracking initiated prior to final failure, passed through gage at x=R+0.125 inch
23

0 1 2 3 4 5HOLE DIAMETER 2RHOLE (inches)
0
1000
2000
3000
4000
5000
TEN
SIL
E S
TRE
NG
TH N
yy (l
bf/in
)
[(90/45)2/ CORE]S PANELS
HOLE TYPESINGLE FACESHEETTHROUGHNONE
FIGURE 27. TENSILE STRENGTH OF SANDWICH PANELS WITH OPEN HOLES
0 1 2 3 4 5HOLE DIAMETER 2RHOLE (inches)
0
4000
8000
12000
16000
AV
ER
AG
E F
AR
-FIE
LD S
TRAI
N
AT
FAIL
UR
E ε
yy (m
icro
stra
in)
[(90/45)2/ CORE]S PANELS
HOLE TYPESINGLE FACESHEETTHROUGHNONE
FIGURE 28. AVERAGE FAR-FIELD STRAINS IN SANDWICH PANELS WITH OPEN HOLES SUBJECTED TO TENSILE LOADING
24

2.4 COMPARISON BETWEEN TENSION AND COMPRESSION RESULTS FOR
S2 ]CORE/)45/90[( PANELS.
The tension and compression properties of S2 ]CORE/)45/90[( sandwich panels were compared to highlight the differences between the two loading scenarios. The strength of panels with open holes under tensile and compressive loads are compared in figure 29. The tensile strength of the panel was observed to be higher than the compression strength for all hole diameters investigated. The unnotched tensile strength itself was, however, higher than the compressive strength. The normalized plot of strengths as a function of hole diameter (see figure 30) indicates that the strength reduction is higher in compression for hole sizes other than 4 inches. The data points corresponding to compressive loading of specimens with 4-inch-diameter holes must however be interpreted with caution due to the change in failure mode. In the absence of facesheet bulging, which relieved the strain concentration, the strength of these specimens would have been lower than that observed during the tests. The experimental results thus indicate that the in-plane compressive loading dictates the strength of sandwich panels with open holes.
0 1 2 3 4 5HOLE DIAMETER 2RHOLE (inches)
0
1000
2000
3000
4000
5000
STR
EN
GTH
|N
yy| (
lbf/i
n)
[(90/45)2/ CORE]S PANELS
HOLE TYPE / LOADINGSINGLE FACESHEET / TENSIONTHROUGH / TENSIONNONE / TENSIONSINGLE FACESHEET / COMPRESSIONTHROUGH / COMPRESSIONNONE / COMPRESSION
FIGURE 29. COMPARISON OF TENSION AND COMPRESSIVE STRENGTHS OF SANDWICH PANELS WITH OPEN HOLES
25

0 1 2 3 4 5HOLE DIAMETER 2RHOLE (inches)
0
0.2
0.4
0.6
0.8
1
NO
RM
ALI
ZED
STR
EN
GTH
[(90/45)2/ CORE]S PANELS
HOLE TYPE / LOADINGSINGLE FACESHEET / TENSIONTHROUGH / TENSIONNONE / TENSIONSINGLE FACESHEET / COMPRESSIONTHROUGH / COMPRESSIONNONE / COMPRESSION
FIGURE 30. COMPARISON OF NORMALIZED TENSILE AND COMPRESSIVE STRENGTHS OF SANDWICH PANELS WITH OPEN HOLES
2.5 COMPARISON WITH IMPACT TEST DATA. The compressive strengths of sandwich panels with open holes are compared to sandwich panels with low-velocity impact-damage [1]. The normalized residual strengths of impact-damaged
S]CORE/)45/90[( sandwich panels are compared with the open hole specimens in figure 31. Whitney-Nuissmer average stress criterion-based [4] residual strength degradation curves are generated and plotted for the open hole data in the same figure. It can be seen that the impact damage data tends to approach the residual strengths corresponding to open hole specimens, as the impact damage diameter and the residual indentation depth increase. The residual indentation depths are illustrated using pointers whose lengths are proportional to the indentation depth. Similar trends were observed for S2 ]CORE/)45/90[( and S3 ]CORE/)45/90[( sandwich panels and are illustrated in figures 32 and 33, respectively. The open-hole data (for specimens with holes in one facesheet) for all sandwich configurations is compared with the impact damage data in figure 34. The open-hole data forms a lower bound on the residual properties of sandwich panels with a given planar damage size. It must be noted that the asymptotic open hole strength will be lower than that presented in the figure e as the open hole strengths corresponding to 4-inch-diameter hole were influenced by change in failure mechanism. All the data in figures 31 through 34 are for the Newport material systems.
26

0 1 2 3 4 5DAMAGE DIAMETER 2Rdamage (in)
0.0
0.2
0.4
0.6
0.8
1.0
1.2
NO
RM
ALI
ZED
RE
SID
UA
L C
OM
PR
ES
SIV
E S
TRE
NG
TH
[(90/45) /CORE]S Sandwich Panels
Open Hole (Single Facesheet) Open Hole (Through hole)Impact Damage (1" Impactor)Impact Damage (3" Impactor)Relative dent depthMinimum : 0.013"Maximum : 0.233"
IN-PLANE COMPRESSION
Whitney-Nuissmer Average Stress Criterion ao = 0.1989 in
Whitney-Nuissmer Average Stress Criterion ao = 0.121 in
FIGURE 31. COMPARISON OF OPEN-HOLE AND IMPACT-DAMAGED SANDWICH PANELS WITH TWO-PLY FACESHEETS
0 1 2 3 4 5DAMAGE DIAMETER 2Rdamage (in)
0.0
0.2
0.4
0.6
0.8
1.0
1.2
NO
RM
ALI
ZED
RE
SID
UA
L C
OM
PR
ES
SIV
E S
TRE
NG
TH
[(90/45)2/CORE]S Sandwich Panels
Open Hole (Single Facesheet) Open Hole (Through hole)Impact Damage (1" Impactor)Impact Damage (3" Impactor)Relative dent depthMinimum : 0.003"Maximum : 0.218"
FAILURE INITIATEDBY BACK FACESHEET BUCKLING
IN-PLANE COMPRESSION
Whitney-Nuissmer Average Stress Criterion ao = 0.0845 in
w/2Rdamage = 2.125
w/2Rdamage = 4.25
FIGURE 32. COMPARISON OF OPEN-HOLE AND IMPACT-DAMAGED SANDWICH PANELS WITH FOUR-PLY FACESHEETS
27

0 1 2 3 4 5DAMAGE DIAMETER 2Rdamage (in)
0.0
0.2
0.4
0.6
0.8
1.0
1.2
NO
RM
ALI
ZED
RE
SID
UA
L C
OM
PR
ES
SIV
E S
TRE
NG
TH
[(90/45)3/CORE]S Sandwich Panels
Open Hole (Single Facesheet) Open Hole (Through hole)Impact Damage (1" Impactor)Impact Damage (3" Impactor)Relative dent depthMinimum : 0.003"Maximum : 0.116"
FAILURE INITIATEDBY BACK FACESHEET BUCKLING
THROUGH-HOLE
IN-PLANE COMPRESSION
Whitney-Nuissmer Average Stress Criterion ao = 0.307 in
Whitney-Nuissmer Average Stress Criterion ao = 0.271 in
FIGURE 33. COMPARISON OF OPEN-HOLE AND IMPACT-DAMAGED SANDWICH PANELS WITH SIX-PLY FACESHEETS
0 1 2 3 4 5 6PLANAR DAMAGE DIAMETER 2RDAMAGE (INCHES)
0
0.2
0.4
0.6
0.8
1
1.2
NO
RM
ALI
ZED
RE
SID
UA
L C
OM
PR
ES
SIV
E S
TRE
NG
TH
OPEN HOLE Whitney-Nuissmer average stress criterionao = 0.15"
IMPACT DATA [Newport]IMPACT DATA [Toray]
The size of the circles corresponding to the open hole data indicate the facesheet thickness. The smallest correponds to2 plies and the largest corresponds to 6 plies.
FIGURE 34. COMPARISON OF COMBINED OPEN-HOLE DATA WITH IMPACT DAMAGE DATA
28

3. IMPACT DAMAGE TOLERANCE OF SANDWICH PANELS WITH TORAY FACESHEETS.
The damage resistance and tolerance of sandwich panels with facesheets fabricated using Toray P707AG-15 Unitape/epoxy and Toray T700S-12K plain weave fabric/epoxy systems were investigated. The objective of this investigation was to determine the effects of material systems, if any, on the residual strength degradation under in-plane compressive loads. This exercise was aimed at strengthening the observations and conclusions drawn using Newport NB321/3K70 plain weave fabric/epoxy material for sandwich facesheets [1]. Three different facesheet configurations were used in this study: SFF ]CORE/)90/45[( ,
SFTTF ]CORE/)45/0/0/45[( , and SFTTFTTF ]CORE/45/0/0/45/0/0/45[ . Plascore PN2-3/16-3.0 Nomex® honeycomb material of nominal density 3.0 lb/ft3, nominal cell size of 3/16 and 0.375 inch thickness was used for the honeycomb core. The sandwich specimens were impacted using a 3-inch spherical steel impactor with nominal impact energy levels of 57, 98, 149, and 255 in-lb. The impact tests were conducted at a constant impact velocity of 96.6 in/sec. The sandwich specimens were clamped between picture frame supports with a test section of 8.0 by 8.0 inches as reported in reference 1. The impacted sandwich panels were then inspected for damage using nondestructive inspection (NDI) methods. The impact damage was quantified in terms of a planar damage diameter 2RDAMAGE, which was obtained using through transmission ultrasonic C-scan method, and the maximum residual indentation depth ΔRMAX, which was measured using a depth gage as reported in reference 1. The planar damage diameter in sandwich panels are plotted as a function of impact energy for the aforementioned three sandwich configurations in figure 35. The planar damage diameter was observed to increase with impact energy level and was lower for sandwich specimens with thicker facesheets at the energy levels investigated. A sharp increase in damage diameter for the SFF ]CORE/)90/45[( sandwich panel at an impact energy level of 255 in-lb corresponds to facesheet fracture. Similar trends were observed for the maximum residual indentation depth as shown in figure 36. The maximum residual indentation depths are plotted against the corresponding planar damage area in figure 37. The residual indentation depth tends to saturate with planar damage area. It should be noted that the residual indentation depths are less than the facesheet thickness for SFTTF ]CORE/)45/0/0/45[( , and
SFTTFTTF ]CORE/45/0/0/45/0/0/45[ sandwich panels and would be difficult to detect visually during field inspections.
29

0 100 200 300Nominal impact energy E IMP [lb-in]
0
1
2
3
4
5
TTU
C-S
can
Pla
nar D
amag
e D
iam
eter
2R
DAM
AGE
[in]
FACESHEET MATERIALS T: Toray P707AG-15 unitape/epoxy F : Toray T700S-12k PWCF/Epoxy
CORE: Plascore PN2-3/16-3.0CORE THICKNESS : 0.375 inchesIMPACTOR DIAMETER: 3.00 inches
SANDWICH CONFIGURATION[45F/0F/ CORE]S
[45F/0T/0T/45F/ CORE]S[45F/0T/0T/45F/0T/0T/45F/ CORE]S
FIGURE 35. PLANAR DAMAGE DIAMETER IN SANDWICH PANELS IMPACTED WITH
DIFFERENT ENERGY LEVELS
0 100 200 300Nominal impact energy E IMP [lb-in]
0
0.016
0.032
0.048
Max
imum
Res
idua
l Ind
enta
tion
Dep
th Δ
RM
AX [i
n]
FACESHEET MATERIALS T: Toray P707AG-15 unitape/epoxy F : Toray T700S-12k PWCF/Epoxy
CORE: Plascore PN2-3/16-3.0CORE THICKNESS : 0.375 inchesIMPACTOR DIAMETER: 3.00 inches
SANDWICH CONFIGURATION[45F/0F/ CORE]S
[45F/0T/0T/45F/ CORE]S[45F/0T/0T/45F/0T/0T/45F/ CORE]S
FIGURE 36. MAXIMUM RESIDUAL INDENTATION DEPTH IN SANDWICH PANELS IMPACTED WITH DIFFERENT ENERGY LEVELS
30

4 8 12 16 20
Planar Damage Area π(Rdamage)2 [in2]
0
0.016
0.032
0.048
Max
imum
Res
idua
l Ind
enta
tion
Dep
th Δ
RM
AX [i
n]
FACESHEET MATERIALS T: Toray P707AG-15 unitape/epoxy F : Toray T700S-12k PWCF/Epoxy
CORE: Plascore PN2-3/16-3.0CORE THICKNESS : 0.375 inchesIMPACTOR DIAMETER: 3.00 inches
SANDWICH CONFIGURATION[45F/0F/ CORE]S[45F/0T/0T/45F/ CORE]S[45F/0T/0T/45F/0T/0T/45F/ CORE]S
FIGURE 37. RESIDUAL INDENTATION DEPTH VERSUS PLANAR DAMAGE DIAMETER FOR SANDWICH PANELS
The sandwich specimens were subjected to in-plane compressive loads to measure the residual compressive strength. The test fixturing and boundary conditions were similar to those discussed in section 2.2. The residual compressive strength is plotted as a function of planar damage diameter in figure 38. The compressive strengths appear to decrease almost linearly with the damage diameter for all three sandwich configurations. The sandwich specimens with damage diameters greater than 1 inch failed due to unstable dimple propagation across the width of the panel, resulting in buckling failure of the sandwich panel [1]. The residual strengths were further normalized with respect to the virgin panel strengths and are plotted against the planar damage diameter in figure 39. The normalized residual strengths followed trends similar to those reported in reference 1. A 60% reduction in compressive strength was observed for
SFTTF ]CORE/)45/0/0/45[( sandwich panels. It should be noted that the low residual strengths may be due to the thinner cores that allow the dimple to perturb the undamaged facesheet, triggering a global buckling mode. It should be noted that panels with thicker facesheets had 0° layers instead of 90° layers, resulting in a stiffer panel. This resulted in lower residual strengths as compared to panels in reference 1.
31

0 1 2 3 4 5TTU C-Scan Planar Damage Diameter 2Rdamage (in)
0
1000
2000
3000
4000
CAI
Stre
ngth
Nyy
CAI
(lbf
/in)
FACESHEET MATERIALS F: TORAY T700S-12K PWCF T: TORAY T707AG-15 UNITAPECORE : Plascore PN2-3/16-3.0CORE THICKNESS : 0.375 inches
SANDWICH CONFIGURATION[90F/45F/CORE]S[45F/0T/0T/45F/CORE]S[45F/0T/0T/45F/0T/0T/45F/CORE]S
FIGURE 38. COMPRESSION-AFTER-IMPACT STRENGTH VERSUS PLANAR DAMAGE DIAMETER FOR SANDWICH PANELS FABRICATED USING TORAY
MATERIAL FOR FACESHEETS
0 1 2 3 4 5TTU C-Scan Planar Damage Diameter 2Rdamage (in)
0
0.4
0.8
1.2
Nor
mal
ized
CA
I Stre
ngth
FACESHEET MATERIALS F: TORAY T700S-12K PWCF T: TORAY T707AG-15 UNITAPECORE : Plascore PN2-3/16-3.0CORE THICKNESS : 0.375 inches
SANDWICH CONFIGURATION[90F/45F/CORE]S[45F/0T/0T/45F/CORE]S[45F/0T/0T/45F/0T/0T/45F/CORE]SCURVE FIT (ALL DATA)
FIGURE 39. NORMALIZED COMPRESSION-AFTER-IMPACT STRENGTH VERSUS PLANAR DAMAGE DIAMETER FOR SANDWICH PANELS FABRICATED USING
TORAY MATERIAL FOR FACESHEETS
32

The normalized residual strengths of sandwich panels with facesheets fabricated using Toray material with similar facesheet configurations are compared with the sandwich panels reported in reference 1. As shown, the data for the two materials lay on top of each other.
0 1 2 3 4 5 6
TTU C-Scan Planar Damage Diameter 2Rdamage (in)
0
0.2
0.4
0.6
0.8
1
1.2N
orm
aliz
ed C
AI S
treng
th
Newport [(90/45)n/ CORE]S (1" impactor)
Newport [(90/45)n/ CORE]S (3" impactor)
TORAY [90F/45F/CORE]S
Strength Degradation Curve for Newport Material NCAI = f(2Rdamage)
FIGURE 40. COMPARISON OF RESIDUAL STRENGTH OF IMPACT-DAMAGED SANDWICH PANELS WITH FACESHEETS FABRICATED USING TORAY AND
NEWPORT MATERIALS 4. CONCLUSIONS.
The behavior of sandwich panels with open holes subjected to in-plane tensile and compressive loads were investigated experimentally. The objective of this study was to establish whether the open hole damage was more severe compared to an impact damage of equal planar size. Hole diameters of 1, 2, and 4 inches were selected because they represented the planar dimensions of impact damage that produced contrasting failure modes in sandwich panels. The experimental results indicated that the open holes are more severe when compared to impact damage, created with different impactor sizes. Comparison with previous data revealed that residual strengths of impact-damaged sandwich panels tend to approach that of the open hole with increasing residual indentation depth. Similar to impact damage, the single facesheet holes in sandwich panels under compression produced distinct failure modes, which was a function of the hole diameter. A facesheet fracture failure mode was observed for small diameter holes (and through holes of all sizes investigated), while a local instability mode was observed for the 4-inch-diameter hole. The buckling mode seen in sandwich panels with 4-inch-diameter, single facesheet holes appeared to blunt the strain concentration due to facesheet bending, resulting in higher compressive strengths compared to smaller size holes. Finally, the open-hole compressive strengths were lower than the open-hole tensile strengths for S2 ]CORE/)45/90[( sandwich panels.
33

The impact damage resistance and damage tolerance of sandwich panels with facesheets fabricated using Toray P707AG-15 Unitape/epoxy and Toray T700S-12K plain weave fabric/epoxy systems were investigated. This study was intended to augment the observations on damage tolerance characteristics reported in previous studies. Three different facesheet configurations, SFF ]CORE/)90/45[( , SFTTF ]CORE/)45/0/0/45[( , and
SFTTFTTF ]CORE/45/0/0/45/0/0/45[ were investigated. Plascore PN2-3/16-3.0 Nomex® honeycomb material of nominal density 3.0 lb/ft3, nominal cell size of 3/16 and 0.375 inch thickness was used for the honeycomb core. The sandwich panels exhibited damage resistance and tolerance characteristics that were similar to earlier findings. The damage states were typical of blunt impactors, and thus, the behavior of these panels under compression was dominated by facesheet stiffness and core properties.
The Federal Aviation Administration damage tolerance program was independently analyzed by Mr. Tom Walker of NSE Composites. The primary emphasis of the evaluation was the residual strength prediction development effort, but also included a review of the residual strength test results. Neither the testing nor analyses related to impact damage resistance were considered. Recommendations addressing the program scope and the analysis method development and verification in appendix C with summaries in the Abstract and Executive Summary.
5. REFERENCES.
1. Tomblin, J.S., Lacy, T., Smith, B., Hoopes, S., Vizzini, A., and Lee, S., “Review of Damage Tolerance for Composite Sandwich Airframe Structures,” FAA report DOT/FAA/AR-99/49, August 1999.
2. Tomblin, J.S., Raju, K.S., Liew, J., and Smith, B.L., “Impact Damage Characterization and Damage Tolerance of Composite Sandwich Airframe Structures,” FAA report DOT/FAA/AR-00/44, January 2001.
3. Tan, S.C., Stress Concentrations in Laminated Composites, Technomic Publishing Co.
4. Nuismer, R.J and J.M. Whitney, “Uniaxial Failure of Composite Laminates Containing Stress Concentrations,” Fracture Mechanics of Composites, ASTM STP 593, American Society for Testing and Materials, 1975, pp. 117-142.
5. Moody, R.C. and Vizzini, A.J., “Damage Tolerance of Composite Sandwich Structures,” FAA report DOT/FAA/AR-99/91, January 2000.
6. Moody, R.C. and Vizzini, A.J., “Test and Analysis of Composite Sandwich Panels With Impact Damage,” FAA report DOT/FAA/AR-01/124, March 2002.
7. Moody, R.C., Harris, J.S., and Vizzini, A.J., “Scaling and Curvature Effects on the Damage Tolerance of Impacted Composite Sandwich Panels,” Journal of Sandwich Structures and Materials, Vol. 4, 2002 pp. 71-82.
8. Hwang, Y. and Lacy, T.E., “Numerical Estimates of the Compressive Strength of Impact-Damaged Sandwich Composites,” to appear in Proceedings of the ASC/ ASTM-D30 Joint 19th Annual Technical Conference, October 2004.
34

APPENDIX A—COMPRESSIVE
0 2000 4000 6000 8000 10000
Strain εyy (microstrain)
0
200
400
600
800
Com
pres
sive
Loa
d R
esul
tant
Nyy
(lbf
/in)
STRAIN GAGE #1STRAIN GAGE #2STRAIN GAGE #3STRAIN GAGE #4STRAIN GAGE #5STRAIN GAGE #6
[(90/45)/ CORE]S PANELHEIGHT : 10.5 inchesWIDTH : 8.5 inchesHOLE DIAMETER : 1.00 inchesHOLE TYPE : Single Facesheet
FIGURE A-1. LOAD-STRAIN PLOT FOR S]CORE/)45/90[( PANEL WITH 1-inch-DIAMETER HOLE IN SINGLE FACESHEET
0 2000 4000 6000 8000 10000
Strain εyy (microstrain)
0
200
400
600
800
Com
pres
sive
Loa
d R
esul
tant
Nyy
(lbf
/in)
STRAIN GAGE #1STRAIN GAGE #2STRAIN GAGE #3STRAIN GAGE #4STRAIN GAGE #5
[90/45/CORE]S PANELHEIGHT : 10.5 inchesWIDTH : 8.5 inchesHOLE DIAMETER : 1.00 inchesHOLE TYPE : Through
FIGURE A-2. LOAD-STRAIN PLOT FOR S]CORE/)45/90[( PANEL WITH 1-inch-DIAMETER THROUGH HOLE
A-1

0 2000 4000 6000 8000 10000
Strain εyy (μstrain)
0
200
400
600
Com
pres
sive
Loa
d R
esul
tant
Nyy
(lbf
/in)
STRAIN GAGE #1STRAIN GAGE #2STRAIN GAGE #3STRAIN GAGE #4STRAIN GAGE #5STRAIN GAGE #6
[90/45/CORE]S PANELHEIGHT : 10.5 inchesWIDTH : 8.5 inchesHOLE DIAMETER : 2.00 inchesHOLE TYPE : Single Facesheet
FIGURE A-3. LOAD-STRAIN PLOT FOR S]CORE/)45/90[( PANEL WITH 2-inch-DIAMETER HOLE IN SINGLE FACESHEET
0 2000 4000 6000 8000 10000
Strain εyy (μstrain)
0
100
200
300
400
500
Com
pres
sive
Loa
d R
esul
tant
Nyy
(lbf
/in)
STRAIN GAGE #1STRAIN GAGE #2STRAIN GAGE #3STRAIN GAGE #4STRAIN GAGE #5STRAIN GAGE #6
[90/45/CORE]S PANELHEIGHT : 10.5 inchesWIDTH : 8.5 inchesHOLE DIAMETER : 2.00 inchesHOLE TYPE : Through Hole
FIGURE A-4. LOAD-STRAIN PLOT FOR S]CORE/)45/90[( PANEL WITH 2-inch-DIAMETER THROUGH HOLE
A-2
0 2000 4000 6000 8000Measured Strain εyy (microstrain)
0
200
400
600
800
Com
pres
sive
Loa
d R
esul
tant
Nyy
(lbf
/in)
[(90/45)/ CORE]S PANELSLength : 30 inchesWidth : 17 inchesHole Diameter : 4 inches (single facesheet)
STRAIN GAGE I.D.STRAIN GAGE #1STRAIN GAGE #2STRAIN GAGE #3STRAIN GAGE #4STRAIN GAGE #5STRAIN GAGE #6STRAIN GAGE #7STRAIN GAGE #8STRAIN GAGE #9
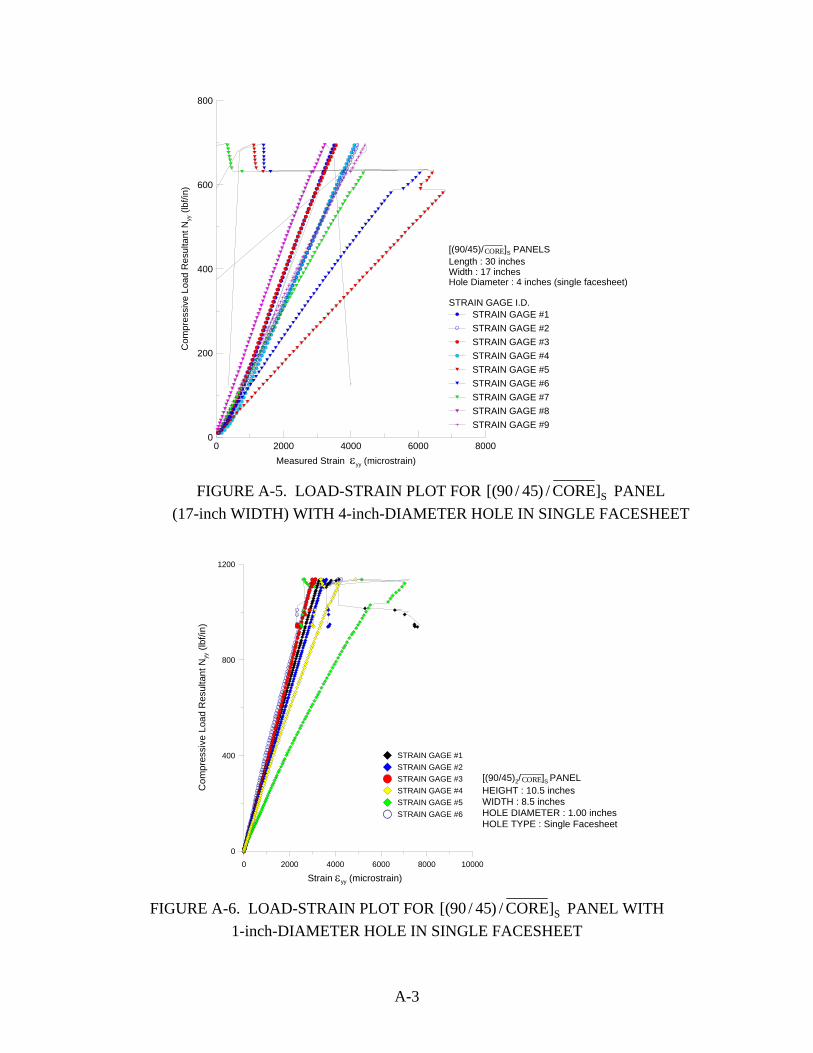
FIGURE A-5. LOAD-STRAIN PLOT FOR S]CORE/)45/90[( PANEL (17-inch WIDTH) WITH 4-inch-DIAMETER HOLE IN SINGLE FACESHEET
0 2000 4000 6000 8000 10000
Strain εyy (microstrain)
0
400
800
1200
Com
pres
sive
Loa
d R
esul
tant
Nyy
(lbf
/in)
STRAIN GAGE #1STRAIN GAGE #2STRAIN GAGE #3STRAIN GAGE #4STRAIN GAGE #5STRAIN GAGE #6
[(90/45)2/ CORE]S PANELHEIGHT : 10.5 inchesWIDTH : 8.5 inchesHOLE DIAMETER : 1.00 inchesHOLE TYPE : Single Facesheet
FIGURE A-6. LOAD-STRAIN PLOT FOR S]CORE/)45/90[( PANEL WITH 1-inch-DIAMETER HOLE IN SINGLE FACESHEET
A-3

0 2000 4000 6000 8000 10000
Strain εyy (microstrain)
0
400
800
1200
1600
Com
pres
sive
Loa
d R
esul
tant
Nyy
(lbf
/in)
STRAIN GAGE #1STRAIN GAGE #2STRAIN GAGE #3STRAIN GAGE #4STRAIN GAGE #5
[(90/45)2/ CORE]S PANELHEIGHT : 10.5 inchesWIDTH : 8.5 inchesHOLE DIAMETER : 1.00 inchesHOLE TYPE : Through
FIGURE A-7. LOAD-STRAIN PLOT FOR S]CORE/)45/90[( PANEL WITH 1-inch-DIAMETER THROUGH HOLE
0 2000 4000 6000 8000 10000
Strain εyy (microstrain)
0
200
400
600
800
1000
Com
pres
sive
Loa
d R
esul
tant
Nyy
(lbf
/in)
STRAIN GAGE #1STRAIN GAGE #2STRAIN GAGE #3STRAIN GAGE #4STRAIN GAGE #5STRAIN GAGE #6
[(90/45)2/ CORE]S PANELHEIGHT : 10.5 inchesWIDTH : 8.5 inchesHOLE DIAMETER : 2.00 inchesHOLE TYPE : Single Facesheet
FIGURE A-8. LOAD-STRAIN PLOT FOR S]CORE/)45/90[( PANEL WITH 2-inch-DIAMETER HOLE IN SINGLE FACESHEET
A-4

0 2000 4000 6000 8000 10000
Strain εyy (microstrain)
0
200
400
600
800
1000
Com
pres
sive
Loa
d R
esul
tant
Nyy
(lbf
/in)
STRAIN GAGE #1STRAIN GAGE #2STRAIN GAGE #3STRAIN GAGE #4STRAIN GAGE #5STRAIN GAGE #6
[(90/45)2/ CORE]S PANELHEIGHT : 10.5 inchesWIDTH : 8.5 inchesHOLE DIAMETER : 2.00 inchesHOLE TYPE : Through
FIGURE A-9. LOAD-STRAIN PLOT FOR S]CORE/)45/90[( PANEL WITH 2-inch-DIAMETER THROUGH HOLE
0 2000 4000 6000 8000Measured Strain εyy (microstrain)
0
400
800
1200
1600
Com
pres
sive
Loa
d R
esul
tant
Nyy
(lbf
/in)
[(90/45)2/ CORE]S PANELSLength : 30 inchesWidth : 17 inchesHole Diameter : 4 inches (single facesheet)
STRAIN GAGE I.D.STRAIN GAGE #1STRAIN GAGE #2STRAIN GAGE #3STRAIN GAGE #4STRAIN GAGE #5STRAIN GAGE #6STRAIN GAGE #7STRAIN GAGE #8STRAIN GAGE #9
FIGURE A-10. LOAD-STRAIN PLOT FOR S]CORE/)45/90[( PANEL (17-inch WIDTH) WITH 4-inch-DIAMETER HOLE IN SINGLE FACESHEET
A-5

-4000 0 4000 8000Measured Strain εyy (microstrain)
0
400
800
1200
1600
Com
pres
sive
Loa
d R
esul
tant
Nyy
(lbf
/in)
[(90/45)2/ CORE]S PANELSLength : 30 inchesWidth : 8.5 inchesHole Diameter : 4 inches (single facesheet)
STRAIN GAGE I.D.STRAIN GAGE #1STRAIN GAGE #2STRAIN GAGE #3STRAIN GAGE #4STRAIN GAGE #5STRAIN GAGE #6STRAIN GAGE #7STRAIN GAGE #8STRAIN GAGE #9
FIGURE A-11. LOAD-STRAIN PLOT FOR S]CORE/)45/90[( PANEL (8.5-inch WIDTH) WITH 4-inch-DIAMETER HOLE IN SINGLE FACESHEET
0 2000 4000 6000 8000 10000
Strain εyy (microstrain)
0
400
800
1200
1600
2000
Com
pres
sive
Loa
d R
esul
tant
Nyy
(lbf
/in)
STRAIN GAGE #1STRAIN GAGE #2STRAIN GAGE #3STRAIN GAGE #4STRAIN GAGE #5STRAIN GAGE #6
[(90/45)3/ CORE]S PANELHEIGHT : 10.5 inchesWIDTH : 8.5 inchesHOLE DIAMETER : 1.00 inchesHOLE TYPE : Single Facesheet
FIGURE A-12. LOAD-STRAIN PLOT FOR S]CORE/)45/90[( PANEL WITH 1-inch-DIAMETER HOLE IN SINGLE FACESHEET
A-6

0 2000 4000 6000 8000 10000
Strain εyy (microstrain)
0
400
800
1200
1600
2000
Com
pres
sive
Loa
d R
esul
tant
Nyy
(lbf
/in)
STRAIN GAGE #1STRAIN GAGE #2STRAIN GAGE #3STRAIN GAGE #4STRAIN GAGE #5
[(90/45)3/ CORE]S PANELHEIGHT : 10.5 inchesWIDTH : 8.5 inchesHOLE DIAMETER : 1.00 inchesHOLE TYPE : Through
FIGURE A-13. LOAD-STRAIN PLOT FOR S]CORE/)45/90[( PANEL WITH 1-inch-DIAMETER THROUGH HOLE
0 2000 4000 6000 8000 10000
Strain εyy (microstrain)
0
400
800
1200
1600
2000
Com
pres
sive
Loa
d R
esul
tant
Nyy
(lbf
/in)
STRAIN GAGE #1STRAIN GAGE #2STRAIN GAGE #3STRAIN GAGE #4STRAIN GAGE #5STRAIN GAGE #6
[(90/45)3/ CORE]S PANELHEIGHT : 10.5 inchesWIDTH : 8.5 inchesHOLE DIAMETER : 2.00 inchesHOLE TYPE : Single Facesheet
FIGURE A-14. LOAD-STRAIN PLOT FOR S]CORE/)45/90[( PANEL WITH 2-inch-DIAMETER HOLE IN SINGLE FACESHEET
A-7

0 2000 4000 6000 8000 10000
Strain εyy (microstrain)
0
400
800
1200
1600
Com
pres
sive
Loa
d R
esul
tant
Nyy
(lbf
/in)
STRAIN GAGE #1STRAIN GAGE #2STRAIN GAGE #3STRAIN GAGE #4STRAIN GAGE #5
[(90/45)3/ CORE]S PANELHEIGHT : 10.5 inchesWIDTH : 8.5 inchesHOLE DIAMETER : 2.00 inchesHOLE TYPE : Through
FIGURE A-15. LOAD-STRAIN PLOT FOR S]CORE/)45/90[( PANEL WITH 2-inch-DIAMETER THROUGH HOLE
0 2000 4000 6000 8000Measured Strain εyy (microstrain)
0
400
800
1200
1600
Com
pres
sive
Loa
d R
esul
tant
Nyy
(lbf
/in)
[(90/45)3/ CORE]S PANELSLength : 30 inchesWidth : 17 inchesHole Diameter : 4 inches (single facesheet)
STRAIN GAGE I.D.STRAIN GAGE #1STRAIN GAGE #2STRAIN GAGE #3STRAIN GAGE #4STRAIN GAGE #5STRAIN GAGE #6STRAIN GAGE #7STRAIN GAGE #8STRAIN GAGE #9
FIGURE A-16. LOAD-STRAIN PLOT FOR S]CORE/)45/90[( PANEL (17-inch WIDTH) WITH 4-inch-DIAMETER HOLE IN SINGLE FACESHEET
A-8

APPENDIX B—LOAD STRAIN PLOTS FOR S2 ]CORE/)45/90[( SANDWICH PANELS UNDER TENSILE LOADING
-4000 0 4000 8000 12000 16000Measured Strain ε (microstrain)
0
1000
2000
3000
Tens
ile L
oad
Res
ulta
nt N
yy (l
bf/in
)
[(90/45)/CORE]S PANELLength : 10 inchesWidth : 8.5 inchesHole Diameter : 1 inches (Through)
STRAIN GAGE I.D.STRAIN GAGE #1STRAIN GAGE #2STRAIN GAGE #3STRAIN GAGE #4STRAIN GAGE #5STRAIN GAGE #6STRAIN GAGE #7STRAIN GAGE #8STRAIN GAGE #9
FIGURE B-1. LOAD-STRAIN PLOTS FOR S2 ]CORE/)45/90[( SANDWICH PANELS WITH 1-inch-DIAMETER THROUGH HOLE UNDER TENSILE LOADING
-4000 0 4000 8000 12000 16000Measured Strain ε (microstrain)
0
1000
2000
3000
Tens
ile L
oad
Res
ulta
nt N
yy (l
bf/in
)
[(90/45)2/CORE]S PANELLength : 10 inchesWidth : 8.5 inchesHole Diameter : 1 inches (Single facesheet)
STRAIN GAGE I.D.STRAIN GAGE #1STRAIN GAGE #2STRAIN GAGE #3STRAIN GAGE #4STRAIN GAGE #5STRAIN GAGE #6STRAIN GAGE #7STRAIN GAGE #8STRAIN GAGE #9STRAIN GAGE #10
FIGURE B-2. LOAD-STRAIN PLOTS FOR S2 ]CORE/)45/90[( SANDWICH PANELS WITH 1-inch-DIAMETER HOLE IN SINGLE FACEHSEET UNDER
TENSILE LOADING
B-1

-4000 0 4000 8000 12000 16000Measured Strain ε (microstrain)
0
1000
2000
3000
Tens
ile L
oad
Res
ulta
nt N
yy (l
bf/in
)[(90/45)2/CORE]S PANELLength : 16 inchesWidth : 8.5 inchesHole Diameter : 2 inches (Through)
STRAIN GAGE I.D.STRAIN GAGE #1STRAIN GAGE #2STRAIN GAGE #3STRAIN GAGE #4STRAIN GAGE #5STRAIN GAGE #6STRAIN GAGE #7STRAIN GAGE #8STRAIN GAGE #9
FIGURE B-3. LOAD-STRAIN PLOTS FOR S2 ]CORE/)45/90[( SANDWICH PANELS WITH 2-inch-DIAMETER THROUGH HOLE UNDER TENSILE LOADING
-4000 0 4000 8000 12000 16000Measured Strain ε (microstrain)
0
1000
2000
3000
Tens
ile L
oad
Res
ulta
nt N
yy (l
bf/in
)
[(90/45)2/CORE]S PANELLength : 16 inchesWidth : 8.5 inchesHole Diameter : 2 inches (single facesheet)
STRAIN GAGE I.D.STRAIN GAGE #1STRAIN GAGE #2STRAIN GAGE #3STRAIN GAGE #4STRAIN GAGE #5STRAIN GAGE #6STRAIN GAGE #7STRAIN GAGE #8STRAIN GAGE #9STRAIN GAGE #10
FIGURE B-4. LOAD-STRAIN PLOTS FOR S2 ]CORE/)45/90[( SANDWICH PANELS WITH 2-inch-DIAMETER HOLE IN SINGLE FACEHSEET UNDER
TENSILE LOADING
B-2

-8000 -4000 0 4000 8000 12000 16000Measured Strain ε (microstrain)
0
1000
2000
3000
Tens
ile L
oad
Res
ulta
nt N
yy (l
bf/in
)
[(90/45)2/CORE]S PANELLength : 40 inchesWidth : 8.5 inchesHole Diameter : 4 inches (through)
STRAIN GAGE I.D.STRAIN GAGE #1STRAIN GAGE #2STRAIN GAGE #3STRAIN GAGE #4STRAIN GAGE #5STRAIN GAGE #6STRAIN GAGE #7STRAIN GAGE #8STRAIN GAGE #9
FIGURE B-5. LOAD-STRAIN PLOTS FOR S2 ]CORE/)45/90[( SANDWICH PANELS (8.5-inch WIDTH) WITH 4-inch-DIAMETER THROUGH HOLE
UNDER TENSILE LOADING
-4000 0 4000 8000 12000 16000Measured Strain ε (microstrain)
0
1000
2000
3000
Tens
ile L
oad
Res
ulta
nt N
yy (l
bf/in
)
[(90/45)2/CORE]S PANELLength : 30 inchesWidth : 8.5 inchesHole Diameter : 4 inches (single facesheet)
STRAIN GAGE I.D.STRAIN GAGE #1STRAIN GAGE #2STRAIN GAGE #3STRAIN GAGE #4STRAIN GAGE #5STRAIN GAGE #6STRAIN GAGE #7STRAIN GAGE #8STRAIN GAGE #9STRAIN GAGE #10
FIGURE B-6. LOAD-STRAIN PLOTS FOR S2 ]CORE/)45/90[( SANDWICH PANELS (8.5-inch WIDTH) WITH 4-inch-DIAMETER HOLE IN SINGLE
FACESHEET UNDER TENSILE LOADING
B-3

-4000 0 4000 8000 12000 16000Measured Strain ε (microstrain)
0
1000
2000
3000
Tens
ile L
oad
Res
ulta
nt N
yy (l
bf/in
)[(90/45)2/CORE]S PANELLength : 40 inchesWidth : 17 inchesHole Diameter : 4 inches (Through)
STRAIN GAGE I.D.STRAIN GAGE #1STRAIN GAGE #2STRAIN GAGE #3STRAIN GAGE #4STRAIN GAGE #5STRAIN GAGE #6STRAIN GAGE #7STRAIN GAGE #8STRAIN GAGE #9
FIGURE B-7. LOAD-STRAIN PLOTS FOR S2 ]CORE/)45/90[( SANDWICH PANELS (17-inch WIDTH) WITH 4-inch DIAMETER THROUGH HOLE
UNDER TENSILE LOADING
-4000 0 4000 8000 12000 16000Measured Strain ε (microstrain)
0
1000
2000
3000
Tens
ile L
oad
Res
ulta
nt N
yy (l
bf/in
)
[(90/45)2/ CORE]S PANELSLength : 40 inchesWidth : 17 inchesHole Diameter : 4 inches (single facesheet)
STRAIN GAGE I.D.STRAIN GAGE #1STRAIN GAGE #2STRAIN GAGE #3STRAIN GAGE #4STRAIN GAGE #5STRAIN GAGE #6STRAIN GAGE #7STRAIN GAGE #8STRAIN GAGE #9STRAIN GAGE #10
FIGURE B-8. LOAD-STRAIN PLOTS FOR S2 ]CORE/)45/90[( SANDWICH PANELS (17-inch WIDTH) WITH 4-inch-DIAMETER HOLE IN FACESHEET UNDER
TENSILE LOADING
B-4

APPENDIX C—NSE COMPOSITES’ ASSESSMENT OF RESEARCH ON RESIDUAL STRENGTH OF THIN-GAGE SANDWICH STRUCTURES WITH DAMAGE
C.1 INTRODUCTION. During the past several years, the Federal Aviation Administration (FAA) has sponsored research in the strength of thin-gage sandwich structure with impact damage [C-1 through C-14]. The work focused on configurations typical of general aviation applications, particularly thin-gage panels with carbon fiber-reinforced plastic (CFRP) skins over Nomex honeycomb core. The program has included substantial compression-after-impact (CAI) testing with a range of panel and impact variables, including facesheet thickness, core density, core thickness, impactor diameter, and impact energy. Analytical prediction techniques are being developed in parallel, to allow extension of the test data to untested configurations. This appendix is an assessment of that program. The primary emphasis of the evaluation was the residual strength prediction effort, but also included a review of the residual strength test results. Neither the tests nor analyses related to impact damage resistance were considered. Recommendations addressing the program scope and the analysis method development and verification are provided. C.2 KEY EXPERIMENTAL FINDINGS. Extensive residual strength testing was conducted under the FAA program. The bulk of this effort was conducted by Wichita State University (WSU), and the initial phases of this work are documented in references C-3 and C-6. More recently, additional experiments were performed to augment the initial studies. These included a study of panel size effects conducted at WSU [C-8], a study of panel size and curvature by Moody and Vizzini at the University of Maryland, and a study of the effect of circular holes at WSU which is contained in this report. Key results from these studies are discussed in sections C.2.1 through C.2.4. C.2.1 INITIAL WSU PROGRAM.
Two main failure modes were reported in the literature for impacted sandwich panels loaded in compression. The first, referred to in this report as facesheet fracture, involved failure of the facesheet via a narrow failure band extending perpendicular to the load (see figure C-1). This band contains a combination of kink bands, fiber microbuckling, and delaminations, and often extends initially in a stable manner prior to unstable growth and specimen failure. This failure mode tends to be associated with thinner facesheets and more severe facesheet damage [C-6].
C-1

FIGURE C-1. FACESHEET FRACTURE FAILURE MODE [C-6]
The second major failure mode, referred to in this report as dimple propagation, is the extension of a core crush zone across the width of the panel perpendicular to the loading (see figure C-2). Frequently, the dimple propagation to the panel edges precedes, and possibly causes, facesheet fracture to occur. In some cases however, no facesheet damage is evident, despite the core crushing across the full panel width. This latter failure mode has caused much concern since major reductions in panel bending stiffness and strength can occur with little or no external visibility. Dimple propagation was found to be associated with configurations having thicker facesheets, higher core densities, and little facesheet damage [C-6].
FIGURE C-2. DIMPLE PROPAGATION FAILURE MODE [C-6]
In reference C-6, compression-compression fatigue loading was applied to specimen/damage combinations representative of the dimple propagation failure mode. Fatigue life and postfatigue residual strength results were within the expected range, indicating that there was no severe fatigue-related performance reductions associated with this failure mode. C.2.2 WICHITA STATE UNIVERSITY PANEL SIZE EFFECTS. The effect of specimen size was investigated in reference C-13 for damage scenarios associated with blunt impactors (i.e., small residual indentations and little facesheet damage) on sandwich panels with two- and four-ply, quasi-isotropic facesheets. Small increases in strength were noted
C-2

for increases in either specimen width or length. The width effects, though small, were more noticeable than those predicted for circular soft inclusions [C-15], which is typically the case when significant precatastrophic damage is present. The decreased strength with specimen length was attributed to the interaction between global buckling and the initial geometric imperfection caused by the damage. Another possible explanation is that the shorter, baseline specimens were insufficiently long to reach a uniform end loading (under displacement control) and, therefore, not develop the full stress concentration at the damage edge. As the specimen length is increased in this scenario, a higher stress concentration is obtained, and the strength is, therefore, reduced. Strain distributions across the specimen width through the damage do not clearly support this argument. It should also be noted that there is no obvious correlation between peak strain levels or strain distribution characteristics and the final specimen strength. In all of the two-ply facesheet specimens, failure occurred via facesheet fracture. For the specimens with widths of 6.5, 8.5, and 12.5 inches, strain profiles across the specimen width obtained from full-field measurements (ARAMIS) show axial strains peaking at the edge of the impact damage zone. However, similar strain plots for the 16.5-inch-wide, two-ply facesheet specimen indicate peak strains at the center of the damage. These results suggest the possibility that, in some cases, facesheet failure initiates at the edge of the damage, while at others, it starts well within the damaged region. For the narrowest four-ply facesheet specimen (6.5 inches wide), failure was produced by dimple propagation. Broad strain peaks are present near the middle of the damaged region, and out-of-plane deflections along the damage growth path approach zero near the panel edge for all load levels. In contrast, the widest four-ply facesheet specimen (16.5 inches wide) exhibited dimple propagation that arrested, followed by a facesheet-fracture failure. The strain distributions were characterized by a narrow peak near the center of the damage. Unlike any of the other specimens (except possibly the four-ply, 12.5-inch-wide specimen, which had no failure mechanism reported), the out-of-plane deflections along the damage growth path were positive (i.e., away from the core) near the panel edge. It is possible that this positive displacement acts in some way to arrest the growth, opening the possibility that the dimple-propagation arrest is not due to increased specimen width. C.2.3 UNIVERSITY OF MARYLAND PANEL SIZE AND CURVATURE EFFECTS. Experimental studies of specimen size and curvature effects were reported in references C-5 and C-8. Flat and curved (42-inch radius of curvature) specimens with various widths (3.25, 6, and 12 inches) and impact damage diameters of approximately 2 to 2.5 inches were tested in compression. All specimens had [0/90]s facesheets and were subject to the same impact event with clamped ends and free sides. The resulting damage (i.e., size, depth, and facesheet fractures) differed, and the differences were attributed to the dissimilar panel bending stiffnesses. One trend specifically noted was an increase in damage size with increasing specimen width. Seven specimens of each configuration were tested, and significant scatter was observed (i.e., spread/mean for identical configurations ranged between about 40% and 70%). The failure progression was found to be influenced by the panel width. The narrow specimens (3.25 inches wide) failed via dimple propagation. In the 6- and 12-inch specimens, however, the
C-3
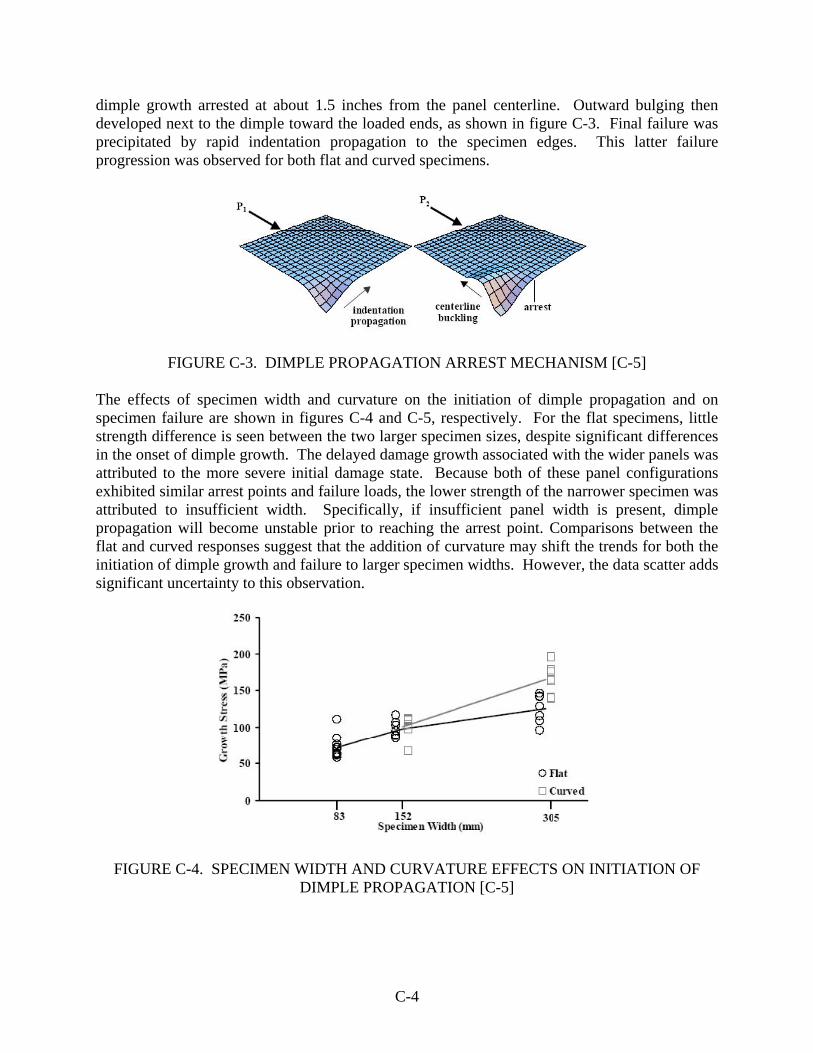
dimple growth arrested at about 1.5 inches from the panel centerline. Outward bulging then developed next to the dimple toward the loaded ends, as shown in figure C-3. Final failure was precipitated by rapid indentation propagation to the specimen edges. This latter failure progression was observed for both flat and curved specimens.
FIGURE C-3. DIMPLE PROPAGATION ARREST MECHANISM [C-5]
The effects of specimen width and curvature on the initiation of dimple propagation and on specimen failure are shown in figures C-4 and C-5, respectively. For the flat specimens, little strength difference is seen between the two larger specimen sizes, despite significant differences in the onset of dimple growth. The delayed damage growth associated with the wider panels was attributed to the more severe initial damage state. Because both of these panel configurations exhibited similar arrest points and failure loads, the lower strength of the narrower specimen was attributed to insufficient width. Specifically, if insufficient panel width is present, dimple propagation will become unstable prior to reaching the arrest point. Comparisons between the flat and curved responses suggest that the addition of curvature may shift the trends for both the initiation of dimple growth and failure to larger specimen widths. However, the data scatter adds significant uncertainty to this observation.
FIGURE C-4. SPECIMEN WIDTH AND CURVATURE EFFECTS ON INITIATION OF DIMPLE PROPAGATION [C-5]
C-4

FIGURE C-5. SPECIMEN WIDTH AND CURVATURE EFFECTS ON FAILURE [C-5] C.2.4 WICHITA STATE UNIVERSITY CIRCULAR HOLE EFFECTS. Limited tension and compression tests were conducted (see the body of this report) on sandwich panels similar to previous studies, except with a range of single facesheet and through-thickness holes (i.e., through both facesheets and the core). All facesheets were quasi-isotropic. The compression tests included two-, four-, and six-ply facesheets, while the tension specimens all were two plies. Hole sizes ranged from 1 to 4 inches, and specimen width-to-hole diameter (w/d) ratios varied from 2.125 to 8.5. The purpose of the study was to develop an understanding of the residual strength curves with holes, including a possibly asymptote at larger sizes. Since the damage associated with machined holes is less variable than for impact damage, this understanding can provide a well-defined basis by which to compare the responses of circular impact damage. Several key observations are discussed below. C.2.4.1 Residual Strength Asymptote. The results for tension and compression loading indicated that the slope of both the single facesheet and through-thickness residual strength curves are much flatter in the 1- to 4-inch range than is typically observed for open hole sharp notches in quasi-isotropic layups. For compressive loading there is insufficient data to separate the hole size effect from data scatter, and therefore, clearly establish the existence of an asymptote at large hole sizes (see figures 13 and 14). Under tensile loading (figures 27 and 28), there is less scatter and there is a well defined hole size effect. C.2.4.2 Impact Damage versus Hole Response. Comparison of the compression results for hole configurations to previous CAI testing indicates that the hole strengths generally serve as a lower bound to the impact-damaged strength for damage sizes less than 4 inches. As shown in figure C-7 (and in plots contained in section 2.5), the residual strength curves for holes appear steep at small sizes and much shallower at large sizes, while those for impact damage are of intermediate steepness throughout the damage size range. If these trends continue at larger damage sizes, the CAI strengths may drop below those
C-5

of the hole specimens. While this may at first seem implausible, specimens with the different damage types (i.e., impact damage, single facesheet hole, and through-thickness hole) may exhibit significantly different out-of-plane specimen deformations, and consequently, different failure sequences. C.2.4.3 Finite Width Effects. For both tension and compression, data to directly measure finite width effects are only available for 4-inch holes. Figures C-6 and C-7 show these effects, both with and without adjustment by isotropic elastic finite width correction factors (FWCF). Identical finite width-adjusted strengths will be seen for all specimens with identical hole configurations (size and single facesheet or through-thickness) if the FWCFs appropriately account for the actual effect. If the corrected strengths of specimens with small w/d’s are lower than those for larger w/d specimens, then the FWCFs under predict the finite width effects. This is indicative of significant prefailure damage growth. If the corrected strengths of small w/d specimens are smaller than those with larger w/d’s, then the FWCFs over predict the finite width effects. In this case, the most likely explanations are (1) scatter in the data, (2) a change in failure mode between the two specimens, (3) a lower stress concentration that predicted for a hole, (4) a failure mode unrelated to the stress concentration, and for compression, (5) a deformation mode that delays failure in the narrower specimens.
FIGURE C-6. FINITE WIDTH EFFECTS IN TENSION: FOUR-PLY FACESHEETS— 4-inch HOLES
C-6

FIGURE C-7. FINITE WIDTH EFFECTS IN COMPRESSION: FOUR-PLY FACESHEETS—4- inch SINGLE FACESHEET HOLES
In the tension data with through-thickness holes, observed finite width effects are similar to those predicted by FWCFs, as indicated by the corrected values being nearly identical. This suggests that prefailure growth is relatively small. For single facesheet holes however, the finite width effects in both tension and compression are much smaller than predicted by the FWCFs. This could be due to the first and third version listed in the previous paragraph. Similar judgments can be made via review of the corrected compression residual strengths in figure C-7 for single facesheet holes. Due to the uncertain scatter level, few conclusions can be drawn using this indirect method. C.2.4.4 Other Observations. The tension and compression strengths of panels with single facesheet holes are approximately 10% to 15% higher than those with through thickness holes. In compression, the two- and four-ply facesheets exhibit increases in strength between 2- and 4-inch hole sizes. This may be attributable to data scatter, but its repeated occurrence suggests it may also be related to the specimen and/or damage configurations. Compression failure of the specimens with four- and six-ply facesheets and with 4-inch holes was initiated by back facesheet buckling. Possible explanations include (1) nominal facesheet buckling capability below the strength of the front facesheet and (2) the specimen and/or damage configurations.
C-7

C.3 RECENT ANALYTICAL DEVELOPMENTS.
Numerous models have been developed to predict notched and postimpact compression strength of composite sandwich panels. These efforts are summarized in many papers (e.g., references C-2, C-10, and C-16), and will not be directly addressed in this report. The following sections discuss the more recent and relevant efforts. C.3.1 MOODY AND VIZZINI. Moody and Vizzini [C-5] addressed the CAI strength of sandwich panels using a modification to analytical models developed by Minguet [C-17] and Tsang [C-18]. The approach included consideration of most major aspects of the problem. The model included panel curvature, initial and progressive core crush regions, and initial and progressive facesheet indentations. A graduated reduction in the facesheet properties, with the most severe reduction at the damage center, is included to address any initial facesheet damage. The core is modeled as an elastic foundation, with responses adjusted to account, as necessary, for core crush, partial rebound (due to facesheet springback), and disbonding from the facesheet. The major aspect missing from this model is progressive facesheet damage growth. The model predicts the general specimen behavior quite well, including the dimple propagation, arrest, bulge formation, and final specimen collapse. Predicted strains along the damage growth path match the measured stiffness relatively well, and the model slightly overpredicts the damage growth. However, it substantially underpredicts the failure stress (by 17%) and the failure strain (by 53%). The approach for determining final failure is not clearly described in the reference, and may have some impact on the magnitude of the error. It should be noted that reference C-12 reported that this method dramatically overpredicted the failure loads. Analytical comparisons of different specimen and damage configurations were made to identify the effects of key variables on the specimen response. Little or no effect was observed on far-field failure stress or local strain along the damage progression path due to curvature, width, or membrane stiffness reduction within the damage region. Bending stiffness reduction in the damage region, however, had a significant effect on this local strain at failure (approximately 20%), though only about 10% effect far-field failure stress. C.3.2 XIE AND VIZZINI. Xie and Vizzini [C-14] have addressed test specimens exhibiting dimple propagation. Two different methods were developed to address this problem: nonlinear finite element analysis and a modified analytical model. The finite element (FE) model contains representations of both facesheets and the honeycomb core, and simulates the residual indentation, the partially crushed core, and delaminations. There is no simulation of any reduced properties associated with fiber failure in the facesheets. The core is modeled with multiple elements through the thickness. The model predicts progressive dimple propagation by comparing the cores through thickness stresses to the plateau core-crushing strength (see figure C-8), and then deactivating any core elements that exceed this value.
C-8

FIGURE C-8. FLATWISE CORE-CRUSHING TEST [C-14]
The appropriate core-crushing strength to use with the FE model is not clear. In reference C-14, using the plateau strength is rationalized based on the existence of initial core crush in the region. This argument appears to be somewhat unsound, since the plateau region of the core stress-strain plot is associated with the core state where the vast majority of the cell walls are buckled, and the core is in the process of being consolidated. Localized crushing, at the scale of the FE element size, would seem to require stresses closer to the flatwise ultimate core crush strength, and possibly higher, if the larger local core crush stiffnesses discussed in the following paragraphs result in higher failure stresses. That being said, however, it is possible from an engineering perspective, that the initiation force is not particularly critical to the dimple growth, and can be ignored to obtain good global results. The second method is a variation of Moody’s analytical model discussed in section C.3.1. Only the damaged facesheet is modeled and is supported by an elastic foundation. No account is taken for reduction in properties due to fiber/matrix damage in the facesheet. The model includes the initial residual facesheet indentation and the crushed core. The undamaged core stiffness is taken as the equivalent local core stiffness, which is determined from local core-crushing tests using a range of tup sizes smaller than the core block, and extending the results to a size equal to the core cell size (see figure C-9). This stiffness is approximately 4 times greater than that determined from the global flatwise core-crushing test that crushes the entire block. The model predicts progressive dimple propagation by comparing the core’s through-thickness stresses to the critical core crush stress over a uniformly distributed series of points across and along the facesheet, and eliminates the elastic foundation stiffness in any regions where the critical core-crushing stress is exceeded. No details are provided in reference C-16 regarding the value that was used for the critical core-crushing stress (i.e., ultimate, plateau, or other).
C-9

FIGURE C-9. LOCAL CORE-CRUSHING TEST [C-14] The key aspect to this work was that, in both methods, specimen failure was conservatively assumed to occur when the dimple propagated past a point (i.e., critical point), some selected distance (i.e., critical distance) from the damage centerline. Selection of this point was noted to be situation-specific, but critical distances of 1 inch are recommended in reference C-14 for transport aircraft. Limited validation of both models was performed, with each being compared to different replicates of the same specimen/damage event scenario. Good correlation is reported between predicted and measured gross-area stresses associated with dimple extension past the critical point. Significant differences exist, however, within the test data, between the analysis methods, and between the predicted and measured local strains, as shown in table C-1. Specifically, the results of the two test points vary 8% in stress and 45% in strain, indicative of the high level of variability inherent in these types of tests. The analytical models also predict local strain differences of 25% at the same gross-area stress. It should be noted that reference C-12 suggests that these methods significantly overpredicted the failure loads.
TABLE C-1. COMPARISON OF EXPERIMENTAL AND ANALYTICAL PREDICTIONS OF STRESS AND STRAIN WHEN DIMPLE PROPAGATION EXTENDS BEYOND A
POINT 1 inch FROM THE DAMAGE CENTERLINE [C-14]
Gross-Area Stress
(MPa) Local Strain
(μin/in) Average Modulus
(MPa) Test Specimen UMD-A3-1 99 1300 76.2 Test Specimen UMD-A3-2 107 1880 56.9 Finite Element Method 103 1690 60.9 Modified Analytical Method 103 1350 76.3
C-10

As suggested in reference C-14, the level of conservatism can be adjusted by varying the critical distance. A rational selection process is not obvious and little guidance is provided. It seems clear, though, that a single value from the center of the damage (e.g., 1 inch) will not suffice for all damage scenarios (e.g., core crush radius > 1 inch). One possible method is to equate any growth with failure by setting the critical distance to be slightly larger than the core crush radius. This may be conservative in many cases, but avoids the challenge associated with rationalizing a larger distance. C.3.3 HWANG AND LACY. Recent nonlinear FE models developed by Hwang and Lacy [C-10, C-11, and C-12] have shown significant progress in addressing panels that exhibit the dimple growth phenomenon. The model uses shell elements to simulate both facesheets and full thickness solid elements to represent the honeycomb core. Initial indentations of the facesheet and core are included to address the crushed core and residual facesheet dent. Progressive through-thickness damage of the core is addressed via a material law based on an idealization of stress-strain curves obtained from flatwise core-crushing tests, as discussed in section C-3.2. In references C-10 and C-11, various levels of stiffness reduction were included to simulate the reduced load-carrying capability of the damaged facesheet. In addition, one of several simple failure criteria was used to determine the onset of localized facesheet failure, which was equated to specimen failure. Failure predictions of a range of specimens consistently underpredicted measured strengths. A single specimen was chosen for detailed analysis and test comparisons. The damage in this specimen consisted of obvious facesheet cracks at ±45° to the specimen axes, as well as distributed matrix cracks and fiber failures. The failure mode of the specimen was not described, but local strain results suggest it failed via dimple propagation. It was found that strain distributions across the undamaged portion of the specimen width could be reasonably reproduced over most of the load range by appropriately selecting the level of stiffness reduction in the damaged region of the facesheet. The model predicted the strain reversal in the undamaged (back) facesheet resulting from local specimen bending near the damage. However, predictions could not capture the large stiffness reductions in the damaged facesheet that occurred at loads approaching failure. In references C-10 and C-12, a progressive damage capability was added to the previous model. Instead of assuming specimen failure at the onset of localized facesheet damage, appropriate element stiffness properties were eliminated when the selected first-ply failure criteria was satisfied. In this manner, the interaction between progressive facesheet failure and specimen response were included. Reduced stiffnesses were not employed to simulate initial facesheet damage in this model since approaches for predicting initiation of further damage within that region were not obvious. Comparison of failure load predictions with experimental results for a wide range of specimen configurations and damage levels show mixed results. For the eight specimens containing impact damage imparted using a 3-inch-diameter impactor, the predictions were generally good.
C-11

The average error was 3.7% to 5.5%, depending on the failure criteria. For the six configurations with damage imparted by a 1-inch-diameter impactor, the predictions were less accurate, with the average error associated with the different failure criteria being between 8.3% and 9.7%. This relatively poor prediction of the 1-inch impactor data is attributed to a combination of the significant facesheet damage associated with the smaller tups and the absence of any facesheet stiffness reduction in the model. Detailed analysis and test comparisons were made using the same specimen described above. Excellent correlation was observed between predicted and measured strains along the damage propagation path for all load levels. The specific ply-level failure criteria had little effect on specimen strains or on the predicted failure load. Parametric studies with the above models indicated that a. the initially assumed core crush depth has only a minor effect on the specimen strain
distribution and strength for any given facesheet stiffness reduction ratio, and b. the radius of the facesheet region with degraded properties had a very small effect on
strength for any given facesheet stiffness reduction ratio. Hwang used actual facesheet thickness (as opposed to nominal values) and emphasizes the need to use them to avoid unconservative predictions. This is not surprising considering the local bending and stability-related aspects of the specimen response. C.3.4 RATCLIFFE, ET AL. Recently, work under the Survivable, Affordable, Reparable Airframe Program funding [C-19] attempted to develop an engineering approach to address the facesheet fracture failure mode. The approach is based on the initial model for notched compression failure of laminates developed by Soutis and Fleck [C-20]. This model predicts stable kink-band growth from an initial hole via the average stress criteria. Unstable kink-band growth is predicted using stress-intensity factors for cracks emanating from a circular hole along with critical fracture toughnesses obtained from a unique compact compression test that produces stable facesheet kink-band growth. The failure stress and associated kink-band length is determined as the intersection of the stable and unstable kink-band curves, as shown in figure C-10. FE analysis or existing solutions are used to determine the stress-intensity factors and to account for finite specimen widths and load transfer to the undamaged facesheet. The simplicity of this model is attractive, and it may prove useful as a design-type tool in certain situations. It does not address out-of-plane specimen or facesheet deformations, which limits its usefulness to situations where the dimple formation and possible growth are known to be absent.
C-12

FIGURE C-10. PREDICTION OF SPECIMEN FAILURE AS INTERSECTION OF STABLE
AND UNSTABLE KINK-BAND GROWTH CURVES [C-19] The method’s basis of a circular hole with edge cracks causes two possible difficulties. First, it does not account for any load transfer through the damaged region. This, and the use of stress-intensity factors, may result in residual strength curves that are steeper than those generated from the test results. This would lead to inaccurate predictions across a relatively wide range of notch sizes. Note that most validation of the method was done for notch sizes less than 1 inch. Soutis, et al. [C-21] subsequently modified the approach to include tractions on the crack surface. Improved correlation with the test results was observed using the modified model, but still over a very limited range of notch sizes. C.3.5 WALKER, ET AL. A semi-empirical model was developed by Walker, et al. [C-22] to support the determination of in-service allowable damage limits for thin-gage composite sandwich panels with Nomex® core. It addresses the effects of layup, damage size, and damage severity on residual strength of impact-damaged sandwich panels using continuous functional forms for each. It does not separately address the facesheet fracture and dimple propagation failure modes, but covers the full range of damage severity, from minor to through-thickness damage. The method relies on damage metrics compatible with airline operator inspection methods, and leveraged a substantial database of notched and impact-damaged tests in determining the appropriate functional forms. Numerical regressions of test data calibrate the model for each material. Correction factors and other techniques are used to modify these strengths for the effects of statistics, operating environment, core thickness, finite width, noncircular damage, and facesheet springback. Failure modes associated with possible outward buckling of delaminated sublaminates are included. Multiple-site damage scenarios are treated through the use of correction factors related to stress-field interactions for holes in isotropic materials. This approach does not attempt detailed prediction of failure. Instead, its intent is to use a number of known strengths as a basis for addressing a wide range of panel, damage, and loading
C-13

variables. Its correlation with the test results is reasonable, but the generalized nature of the approach, the sparseness of the test data (relative to the number of variables), and the relative lack of knowledge regarding multiple failure modes necessarily decrease the accuracy of this model. C.4 RECOMMENDATIONS. A suggested general approach and a number of specific recommendations for future work based on the review are discussed below. Previous recommendations [C-23] have been updated and included for completeness. C.4.1 APPROACH. The major goals of the FAA effort were twofold. The first was to understand various responses, failure modes, and interactions associated with impact-damaged sandwich panels under loading, as well as the combinations of specimen and damage characteristics that result in them occurring. The second was to develop appropriate analytical tools to support efficient design and maintenance. The work performed to date provides a good foundation in this regard. The most effective way to achieve these objectives is a combined analysis and test program. The role of the testing is to clearly establish physical responses and to support development and validation of the analytical models. These models are used to help understand important phenomena, establish boundaries between various responses and failure modes, identify critical tests needed for validation, and extend the experimental data to untested scenarios. Analytically, two complementary pieces are needed. The first is a methodology that serves as a framework for general assessments of damaged sandwich panels. This methodology must address all aspects of the problem, and yet be sufficiently simplified to be compatible with the real-world design and support environments. The second is one or more detailed predictive tools for addressing specific aspects of the problem (e.g., CAI strength). These detailed analysis methods are used to validate and refine the general framework, as specific aspects of the more general problem are more completely understood. In addition, the strengths predicted by the detailed methods can be used to replace the test data required to calibrate the general framework, to the extend that there is a high level of confidence in them. Residual strength of impact-damaged sandwich panels is a complex phenomenon. Numerous effects interact to determine the specimen’s response, damage progression, and final collapse. These effects include initial deformations, multiple scales of instability, and intra- and interfacesheet load redistribution associated with multiple local damage types. Compounding this is the large variability in the test results caused in part by variations in damage states and the noncontinuous nature of the core. Due to this complexity, a single detailed predictive method that addresses all major responses and failure modes seems to be necessary. This is particularly important while the factors controlling the different failure progressions are being determined and the interactions of failure modes are being studied. Using methods that address a subset of the failure modes requires a
C-14

clear understanding of the configuration and damage scenarios that will result in those modes, which does not currently exist. Combining several of these methods to address all failure modes can result in important interactions being missed and, therefore, unconservative predictions. Development of this detailed-prediction model should be done systematically to maximize the chances for success. Specifically, opportunities should be sought to develop and validate key responses or failure modes either in isolation or in sequentially more complex scenarios. C.4.2 DEVELOPMENT OF RESIDUAL STRENGTH PREDICTION METHOD. The following are recommendations for developing appropriate predictive methods. C.4.2.1 Evaluate the general applicability of the Walker model. The method developed by Walker, et al. [C-22] is a good candidate to serve as a framework for general assessments of damaged sandwich panels. The Comanche test data [C-24] provide a significant opportunity to assess the general applicability of the approach. The test plan was developed specifically to provide the information necessary to calibrate this method for several facesheet and core materials. Unfortunately, the Comanche program was canceled prior to reduction of the data. Since the data are Comanche Proprietary, approval must be obtained prior to its use. The large FAA CAI database provides another opportunity for evaluating the method, though some additional testing is likely required to address more severe facesheet damage created by the 3-inch impactor. C.4.2.2 Pursue FE Approaches for Detailed Predictions. FE analysis appears the most feasible method to account for the complex interactions of the problem. It also has the flexibility to allow technique adjustments as needed to obtain acceptable results and is able to adapt to a broader range of configurations and loadings. C.4.2.3 Further Develop the Hwang and Lacy Models to Include all Critical Aspects. Key aspects that appear to be necessary in a detailed analysis model to capture the major responses and interactions are: a. The initial damage state, including core-crushing profile, facesheet indentation, and
facesheet fiber and matrix damage b. Progressive core crushing, including through-thickness properties for pristine, partially
crushed and fully crushed core c. Progressive facesheet failure, including appropriate property degradation Many results have shown the importance of addressing the initial core and facesheet indentation as well as the core crush propagation. Experimental results [C-25] strongly suggest that both facesheet damage and out-of-plane deformations must be considered to accurately predict
C-15

residual strength. These results demonstrated that impact damage (simulated by static indentation) is more critical than either facesheet damage or core crushing considered individually. The recent modeling by Hwang and Lacy has illustrated the need to include progressive facesheet damage. Consideration of delaminations may be necessary for configurations where the facesheet deforms toward the core, though the need is unclear. However, they must be included to study outward facesheet buckling. Initial panel imperfections (i.e., deviations from nominal shape) may also be important. None of the existing models contain all of the above attributes. However, the Hwang and Lacy models appear to be the most promising and complete to date and should serve as the basis for future development. The major deficiency of the Hwang and Lacy method is its inability to predict the facesheet fracture failure mode. Adding initial facesheet damage to the model is the obvious first step in attempting to remedy this problem. Reduced stiffness approaches appear the most likely method to accomplish this. The most frequently used technique is to uniformly reduce the stiffness in the damage region. In reference C-5, this technique was modified somewhat by using a variable stiffness reduction within the damage region, with the largest reductions occurring in the damage center. A similar variable stiffness reduction, but in a FE model, was used in reference C-26. A challenge associated with each of the above approaches is determining a criterion for the initiation of further damage within the initial damage zone. In some instances, measured strain distributions showed peak strains in the center of the damage region, suggesting that facesheet damage might initiate there. Another approach, currently being pursued by Lacy [C-12], is to fully eliminate the stiffness of selected or random elements within the damage region. The number of elements degraded can be adjusted to obtain a desired average stiffness reduction. This approach allows the use of the same failure criteria and strengths throughout the entire facesheet. C.4.2.4 Extend Validation of the FE Results. The FE analysis should be validated further with existing test data [C-7]. It appears that detailed comparisons of the Hwang and Lacy model with measured strains were performed for a single specimen that exhibited good correlation with strength predictions. The types of comparisons should be extended to include local and global out-of-plane deflections as a function of load (e.g., the extent of dimple growth, the presence of front and/or back facesheet bulging). The ARAMIS results appear to be a good source for this deflection data. These detailed comparisons should also be extended to a wider range of configuration and damage combinations, similar to the comparisons of failure predictions. This would provide key insights into model capabilities and deficiencies, as well as possible remedies. In particular, specimens with different failure modes should be included in these assessments. An even broader set of test configurations, though with less detailed test measurements, are contained in
C-16

reference C-24, including different core and facesheet materials and facesheet layups. The use of this latter data requires approval from the Comanche program. C.4.2.5 Analyze Compact Compression Specimens. The stable facesheet fracture growth data obtained from the compact compression specimens discussed in reference C-19 provides an excellent opportunity for extending the FE modeling approach to address this failure mode. Analyses of these specimens should be pursued to develop modeling and calibration strategies. Successful strategies can then be incorporated into the primary model of CAI specimens. Additional testing will likely be needed to address materials and cores of interest, but work can likely initiate based on the existing data. C.4.2.6 Analyze the WSU Hole Specimens. The single facesheet and through-thickness hole specimens discussed in section 2.5 provide a good opportunity to ensure that the current model appropriately captures basic specimen responses. These specimens should be analyzed using the FE approach to help validate several key aspects. Although initial facesheet and core indentations are not present, the well-defined damage state eliminates numerous variables from the model. The through-thickness hole specimens will likely exhibit little bending, and failure predictions will serve as a good check of progressive facesheet damage approaches. The single facesheet specimens likely exhibit significant bending, and successful modeling will validate the model’s ability to properly capture the panel bending response and the progressive facesheet damage and any interactions. C.4.2.7 Evaluate the Effect of Initial Imperfection and Other Parameters on Specimen Response. Initial imperfections of the panel (i.e., differences from nominal shape) likely play an important role in specimen deflections. It has been clearly demonstrated that the initial deformed shape must be included in stability analyses and has become standard practice for cases where accurate predictions of large-deflection compression problems are required. Initial ARAMIS data may provide this information. The sensitivity of the specimen response, including dimple growth and arrest, bulging, and outward deflections, should be analytically evaluated over a range of realistic initial imperfections. Similar studies should be performed (or past studies extended) to evaluate the effect of other variables, such as core crush depth, residual facesheet properties, and indentation shape, on these same specimen responses. C.4.3 RESOLUTION OF ISSUES FROM EXISTING TEST DATA. The following recommendations address unresolved issues identified in the test data and support an increased understanding of the specimen responses. C.4.3.1 Investigate the Back Facesheet Buckling Failures on the Large Circular Hole Specimens. The response of the specimens with 4-inch-diameter, single facesheet holes should be investigated in more detail. In particular, the buckling of the back facesheet may artificially
C-17

increase the apparent failure load, providing an explanation for the relatively high strengths observed for the four-ply facesheet specimens. For example, if the back facesheet deflected towards the core, the specimen bending would relieve the compression load on the notched facesheet. Initial efforts should focus on a detailed review of existing data. Subsequent activities could include FE models to determine the variables that affect the response and additional tests to validate the findings. C.4.3.2 Determine the Causes of Strain Concentrations at the Edge of the Damage Zone. In much of the test data, strain concentrations were observed at the edge of the damage region. In some situations, however, the peak strains were located at the center of the damage. The causes for these different behaviors should be explored. Possible causes include the level of damage in the facesheet, the damage depth, the specimen configuration, and the initial imperfections in the panel shape. The location of the strain concentration may have a strong influence on the observed final failure mode. C.4.3.3 Explore Deformations Associated With Dimple Arrest. Two different studies [C-8 and C-13] observed dimple growth arrestment and subsequent facesheet fracture failure in wider specimens. In the former work, outward bulging was observed adjacent to the dimple, while outward deformations were seen in the latter study near the specimen edge along the damage growth path. These deformations may be a result of the dimple arrest or other causes (e.g., initial specimen imperfections or specimen width). In the latter case, these deformations may produce the dimple arrest. These issues should be investigated. Initial efforts should include a thorough review of the existing test data, and parameter sensitivity studies via analysis. Limited experiments may also be needed. C.4.3.4 Continue Investigations of Machined Notches. A good understanding of the residual strength of configurations with machined notches (holes and slits) provides a firm basis for judging the strength of impact-damaged configurations and for developing predictive models. Generally, these notched strengths may serve as lower bounds to the impact strength, and may also provide insight into the sensitivity of CAI strength to damage size. An asymptote in the residual strength curves for holes may also indicate a similar characteristic in the CAI residual strength curve. The most recent data addressing single facesheet and through-thickness holes, discussed in section 2.5, made some progress towards understanding the hole response. Unfortunately, the limited number of notch sizes and specimen replicates, in addition to the variations in w/d, make any conclusions rather speculative. These investigations should continue and be expanded to address slits. The following specific activities should be considered: • Additional testing either to validate the strengths observed in the previous testing or to
determine the level of scatter that is typical of both single facesheet and through-thickness holes. This will allow trends to be more confidently established.
C-18

• Testing of additional hole size and specimen width combinations to establish residual strength curves for a single w/d. Without well-established relationships addressing the specimen-size effect on residual strength, tests of differing w/d cannot be combined to isolate the notch-size effect.
• Testing of single facesheet and through-thickness machined slits. The hole data
discussed in section 2.5, in conjunction with WSU-generated CAI data, suggest that the notch-size sensitivities of single facesheet and through-thickness hole configurations are not closely related to impact-damaged configurations. The method proposed in reference C-22 assumed, without substantial basis, that the size sensitivity of impact-damaged configurations is identical to that of through-thickness slits. Data are needed to validate this assumption or to establish a more accurate alternative.
C.4.4 EXPANSION OF PROGRAM SCOPE. While the current scope of the FAA’s program is significant, additional areas should be addressed to provide coverage for the full range of issues associated with impact damage in composite aircraft structure. The following are recommendations to address these needs. C.4.4.1 Expand the Range of Damage Detectability Being Emphasized. The FAA experimental and analytical studies to date have concentrated primarily on damage near the threshold of detectability (TOD). More specifically, the effort has sought to determine the impact damages causing the largest strength reductions with the least amount of detectability. To the extent that these damages can realistically occur, they are critical considerations in designing a structure to ultimate load requirements. Data associated with easily visible damage are needed to address limit load requirements and in-service damage acceptability (i.e., allowable damage limits, (ADLs). Determining the damage types and levels that reduce the structure to Limit load capability requires that a range of easily visible damages be understood. Similar data are needed to determine damage types and levels that will reduce regions with high margins of safety to ultimate load capability, and therefore, serve as ADLs. A particularly apparent void in the data is easily visible damage scenarios with large sizes. C.4.4.2 Perform Large-Scale Impact Surveys. In service, a variety of blunt impact threats exist to aircraft structure, including loose tire treads and service vehicles. In the FAA work to date, 3-inch tups have been used to address blunt impacts without a significant understanding of how these events relate to other realistic blunt impact scenarios. A large-scale impact survey should be undertaken, using representative full-scale structure and impact events to address the lack of data in this area. Relationships between energy, impactors, and resulting damage will allow for an improved understanding of damage levels that must be considered in the design. It will help identify (1) the frequency of impacts with significant strength knockdowns and (2) the types of events that will be considered extraordinary and that must therefore rely on operator reporting.
C-19

C.4.4.3 Systematically Evaluate Multiple-Site Damage. In-service damage scenarios often include multiple damage sites in close proximity, which can degrade strength below that of either damage individually. Reference C-22 proposed the use of isotropic stress concentration factors for holes to address the interaction effects on residual strength. This approach may serve as a good starting point for initial experimental evaluations. Major variables to consider include damage spacing, relative damage size, relative damage severity, and damage positions relative to the loading direction. C.4.4.4 Explore Outward Facesheet and Sublaminate Buckling. An additional potential failure mode that has not been addressed in the FAA work is outward buckling (i.e., away from the core) of the damaged portion of the facesheet (or sublaminate). Scenarios with delamination but little or no dent are particularly likely to exhibit this behavior. Observation of this response in experimental studies of sandwich panels has not been widely reported. These studies [C-27 and C-28], however, have reported a related phenomenon in testing of sandwich panels with CFRP facesheets and notches. Specifically, they observed outward buckling of ±45° surface plies in a relatively narrow (e.g., 0.25-inch) band across the specimen width, accompanied by fiber kinking and microbuckling in the subsurface 0° plies. A cross section is shown in figure C-11.
FIGURE C-11. OUTWARD BUCKLING OF SURFACE PLY ALONG DAMAGE PROGRESSION LINE
A possible explanation for the absence of outward buckling of the impact-damaged region is that test specimens are generally flat, and the damage is predisposed to deform inward, due to residual indentations or mechanical links to the core. A reduced predisposition toward inward buckling is expected for impact damage on the convex surface of curved panels, particularly for scenarios with small residual indentations. Outward buckling was not reported by Vizzini in testing of such configurations, however, but details of the damage states were not provided. Possible failure modes associated with outward buckling include static delamination growth, fatigue delamination growth, and facesheet fracture due to the reduced stiffness of the buckled
C-20

region. In reference C-22, these modes were avoided by requiring configurations with small residual indentation depths to have (1) no static mode, one delamination growth at ultimate load; (2) no delamination buckling at operating loads; and (3) no facesheet fracture at ultimate load, respectively. These criteria were typically more critical than experimental strengths for panels with small residual indentations, but no observed outward buckling. An experimental program should be pursued to determine if, and under what realistic conditions, outward buckling will occur. If it does occur, the range of configuration and damage variables over which it can occur should be defined, and associated static and fatigue failure modes should be evaluated. Key variables are likely to include panel curvature, damage size, residual indentation, and delamination depth. Facesheet material form (i.e., tape versus fabric) may play a key role, since it can have a significant influence on delamination locations. Robust FE analysis may be useful in determining specimen or damage configurations that are likely to exhibit this phenomenon. C.4.4.5 Clarify Acceptability and Criticality of Dimple Growth Initiation. Design criteria typically require that there be no detrimental damage growth prior to limit load. If dimple propagation is considered to be detrimental and the dimple propagation initiates at load levels less than 2/3 of the final failure loads, then it becomes the controlling condition. Understanding the relative criticality of the growth initiation and the failure may decrease the importance of accurate prediction of final failure for this mode. If so, then only the simpler problem of dimple propagation need be considered. C.4.4.6 Explore Facesheet Springback. Facesheet springback plays a key role in sandwich damage tolerance by reducing the damage visibility. A clear understanding of the circumstances when it can or does occur would limit the negative impact of this response. Limited results [C-22] have indicated that a critical damage diameter-to-residual indentation depth ratio (i.e., d/y) may exist for a given facesheet thickness, below which springback does not occur and above which it might occur. These findings should be critically assessed, including the effect of impact, core, and configuration variables on such a critical d/y value. Substantial data to support this effort is available in reference C-24. In addition, existing impact survey data within the WSU database, with some augmentation using pieces of failed panels, could provide further data needed for this assessment. The effect of springback on residual strength should also be evaluated. One key variable is the magnitude of facesheet springback. Studies should determine whether this magnitude has a strong influence on the residual strength for a given core crush configuration. If not, then the development of more simplified models might be possible. In reference C-22, for example, residual strength with impact damage was related to the damage severity, as measured by d/y. It was then postulated that the strength for a configuration with springback was related to the strength of that configuration with damage severity associated with the point of maximum facesheet indentation that occurred during the impact event. Studies should also identify any failure mode trends associated with such scenarios.
C-21

C.4.4.7 Investigate Durability of Low-Visibility Damage. The long-term durability of damage scenarios with little or no facesheet damage should be assessed to ensure significant strength degradation does not occur in nondetectable damages. Studies of mechanical cycling alone have shown no extraordinary degradations [C-6]. These investigations should be extended to address moisture transport and core damage propagation when exposed to hygro-thermal-mechanical cycling (individually and combined) typical of aircraft service environments. C.4.4.8 Pursue NDI Techniques to Help Characterize Key Parameters for Residual Strength Prediction. Analytical models continue to require parameters that are not obtained by standard in-service NDI techniques. Most obvious is a quantification of the level of stiffness degradation caused by the facesheet damage. Another elusive measurement is the core crush depth. Development of promising inspection techniques (e.g., lamb-wave methods) should be pursued aggressively. C.4.4.9 Explore Techniques for Obtaining Residual Stiffness of Impact-Damaged Regions. Approaches for measuring or predicting the residual stiffness of the damaged regions of panels should be explored. These could support residual strength predictions. In addition, stiffness considerations are often more critical than strength for flight control surfaces (due to flutter requirements). C.4.4.10 Develop a Database of all Test Specimens. A single source of verified information regarding each test specimen is needed, which does not appear to exist. This would minimize the potential for losing the data, and allows easy transfer to people not involved in the actual testing. Key information includes specimen details (e.g., materials, layups, and size), impact-event data (e.g., impactor, energy, velocity, and peak force), damage details (e.g., damage types and dimensions), and test details (e.g., supports and load and deflections at failure). There are several options for the format, but the selected approach should be simple enough for typical engineers to use (e.g., large spreadsheet). C.4.4.11 Create an Industry Advisory Team. An advisory committee consisting of key individuals with substantial experience in addressing residual strength of sandwich panels could prove invaluable to developing a good understanding of this problem. Their role could include reviewing the overall program plans and making associated recommendations and providing a detailed review of intermediate progress and working with the program team to define near-term activities to address shortcomings. In addition, the team could also help in establishing appropriate tools to support design development, once the understanding was sufficiently mature. Individuals to consider for this team include (but are not limited to) Christos Kassapoglou, Ric Abbott, Jeff Schaff, Al Dobyns, Pierre Minguet, and Doug Cairns.
C-22

C.5 REFERENCES. C-1. Tomblin, J.S., Lacy, T., Smith, B., Hoopes, S., Vizzini, A., and Lee, S., “Review of
Damage Tolerance for Composite Sandwich Airframe Structures,” FAA report DOT/FAA/AR-99/49, August 1999.
C-2. Moody, R.C. and Vizzini, A.J., “Damage Tolerance of Composite Sandwich Structures,” FAA report DOT/FAA/AR-99/91, January 2000.
C-3. Tomblin, J.S., Raju, K.S., Liew, J., and Smith, B.L., “Impact Damage Characterization and Damage Tolerance of Composite Sandwich Airframe Structures,” FAA report DOT/FAA/AR-00/44, January 2001.
C-4. Lacy, T.E., Samarah I.K., and Tomblin J.S., “Damage Resistance Characterization of Sandwich Composites Using Response Surfaces,” FAA report DOT/FAA/AR-01/71, March 2002.
C-5. Moody, R.C. and Vizzini, A.J., “Test and Analysis of Composite Sandwich Panels with Impact Damage,” FAA report DOT/FAA/AR-01/124, March 2002.
C-6. Tomblin, J.S., Raju, K.S., Acosta, J., Smith, B., and Romina, N., “Impact Damage Characterization and Damage Tolerance of Composite Sandwich Airframe Structures—Phase II, FAA report DOT/FAA/AR-02/80, October 2002.
C-7. Lacy, T.E., Samarah, I.K., and Tomblin, J.S., “Damage Tolerance Characterization of Sandwich Composites Using Response Surfaces,” FAA report DOT/FAA/AR-02/101, November 2002.
C-8. Moody, R.C., Harris, J.S., and Vizzini, A.J., “Scaling and Curvature Effects on the Damage Tolerance of Impacted Composite Sandwich Panels,” Journal of Sandwich Structures and Materials, Vol. 4, 2002, pp. 71-82.
C-9. Shyprykevich, P., Tomblin, J., Ilcewicz, J., Vizzini, A., Lacy T., and Hwang, Y., “Guidelines for Analysis, Testing, and Nondestructive Inspection of Impact-Damaged Composite Sandwich Structures, FAA report DOT/FAA/AR-02/121, March 2003.
C-10. Hwang, Y., “Numerical Analysis of Impact-Damaged Sandwich Composites,” Ph.D. Thesis, Wichita State University, 2003.
C-11. Lacy, T.E and Hwang, Y., “Numerical Modeling of Impact-Damaged Sandwich Composites Subjected to Compression-After-Impact Loading,” Composite Structures, Vol. 61, 2003, pp. 115-128.
C-12. Hwang, Y. and Lacy, T.E., “Numerical Estimates of the Compressive Strength of Impact-Damaged Sandwich Composites,” to appear in Proceeding of the AC/ASTM-D30 Joint 19th Annual Technical Conference, October 2004.
C-23

C-13. Tomblin, J.S., Raju, K.S., and Arosteguy, G., “Damage Resistance and Tolerance of Composite Sandwich Panels—Scaling Effects,” FAA report DOT/FAA/AR-03/75, February 2005.
C-14. Xie, Z. and Vizzini, A.J., “A Feasible Methodology for Engineering Applications in Damage Tolerance of Composite Sandwich Structures,” Journal of Composite Materials, Vol. 38, No. 11, 2004, pp. 891-914.
C-15. Dost, E.F., Ilcewicz, L.B., and Gosse, J.H., “Sublaminate Stability Based Modeling of Impact-Damaged Composite Laminates,” 3rd Technical Conference on Composite Materials, Am. Soc. of Composites, September 1988, pp. 354-363.
C-16. Edgren, F., Asp, L.E., and Bull, P.H., “Compressive Failure of Impacted NCF Composite Sandwich Panels—Characterization of the Failure Process,” Journal of Composite Materials, Vol. 38, No. 6, 2004, pp. 495-514.
C-17. Minguet, P.J., “A Model for Predicting the Behavior Of Impact-Damaged Minimum Gage Sandwich Panels Under Compression,” AIAA Paper 91-1075-CP, 32nd AIAA/ASME/ ASCE/AHS/ASC Structures, Structural Dynamics, and Materials Conference, Baltimore, Maryland, 1991, pp. 1112-1122.
C-18. Tsang, P.H.W., “Impact Resistance and Damage Tolerance of Composite Sandwich Panels,” Ph.D. Thesis, Massachusetts Institute of Technology, June 1994.
C-19. Ratcliffe, J.G., Jackson, W.C., and Schaff, J., “Compression Strength Prediction of Impact-Damaged Composite Sandwich Panels,” American Helicopter Society 60th Annual Forum, Baltimore, Maryland, 2004.
C-20. Soutis, C. and Fleck, N.A., “Static Compression Failure of Carbon Fibre T800/924C Composite Plane with a Single Hole,” Journal of Composite Materials, Vol. 24, May 1990, pp. 536-558.
C-21. Soutis, C., Fleck, N.A., and Smith, P.A., “Failure Prediction Technique for Compression Loaded Carbon Fiber-Epoxy Laminate With Open Holes,” Journal of Composite Materials, Vol. 25, November 1991, pp. 1476-1498.
C-22. Walker, T.H., Graesser, D.L, et al., “Damage Assessment for Composite Sandwich Structure,” AIAA Paper 2003-1596, 44th AIAA/ASME/ASCE/AHS/ASC Structures, Structural Dynamics, and Materials Conference, Norfolk, Virginia, April 2003.
C-23. Walker, T.H., Review of Draft Report “Guidelines for Analysis, Testing, and Non-destructive Inspection of Impact Damaged Composite Sandwich Structure,” NSE Composites Report 2003-01, February 2003.
C-24. Unpublished Comanche test program conducted by NSE Composites and Integrated Technologies, Inc., under funding provided by Boeing-Philadelphia.
C-24

C-25. Tsang, P.H.W. and Lagace, P.A., “Failure Mechanisms of Impact-Damaged Sandwich Panels Under Uniaxial Compression,” 35th AIAA/ASME/ASCE/AHS/ASC Structures, Structural Dynamics, and Materials Conference, Hilton Head, South Carolina, 1994, pp. 745-754.
C-26. Nyman, T., Bedberg, A., and Schon, J., “Equivalent Damage and Residual Strength for Impact-Damaged Composite Structures, Proceedings of the ASC 13th
Annual Technical Conference on Composite Materials, Baltimore, Maryland, 1998.
C-27. Toribio, M.G., Mirazo, J.M., and Spearing, S.M., “On the Compressive Response of Notched Composite Sandwich Panels,” AIAA Paper AIAA-99-1415, 40th
AIAA/ASME/ASCE/AHS/ASC Structures, Structural Dynamics, and Materials Conference, St. Louis, Missouri, 1999.
C-28. Mirazo, J.M. and Spearing, S.M., “Damage Modeling of Notched Graphite/Epoxy Sandwich Panels in Compression,” Applied Composite Materials, Vol. 8, 2001, pp. 191-216.
C-25/C-26