Damage detection and identification in beam structure using ... · The effects of different crack...
14
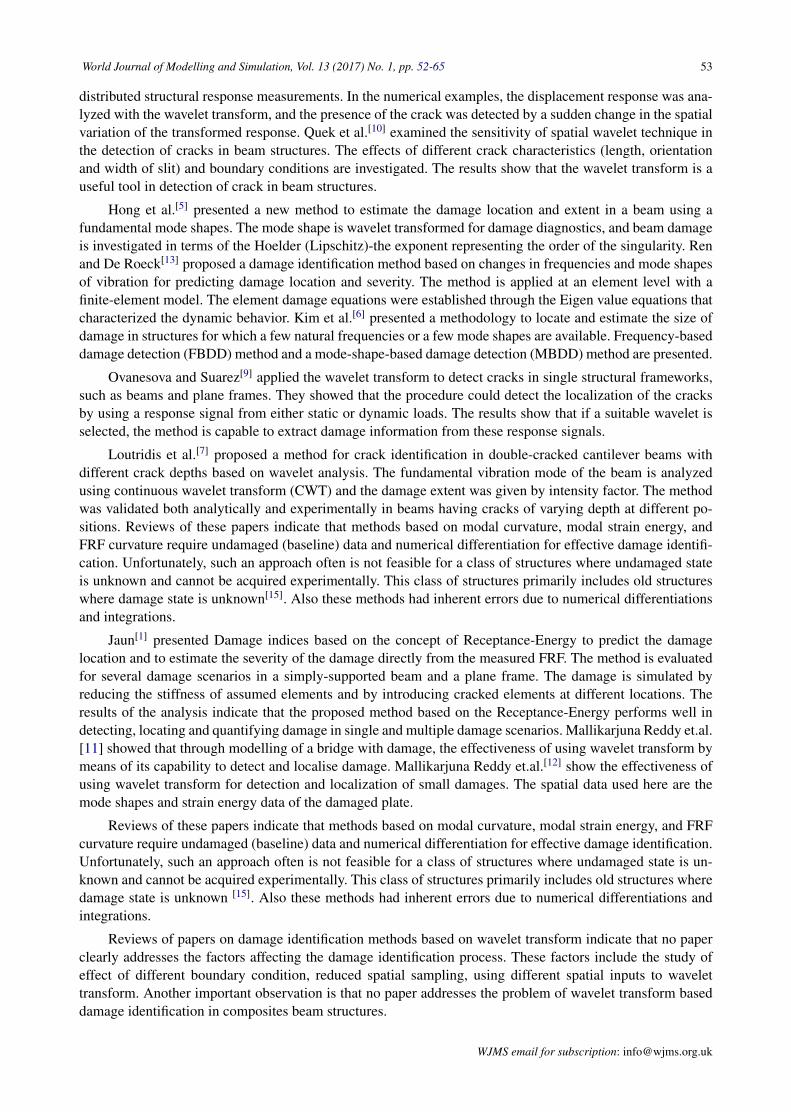
ISSN 1 746-7233, England, UK World Journal of Modelling and Simulation Vol. 13 (2017) No. 1, pp. 52-65 Damage detection and identification in beam structure using modal data and wavelets Shivasharanayya Swamy 1 , D Mallikarjuna Reddy 2* , Jaya Prakash G 1 School of Mechanical Engineering, REVA University, Bangalore, India-560064 2 School of Mechanical & Building Science, VIT-University, Vellore, India-632014 3 Finite element engineer, Infosys Pvt. Ltd, Bangalore-560064 (Received March 4 2016, Accepted September 27 2016) Abstract. In this paper, existing structural damage identification methods based on dynamic characteristics of structures are examined and new method of damage identification in beam structures based on continu- ous wavelet transform is presented and compared. A three dimensional plot of wavelet coefficients plotted in scale-translation plane provide necessary detection and localization of structural damage by showing high wavelet coefficients at the damage location. Damage is defined as the reduction in percentage of young’s modulus and numerically simulated by reducing the stiffness of the assumed element. The proposed method is numerically and experimentally evaluated on a simple finite element beam model. The results of analy- sis indicate that the proposed continuous wavelet transform based damage identification method effectively identify single as well as multiple damages using only the fundamental mode shape. Hence, it is shown that proposed method has the potential to identify damage in structures. Keywords: structural health monitoring, damage detection, signal processing, spatial wavelets 1 Introduction The condition assessment of existing civil structures such as buildings, highway and railways bridges and structures of airports, ports, and water treatment plants is crucial to prevent potential catastrophic events and for planning the future investments in repair and rehabilitation of this infrastructure. The process of imple- menting condition/damage detection and monitoring strategy for aerospace, civil and mechanical engineering infrastructure is commonly referred to as structural health monitoring (SHM). Here damage is defined as changes to the material and/or geometric properties of these systems, including changes to the boundary con- ditions and system connectivity, which adversely affect the system’s performance [4] . Salawu and Williams [14] investigated the performance of four damage detection methods. One method is based on changes in the Eigen parameters and the others use system identification and model updating procedures. The results showed that the Eigen parameter method is the best, although it was incapable of locating the damage in a lightly stressed zone. Chance, et al. [2] found that numerically calculating curvature mode shapes resulted in unacceptable er- rors. They used measured strains instead of using curvature calculated from mode shapes, which improved results dramatically. They concluded that strain mode shape facilitated the localization of crack markedly. Stubbs and Osegueda [8] presented a method for damage identification based on changes in modal character- istics. Expressions relating variations in stiffness’s of structural members to the variations in modal stiffness were generated using matrix structural analysis. Damage was defined as a reduction in the stiffness of one of the elements forming the structure. The stiffness reductions were located by solving a general inverse problem. Wang and Deng [16] presented a structural damage detection technique based on wavelet analysis of spatially * Corresponding author. E-mail address: [email protected] Published by World Academic Press, World Academic Union
Transcript of Damage detection and identification in beam structure using ... · The effects of different crack...
ISSN 1 746-7233, England, UKWorld Journal of Modelling and Simulation
Vol. 13 (2017) No. 1, pp. 52-65
Damage detection and identification in beam structure using modal data andwavelets
Shivasharanayya Swamy1, D Mallikarjuna Reddy2∗, Jaya Prakash G
1 School of Mechanical Engineering, REVA University, Bangalore, India-5600642 School of Mechanical & Building Science, VIT-University, Vellore, India-632014
3 Finite element engineer, Infosys Pvt. Ltd, Bangalore-560064
(Received March 4 2016, Accepted September 27 2016)
Abstract. In this paper, existing structural damage identification methods based on dynamic characteristicsof structures are examined and new method of damage identification in beam structures based on continu-ous wavelet transform is presented and compared. A three dimensional plot of wavelet coefficients plottedin scale-translation plane provide necessary detection and localization of structural damage by showing highwavelet coefficients at the damage location. Damage is defined as the reduction in percentage of young’smodulus and numerically simulated by reducing the stiffness of the assumed element. The proposed methodis numerically and experimentally evaluated on a simple finite element beam model. The results of analy-sis indicate that the proposed continuous wavelet transform based damage identification method effectivelyidentify single as well as multiple damages using only the fundamental mode shape. Hence, it is shown thatproposed method has the potential to identify damage in structures.
Keywords: structural health monitoring, damage detection, signal processing, spatial wavelets
1 Introduction
The condition assessment of existing civil structures such as buildings, highway and railways bridges andstructures of airports, ports, and water treatment plants is crucial to prevent potential catastrophic events andfor planning the future investments in repair and rehabilitation of this infrastructure. The process of imple-menting condition/damage detection and monitoring strategy for aerospace, civil and mechanical engineeringinfrastructure is commonly referred to as structural health monitoring (SHM). Here damage is defined aschanges to the material and/or geometric properties of these systems, including changes to the boundary con-ditions and system connectivity, which adversely affect the system’s performance[4]. Salawu and Williams[14]
investigated the performance of four damage detection methods. One method is based on changes in the Eigenparameters and the others use system identification and model updating procedures. The results showed thatthe Eigen parameter method is the best, although it was incapable of locating the damage in a lightly stressedzone. Chance, et al.[2]found that numerically calculating curvature mode shapes resulted in unacceptable er-rors. They used measured strains instead of using curvature calculated from mode shapes, which improvedresults dramatically. They concluded that strain mode shape facilitated the localization of crack markedly.Stubbs and Osegueda[8] presented a method for damage identification based on changes in modal character-istics. Expressions relating variations in stiffness’s of structural members to the variations in modal stiffnesswere generated using matrix structural analysis. Damage was defined as a reduction in the stiffness of one ofthe elements forming the structure. The stiffness reductions were located by solving a general inverse problem.Wang and Deng[16] presented a structural damage detection technique based on wavelet analysis of spatially
∗ Corresponding author. E-mail address: [email protected]
Published by World Academic Press, World Academic Union
World Journal of Modelling and Simulation, Vol. 13 (2017) No. 1, pp. 52-65 53
distributed structural response measurements. In the numerical examples, the displacement response was ana-lyzed with the wavelet transform, and the presence of the crack was detected by a sudden change in the spatialvariation of the transformed response. Quek et al.[10] examined the sensitivity of spatial wavelet technique inthe detection of cracks in beam structures. The effects of different crack characteristics (length, orientationand width of slit) and boundary conditions are investigated. The results show that the wavelet transform is auseful tool in detection of crack in beam structures.
Hong et al.[5] presented a new method to estimate the damage location and extent in a beam using afundamental mode shapes. The mode shape is wavelet transformed for damage diagnostics, and beam damageis investigated in terms of the Hoelder (Lipschitz)-the exponent representing the order of the singularity. Renand De Roeck[13] proposed a damage identification method based on changes in frequencies and mode shapesof vibration for predicting damage location and severity. The method is applied at an element level with afinite-element model. The element damage equations were established through the Eigen value equations thatcharacterized the dynamic behavior. Kim et al.[6] presented a methodology to locate and estimate the size ofdamage in structures for which a few natural frequencies or a few mode shapes are available. Frequency-baseddamage detection (FBDD) method and a mode-shape-based damage detection (MBDD) method are presented.
Ovanesova and Suarez[9] applied the wavelet transform to detect cracks in single structural frameworks,such as beams and plane frames. They showed that the procedure could detect the localization of the cracksby using a response signal from either static or dynamic loads. The results show that if a suitable wavelet isselected, the method is capable to extract damage information from these response signals.
Loutridis et al.[7] proposed a method for crack identification in double-cracked cantilever beams withdifferent crack depths based on wavelet analysis. The fundamental vibration mode of the beam is analyzedusing continuous wavelet transform (CWT) and the damage extent was given by intensity factor. The methodwas validated both analytically and experimentally in beams having cracks of varying depth at different po-sitions. Reviews of these papers indicate that methods based on modal curvature, modal strain energy, andFRF curvature require undamaged (baseline) data and numerical differentiation for effective damage identifi-cation. Unfortunately, such an approach often is not feasible for a class of structures where undamaged stateis unknown and cannot be acquired experimentally. This class of structures primarily includes old structureswhere damage state is unknown[15]. Also these methods had inherent errors due to numerical differentiationsand integrations.
Jaun[1] presented Damage indices based on the concept of Receptance-Energy to predict the damagelocation and to estimate the severity of the damage directly from the measured FRF. The method is evaluatedfor several damage scenarios in a simply-supported beam and a plane frame. The damage is simulated byreducing the stiffness of assumed elements and by introducing cracked elements at different locations. Theresults of the analysis indicate that the proposed method based on the Receptance-Energy performs well indetecting, locating and quantifying damage in single and multiple damage scenarios. Mallikarjuna Reddy et.al.[11] showed that through modelling of a bridge with damage, the effectiveness of using wavelet transform bymeans of its capability to detect and localise damage. Mallikarjuna Reddy et.al.[12] show the effectiveness ofusing wavelet transform for detection and localization of small damages. The spatial data used here are themode shapes and strain energy data of the damaged plate.
Reviews of these papers indicate that methods based on modal curvature, modal strain energy, and FRFcurvature require undamaged (baseline) data and numerical differentiation for effective damage identification.Unfortunately, such an approach often is not feasible for a class of structures where undamaged state is un-known and cannot be acquired experimentally. This class of structures primarily includes old structures wheredamage state is unknown [15]. Also these methods had inherent errors due to numerical differentiations andintegrations.
Reviews of papers on damage identification methods based on wavelet transform indicate that no paperclearly addresses the factors affecting the damage identification process. These factors include the study ofeffect of different boundary condition, reduced spatial sampling, using different spatial inputs to wavelettransform. Another important observation is that no paper addresses the problem of wavelet transform baseddamage identification in composites beam structures.
WJMS email for subscription: [email protected]
54 Shivasharanayya Swamy &D.M.Reddy&Jaya Prakash G: Damage detection and identification
The present work includes the study of existing damage identification based on using only the modaldata and development of a new method of damage identification based on wavelet transform. All the factorsaffecting the proposed method of Wavelet based damage identification is investigated in detail. The efficiencyof the method is investigated primarily in terms of the spatial input used, choices of wavelets and scales.Numerical as well as experimental study is done on a simple structural beam model.
2 Methodology
The Fourier analysis consists in transforming a signal from the time or space domain to the frequencydomain. The Fourier transform is used to extract the modal information (natural frequencies and vibrationmodes), or it is used to calculate the FRF from a transient time signal. The theory of the Fourier transformis very well established, and it is a quick and easy tool to find the frequency components in a signal. Adisadvantage of the Fourier analysis is that the time or space information is lost in the transformation, and itis not possible to determine when or where a local event occurs, which is necessary in damage identification.
In order to overcome this drawback, wavelet analysis has been considered recently for structural iden-tification and damage detection. Wavelet analysis may be viewed as an extension of the traditional Fouriertransform with a window adjustable in location and size. The advantage of wavelet analysis lies in its capacityto examine local information with a “zoom lens having an adjustable focus” to provide multiple levels ofdetails and approximations of the original signal.
2.1 Continuous wavelet transforms (CWT)
The Continuous Wavelet Transform (CWT) is defined as the sum over all time of the signal function oftime or space (infinite) multiplied by a scaled, shifted version of a wavelet function . For a spatial signal,
Wf(u, s) =
∞∫−∞
f (x)ψ(u, s, x)dx. (1)
where, f(x) is the spatial input signal, and x being the spatial coordinate. The results of the CWT arewavelet coefficients Wf(u, s) that are a function of the scale s and position u. Since the input is spatial signalthe wavelet transform is called Spatial Wavelet Transform. In case of damage identification in beam structures,the input signal may be mode shape, modal strain energy or the forced vibration data, where x is length ofbeam or node (element) number.
To perform the CWT, a basic wavelet function must be selected from the existing wavelet families. Thebasic wavelet function, known as the “mother wavelet” ψ(x) is dilated by a value s and translated by theparameter u.
The dilation (expansion or compression) and the translation yield a set of basis functions defined as
ψ(s, u, x) =1√sψ
(x− u
s.
)(2)
The translation parameter, u, indicates the space (or time) position of the relocated wavelet window in thewavelet transform. Shifting the wavelet window along the space (or time) axis implies examining the signalf(x) in the neighborhood of the current window location. The scale parameter, s, indicates the width of thewavelet window.
The wavelets coefficients defined in equation indicate how similar is the function f(x) being analyzed tothe wavelet function ψ(s, u, x)
In terms of a selected mother wavelet function ψ(x), the continuous wavelet transform of a signal f(x)is defined as (Daubechies, 1992)[3]
Wf(s, u) =1√s
∞∫−∞
f(x)ψ(x− u
s
)dx. (3)
WJMS email for contribution: [email protected]
World Journal of Modelling and Simulation, Vol. 13 (2017) No. 1, pp. 52-65 55
The wavelet transform can detect and characterize transients (caused due to damage) in a spatial signalwith zooming procedure across scales. The wavelet coefficients measures the variation of f(x) in a neighbor-hood of u whose size is proportional to s. Sharp transients create large amplitude wavelet coefficients. Thushigh wavelet coefficients Wf(u, s) at a particular point on the spatial signal detects and locates the damage(Level I and II identification)
2.2 Vanishing moments
If a wavelet has N vanishing moments it is blind to polynomial up to order N-1. This is expressed math-ematically as
+∞∫−∞
xnψ(x)dx = 0Forn = 0, 1N − 1. (4)
A way to obtain a wavelet with N vanishing moments is to take the Nth derivative of the smooth functionφ(x), called the scaling function.
1√s
+∞∫−∞
f(x)ψ(
x−bs
)dx = (−s)N
√s
+∞∫−∞
f(x)(
dN
dxN φ(
x−bs
))dx
= (−s)N
√s
+∞∫−∞
(dN
dxN f(x))φ(
x−bs
)dx.
(5)
The wavelet transform of f(x) with a mother wavelet having N vanishing moments is a smoothenedversion of the Nth derivative of f(x) at various scales[7].
This clearly shows the importance of choosing an appropriate mother wavelet to analyze a spatially dis-tributed signal for identification of damage. A wavelet with one vanishing moment will derive properties fromsignal f(x) that are related to first derivative of the signal. This similarly happens for higher order derivatives.Thus, to extract relevant information corresponding to a particular derivative of input signal the selection ofvanishing moments for mother wavelet should be done accordingly. It has been proved that the minimum num-ber of vanishing moments required to identify damage using the mode shapes as input to wavelet transform istwo[5].
2.3 Selection of mother wavelet
Higher vanishing moments has the advantage of being able to measure Hoelder exponent of high order.On the other hand, if the wavelet has higher vanishing moments, localization worsens because support lengthincreases. Daubechies[3] proved that if a wavelet has n vanishing moments, its support length must be at least2n− 1. Therefore a compromise between number of vanishing moments and adequate localization should beaccomplished.
2.4 Selection of scales
A high value of scale corresponds to big wavelets, so that low spatial-frequency components can belooked through, while a low level of scale corresponds to small wavelet suitable for the analysis of highfrequency components[7]. Since local perturbation in spatial signal caused due to presence of damage is highfrequency component, it is desirable to use lower values of scales. Another important advantage of CWT ascompared to discrete wavelet transform is the redundancy of information provided for analysis. This suggeststhat wavelet coefficients can be estimated for any given value of scale.
Damage identification based on wavelet transform is carried out utilizing the special properties of CWT,discussed previously. Damage detection and localization is done by observing high wavelet coefficients inscale-translation plane and quantification is done by estimating Hoelder exponent and intensity factor at thedamaged location. Next chapter presents damage simulations on a simple numerical beam model and identifi-cation of damage using CWT, and also experimental verification of the proposed method.
WJMS email for subscription: [email protected]
56 Shivasharanayya Swamy &D.M.Reddy&Jaya Prakash G: Damage detection and identification
2.5 Damage identification procedure
The present wavelet based damage identification procedure as follows. The input to the continuouswavelet transform is the spatial signal which can be displacement mode shape or the strain energy measure-ment. The spatial signal is convolved with mother wavelet (e.g., Complex Gaussian Wavelets) for differentwavelet scales to get a matrix of wavelet coefficients. The number of rows and column of the coefficient matrixare respectively equal to the size of spatial signal and the number of wavelet scales. Damage can be detectedand located by plotting a 3- D graph of wavelet coefficients in scale- translation (Node/element number orlength of beam) plane. Any point of high wavelet coefficients on the translation axis, indicate damage and theposition of the same helps in locating the damage. The same procedure can be repeated for different damageseverity.
3 Numerical simulation
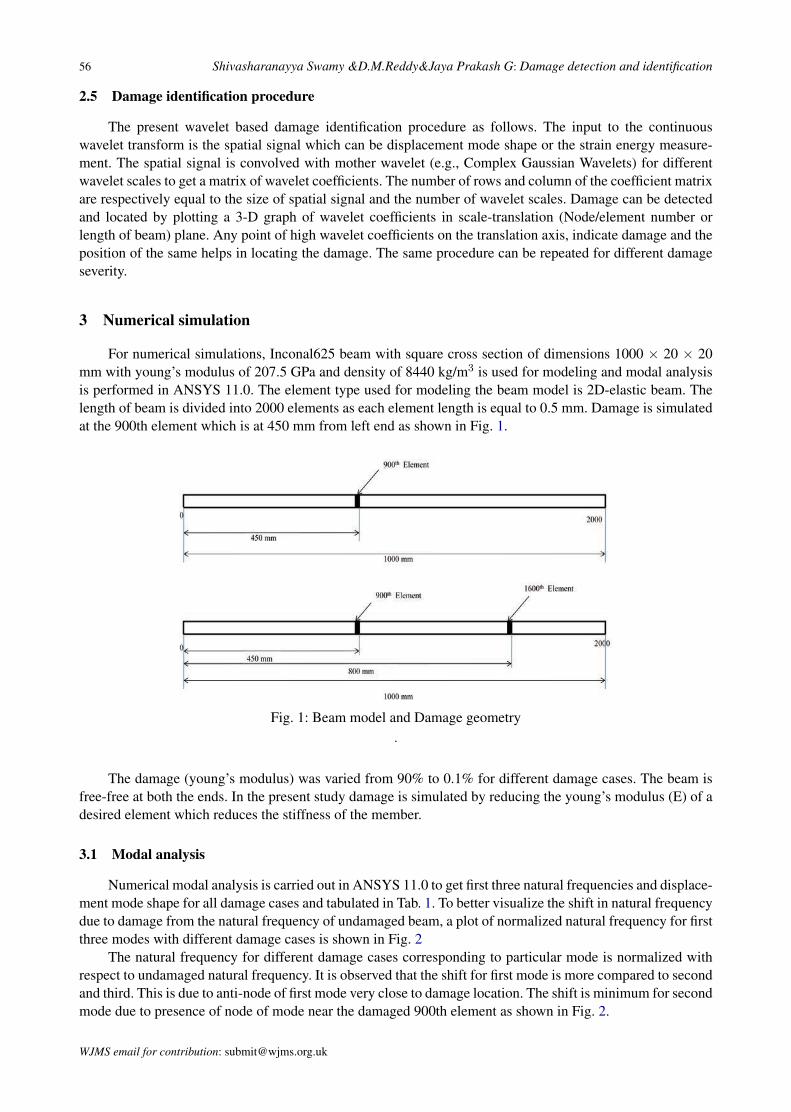
For numerical simulations, Inconal625 beam with square cross section of dimensions 1000 × 20 × 20mm with young’s modulus of 207.5 GPa and density of 8440 kg/m3 is used for modeling and modal analysisis performed in ANSYS 11.0. The element type used for modeling the beam model is 2D- elastic beam. Thelength of beam is divided into 2000 elements as each element length is equal to 0.5 mm. Damage is simulatedat the 900th element which is at 450 mm from left end as shown in Fig. 1.
Fig. 1: Beam model and Damage geometry.
The damage (young’s modulus) was varied from 90% to 0.1% for different damage cases. The beam isfree- free at both the ends. In the present study damage is simulated by reducing the young’s modulus (E) of adesired element which reduces the stiffness of the member.
3.1 Modal analysis
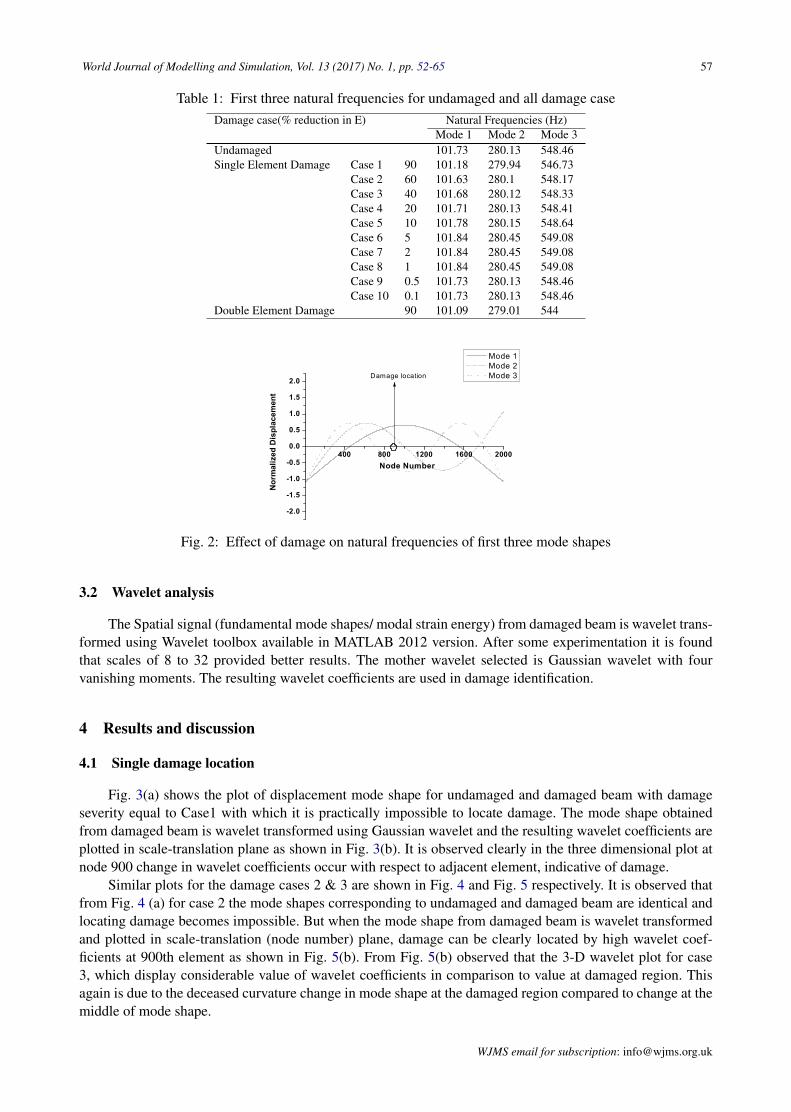
Numerical modal analysis is carried out in ANSYS 11.0 to get first three natural frequencies and displace-ment mode shape for all damage cases and tabulated in Tab. 1. To better visualize the shift in natural frequencydue to damage from the natural frequency of undamaged beam, a plot of normalized natural frequency for firstthree modes with different damage cases is shown in Fig. 2
The natural frequency for different damage cases corresponding to particular mode is normalized withrespect to undamaged natural frequency. It is observed that the shift for first mode is more compared to secondand third. This is due to anti- node of first mode very close to damage location. The shift is minimum for secondmode due to presence of node of mode near the damaged 900th element as shown in Fig. 2.
WJMS email for contribution: [email protected]
World Journal of Modelling and Simulation, Vol. 13 (2017) No. 1, pp. 52-65 57
Table 1: First three natural frequencies for undamaged and all damage caseDamage case(% reduction in E) Natural Frequencies (Hz)
Mode 1 Mode 2 Mode 3Undamaged 101.73 280.13 548.46Single Element Damage Case 1 90 101.18 279.94 546.73
Case 2 60 101.63 280.1 548.17Case 3 40 101.68 280.12 548.33Case 4 20 101.71 280.13 548.41Case 5 10 101.78 280.15 548.64Case 6 5 101.84 280.45 549.08Case 7 2 101.84 280.45 549.08Case 8 1 101.84 280.45 549.08Case 9 0.5 101.73 280.13 548.46Case 10 0.1 101.73 280.13 548.46
Double Element Damage 90 101.09 279.01 544
400 800 1200 1600 2000
-2.0
-1.5
-1.0
-0.5
0.0
0.5
1.0
1.5
2.0
Nor
mal
ized
Dis
plac
emen
t
Node Number
Mode 1 Mode 2 Mode 3Damage location
Fig. 2: Effect of damage on natural frequencies of first three mode shapes
3.2 Wavelet analysis
The Spatial signal (fundamental mode shapes/ modal strain energy) from damaged beam is wavelet trans-formed using Wavelet toolbox available in MATLAB 2012 version. After some experimentation it is foundthat scales of 8 to 32 provided better results. The mother wavelet selected is Gaussian wavelet with fourvanishing moments. The resulting wavelet coefficients are used in damage identification.
4 Results and discussion
4.1 Single damage location
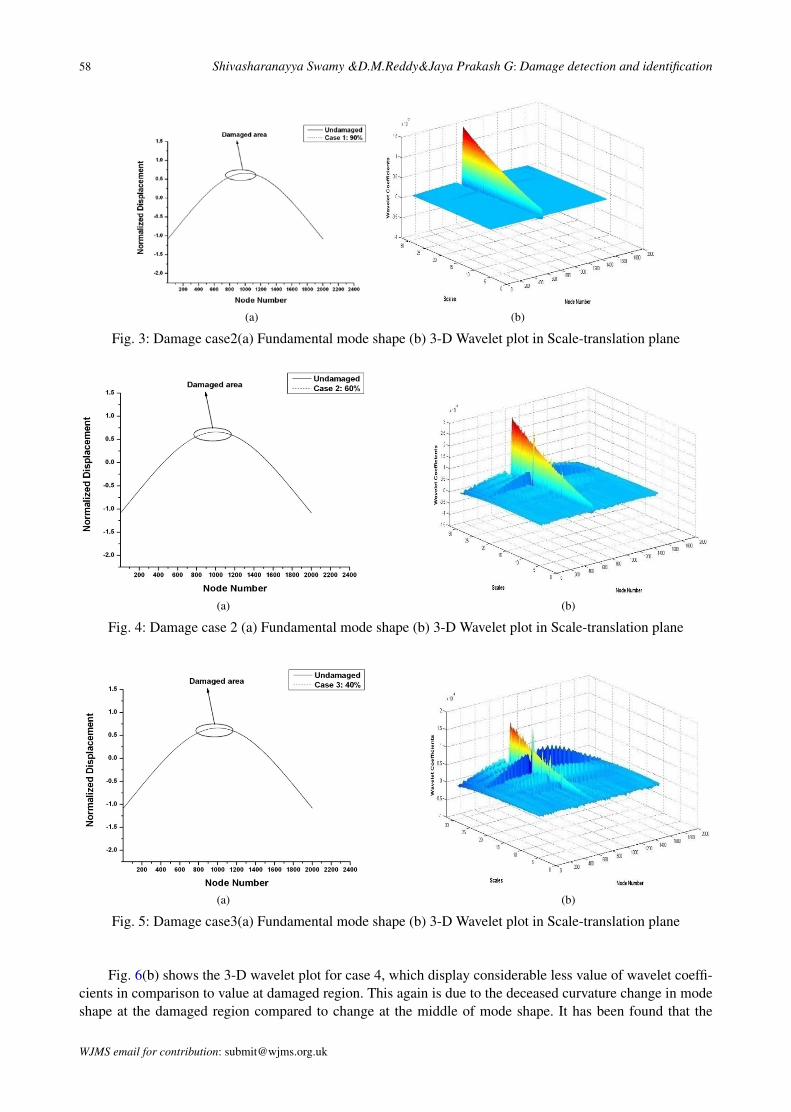
Fig. 3(a) shows the plot of displacement mode shape for undamaged and damaged beam with damageseverity equal to Case1 with which it is practically impossible to locate damage. The mode shape obtainedfrom damaged beam is wavelet transformed using Gaussian wavelet and the resulting wavelet coefficients areplotted in scale-translation plane as shown in Fig. 3(b). It is observed clearly in the three dimensional plot atnode 900 change in wavelet coefficients occur with respect to adjacent element, indicative of damage.
Similar plots for the damage cases 2 & 3 are shown in Fig. 4 and Fig. 5 respectively. It is observed thatfrom Fig. 4 (a) for case 2 the mode shapes corresponding to undamaged and damaged beam are identical andlocating damage becomes impossible. But when the mode shape from damaged beam is wavelet transformedand plotted in scale-translation (node number) plane, damage can be clearly located by high wavelet coef-ficients at 900th element as shown in Fig. 5(b). From Fig. 5(b) observed that the 3-D wavelet plot for case3, which display considerable value of wavelet coefficients in comparison to value at damaged region. Thisagain is due to the deceased curvature change in mode shape at the damaged region compared to change at themiddle of mode shape.
WJMS email for subscription: [email protected]
58 Shivasharanayya Swamy &D.M.Reddy&Jaya Prakash G: Damage detection and identification
(a)
(b)
Fig. 3: Damage case2(a) Fundamental mode shape (b) 3-D Wavelet plot in Scale-translation plane
(a)
(b)
Fig. 4: Damage case 2 (a) Fundamental mode shape (b) 3-D Wavelet plot in Scale-translation plane
(a)
(b)
Fig. 5: Damage case3(a) Fundamental mode shape (b) 3-D Wavelet plot in Scale-translation plane
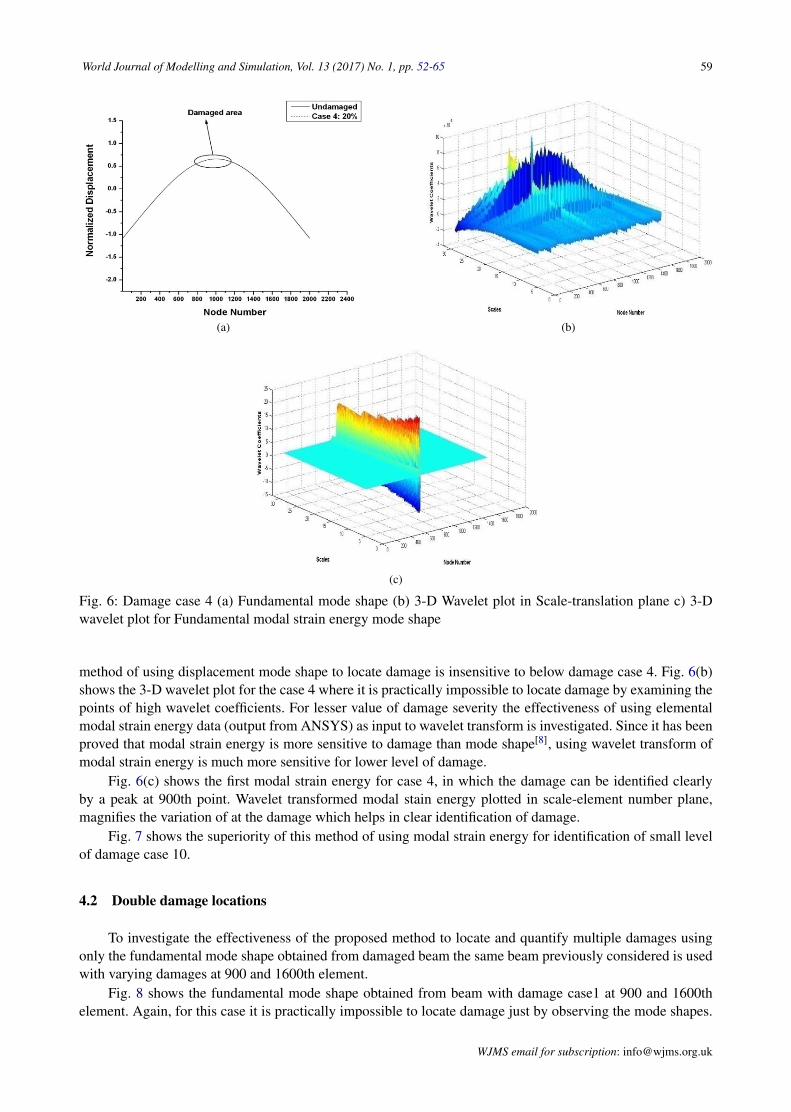
Fig. 6(b) shows the 3-D wavelet plot for case 4, which display considerable less value of wavelet coeffi-cients in comparison to value at damaged region. This again is due to the deceased curvature change in modeshape at the damaged region compared to change at the middle of mode shape. It has been found that the
WJMS email for contribution: [email protected]
World Journal of Modelling and Simulation, Vol. 13 (2017) No. 1, pp. 52-65 59
fig (a)
(b)
(c)
Fig. 6: Damage case 4 (a) Fundamental mode shape (b) 3-D Wavelet plot in Scale-translation plane c) 3-Dwavelet plot for Fundamental modal strain energy mode shape
method of using displacement mode shape to locate damage is insensitive to below damage case 4. Fig. 6(b)shows the 3-D wavelet plot for the case 4 where it is practically impossible to locate damage by examining thepoints of high wavelet coefficients. For lesser value of damage severity the effectiveness of using elementalmodal strain energy data (output from ANSYS) as input to wavelet transform is investigated. Since it has beenproved that modal strain energy is more sensitive to damage than mode shape[8], using wavelet transform ofmodal strain energy is much more sensitive for lower level of damage.
Fig. 6(c) shows the first modal strain energy for case 4, in which the damage can be identified clearlyby a peak at 900th point. Wavelet transformed modal stain energy plotted in scale-element number plane,magnifies the variation of at the damage which helps in clear identification of damage.
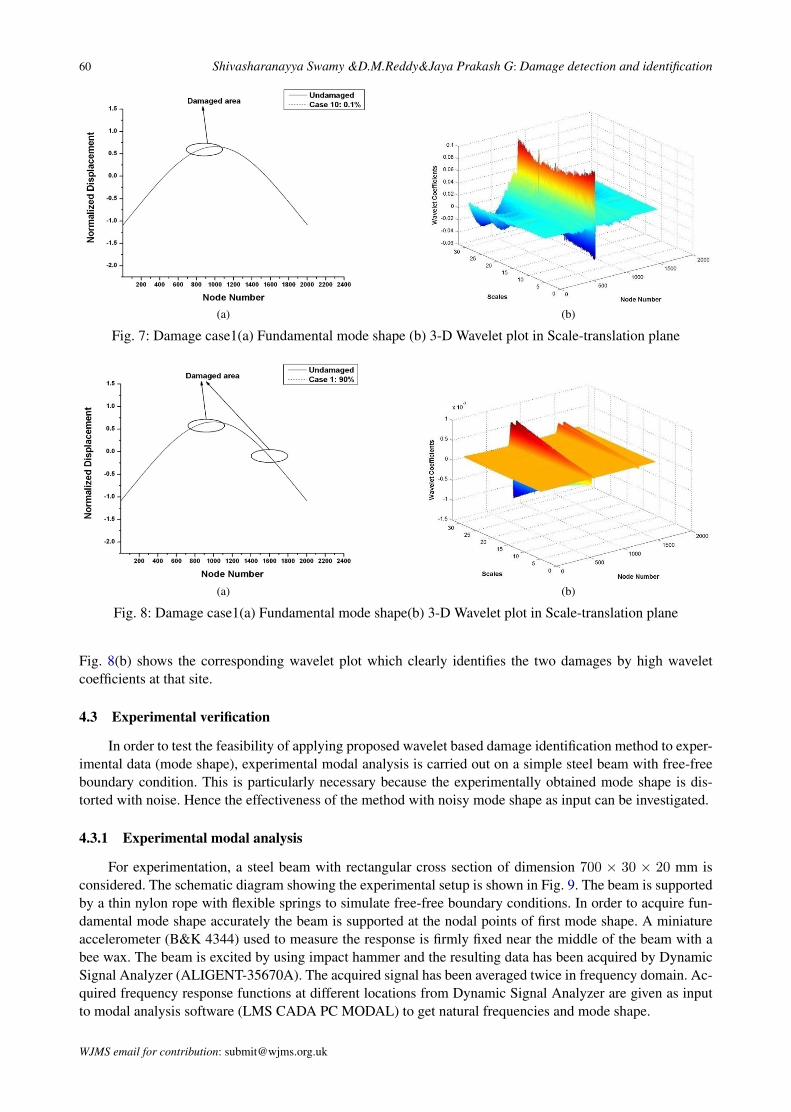
Fig. 7 shows the superiority of this method of using modal strain energy for identification of small levelof damage case 10.
4.2 Double damage locations
To investigate the effectiveness of the proposed method to locate and quantify multiple damages usingonly the fundamental mode shape obtained from damaged beam the same beam previously considered is usedwith varying damages at 900 and 1600th element.
Fig. 8 shows the fundamental mode shape obtained from beam with damage case1 at 900 and 1600thelement. Again, for this case it is practically impossible to locate damage just by observing the mode shapes.
WJMS email for subscription: [email protected]
60 Shivasharanayya Swamy &D.M.Reddy&Jaya Prakash G: Damage detection and identification
(a) (b)
Fig. 7: Damage case1(a) Fundamental mode shape (b) 3-D Wavelet plot in Scale-translation plane
(a) (b)
Fig. 8: Damage case1(a) Fundamental mode shape(b) 3-D Wavelet plot in Scale-translation plane
Fig. 8(b) shows the corresponding wavelet plot which clearly identifies the two damages by high waveletcoefficients at that site.
4.3 Experimental verification
In order to test the feasibility of applying proposed wavelet based damage identification method to exper-imental data (mode shape), experimental modal analysis is carried out on a simple steel beam with free-freeboundary condition. This is particularly necessary because the experimentally obtained mode shape is dis-torted with noise. Hence the effectiveness of the method with noisy mode shape as input can be investigated.
4.3.1 Experimental modal analysis
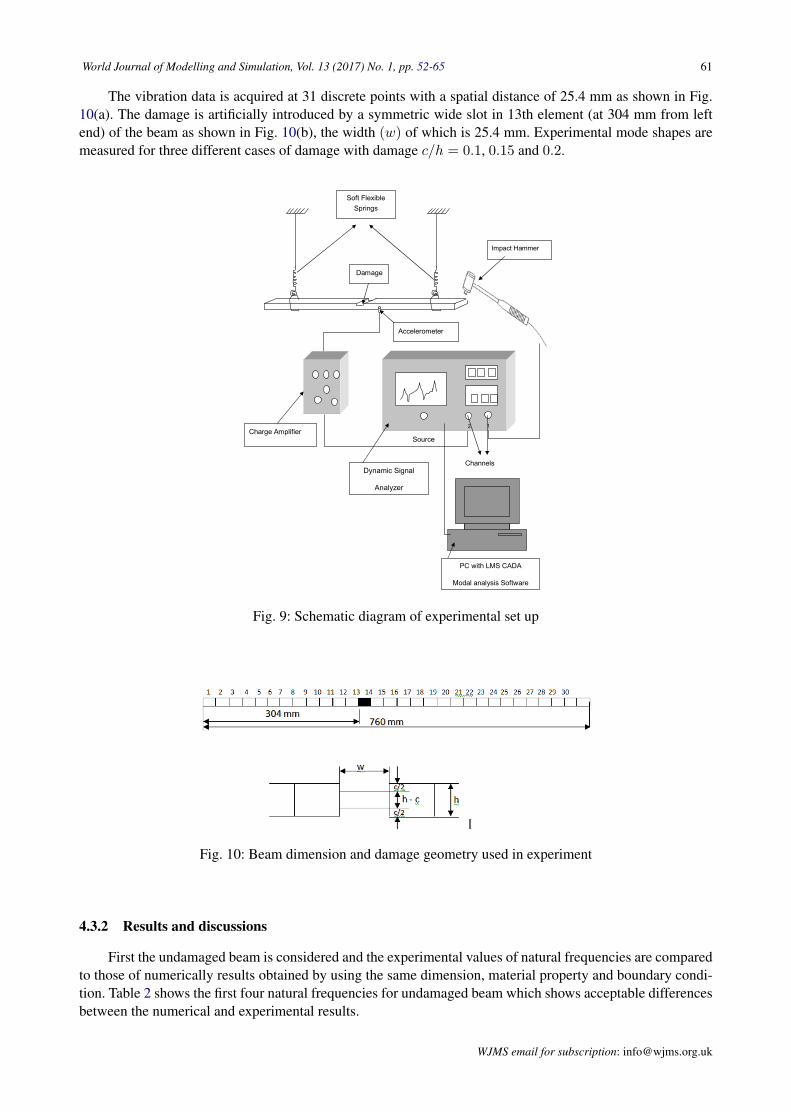
For experimentation, a steel beam with rectangular cross section of dimension 700 × 30 × 20 mm isconsidered. The schematic diagram showing the experimental setup is shown in Fig. 9. The beam is supportedby a thin nylon rope with flexible springs to simulate free-free boundary conditions. In order to acquire fun-damental mode shape accurately the beam is supported at the nodal points of first mode shape. A miniatureaccelerometer (B&K 4344) used to measure the response is firmly fixed near the middle of the beam with abee wax. The beam is excited by using impact hammer and the resulting data has been acquired by DynamicSignal Analyzer (ALIGENT-35670A). The acquired signal has been averaged twice in frequency domain. Ac-quired frequency response functions at different locations from Dynamic Signal Analyzer are given as inputto modal analysis software (LMS CADA PC MODAL) to get natural frequencies and mode shape.
WJMS email for contribution: [email protected]
World Journal of Modelling and Simulation, Vol. 13 (2017) No. 1, pp. 52-65 61
The vibration data is acquired at 31 discrete points with a spatial distance of 25.4 mm as shown in Fig.10(a). The damage is artificially introduced by a symmetric wide slot in 13th element (at 304 mm from leftend) of the beam as shown in Fig. 10(b), the width (w) of which is 25.4 mm. Experimental mode shapes aremeasured for three different cases of damage with damage c/h = 0.1, 0.15 and 0.2.
Channels
Source
Soft Flexible Springs
Damage
Charge Amplifier
Dynamic Signal
Analyzer
1 2
Accelerometer
Impact Hammer
PC with LMS CADA
Modal analysis Software
Fig. 9: Schematic diagram of experimental set up
Fig. 10: Beam dimension and damage geometry used in experiment
4.3.2 Results and discussions
First the undamaged beam is considered and the experimental values of natural frequencies are comparedto those of numerically results obtained by using the same dimension, material property and boundary condi-tion. Table 2 shows the first four natural frequencies for undamaged beam which shows acceptable differencesbetween the numerical and experimental results.
WJMS email for subscription: [email protected]
62 Shivasharanayya Swamy &D.M.Reddy&Jaya Prakash G: Damage detection and identification
Table 2: First four natural frequencies of undamaged beam
Mode NoNatural Frequencies (Hz)
FEM (MATLAB) Experimental1 180.88 181.702 498.61 498.483 977.49 970.024 1615.9 1592
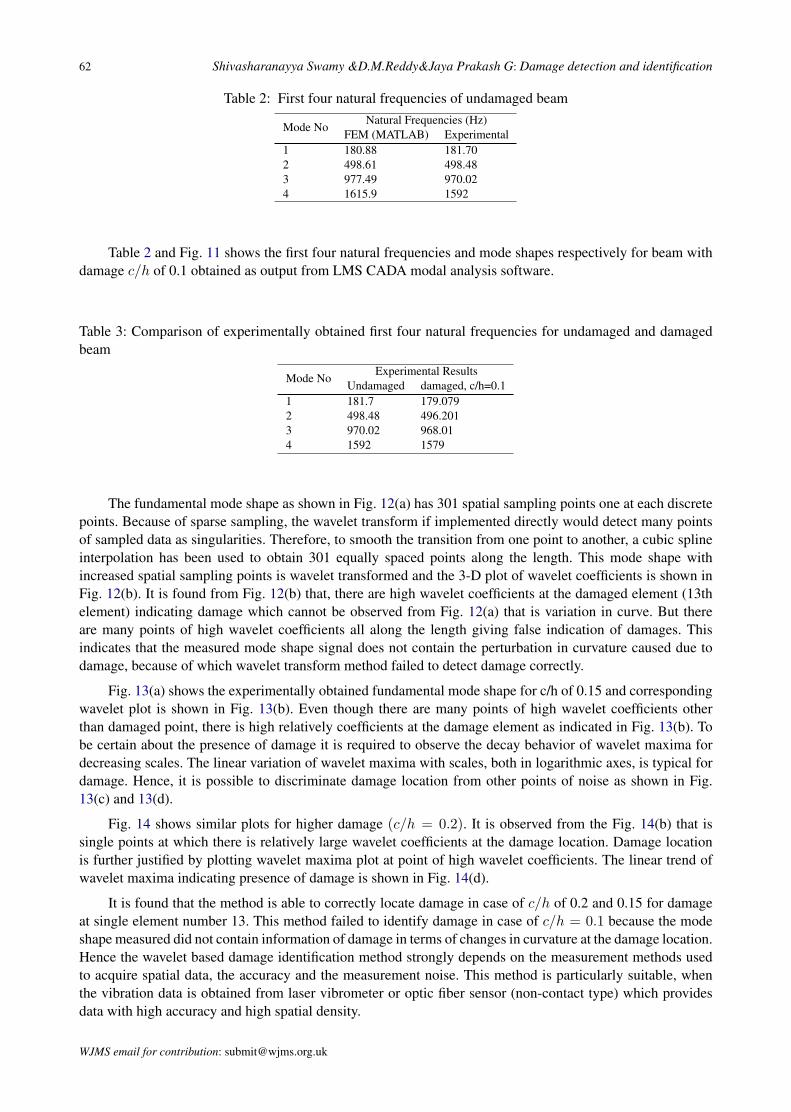
Table 2 and Fig. 11 shows the first four natural frequencies and mode shapes respectively for beam withdamage c/h of 0.1 obtained as output from LMS CADA modal analysis software.
Table 3: Comparison of experimentally obtained first four natural frequencies for undamaged and damagedbeam
Mode NoExperimental Results
Undamaged damaged, c/h=0.11 181.7 179.0792 498.48 496.2013 970.02 968.014 1592 1579
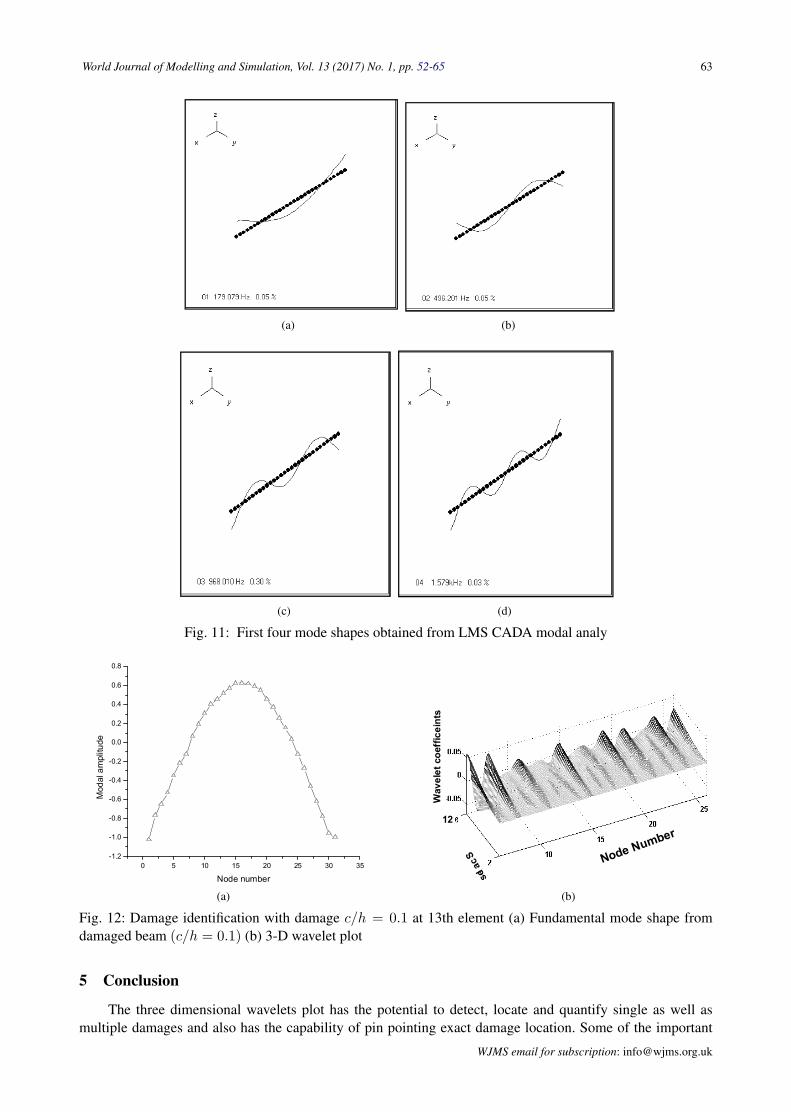
The fundamental mode shape as shown in Fig. 12(a) has 301 spatial sampling points one at each discretepoints. Because of sparse sampling, the wavelet transform if implemented directly would detect many pointsof sampled data as singularities. Therefore, to smooth the transition from one point to another, a cubic splineinterpolation has been used to obtain 301 equally spaced points along the length. This mode shape withincreased spatial sampling points is wavelet transformed and the 3-D plot of wavelet coefficients is shown inFig. 12(b). It is found from Fig. 12(b) that, there are high wavelet coefficients at the damaged element (13thelement) indicating damage which cannot be observed from Fig. 12(a) that is variation in curve. But thereare many points of high wavelet coefficients all along the length giving false indication of damages. Thisindicates that the measured mode shape signal does not contain the perturbation in curvature caused due todamage, because of which wavelet transform method failed to detect damage correctly.
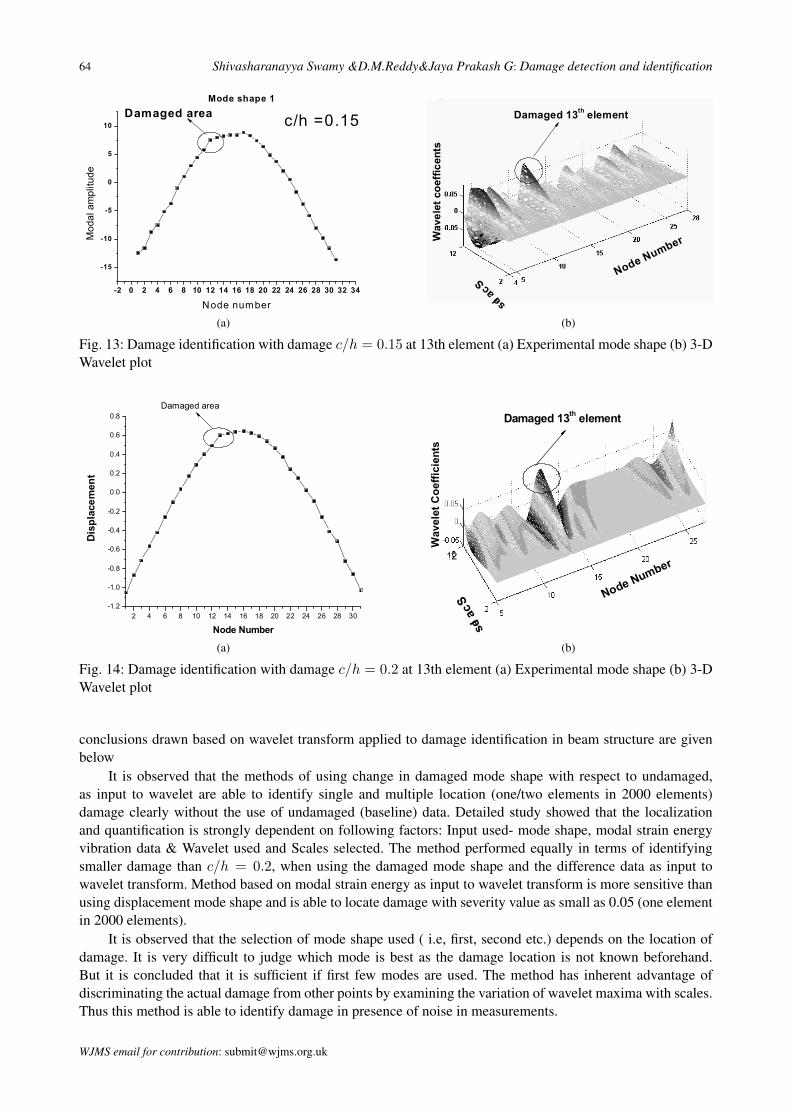
Fig. 13(a) shows the experimentally obtained fundamental mode shape for c/h of 0.15 and correspondingwavelet plot is shown in Fig. 13(b). Even though there are many points of high wavelet coefficients otherthan damaged point, there is high relatively coefficients at the damage element as indicated in Fig. 13(b). Tobe certain about the presence of damage it is required to observe the decay behavior of wavelet maxima fordecreasing scales. The linear variation of wavelet maxima with scales, both in logarithmic axes, is typical fordamage. Hence, it is possible to discriminate damage location from other points of noise as shown in Fig.13(c) and 13(d).
Fig. 14 shows similar plots for higher damage (c/h = 0.2). It is observed from the Fig. 14(b) that issingle points at which there is relatively large wavelet coefficients at the damage location. Damage locationis further justified by plotting wavelet maxima plot at point of high wavelet coefficients. The linear trend ofwavelet maxima indicating presence of damage is shown in Fig. 14(d).
It is found that the method is able to correctly locate damage in case of c/h of 0.2 and 0.15 for damageat single element number 13. This method failed to identify damage in case of c/h = 0.1 because the modeshape measured did not contain information of damage in terms of changes in curvature at the damage location.Hence the wavelet based damage identification method strongly depends on the measurement methods usedto acquire spatial data, the accuracy and the measurement noise. This method is particularly suitable, whenthe vibration data is obtained from laser vibrometer or optic fiber sensor (non-contact type) which providesdata with high accuracy and high spatial density.
WJMS email for contribution: [email protected]
World Journal of Modelling and Simulation, Vol. 13 (2017) No. 1, pp. 52-65 63
(a)
(b)
(c)
(d)
Fig. 11: First four mode shapes obtained from LMS CADA modal analy
0 5 10 15 20 25 30 35-1.2
-1.0
-0.8
-0.6
-0.4
-0.2
0.0
0.2
0.4
0.6
0.8
Mod
al a
mpl
itude
Node number
(a) 0 2 4 6 8 100
2
4
6
8
10
Node Number
Scales
Wav
elet
coe
ffic
eint
s
122
(b)
Fig. 12: Damage identification with damage c/h = 0.1 at 13th element (a) Fundamental mode shape fromdamaged beam (c/h = 0.1) (b) 3-D wavelet plot
5 Conclusion
The three dimensional wavelets plot has the potential to detect, locate and quantify single as well asmultiple damages and also has the capability of pin pointing exact damage location. Some of the important
WJMS email for subscription: [email protected]
64 Shivasharanayya Swamy &D.M.Reddy&Jaya Prakash G: Damage detection and identification
-2 0 2 4 6 8 10 12 14 16 18 20 22 24 26 28 30 32 34
-15
-10
-5
0
5
10
Mod
al a
mpl
itude
Node number
Damaged area c/h =0.15Mode shape 1
(a)
0 2 4 6 8 100
2
4
6
8
10
Node Number
Scales
Wav
elet
coe
ffice
nts
Damaged 13th element
(b)
Fig. 13: Damage identification with damage c/h = 0.15 at 13th element (a) Experimental mode shape (b) 3-DWavelet plot
2 4 6 8 10 12 14 16 18 20 22 24 26 28 30-1.2
-1.0
-0.8
-0.6
-0.4
-0.2
0.0
0.2
0.4
0.6
0.8
Dis
plac
emen
t
Node Number
Damaged area
(a)
0 2 4 6 8 100
2
4
6
8
10
Node Number
Scales
Wav
elet
Coe
ffici
ents
120
Damaged 13th element
(b)
Fig. 14: Damage identification with damage c/h = 0.2 at 13th element (a) Experimental mode shape (b) 3-DWavelet plot
conclusions drawn based on wavelet transform applied to damage identification in beam structure are givenbelow
It is observed that the methods of using change in damaged mode shape with respect to undamaged,as input to wavelet are able to identify single and multiple location (one/two elements in 2000 elements)damage clearly without the use of undamaged (baseline) data. Detailed study showed that the localizationand quantification is strongly dependent on following factors: Input used- mode shape, modal strain energyvibration data & Wavelet used and Scales selected. The method performed equally in terms of identifyingsmaller damage than c/h = 0.2, when using the damaged mode shape and the difference data as input towavelet transform. Method based on modal strain energy as input to wavelet transform is more sensitive thanusing displacement mode shape and is able to locate damage with severity value as small as 0.05 (one elementin 2000 elements).
It is observed that the selection of mode shape used ( i.e, first, second etc.) depends on the location ofdamage. It is very difficult to judge which mode is best as the damage location is not known beforehand.But it is concluded that it is sufficient if first few modes are used. The method has inherent advantage ofdiscriminating the actual damage from other points by examining the variation of wavelet maxima with scales.Thus this method is able to identify damage in presence of noise in measurements.
WJMS email for contribution: [email protected]

World Journal of Modelling and Simulation, Vol. 13 (2017) No. 1, pp. 52-65 65
References
[1] C. H. S. 13. Jaun. Evaluation of structural damage identification methods based on dynamic characteristics. Ph.D.Thesis, University of Puerto Rico, Puerto Rico, 20105.
[2] J. Chance, G. R. Tomlinson, K. Worden. A simplified approach to the numerical and experimental modelling ofthe dynamics of a cracked beam. Proceedings of SPIE - The International Society for Optical Engineering, 1994,2251(2251): 778–785.
[3] I. Daubechies. Ten Lectures On Wavelets. capital city press, 1992.[4] S. W. Doebling, C. R. Farrar, M. B. Prime, et al. Damage identification and health monitoring of structural and
mechanical systems from changes in their vibration characteristics: A literature review. Shock & Vibration Digest,1996, 30(11): 2043–2049.
[5] J. C. Hong, Y. Y. Kim, H. C. Lee, et al. Damage detection using the lipschitz exponent estimated by the wavelettransform: applications to vibration modes of a beam. International Journal of Solids & Structures, 2002, 39(7):1803–1816.
[6] J. T. Kim, Y. S. Ryu, H. M. Cho, et al. Damage identification in beam-type structures: frequency-based method vsmode-shape-based method. Engineering Structures, 2003, 25(1): 57–67.
[7] S. Loutridis, E. Douka, A. Trochidis. Crack identification in double-cracked beams using wavelet analysis. Journalof Sound & Vibration, 2004, 277(4): 1025–1039.
[8] Osegueda, A. Roberto. ’global non-destructive damage evaluation in solids,’. 2013.[9] A. V. Ovanesova, L. E. Surez. Applications of wavelet transforms to damage detection in frame structures. Engi-
neering Structures, 2004, 26(1): 39–49.[10] S. T. Quek, Q. Wang, L. Zhang, et al. Sensitivity analysis of crack detection in beams by wavelet technique.
International Journal of Mechanical Sciences, 2001, 43(43): 2899–2910.[11] D. M. . Reddy. Detection and localisation of damage in bridge model by spatial wavelet based approach. Interna-
tional Journal of Modelling Identification & Control, 2008, 3(2): 156–161.[12] D. M. Reddy, S. Swarnamani. Damage detection and identification in structures by spatial wavelet based approach.
International Journal of Applied Science & Engineering, 2012, 10(10:1): 69–87.[13] W. X. Ren, G. D. Roeck. Structural damage identification using modal data. i: Simulation verification. Journal of
Structural Engineering, 2002, 128(1): 87–95.[14] C. Salawu, O.S.and Williams. Structural damage detection using experimental modal analysis-a comparison of
some methods. Proc. of 11th International Modal Analysis Conference, 1993, 254–260.[15] E. S. Sazonov, P. Klinkhachorn, U. B. Halabe, et al. Non-baseline detection of small damages from changes in
strain energy mode shapes. Nondestructive Testing & Evaluation, 2003, 18(3-4): 91–107.[16] Q. Wang, X. Deng. Damage detection with spatial wavelets. International Journal of Solids & Structures, 1999,
36(23): 3443–3468.
WJMS email for subscription: [email protected]