DAMAGE ASSESSMENT AND RESTORATION … Unit No. 1 Oil Spill NRDA Obed Wild and Scenic River Morgan...
123
DAMAGE ASSESSMENT AND RESTORATION PLAN / ENVIRONMENTAL ASSESSMENT Howard/White Unit No. 1 Oil Spill PUBLIC REVIEW DRAFT January 2008
Transcript of DAMAGE ASSESSMENT AND RESTORATION … Unit No. 1 Oil Spill NRDA Obed Wild and Scenic River Morgan...

DAMAGE ASSESSMENT AND RESTORATION
PLAN / ENVIRONMENTAL ASSESSMENT
Howard/White Unit No. 1 Oil Spill
PUBLIC REVIEW DRAFT
January 2008

Howard/White Unit No. 1 Oil Spill NRDA
Obed Wild and Scenic River
Morgan County, Tennessee
DAMAGE ASSESSMENT AND RESTORATION PLAN /
ENVIRONMENTAL ASSESSMENT
PUBLIC REVIEW DRAFT
Prepared by:
Obed Wild and Scenic River Natural Resource Trustee Council
Including:
U.S. Department of Interior
National Park Service
U.S. Fish and Wildlife Service
Tennessee Department of Environment and Conservation
January 2008

Damage Assessment and
Restoration Plan
i
TABLE OF CONTENTS
Page
LIST OF ACRONYMS ............................................................................................................... iv
EXECUTIVE SUMMARY ...........................................................................................................v
1.0 INTRODUCTION .............................................................................................................. 1-1
1.1 Spill Incident ................................................................................................................... 1-1
1.2 Summary of Natural Resource Injuries .......................................................................... 1-5
1.3 Summary of Preferred Restoration Alternative .............................................................. 1-5
1.4 Organization of Document ............................................................................................. 1-5
2.0 PURPOSE AND NEED OF THE DARP ........................................................................ 2-1
2.1 OPA Requirements ......................................................................................................... 2-1
2.1.1 Coordination among the Trustees ........................................................................ 2-2
2.1.2 Coordination with the Responsible Party ............................................................ 2-2
2.1.3 Public Participation .............................................................................................. 2-2
2.1.4 Administrative Record ......................................................................................... 2-2
2.2 NEPA Compliance ......................................................................................................... 2-3
3.0 AFFECTED ENVIRONMENT ......................................................................................... 3-1
3.1 Physical Environment ..................................................................................................... 3-1
3.1.1 The Obed WSR ...................................................................................................... 3-1
3.1.2 Centennial Park, Crossville, TN ............................................................................ 3-2
3.1.3 Golliher Creek, Morgan County, TN ..................................................................... 3-2
3.2 Biological Environment .................................................................................................. 3-3
3.2.1 The Obed WSR ...................................................................................................... 3-3
3.2.2 Centennial Park, Crossville, TN ............................................................................ 3-4
3.2.3 Golliher Creek, Morgan County, TN ..................................................................... 3-4
3.3 Cultural Environment and Human Use .......................................................................... 3-4
3.3.1 The Obed WSR ...................................................................................................... 3-4
3.3.2 Centennial Park, Crossville, TN ............................................................................ 3-5
3.3.3 Golliher Creek, Morgan County, TN ..................................................................... 3-6
4.0 INJURY ASSESSMENT ................................................................................................... 4-1
4.1 Introduction .................................................................................................................... 4-1
4.2 Overview of Preassessment Phase Activities and Findings ........................................... 4-1
4.2.1 Water Quality ....................................................................................................... 4-1
4.2.2 Sediment Quality .................................................................................................. 4-2
4.2.3 Benthic Algae ....................................................................................................... 4-2
4.2.4 Macroinvertebrates ............................................................................................... 4-3
4.2.5 Fish Community Health ....................................................................................... 4-3
4.2.6 Forest Vegetation and Soils .................................................................................. 4-4
4.2.7 Riparian Wetlands and Habitat ............................................................................. 4-5
4.2.8 Visitor Use ............................................................................................................ 4-5

Damage Assessment and
Restoration Plan
ii
4.2.9 Information Management ..................................................................................... 4-5
4.3 Injury Assessment Strategy ............................................................................................ 4-6
4.4 Injury Assessment Methods and Results ........................................................................ 4-8
4.4.1 Forest Vegetation and Soils .................................................................................. 4-8
4.4.2 Stream Services .................................................................................................. 4-11
4.4.3 Lost Visitor Use .................................................................................................. 4-20
5.0 RESTORATION ALTERNATIVES ................................................................................ 5-1
5.1 Restoration Strategy ....................................................................................................... 5-1
5.2 Evaluation Criteria .......................................................................................................... 5-1
5.3 Environmental Consequences ......................................................................................... 5-2
5.4 Natural Recovery Alternative ......................................................................................... 5-2
5.5 Preferred Alternative ...................................................................................................... 5-2
5.5.1 Invasive Vegetation Control ................................................................................ 5-2
5.5.2 Land Acquisition .................................................................................................. 5-4
5.5.3 Stream Restoration ............................................................................................. 5-11
5.6 Agency Consultation .................................................................................................... 5-24
5.7 Restoration Oversight and Administration ................................................................... 5-25
6.0 ENVIRONMENTAL CONSEQUENCES ....................................................................... 6-1
6.1 Environmental Analysis ................................................................................................. 6-1
6.2 Environmentally Preferred Alternative ........................................................................ 6-10
7.0 SUMMARY......................................................................................................................... 7-1
7.1 Injury Summary .............................................................................................................. 7-1
7.2 Restoration Summary and Timeline ............................................................................... 7-1
8.0 REFERENCES ................................................................................................................... 8-1
APPENDICES
A Forest Injury Curve Inputs and DSAYs .............................................................................. A-1
B USGS Monthly Statistics for Discharges in the Obed River ...............................................B-1
C Stream Injury and Restoration Calculations .........................................................................C-1
D List of Preparers, Agencies and Contacts Consulted .......................................................... D-1
E USFWS Consultation ........................................................................................................... E-1
F Tribal Councils Consultation ............................................................................................... F-1
G SHPO Consultation ............................................................................................................. G-1

Damage Assessment and
Restoration Plan
iii
LIST OF FIGURES
1 Location of the Howard/White Unit No. 1 oil spill and fire. ................................................. 1-3
2 Topographic map showing the spill site, Clear and White Creek .......................................... 1-4
3 Hypothetical curve showing the lost services after an oil spill .............................................. 4-7
4 The oiled and burned slope just above Clear Creek ............................................................. 4-10
5 Recovery curve for the forest vegetation and soils .............................................................. 4-10
6 Injury curve for stream services for the Clear Creek Seep Reach ....................................... 4-20
7 Injury curve for stream services for the Clear Creek Downstream Reach ........................... 4-21
8 Injury curve for stream services for the White Creek Reach ............................................... 4-21
9 Map of the Obed WSR showing Tracts 101-10 and 102-14 .................................................. 5-5
10 Map of Golliher Creek ........................................................................................................ 5-14
LIST OF TABLES
ES-1 Injury and restoration scaling for each affected resource. ................................................ vii
1 Hypothetical injury calculated for 1.0 acre of injured forest habitat ..................................... 4-7
2 Observations of oil on Clear Creek between 2002 and 2007. .............................................. 4-11
3 TMI scores for benthic macroinvertebrate samples collected from Clear Creek. ................ 4-13
4 Services present in both Clear and White Creeks as compared to baseline ......................... 4-17
5 Costs for restoration activities in Centennial Park, Little Obed River watershed................ 5-20
6 Estimated costs for Golliher Creek Restoration ................................................................... 5-22
7 Restoration phase oversight and administration costs for NPS ........................................... 5-25
8 Restoration phase oversight and administration costs for USFWS ..................................... 5-25
9 Restoration phase oversight and administration costs for TDEC ........................................ 5-25
10 Restoration alternatives impact analysis on the physical environment .................................. 6-3
11 Restoration alternatives impact analysis on the biological environment. .............................. 6-6
12 Restoration alternatives impact analysis on the cultural environment and human use. ......... 6-8
13 Summary of injuries, preferred restoration actions, and restoration costs
for the Obed WSR oil spill...................................................................................................... 7-2

Damage Assessment and
Restoration Plan
iv
LIST OF ACRONYMS
AMD acid mine drainage
BTEX benzene, toluene, ethylbenzene, xylene
DARP Damage Assessment and Restoration Plan
dbh diameter breast height
DOI Department of the Interior
DSAYs discounted service acre years
EA Environmental Assessment
EIS Environmental Impact Statement
EPA Environmental Protection Agency
EPT Ephemeroptera, Plecoptera, and Trichoptera
ft feet
GC/MS gas chromatography/mass spectrometry
GIS geographic information system
HEA Habitat Equivalency Analysis
IBI Index of Biotic Integrity
LPP Land Protection Plan
LSU Louisiana State University
m meter
NCBI North Carolina Biotic Index
NEPA National Environmental Policy Act
NPS National Park Service
NRDA Natural Resource Damage Assessment
OC Oligochaetes and Chironomids
OSLTF Oil Spill Liability Trust Fund
OPA Oil Pollution Act of 1990
ORNL Oak Ridge National Laboratory
PAH polynuclear aromatic hydrocarbon
RP Responsible Party
SHPO State Historic Preservation Office
SQKICK Semi-Quantitative Riffle Kick
SVOC semivolatile organic compounds
TDEC Tennessee Department of Environment and Conservation
TMI Tennessee Macroinvertebrate Index
TNC The Nature Conservancy
TPH-DRO total petroleum hydrocarbons – diesel range organics
TVA Tennessee Valley Authority
TWRA Tennessee Wildlife Resources Agency
USCG U.S. Coast Guard
USGS U.S. Geological Survey
USEPA U.S. Environmental Protection Agency
USFWS U.S. Fish and Wildlife Service
VOC volatile organic compounds
WSR Wild and Scenic River
Damage Assessment and
Restoration Plan
v
EXECUTIVE SUMMARY
On 19 July 2002, a blowout occurred on the Howard/White Unit No. 1 oil well in Morgan
County, Tennessee releasing an undetermined amount of crude oil. The oil flowed down the
slope, entering White Creek and Clear Creek, two tributaries of the Obed Wild and Scenic River.
The oil caught on fire and burned down both slopes and across Clear Creek. Emergency response
operations were initially conducted by the Responsible Party; however, the U.S. Environmental
Protection Agency took over operations on 21 July. Since the initial spill, oil has continued to
seep out of the bank below the well through July 2007.
The Trustees for this incident include the Department of the Interior (DOI) represented
by the National Park Service and the U.S. Fish and Wildlife Service, and the State of Tennessee
represented by the Tennessee Department of Environment and Conservation. The Trustees were
assisted by the U.S. Geological Survey and the Tennessee Wildlife Resource Agency. During the
Preassessment Phase, the Trustees determined that forest vegetation and soils, visitor use, and
stream health (as indicated by benthic algae and invertebrates, fisheries, water quality, and
sediment quality) had been affected as a result of the oil spill and decided to pursue Injury
Assessment and Restoration Scaling.
Injury to forestry resources was determined by a study of the forest structure and
chemical analysis of the soils in the burned site and a nearby reference site two years after the
spill and fire. Overstory mortality at the burned site was 100%. The soil litter, duff, and surface
horizons were burned away, and the soil seed bank was destroyed. Mychorrizae and root systems
were killed so that trees could not resprout from their roots following the burn. Based on the rate
of biomass accumulation and the age structure of the reference forest, it was estimated that it will
take 172 years for the forest to return to pre-spill biomass standing stock. Using the Habitat
Equivalency Analysis (HEA), the injury to forestry resources in the 0.74 acre site that was oiled
and burned was calculated to be 24.3 discounted service acre years (DSAYs).
Injury to stream services was determined by studies of the benthic macroinvertebrates in
the impacted and upstream reference sites, studies of benthic algae, surveys of riparian
vegetation, chemical analysis of water and sediments, and studies of the health and integrity of
fish populations in impacted versus reference sites in Clear Creek. An important consideration in
the injury assessment is the continued release of oil from the spill site as seepage directly into
Clear Creek since the spill and as of July 2007. The rate of seepage appears to be controlled by
the flow conditions; that is, the seepage rate is higher during low-flow conditions and appears to
slow during high-flow conditions. It has not been possible to determine if the oil is still being
released from the well itself or from the oil trapped in the vadose zone and fractures in the rocky
slope adjacent to the creek. Thus, the Trustees have assumed that the oil seepage will continue
for 20 years and follow a pattern of higher seepage during low flows 66% of the time. This
pattern of higher seepage rates during low-flow conditions is important because the benthic
macroinvertebrate community, as measured using the Tennessee Macroinvetebrate Index (TMI),
becomes degraded in the section of stream below the seep during periods of higher seepage,
compared to the reference site that is located only a short distance upstream.

Damage Assessment and
Restoration Plan
vi
The affected sections of Clear Creek and White Creek were divided into three reaches
with differing degree and duration of exposure and impact. The Clear Creek Seep Reach extends
1,320 feet from the seep site and is chronically exposed to oil seepage during low-flow
conditions. Low-flow conditions were determined to be when the flow at the Obed River gaging
station at Lancing, TN for July, August, or September was below 98 cubic feet per second, which
is the 70% duration flow exceedance value. The Clear Creek Downstream Reach extends 1,240
feet from the end of the Seep Reach to 500 feet below Barnett Bridge where oil sheens continue
to be observed through June 2007, thus it is also chronically exposed, but to lower amounts of
oil. The White Creek Reach extends 1,174 feet from the point of oil entry into White Creek to
the junction with Clear Creek. White Creek was exposed to oil during the first year of the spill;
the amount of chronic oil seepage since then into White Creek was considered to be insufficient
to cause injury to benthic resources.
The inputs to the HEA model after the first year were based largely on the TMI scores in
the impacted streams versus upstream reference sites and consideration of the life histories of the
benthic macroinvertebrates present in the streams. It was assumed that low-flow conditions
would occur 66% of the time over the next 20 years. Thus, for years 1-20 the % service loss for
the Clear Creek Seep Reach was 50% during low-flow years and 25% during high-flow years.
The injury to the 2.41 acres in the Clear Creek Seep Reach was calculated as 16.01 DSAYs. For
the Clear Creek Downstream Reach, the % service losses, again based largely on the measured
TMI scores in this reach compared to the reference site, was 25% during low-flow years and
10% during high-flow years. The injury to the 2.26 acres in the Clear Creek Downstream Reach
was calculated as 8.76 DSAYs. The White Creek Reach recovery curve was based on oil
exposure during the first year after the spill and the life histories of the benthic invertebrates.
Thus, the service loss in the first year was 25% and full recovery was reached in four years. The
injury to the 1.62 acres in the White Creek Reach was calculated to be 1.37 DSAYs.
Lost use was based on a study of baseline estimates of visitor use at the Obed WSR prior
to the oil spill and the number of days lost during the period when the river was closed to public
use. It was determined that 509 fishing days and 400 paddling days were lost. A benefits transfer
methodology was used to determine the economic value of each fishing and paddling day lost as
a result of the spill, with the result of $29,654 for lost fishing days and $26,792 for lost paddling
days, for a total lost use of $56,446.
Two restoration alternatives were evaluated to restore services to the injured resource: 1)
Natural recovery (i.e., no action alternative) and the 2) Preferred alternative. The preferred
alternative involves several actions chosen to restore the forest, stream and lost use injuries. The
Trustees chose this alternative as the actions compensate for the interim loss of services. For
forestry resources, the preferred restoration action was invasive vegetation removal in the area
burned for 25 years and land acquisition along the Obed WSR corridor consistent with the Land
Protection Plan for the park. HEA was used to calculate the amount of land to be acquired, with
the result of 2.3 acres. The Trustees decided land acquisition was also preferred for the injury to
lost use since the properties identified have significant recreational value and either provide
access to the river and hiking areas or protect key parts of the Obed WSR corridor. The invasive
vegetation removal costs were $11,722 and land acquisition costs were $17,050.

Damage Assessment and
Restoration Plan
vii
The preferred restoration action for the stream services resource consisted of several
stream restoration projects in Centennial Park in Crossville, TN in the headwaters of the Little
Obed River. The restoration projects include 0.19 acres of streambank restoration, invasive
vegetation removal along 750 feet of stream, creation of 2.12 acres of bog gardens, and
construction of 2.0 acres of rain gardens/water detention structures. Using HEA, these restoration
projects would create 26.1 DSAYs (equal to the injury to stream services) at a cost of $691,600;
however, other sources of funds will cover some of these costs, so the costs to be provided by the
DARP would be $460,689. This is the preferred restoration action because it would restore
resources within the Obed River watershed and it meets the evaluation criteria discussed in
section 5.2.
Oversight of the restoration projects and administrative costs by the Trustee agencies are
estimated to be $151,835.
Table ES-1 shows the injury and restoration scaling for each affected resource. The total
costs are $697,742.
TABLE ES-1. Injury and restoration scaling for each affected resource.
Injured Resource Injury Scaling Restoration Action and
Scaling
Restoration Action
Costs
Forestry resources
– 0.74 acres with
recovery taking 172
years
24.3 DSAYs
Invasive vegetation removal for
25 years;
Acquisition of 2.3 acres of land
$11,722
$17,050
Stream services –
6.29 acres of stream 26.1 DSAYs
Stream restoration in Centennial
Park, headwaters of Little Obed
River
(26.1 DSAYs)
$460,689
Lost visitor use
- 509 fishing days
- 400 paddling days
$56,446 Acquisition of 16.1 acres of land $56,446
Oversight and
Administration $151,835
Total $697,742

Damage Assessment and
Restoration Plan
1-1
1.0 INTRODUCTION
This Damage Assessment and Restoration Plan (DARP) was prepared by federal and
state natural resource Trustees responsible for restoring natural resources and services of the
Obed Wild and Scenic River (Obed WSR) injured by the 19 July 2002 oil well blowout (the
“incident”) Howard/White Unit No. 1 oil well in Morgan County, Tennessee. The Obed WSR is
a unit of the National Park Service (NPS) and was included into the Wild and Scenic Rivers
System in 1976. Located on the Cumberland Plateau in eastern Tennessee, the Obed WSR
corridor is managed cooperatively by the NPS and State of Tennessee. Through a Memorandum
of Understanding, the Tennessee Wildlife Resource Agency (TWRA) manages the land it owns
within the rims of the gorges of the Obed River, Daddys Creek, and Clear Creek within the
authorized boundary of the Park, in accordance with the purpose and policies outlined in the
Wild and Scenic Rivers Act, as amended, Public Law 90-542. The NPS exercises management
responsibilities for the Obed River and its major tributaries, including Clear Creek.
The purpose of restoration, as outlined in this DARP, is to make the environment and the
public whole for injuries resulting from the incident by implementing restoration actions that
return injured natural resources and services to baseline conditions and compensate for interim
losses. The Department of the Interior (DOI), represented by the NPS and the U.S. Fish and
Wildlife Service (USFWS), and the State of Tennessee, represented by the Tennessee
Department of Environment and Conservation (TDEC), are co-Trustees for the Natural Damage
Assessment (NRDA) of this spill event. The agencies assisting the Trustees include the U.S.
Geological Survey (USGS) and the TWRA. The Trustees have prepared this DARP to inform the
public about injury assessment and restoration planning efforts.
1.1 Spill Incident
On 19 July 2002, a blowout occurred on the Howard/White Unit No. 1 oil well in Morgan
County, Tennessee (Fig. 1) releasing an undetermined amount of crude oil. The well was being
drilled to test for commercial oil production from the Nashville Group formation. After drilling
to a certain depth, oil flow occurred. The pressure of the flow increased and began to spill oil
around the well and outside of the containment area at an estimated 200-500 barrels per hour
(EPA, 2003). At approximately midnight on 19 July, the oil well caught fire. The spilled oil had
flowed downhill from the wellhead into White Creek, at approximately 0.21 miles above its
confluence with Clear Creek, and into Clear Creek, at approximately 0.37 miles above Barnett
Bridge. The fire followed both oiled paths, burning the vegetation and the oil-soaked soils (Fig.
2). Some of the large boulders on the slope fractured from the heat of the fire. The oil adjacent to
the banks in both creeks caught fire as well. After the initial spill, oil continued to seep from the
creek bank into Clear Creek through 2007, with higher rates of release during periods of low
river flow (NPS, 2007a; b).
Staff from the NPS responded with fire crews and technical staff. FWS staff also served
in a response capability. Initial response actions to contain the oil were undertaken by the
operator of the well and Responsible Party (RP), Pryor Oil Company of Cookeville, Tennessee,
and the well drilling firm, Highland Drilling Company, Inc. of Kingston, Tennessee. Response
actions were taken over by the U.S. Environmental Protection Agency (EPA) on the evening of

Damage Assessment and
Restoration Plan
1-2
21 July 2002, with support from the U.S. Coast Guard (USCG). Two containment ponds were
constructed on the north and south side of the wellhead to catch the run-off from the well to
White Creek and Clear Creek. Containment and absorbent booms were deployed at several
locations along Clear Creek and White Creek. As of 2 August 2002, the placement of the booms
included the following locations (Fig. 2):
Point of oil entry in Clear Creek
Point of oil entry in White Creek
Immediately upstream of Barnett Bridge
Downstream (100 yards) of Barnett Bridge
Downstream (0.5 miles) of Barnett Bridge
Upstream of Jett Bridge, approximately 5 miles downstream of the spill event
During the response actions, oil seeping from the bank of Clear Creek was recovered
using containment booms and a drum skimmer. As of February 2003, all containment and
absorbent booms were removed, except at the point of oil entry in Clear Creek. The RP has
maintained sorbent and hard boom in Clear Creek continuously through June 2007 because oil
has persistently seeped out of the bank. NPS staff has inspected the seep site regularly between
June and November 2006 and again in June and July 2007. They observed oil sheen, oil
globules, and oiled boom on each visit (NPS, 2006a; b; c; d; e; f; g; h; 2007a; b). Evidence of oil
was consistently observed in Clear Creek at the seep site and downstream to the riffle just above
the confluence with White Creek. The boom and sorbent materials were commonly observed to
be poorly maintained.
NPS posted “Do Not Come in Contact with Water” signs at both Jett and Barnett Bridges
shortly after the spill. On 23 July Clear Creek was officially closed to public use from Double
Drop Falls to Jett Bridge (approximately 6 miles). The closure was implemented due to public
health and safety concerns. A cautionary warning was issued to the public against recreating on
the water from Jett Bridge to Nemo Bridge. The NPS lifted the closure from Barnett Bridge to
Jett Bridge on February 6, 2003, but maintained a one-half mile closure between Double Drop
Falls and Barnett Bridge.
Responders were able to stop the release of oil from the well and extinguished all fires by
25 July 2002. The well was capped on 26 July 2002. An emergency access road was widened
and stabilized near Barnett Bridge to allow vacuum trucks access to the area in order to remove
spilled oil from the creek. Oil-saturated soil was removed from the top of the slope above the
cliff face on Clear Creek from 27 July to 2 August 2002. The soil was excavated and temporarily
placed in the containment pond on site. Straw was placed on the slope below the cliff face to
slow erosion and run-off of oily sediments into Clear Creek. The removal actions did not include
complete restoration of the damaged areas downslope of the well or complete removal of the
access road near Barnett Bridge.
Water, soil, and sediment samples were taken by EPA during the response activities.
EPA, TDEC, and FWS personnel also collected additional samples on 25 July 2002 to assess the
nature and extent of contamination in the impact areas during the response.

Damage Assessment and
Restoration Plan
1-3
FIGURE 1. Location of the Howard/White Unit No. 1 oil spill and fire.
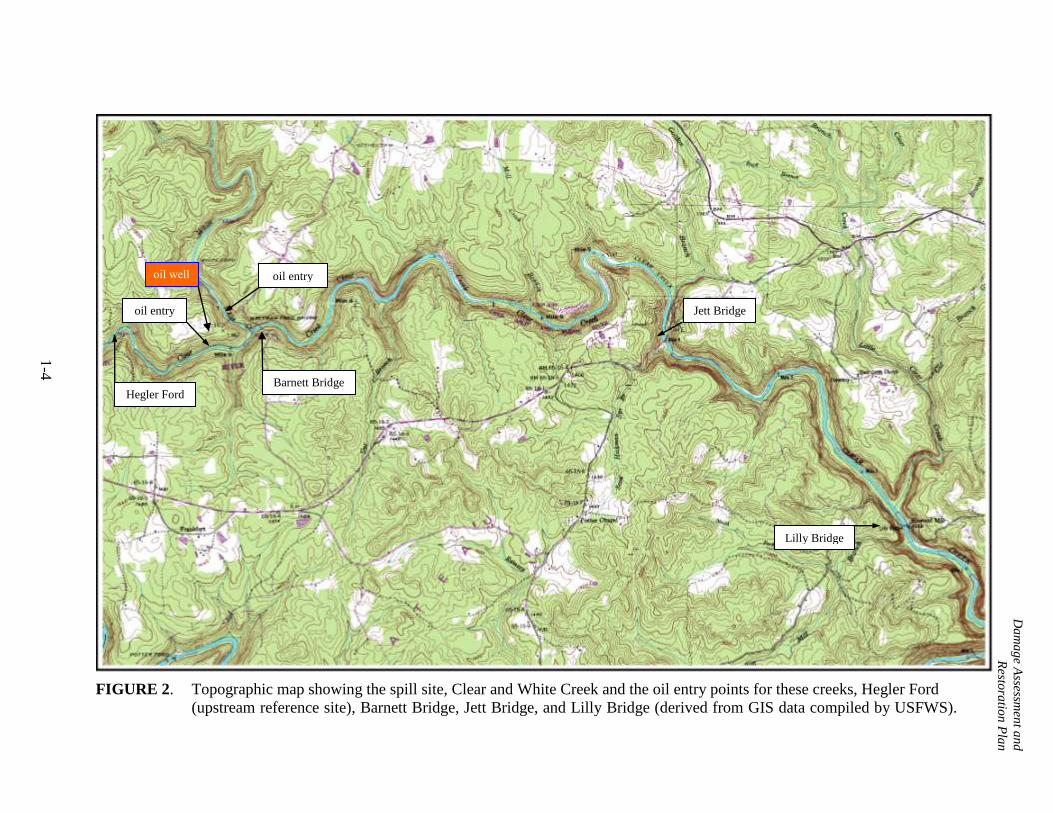
FIGURE 2. Topographic map showing the spill site, Clear and White Creek and the oil entry points for these creeks, Hegler Ford
(upstream reference site), Barnett Bridge, Jett Bridge, and Lilly Bridge (derived from GIS data compiled by USFWS).
1-4
Da
ma
ge A
ssessmen
t an
d
Resto
ratio
n P
lan
oil well
Barnett Bridge
Jett Bridge oil entry
oil entry
Lilly Bridge
Hegler Ford

Damage Assessment and
Restoration Plan
1-5
1.2 Summary of Natural Resource Injuries
The natural resource Trustees evaluated the information gathered during the response
activities and from studies implemented during the Preassessment Phase and Injury Assessment
Phase of the NRDA. Forest vegetation and soils, visitor use, and stream health (as indicated by
benthic algae and invertebrates, fisheries, water quality, and sediment quality) were determined
to have been affected as a result of the oil spill. There is some uncertainty in the duration of
injury to stream health because it is unknown how long oil will continue to seep into Clear
Creek. However, the Trustees used all of the available information, including focused studies,
past literature, and expert scientific judgment, to estimate the injury as a result of the oil spill.
The natural resource injuries were determined using the Habitat Equivalency Analysis
application discussed in further detail in the Injury Assessment section of this report and
translated to discounted service acre years (DSAYs) or dollars. Using these methods, the
Trustees estimated the injury to the 0.74 acres of oiled and burned forest to be 24.3 DSAYs. The
Trustees estimated the injury to the 5.2 acres of stream services to be 26.1 DSAYs. The injury to
visitor use was estimated to be $56,446.
1.3 Summary of the Preferred Restoration Alternative
The preferred restoration alternative involves five actions: 1) natural recovery – the
primary restoration option for forest and stream injuries, 2) invasive vegetation control to
compensate for the forest injury, 3) land acquisition/conservation to compensate for forest injury
as well as lost visitor use in the Obed WSR, 4) restoration activities in the headwaters of the
Little Obed River in Centennial Park, Crossville, TN to compensate for lost stream services, and
in the event that the 4th
action is unable to be implemented, 5) reclamation of an abandoned mine
site in the Golliher Creek watershed that includes treatment of acid mine drainage (AMD) would
also be appropriate to restore stream services. The Trustees prefer the Centennial Park project
over the Golliher Creek project because it is located in the Obed River watershed where the
injury occurred.
1.4 Organization of Document
This report presents information about the natural resource injury studies and proposed
restoration actions for the Howard/White Unit No. 1 oil well blowout incident. Section 2 briefly
summarizes the legal authority and regulatory requirements of the Trustees under the Oil
Pollution Act of 1990 (OPA), and the role of the RP and the public in the damage assessment
process. Section 3 describes the physical and ecological environments, the cultural and
socioeconomic use of the impacted areas, and the current conditions of affected resources.
Section 4 describes and quantifies the injuries caused by the spill, including an overview of
preassessment activities, a description of assessment strategies employed by the Trustees, and a
summary of assessment results. Section 5 provides a discussion of restoration options, including
the economic and socio-economic impacts associated with each, and the appropriate scale of
preferred options based on the nature and extent of injury presented in Section 4. Section 6
provides an analysis of environmental consequences from the two restoration alternatives.
Section 7 is a summary of the preferred restoration alternative evaluated by the Trustees.
Damage Assessment and
Restoration Plan
2-1
2.0 PURPOSE AND NEED FOR THE DARP
2.1 OPA Requirements
Under the OPA NRDA regulations in 15 C.F.R. Part 990, the NRDA process consists of
three phases: 1) Preassessment; 2) Restoration Planning (includes Injury Assessment and
Restoration Selection); and 3) Restoration Implementation. Preassessment Phase activities for a
NRDA include collecting ephemeral data that are necessary for determining the fate and effects
of the spilled oil, reviewing the results and analyzing the data, compiling the Administrative
Record, and making a determination whether there is injury or potential injury to Trust resources
or services potentially affected. Ultimately, the Preassessment Phase documents the collaborative
decision made by the Trustees on whether or not to pursue the assessment and restoration
planning phases of the NRDA. The determination to conduct restoration planning is based on the
following conditions (OPA regulations section 990.42(a)):
Injuries have resulted, or are likely to result, from the incident;
Response actions have not adequately addressed, or are not expected to adequately
address, the injuries resulting from the incident; and
Feasible primary and/or compensatory restoration actions exist to address the potential
injuries.
The Trustees conducted preassessment activities and prepared a Preassessment Phase
report in April 2003. As a result, the Trustees determined that the above conditions had been met
and had likely resulted in losses of natural resources and services from the date of the incident
until the date of recovery. Thus, the Restoration Planning Phase was initiated. Under OPA,
trustee agencies determine the damage claims to be filed against parties responsible for injuries
to natural resources resulting from discharges of oil. Claims can be made for primary restoration
(actions taken to directly restore the injured resources) and compensatory restoration (actions
taken to replace the interim loss of resources from the time of injury until the resources recover
to baseline conditions). The purpose of the Restoration Planning Phase is to quantify injuries to
natural resources and services and determine the scale of the restoration actions. As the injury
assessment is being completed, the Trustees develop a plan for restoring the injured natural
resources and services. The Trustees are responsible for:
Identifying a range of restoration alternatives,
Reviewing and selecting the preferred alternative(s),
Developing a Draft Restoration Plan presenting the alternative(s) to the public,
Soliciting public comment on the Plan, and
Considering these comments when developing a Final Restoration Plan.
Before initiating the Restoration Implementation Phase, the Final Restoration Plan is
presented to the RP to implement or to fund the Trustees' costs of implementing the plan to avoid
litigation. Should the RP decline to settle a claim, OPA authorizes Trustees to bring a civil action
against the RP for damages and the Trustees’ costs, or to seek disbursement from the USCG Oil
Spill Liability Trust Fund (OSLTF) equal to the value of the damages plus the Trustees’ costs.
Costs include the cost of implementing the selected restoration action, the monitoring and

Damage Assessment and
Restoration Plan
2-2
necessary corrective actions, and the cost of the damage assessment itself (33 U.S.C. §§ 2701(5)
and 2702(b), 15 CFR 990.62 and 990.63).
2.1.1 Coordination among the Trustees
The damage assessment and restoration planning process included the two co-Trustees
(DOI as represented by NPS and USFWS, and the State of Tennessee represented by TDEC) of
the river system and those agencies assisting the Trustees (USGS, TWRA). Together, these
agencies became the Trustee Council and worked to meet their respective natural resource
trustee responsibilities under OPA. The Trustee Council met on a regular basis to discuss the
progress of the NRDA and the studies being completed to support the Injury Assessment and
Restoration Planning efforts. As the federal co-Trustee, NPS assumed the role of the Federal
Lead Administrative Trustee and the overall NRDA coordinator; however, all decisions were
made by a consensus of the Trustee Council.
2.1.2 Coordination with the Responsible Party
The OPA regulations require the Trustees to invite the RP to participate in the damage
assessment process. Accordingly, the Trustees delivered a letter to the RP, Pryor Oil Company,
on 16 August 2002, alerting the RP that the Trustees were preparing to begin the Preassessment
Phase of the NRDA, and that they were invited to participate in the preassessment as well as any
further assessments or restoration planning. The RP chose not to participate with the Trustees
and was not present at the Trustee Council meetings. A DOI Notice of Intent to Conduct
Restoration Planning letter was sent to the RP on 29 April 2003, but the Trustees did not receive
a written response from the RP. A third letter to the RP, dated 11 February 2005, was sent to
notify the RP that the Trustee Council was preparing the DARP. The letter also offered an
invitation to the RP to participate in DARP activities, with no response received from the RP.
With the lack of participation from the RP, the Trustees collectively made determinations
regarding injury and restoration.
2.1.3 Public Participation
The Trustees have provided the public with information regarding their NRDA activities
via the Administrative Record (AR). The AR is available for public viewing at the Obed WSR
Office. Through the AR, the public is able to obtain all documentation collected during the
NRDA, provide restoration ideas and alternatives to the Trustees, and identify agency contacts to
obtain more information.
The Trustees will also provide notice to the public that this draft Damage Assessment and
Restoration Plan and Environmental Assessment is available for public review, will solicit public
comments on the draft, and may hold a public meeting about the plan and assessment if there is
sufficient public interest. The Trustees will respond to any written or oral comments received on
the draft plan and environmental assessment when they prepare the final plan and assessment.
2.1.4 Administrative Record

Damage Assessment and
Restoration Plan
2-3
The AR was created during the Preassessment Phase and the files contain records from all
of the injury assessment studies, meeting minutes, comments provided by the various agencies,
reports, and all other documentation related to the NRDA. The AR is available for public
viewing at the Obed WSR office, 208 N. Maiden Street, Wartburg, Tennessee.
2.2 NEPA Compliance
The National Environmental Policy Act (NEPA) (42 U.S.C §§ 4371 et. seq.) requires
federal agencies to evaluate environmental values during a restoration project by considering the
environmental impacts of their proposed actions and reasonable alternatives to those actions.
This document serves as the Environmental Assessment (EA) required by NEPA in that it
describes the affected environment, the need and purpose of the restoration, addresses alternative
restoration options, the consequences of the proposed action, and the role for public participation
within the decision-making process. The information summarized in this document also
determines whether or not an Environmental Impact Statement (EIS) is required before a final
restoration project(s) is chosen. An EIS is necessary when the proposed action is a major federal
action that may significantly affect the quality of the human environment (40 CFR 1502.3).
The draft DARP/EA will be submitted for public review and comment. Based on the
results of the public review, the Trustees will make the determination whether or not the
preferred restoration actions will significantly affect the quality of the human environment and if
the proposed restoration actions meet the threshold requiring an EIS. The results of these
determinations will be included in the final DARP/EA.
Damage Assessment and
Restoration Plan
3-1
3.0 AFFECTED ENVIRONMENT
This chapter presents a summary of the physical, biological, and cultural environment
within the Obed WSR affected by the Howard/White Unit No. 1 oil spill. The affected
environment includes the surface waters, sediment, shoreline, cliffs, and associated biological
resources as well as the cultural resources and human uses of Clear Creek and White Creek. Also
discussed is the Little Obed River headwater stream and Golliher Creek, neither of which were
affected by the oil spill but are considered part of the preferred restoration alternative.
3.1 Physical Environment
3.1.1 The Obed WSR
The Obed is one of only nine Wild and Scenic Rivers authorized in the southeastern
United States. The Obed River flows over 45 miles through some of the most rugged and
undeveloped terrain in eastern Tennessee. Spectacular views of high bluffs, waterfalls, and
geologic features are common. Its rugged terrain has allowed the river corridor to remain
relatively uninhabited and unimpacted. The Obed WSR's "wild" character and difficult terrain
offer visitors a rare opportunity to experience a trace of primitive America. Clear Creek and
White Creek are part of the Obed River watershed that drains across the Cumberland Plateau,
cutting 300 to 400 feet below the surface of the Plateau. Much of this vertical depth is accounted
for by bluffs that are up to several hundred feet in height. The larger tributaries join the stream at
grade, and the smaller ones often enter as waterfalls and seeps. Total precipitation varies from
about 52 inches to 61 inches (Mayfield, 1984). Water resources and riparian environments are
the principle resources of the Obed WSR. The waters of the Obed in this area, including Clear
Creek, are relatively unpolluted (with the exception of the oil spill) and are considered to be
among the highest quality in the state, supporting a rich array of plant and animal life. The
waters in this area are currently listed on the 2006 303(d) list for the oil pollution.
The oil flowing from the well contaminated both White Creek, at approximately 0.21
miles above its confluence with Clear Creek, and Clear Creek, at approximately 0.37 miles
above Barnett Bridge. The oil impacted at least 2 miles of Clear Creek (EPA, 2002). Clear Creek
is a high-gradient, fourth-order stream located in Fentress and Morgan Counties, Tennessee. The
physical resources affected from the contamination were the water and sediments within the
creeks, the riparian wetlands and habitat alongside Clear Creek, and the highland areas and soils
above the point of oil entry at Clear Creek.
The waters of Clear Creek showed evidence of oil contamination during sampling efforts
(see 4.2.1 Water Quality), and the Trustees assumed that the water quality remains affected since
oil continues to seep into Clear Creek (observed June 2007). The affected waters in Clear Creek
begin from the point of entry to just downstream of Barnett Bridge (2,560 ft long). White Creek
also showed evidence of water contamination initially from the point of oil entry downstream to
the confluence with Clear Creek (1,174 ft long), however, the amount currently observed in the
creek is likely to be below levels that would cause significant impacts. Sediments were also
affected as a result of the spill. There was initial evidence of contamination in the sediments in
Clear Creek from the point of oil entry downstream to just below Barnett Bridge (2,560 ft). The
Trustees assumed that this resource continues to be affected by the continual seepage of oil into

Damage Assessment and
Restoration Plan
3-2
Clear Creek, however, the degradation of sediments was based on the effects observed in the
injured biological resources (e.g., benthic invertebrates, fish), discussed under 3.2 Biological
Environment. Riparian wetlands and habitat, from the spill site to Barnett Bridge along Clear
Creek were also affected in the initial period after the spill. Dead and stressed vegetation was
observed, as well as a coating of oil on leaves of some of the surviving plants. However, the
riparian areas observed after the spill had returned to baseline levels within a year, and the
Trustees did not identify these resources as impaired after this time period.
The highland areas, from the oil well down to both White and Clear Creeks, were
impacted by both oil and fire. The soils were soaked with oil and the fire burned the surface soil
as well as the forest vegetation. An area 1.98 acres (0.8 hectares) in size was burned from the oil
well to Clear Creek, of which 0.74 acres (0.3 hectares) are within the authorized boundary of the
Obed WSR over which the Park owns a scenic easement property interest. The fire also burned
an area estimated to be less than 1.24 acres on the slope from the oil well down to White Creek;
however, this area was not part of the Obed WSR property. The forest vegetation and soil
resources are currently injured as a result of the spill and fire.
3.1.2 Centennial Park, Crossville, TN
The Little Obed River is a headwater stream to the Obed River within the city limits of
Crossville, TN. One of the smaller streams that empty into the Little Obed River also runs
through Centennial Park, a Crossville City park with baseball fields and other recreational areas.
The headwater stream was not affected by the oil spill, however, the site is the location of one of
the preferred alternative actions discussed in subsequent sections.
The reaches of the small headwater stream to the Little Obed River in the preferred
restoration area are heavily developed. The banks are incised 3-7 feet, and the stream has been
channelized in the upper section of the city park. Entrenchment is consistent with upstream urban
development/increased runoff coefficient. The banks are unstable, the substrate includes
sandstone rubble and scoured residuum, and silt covers the bottom of the creek. In July 2007
(during drought conditions), the channel was dry in the uppermost sections, standing pools were
present in the middle reaches, and the lowest reaches in the park had a trickle of flow, indicating
viable perennial (or nearly so) habitat in the lowest third or so of the park (J. Burr, pers. comm.,
2007). The riparian buffer is either non-existent or composed of non-native species. Water
quality is degraded. Most of the drainage conveyances leading from the paved parking areas
directly to the stream are unstable and managed poorly. Not only are they susceptible to flash
runoff erosion and are washing away hillsides, the grounds crew crops the soils bare.
3.1.3 Golliher Creek, Morgan County, TN
Golliher Creek is a tributary and headwater creek to Crab Orchard Creek which empties
into the Emory River. Golliher Creek is outside of the Obed WSR drainage and was not affected
during the oil spill. However, like the Centennial Park site, it is the location of one of the
preferred alternative actions discussed below.
Golliher Creek is currently listed in the TDEC 303(d) 2006 List of Impaired Waterbodies

Damage Assessment and
Restoration Plan
3-3
as a result of acid mine drainage (AMD). The upland banks of Golliher Creek were used for coal
mining activities prior to the passage of the Surface Mining Control and Reclamation Act of
1977. The coal mining activities left open pits along the creek channel and acid-forming material
that was exposed on the upland site during the operations oxidized and created pockets of
standing and flowing surface water with depressed pH and elevated mineral content. Although
coal mining operations no longer occur at this site, runoff events continue to contaminate
Golliher Creek with acidic materials (TDEC, 2001). The water quality of Golliher Creek is poor
with low pH levels (pH≤ 3.0) and high levels of managanese and iron (TDEC, 2006). The total
surface disturbance at this site is approximately 17 acres.
3.2 Biological Environment
3.2.1 The Obed WSR
Clear Creek and White Creek are important habitat for an array of species.
Macroinvertebrates, such as the mussels Villosa iris and Lampsilis fasciola, are common to both
creeks and rely on high water quality within the river system. Several species of fish inhabit both
Clear and White Creek including smallmouth bass (Micropterus dolomieu), largemouth bass
(Micropterus salmoides), rock bass (Ambloplites rupestris), redbreast sunfish (Lepomis auritus),
and Northern hogsucker (Hypentelium nigricans).
Clear Creek is federally designated critical habitat (Federal Register Volume 42, No. 175)
for the federally threatened spotfin chub (Cyprinella (=Hybopsis) monacha). One federally
endangered Unionid mussel, the purple bean (Villosa perpurpurea), and two federally threatened
plants, Virginia spiraea (Spiraea virginiana) and Cumberland rosemary (Conradina verticillata)
are also known to occur in or along Clear Creek.
The forests bordering the Obed WSR are characterized as a dry oak-dominated forest
with black and scarlet oak the most common and oldest species, with a mean age of 102 years
and up to nearly 400 years (Walker et al., 2004; Webster and Jenkins, 2006). Other species
include white pine, hickories, white oak, and chestnut oak. The rim and slopes of the river have
thin soils, unique and striking rock outcrops, rugged terrain, and one of the richest floras in the
southeastern United States including vascular plants, bryophytes, and lichens (Walker et al.,
2004). Within the Obed River gorge, studies have reported 734 taxa within 393 genera and 122
families (Schmalzer et al., 1985). The cliff edge habitat was found to have unique community
assemblages including state and federally listed species (Walker et al., 2004). Mammals and
birds that have been observed in the Obed WSR include white-tailed deer, gray fox, red fox, gray
squirrel, raccoon, cottontail rabbit, wood duck, mallard, and turkey. Songbirds and raptors are
also seen frequently throughout the area.
Affected biological resources from the oil spill include benthic algae, macroinvertebrates,
and fish. These resources are present in both Clear and White Creek occurring in the entire area
of impact (Clear Creek: 2,560 ft long and 79.4 ft wide; White Creek: 1,174 ft long and 60 ft
wide). There was a change in the benthic algae community that occurred immediately after the
spill as a response to the change in water quality. A decrease in primary productivity was noted
downstream of the spill site. Algal communities may be affected as long as oil continues to seep
into Clear Creek. Benthic macrovinvertebrates were also affected and sampling between 2002

Damage Assessment and
Restoration Plan
3-4
and 2006 showed lower index scores (e.g., taxa richness, EPT richness) indicating injury in the
macroinvertebrate community during low water flows in Clear Creek. Fish, including redbreast
sunfish and rock bass, were exposed to oil in the area of impact and showed evidence of
sublethal stress (e.g., organ dysfunction and reduced condition indices). Impacts on reproduction
were also observed but only immediately following the spill. The Trustees concluded that fish
were affected in the impacted area from the spill site to Barnett Bridge.
Every canopy tree, most of which were oaks, in the burned area was killed. Few trees
have resprouted because of the damaged root systems and the badly burned soil litter, duff, and
surface horizons. Fireweed, a native weed that dominates disturbed sites, comprises the majority
of the growth in vegetation since the spill.
3.2.2 Centennial Park, Crossville, TN
The riparian buffer in the headwater stream in Centennial Park ranges from spotty and
composed mostly of non-natives to no canopy and mostly mown grass and weeds. The instream
habitat is poor, consisting of silt and weedy aquatic vegetation in the upper sections and some
viable natural substrate in the lower section (J. Burr, pers. comm., 2007).
During informal consultation wtih the USFWS, it was determined that there were no
threatened or endangered species in the headwater stream in Centennial Park, Crossville that
might be affected by the proposed restoration project. The park is highly developed and
maintained (mowed grass, ball fields, paved parking areas, etc.) and is surrounded for miles by
suburban development. Representatives of the TWRA visited the site in July 2007 and did not
note the presence of any species or habitats of concern.
3.2.3 Golliher Creek, Morgan County, TN
In its current condition, Golliher Creek does not support fish and other aquatic life
because of the high acidity levels. Secondary production, an important ecological service of a
headwater stream, is limited as a result of the degraded aquatic community. Benthic algae, fish,
and macroinvertebrates will return to streams when the pH of the water returns to baseline
conditions.
3.3 Cultural Environment and Human Use
3.3.1 Obed WSR
There is evidence that prehistoric Native American cultures used the gorges and bluffs
along the Obed WSR as early as 12,000 B.C. as hunting grounds (NPS, 1994). Approximately
400 years ago, Native American groups of the Historic Period claimed the Obed WSR as tribal
territory. The last prehistoric cultural period, known as the Mississippian period, saw an influx of
different tribes in the region. From roughly 1300 to the mid-1800s, tribes such as the Creek,
Chickasaw, Choctaw, Shawnee, Yuchi, and Cherokee all bore witness to the Obed River. These
tribes could not farm the land surrounding the river however, due to its poor farming soil and
steep bluffs. As a result, the tribes used the area for hunting and gathering, and on many
Damage Assessment and
Restoration Plan
3-5
occasions used the sandstone bluffs as shelter during inclement weather. During the 18th
century, a group of European white males migrated through the Obed area. They were called
"Longhunters," and they were in the area primarily to hunt and fish. Like the Native Americans
before them, they did not make their homes at the Obed, but used the sandstone bluffs as
shelters. Europeans settled on the Cumberland Plateau around 1800 and used the land for
agriculture. Archaeological studies identified 13 culturally significant sites, ten of which were
prehistoric rock shelters. The remaining three sites were associated with 19th
and 20th
century
farmsteads and industries (NPS, 1994). It is unlikely federally controlled sites were affected by
the oil spill, however, private and/or state archaeological/cultural sites were disturbed by the
response efforts (DesJean, 2002).
With the excellent water quality, scenic canyons, deep swimming holes, and whitewater
rapids, the park supports a variety of outdoor recreational activities, including whitewater
paddling, rock climbing, hiking, swimming, fishing, and sightseeing. Many visitors are
particularly attracted by the remote wilderness experience offered by the park, as there are no
roads along the rivers and few signs of civilization (IEc, 2003b).
Five bridges span rivers and creeks within the park, allowing visitors access to the water
and serving as focal points for recreation. A brief description provided by Industrial Economics,
Inc. (2003b) of the four bridge access points potentially affected by the spill follows:
Barnett Bridge: The Barnett Bridge access to Clear Creek includes two to three primitive
camping sites, pit toilets, a bulletin board, and a small, unpaved parking area with space for
approximately ten to twelve cars. Recreational activities at Barnett Bridge include paddling,
fishing, picnicking, camping, and swimming (a swimming hole with a tree swing is located
approximately 500 yards downstream from the bridge).
Jett Bridge: The Jett Bridge access to Clear Creek includes a bulletin board, pit toilets,
picnic tables, fire pits, and a paved parking area with space for approximately ten to fifteen
vehicles. Recreational activities at Jett Bridge include paddling (Jett is a popular put-in and take-
out area), fishing, picnicking, and swimming (a popular swim hole, known as "Slant Rock" is
located just upstream of the bridge).
Lilly Bridge: The Lilly Bridge access to Clear Creek includes a bulletin board, pit toilets,
and a partially paved parking area with space for approximately 25 vehicles. Recreational
activities at Lilly Bridge include paddling, fishing, swimming, and sightseeing. A number of
popular swim holes are located near the bridge, and the view of Clear Creek Canyon makes the
Lilly Bridge area attractive to sightseers.
Nemo Bridge: The Nemo Bridge access on the north shore of the Emory River includes a
bulletin board, changing rooms, pit toilets, 10-12 picnic tables and fire pits, and a large parking
area with space for approximately 30-40 vehicles. In addition, Nemo Bridge access provides
approximately twelve primitive camping sites on the south shore of the river and additional day
use parking. Recreational activities at Nemo Bridge include paddling, fishing, swimming,
picnicking, hiking, and camping. A number of popular swim holes are found just downstream of
the bridge, outside of the park boundary.

Damage Assessment and
Restoration Plan
3-6
The visitor use component of the Obed WSR was affected by the spill as many of the
activities that occur frequently within the park’s boundaries were prohibited as a result of the oil
contamination. A section of Clear Creek was closed from July 2002 through February 2003, and
an estimated 509 fishing days and 400 paddling days were lost. A survey revealed that 78% of
visitors who had completed the survey indicated that they were negatively impacted by the spill.
The ongoing release of oil into Clear Creek during low flows continues to impact visitors,
whether their intended activity is fishing, swimming, or boating.
3.3.2 Centennial Park, Crossville, TN
Centennial Park, managed by the City of Crossville, TN, was built in 1992 and consists
of 67 acres. The park facilities include four adult-sized softball fields with field house and
concessions, five youth-sized softball fields, a regulation baseball field along with field house
and concessions, two lighted picnic pavilions, 1.5 miles of paved walking and bicycle trails,
combination basketball and tennis court area, regulation-sized double tennis court, 24 horseshoe
pits, four sand volleyball courts, a large child play area with sand boxes, a playground designed
specifically to accommodate children with special needs, and ample parking.
Consulations were initiated with the State Historic Preservation Office and Tribal
governments on the potential for impacts to cultural resources in the park. Based on these
consultations, there are no known cultural resources in the park.
3.3.3 Golliher Creek, Morgan County, TN
Crab Orchard Creek was once a heavily used site for whitewater fishing enthusiasts.
However, the poor water quality due to the AMD contamination from several of its headwater
creeks (e.g., Golliher Creek included) has limited recreational fishing. Many of the fish species
have disappeared from the creek as result of the high acidicity levels. Golliher Creek is not a
high public use site; however there have been some concerns with human safety on the uplands
of the creek. The steep high wall of the mine against the hillside is hazardous and piles of
unstable mine debris are unsafe for climbing.

Damage Assessment and
Restoration Plan
4-1
4.0 INJURY ASSESSMENT
4.1 Introduction
The goal of injury assessment under OPA is to determine the nature and extent of injuries
to the natural resources and services. This determination provides a technical basis for evaluating
the need for, type of, and scale of restoration actions. Under the OPA regulations, “injury” is
defined to include “an observable or measurable adverse change in a natural resource or an
impairment of a natural resource service” (15 CFR § 990.30). Trustees are responsible for
determining whether or not there is exposure or an adverse change to natural resources as a result
of oil contamination or injury to a natural resource as a result of response actions. To proceed
with restoration planning, trustees also quantify the degree and extent of injuries. Injuries are
quantified by comparing the condition of the injured natural resources or services to baseline.
“Baseline” is defined as “the condition of the natural resources and services that would have
existed had the incident not occurred” (15 CFR § 990.30).
4.2 Overview of Preassessment Phase Activities and Findings
The data collected during the Preassessment Phase were necessary to determine the
extent of injury to Clear and White Creeks and decide if restoration planning is appropriate.
NPS, USFWS, TDEC, Oak Ridge National Laboratory (ORNL), and the Tennessee Valley
Authority (TVA) participated in the collection of samples for analysis that began days after the
spill and continued for the next six months. The following sections describe the studies
conducted to assess the likelihood of injury to the resources impacted by the oil spill. The
resources and services that were evaluated include water, sediment, soil, biota, terrestrial
vegetation, and visitor use. A more detailed description of the following studies is presented in
the Preassessment Phase Report (Research Planning, Inc., 2003) located in the Administrative
Record.
4.2.1 Water Quality
Water quality monitoring of both Clear and White Creeks was conducted to document the
oil concentrations over time and distance downstream from the release site, as well as to
complete a fingerprint analysis to document the source of the oil contamination. Surface water
grab samples were collected from Clear Creek and White Creek in July, August, and October
2002, as well as October 2003. Locations were chosen to represent water quality upstream of the
spill site, at the site where the oil was discharged into the creeks, and downstream of the site to
monitor the spatial extent of exposure. Water samples were analyzed for polynuclear aromatic
hydrocarbons (PAH), metals, semivolatile organic compounds (SVOC), volatile organic
compounds (VOC), EPA target analyte list of 23 metals, alkanes, and total petroleum
hydrocarbons–diesel range organics (TPH-DRO).
Water samples collected in July, August, and October 2002 and analyzed by the
Louisiana State University showed evidence of contamination by oil that was fingerprinted as
matching the source oil from the oil well (Research Planning, Inc., 2003). Additional water
samples collected in October 2003 also showed contamination with PAHs that were a match with

Damage Assessment and
Restoration Plan
4-2
the source oil. The sampling efforts and analyses indicated that there were impacts to water
quality resulting from the oil spill and fire, from the point of release on each creek and extending
at least to Barnett Bridge.
NPS and USFWS personnel routinely surveyed Clear Creek and White Creek during the
summer, fall, and winter of 2002 and early 2003 for evidence of oiled substrates and surface
sheening. Survey efforts included snorkeling and videotaping the substrate and biota
encountered. Stream substrates were disturbed to determine oil emergence areas and shorelines
were also surveyed for residual free product and areas of paraffin accumulation.
4.2.2 Sediment Quality
In July and August 2002 sediment samples were collected from Clear Creek and White
Creek representing unaffected upstream or background sites, points of oil entry into the creeks,
and downstream sites. These samples were analyzed for SVOC, VOC, metals, and TPH-DRO.
Sediment samples were also collected from three locations along Clear and White Creeks in
August 2002 to be tested for alkanes and PAH. A third round of sediment sampling in October
2002 was completed and samples were analyzed for n-alkanes, PAH, metals, and VOC.
Based on sediment sampling conducted in 2002, sediments in Clear Creek showed
evidence of contamination from the oil spill, with elevated TPH-DRO concentrations in
sediments from the point of entry site to Barnett Bridge. Although there is potential for continued
sediment contamination from ongoing oil seepage into Clear Creek, the Trustees proposed to
assess sediment injury in terms of impacts to the benthic community, as reflected in
contamination of mussels and crayfish and the health of the benthic macroinvertebrate
community. Therefore, no additional injury assessment studies of sediments were completed.
4.2.3 Benthic Algae
Benthic algae are important indicators for changes in water quality as they are attached to
the substrate and respond rapidly to chemical or physical disturbances within a stream system.
Natural substrates were sampled and artificial substrates were deployed in Clear Creek upstream
from the spill site, at Barnett Bridge, and at Jett Bridge (downstream of spill site) in October
2002 (Pennington and Associates, Inc. 2003). The artificial substrates were removed two months
later and analyzed for chlorophyll and ash-free dry weight. The samples from the natural
substrates were analyzed for species present, number of individuals per species, and calculation
of metrics of biotic integrity.
The results indicated that the natural substrate sampled in October 2002 appeared to be
similar among all three stations sampled. The December 2002 samples analyzed from the
artificial substrates indicated a change in the number of species between locations, with the
highest number of species found at the upstream location in Clear Creek (Pennington and
Associates, Inc. 2003). These data suggest a change in the algal community as a possible
response to the water quality impacts in Clear Creek after the oil spill. Therefore, the Trustees
used these data to assess the injury to benthic algae in terms of changes in primary production,
which is the lowest trophic level in the stream ecosystem.
Damage Assessment and
Restoration Plan
4-3
4.2.4 Macroinvertebrates
Impacts to benthic macroinvertebrates were assessed during the Preassessment Phase by
three types of studies: 1) mussel sampling in August and October 2002 for chemical analysis of
tissues to measure the bioavailability of the oil; 2) benthic monitoring conducted in October 2002
and 2003 to compare benthic species abundance and diversity between oiled and unoiled areas of
Clear Creek; and 3) collection of crayfish samples in May 2003 (however, the samples were not
analyzed until 2006).
All mussel tissues collected and analyzed in 2002 showed low or no detectable PAH.
During August 2002 surveys, female mussels were observed ejecting from the sediments near the
spill site and moving to a different location (seen by a trail left on the substrate by the mussel),
possibly indicating that the mussels were trying to relocate into non-polluted sediments.
The benthic macroinvertebrate community data collected in October 2002 showed
impacts to the benthic macroinvertebrate communities in Clear Creek for the area above Barnett
Bridge but not as far downstream as Jett Bridge (Research Planning, Inc., 2003). The degradation
of benthic community health in Clear Creek dropped to “partially-supporting,” whereas it
previously was fully supporting and considered to be a reference stream.
The results of the October 2003 benthic macroinvertebrate sampling indicated that the
benthic community in the area just above Barnett Bridge had returned to pre-spill levels by late
2003. A new site 0.4 miles downstream of Barnett Bridge was sampled in October 2003 to
determine the downstream extent of impact, and this site was also normal in terms of its benthic
community in late 2003. Sheens were released from both sites above and below Barnett Bridge
during the October 2003 sampling efforts.
Based on the above data collected, the biological condition at the Jett Bridge site before
and after the spill was considered to be non-impaired. Benthic index scores showed an impact
immediately downstream of the spill site in 2002 but not in 2003. In summary, impacts to the
benthic macroinvertebrate communities were detected in Clear Creek for the area above Barnett
Bridge but not as far downstream as Jett Bridge.
4.2.5 Fish Community Health
Fish were collected, counted, and observed for anomalies in 2002, 2003, and 2004 to
determine the Index of Biotic Integrity (IBI) metric for Clear Creek. Similar data were available
from 1996 and 1998, allowing time-series comparison of before and after the spill event. The IBI
is a fish community assessment where species are assigned to trophic guilds and anomalies are
noted in order to obtain a score based on values assigned to the Cumberland Plateau Ecoregion.
TDEC, TVA, and ORNL collected fish for analysis at two reference sites and two oiled
sites (Barnett and Jett Bridges) in 2002 (Fig. 2). For a portion of the 2002 samples, preliminary
analysis were conducted which indicated injury at various levels of biological organization to the
health of both rock bass and redbreast sunfish (sentinel indicator species) collected from the oil
spill site (Adams et al., 2003).

Damage Assessment and
Restoration Plan
4-4
No fish kills were reported during the oil spill and response. The IBI scores calculated for
locations upstream and downstream of the spill site in Clear Creek were compared to scores
assigned to the same areas in previous years. The only decrease observed between sampling
times was for the upstream location at Norris Ford. The scores for fish collected at Barnett
Bridge, downstream of the spill site, gave no indication of having an impact from the oil spill
event. The IBI scores were all rated as good or good/excellent with the exception of the upstream
2002 collection, which was rated fair/good.
The initial data collected from the fish collections in August 2002 indicated that rock bass
may be the species most affected by oil exposure (Adams et al., 2003). Rock bass collected near
Barnett Bridge in Clear Creek experienced lower visceral-somatic index, liver-somatic index,
and reduced feeding index as compared to redbreast sunfish and hogsucker. All three species,
rock bass, redbreast sunfish, and hogsucker had higher leukocrit values indicating a weakened
immune system. A depressed immune system in fish increases the chance of disease and
parasites.
In summary, it is likely that there were no acute impacts to fish communities resulting
from the spill. However, there were indications of sub-lethal impacts to fish health that could
lead to reduced survival, growth, and reproduction.
4.2.6 Forest Vegetation and Soils
A forestry study was conducted to document impacts to the forest structure by sampling
vegetation within the burned site and a nearby reference site (Jenkins, 2003). Preassessment
Phase field sampling was completed in January and February 2003. The diameter at breast height
(dbh) and height of all woody stem species greater than or equal to 1.4 m in height were
measured and their condition was assessed. Basal area and density were calculated for all living
and dead woody stems greater than or equal to 2.54 cm dbh. Density was measured for stems
less than 2.54 cm dbh. The age of the overstory trees were also determined.
Soil samples were collected in July and August 2002 and included a reference site located
in the woods southwest of the well, as well as samples between the well and the cliff. Samples
were collected between the cliff edge and Clear Creek, as well as in the area between the cliff
edge and White Creek. The samples were analyzed for SVOC, VOC, metals, and TPH-DRO
(EPA, 2003). Another round of soil samples were collected throughout the burned forest
community in February 2003 that documented the changes in fire severity and oil saturation.
The forestry study results showed high mortality of the vegetation in the footprint of the
two slope areas (on both Clear Creek and White Creek) affected by the oil spill and fire. The soil
was severely impacted by the oil spill and fire. The oil saturation and fire caused the loss of the
fine roots, the seed bank, and the sources of vegetative reproduction, which will slow recovery of
the burned area. The fine roots are responsible for the uptake of water and nutrients and their loss
could greatly impact surviving trees.
Damage Assessment and
Restoration Plan
4-5
4.2.7 Riparian Wetlands and Habitat
During the Preassessment Phase, a botanist from TDEC’s Division of Natural Heritage
conducted surveys of the riparian habitat adjacent to and in Clear Creek, from the spill site to
Barnett Bridge. Dead and stressed vegetation, consisting primarily of American water willow,
Justicia americana, was observed along Clear Creek. Many occurrences of the royal fern,
Osmunda regalis, which also occurs along the banks of Clear Creek, were observed to be
damaged and dead. The botanist observed a coating of oil on the leaves on some surviving
individual plants. Woody plants observed at the water’s edge did not appear to be affected except
for browning of the leaves where the plant came in contact with oily water.
4.2.8 Visitor Use
Visitor-use reports were compiled to document the potential impacts of the spill on park
visitors during and after the spill event. Qualitative visitor-use surveys were completed between
July and August 2002 and between August and September 2002 that documented response
events that may have affected park visitor’s experiences at the park. The response actions, the
timing and geographic extent of closures and warnings for Clear Creek, and the appearance of
the oil were recorded. This information was researched and compiled into a single document for
future economic valuation work (Industrial Economics, Inc., 2003a).
A total of 118 visitors completed an informal NPS visitor survey. The surveys revealed
that 41% of the respondents could not participate in their intended activity; however, 85% of
these respondents could participate in their activity at an alternate location. Seventy-eight percent
of visitors who completed the survey were negatively impacted by the spill, with 33% being
“slightly” affected, 29% “moderately” affected, and 38% “greatly” affected.
A quantitative study was completed that produced baseline estimates of visitor use at the
Obed WSR prior to the oil spill. Visitor use at four bridge access areas in the park was calculated
using visitation patterns observed by an experienced NPS Obed law enforcement ranger. It was
estimated that the average number of fishing visitors per day at Barnett Bridge and Jett Bridge
between 20 July 2002 and 31 October 2002 (the end of the fishing season) were 7 people on
weekend days and 4 people on week days (Industrial Economics, Inc., 2003b). It was also
estimated by NPS personnel that approximately 400 paddling days would have occurred on the
closed section of Clear Creek between 20 July and 6 February 2003 (when the closure was lifted)
in absence of the spill (Industrial Economics, Inc., 2003b).
4.2.9 Information Management
The USFWS provided Geographic Information System (GIS) data management support
to the Trustee Council during the Injury and Restoration Assessment Phases of the NRDA
project. The work consisted of gathering spatial data on all sampling and observation stations
within the Clear Creek watershed. All analytical data were entered into a relational database and
linked with the spatial database. The GIS database was used by the Trustee Council and
researchers in the conduct of NRDA-related assessments.

Damage Assessment and
Restoration Plan
4-6
4.3 Injury Assessment Strategy
Based on the data collected during the Preassessment Phase, the Trustee Council
determined three categories of injury: 1) forestry resources; 2) stream resources; and 3) lost
visitor use. To determine the restoration options appropriate to compensate for the injury, the
Trustees were required to quantify the nature and extent of the injury. Each injury assessment
study focused on determining both the magnitude of the injury (i.e., amount of biomass lost or
reduction in stream health) and the time to full recovery. Two approaches were used for injury
quantification: benefits transfer and habitat equivalency analysis (HEA). Benefits transfer
involves using economic values that have been previously estimated and reported in existing
studies to address similar issues in other contexts. That is, per-day monetary values from existing
economic studies are combined with site-specific data on the number of days lost to estimate the
total ecomomic value of the loss (NPS, 2003). HEA is a methodology used to determine
compensation for injuries to resources such as forestry and stream resources. The principal
concept underlying the HEA method is that lost habitat resources/services can be compensated
through habitat replacement projects by providing additional resources/services of the same type
(NOAA, 2000).
Under the HEA method, trustees determine the injury using metrics that can be used to
scale appropriate compensatory restoration options. The size of a restoration action is scaled to
ensure that the present discounted value of project gains equals the present discounted value of
interim losses. That is, the proposed restoration action should provide services of the same type
and quality, and of comparable value, as those lost due to injury (NOAA, 2000). The losses and
gains are discounted at a standard rate to express future quantities in present terms based on the
concept that present services are more valuable than future services. The selection of the
metric(s) to quantify the injury and scale restoration options is key to the successful application
of the HEA method.
Using the HEA method, the injuries are quantified in terms of the percent loss of
ecological services (compared to pre-spill baseline levels) and the rate at which the lost services
recover over time. Figure 3 shows a hypothetical curve of the reduction in services for a habitat
after an incident and the expected rate of natural recovery. The inputs into such curves for each
injured habitat are: 1) the percent loss in services immediately after the incident; and 2) the
percent of baseline services at key points in time after the injury. For example, the ecological
services of an injured forest as measured by lost biomass might be reduced to 25 percent of
baseline during the period from the spill to when vegetation started to return. Recovery would be
a function of the rate of oil degradation in the soils and the accumulation of biomass as the
vegetation repopulated the area. By the end of the first growing season, the services might be
predicted as 65 percent of baseline; by the end of the second year, services might be predicted to
have returned to 90 percent of baseline; full recovery might be predicted to occur at the end of
the growing season of the third year following the injury. The injury or lost interim services is
then quantified using a term called a discounted-service-acre-year (i.e., the value or amount of
services provided by one acre of habitat over one year). For the above example, if the injured
area was 1 acre, the estimated injury would be 1.2 discounted service-acres-years (DSAYs). The
calculations for this example are shown in Table 1.

Damage Assessment and
Restoration Plan
4-7
FIGURE 3. Hypothetical curve showing the lost services after an oil spill (area represented by
the letter “A”) and the expected rate of natural recovery, for habitats where the
baseline is constant, though undergoing natural variability.
TABLE 1. Hypothetical injury calculated for 1.0 acre of injured forest habitat.
Years Post Spill Year
Average
Percent
Service Loss
Discount
Factor1
Discounted
Ave. Percent
Services Lost2
Discounted
Service Acre
Years Lost3
0 2003 75% 1.000 75% 0.750
1 2004 35% 0.971 34% 0.340
2 2005 10% 0.943 9% 0.094
3 2006 0% 0.915 0% 0.000
Total Discounted Service Acre Years Lost 1.184 1 the standard discount rate, 3 percent; for year 2: disc. factor = (disc. factor from Year 1, 0.971) / (1 + 0.03)
2 (discount factor) X (average percent service loss)
3 (acres injured (1.0)) X (discounted average percent services lost)
This approach was used for stream and forestry resources by quantifying the injury as
service acre-years, where a service acre-year is the flow of benefits that one acre of forest or one
acre of stream habitat provides over the period of one year. For lost visitor use, losses were
calculated as the reduction in visitors to the spill zone and the diminished value of recreational
activities that occurred after the spill, expressed in dollars. Injury estimates in future years were
Damage Assessment and
Restoration Plan
4-8
discounted at three percent per year (NOAA, 1999), summed, and added to the injury in the year
of the spill yielding an estimate of total injury. All of these methods produce an estimate of direct
plus interim (from the time of injury until full recovery) loss of resources resulting from the oil.
Federal and state scientists, and local and regional experts, including those from
Tennessee Tech University, Michigan Technological University, and ORNL, conducted the
studies for each injury category. A full description of the injury assessment methods and results
is presented in resource-specific injury reports prepared by the principal investigators. In each
instance, the Trustees retained an outside expert to peer review key reports and, where
appropriate, the principal investigators revised the report to address peer review comments prior
to approval. Final injury reports and peer review comments were then placed into the
Administrative Record, where they are available for public review (see Section 2.1.4). Section
4.4 of this final Restoration Plan presents a summary of each injury assessment, including
methods and findings.
4.4 Injury Assessment Methods and Results
The following sections describe the results of the Trustees’ injury assessments for
resources as a result of the Obed oil spill. Descriptions of injuries are organized into the
following three categories: forest vegetation and soils, stream health, and lost visitor use.
4.4.1 Forest Vegetation and Soils
The results from the forest vegetation sampling that occurred during the Preassessment
Phase prompted a resampling of both the burned and reference site two years later. On 22-24
September 2004, within a 10 x 50 meter (m) plot, five subplots (10 x 10 m) were used to
measure the diameter at breast height for all woody stems greater than or equal to 1 centimeter
(cm), to identify the species (when possible), and to determine average age using tree cores.
Using an age versus diameter relationship, the rate of accumulation of forest stand biomass at the
Obed WSR burned and reference forest sites were estimated.
The current standing stock of biomass from the reference site was estimated to be 137
metric tons/hectare and the forest is accruing biomas at a rate of 0.92 metric tons/ hectare per
year. The maximum tree age in the both the burned and reference forest was 149 years (Webster
and Jenkins, 2006). Dry forest communities (pine, oak) have adapted to disturbances such as
low-moderate intensity burns, which thins the understory and shrub layers but spares the
overstory trees. However, the oil spill and burn that took place in 2002 was much more severe
than the typical disturbance regime seen in forest communities. Analysis of the site revealed that
overstory mortality at the burned sites was 100% (Webster and Jenkins, 2006). Few trees had
resprouted (<15 %) within the two years following the spill/fire, and those that had were closer
to the edge of the forest where the burn was not as severe. The soil litter, duff, and surface
horizons were burned away and the soil seed bank was destroyed. Mychorrizae and root systems
were killed so that trees could not resprout from their roots following the burn.
The soil sample analysis showed a decrease in alkane and PAH concentrations by 80%
from February 2003 to September 2004 (Webster and Jenkins, 2006). Because of this rapid
Damage Assessment and
Restoration Plan
4-9
breakdown of hydrocarbons, it is unlikely that the compounds will inhibit future forest
regeneration after the site experiences some initial re-vegetation by early successional species.
The recovery period for the burned forest was estimated using previous studies on the
recovery times of both post disturbance succession of vegetation in post-agriculture fields (6-14
years) and strip mine areas (30-46 years). Webster and Jenkins (2006) estimated that the severity
of the spill and fire on the Obed WSR forest community was likely to be more damaging than old
agricultural fields but less damaging as compared to strip mine areas. It was estimated that there
would be a 25-year time lag before woody species began to reestablish on the site and initiate
normal stand development. However, the establishment of the herbaceous species, Erechtites
hieracifolia (E. hieracifolia, fireweed), a native weed that dominates heavily disturbed sites, has
covered over 10% of the burned forest ground (Fig. 4) since the spill occurred (Webster and
Jenkins, 2006). As part of a primary restoration effort, the NPS will implement an invasive
vegetation control plan at the beginning and end of at least two growing periods that would
increase the rate of recovery of the natural forest vegetation. With the amount of E. hieracifolia
growing within the burned site and the NPS primary restoration effort, it was estimated that 5%
of biomass would accrue incrementally within the first 25 years following the spill.
Based on the rate of biomass accumulation and the age structure of the reference forest, it
is estimated that it will take 172 years for the forest to return to pre-spill biomass standing stock.
The recovery curve for the burned forest is shown in Figure 5. The curve was developed with a
logarithmic equation that used the slope and intercept of the observed relationship between the
rate of biomass accumulation and the age of the forest to determine the return of services. The
inputs to the recovery curve can be found in Appendix A, Table 1. Using the HEA model and the
injury curve, the injury for the 0.74 acres of burned forest was 24.3 DSAYs (Appendix A, Table
2).

Damage Assessment and
Restoration Plan
4-10
FIGURE 4. The oiled and burned slope just above Clear Creek. Note growth of E. hieracifolia,
a native weed that dominates sites after heavy disturbance. August 2004.
FIGURE 5. Recovery curve for the forest vegetation and soils. In the first 25 years, only 5% of
services returned in the form of early successsional species. Normal stand
development was estimated to occur 25 years after the spill and reach pre-spill
conditions 172 years after the spill.
Damage Assessment and
Restoration Plan
4-11
4.4.2 Stream Services
The injury to stream services was estimated using the data collected from several studies
gathered during the Preassessment Phase (see section 4.2 Overview of Preassessment Phase
Activities and Findings) and the Injury Assessment Phase for the following resources: benthic
algae, benthic macroinvertebrates, mussels, fish, ground water/geologic resources, riparian
wetlands and habitat, sediment quality, and surface water quality. The injury assessment for each
resource is discussed below.
The temporal and spatial component of the oil contamination was critical in determining
the injury to the stream services. The data collected during the Preassessment Phase indicated
that the spatial extent of the impacted stream area was from the spill site in both Clear Creek and
White Creek to the pool located just below Barnett Bridge. Based on the GIS data compiled by
the USFWS, the total length of injury for Clear Creek was 2,560 feet (ft), with 1,320 ft from the
release site to the first riffle and 1,240 ft from the riffle to 500 ft below Barnett Bridge (since the
site 2,000 ft below the bridge was not affected, based on the macroinvertebrate sampling). The
total length of injury for White Creek was 1,174 ft.
The temporal component of the spill was more difficult to determine. The Trustees have
documented observation of oil seeping from the bank at the spill site into Clear Creek through
June 2007 (Table 2) and are unsure of how many years into the future the seep will continue.
Based on the Preassessment and Damage Assessment data, the Trustees determined that the flow
rate of the river may dictate how much oil is released into Clear Creek. In lower water flow years
(i.e., 2002, 2005, 2006), oil was observed seeping from the well into Clear Creek and water
samples showed contamination (see section 4.2.1 Water Quality). In 2003 and 2004, years of
higher flows, the observation of oil seeping into the Creek was not as apparent and the data
showed little or no contamination. During the June 2007 site visit, “sheen was observed among
the rocks as we stepped into the river near Barnett Bridge” (NPS, 2007a). The flow at the USGS
gauge was 4.5 cubic feet per second, a historic low for this date.
TABLE 2. Observations of oil on Clear Creek between 2002 and 2007.
Date Team Observations
August 2002 J. Burr (TDEC-WPC)
and Tetra Tech
Oil, paraffin, and sheen observed; water sample taken at point of
entry had extremely high PAH concentrations (24,100 ppm)
indicating that the sample included some floating oil; oil appeared
to be fresh with a PAH pattern that matched the oil from the well,
indicating that fresh oil continued to seep out of the creek bank in
late August.
October 2002 J. Burr (TDEC-WPC) Sheen observed upstream of Barnett Bridge during benthics
collection.
May 2003 Williams, Bivens, Carter
(TWRA); Bakaletz,
Hudson, Williams
(NPS)
Oily sheen rising from rocks in Clear Creek at Barnett Bridge as
they were overturned during crayfish sampling.
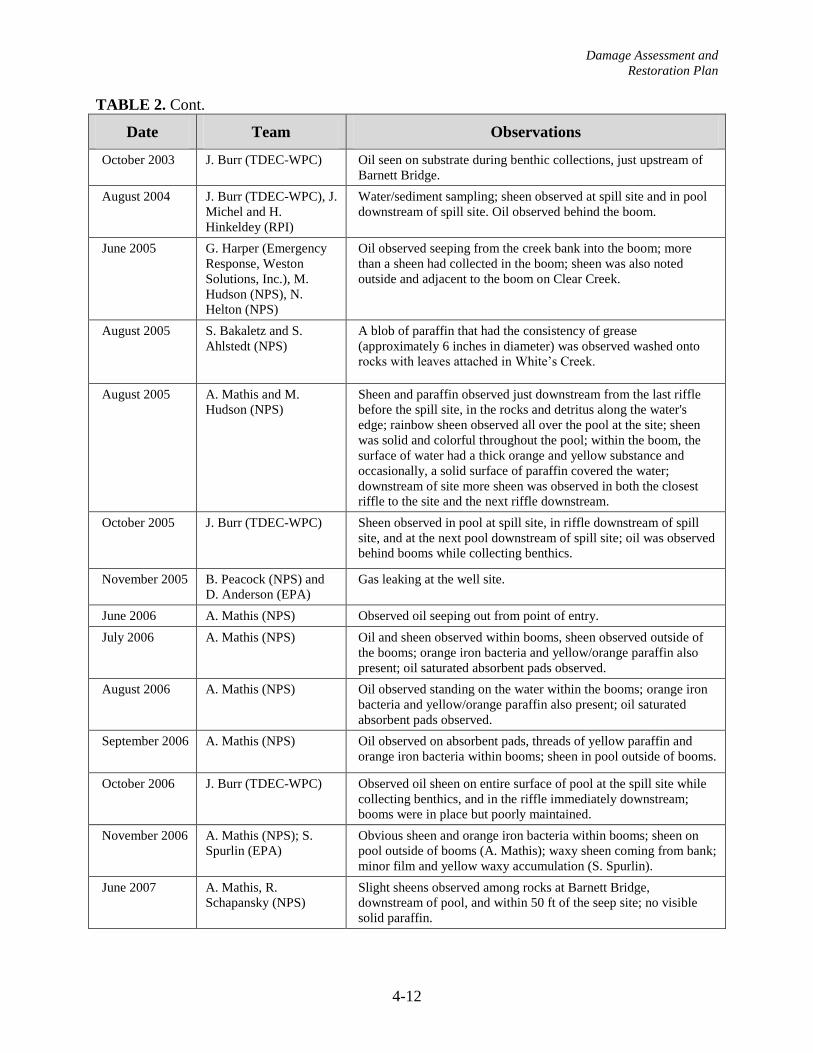
Damage Assessment and
Restoration Plan
4-12
TABLE 2. Cont.
Date Team Observations
October 2003 J. Burr (TDEC-WPC) Oil seen on substrate during benthic collections, just upstream of
Barnett Bridge.
August 2004 J. Burr (TDEC-WPC), J.
Michel and H.
Hinkeldey (RPI)
Water/sediment sampling; sheen observed at spill site and in pool
downstream of spill site. Oil observed behind the boom.
June 2005 G. Harper (Emergency
Response, Weston
Solutions, Inc.), M.
Hudson (NPS), N.
Helton (NPS)
Oil observed seeping from the creek bank into the boom; more
than a sheen had collected in the boom; sheen was also noted
outside and adjacent to the boom on Clear Creek.
August 2005 S. Bakaletz and S.
Ahlstedt (NPS)
A blob of paraffin that had the consistency of grease
(approximately 6 inches in diameter) was observed washed onto
rocks with leaves attached in White’s Creek.
August 2005 A. Mathis and M.
Hudson (NPS)
Sheen and paraffin observed just downstream from the last riffle
before the spill site, in the rocks and detritus along the water's
edge; rainbow sheen observed all over the pool at the site; sheen
was solid and colorful throughout the pool; within the boom, the
surface of water had a thick orange and yellow substance and
occasionally, a solid surface of paraffin covered the water;
downstream of site more sheen was observed in both the closest
riffle to the site and the next riffle downstream.
October 2005 J. Burr (TDEC-WPC) Sheen observed in pool at spill site, in riffle downstream of spill
site, and at the next pool downstream of spill site; oil was observed
behind booms while collecting benthics.
November 2005 B. Peacock (NPS) and
D. Anderson (EPA)
Gas leaking at the well site.
June 2006 A. Mathis (NPS) Observed oil seeping out from point of entry.
July 2006 A. Mathis (NPS) Oil and sheen observed within booms, sheen observed outside of
the booms; orange iron bacteria and yellow/orange paraffin also
present; oil saturated absorbent pads observed.
August 2006 A. Mathis (NPS) Oil observed standing on the water within the booms; orange iron
bacteria and yellow/orange paraffin also present; oil saturated
absorbent pads observed.
September 2006 A. Mathis (NPS) Oil observed on absorbent pads, threads of yellow paraffin and
orange iron bacteria within booms; sheen in pool outside of booms.
October 2006 J. Burr (TDEC-WPC) Observed oil sheen on entire surface of pool at the spill site while
collecting benthics, and in the riffle immediately downstream;
booms were in place but poorly maintained.
November 2006 A. Mathis (NPS); S.
Spurlin (EPA)
Obvious sheen and orange iron bacteria within booms; sheen on
pool outside of booms (A. Mathis); waxy sheen coming from bank;
minor film and yellow waxy accumulation (S. Spurlin).
June 2007 A. Mathis, R.
Schapansky (NPS)
Slight sheens observed among rocks at Barnett Bridge,
downstream of pool, and within 50 ft of the seep site; no visible
solid paraffin.

Damage Assessment and
Restoration Plan
4-13
4.4.2.1 Benthic Algae
The decrease in the number of species at the stations sampled downstream of the spill site
(see section 4.2.3 Benthic Algae) indicated a decrease in primary productivity in response to the
oil contamination by December 2002 (5 months after the spill occurred). Algae are a food source
for grazing fishes and invertebrates, and changes in the algal community may affect some higher
trophic level species.
4.4.2.2 Benthic Macroinvertebrates
Table 3 shows a summary of the Tennessee Macroinvetebrate Index (TMI) scores for
samples collected from Clear Creek over time since the spill. The TMI score is based on taxa
richness, percent Ephemeroptera, Plecoptera, and Trichoptera (EPT), EPT richness, North
Carolina Biotic Index (NCBI), percent Oligochaetes and Chironomids (OC), percent of dominant
taxa, and percent of clinger taxa. Scores are recorded based on values developed for each
category (i.e., taxa richness, EPT richness) under Bioregion 68a, where Clear Creek is located
(Arnwine, 2002). A score of 10 or less is considered to be non-supporting or severely degraded;
a score between 10 and 31 is considered to be partially supporting or slightly to moderately
degraded; and a score greater than 32 indicates a fully supporting or non-degraded community.
Table 3 also shows the flow conditions in the watershed for the period of July through September
each year, since water levels for this period have a direct influence on the benthic
macroinvertebrate community sampled in early October.
TABLE 3. TMI scores for benthic macroinvertebrate samples collected from Clear Creek since
the spill in July 2002. A score >32 indicates a fully supporting community.
Sample Date Helger Ford
(upstream of spill)
Riffle Below
Seep
Barnett Bridge
(downstream of
spill)
River Flow
Conditions
(July-Sept)
October 2002 38 - 20 Low
October 2003 40 - 40 High
2004 - - - High
October 2005 34 18 24 Low-Moderate
October 2006 34 26 36 Low-Moderate
Table 3 shows that benthic macroinvertebrates were injured in October 2002 at Barnett
Bridge but had returned to pre-spill levels in October 2003. Samples taken upstream and further
downstream (Jett Access) were determined to have a healthy benthic community.
Benthic samples were collected outside of the NRDA in 2004 at Hegler Ford, Barnett
Bridge, White Creek, and Jett Bridge as part of separate study (Goodfred and Cooke,
unpublished data, cited in Cooke, 2006). The TMI scores from these samples showed that none
of these sites were impaired. This was likely due to 2004 being a high-flow year. As part of the

Damage Assessment and
Restoration Plan
4-14
NRDA studies, samples were collected in October 2005 and 2006 at the standard upstream
location (Hegler Ford) and two downstream locations (at the first riffle below the seep and at the
standard location at Barnett Bridge). The data through 2005 were analyzed by Cooke (2006) who
concluded that the reference and Barnett Bridge impact sites had similar habitats, as well as good
scores for sediment deposition and embeddedness, and thus could be used to detect impacts from
the spill. The apparent recovery with the high-flow conditions of 2003 and 2004 was reversed
during the lower flows in 2005 (Table 3). EPT richness, percent EPT, and percent clinger scores
were also lower in the 2005 downstream samples than in the 2003 samples. EPT and clinger taxa
are both sensitive to environmental disturbance. The downstream 2005 samples had higher
percent OC values, which seems appropriate because Oligochaetes and Chironomidae larvae are
considered to be more tolerant to stream disturbances than Ephemeroptera, Plecoptera, or
Trichoptera. Cooke (2006) concluded that, during normal and high flow events, benthic
communities at the Barnett Bridge sites appear non-impacted, but may be influenced by
increased contact with oil during low flows.
In 2006, when flows were very low in July and moderate in August and September, the
riffle below the seep site showed injury (Table 3). According to analysis of the data by Burr
(2006), the total taxa numbers dropped from 32 at Hegler Ford (the control site) to 21 at the spill
site (a loss of 1/3 of the taxa). The % OC (% of the sample made up of oligochaete worms and
chironomids) rose sharply at the site immediately downstream of the spill zone. This is a
negative metric, so a higher value means more impact. The sample at the site below the seep was
dominated by worms of the Genus Nais, which have been noted to have an affinity for
petroleum. There was one Nais in the Hegler Ford site sample, and five in the Barnett Bridge
sample, but Nais was the dominant organism at the site immediately downstream of the seep (49
individuals out of 199 total organisms subsampled, or 25% of the community). The NCBI was
significantly higher at the site below the seep (5.51) than at Hegler Ford (4.29) or Barnett Bridge
(4.11). It is another negative metric; the higher the value, the more tolerant to pollution the biotic
community. The % Clingers, which refers to the % of taxa that build fixed retreats or have
adaptations to attach to surfaces in flowing water (as opposed to burrowers or sprawlers),
declined by about 60% at the spill zone site compared to the control site at Hegler Ford. Clingers
depend on stable, sediment-free or contaminant-free substrates.
Mussel tissue sampled in 2002 had no detectable PAH and a qualitative mussel survey in
August 2005 did not provide any evidence that mussels were affected by the oil spill. Crayfish
collected in May 2003 were also analyzed for PAH and no oil contamination was observed. The
results of a mussel population and reproduction survey in 2005 were inconclusive since there
was limited reproduction and recruitment in both the reference and impact study sites (Ahlstedt
and Bakaletz, 2005). The Trustees conducted a second mussel tissue sampling study in June
2006. Lampsilis fasciola, wavyrayed lampmussels, and Villosa iris, rainbow mussels, were
collected from Clear Creek above the spill site (reference site) and from Clear Creek at the
junction with White Creek (impacted site) to determine if organ tissues showed lingering effects
from the oil. The results of the study were inconclusive (Henley, 2007). There were no
biologically meaningful differences between the tissues of mussels from the impacted site
compared to the mussels from the reference site. However, because of a small sample size due to
trematode infestation on mussels at the reference site, it was difficult to draw firm conclusions on
the effects of lingering oil.

Damage Assessment and
Restoration Plan
4-15
In summary, the benthic macroinvertebrates were impacted initially after the release of
oil into the stream. In the years following the spill, benthic macroinvertebrates between the spill
site to just below Barnett Bridge appear non-impacted during high-flow years, but may become
impacted when the oil seepage rate increases during low-flow periods during the summer months
(Cooke, 2006).
4.4.2.3 Ground Water/Geologic Sources
The oil well was observed by TDEC staff in November 2006, and it did not appear to be
leaking. The well was observed to be leaking in the summer (2006) at about a half-pint per day.
There is some hypothesizing that the leak may be temperature influenced (D. Mann, TDEC, per.
comm., 2006).
4.4.2.4 Riparian Wetlands and Habitat
No further studies were conducted on riparian wetlands or habitat after the surveys were
completed in the Preassessment Phase. The Trustees assume that injury to the riparian vegetation
and habitat along Clear Creek was evident only within the first year following the spill and then
returned to baseline services in the following year.
4.4.2.5 Sediment Quality
Evidence of oil contamination was found in sediment samples collected within Clear
Creek downstream of the spill site in 2002 and 2004. This indicates an ongoing release of oil into
the river system and accumulation in sediments. The Trustees assume injury to stream services
and biota from sediment contamination will continue as long as oil continues to seep from the
creek bank into Clear Creek.
4.4.2.6 Surface Water Quality
Water samples taken in 2002 and 2003 in Clear Creek showed evidence of oil
contamination. Because oil continues to seep into Clear Creek, the Trustees assume that surface
water quality will continue to be affected.
4.4.2.7 Fish Resources
Two sentinel fish species, redbreast sunfish and rock bass, were studied over a three-year
period (2002-2004) to assess and evaluate the possible effects of the oil spill on the health and
integrity of fish populations in Clear Creek (Adams et al., 2007). An integrative bioindicator
approach, measuring a suite of selected biological responses at several levels of biological
organization from the biochemical and physiological levels to the individual and population
levels, was used to assess the potential effects of the oil spill on the health and integrity of these
two sentinel fish populations in Clear Creek. The results indicated that both species from the
Barnett Bridge site were exposed to oil and had sublethal stress (based on organ dysfunction and
reduced condition indices) as a result of that exposure in 2002, compared to upstream control
sites. Impacts on reproduction were observed in 2002 near the end of the breeding season for
Damage Assessment and
Restoration Plan
4-16
these species but not during the 2003 or 2004 breeding season. Levels of most sublethal stress
responses that were observed in 2002 declined or were reduced dramatically in 2003 and 2004.
Based on these studies, the Trustees concluded that there were no impacts to fish populations as
a result of the spill; however, there was evidence of sublethal effects from the spill site to Barnett
Bridge in 2002.
4.4.2.8 Summary of Injury to Stream Services
Using the Preassessment and Injury Assessment study results, the Trustees determined
the percent of baseline services at key points in time to create the injury curve for stream services
for both Clear and White Creeks. Table 4 shows the data that were used to determine the loss.
The Trustees divided Clear Creek into two reaches based on the level of impact from the
contamination: the Seep Site (area from the seep to the first riffle just downstream of the seep)
and the Downstream Site (area from the first riffle downstream to 500 ft below Barnett Bridge).
The former would have higher oil exposures based on the proximity to the oil release site than
the latter. As shown in Table 3, the Seep Site had a lower TMI score (18 and 26 in October 2004
and 2005, respectively) than the Downstream Site (24 and 36 in October 2004 and 2005,
respectively). The injury to White Creek was calculated separately using a third recovery curve,
since the amount of chronic seepage into White Creek is unknown but likely to be below levels
to cause significant impacts to stream services.
In developing the injury curves for the period 2002 to 2003, the Trustees used the actual
field data and observations of oil seepage patterns to estimate the percent reduction in stream
services, as discussed in the following sentences and described in Table 4. All three stream
reaches, the Clear Creek Seep Reach, the Clear Creek Downstream Reach, and White Creek,
were estimated to have 0% services in July-August 2002. This was the month following the spill
and a large amount of oil had entered the stream system from both release sites. Elevated TPH-
DRO levels were found in water and sediment samples, and PAH contamination was apparent.
Fish collected in August 2002 had lower visceral-somatic index, liver-somatic index, reduced
feeding index, and weakened immune systems. Mussels were observed abnormally ejecting from
the sediments. By October 2002, the percent of services provided by the Clear Creek Seep Reach
were estimated to be at 25% of baseline, and White Creek and the Clear Creek Downstream
Reach at 35% of baseline. The majority of the heavy oil had been removed but a constant sheen
remained. The TMI was much lower in waters downstream of the spill (score = 20) compared to
upstream sites (score = 38). EPT richness and % clingers (sensitive to disturbance) were both
low. By December 2002, the percent services present increased by 5%-10%. The number of
benthic algae species had decreased in December collections. By 2003, higher water flows
occurred and the TMI showed no injury. However, the water samples still showed evidence of
PAH contamination and oil sheens continued to be seen during benthic collections. An estimated
90% of the benthic macroinvertebrate species have one-year life cycles (Burr, 2007). Drift from
upstream habitats would bring in nymphs and eggs, however it would take two years to fully
recover to baseline conditions in the absence of oil. Thus, the services present were estimated at
75% of baseline for White Creek and the Clear Creek Downstream Reach (low amount of
continuing oil exposure) and at 50% of baseline for the Clear Creek Seep Reach where there was
chronic oil exposure.

Damage Assessment and
Restoration Plan
4-17
In 2004, continued high water flows appeared to flush out the system, although some
sheen was still observed during water and sediment sampling. No benthic invertebrate samples
were collected, because it was assumed that the oil seepage would slow and benthic communities
would continue to recover. Several important taxa have life cycles greater than one year,
including odonates (dragonfly larvae) with a 2-4 year life cycle, perilidae stoneflies with a 2 year
life cycle, megalopterans (hellgrammites) such as Corydalus and Nigronia have a 2-3 year life
cycle, and gilled snails, mostly the females, live 4-5 years (Burr, 2007). Considering the time for
these communities to recover, the Clear Creek Seep Reach was estimated to have services
present at 75% compared to baseline (because of continued chronic oil exposures), and White
Creek Reach and the Clear Creek Downstream Reach at 85% compared to baseline (low amounts
of chronic oil exposure).
TABLE 4. Services present in both Clear and White Creeks as compared to baseline based on
the Preassessment Phase and Injury Assessment Phase study results.
Period
Clear Creek
Seep Reach
% Services
Present
Clear Creek
Downstream
Reach
% Services
Present
White Creek
Reach
% Services
Present
Evidence of Service Loss
July-
August
2002
0 0 0
Vegetation stressed and some mortality occurred; mussels
ejecting from sediments (abnormal behavior); TPH-DRO in
water samples was 4 times the background at Barnett Bridge;
elevated TPH-DRO in sediment samples; PAH contamination
above background levels in sediment samples downstream of
spill; oil continued to seep out of creek bank into Clear Creek
in late August.
October
2002 25 35 35
TMI showed moderate injury at Barnett Bridge with a score
of 20 versus 38 at Hegler Ford (upstream site); EPT richness
and % clingers lowest of all sites: clingers are very sensitive
to environmental disturbance; low levels of BTEX in water
samples; higher concentrations of metals (Al, Fe, Mn) in
water samples; benthic algae showed no difference between
upstream and downstream sites.
Dec 2002 30 45 45
For benthic algae; number of species decreased in areas
downstream of spill. Upstream area had highest number of
species.
2003 50 75 75
Higher water flow; TMI showed Clear Creek was not
impaired at any sites, with score of 40 at Barnett Bridge and
Hegler Ford; PAH contamination still observed in water
samples; crayfish samples indicated no contamination; oil
sheen rising from rocks at Barnett Bridge during crayfish
sampling; oil seen on substrate during benthic collections, just
upstream of Barnett Bridge.
2004 75 85 85 Higher water flows; sheen observed during water/sediment
sampling.

Damage Assessment and
Restoration Plan
4-18
TABLE 4. Cont.
Period
Clear Creek
Seep Reach
% Services
Present
Clear Creek
Downstream
Reach
% Services
Present
White Creek
Reach
% Services
Present
Evidence of Service Loss
2005 50 70 95
Low to moderate water flows: TMI indicated slight to
moderate injury with score of 24 at Barnett Bridge and 18 at
site immediately downstream of seep versus 34 at Hegler
Ford; lack of younger age classes in mussels in Clear Creek;
patch of paraffin observed on rocks during mussel survey.
2006 75 90 100
Low to moderate flows; observed product seeping out from
point of entry, Barnett Bridge was not injured with a TMI
score of 36; Seep Site was injured with score of 26 versus
Hegler Ford score of 34.
2007-
2022
75
(high flow)
50
(low flow)
90
(high flow)
75
(low flow)
Assume low flows occur 66% of time and Barnett Bridge site
scores will not be injured during normal/high flows but some
service losses due to oil seep; Barnett Bridge will be slightly
injured during low flows with TMI score 25% below Hegler
Ford reference site; assume Seep Site will be injured both
during moderate/high flows with scores 25% below reference
and during low flow with scores 50% below reference;
assume seep will continue for 20 years, until 2022.
In 2005, stream flows were low to moderate. In Clear Creek, oil was observed seeping
from the creek bank collecting within the boom and sheens were observed outside the boom
during one of the site visits. The TMI at the upstream site scored at 34, whereas the Clear Creek
Seep Site had a score of 18, and the Barnett Bridge site had a score of 24, indicating slight to
moderate injury at both sites. At this time and forward, the Trustees decided to use the ratio of
the TMI at each impacted site compared to the upstream site as the estimator for the percent of
stream services lost in Clear Creek. Thus, the percent services for the Clear Creek Seep Reach in
2005 were estimated to have been about 50% (18/34 = 0.53 at the Seep Site) and about 70%
(24/34 = 0.71 at the Downstream Site) as a result of lower flows and more oil releases from the
seep.
Because of the low amount of chronic oil releases into White Creek, it is assumed that the
benthic macroinvertebrates continued to recover from the oil spill, reaching 95% of baseline in
2005 (3 years after the spill, to account for the recovery of species with 2-3 year life cycles) and
full recovery in 2006 (to account for recovery of species with a 4 year life cycle).
In 2006, flow conditions were low to moderate, and oil was observed seeping from the
site of the oil spill. The TMI score at the Clear Creek Seep Site increased to 26 (slight injury)
compared to 18 in 2005, the downstream Barnett Bridge site increased to a score of 36 compared
to 24 in 2005, and the upstream site continued to score at 34. To account for life-history
considerations, the percent services were estimated to increase in 2006 to 75% of baseline for the
Clear Creek Seep Reach and 90% of baseline at the Clear Creek Downstream Reach.

Damage Assessment and
Restoration Plan
4-19
The stream services present in Clear Creek from 2007 and into the future were harder to
predict based on the changes of oil seepage and water flow rates in Clear Creek. There appears to
be a correlation between flow conditions, oil seepage rates, and impacts to benthic
macroinvertebrates, with higher seepage rates and impacts occurring during low-flow periods.
The nearest USGS water gauge to the spill site is on the Obed River near Lancing, TN (location
at 36°04’53.11” and 84°40’13.33”), about 12 miles downstream of the spill site. The monthly
discharge statistics were obtained from the USGS web site:
(http://waterdata.usgs.gov/nwis/monthly/?referred_module=sw/). Data were available for the
Lancing station for 35 years over the period 1957-2006 (shown in Appendix B). The 35-year
mean flows are 387 cubic feet per second for July, 151 cubic feet per second for August, and 275
cubic feet per second for September. During the 1957-2006 period, there were 23 years (equal to
about 66% of the time) when the average discharge in September was below 98 cubic feet per
second. This value is the 70% duration flow exceedance. September data were used, as opposed
to other months, because benthic sampling usually occurred in early October, and it was
appropriate to use flow data that was collected near the time of the sampling. Using these data, it
was assumed that stream services would be impacted by the oil seepage from the spill site
approximately 66% of the time for a period of 20 years since the spill, i.e., unto 2022. The
duration of seepage was estimated based on the fact that there has been no observable change in
the rate of seepage over the five years since the spill. It is assumed that the seep will continue for
many years, even if the source is identified and controlled, because of the oil remaining in the
solutional features of the geological formation and vadose zone between the well and the
streambank.
The Trustees estimated that, from 2007 through 2022, the Clear Creek Seep Reach would
have services of 50% compared to baseline during low flows (based on the ratio of the TMI
score for this site versus the upstream reference of 0.53 in the low-flow year of 2005) and 75%
during high flows (based on the ratio of the TMI score for this site versus the upstream reference
of 0.76 in the medium- to high-flow year of 2006). The Clear Creek Downstream Reach would
have services of 75% compared to baseline during low flows, based on the ratio of the TMI score
for this site versus the upstream reference of 0.71 in the low-flow year of 2005, and 90% services
during high flows, based on the ratio of the TMI score for this site versus the upstream reference
of >1.0 and accounting for a lag in full recovery because 10% of the species have 2-4 year life
histories (Burr, 2007). In order to assign each year (beginning in 2007) a low or high flow event
and the appropriate service level, a random number generator was used to assign low-flow years
occurring 66% of the time. Figures 6 to 8 show the injury curves for stream services for the Clear
Creek Seep Reach, the Clear Creek Downstream Reach, and the White Creek Reach,
respectively. Appendix C, Tables C1-C3 shows the injury inputs and calculations.
Using the HEA application and discounting for the present loss of future services, the
injury to stream services for the Clear Creek Seep Reach (2.41 acres: 1,320 ft long and 79.4 ft
wide) was 16.01 discounted service acre-years (DSAYs). The injury to stream services for the
Clear Creek Downstream Reach (2.26 acres: 1,240 ft long and 79.4 ft wide) was 8.76 DSAYs.
The injury to stream services for White Creek (1.62 acres: 1,174 ft long and 60 ft wide) was 1.37
DSAYs. The total injury to the stream services as a result of the oil spill was 26.1 DSAYs.
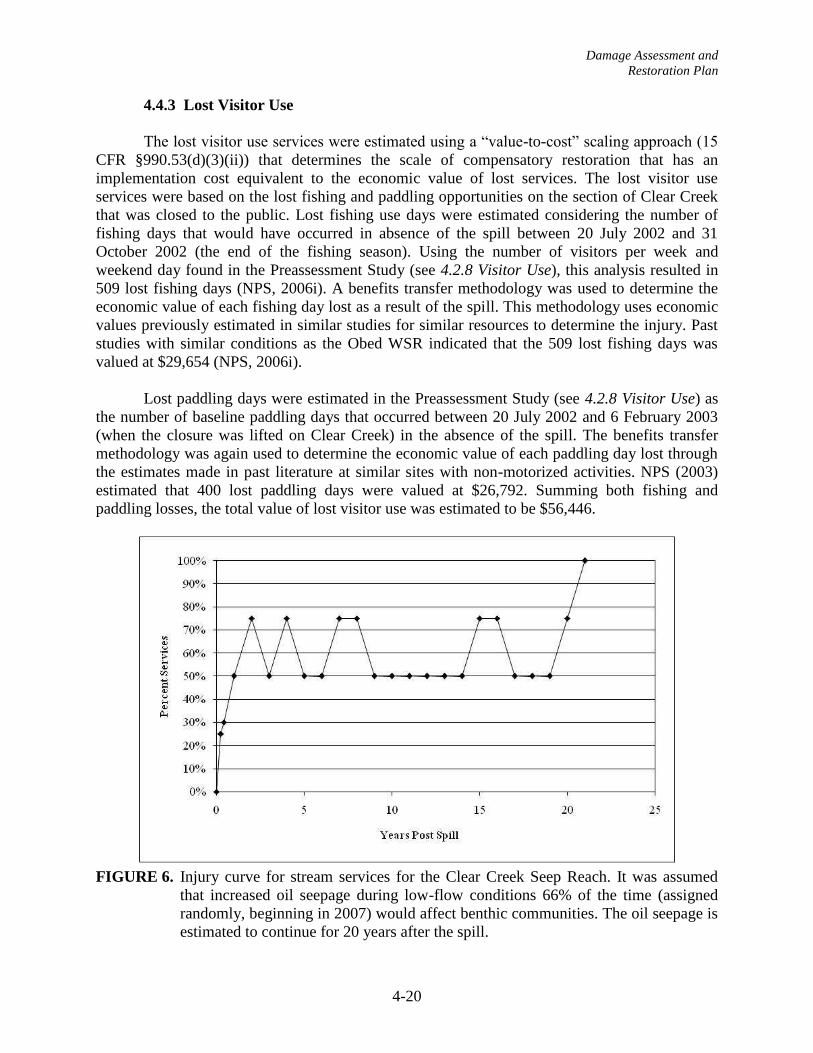
Damage Assessment and
Restoration Plan
4-20
4.4.3 Lost Visitor Use
The lost visitor use services were estimated using a “value-to-cost” scaling approach (15
CFR §990.53(d)(3)(ii)) that determines the scale of compensatory restoration that has an
implementation cost equivalent to the economic value of lost services. The lost visitor use
services were based on the lost fishing and paddling opportunities on the section of Clear Creek
that was closed to the public. Lost fishing use days were estimated considering the number of
fishing days that would have occurred in absence of the spill between 20 July 2002 and 31
October 2002 (the end of the fishing season). Using the number of visitors per week and
weekend day found in the Preassessment Study (see 4.2.8 Visitor Use), this analysis resulted in
509 lost fishing days (NPS, 2006i). A benefits transfer methodology was used to determine the
economic value of each fishing day lost as a result of the spill. This methodology uses economic
values previously estimated in similar studies for similar resources to determine the injury. Past
studies with similar conditions as the Obed WSR indicated that the 509 lost fishing days was
valued at $29,654 (NPS, 2006i).
Lost paddling days were estimated in the Preassessment Study (see 4.2.8 Visitor Use) as
the number of baseline paddling days that occurred between 20 July 2002 and 6 February 2003
(when the closure was lifted on Clear Creek) in the absence of the spill. The benefits transfer
methodology was again used to determine the economic value of each paddling day lost through
the estimates made in past literature at similar sites with non-motorized activities. NPS (2003)
estimated that 400 lost paddling days were valued at $26,792. Summing both fishing and
paddling losses, the total value of lost visitor use was estimated to be $56,446.
FIGURE 6. Injury curve for stream services for the Clear Creek Seep Reach. It was assumed
that increased oil seepage during low-flow conditions 66% of the time (assigned
randomly, beginning in 2007) would affect benthic communities. The oil seepage is
estimated to continue for 20 years after the spill.

Damage Assessment and
Restoration Plan
4-21
FIGURE 7. Injury curve for stream services for the Clear Creek Downstream Reach. Chronic
oil seepage would also affect this stream reach, but at lower levels.
FIGURE 8. Injury curve for stream services for the White Creek Reach. Oil exposure ended in
2002, thus the recovery curve reflects the 2-4 year life histories of an estimated
10% of the benthic macroinvertebrates in the benthic community present.
Damage Assessment and
Restoration Plan
5-1
5.0 RESTORATION ALTERNATIVES
The goal of restoration under OPA is to restore natural resources injured by incidents to
the condition that they would have been if the incident had not occurred. OPA requires that this
goal be achieved by restoring natural resources and compensating for interim losses of those
resources and their services that occur during the period of recovery. The following sections
describe the methods used by the Trustees to identify and evaluate appropriate restoration
projects using the guidelines provided by OPA, as well as NEPA.
The restoration alternatives identified by the Trustees for each injured resource are as
follows: 1) Natural recovery alternative (synonymous with the NEPA no action alternative) and
2) Preferred alternative. The preferred alternative consists of five restoration actions including, a)
Natural recovery as a primary restoration for forest and stream services; b) Primary restoration to
restore forest vegetation and soil services in the form of invasive vegetation control in the
footprint of the burn area; c) compensatory restoration through an acquisition of land or a
conservation easement in the Obed WSR corridor to restore forest vegetation and soil services as
well as lost visitor use; d) Improvement of water quality to the Little Obed River, a headwater
stream of the Obed River, to restore stream services (i.e., Centennial Park watershed project);
and e) Acid mine drainage reclamation project at Golliher Creek to restore stream services if the
Little Obed River project cannot be implemented.
5.1 Restoration Strategy
There are two kinds of restoration options available under the OPA guidelines, primary
and compensatory restoration. Primary restoration is an action that expedites the return of injured
resources to their baseline condition by directly restoring the injured resources. Compensatory
restoration addresses interim losses of natural resource services from the time of initial injury
until full recovery of natural resources to their baseline condition. The scale of the compensatory
restoration projects depends on the nature, extent, severity, and duration of the resource injury.
Primary restoration can reduce the amount of compensatory restoration that may be needed.
The Trustees considered several alternatives for each injury (forest, stream, and lost
visitor use) before identifying the most appropriate restoration option. All projects were
reviewed using the evaluation criteria found in Section 5.2 (see below) to determine the most
appropriate restoration project for the lost services. The preferred projects were then scaled
appropriately to compensate for the injury. The following sections describe the restoration
options for each resource in more detail.
5.2 Evaluation Criteria
The OPA regulations (15 C.F.R. §990.54) require the Trustees to identify restoration
alternatives based on specific criteria. The following criteria, presented in the order listed in the
regulations, were considered:
Cost to carry out the alternative;

Damage Assessment and
Restoration Plan
5-2
Extent to which each alternative is expected to meet the Trustees' goals and objectives
in returning the injured natural resources and services to baseline and/or compensating
for interim losses;
Likelihood of success of each alternative;
Extent to which each alternative will prevent future injury as a result of the incident
and avoid collateral injury as a result of implementing the alternative;
Extent to which each alternative benefits more than one natural resource and/or
service; and
Effect of each alternative on public health and safety.
5.3 Environmental Consequences
The Trustees examined a variety of proposed projects to restore resources and/or services
lost as a result of the spill. Cumulative, indirect, and direct impacts as well as project-specific
environmental consequences to be considered in both OPA and NEPA regulations for each
restoration alternative are provided for each resource under 6.0 Environmental Consequences.
5.4 Natural Recovery Alternative
OPA requires the Trustees to consider a natural recovery alternative. The natural
recovery alternative is synonymous with the NEPA no action alternative. Under this alternative,
the Trustees would take no direct action to restore injured natural resources or compensate for
lost services pending environmental recovery. Instead, the Trustees would rely on natural
processes for recovery of the injured natural resources. To document the natural recovery of
injured resources, site visits are warranted. Currently, NPS visits the spill site once every two
weeks in the summer months to inspect and monitor the site. NPS documents observations from
every site visit. This will continue through the summer of 2008. The RP was periodically visiting
the site to cleanup any additional oil that seeped into Clear Creek. It is unclear if the RP is
continuing to visit the site.
While natural recovery is the primary restoration option for the injured forest and stream
services, the interim losses suffered would not be compensated under the natural recovery
alternative. Therefore, the Trustees have not identified this alternative as the preferred alternative
for the interim losses for forest and stream services and the lost visitor use.
5.5 Preferred Alternative
The Trustees have identified five restoration actions under the preferred alternative to
restore forest vegetation and soil, stream, and lost use services injured or lost as a result of the oil
spill. The first action is natural recovery, a primary restoration action to be used for forest and
stream services in the location of the injury. The following sections describe the remaining four
restoration actions in greater detail.
Damage Assessment and
Restoration Plan
5-3
5.5.1 Invasive Vegetation Control
5.5.1.1 Project Descriptions and Restoration Objectives
The Trustees identified primary restoration in the form of invasive vegetation control in
the footprint of the burn area to restore forest vegetation and soils services. The restoration action
would be a semi-annual removal of invasive plant species from the footprint of the burn area for
at least 25 years. The possible treatment methods that may be used by NPS personnel include
foliar application (herbicides sprayed on foliage), cut-stump application (herbicide sprayed on
the cut stump), or manual removal. Manual removal is the preferred method, however treatment
is dependent on both species and location. If there are trust resources nearby, NPS employs
either manual methods only, or cut-stump application of herbicides. Herbicides that include
surfactants or oil bases are not used near bodies of water. The restoration objective is to speed the
rate of natural recovery by removal of invasive vegetation that, in turn, would aid the forest in re-
vegetating the burned slope more quickly with native plants and trees.
5.5.1.2 Probability of Success, Performance Measures, and Monitoring
NPS will monitor the burned forest for the expected 25-year duration of the invasive
vegetation removal restoration activities to determine how the natural vegetation is recovering.
Thus, they will determine if the invasive vegetation control plan needs to be revised and/or if the
plan needs to continue past the time allotted.
5.5.1.3 Approximate Project Costs
To control invasive vegetation, NPS estimated that the area would need to be treated once
in the spring and once at the end of the summer, and that each treatment would take
approximately one 8-hour day. The cost of a GS 5/1 to work 16 hours per growing season is
currently $233.90 including benefits. With a 5% annual increase and 25 years, the total cost is
$11,722.
5.5.1.4 Environmental and Socio-Economic Impacts
There are no adverse socio-economic impacts associated with the removal of invasive
species. There may be some environmental impacts with the disturbance of soils when removing
the vegetation or from the use of herbicides. The manual removal method is preferred, however
when manual removal of a species is not possible due to extensive root systems or if removal
would cause significant soil loss, herbicides may be used. The Trustees determined that any
impacts would be minor as the application of the herbicide to individual plants would be fairly
localized. Glyphosate, the main herbicide used in the Park, has an average half-life in soils of 47
days and less than eight days in water, however the amount applied is directly related to the
duration of the half-life (WA DOT, 2007). NPS’ invasives biotechnician estimated that the
amount likely used in the Park would break down in soils within 72 hours (N. Helton, NPS, pers.
comm., 2007). Glyphosate is not mobile and has a very low potential to contaminate
groundwater. Glyphosate is of relatively low toxicity to fish. In addition, glyphosate has an
extremely high ability to bind to soil particles. Accordingly it is not easily leached into either

Damage Assessment and
Restoration Plan
5-4
groundwater or surface water (D. Gregg, OCWA, pers. comm. 2007a). Garlon 3A, another
herbicide that may be used, has a half-life of 46 days and is also not mobile (VA Dept of
Forestry, 1997). The impacts of ground disturbance or herbicides in specific cases are expected
to be outweighed by the benefit of the quicker return of native species to the impacted forest site.
5.5.1.5 Evaluation
This project meets the evaluation criteria discussed in Section 5.2. It is cost effective, has
a high likelihood of success, and has minimal potential for adverse environmental effects. As
primary restoration, it will directly restore the injured resources.
5.5.1.6 Alternatives Considered But Dismissed
The Trustees considered several other restoration projects to compensate for the forest
injury. Projects that were considered, but then dimissed, included:
Hemlock Woolly Adelgid Removal: Adelges tsugae (hemlock wooly adelgid), an aphid
that feeds on and eventually kills eastern and Carolina hemlocks, has been identified in
Frozen Head State Park (10 to 12 miles from the Obed WSR). Two predatory beetles,
Sasajiscymnus tsugae and Laricobius nigrinus, feed on aphids and have been identified
as an appropriate management tool to control the outbreak of this invasive insect. The
NPS states that the aphids will soon be present in the Obed WSR if they are not already
present. Many hemlocks are part of the canopy along the streams and are considered
extremely beneficial to wildlife and water quality. One project considered was to design
a plan using the beetles to protect the hemlocks within the Obed WSR. This proposal was
not chosen because NPS expects to eventually receive funding internally to mitigate the
possible future aphid infestation.
Slope Fertilization: The Trustees considered the addition of fertilizer to the contaminated
and burned slope to aid in the recovery of the soils and vegetation. This project was not
considered further because the Trustees did not want excess nutrients to enter Clear
Creek. Clear Creek has an adequate amount of nutrients in the system, and fertilizer
runoff from the slope to the stream may cause additional problems.
5.5.2 Land Acquisition
5.5.2.1 Project Descriptions and Restoration Objectives
The Trustees identified compensatory restoration through an acquisition of land or a
conservation easement in the Obed WSR corridor to restore forest vegetation and soils services
and lost use services. The compensatory restoration action to restore forest vegetation and soil
services would be the acquisition of a conservation easement or outright purchase from a willing
landowner of a property that borders the Obed WSR. NPS is considering two parcels of land,
Tract 101-10 (conservation easement) and Tract 102-14 (land purchase). Figure 9 shows the land
ownership along the Obed WSR corridor, with green indicating land under NPS or TWRA
management. The two tracts of interest are shown in red. These two tracts clearly represent
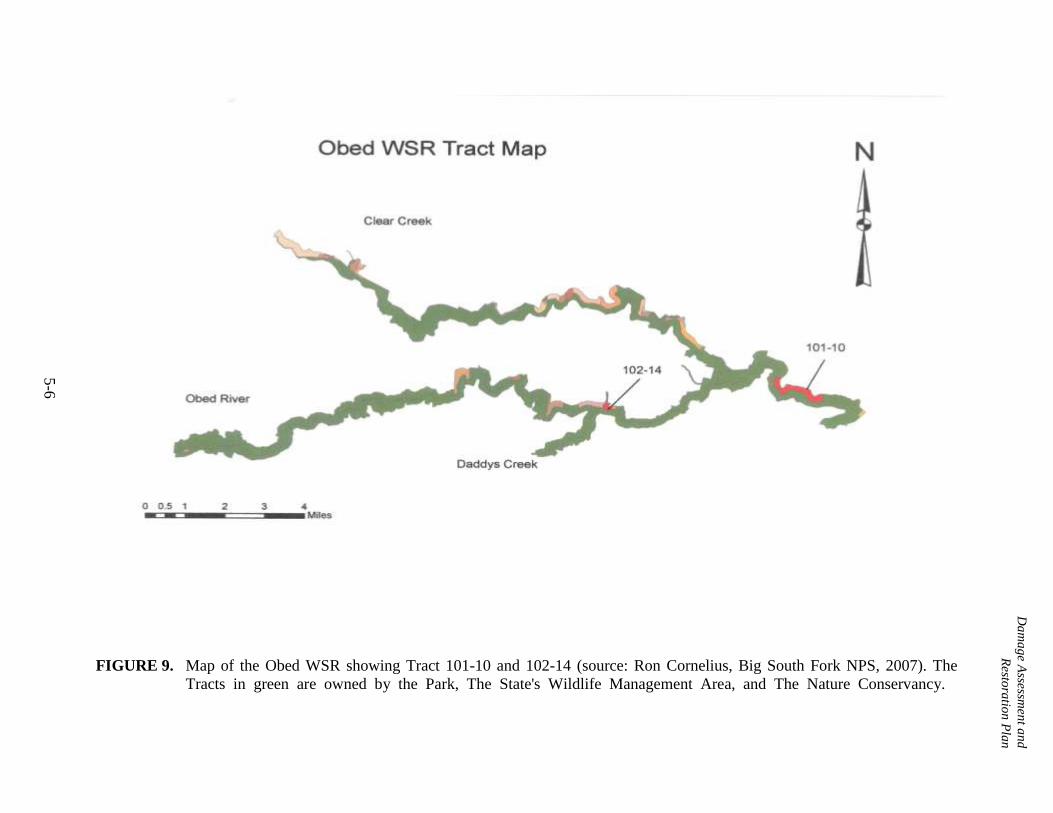
FIGURE 9. Map of the Obed WSR showing Tract 101-10 and 102-14 (source: Ron Cornelius, Big South Fork NPS, 2007). The
Tracts in green are owned by the Park, The State's Wildlife Management Area, and The Nature Conservancy.
5-6
Da
ma
ge A
ssessmen
t an
d
Resto
ratio
n P
lan
Damage Assessment and
Restoration Plan
5-7
significant gaps in NPS management of the Obed WSR corridor. Tract 101-10 is approximately
169 acres and proposed for acquisition of a conservation easement. This tract lies between river
mile 3 and river mile 1 of the Obed WSR (ending about 1 mile upstream of the Obed/Emory
confluence). Tract 101-10 is on river left, with the majority of the property facing the Catoosa
Wildlife Management Area property that is jointly managed by the WMA and the NPS. Tract
102-14 is approximately 29 acres and located at the junction of Daddy’s Creek and the Obed
River. Of the two tracts, purchasing Tract 102-14 is the highest priority for the Park because it
has river access, scenic value, endangered species habitat, developmental potential, and
harvestable timber (NPS, 1992).
Acquiring an easement or an outright purchase of one of the above tracts of land also
would compensate for the lost use services. Part of the management objectives outlined in the
General Management Plan for the Obed WSR was to provide visitor experience through “the
primitive nature of the resource between existing public bridge crossings” and for visitors to
“enjoy the special values of the Obed WSR (essentially primitive, unpolluted, and generally
inaccessible) while assuring the protection of those values” (NPS, 1994). The assurance that a
continuous corridor of land along the Obed WSR will not be developed in the future is following
the Parks’ management objectives while also compensating for lost visitor use as a result of the
spill.
NPS has an approved Land Protection Plan (LPP) that was used to identify potential
properties using the following objectives (NPS, 1992):
Identify those lands or interests in land that need to be in Federal ownership to achieve
management unit purposes consistent with public objectives of the unit.
To the maximum extent practical, use cost-effective alternatives rather than direct Federal
purchase of private land: when acquisition is necessary, acquire or retain only the
minimum interest necessary to meet management objectives.
Cooperate with landowners, other Federal agencies, State, and local governments, and the
private sector to manage land for public use or protect it for resource conservation.
Formulate or revise, as necessary, plans for land acquisition and resource use or
protection to assure the sociocultural impacts are considered and that the most
outstanding areas are adequately managed.
All of the above objectives were considered in the selection of the two priority tracts of
land for compensation. The LPP states than an easement is appropriate whenever the protection
of scenic values is the major concern, there is no Federal development, and public use is limited
to the river and floodplain.
5.5.2.2 Scaling Approach
The Trustees used a restoration curve, similar to the injury curve, to determine the
amount of land that could be purchased to compensate for the 24.3 DSAYs of forestry resources
lost as a result of the spill and fire. With the acquisition of a conservation easement or the
outright purchase of a tract of land with similar characteristics to the injured forest, forest
resources would be protected from future development compensating for the lost forest services.
Damage Assessment and
Restoration Plan
5-8
The recovery curve was developed with a maximum service benefit of 50% because only
half of the tracts are capable of being developed in the future due to the slope of the properties as
well as the floodplain (P. Campbell, NPS, pers. comm., 2007a; M. Hudson, NPS, pers. comm.,
2007a). The Trustees also assumed that with the increase in development in Morgan County in
recent years, and the development of several new housing subdivisions near the Obed WSR, the
likelihood of future development on the land is fairly high. It was estimated that full
development of half of either tracts of land could occur within 20 years. The Trustees assumed
that the acquisition or purchase would occur in the year 2010. In the absence of the easement or
purchase, the Trustees estimated an exponential increase in development from 2010 to 2029
(Appendix A, Table A3). The percentages were provided for each year after the start of the
project (2010) to estimate the credit that the easement (or purchase) is providing through the
prevention of increasing development on the land. Using the restoration curve inputs shown in
Table A3 of Appendix A, the Trustees estimated that 2.3 acres of land could be acquired for a
conservation easement in order to restore the 24.3 lost DSAYS.
The Trustees decided to add the lost visitor use restoration resources to the forest injury
resources to acquire more land than would have been possible using only forest injury resources.
Restoration projects for lost visitor use services were scaled to a dollar amount, where the loss of
visitor use days was given a dollar value based on the public being unable to use the resource.
The dollar amount of $56,446 will be used to acquire additional acres of the land through a
purchase or conservation easement.
5.5.2.3 Probability of Success, Performance Measures, and Monitoring
There is a high probability of success since there are no changes occurring to the natural
resources in the acquisition of a land easement or land purchase. The prevention of future
development on the property along the Obed River is “protecting the natural systems, cultural
resources, landscape character, and biodiversity of the Wild and Scenic River area,” one of the
management objectives for the resources of the Obed WSR (NPS 1994).
Communication with landowners on a semi-annual basis will be included as part of the
monitoring plan in order to prevent easements from being ignored or illegal activities occurring
on the land. Overflights and visits to the tract of land may be necessary periodically and are part
of the NPS regular monitoring of the Obed WSR corridor (NPS, 1992).
5.5.2.4 Approximate Project Costs
The average cost of an acre of land within the authorized boundary of the Obed WSR is
$3,500 (P. Campbell, NPS, pers. comm., 2007b). The forestry services restoration was scaled at
2.3 acres, thus the cost for this component would be $8,050. The compensation from the lost
visitor use, at $56,446, would allow for purchase of 16.1 acres. Other costs associated with the
application of a conservation easement or land acquisition of a tract include an environmental
assessment ($2,500), appraisal ($5,000), and closing costs ($1,500). Thus the total cost for the
preferred restoration option of land acquisition to restore forestry resources is $17,050.
Additional funding sources identified by NPS would allow additional acres to be acquired, to
complete acquisition of a specific tract that exceeded the amount available from the restoration.
Damage Assessment and
Restoration Plan
5-9
The NPS will cover all other costs associated with the land acquisition, including negotiation
with the land owner, contract management, and long-term monitoring.
5.5.2.5 Environmental and Socio-Economic Impacts
The placement of a conservation easement on a private tract of land or purchase of a tract
of land for NPS use will have some socio-economic impacts as outlined in the LPP (NPS, 1992):
1) Land acquisition will prohibit timber harvesting and future residential development; and 2)
lands where easements are purchased may be assessed at a lower tax rate. However, these are
minor impacts considering the former is an objective that the NPS is trying to meet (e.g., no
invasive activity on the land to compensate for lost forest services). The latter may be
compensated through visitors coming to the NPS and spending money on local accommodations
and food that would benefit the community.
No adverse environmental impacts are expected with the acquisition of a conservation
easement or tract of land. A land easement or purchase will have several positive environmental
benefits. The easement or purchase of land along the Obed WSR will benefit the affected
resources by providing similar forest vegetation and soils that were lost in the spill and fire, as
well as providing natural riparian habitat along the Obed WSR. Land that is prevented from
future development is beneficial for wildlife, native plant and tree species, as well as NPS
visitors, as the undeveloped primitive character of the forest along the Obed provides a unique
natural setting. A land easement or purchase will help to reduce the trend of development along
the creek edge, therefore reducing sedimentation of the river. This in turn will also benefit the
threatened and endangered species that inhabit Clear Creek. In addition, no impacts to public
health and safety or historical or archaeological resources are anticipated. In fact, several of the
archaeological sites on Tract 101-10 have already been looted, and increased patrolling and legal
consequences could help thwart illegal activities. A conservation easement, as would occur on
Tract 101-10, will prompt an archaeological inventory of the area that would help gather more
information about what is present on the land and how to best preserve those resources.
5.5.2.6 Evaluation
This project meets the evaluation criteria discussed in Section 5.2. The acquisition of land
will compensate for interim losses of forest and lost use services (in-kind restoration) and will
occur in the same geographic vicinity of the spill (in-place). This has a number of benefits
including: (1) the protection of the unique characteristics of the geographic area; (2) no risks to
human health or safety; and (3) additional ecological benefits in the form of habitat availability
for wildlife and native vegetation. In addition, the opportunity to combine forest restoration with
the lost visitor use injury (Section 5.4.4 Lost Visitor Use) makes this option cost-effective for
both injuries.
The Trustees preferred acquiring land or conservation easement over the restoration
alternatives that were dismissed because the former provides important benefits with no adverse
impacts to other natural resources. As a Wild and Scenic River, the park’s first, most overarching
purpose is to provide an environment “protect[ed] for the benefit and enjoyment of present and
future generations” (NPS, 1994). Therefore, protecting previously vulnerable land within the
Damage Assessment and
Restoration Plan
5-10
NPS’s legislative boundaries should take precedence over new programs for educating and
informing the public when such an option is available. This alternative is part of the NPS LPP
that has gone through extensive public review and approval, and there are willing landowners
who want to preserve the Obed WSR corridor. Other reasons for choosing these tracts of land
include:
Both tracts of land have timber on the property that is mature and harvestable.
Acquiring either tract would provide continual protection along the river since NPS lands
occur on either side of these properties.
Tract 101-10 is highly desirable for development because the cliffs are sheer and the land
leading to them is fairly flat, so homes built on the tract can be built virtually on top of the
river, with sweeping views.
The USGS river gauge at Alley Ford is accessed by crossing Tract 101-10. Preserving
that access is important both from a visitor use and scientific perspective.
Tract 101-10 tract currently offers outstanding recreational values, including scenic
views, wilderness character, and solitude.
Tract 102-14 has river access and is an important put-in, the only one for the section of
the Obed River within the park except Potter’s Ford, which is 12 miles upstream and
much more difficult to access. Also, since that put-in is not owned or controlled by the
park, its use as a put-in is at the discretion of the landowner, and ownership may change
in the future.
The portion of Tract 102-14 that adjoins the Obed River contains one of the most
significant populations of Cumberland rosemary, a federally threatened plant, within the
authorized park boundary.
From the perspective of compensatory restoration for lost visitor use, protecting the land
alongside the river from development is extremely important to the overall quality of the
recreational experience. Most of Tract 101-10 is in the viewshed of hikers on the segment of the
Cumberland Trail that goes through the Obed WSR and Catoosa Wildlife Management Area. A
popular stopping place on the Cumberland Trail, Alley Ford, is often used for picnicking and
fishing. Preserving the view from Alley Ford would be a positive outcome of the easement that
would benefit hikers and fishers, as well as boaters. Development of Tract 101-10 poses a great
threat to the viewshed of all park users, but especially boaters, who are most likely to venture
into the canyon areas. The upper mile of the tract, which is mostly steep cliffs with flat rims,
adjoins a segment of river that is very straight. Any development on the canyon rim would be
visible to boaters for a longer period than if that length of the river had more meanders (A.
Mathis, NPS, pers. comm., 2007).
Tract 102-14 is an important access point for whitewater paddlers. Catoosa Wildlife
Management Area is closed to visitors for much of the paddling season and, during these
closures, Obed Junction is the only available put-in for the Obed River canyon run and the only
available take-out for the Daddy's Creek canyon run. Obed Junction is also very popular with
campers and fishermen. Tract 102-14 is rugged and extremely beautiful. It is bordered on one
side by Ramsey Creek, a significant tributary of the Obed River. This cascading, boulder-filled
stream is deeply shaded by hemlock forests and lined with dense rhododendron thickets. A high
rock outcropping on Tract 102-14 provides a commanding view of the junction of the Obed and

Damage Assessment and
Restoration Plan
5-11
Daddy's Creek. The Obed River itself at this point features a long, very scenic series of rapids
and shoals (M. Hudson, NPS, pers. comm., 2007b). The recreational experience by visitors to the
Park would be enhanced by the purchase of this tract of land.
5.5.2.7 Alternatives Considered But Dismissed
The Trustees considered one other restoration project to compensate for the forest injury.
The project that was considered, but then dimissed, included:
Acquisition to an Identified Recreational Climbing Site: One tract of land exists adjacent
to the park boundary with approximately 3.0 acres of privately owned land used by
climbers. This piece of land is similar in vegetation, slope, distance to the creek, and
available habitat as the land that was injured in the spill and fire. This option was not
considered further as there was no willing seller.
The Trustees considered several restoration projects to compensate for the lost visitor
use. Projects that were considered, but then dismissed, included:
Wayside exhibits for the Nemo Bridge access site, including:
Two custom rail-mounted low profile bases that allow for interpretation of the river
ecosystem and the history of the area,
A three-sided upright base with one bulletin case at the Trailhead for general visitor
information, warnings, and other notifications,
A parking lot entrance sign, and
One trail distance sign (to describe trails and trail distances).
The potential cost for these exhibits is estimated at $30,900. This option was not selected as
potential funding sources may already exist through NPS Project Management Information
Systems.
Public education cases/signs for Lilly Bluff/Nemo bridge access areas that would
include:
Trail signage (trailhead signs, milemarkers, etc) in the Lilly Bridge access area
Extra wayside panels in case of vandalism
Two more three-sided upright bases with bulletin cases (one for both Lilly and Nemo
Bridges)
The potential cost for these case/signs is estimated at $10,000-$20,000. This option was not
selected as there are already funding sources identified through the NPS Project Management
Information Systems program to support this project.
Addition of an audio/visual kiosk in the visitor center for slideshows or park video (to be
produced at a later date) that would include:
Kiosk shell
LCD monitor
DVD player or computer to play the A/V production

Damage Assessment and
Restoration Plan
5-12
The potential cost for the audio/visual kiosk is estimated at $3,000 - $4,000. This option was not
selected as potential funding sources may exist through the NPS Project Management
Information Systems program.
5.5.3 Stream Restoration
No primary restoration was available to expedite recovery of stream services other than
natural recovery. The Trustees considered efforts to stop the seepage of oil into Clear Creek;
however, there are many difficulties with this alternative because it is not technically feasible to
control the movement of oil in the geological formation. Capturing the oil would be a possibility,
but would also be unlikely because the terrain would not allow for installation of a recovery
trench, etc. The Trustees have referred all regulatory issues regarding the well to the appropriate
regulatory authorities.
The Trustees identified the improvement of water quality to the Little Obed River
(Centennial Park watershed project), a headwater stream of the Obed River, as an option to
restore stream services. A second project was identified in the event that the Little Obed River
option could not be completed and also to evaluate the cost effectiveness of the option. The
second alternative selected was the restoration of an abandoned coal mine site on Golliher Creek
where acid mine drainage (AMD) occurs, draining into Crab Orchard Creek. Crab Orchard
Creek flows into the Emory River.
These projects were identified to aid in improving the water quality that will, in turn,
restore the stream services that were lost as a result of the oil releases.
5.5.3.1 Project Descriptions and Restoration Objectives
5.5.3.1.1 Centennial Park Watershed Project
The Little Obed River is a headwater stream to the Obed River that drains approximately
5 square miles within the city limits of Crossville, TN. The health of the Obed River depends on
the quality of the inflows from all the tributaries that contribute to the river (D. Gregg, OCWA,
pers. comm., 2007b). The water quality of the Obed River is affected by the activities within the
river corridor itself, but also by any activities that occur alongside the smaller creeks and streams
that empty into the Obed River. Dilution and regeneration allow rivers to accommodate some
amount of disturbance along their corridor or headwater streams; however, if the volume or
toxicity of a pollutant becomes significant, waters downstream can be impacted (D. Gregg,
OCWA, pers. comm., 2007b). One of the smaller streams that empty into the Little Obed River
also runs through Centennial Park, a Crossville City park with baseball fields and other
recreational areas with manicured lawns and trails. The upper reaches of this small stream are
heavily developed, and there are large commercial buildings and parking lots that drain into the
city park. The stream has been channelized in the upper section of the city park, and currently the
banks are unstable. Silt covers the bottom of the creek. Restoring this small stream that flows
into the Little Obed River would alleviate some of the pollutants entering the Obed River.
Damage Assessment and
Restoration Plan
5-13
The Trustees chose restoration of the Centennial Park stream as part of the preferred
restoration alternative to compensate for stream injuries in the Obed River. The restoration
activities include streambank restoration and vegetation, removal of invasive vegetation, and
creation of a bog garden and rain gardens. Streambank restoration would require site preparation
on 1.82 acres (creating more normal bank slopes), and landscaping for erosion control. Removal
of invasive plant species from existing riparian buffer would be needed on 3.56 acres, affecting
750 ft of the stream. The bog garden and rain gardens would act as a filter strip to catch nonpoint
source runoff. The bog garden would require site preparation, a sign and boardwalk, and planting
of native vegetation. The rain gardens would require site preparation, plant materials, and labor.
The restoration objectives would be to return the headwater stream banks in Centennial Park to
their original contour and vegetation, thereby reducing the effects of erosion and nonpoint source
pollution and improving the overall water quality of the stream through stormwater detention and
filtering. An increase in the water quality for this project would be based on an increase in the
health of benthic macroinvertebrate community in the stream over time.
5.5.3.1.2 Golliher Creek
Golliher Creek is a tributary to Crab Orchard Creek which empties into the Emory River
(Fig. 10). The Obed River is a tributary of the Emory River above the junction with Crab
Orchard Creek, thus Golliher Creek is not part of the Obed WSR drainage. Prior to the passage
of the Surface Mining Control and Reclamation Act of 1977, coal mining occurred in the upland
areas of Golliher Creek. The coal mining activities left open pits along the creek channel, and
acid-forming material that was exposed during the operations oxidized and created pockets of
standing and flowing surface water with depressed pH and elevated mineral content. Golliher
Creek was then exposed to the acidic materials during runoff events. Although coal mining
operations have been abandoned, the runoff events continue to carry the acidic materials into the
creek (TDEC, 2001). The total surface disturbance at this site is approximately 17 acres.
Golliher Creek is currently listed in the TDEC 303(d) 2006 List of Impaired Waterbodies
as a result of AMD. Active soil loss and release of AMD in Golliher Creek has caused low pH
(pH ≤ 3.0) and elevated levels of manganese and iron in the water (TDEC, 2006). Fish and other
aquatic life cannot tolerate the high acidity levels (pH ≤ 6.5) (Fairchild et al., 1999). Improved
water quality and, in turn, a fully supporting aquatic community would require the remediation
of the AMD sites along Golliher Creek. There are two abandoned mine sites on either side of
Golliher Creek located 1.5 miles upstream of the junction with Crab Orchard Creek. TVA has
already begun a remediation project at the abandoned mine on the northeast side of the creek;
they are projected to complete the project in the summer of 2008. However, there are no plans or
funds to remediate the other abandoned mine on the southwest side of Golliher Creek. The
Trustees decided that this would be an appropriate restoration project to compensate for injured
stream services because, with restoration of the second site, all AMD into Golliher Creek would
be controlled and the stream would be able to fully recover. Other AMD sites were visited and
evaluated, but none provided the opportunity for cost-effective and complete control of AMD
into a stream reach.
The restoration project on the southwest side of Golliher Creek would be accomplished in
two phases. The first phase would include the regrading and revegetation of the 17 acres of land

Damage Assessment and
Restoration Plan
5-14
FIGURE 10. Map of Golliher Creek (source: TVA, 2004).
Damage Assessment and
Restoration Plan
5-15
followed by the establishment of positive surface drainage. Revegetation is completed by
seeding the soil using seed, commercial fertilizer, agricultural limestone, and mulch material on
newly graded areas. The soil is pulverized with lime and fertilizer and then seed is applied to the
soil with a hydroseeder, cultipacker seeder, or tractor-mounted cyclone seeder. Three tons of
straw or hay mulch per acre will be anchored to the soil using a mulching machine immediately
following seeding. Positive surface drainage and stabilization of the site would require grading to
eliminate pits or any depressions that would hold water.
After grading is complete, surface drainage would be provided by construction of grass-
lined waterways. Terraces may be constructed to carry runoff to grassed waterways. The second
phase of the project would occur after the hydrology of the site was stabilized. The seeps would
be located and the AMD treatment systems would be constructed. AMD Passive Treatment
Sizing is determined using a web-based cost-modeling tool provided by the U.S. DOI Office of
Surface Mining (http://amd.osmre.gov/). However, the Crab Orchard Creek Watershed
Restoration Plan (TVA, 2004), developed by TVA, TDEC/Division of Water Pollution Control
and the Emory River Watershed Association, suggested using two limestone treatment ponds and
the creation of one wetland to reduce acidity on the northeastern AMD site on Golliher Creek.
For cost estimates, the Trustees assumed that a similar number of treatment ponds/wetlands
would be needed on the southeastern AMD site as well. Further ground surveys will be needed to
determine the actual number of ponds and wetlands required to reduce AMD.
Restoration objectives include controlling the active soil loss from the upland banks of
Golliher Creek, reducing the acidity in Golliher Creek, and measuring an increase in the TMI
score indicating a return of aquatic life to the waterbody.
5.5.3.2 Scaling Approach
5.5.3.2.1 Centennial Park Watershed Project
To scale the injury of the stream services from Clear Creek and White Creek to the
Centennial Park Watershed Project, the Trustees compared the ecological importance of each
stream. The Little Obed River headwater stream was assumed to be equivalent to Clear Creek
and White Creek in ecological services because of the high secondary production in headwater
streams. Larger creeks and streams, such as Clear Creek and White Creek, have higher numbers
of mussels and fish but are a smaller source of macroinvertebrate or secondary production. Even
though primary headwater streams are much smaller in size, they provide downstream creeks and
rivers with an essential water supply and food source (macroinvertebrates and decaying organic
matter) (Ohio EPA, 2003).
The Trustees estimated the number of DSAYs generated for each restoration activity. The
first activity, streambank restoration, will increase stream services in 0.19 acres of stream habitat
(1,660 ft long and 5 ft wide). It would begin in 2009 and generate a 20% increase in stream
services (i.e., macroinvertebrate biomass) each year after completion until reaching 80% (at year
four). Other injuries in the watershed will constrain full ecological functioning in the stream. The
streambank restoration is assumed to have a lifespan of 75 years. Streambank stabilization,
coupled with fencing, led to revegetated eroding banks and a significant increase in

Damage Assessment and
Restoration Plan
5-16
macroinvertebrate densities in an intensely grazed riparian area of a small Pennsylvania creek
(Carline et al., 2004). Discounting the percent services each year into the future generates 3.68
DSAYs from streambank restoration (Appendix C, Table C5).
The second restoration activity in Centennial Park, invasive vegetation removal along
750 ft of stream, would generate a small increase in stream services. The Trustees assumed that
invasive vegetation along the stream banks already provided some services, therefore, the project
started in 2009 with 50% of services already present. Services would increase by 10% every year
until reaching 80% where services would remain for the life of the project. The experience is that
invasive species are never completely removed from the system, therefore, an increase in benthic
macroinvertebrates as a result of an increase in the natural vegetation would never reach 100%.
Furthermore, other injuries in the watershed will constrain full ecological functioning in the
stream. As was done for streambank restoration, discounting the percent services each year into
the future and giving the project a lifespan of 75 years generates 0.18 DSAYs from invasive
vegetation removal (Appendix C, Table C6).
The third restoration activity in Centennial Park is construction of 2.12 acres of bog
garden. Bog gardens act as water detention structures to slow stormwater discharge into streams
and as filter strips to control nonpoint sources; they provide only limited benefits for secondary
production (Burr, 2007). The filtering of pollutants through the garden will improve water
quality and that, in turn, will provide a better habitat for macroinvertebrates in downstream
sections of the stream in Centennial Park. Vegetated filter strips used in agricultural practices
have been highly successful at protecting waterbodies in various ways that include (Dillaha et al.,
1989):
Intercept surface runoff trapping as much as 75 to 100 percent of sediment,
Capture nutrients in runoff through plant uptake and adsorption to soil particles,
Promote the change of pollutants into less toxic forms, and
Remove over 60% of some pathogens from the runoff.
The primary benefit of the bog garden will be improvement of macroinvertebrate
production downstream, but it will also provide aquatic habitat for macroinvertebrates within the
footprint of the bog garden. To include this benefit, the Trustees assumed that the bog garden
habitat would provide up to 25% of the stream services of the open stream habitat (Burr, 2007).
The Trustees assumed a 5% increase in production after each year following the completion of
the bog garden with a maximum service benefit of 25% over the lifetime of the project (75 years)
(Appendix C, Table C7). Creation of the 2.12-acre bog garden generates 12.60 DSAYs.
The fourth restoration activity proposed by the Trustees is the creation of 2.0 acres of rain
gardens and water detention structures. A rain garden is constructed by excavating an area,
placing gravel within the area and then covering the gravel with landscape filter fabric and
soil/compost mix. The perimeter of the site is then planted with non-grassy vegetation (e.g., trees
and water tolerant shrubs) while the interior is planted with water tolerant herbaceous perennials.
A low berm is constructed on the downslope side of the garden to allow for standing water
during storm events. The rain garden increases the rate of water infiltration into the ground and
acts as a storage facility so that runoff is captured instead of flowing directly into the stream. The

Damage Assessment and
Restoration Plan
5-17
primary benefit of the rain gardens will be improvement of macroinvertebrate production
downstream through retention and filtering of stormwater runoff, but they will also provide
aquatic habitat for macroinvertebrates within the footprint of the rain gardens. To include this
benefit, the Trustees assumed that the rain garden habitat would provide up to 20% of the stream
services of the open stream habitat (Burr, 2007). The Trustees assumed a 5% increase in
production after each year following the completion of the bog garden reaching 20% stream
services over the lifetime of the project (75 years) (Appendix C, Table C8). Creation of 2.0 acres
of rain gardens generates 9.65 DSAYs. These four restoration activities in Centennial Park,
Crossville, TN would generate 26.1 DSAYs of restoration, which is equal to the DSAYs
calculated for injury to stream services.
5.5.3.2.2 Golliher Creek
For restoration scaling purposes, the Trustees assumed that the abandoned mines
occurring on the northeast and southwest sides of Golliher Creek were supplying equal amounts
of acidity load into the creek (the disturbed number of acres are similar). The northeast side of
the creek is currently being restored with completion estimated by 2008. The Trustees assumed
that the restoration on the mine site northeast of the creek would decrease sediment and acidity
loads into Golliher Creek by 50%, and the restoration of the mine site on the southwest side of
Golliher Creek would reduce all remaining sediment and acidity loads, thereby accomplishing
100% removal of the sources of injury to Golliher Creek. Based on the Crab Orchard Creek
Watershed Plan (TVA, 2004) and site visits by the Trustees, there are no other sources of AMD
in Golliher Creek.
Remediating Golliher Creek AMD sites to remove the entire acidity load introduced by
the mines will have some effect in downstream reaches beyond Golliher Creek. However, the
effect will quickly decrease once the stream enters the mainstem of Crab Orchard Creek because
of dilution with the highly acidic waters of Crab Orchard Creek. The Spreadsheet Tool for the
Estimation of Pollutant Load (STEPL) was used to determine the downstream benefits in Crab
Orchard Creek of 100% reduction in anthropogenic acidity in Golliher Creek. The calculations
used in this analysis were based on data for stream flows and acidity in the Crab Orchard Creek
Watershed Restoration Plan (TVA, 2004) for specific stations along the main stem of the creek.
The Crab Orchard Creek station closest to Golliher Creek is located about 4 miles downstream
from the mouth of Golliher Creek. The percent and absolute change in acidity load is related to
stream flow, thus different stream flow conditions were used in the STEPL calculations. Even
with 100% reduction in the acidity from Golliher Creek, the acidity reduction in Crab Orchard
Creek under low-flow conditions was only 15% and under median-flow conditions was 59%.
Under these conditions, aquatic life would still be significantly injured because of their frequent
exposure to highly acidic water (pH< 3) during regular low-flow conditions. Based on this
analysis, no benefits to stream services were considered downstream of Golliher Creek.
To scale the Golliher Creek restoration project to the amount of injury to the stream, the
Trustees assumed that the remediation of the abandoned mine on the southwest side of the creek
would be complete in 2009. Based on previous AMD reclamation projects, it was assumed that
once complete, the water quality would improve almost immediately. This was shown in
Goodrich-Mahoney and Ziemkiewicz (2006) when a partially reclaimed surface mine near
Damage Assessment and
Restoration Plan
5-18
Valley Point, Preston County, West Virginia was restored in 2004 using a passive AMD
treatment system. Water quality sampling one month later revealed a 95% removal efficiency for
acidity, iron, and aluminum. With the pH restored, Trustees estimated that, within the first year
of project completion, 50% of benthic macroinvertebrates would return to Golliher Creek and
after two years, 100% of macroinvertebrates would return. These percentages were based on the
life history of species known to inhabit streams systems in Tennessee Bioregion 68a. Most
benthic macroinvertebrate species (i.e., mayflies, caddisflies) have short life histories (less than
one year) and, therefore are able to repopulate a waterbody in a relatively short time period once
the invertebrates drift into an area. The passive AMD treatment systems are constructed to have a
life span of approximately 30 years providing services until 2039. Using these estimates, the
remediation of the AMD site would restore 1.82 acres of Golliher Creek (7,920 ft long and 10 ft
wide) and produce 30.2 DSAYs (Appendix C, Table C4) to compensate for the injured stream
services that were calculated to be 26.14 DSAYs.
5.5.3.3 Probability of Success, Performance Measures, and Monitoring
5.5.3.3.1 Centennial Park Watershed Project
The Centennial Park Watershed Project is a strong candidate for restoration because of
the commitment of the Obed Watershed Community Association (OWCA), a 501(c)(3)
membership organization that was formed in 2005. Their goal is to increase public appreciation
for the cultural, historical, and environmental resources of the Obed River watershed within
Cumberland County through encouraging programs and activities that will protect these
resources. In February 2007, OWCA received a grant from TDEC to set up a volunteer
monitoring project for three injured stream segments in the Obed River watershed and develop
Watershed Restoration and Management Plans for these streams (the streams did not include the
Little Obed River). OWCA has a Technical Advisory Committee made up of representatives of
TDEC, Tennessee Tech University Center for Water Management, Natural Resource
Conservation Service, TWRA, TVA, Tennessee Department of Transportation, NPS, Veolia
International (the company that has the contract to manage Crossville’s Wastewater Treatment
plant), and DEPA (a private environmental consulting firm). In addition, OWCA is involved
with the Habitat Conservation Plan process that has begun recently and includes all of
Cumberland County. Its staff, Louise Gorenflo and Dennis Gregg, have almost 30 years of
experience working in Cumberland County on a range of issues of concern to the community,
and they both hold Master’s degrees in Ecology from the University of Tennessee. Thus, OWCA
has the technical experience, financial support, and community outreach to be successful in
implementing the restoration project.
In addition, the City of Crossville will be an active partner in the Centennial Park
Watershed Project. They have committed to provide personnel and equipment to help construct
components of the projects and to maintain these new aspects of the park once completed.
Monitoring will be a key component of the Centennial Park Watershed Project. OWCA
has developed a volunteer-based monitoring program that it is using for studies under contract
with TDEC on three stream segments. Because benthic macroinvertebrate monitoring is not part
of the planned monitoring program in Centennial Park, it has been included at additional costs.

Damage Assessment and
Restoration Plan
5-19
5.5.3.3.2 Golliher Creek
The Golliher Creek site is a strong candidate for restoration because there are baseline
data already available for this creek, a watershed plan has been developed for this site (TVA,
2004), and the TDEC Tennessee Land Reclamation Office has already begun the restoration of
the opposite (northeast) side of the creek that is scheduled to be complete in 2008. The Crab
Orchard Creek Restoration Partnership is a consortium of agencies and groups that are interested
in restoring Crab Orchard Creek and its tributaries and removing them from the 303(d) list.
Partners include TDEC, TVA, Emory River Watershed Association, Morgan County, Oakdale
School, Natural Resource Conservation Service, TWRA, University of Tennessee, Tennessee
Scenic Rivers Association, and Chota Canoe Club. The goals of the Crab Orchard Creek
Restoration Partnership are to restore Crab Orchard Creek and its tributaries to fully supporting
their designated uses, and protect public health and well being by reclaiming hazardous
abandoned mine land. Thus, there is a well-established organization to oversee and manage the
restoration project. Restoring the abandoned mine site on the southwest side of Golliher Creek
would complete the restoration in this tributary.
Ziemkiewicz et al. (2003) summarized performance data for 18 limestone leach bed sites
located in Tennessee, Alabama, West Virginia, and Indiana. Limestone leach beds are similar in
functionality to limestone ponds (TVA, 2004) but little data exist on the performance of
limestone ponds. The acidity reduction factors were calculated for each limestone leach bed site
and, excluding minimum and maximum calculated values, the acidity reduction factor was 93%
(Ziemkiewicz et al., 2003). Fairchild et al. (1999) observed a significant recovery of water
quality, fish, and invertebrate communities following the reclamation of an abandoned surface
mine site in western Missouri.
There would be no monitoring costs associated with this project because the northeast
side restoration (completed by TDEC) is already being monitored. That monitoring will
continue, serving to monitor the southwest side as well. TVA (2004) recommends the following
monitoring plan for the AMD reclamation sites in Crab Orchard Creek:
Mine Site Monitoring:
Pre-reclamation sampling of seeps will be conducted to establish a baseline, including 3-
4 sample collections under variable conditions (low and high flows). Parameters to
sample include: pH, conductivity, acidity, alkalinity, iron, manganese, and aluminum.
Post-reclamation sampling: mine reclamation treatments will be monitored to assess
effectiveness and to ensure that the reclamation installations remain intact and function
properly. Monitoring schedule will be quarterly for one year.
In-stream Water Quality Monitoring:
Post-reclamation monitoring: stream segments will be monitored quarterly for one year
following reclamation. Parameters sampled to include pH and conductivity.
Post project, there will be a year of monitoring for pH, conductivity, acidity, alkalinity,
iron, and manganese to support delisting restored stream segments.
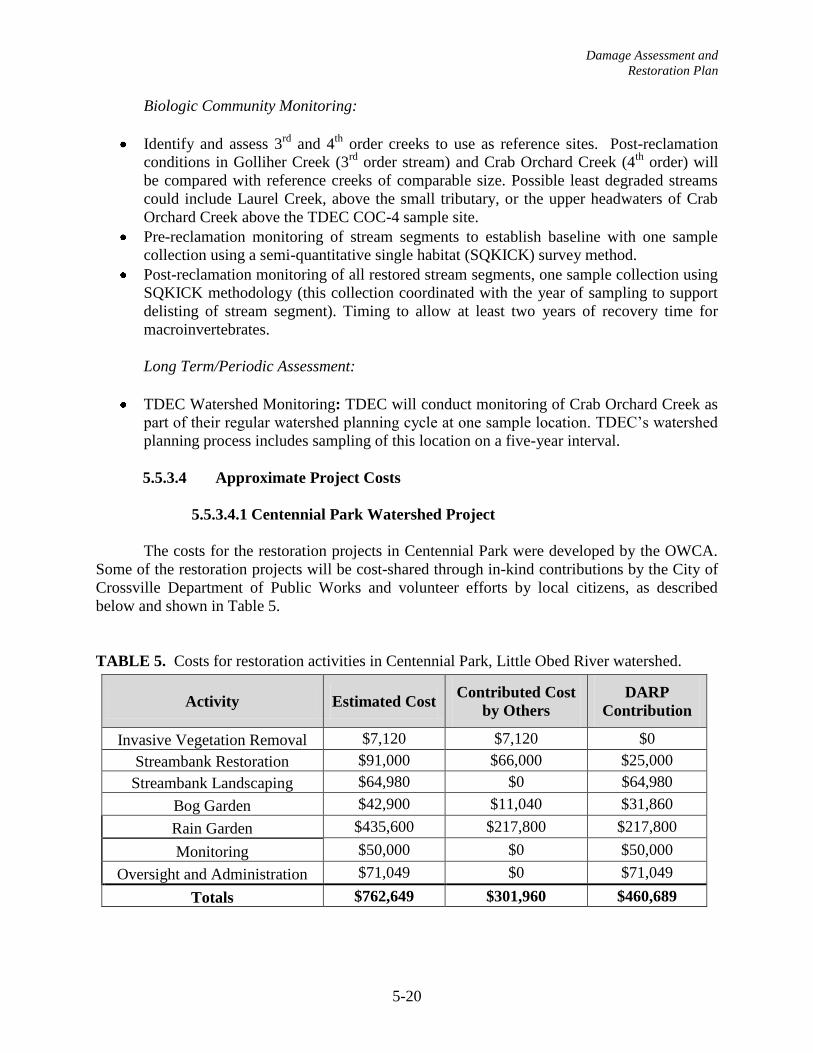
Damage Assessment and
Restoration Plan
5-20
Biologic Community Monitoring:
Identify and assess 3rd
and 4th
order creeks to use as reference sites. Post-reclamation
conditions in Golliher Creek (3rd
order stream) and Crab Orchard Creek (4th
order) will
be compared with reference creeks of comparable size. Possible least degraded streams
could include Laurel Creek, above the small tributary, or the upper headwaters of Crab
Orchard Creek above the TDEC COC-4 sample site.
Pre-reclamation monitoring of stream segments to establish baseline with one sample
collection using a semi-quantitative single habitat (SQKICK) survey method.
Post-reclamation monitoring of all restored stream segments, one sample collection using
SQKICK methodology (this collection coordinated with the year of sampling to support
delisting of stream segment). Timing to allow at least two years of recovery time for
macroinvertebrates.
Long Term/Periodic Assessment:
TDEC Watershed Monitoring: TDEC will conduct monitoring of Crab Orchard Creek as
part of their regular watershed planning cycle at one sample location. TDEC’s watershed
planning process includes sampling of this location on a five-year interval.
5.5.3.4 Approximate Project Costs
5.5.3.4.1 Centennial Park Watershed Project
The costs for the restoration projects in Centennial Park were developed by the OWCA.
Some of the restoration projects will be cost-shared through in-kind contributions by the City of
Crossville Department of Public Works and volunteer efforts by local citizens, as described
below and shown in Table 5.
TABLE 5. Costs for restoration activities in Centennial Park, Little Obed River watershed.
Activity Estimated Cost Contributed Cost
by Others
DARP
Contribution
Invasive Vegetation Removal $7,120 $7,120 $0
Streambank Restoration $91,000 $66,000 $25,000
Streambank Landscaping $64,980 $0 $64,980
Bog Garden $42,900 $11,040 $31,860
Rain Garden $435,600 $217,800 $217,800
Monitoring $50,000 $0 $50,000
Oversight and Administration $71,049 $0 $71,049
Totals $762,649 $301,960 $460,689

Damage Assessment and
Restoration Plan
5-21
Invasive vegetation removal is estimated to cost $2,000 per acre for 3.56 acres, or $7,120.
This project will be implemented using in-kind volunteer labor overseen by certified personnel in
invasive vegetation removal and herbicide application.
Streambank restoration consists of site preparation work to create a more normal bank
slope, which will cost $91,000 for 1.82 acres at $50,000 per acre. However, the City of
Crossville Department of Public Works will remove the existing sewer line adjacent to the
stream as part of their planned sewer system upgrade program in 2008, thus the additional costs
to restore the stream banks to a more natural slope and planting woody vegetation is estimated to
cost $25,000 beyond what would normally be expected for the planned work by the City. In
addition, buffer areas around the stream will be graded and planted for erosion control. The costs
for this work on 7,220 ft2 are $9/ft
2, for a total of $64,980.
The bog garden costs include a design fee ($4,000), site preparation ($2,000), boardwalk
construction ($22,500), plants and labor ($12,000), and signage ($2,400), for a total of $42,900.
The City of Crossville Department of Public Works and volunteers will contribute much of the
labor and equipment for this project. Actual out-of-pocket expenses are estimated to be $31,860.
The OCWA has identified six sites for construction of rain gardens and runoff detention
structures, covering an estimated 188,500 ft2. They estimate the costs for construction, planting,
and maintenance of the rain gardens at $5/ft2. Through the restoration scaling calculations, it was
determined that 87,120 ft2 of rain gardens would offset the remaining stream services injuries, at
a cost of $435,600. However, the City of Crossville and volunteers will contribute some labor
and equipment, offsetting the costs by an estimated 50%, thus the costs to be covered by the
restoration project are estimated to be $217,800.
It will be important to monitor the effectiveness of these restoration projects in
Centennial Park. The OWCA and its volunteers will be conducting monitoring studies of the
projects that include visual assessments (using the Maryland protocols, which are an assessment
of the stream morphology and sediments) and water quality measurements. Additional costs are
estimated to be $10,000 per year for collection and analysis of benthic invertebrate samples.
The OWCA costs include a half-time staff member to oversee the project, report to the
Trustees on project status, and prepare required reports. The annual costs include $20,000 (half-
time salary), $2,000 in benefits, and $1,683 in overhead costs, for a total annual cost of $23,683.
For the three years of the project period, oversight and administrative costs will be $71,040.
5.5.3.4.2 Golliher Creek
The first phase of the abandoned mine restoration project on Golliher Creek, which
includes regrading, revegetation, and establishing positive surface drainage, is estimated to cost
$10,400 per acre of land. This cost estimate is based on the first phase of work that was
completed by TDEC-WPC Land Reclamation Section in 2006 on the northeast side of Golliher
Creek (T. Eagle, TDEC, pers. comm., 2007) and accounting for a 10% increase in costs per year
until implementation in 2009. Thus, the Trustees will need approxmately $176,800 to complete
the first phase of work on the 17-acre site on the southwest side. The second phase of the project,

Damage Assessment and
Restoration Plan
5-22
constructing the two limestone treatment ponds in 2009, is estimated to cost $48,315 per pond
for two ponds plus one wetland/settling pond at $43,500, based on cost estimates in the Crab
Orchard Creek Watershed Plan prepared by TVA (2004) and accounting for a 10% increase in
costs per year since 2004. Monitoring costs are estimated to be $10,000 per year for 5 years.
Table 6 provides the list of expenditures and total costs.
TABLE 6. Estimated costs for Golliher Creek Restoration.
Activity Cost
Phase 1 $176,800
Phase 2 $140,130
Monitoring (5 years) $50,000
Total Cost $366,930
5.5.3.5 Environmental and Socio-Economic Impacts
5.5.3.5.1 Centennial Park Watershed Project
Restoration activities in Centennial Park will have positive environmental impacts on the
affected resources described above in Section 3.0 Affected Environment (water, sediment, and
biological community). Currently, the stream has been channelized in the upper section of the
park, banks are unstable, and there is little streamside vegetation to provide shade or habitat in
many areas. The stream bottom is silt and provides little benthic invertebrate habitat. All of the
proposed activities will improve stream habitat directly through bank stabilization and vegetation
and indirectly through stormwater detention and filtering. The improvement of water quality and
sediment on the stream bottom, as well as riparian vegetation will provide important habitat and
initiate the return of benthic algae, fish, and macroinvertebrates. There may be some
environmental impacts associated with application of herbicides in some locations, however they
will be used only when manual removal will cause significant soil loss. The removal of invasive
vegetation will be done primarily through manual hand control and cutting. Plants will be
removed where the soil disturbance will not cause an erosion or siltation problem. Herbicides
will only be used on the cut stems of the largest, most woody plants, where the removal of the
plant would cause significant soil loss into the stream bed, or where the size of the root system
makes removal impractical. The herbicide used, glyphosate, is readily metabolized by soil
bacteria and is non-toxic to soil invertebrates. As discussed above, glyphosate is of relatively low
toxicity to fish, birds, mammals, invertebrates, and fish. It has an extremely high ability to bind
to soil particles and therefore is not easily leached into either groundwater or surface water (D.
Gregg, pers. comm., 2007a).
Some of the key components of the Centennial Park project will be its outreach and
public benefits. The park is heavily used, and the public will be exposed to the attractive aspects
of all of the restoration features. Rather than thinking of how to shed water off of their property,
people in the community can begin to see the value of retention as allowing a different kind of
self-maintaining landscaping that does not need to be mowed or watered, that attracts birds and

Damage Assessment and
Restoration Plan
5-23
other wildlife. The city of Crossville will have a stormwater ordinance (including a stream buffer
section) in place by July 2008. However, these regulations will not apply outside of city limits,
and their effectiveness ultimately depends on the interest and willingness of the community to
protect its waters. The city will be required to train their own public works employees and to
sponsor trainings for builders and developers. The projects at Centennial Park will demonstrate
techniques and designs that can be used in other projects throughout the watershed. Education of
builders, developers, and property owners is key to the adoption of these new practices. Thus, the
restoration projects at Centennial Park will have very high educational and socio-economic
values.
5.5.3.5.2 Golliher Creek
Restoration of the remaining abandoned mine site on Golliher Creek will have
considerable positive environmental impacts on the affected resources described in Section 3.0
Affected Resources (water, sediment, biological community) located outside of the Obed
watershed. Grading, stabilization, and revegetation of the land surface of the abandoned mine
will control sediment runoff into the stream and provide better upland habitat. Treatment of
AMD discharges will allow return of a fully supporting benthic community. Headwater streams
are extremely productive in terms of secondary production, thus the return of Golliher Creek to a
fully supporting community will contribute to the improvement of the Crab Orchard watershed.
Benthic algae, fish, and macroinvertebrates will return to streams when the pH of the water
returns to baseline conditions.
One of the key concerns with abandoned mines in Tennessee is human safety. The steep
high wall of the mine against the hillside poses significant hazards from falling off the edge.
Piles of unstable mine debris are unsafe for climbing. Restoration of these sites will reduce the
risks of injury or death from recreational use. Landowners in the watershed recognize the value
of restoration of abandoned mine lands both in terms of environmental quality and public safety.
Crab Orchard Creek once supported muskellunge (Esox masquinongy) populations and is
a favorite of whitewater enthusiasts. Crab Orchard Creek’s designated uses include support of
fish and aquatic life, recreation, livestock watering/wildlife, and irrigation. It is listed on the
Nationwide Rivers Inventory for exceptional scenic, recreational, geologic, and fish/wildlife
values. These uses have been degraded by the poor water quality resulting from AMD. TVA and
TDEC are working to mitigate four of the largest sources of AMD in the Crab Orchard Creek
watershed, including the site on the northeast side of Golliher Creek. Thus, major efforts are
being made to improve water and land quality in the watershed. The full restoration of Golliher
Creek will be an important contribution to the overall recovery of the watershed to its full
historical use.
5.5.3.6 Evaluation
Both the abandoned mine reclamation and AMD treatment at Golliher Creek and the
restoration of the headwater creek of the Little Obed River in Centennial Park aim at improving
water quality to two creeks that are currently on the 2006 303(d) list of impaired waterbodies
(TDEC, 2006). The costs of both projects are similar, and both provide substantial environmental

Damage Assessment and
Restoration Plan
5-24
and socio-economic benefits. The Trustees prefer the Centennial Park watershed project over the
Golliher Creek project because the Centennial Park project will restore stream services within
the Obed River watershed. The Golliher Creek project is located within the Emory River
watershed, below where the Obed River enters the Emory River.
5.5.3.6 Alternatives Considered But Dismissed
The Trustees evaluated several alternatives for compensatory restoration for stream
services. These alternatives are briefly described and the reasons for their rejection are
summarized below:
Implementation of best management practices to control sedimentation in streams from
non-point sources, similar to the kinds of projects funded under Section 319 of the Clean
Water Act. Potential partners including the Natural Resources Conservation Service,
TDEC, and the FWS Partners Program were contacted. Several potential sites were
visited, but no promising projects were identified within the Obed River watershed. Also,
there were few data on which to estimate the benefit of reductions in sedimentation on
stream services, particularly in estimating the distance downstream of the benefit.
Plugging of leaking wells, particularly the one at Potter’s Ford. It was felt that there were
existing regulations for control of oil discharges.
Implementation of some elements of the Spotfin Chub recovery plan. The oil spill was
not known to have impacted spotfin chub specifically. Also, the Spotfin Chub recovery
plan was outdated, and some items on the summary were already being/have been done.
Acid mine drainage treatment by dosing of Rock Creek with limestone sand. Rock Creek
is within the Obed WSR and has very poor water quality. The abandoned mine site was
visited by the Trustees and experts in abandoned mine restoration. It was decided that
regrading and contouring work on Rock Creek would cause significant damage to the
stream and should not be attempted at this time.
5.6 Agency Consultation
NPS has conducted an informal consultation with the USFWS, Tribal Councils, and the
Tennessee State Historic Preservation Office (SHPO) for the preferred alternative restoration
actions. The USFWS was a participating member of the Trustee Council and assisted in the
identification of the restoration actions listed above. The USFWS concurred with the NPS
finding that the preferred alternatives occurring within Park boundaries and in the Little Obed
River watershed are “not likely to adversely affect” any federally threatened or endangered
species listed within the state of Tennessee. The USFWS stated that NPS has fulfilled the
requirements of Section 7 of the Endangered Species Act through the informal consultation
letter (Appendix E).
Seven Tribal Councils were consulted and asked to contact NPS if they planned to
respond. Only one tribe confirmed, the United Keetoowah Band of Cherokee Indians in
Oklahoma, and they had no comments on the proposed actions (Appendix F).

Damage Assessment and
Restoration Plan
5-25
SHPO reviewed the area where the preferred alternative actions are to be implemented
and concurred that there are no archaeological resources eligible for listing in the National
Register of Historic Places (Appendix G).
5.7 Restoration Oversight and Administration
NPS will serve as the Contract Office Representative (COR) and will oversee the
implementation of the restoration projects listed above. This includes two meetings and one site
visit per year (for a total of two years), periodic conference calls, status reports, and
administrative support for each of the projects. Table 7 shows the costs estimated to cover
oversight and administrative costs.
USFWS and TDEC will also participate in the support and oversight of the restoration
projects. Each agency will also attend two meetings per year and participate in conference calls
or provide support to the implementation of the restoration project when needed. The costs for
USFWS and TDEC are shown in Tables 8 and 9, respectively. The total costs for oversight and
administration by the Trustee agencies are estimated to be $151,835.
TABLE 7. Restoration phase oversight and administration costs for NPS.
Staff
Meeting
/Travel
Time
Oversight/
Support
(Hours
Total
Hours
2008
Hourly
Rate
2009
Hourly
Rate Cost
Overhead
Costs
Travel
Costs Total Cost
P.
Campbell 48 80 128 $ 48.32 $ 49.77 $ 6,277.34 $ 1,057.10 N/A $ 7,334.45
R.
Schapansky 48 150 198 $ 36.40 $ 37.49 $ 7,315.31 $ 1,231.90 N/A $ 8,547.21
J. Carriero 80 80 160 $ 66.26 $ 68.25 $ 10,760.61 $ 1,812.09 $4,610 $ 17,182.69
R. Dawson 80 20 100 $ 66.95 $ 68.96 $ 6,795.43 $ 1,144.35 $2,662 $ 10,601.77
A. Mathis 136 1934 2070 $ 23.23 $ 23.93 $ 48,807.39 $ 8,219.16 N/A $ 57,026.56
Total Cost $ 100,693
TABLE 8. Restoration phase oversight and administration costs for USFWS.
Staff
Meetings/
Travel
Time
Oversight/
Support
(Hours
Total
Hours
2008
Hourly
Rate
2009
Hourly
Rate Cost
DOI
Overhead
Cost
Travel
Costs
USFWS
Overhead
Costs
Total
Cost
S. Alexander 48 345.6 393.6 $ 44.05 $ 45.59 $ 17,641.34 $ 2,970.80 $550 $ 3,274.44 $ 24,437
TABLE 9. Restoration phase oversight and administration costs for TDEC.
Staff
Meetings/
Travel
Time
(Hours)
Oversight/
Support
(Hours)
Total
Hours
2008
Hourly
Rate
2009
Hourly
Rate Cost
Overhead
Costs
Travel
Costs Total Cost
D. Mann 52 80 132 $ 43.46 $ 44.76 $ 5,822.77 $ 1,316.53 $ 1,100.79 $ 8,240.09
J. Burr 48 345.6 393.6 $ 36.56 $ 37.66 $ 14,605.87 $ 3,302.39 $ 556.68 $ 18,464.93
Total Cost $ 26,705

Damage Assessment and
Restoration Plan
6-1
6.0 ENVIRONMENTAL CONSEQUENCES
6.1 Environmental Analysis
The following sections describe the potential environmental consequences of the
restoration alternatives presented above as required in the CEQ regulations to implement NEPA.
Affected resources of the physical (e.g., soil, sediment, and water quality), biological (e.g.,
aquatic biota and forest vegetation), and cultural environment and human use (e.g., lost visitor
use) are explored for positive and negative impacts from two alternatives: 1) Natural recovery
and 2) Preferred alternative. The preferred alternative consists of five actions: a) Natural
recovery as a primary restoration action to restore forest and stream services; b) Primary
restoration to restore forest vegetation and soil services in the form of invasive vegetation control
in the footprint of the burn area; c) Compensatory restoration through an acquisition of land or a
conservation easement in the Obed WSR corridor to restore forest vegetation and soil services as
well as lost visitor use; d) Improvement of water quality to the Little Obed River, a headwater
stream of the Obed River, to restore stream services (i.e., Centennial Park watershed project);
and e) Compensatory restoration through AMD reclamation on Golliher Creek. Impacts are
organized into three categories: direct, indirect, and cumulative.
Direct – Direct impacts are those caused by the implementation of the alternative that occurs at
the same time and in the same place as the restoration action.
Indirect – Indirect impacts are those caused by implementing the alternative but that occur later
or in a different location from the restoration action.
Cumulative – Cumulative impacts are defined as “the impact on the environment which results
from the incremental impact of the action when added to other past, present, and reasonably
foreseeable future actions regardless of what agency (federal or non-federal) or person
undertakes such other actions” (40 CFR 1508.7).
The following terms are defined and used in the analysis of impacts, both negative and positive.
Negligible – Resources (e.g., biota, soil, water quality) would not be affected or the effects
would be below levels of detection. Visitor use in areas of restoration would not be affected.
Minor – Slight impacts to resources may be detected but are localized and short-term.
Alterations in aquatic or terrestrial communities (e.g., density and richness) would occur but
would be within the natural range of variability. Visitor use may be altered slightly as a result of
restoration alternatives but would be short-term.
Moderate – Impacts on resources are readily apparent. Changes in water, soil, or sediment
quality and alterations in aquatic or terrestrial communities may 1) occur over a large area but
are short in duration, or 2) be localized but persistent. Visitor use or public recreation may be
affected temporarily.
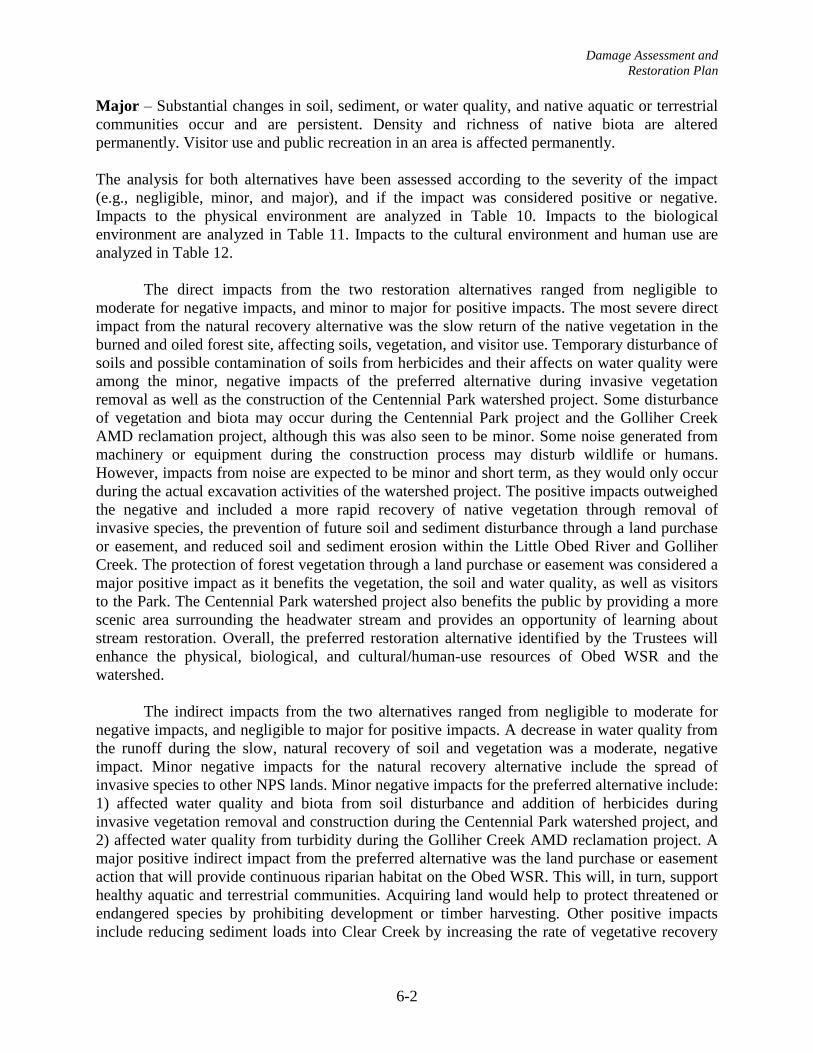
Damage Assessment and
Restoration Plan
6-2
Major – Substantial changes in soil, sediment, or water quality, and native aquatic or terrestrial
communities occur and are persistent. Density and richness of native biota are altered
permanently. Visitor use and public recreation in an area is affected permanently.
The analysis for both alternatives have been assessed according to the severity of the impact
(e.g., negligible, minor, and major), and if the impact was considered positive or negative.
Impacts to the physical environment are analyzed in Table 10. Impacts to the biological
environment are analyzed in Table 11. Impacts to the cultural environment and human use are
analyzed in Table 12.
The direct impacts from the two restoration alternatives ranged from negligible to
moderate for negative impacts, and minor to major for positive impacts. The most severe direct
impact from the natural recovery alternative was the slow return of the native vegetation in the
burned and oiled forest site, affecting soils, vegetation, and visitor use. Temporary disturbance of
soils and possible contamination of soils from herbicides and their affects on water quality were
among the minor, negative impacts of the preferred alternative during invasive vegetation
removal as well as the construction of the Centennial Park watershed project. Some disturbance
of vegetation and biota may occur during the Centennial Park project and the Golliher Creek
AMD reclamation project, although this was also seen to be minor. Some noise generated from
machinery or equipment during the construction process may disturb wildlife or humans.
However, impacts from noise are expected to be minor and short term, as they would only occur
during the actual excavation activities of the watershed project. The positive impacts outweighed
the negative and included a more rapid recovery of native vegetation through removal of
invasive species, the prevention of future soil and sediment disturbance through a land purchase
or easement, and reduced soil and sediment erosion within the Little Obed River and Golliher
Creek. The protection of forest vegetation through a land purchase or easement was considered a
major positive impact as it benefits the vegetation, the soil and water quality, as well as visitors
to the Park. The Centennial Park watershed project also benefits the public by providing a more
scenic area surrounding the headwater stream and provides an opportunity of learning about
stream restoration. Overall, the preferred restoration alternative identified by the Trustees will
enhance the physical, biological, and cultural/human-use resources of Obed WSR and the
watershed.
The indirect impacts from the two alternatives ranged from negligible to moderate for
negative impacts, and negligible to major for positive impacts. A decrease in water quality from
the runoff during the slow, natural recovery of soil and vegetation was a moderate, negative
impact. Minor negative impacts for the natural recovery alternative include the spread of
invasive species to other NPS lands. Minor negative impacts for the preferred alternative include:
1) affected water quality and biota from soil disturbance and addition of herbicides during
invasive vegetation removal and construction during the Centennial Park watershed project, and
2) affected water quality from turbidity during the Golliher Creek AMD reclamation project. A
major positive indirect impact from the preferred alternative was the land purchase or easement
action that will provide continuous riparian habitat on the Obed WSR. This will, in turn, support
healthy aquatic and terrestrial communities. Acquiring land would help to protect threatened or
endangered species by prohibiting development or timber harvesting. Other positive impacts
include reducing sediment loads into Clear Creek by increasing the rate of vegetative recovery
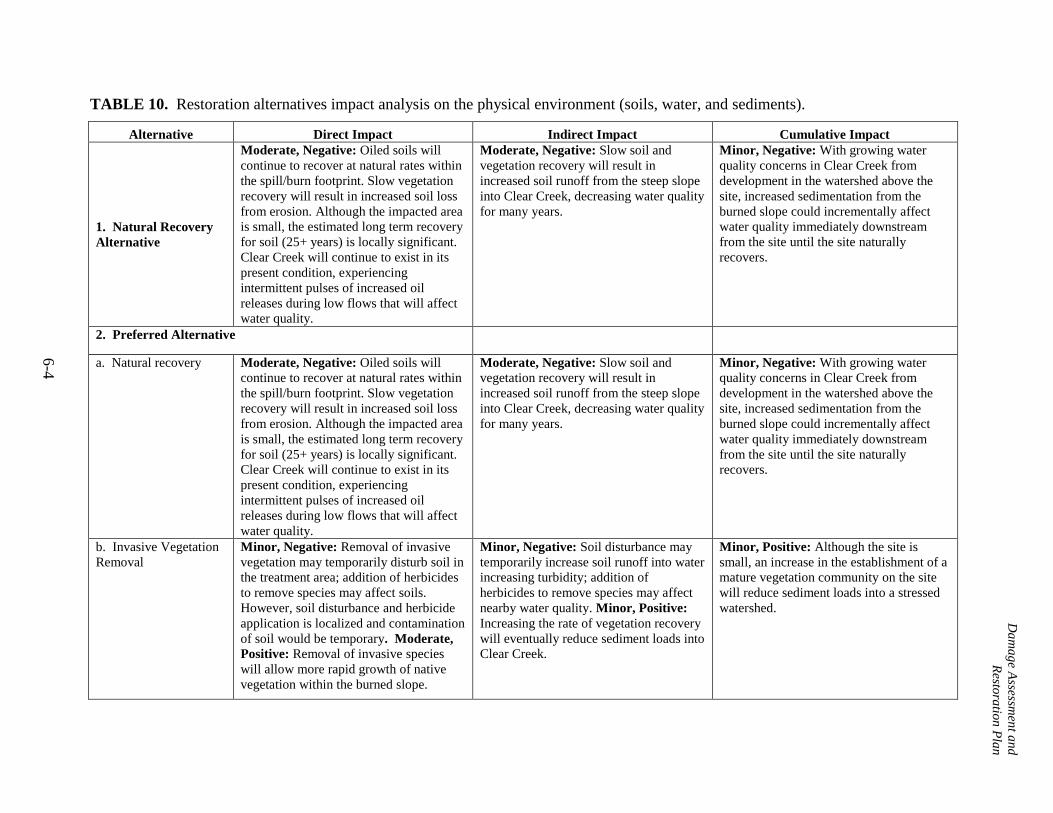
TABLE 10. Restoration alternatives impact analysis on the physical environment (soils, water, and sediments).
Alternative Direct Impact Indirect Impact Cumulative Impact
1. Natural Recovery
Alternative
Moderate, Negative: Oiled soils will
continue to recover at natural rates within
the spill/burn footprint. Slow vegetation
recovery will result in increased soil loss
from erosion. Although the impacted area
is small, the estimated long term recovery
for soil (25+ years) is locally significant.
Clear Creek will continue to exist in its
present condition, experiencing
intermittent pulses of increased oil
releases during low flows that will affect
water quality.
Moderate, Negative: Slow soil and
vegetation recovery will result in
increased soil runoff from the steep slope
into Clear Creek, decreasing water quality
for many years.
Minor, Negative: With growing water
quality concerns in Clear Creek from
development in the watershed above the
site, increased sedimentation from the
burned slope could incrementally affect
water quality immediately downstream
from the site until the site naturally
recovers.
2. Preferred Alternative
a. Natural recovery Moderate, Negative: Oiled soils will
continue to recover at natural rates within
the spill/burn footprint. Slow vegetation
recovery will result in increased soil loss
from erosion. Although the impacted area
is small, the estimated long term recovery
for soil (25+ years) is locally significant.
Clear Creek will continue to exist in its
present condition, experiencing
intermittent pulses of increased oil
releases during low flows that will affect
water quality.
Moderate, Negative: Slow soil and
vegetation recovery will result in
increased soil runoff from the steep slope
into Clear Creek, decreasing water quality
for many years.
Minor, Negative: With growing water
quality concerns in Clear Creek from
development in the watershed above the
site, increased sedimentation from the
burned slope could incrementally affect
water quality immediately downstream
from the site until the site naturally
recovers.
b. Invasive Vegetation
Removal
Minor, Negative: Removal of invasive
vegetation may temporarily disturb soil in
the treatment area; addition of herbicides
to remove species may affect soils.
However, soil disturbance and herbicide
application is localized and contamination
of soil would be temporary. Moderate,
Positive: Removal of invasive species
will allow more rapid growth of native
vegetation within the burned slope.
Minor, Negative: Soil disturbance may
temporarily increase soil runoff into water
increasing turbidity; addition of
herbicides to remove species may affect
nearby water quality. Minor, Positive:
Increasing the rate of vegetation recovery
will eventually reduce sediment loads into
Clear Creek.
Minor, Positive: Although the site is
small, an increase in the establishment of a
mature vegetation community on the site
will reduce sediment loads into a stressed
watershed.
6-4
Da
ma
ge A
ssessmen
t an
d
Resto
ratio
n P
lan

TABLE 10. Cont.
Alternative Direct Impact Indirect Impact Cumulative Impact
c. Land
Purchase/Conservation
Easement
Major, Positive: Will prevent
development of protected lands and in
turn, will prevent future soil and sediment
disturbances. Such development is very
likely and would include timber removal,
soil disruptions, and construction of
homes and other structures.
Moderate, Positive: Will prevent future
soil and water quality degradation
associated with runoff from development
along the riparian zone in the Obed WSR
corridor.
Moderate, Positive: Will prevent future
soil and water quality degradation
associated with runoff from development
along the riparian zone in the Obed WSR
corridor.
d. Centennial Park
Watershed Project
Minor, Negative: Temporary impacts to
water quality in the Little Obed River
within the project site from the
application of herbicides, however, they
will be used only when manual removal
will cause significant soil loss. Removing
invasive vegetation and stabilizing banks
of the river may cause soil disturbance
and some temporary erosion, even when
implementing control practices.
Moderate, Positive: Stabilized stream
banks, water gardens, and riparian
vegetation will significantly reduce
sediment and soil erosion in the project
area.
Minor, Negative: Temporary impacts to
water quality in the Little Obed River
downstream from the application of
herbicides; however, the amounts used
will be very small and have minor, local
affects. Temporary increases in turbidity
will affect water quality downstream;
however impacts are likely to be minor
because of the small amount of area to be
disturbed at any one time. Moderate,
Positive: Stabilized stream banks, water
gardens, and riparian vegetation will
significantly reduce sediment and soil
erosion in the downstream sections of the
Little Obed River.
Moderate, Positive: Stabilized stream
banks, water gardens, and riparian
vegetation will significantly reduce
sediment and soil erosion both in the
project area and downstream in the Little
Obed River. Public outreach and education
during project implementation and as a
demonstration site in a highly public area
will greatly expand on the cumulative
benefits as the public learns about the
value of stream restoration.
e. Golliher Creek AMD
Reclamation Project
Minor, Negative: Temporary impacts to
water quality in Golliher Creek during
bank stabilization; soil disturbance and
temporary erosion may affect Creek
waters, although impacts would be short-
term. Moderate, Positive: Grading,
stabilization, and revegetation of the land
surface will reduce sediment runoff into
the creek and provide better upland
habitat.
Minor, Negative: Temporary increase in
turbidity will affect water quality
downstream; however impacts are likely
to be minor because of the small area to
be disturbed during implementation.
Major, Positive: Removal of acidic
materials will return pH in waters to
natural, pre-AMD levels.
Major, Positive: The AMD project on the
northeast side of Golliher Creek will be
completed by 2008, restoring the pH to
half of pre-AMD levels. Completing the
southwest side of Golliher Creek will
complete the restoration.
6-5
Da
ma
ge A
ssessmen
t an
d
Resto
ratio
n P
lan
TABLE 11. Restoration alternatives impact analysis on the biological environment.
Alternative Direct Impact Indirect Impact Cumulative Impact
1. Natural Recovery
Alternative
Moderate, Negative: Native vegetation
will be slow to recover and will have to
compete with invasive vegetation for space
and nutrients.
Minor, Negative: Allowing the growth
of invasive species in the burned area
may permit the possible spread of
invasive species into other areas within
the Park.
Negligible: No cumulative impacts will
be observed on biota or forest vegetation
because the burned area represents such a
small area within the Obed WSR corridor.
2. Preferred Alternative
a. Natural recovery Moderate, Negative: Native vegetation
will be slow to recover and will have to
compete with invasive vegetation for space
and nutrients.
Minor, Negative: Allowing the growth
of invasive species in the burned area
may permit the possible spread of
invasive species into other areas within
the Park.
Negligible: No cumulative impacts will
be observed on biota or forest vegetation
because the burned area represents such a
small area within the Obed WSR corridor.
b. Invasive Vegetation
Removal
Moderate, Positive: Quicker return of
native species to the burned slope will
benefit all species using this habitat.
Minor, Negative: Disturbance of soils
during invasive species removal may
cause increased turbidity of Clear Creek
during runoff events; this may indirectly
affect biota by smothering habitats used
by biota. Herbicide used on invasive
vegetation may cause adverse impacts on
aquatic biota if it enters Clear Creek;
however the herbicide used is of low
toxicity to fish and has a short half-life.
Minor, Positive: Increasing the rate of
vegetation recovery will eventually
reduce sediment loads and potential
impacts to aquatic biota in Clear Creek.
Moderate, Positive: Although the
impacted site is small, it presents a gap in
the continuity of the riparian buffer in this
area. Quicker re-establishment of the
vegetation will close this gap sooner.
c. Land
Purchase/Conservation
Easement
Major, Positive: Acquiring land protects
the forest vegetation from timber
harvesting or development.
Major, Positive: Continuous riparian
habitat on the Obed WSR will support
healthy aquatic communities; continuous
forested habitat will support terrestrial
biota (e.g., threatened and endangered
species and native tree species).
Moderate, Positive: Prevention of
development will prevent fragmentation
of the riparian corridor along the Obed
WSR.
Da
ma
ge A
ssessmen
t an
d
Resto
ratio
n P
lan
6-6

TABLE 11. Cont.
Alternative Direct Impact Indirect Impact Cumulative Impact
d. Centennial Park
watershed Project
Minor, Negative: Some vegetation and
biota may be disturbed during the
streambank stabilization and construction
of the rain and bog gardens. However, the
vegetation and biota are already of low
quality in this highly disturbed site.
Minor, Negative: Stabilizing
streambanks and constructing rain/bog
gardens may cause soil disturbance and
some initial erosion which may indirectly
affect downstream aquatic biota via
smothering of habitats; however the
construction phase should be short-term
(3-4 months). Moderate, Positive:
Sediments on the substrate of the Little
Obed River are silt and do not support a
healthy population of native biota.
Restoring the river will return the
substrate to the more natural habitat of
sediments that will support the aquatic
community. Stabilizing the stream banks
and removal of invasive species will also
support native plants and associated biota.
Moderate, Positive: Stabilized stream
banks, water gardens, and riparian
vegetation will significantly improve
water quality and associated biota in the
project area and downstream in the Little
Obed River. Public outreach and
education during project implementation
and as a demonstration site in a highly
public area will greatly expand on the
cumulative benefits as the public learns
about the value of stream restoration.
e. Golliher Creek
AMD Reclamation
Project
Minor, Negative: Some vegetation and
biota may be disturbed during stabilization
and grading of uplands. However, these
activities will provide a more natural
upland habitat for vegetation and biota to
inhabit.
Major, Positive: Treatment of AMD
discharges will allow the return of a fully
supporting benthic community in Golliher
Creek. Return of native fish species to the
creek will also occur.
Major, Positive: Completing the
southwest side of Golliher Creek will
complete the stream restoration, with the
northeast side having been completed in
2008. The cumulative impact of the
restoration of both riverbanks is the return
of the benthic community and native fish
species.
6-7
Da
ma
ge A
ssessmen
t an
d
Resto
ratio
n P
lan

TABLE 12. Restoration alternatives impact analysis on the cultural environment and human use.
Alternative Direct Impact Indirect Impact Cumulative Impact
1. Natural Recovery
Alternative
Minor, Negative: The slow rate of natural
re-vegetation in the burned area and oil
sheens on the water surface during low
flow periods will be observable by the
public who boat along this part of the Obed
WSR.
There are no cultural resources in this area.
Negligible: No indirect impacts are
expected on visitor use.
Negligible: No cumulative impacts are
expected on visitor use.
2. Preferred Alternative
a. Natural Recovery Minor, Negative: The slow rate of natural
re-vegetation in the burned area and oil
sheens on the water surface during low
flow periods will be observable by the
public who boat along this part of the Obed
WSR.
There are no cultural resources in this area.
Negligible: No indirect impacts are
expected on visitor use.
Negligible: No cumulative impacts are
expected on visitor use.
b. Invasive Vegetation
Removal
Moderate, Positive: Allowing for the more
rapid growth of native vegetation by
removing invasive vegetation will provide
natural scenic views along Clear Creek for
visitors who recreate along the creek.
There are no cultural resources in this area.
Negligible: No indirect impacts are
expected on visitor use.
Negligible: No cumulative impacts are
expected on visitor use.
c. Land
Purchase/Conservation
Easement
Major, Positive: Land that is prevented
from future development is beneficial for
visitors of the Park as the wildlife, native
plant and tree species, and the undeveloped
primitive character of the forest along the
Obed WSR provides a unique natural
setting for visitors to enjoy; one of the
tracts of land being considered is a put-in
access point along the river, an important
site for recreational boaters.
Any cultural resources would also be
protected.
Negligible: No indirect impacts are
expected on visitor use or cultural
resources
Negligible: No cumulative impacts are
expected on visitor use or cultural
resources.
Da
ma
ge A
ssessmen
t an
d
Resto
ratio
n P
lan
6-8

TABLE 12. Cont.
Alternative Direct Impact Indirect Impact Cumulative Impact
d. Centennial Park
Watershed Project
Minor, Negative: Public use of the area
being restored may be prohibited during the
implementation and construction of the
project. Some noise generated from
machinery or equipment during the
construction process may disturb visitors to
Centennial Park. However, impacts from
noise are expected to be minor and short
term, as they would only occur during the
actual excavation activities of the
watershed project. Moderate, Positive:
Centennial Park is heavily used and the
restoration project will provide informative
and educational opportunities for the public
to enjoy.
Minor, Positive: The projects at
Centennial Park will demonstrate
techniques and designs that can be used
in other projects throughout the
watershed.
Minor, Positive: The projects at
Centennial Park will demonstrate
techniques and designs that can be used
in other projects throughout the
watershed.
e. Golliher Creek AMD
Reclamation Project
Negligible: No direct impacts are expected
on visitor use. There are no cultural
resources in this area.
Minor, Positive: Public use of the river
may increase with the return of some
recreational fish species (i.e.,
muskellunge).
Minor, Positive: The return of rivers to
their historical environments has small
but cumulative impacts on the larger
watershed. The restoration of Golliher
Creek provides a small step to
improving the quality of the Crab
Orchard Creek watershed that was once
used for fishing and recreating.
6-9
Da
ma
ge A
ssessmen
t an
d
Resto
ratio
n P
lan

Damage Assessment and
Restoration Plan
6-10
after invasive vegetation removal, prevention of future soil and water quality degradation along
the Obed WSR through a land purchase or easement, and the reduction of sediment and soil
erosion into the Little Obed River and Golliher Creek. Restoring the Little Obed River will have
an indirect positive impact on the aquatic communities of the river by changing the substrate of
the river from the current unhealthy silt to a more healthy sediment substrate. Reclamation of the
AMD site along Golliher Creek will have an indirect positive impact on the benthic and fish
communities by decreasing the acidity levels in the creek waters, promoting the return of native
species.
Cumulative impacts ranged from negligible to minor for negative impacts and negligible
to major for positive impacts. The only negative cumulative impact was on water quality when
choosing the natural recovery alternative. The incremental affect of sedimentation from the
burned slope into Clear Creek that is already affected by development upstream of the site was a
concern. The incremental affect on water quality would last until the site recovered. Positive
impacts from the preferred alternative include: 1) reduction of sediment loads and prevention of
future water quality issues through more rapid establishment of a native mature community, 2)
continuity of the riparian corridor with the land purchase or easement along the Obed WSR, 3)
healthy water quality and biota downstream of the Centennial Park watershed site from re-
stabilized banks and bog and rain gardens, and 4) full restoration of Golliher Creek with the
reclamation of the southwest riverbanks in addition to the northeast riverbanks.
For actions within the Park boundaries, impairment determinations on NPS resources
must be made. An impairment, defined in the Organic Act and the General Authorities Act, is
“…an impact that, in the professional judgment of the responsible NPS manager, would harm the
integrity of park resources or values, including the opportunities that otherwise would be present
for the enjoyment of those resources or values” (NPS Management Policies, Section 1.4). The
Trustees determined that no impairment of NPS resources would occur from the removal of
invasive species or through land acquisition, the only two actions of the preferred alternative
occurring within Park lands. NPS regularly removes invasive species in other areas within the
park boundary and these actions do not harm the integrity of park resources or values. The
Trustees agreed that acquiring land would help to protect threatened or endangered species by
prohibiting development or timber harvesting to occur.
As was stated above (5.6 Agency Consultation), the preferred alternatives are “not likely
to adversely affect” any federally threatened or endangered species listed within the state of
Tennessee. The Centennial Park watershed project site does not provide suitable habitat to the
listed species that occur in Cumberland County, Tennessee. There is a possibility of three listed
species occurring within Park boundaries (i.e. purple bean, spotfin chub, and Indiana bat)
however, the preferred alternative actions listed for Park lands are not likely to negatively impact
these species.
6.2 Environmentally Preferred Alternatives
The environmentally preferred alternative is the alternative that will promote the national
environmental policy expressed in NEPA (Sec. 101 (b)). This includes alternatives that:
Damage Assessment and
Restoration Plan
6-11
Fulfill the responsibilities of each generation as trustee of the environment for succeeding
generations.
Ensure for all Americans safe, healthful, productive, and aesthetically and culturally
pleasing surroundings.
Attain the widest range of beneficial uses of the environment without degradation, risk of
health or safety, or other undesirable and unintended consequences.
Preserve important historic, cultural, and natural aspects of our national heritage and
maintain, wherever possible, an environment that supports diversity and variety of
individual choice.
Achieve a balance between population and resource use that will permit high standards of
living and a wide sharing of life’s amenities.
Enhance the quality of renewable resources and approach the maximum attainable
recycling of depletable resources.
The environmentally preferred alternative, based on the above criteria, are natural
recovery, invasive species removal, land acquisition, the Centennial Park watershed project, and
the Golliher Creek AMD reclamation project. Invasive species removal on the burned slope on
Clear Creek ensures that a more natural setting with native vegetation will occur more quickly
than if the natural recovery alternative (or no action alternative) was chosen. A more natural
setting along Clear Creek is aesthetically pleasing to Park visitors and preserves the important
natural aspects along the Obed WSR corridor.
Land acquisition by purchase or easement along the Obed WSR will provide for a
continuous corridor along the Obed WSR of which the Park can protect for future generations to
enjoy. The sites chosen for acquisition have a wide range of benefits (e.g., river access, scenic
value, and endangered species habitat), and there is no risk of degradation or other undesirable
consequences to the site that is acquired.
The Centennial Park watershed project will control and filter non-point source runoff,
stablize the streambanks, and improve the riparian habitat, which will improve water quality
within the Obed River watershed. This project has broader benefits because of the community
participation and public outreach components. The Golliher Creek project, only to be
implemented if the Centennial Park watershed project cannot be accomplished, would restore the
creek to more natural conditions with the removal of AMD. The project will improve water
quality and support native habitat and species, returning the waters downstream of the AMD site
to their historic uses.

Damage Assessment and
Restoration Plan
7-1
7.0 SUMMARY
7.1 Injury Summary
Three main categories of injury were determined during the Preassessment and
Restoration Planning Phases of the Obed WSR NRDA: forestry resources including vegetation
and soils, stream services, and lost visitor use. Studies have been completed since the time of the
spill (2002) to determine the degree and extent of the injury for the three injury categories.
Using the HEA approach, the injury to forestry resources was determined to be 24.3
DSAYs for the 0.74 acres of injured forest vegetation and soils. The forest was estimated to
return to pre-spill biomass standing stock in approximately 172 years.
The stream injury was based on several resource including benthic algae, fish, benthic
macroinvertebrates, mussels, sediment quality, surface water quality, riparian vegetation, and
groundwater/geologic sources. Three recovery curves were used to quantify the injury to the
three stream reaches based on their degree and duration of exposure to oil. The continued chronic
release of oil from the site through 2007 was an important factor affecting the recovery rates.
The health of benthic macroinvertebrates was an important consideration in quantifying the lost
stream services. The injury for the 6.29 acres of injured stream services in Clear and White
Creeks was estimated to be 26.1 DSAYs.
The injury to visitor use was estimated using a “value-to-cost” scaling approach based on
the lost fishing and paddling opportunities on the section of Clear Creek that was closed to the
public. The dollar amount of this loss was estimated to be $56,446.
7.2 Restoration Summary and Timeline
Table 13 summarizes scaling and cost of the preferred restoration alternative actions
(excluding natural recovery) for the Obed WSR oil spill incident. The Trustees selected land
acquisition/conservation and invasive vegetation control as the preferred restoration action to
compensate for the forest injury. The invasive vegetation control will start immediately upon
receipt of funds and continue for 25 years. The land acquisition project will be implemented by
the NPS within 12 months after receipt of funds. Two tracts with willing sellers have already
been identified as part of the Land Protection Plan for the Obed WSR. It normally takes 12-15
months for contract closure once the funds are available.
Land acquisition was also chosen to compensate for lost visitor use in the Obed WSR. It
will follow the same schedule as discussed above.
Restoration activities in the headwaters of the Little Obed River in Centennial Park,
Crossville, TN will restore lost stream services within the affected watershed. The removal of the
invasive species (two week effort) and the restoration of the streambank would occur in
conjunction with the relocation and upgrade of the city of Crossville’s sewer lines and therefore
would not be implemented before July 1, 2008 (when the city’s FY2009 budget is approved).
The construction of the rain gardens (approximately a 3 month effort) could begin any time after

Damage Assessment and
Restoration Plan
7-2
receipt of restoration funds, during which a contract would be negotiated with the OWCA for
implementation. The overall project is estimated to take 2-3 years for design and construction.
Monitoring will continue for five years. The Golliher Creek AMD restoration project was not
included in Table 13 as it will only be implemented if the Centennial Park watershed project is
unable to occur.
TABLE 13. Summary of injuries, preferred restoration actions, and restoration costs for the
Obed WSR oil spill.
Injured
Resource
Preferred
Restoration Actions Scale of Restoration
Restoration Costs
Forest
Vegetation
and Soils
Primary Restoration:
Invasive Vegetation
Control
Compensatory
Restoration: Land
Acquistion/
Conservation
Removal of invasive species on the
burned tract for 25 years.
Acquistion of 2.3 acres. $28,772
Stream
Services
Centennial Park,
streambank
restoration, invasive
vegetation removal,
creation of a bog
garden and rain
gardens
Restoration of 1,660 ft of
streambank.
Removal of invasive species along
750 ft of stream channel.
Construction of 2.12 acre bog garden
Construction of 1.4 acres of rain
gardens
$460,689
Lost Visitor
Use
Land Acquistion/
Conservation
Acquistion of 16.1 acres. $56,446
Oversight and Administration $151,835
Total $697,742
Damage Assessment and
Restoration Plan
8-1
8.0 REFERENCES CITED
Adams, S.M., M.S. Greely, and M.J. Peterson. 2003. Assessment of exposure and injury to fish from
oil discharges into Clear Creek. Proposal prepared by Environmental Sciences Division, Oak
Ridge National Laboratory, Oak Ridge, TN. Prepared for the Clear Creek Oil Spill NRDA
Trustee Council. 21 pp.
Adams, S.M., M.S. Greeley, and M.J. Peterson. 2006. Assessment of exposure and injury to fish
from oil discharges into Clear Creek. Prepared by Environmental Sciences Division, Oak
Ridge National Laboratory, Oak Ridge, TN. Prepared under contract to the National Park
Service, 46 pp.
Ahlstedt, S.A. and S. Bakaletz, 2005. Assessment of freshwater mussel populations in Clear
Creek, Tennessee (Emory-Obed River System) following an oil well fire and resulting spill
(2005). Prepared for the Obed Wild and Scenic River, National Park Service, Wartburg, TN,
13 pp.
Arnwine, D. 2002. Quality System Standard Operating Procedure for Macroinvertebrate Stream
Surveys. Division of Water Pollution Control, Department of Environment and Conservation,
State of Tennessee.
Burr, J. 2006. Benthic Results – October 13, 2006. Email to the Trustee Council on 7 December
2006. Tennessee Department of Environment and Conservation.
Burr, J. 2007. Memo to the Trustee Council. Tennessee Department of Environment and
Conservation.
Burr, J., pers. comm., 2007. Tennessee Department of Environment and Conservation – Water
Pollution Control, Knoxville, Tennessee. Email: June 13, 2007.
Campbell, P., pers. comm.., 2007a. National Park Service, Wartburg, Tennessee. Email: January
16, 2008.
Campbell, P., pers. comm.., 2007b. National Park Service, Wartburg, Tennessee. Within email
from A. Mathis: June 13, 2007.
Carline, R.F., M.C. Walsh, and A.M. Smith. 2004. Responses of streams to restoration of
intensively grazed riparian areas: Spring Creek, West Branch Susquehanna River Watershed.
Chesapeake Bay Program, U.S. EPA. 100 pp.
Cooke, S.B. 2006. Quantification of injury to aquatic resources resulting from the Pryor Oil Spill
and Fire, Obed Wild and Scenic River. Prepared for the Obed Wild and Scenic River,
National Park Service, Wartberg, TN, 34 pp + appendix.
DesJean, Tom. 2002. Report of section 106 cultural resources evaluations for emergency oil spill
containment on White Creek. National Park Service. 11 pp.
Dillaha, T.A., R.B. Reneau, S. Mostaghimi, and D. Lee. 1989. Vegetative filter strips for
agricultural nonpoint source pollution control. Transactions of ASAE, 32 (2): 513-519.
Eagle, T. pers. comm., 2007. Tennessee Department of Environment and Conservation – Water
Pollution Control, Knoxville, Tennessee. Email: May 22, 2007.

Damage Assessment and
Restoration Plan
8-2
Fairchild, J.F., B.C. Poulton, T.W. May, and S.M. Miller. 1999. Evaluation of the recovery of
fish and invertebrate communities following reclamation of a watershed impacted by an
abandoned coal surface mine. U.S. Geological Survey Toxic Substances Hydrology
Program--Proceedings of the Technical Meeting, Charleston, South Carolina, March 8-12,
1999. Vol 1, Section D: 261-268.
Goodrich-Mahoney, J.W. and P. Ziemkiewicz. 2006. Demonstrating a market-based approach to
the reclamation of mined lands in West Virginia. Quarterly Report: Oct 1, 2004 – Dec 30,
2004. National Mine Land Reclamation Center, Morgantown, Virginia. 14 pp.
Gregg, D. pers. comm., 2007a. Obed Watershed Community Association, Crossville, Tennessee.
Email: September 6, 2007.
Gregg, D. pers. comm., 2007b. Obed Watershed Community Association, Crossville, Tennessee.
Email: April 29, 2007.
Helton, N. pers. comm., 2007. National Park Service, Wartburg, Tennessee. Email: September
10, 2007.
Henley, W.F. 2007. Tissue Evaluations for Determination of Sublethal Effects of Oil
Contamination in Freshwater Mussels from Clear Creek, Tennessee. Report prepared by
Freshwater Mollusk Conservation Center, Department of Fisheries and Wildlife Sciences,
Virginia Tech, Blacksburg, VA. Submitted to the National Park Service. 34 pp.
Hudson, M., pers. comm., 2007a. National Park Service, Wartburg, Tennessee. Within email
from A. Mathis: January 8, 2007.
Hudson, M., pers. comm., 2007b. National Park Service, Wartburg, Tennessee. Email: June 15,
2007.
Industrial Economics, Inc. 2003a. Documentation of Visitor Impacts from the Howard/White Unit
No. 1 Oil Spill. Contract No. 1443CX2605-98-004, Task Order T2310025013 Ephemeral Data
Collection for Oil Spill NRDA at Obed WSR, TN. Prepared under contract to Foster Wheeler
Environmental Corporation; MOA014469 Task 19. 8 pp.
Industrial Economics, Inc. 2003b. Documentation of Visitor Use of Obed Wild and Scenic River.
Contract No. 1443CX2605-98-004, Task Order T2310025013 Ephemeral Data Collection for
Oil Spill NRDA at Obed WSR, TN. Prepared under contract to Foster Wheeler Environmental
Corporation; MOA014469 Task 19. 11 pp. + appendices.
Mann, D., pers. comm., 2006. Tennessee Department of Environment and Conservation – Water
Pollution Control, Knoxville, Tennessee. Email: December 14, 2006.
Mathis, A., pers. comm., 2007. National Park Service, Wartburg, Tennessee. Email: January 8,
2007.
Mayfield, M.W. 1984. Variations in streamflow among watersheds of the Cumberland Plateau,
Tennessee. Ph.D. Dissertation, UT Knoxville, Knoxville, Tennessee.
NPS (National Park Service). 1992. Obed Wild and Scenic River- Land Protection Plan. Department
of the Interior. 62 pp.
NPS. 1994. Obed Wild and Scenic River - General Management Plan. Department of the Interior.
161 pp.
Damage Assessment and
Restoration Plan
8-3
NPS. 2003. Damage Assessment and Restoration Handbook. Environmental Quality Division,
Environmental Response, Damage Assessment, and Restoration Branch, National Park Service,
Department of the Interior, Washington, DC. 61 pp. + appendices.
NPS. 2006a. Howard/White #1 Site Visit, 6/16/06. Memo from Amy Mathis, NPS to Steve
Spurlin, USEPA.
NPS. 2006b. Howard/White #1 Site Visit, 7/3/06. Memo from Amy Mathis, NPS to Steve
Spurlin, USEPA.
NPS. 2006c. Howard/White #1 Site Visit, 7/17/06. Memo from Amy Mathis, NPS to Steve
Spurlin, USEPA.
NPS. 2006d. Howard/White #1 Site Visit, 7/31/06. Memo from Amy Mathis, NPS to Steve
Spurlin, USEPA.
NPS. 2006e. Howard/White #1 Site Visit, 8/16/06. Memo from Amy Mathis, NPS to Steve
Spurlin, USEPA.
NPS. 2006f. Howard/White #1 Site Visit, 9/8/06. Memo from Amy Mathis, NPS to Steve
Spurlin, USEPA.
NPS. 2006g. Howard/White #1 Site Visit, 10/6/06. Memo from Amy Mathis, NPS to Steve
Spurlin, USEPA.
NPS. 2006h. Howard/White #1 Site Visit, 11/29/06. Memo from Amy Mathis, NPS to Steve
Spurlin, USEPA.
NPS. 2006i. Lost Visitor Use Services Howard/White No. 1 Oil Spill at the Obed Wild and
Scenic River. Prepared by Bruce Peacock, NPS. 8 pp + attachments.
NPS. 2007a. Howard/White #1 Site Visit, 6/15/07. Memo from Amy Mathis, NPS to Steve
Spurlin, USEPA.
NPS. 2007b. Howard/White #1 Site Visit, 7/16/07. Memo from Amy Mathis, NPS to Steve
Spurlin, USEPA.
Ohio EPA. 2003. Fact Sheet: The importance and benefits of primary headwater streams. Division of
Surface Water, Ohio EPA, Columbus, OH. 1 pp.
Pennington and Associates, Inc. 2003. A survey of the periphyton community, Clear Creek,
Tennessee. Report submitted to Obed Wild and Scenic River, National Park Service, 23 pp.
Research Planning, Inc. 2003. Preassessment Phase Report for the Howard/White Unit No. 1 Oil
Spill, Natural Resource Damage Assessment. Prepared for the National Park Service, Denver,
CO. 47 pp + appendices.
Schmalzer, P.A., T.S. Patrick, and H.R. DeSelm. 1985. Vascular flora of the Obed Wild and
Scenic River, Tennessee. Castanea 50:71-88.
TDEC. 2001. Total Maximum Daily Load (TMDL) For pH in Crab Orchard Creek Located in
The Emory River Watershed (HUC 06010208) Cumberland and Morgan County, Tennessee,
September 21, 2000. State of Tennessee, Department of Environment and Conservation,
Division of Water Pollution Control.
Damage Assessment and
Restoration Plan
8-4
TDEC. 2006. Proposed Final Version Year 2006 303(d) List, August, 2006. State of Tennessee,
Department of Environment and Conservation, Division of Water Pollution Control.
TVA. 2004. Crab Orchard Creek Watershed Restoration Plan. Tennessee Valley Authority,
Tennessee Department of Environment and Conservation, Emory River Watershed
Association. 34 pp.
Virginia Department of Forestry (VA Dept of Forestry). 1997. Herbicide Fact Sheet.
Charlottesville, VA.
Washington State Department of Transportation (WA DOT). 2007. Glyphosate, Roadside
Vegetation Management Herbicide Fact Sheet. Oregon State University and Intertox, Inc. 4
pp.
Walker, G., E. Parisher, P. Smith, D. Whitlock, D.Kramer, U. Matthes, and L. Morefield. 2004.
Characterization of Plant Community Structure and Abiotic Conditions on Climbed and
Unclimbed Cliff Faces in the Obed River Gorge. Report to the NPS, Obed Wild and Scenic
River prepared by the Department of Biology, Appalachian State University. Available at:
http://www.nps.gov/obed/parkmgmt/index.htm. Accessed on 4 July 2007.
Webster, C.R. and M.A. Jenkins. 2006. The impact of an oil spill and subsequent burning on the
vegetation of Obed Wild and Scenic River, Tennessee: Estimating the time interval required
for recovery of stand biomass. Prepared for the Obed Wild and Scenic River, National Park
Service, Wartberg, TN, 13 pp.
Ziemkiewicz, P.F., J.G. Skousen, and J. Simmons. 2003. Long-term Performance of Passive
Acid Mine Drainage Systems. Mine Water and the Environment. Volume 22: pp. 188-129.

Damage Assessment and
Restoration Plan
A-1
APPENDIX A
Forest Injury Curve Inputs and DSAYs
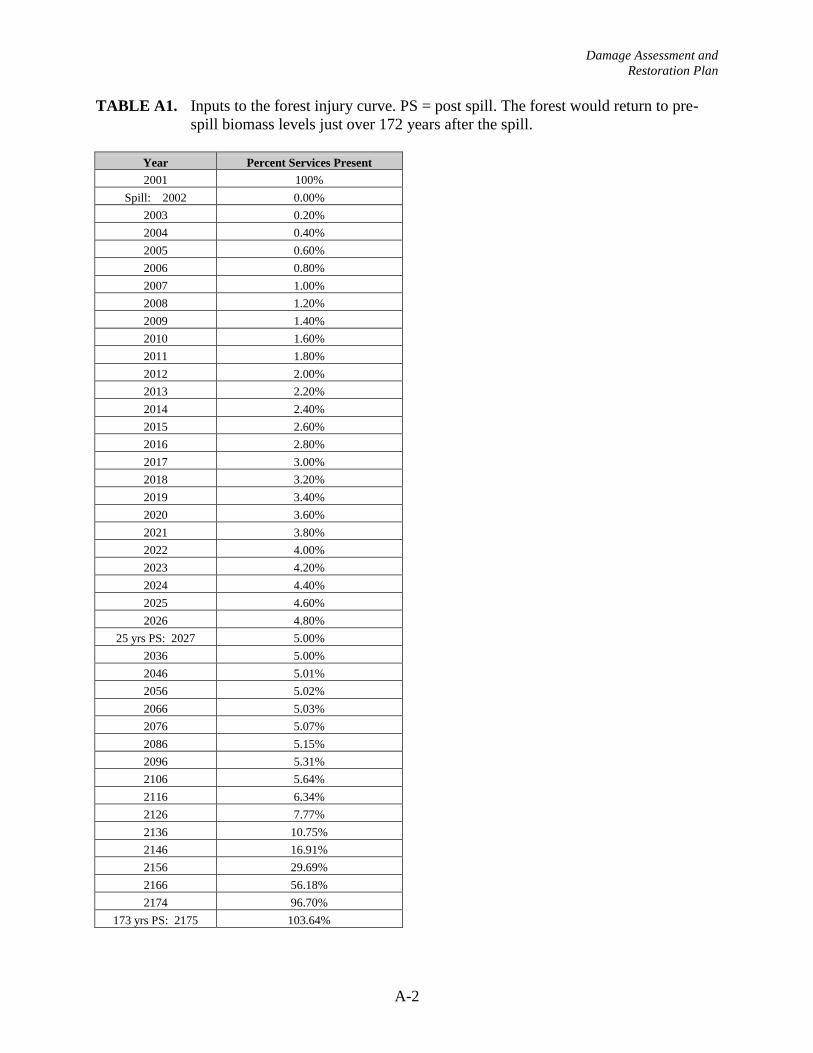
Damage Assessment and
Restoration Plan
A-2
TABLE A1. Inputs to the forest injury curve. PS = post spill. The forest would return to pre-
spill biomass levels just over 172 years after the spill.
Year Percent Services Present
2001 100%
Spill: 2002 0.00%
2003 0.20%
2004 0.40%
2005 0.60%
2006 0.80%
2007 1.00%
2008 1.20%
2009 1.40%
2010 1.60%
2011 1.80%
2012 2.00%
2013 2.20%
2014 2.40%
2015 2.60%
2016 2.80%
2017 3.00%
2018 3.20%
2019 3.40%
2020 3.60%
2021 3.80%
2022 4.00%
2023 4.20%
2024 4.40%
2025 4.60%
2026 4.80%
25 yrs PS: 2027 5.00%
2036 5.00%
2046 5.01%
2056 5.02%
2066 5.03%
2076 5.07%
2086 5.15%
2096 5.31%
2106 5.64%
2116 6.34%
2126 7.77%
2136 10.75%
2146 16.91%
2156 29.69%
2166 56.18%
2174 96.70%
173 yrs PS: 2175 103.64%

Damage Assessment and
Restoration Plan
A-3
TABLE A2. Injury (DSAYs) calculated for 0.74 acres of impacted forest services.
Years Post Spill Year
Percent
Biomass
Level (start
of year)
Percent
Biomass
Loss (start
of year)
Average
Percent
Biomass
Loss
Discount
Factor
Discounted
Average
Biomass
Lost
Discounted
Acre Years
Lost
0 2002 0.00% 100.00% 99.90% 1.000 99.90% 0.740
1 2003 0.20% 99.80% 99.70% 0.971 96.80% 0.717
2 2004 0.40% 99.60% 99.50% 0.943 93.79% 0.695
3 2005 0.60% 99.40% 99.30% 0.915 90.87% 0.673
4 2006 0.80% 99.20% 99.10% 0.888 88.05% 0.652
5 2007 1.00% 99.00% 98.90% 0.863 85.31% 0.632
6 2008 1.20% 98.80% 98.70% 0.837 82.66% 0.613
7 2009 1.40% 98.60% 98.50% 0.813 80.09% 0.593
8 2010 1.60% 98.40% 98.30% 0.789 77.60% 0.575
9 2011 1.80% 98.20% 98.10% 0.766 75.19% 0.557
10 2012 2.00% 98.00% 97.90% 0.744 72.85% 0.540
11 2013 2.20% 97.80% 97.70% 0.722 70.58% 0.523
12 2014 2.40% 97.60% 97.50% 0.701 68.38% 0.507
13 2015 2.60% 97.40% 97.30% 0.681 66.26% 0.491
14 2016 2.80% 97.20% 97.10% 0.661 64.19% 0.476
15 2017 3.00% 97.00% 96.90% 0.642 62.20% 0.461
16 2018 3.20% 96.80% 96.70% 0.623 60.26% 0.447
17 2019 3.40% 96.60% 96.50% 0.605 58.38% 0.433
18 2020 3.60% 96.40% 96.30% 0.587 56.57% 0.419
19 2021 3.80% 96.20% 96.10% 0.570 54.80% 0.406
20 2022 4.00% 96.00% 95.90% 0.554 53.10% 0.393
21 2023 4.20% 95.80% 95.70% 0.538 51.44% 0.381
22 2024 4.40% 95.60% 95.50% 0.522 49.84% 0.369
23 2025 4.60% 95.40% 95.30% 0.507 48.29% 0.358
24 2026 4.80% 95.20% 95.10% 0.492 46.78% 0.347
25 2027 5.00% 95.00% 95.00% 0.478 45.37% 0.336
26 2028 5.00% 95.00% 95.00% 0.464 44.05% 0.326
27 2029 5.00% 95.00% 95.00% 0.450 42.77% 0.317
28 2030 5.00% 95.00% 95.00% 0.437 41.52% 0.308
29 2031 5.00% 95.00% 95.00% 0.424 40.31% 0.299
30 2032 5.00% 95.00% 95.00% 0.412 39.14% 0.290
31 2033 5.00% 95.00% 95.00% 0.400 38.00% 0.282
32 2034 5.00% 95.00% 95.00% 0.388 36.89% 0.273
33 2035 5.00% 95.00% 95.00% 0.377 35.82% 0.265
34 2036 5.00% 95.00% 95.00% 0.366 34.77% 0.258
35 2037 5.00% 95.00% 95.00% 0.355 33.76% 0.250
36 2038 5.00% 95.00% 95.00% 0.345 32.78% 0.243
37 2039 5.00% 95.00% 94.99% 0.335 31.82% 0.236
38 2040 5.01% 94.99% 94.99% 0.325 30.89% 0.229
39 2041 5.01% 94.99% 94.99% 0.316 29.99% 0.222
40 2042 5.01% 94.99% 94.99% 0.307 29.12% 0.216
41 2043 5.01% 94.99% 94.99% 0.298 28.27% 0.210

Damage Assessment and
Restoration Plan
A-4
TABLE A2. Cont.
Years Post Spill Year
Percent
Biomass
Level (start
of year)
Percent
Biomass
Loss (start
of year)
Average
Percent
Biomass
Loss
Discount
Factor
Discounted
Average
Biomass
Lost
Discounted
Acre Years
Lost
42 2044 5.01% 94.99% 94.99% 0.289 27.45% 0.203
43 2045 5.01% 94.99% 94.99% 0.281 26.65% 0.197
44 2046 5.01% 94.99% 94.99% 0.272 25.87% 0.192
45 2047 5.01% 94.99% 94.99% 0.264 25.12% 0.186
46 2048 5.01% 94.99% 94.99% 0.257 24.39% 0.181
47 2049 5.01% 94.99% 94.99% 0.249 23.68% 0.175
48 2050 5.01% 94.99% 94.99% 0.242 22.99% 0.170
49 2051 5.01% 94.99% 94.99% 0.235 22.32% 0.165
50 2052 5.01% 94.99% 94.99% 0.228 21.67% 0.161
51 2053 5.01% 94.99% 94.99% 0.221 21.04% 0.156
52 2054 5.01% 94.99% 94.98% 0.215 20.42% 0.151
53 2055 5.02% 94.98% 94.98% 0.209 19.83% 0.147
54 2056 5.02% 94.98% 94.98% 0.203 19.25% 0.143
55 2057 5.02% 94.98% 94.98% 0.197 18.69% 0.138
56 2058 5.02% 94.98% 94.98% 0.191 18.14% 0.134
57 2059 5.02% 94.98% 94.98% 0.185 17.62% 0.131
58 2060 5.02% 94.98% 94.98% 0.180 17.10% 0.127
59 2061 5.02% 94.98% 94.97% 0.175 16.60% 0.123
60 2062 5.03% 94.97% 94.97% 0.170 16.12% 0.119
61 2063 5.03% 94.97% 94.97% 0.165 15.65% 0.116
62 2064 5.03% 94.97% 94.97% 0.160 15.19% 0.113
63 2065 5.03% 94.97% 94.97% 0.155 14.75% 0.109
64 2066 5.03% 94.97% 94.96% 0.151 14.32% 0.106
65 2067 5.04% 94.96% 94.96% 0.146 13.90% 0.103
66 2068 5.04% 94.96% 94.96% 0.142 13.50% 0.100
67 2069 5.04% 94.96% 94.95% 0.138 13.10% 0.097
68 2070 5.05% 94.95% 94.95% 0.134 12.72% 0.094
69 2071 5.05% 94.95% 94.95% 0.130 12.35% 0.092
70 2072 5.05% 94.95% 94.94% 0.126 11.99% 0.089
71 2073 5.06% 94.94% 94.94% 0.123 11.64% 0.086
72 2074 5.06% 94.94% 94.94% 0.119 11.30% 0.084
73 2075 5.07% 94.93% 94.93% 0.116 10.97% 0.081
74 2076 5.07% 94.93% 94.92% 0.112 10.65% 0.079
75 2077 5.08% 94.92% 94.92% 0.109 10.34% 0.077
76 2078 5.08% 94.92% 94.91% 0.106 10.04% 0.074
77 2079 5.09% 94.91% 94.91% 0.103 9.75% 0.072
78 2080 5.10% 94.90% 94.90% 0.100 9.46% 0.070
79 2081 5.10% 94.90% 94.89% 0.097 9.19% 0.068
80 2082 5.11% 94.89% 94.88% 0.094 8.92% 0.066
81 2083 5.12% 94.88% 94.87% 0.091 8.66% 0.064
82 2084 5.13% 94.87% 94.87% 0.089 8.40% 0.062
83 2085 5.14% 94.86% 94.86% 0.086 8.16% 0.060

Damage Assessment and
Restoration Plan
A-5
TABLE A2. Cont.
Years Post Spill Year
Percent
Biomass
Level (start
of year)
Percent
Biomass
Loss (start
of year)
Average
Percent
Biomass
Loss
Discount
Factor
Discounted
Average
Biomass
Lost
Discounted
Acre Years
Lost
84 2086 5.15% 94.85% 94.84% 0.083 7.92% 0.059
85 2087 5.16% 94.84% 94.83% 0.081 7.69% 0.057
86 2088 5.17% 94.83% 94.82% 0.079 7.46% 0.055
87 2089 5.19% 94.81% 94.81% 0.076 7.24% 0.054
88 2090 5.20% 94.80% 94.79% 0.074 7.03% 0.052
89 2091 5.22% 94.78% 94.78% 0.072 6.83% 0.051
90 2092 5.23% 94.77% 94.76% 0.070 6.63% 0.049
91 2093 5.25% 94.75% 94.74% 0.068 6.43% 0.048
92 2094 5.27% 94.73% 94.72% 0.066 6.24% 0.046
93 2095 5.29% 94.71% 94.70% 0.064 6.06% 0.045
94 2096 5.31% 94.69% 94.68% 0.062 5.88% 0.044
95 2097 5.33% 94.67% 94.65% 0.060 5.71% 0.042
96 2098 5.36% 94.64% 94.63% 0.059 5.54% 0.041
97 2099 5.39% 94.61% 94.60% 0.057 5.38% 0.040
98 2100 5.42% 94.58% 94.57% 0.055 5.22% 0.039
99 2101 5.45% 94.55% 94.54% 0.054 5.07% 0.038
100 2102 5.48% 94.52% 94.50% 0.052 4.92% 0.036
101 2103 5.52% 94.48% 94.46% 0.051 4.77% 0.035
102 2104 5.56% 94.44% 94.42% 0.049 4.63% 0.034
103 2105 5.60% 94.40% 94.38% 0.048 4.49% 0.033
104 2106 5.64% 94.36% 94.33% 0.046 4.36% 0.032
105 2107 5.69% 94.31% 94.28% 0.045 4.23% 0.031
106 2108 5.75% 94.25% 94.23% 0.044 4.11% 0.030
107 2109 5.80% 94.20% 94.17% 0.042 3.98% 0.030
108 2110 5.86% 94.14% 94.10% 0.041 3.87% 0.029
109 2111 5.93% 94.07% 94.04% 0.040 3.75% 0.028
110 2112 6.00% 94.00% 93.96% 0.039 3.64% 0.027
111 2113 6.07% 93.93% 93.89% 0.038 3.53% 0.026
112 2114 6.16% 93.84% 93.80% 0.036 3.42% 0.025
113 2115 6.24% 93.76% 93.71% 0.035 3.32% 0.025
114 2116 6.34% 93.66% 93.61% 0.034 3.22% 0.024
115 2117 6.44% 93.56% 93.51% 0.033 3.12% 0.023
116 2118 6.55% 93.45% 93.39% 0.032 3.03% 0.022
117 2119 6.66% 93.34% 93.27% 0.031 2.94% 0.022
118 2120 6.79% 93.21% 93.14% 0.031 2.85% 0.021
119 2121 6.92% 93.08% 93.00% 0.030 2.76% 0.020
120 2122 7.07% 92.93% 92.85% 0.029 2.67% 0.020
121 2123 7.23% 92.77% 92.69% 0.028 2.59% 0.019
122 2124 7.40% 92.60% 92.51% 0.027 2.51% 0.019
123 2125 7.58% 92.42% 92.33% 0.026 2.43% 0.018
124 2126 7.77% 92.23% 92.12% 0.026 2.36% 0.017
125 2127 7.98% 92.02% 91.91% 0.025 2.28% 0.017
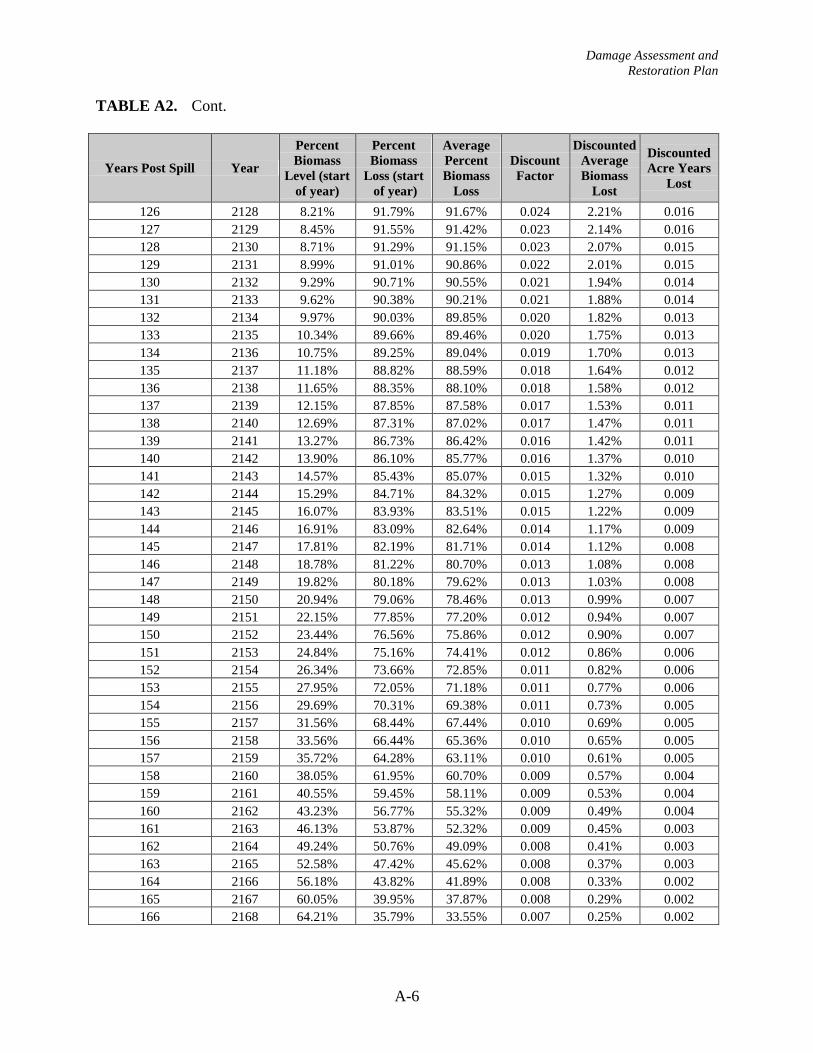
Damage Assessment and
Restoration Plan
A-6
TABLE A2. Cont.
Years Post Spill Year
Percent
Biomass
Level (start
of year)
Percent
Biomass
Loss (start
of year)
Average
Percent
Biomass
Loss
Discount
Factor
Discounted
Average
Biomass
Lost
Discounted
Acre Years
Lost
126 2128 8.21% 91.79% 91.67% 0.024 2.21% 0.016
127 2129 8.45% 91.55% 91.42% 0.023 2.14% 0.016
128 2130 8.71% 91.29% 91.15% 0.023 2.07% 0.015
129 2131 8.99% 91.01% 90.86% 0.022 2.01% 0.015
130 2132 9.29% 90.71% 90.55% 0.021 1.94% 0.014
131 2133 9.62% 90.38% 90.21% 0.021 1.88% 0.014
132 2134 9.97% 90.03% 89.85% 0.020 1.82% 0.013
133 2135 10.34% 89.66% 89.46% 0.020 1.75% 0.013
134 2136 10.75% 89.25% 89.04% 0.019 1.70% 0.013
135 2137 11.18% 88.82% 88.59% 0.018 1.64% 0.012
136 2138 11.65% 88.35% 88.10% 0.018 1.58% 0.012
137 2139 12.15% 87.85% 87.58% 0.017 1.53% 0.011
138 2140 12.69% 87.31% 87.02% 0.017 1.47% 0.011
139 2141 13.27% 86.73% 86.42% 0.016 1.42% 0.011
140 2142 13.90% 86.10% 85.77% 0.016 1.37% 0.010
141 2143 14.57% 85.43% 85.07% 0.015 1.32% 0.010
142 2144 15.29% 84.71% 84.32% 0.015 1.27% 0.009
143 2145 16.07% 83.93% 83.51% 0.015 1.22% 0.009
144 2146 16.91% 83.09% 82.64% 0.014 1.17% 0.009
145 2147 17.81% 82.19% 81.71% 0.014 1.12% 0.008
146 2148 18.78% 81.22% 80.70% 0.013 1.08% 0.008
147 2149 19.82% 80.18% 79.62% 0.013 1.03% 0.008
148 2150 20.94% 79.06% 78.46% 0.013 0.99% 0.007
149 2151 22.15% 77.85% 77.20% 0.012 0.94% 0.007
150 2152 23.44% 76.56% 75.86% 0.012 0.90% 0.007
151 2153 24.84% 75.16% 74.41% 0.012 0.86% 0.006
152 2154 26.34% 73.66% 72.85% 0.011 0.82% 0.006
153 2155 27.95% 72.05% 71.18% 0.011 0.77% 0.006
154 2156 29.69% 70.31% 69.38% 0.011 0.73% 0.005
155 2157 31.56% 68.44% 67.44% 0.010 0.69% 0.005
156 2158 33.56% 66.44% 65.36% 0.010 0.65% 0.005
157 2159 35.72% 64.28% 63.11% 0.010 0.61% 0.005
158 2160 38.05% 61.95% 60.70% 0.009 0.57% 0.004
159 2161 40.55% 59.45% 58.11% 0.009 0.53% 0.004
160 2162 43.23% 56.77% 55.32% 0.009 0.49% 0.004
161 2163 46.13% 53.87% 52.32% 0.009 0.45% 0.003
162 2164 49.24% 50.76% 49.09% 0.008 0.41% 0.003
163 2165 52.58% 47.42% 45.62% 0.008 0.37% 0.003
164 2166 56.18% 43.82% 41.89% 0.008 0.33% 0.002
165 2167 60.05% 39.95% 37.87% 0.008 0.29% 0.002
166 2168 64.21% 35.79% 33.55% 0.007 0.25% 0.002

Damage Assessment and
Restoration Plan
A-7
TABLE A2. Cont.
Years Post Spill Year
Percent
Biomass
Level (start
of year)
Percent
Biomass
Loss (start
of year)
Average
Percent
Biomass
Loss
Discount
Factor
Discounted
Average
Biomass
Lost
Discounted
Acre Years
Lost
167 2169 68.69% 31.31% 28.90% 0.007 0.21% 0.002
168 2170 73.51% 26.49% 23.90% 0.007 0.17% 0.001
169 2171 78.69% 21.31% 18.53% 0.007 0.13% 0.001
170 2172 84.26% 15.74% 12.74% 0.007 0.08% 0.001
171 2173 90.25% 9.75% 6.52% 0.006 0.04% 0.000
172 2174 96.70% 3.30% -0.17% 0.006 0.00% 0.000
173 2175 103.64% -3.64% -1.82% 0.006 -0.01% 0.000
Total Discounted Service-Acre Years (DSAYs) 24.3
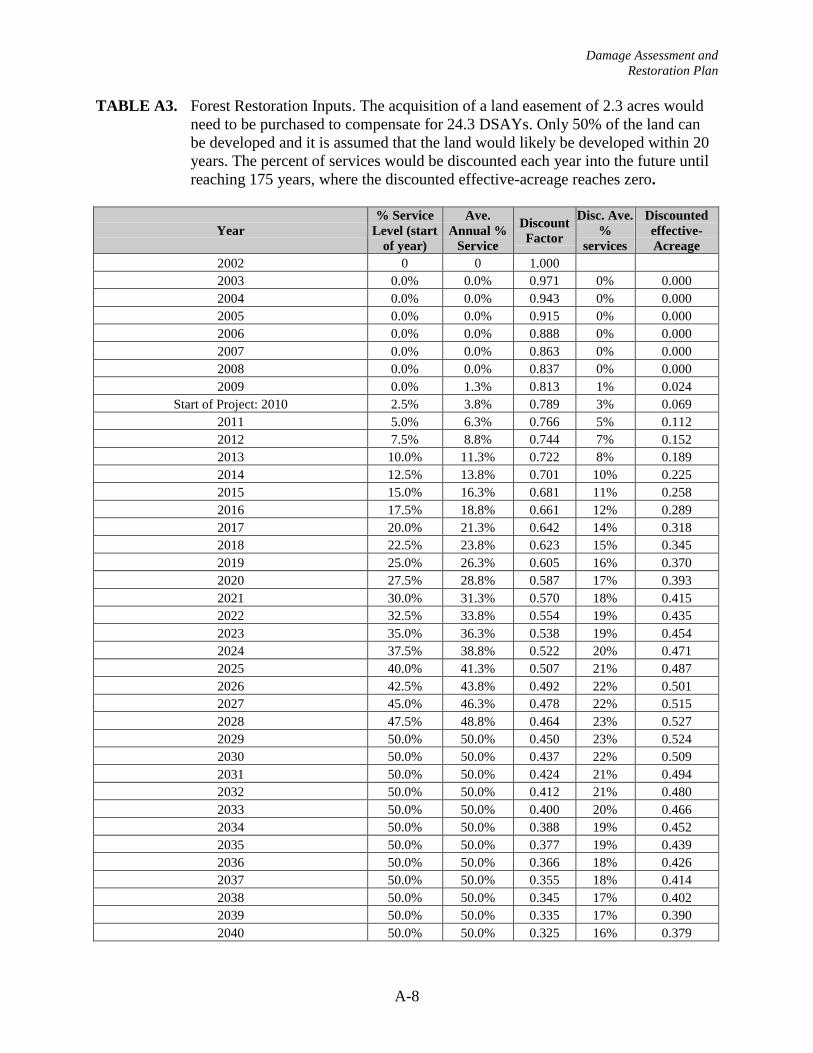
Damage Assessment and
Restoration Plan
A-8
TABLE A3. Forest Restoration Inputs. The acquisition of a land easement of 2.3 acres would
need to be purchased to compensate for 24.3 DSAYs. Only 50% of the land can
be developed and it is assumed that the land would likely be developed within 20
years. The percent of services would be discounted each year into the future until
reaching 175 years, where the discounted effective-acreage reaches zero.
Year
% Service
Level (start
of year)
Ave.
Annual %
Service
Discount
Factor
Disc. Ave.
%
services
Discounted
effective-
Acreage
2002 0 0 1.000
2003 0.0% 0.0% 0.971 0% 0.000
2004 0.0% 0.0% 0.943 0% 0.000
2005 0.0% 0.0% 0.915 0% 0.000
2006 0.0% 0.0% 0.888 0% 0.000
2007 0.0% 0.0% 0.863 0% 0.000
2008 0.0% 0.0% 0.837 0% 0.000
2009 0.0% 1.3% 0.813 1% 0.024
Start of Project: 2010 2.5% 3.8% 0.789 3% 0.069
2011 5.0% 6.3% 0.766 5% 0.112
2012 7.5% 8.8% 0.744 7% 0.152
2013 10.0% 11.3% 0.722 8% 0.189
2014 12.5% 13.8% 0.701 10% 0.225
2015 15.0% 16.3% 0.681 11% 0.258
2016 17.5% 18.8% 0.661 12% 0.289
2017 20.0% 21.3% 0.642 14% 0.318
2018 22.5% 23.8% 0.623 15% 0.345
2019 25.0% 26.3% 0.605 16% 0.370
2020 27.5% 28.8% 0.587 17% 0.393
2021 30.0% 31.3% 0.570 18% 0.415
2022 32.5% 33.8% 0.554 19% 0.435
2023 35.0% 36.3% 0.538 19% 0.454
2024 37.5% 38.8% 0.522 20% 0.471
2025 40.0% 41.3% 0.507 21% 0.487
2026 42.5% 43.8% 0.492 22% 0.501
2027 45.0% 46.3% 0.478 22% 0.515
2028 47.5% 48.8% 0.464 23% 0.527
2029 50.0% 50.0% 0.450 23% 0.524
2030 50.0% 50.0% 0.437 22% 0.509
2031 50.0% 50.0% 0.424 21% 0.494
2032 50.0% 50.0% 0.412 21% 0.480
2033 50.0% 50.0% 0.400 20% 0.466
2034 50.0% 50.0% 0.388 19% 0.452
2035 50.0% 50.0% 0.377 19% 0.439
2036 50.0% 50.0% 0.366 18% 0.426
2037 50.0% 50.0% 0.355 18% 0.414
2038 50.0% 50.0% 0.345 17% 0.402
2039 50.0% 50.0% 0.335 17% 0.390
2040 50.0% 50.0% 0.325 16% 0.379
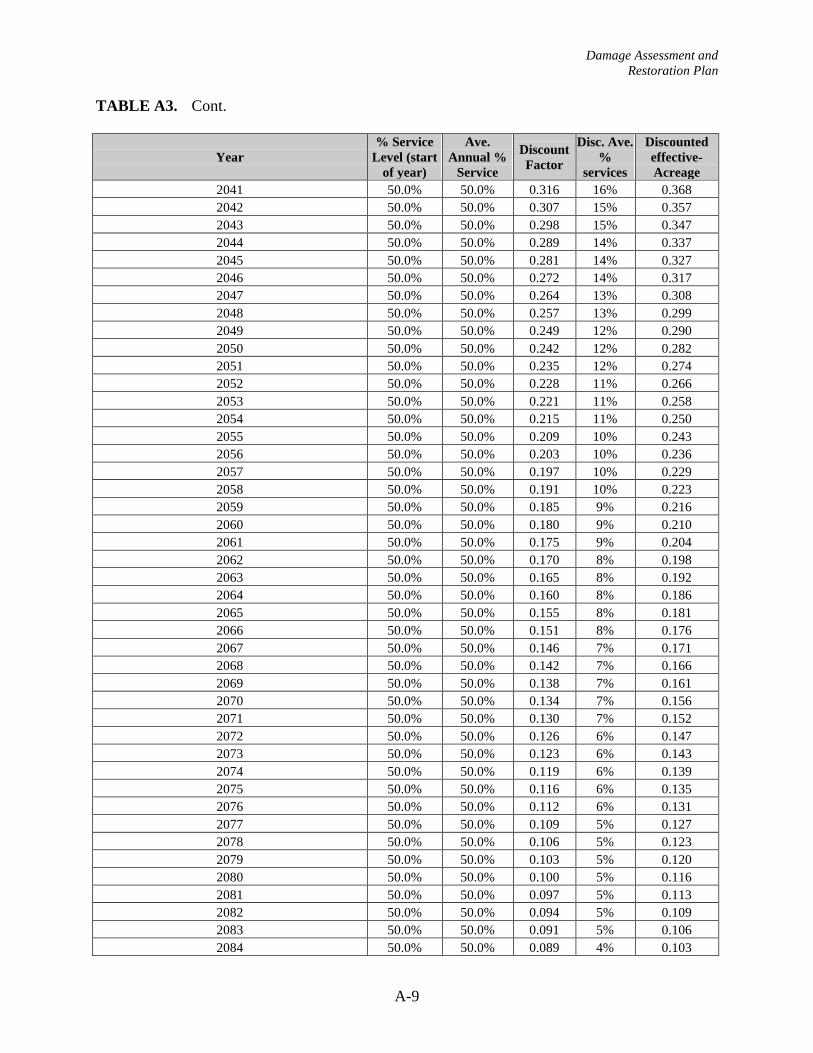
Damage Assessment and
Restoration Plan
A-9
TABLE A3. Cont.
Year
% Service
Level (start
of year)
Ave.
Annual %
Service
Discount
Factor
Disc. Ave.
%
services
Discounted
effective-
Acreage
2041 50.0% 50.0% 0.316 16% 0.368
2042 50.0% 50.0% 0.307 15% 0.357
2043 50.0% 50.0% 0.298 15% 0.347
2044 50.0% 50.0% 0.289 14% 0.337
2045 50.0% 50.0% 0.281 14% 0.327
2046 50.0% 50.0% 0.272 14% 0.317
2047 50.0% 50.0% 0.264 13% 0.308
2048 50.0% 50.0% 0.257 13% 0.299
2049 50.0% 50.0% 0.249 12% 0.290
2050 50.0% 50.0% 0.242 12% 0.282
2051 50.0% 50.0% 0.235 12% 0.274
2052 50.0% 50.0% 0.228 11% 0.266
2053 50.0% 50.0% 0.221 11% 0.258
2054 50.0% 50.0% 0.215 11% 0.250
2055 50.0% 50.0% 0.209 10% 0.243
2056 50.0% 50.0% 0.203 10% 0.236
2057 50.0% 50.0% 0.197 10% 0.229
2058 50.0% 50.0% 0.191 10% 0.223
2059 50.0% 50.0% 0.185 9% 0.216
2060 50.0% 50.0% 0.180 9% 0.210
2061 50.0% 50.0% 0.175 9% 0.204
2062 50.0% 50.0% 0.170 8% 0.198
2063 50.0% 50.0% 0.165 8% 0.192
2064 50.0% 50.0% 0.160 8% 0.186
2065 50.0% 50.0% 0.155 8% 0.181
2066 50.0% 50.0% 0.151 8% 0.176
2067 50.0% 50.0% 0.146 7% 0.171
2068 50.0% 50.0% 0.142 7% 0.166
2069 50.0% 50.0% 0.138 7% 0.161
2070 50.0% 50.0% 0.134 7% 0.156
2071 50.0% 50.0% 0.130 7% 0.152
2072 50.0% 50.0% 0.126 6% 0.147
2073 50.0% 50.0% 0.123 6% 0.143
2074 50.0% 50.0% 0.119 6% 0.139
2075 50.0% 50.0% 0.116 6% 0.135
2076 50.0% 50.0% 0.112 6% 0.131
2077 50.0% 50.0% 0.109 5% 0.127
2078 50.0% 50.0% 0.106 5% 0.123
2079 50.0% 50.0% 0.103 5% 0.120
2080 50.0% 50.0% 0.100 5% 0.116
2081 50.0% 50.0% 0.097 5% 0.113
2082 50.0% 50.0% 0.094 5% 0.109
2083 50.0% 50.0% 0.091 5% 0.106
2084 50.0% 50.0% 0.089 4% 0.103

Damage Assessment and
Restoration Plan
A-10
TABLE A3. Cont.
Year
% Service
Level (start
of year)
Ave. Annual
% Service
Discount
Factor
Disc. Ave.
%
services
Discounted
effective-
Acreage
2085 50.0% 50.0% 0.086 4% 0.100
2086 50.0% 50.0% 0.083 4% 0.097
2087 50.0% 50.0% 0.081 4% 0.094
2088 50.0% 50.0% 0.079 4% 0.092
2089 50.0% 50.0% 0.076 4% 0.089
2090 50.0% 50.0% 0.074 4% 0.086
2091 50.0% 50.0% 0.072 4% 0.084
2092 50.0% 50.0% 0.070 3% 0.081
2093 50.0% 50.0% 0.068 3% 0.079
2094 50.0% 50.0% 0.066 3% 0.077
2095 50.0% 50.0% 0.064 3% 0.075
2096 50.0% 50.0% 0.062 3% 0.072
2097 50.0% 50.0% 0.060 3% 0.070
2098 50.0% 50.0% 0.059 3% 0.068
2099 50.0% 50.0% 0.057 3% 0.066
2100 50.0% 50.0% 0.055 3% 0.064
2101 50.0% 50.0% 0.054 3% 0.062
2102 50.0% 50.0% 0.052 3% 0.061
2103 50.0% 50.0% 0.051 3% 0.059
2104 50.0% 50.0% 0.049 2% 0.057
2105 50.0% 50.0% 0.048 2% 0.055
2106 50.0% 50.0% 0.046 2% 0.054
2107 50.0% 50.0% 0.045 2% 0.052
2108 50.0% 50.0% 0.044 2% 0.051
2109 50.0% 50.0% 0.042 2% 0.049
2110 50.0% 50.0% 0.041 2% 0.048
2111 50.0% 50.0% 0.040 2% 0.046
2112 50.0% 50.0% 0.039 2% 0.045
2113 50.0% 50.0% 0.038 2% 0.044
2114 50.0% 50.0% 0.036 2% 0.043
2115 50.0% 50.0% 0.035 2% 0.041
2116 50.0% 50.0% 0.034 2% 0.040
2117 50.0% 50.0% 0.033 2% 0.039
2118 50.0% 50.0% 0.032 2% 0.038
2119 50.0% 50.0% 0.031 2% 0.037
2120 50.0% 50.0% 0.031 2% 0.036
2121 50.0% 50.0% 0.030 1% 0.035
2122 50.0% 50.0% 0.029 1% 0.034
2123 50.0% 50.0% 0.028 1% 0.033
2124 50.0% 50.0% 0.027 1% 0.032
2125 50.0% 50.0% 0.026 1% 0.031
2126 50.0% 50.0% 0.026 1% 0.030
2127 50.0% 50.0% 0.025 1% 0.029
2128 50.0% 50.0% 0.024 1% 0.028
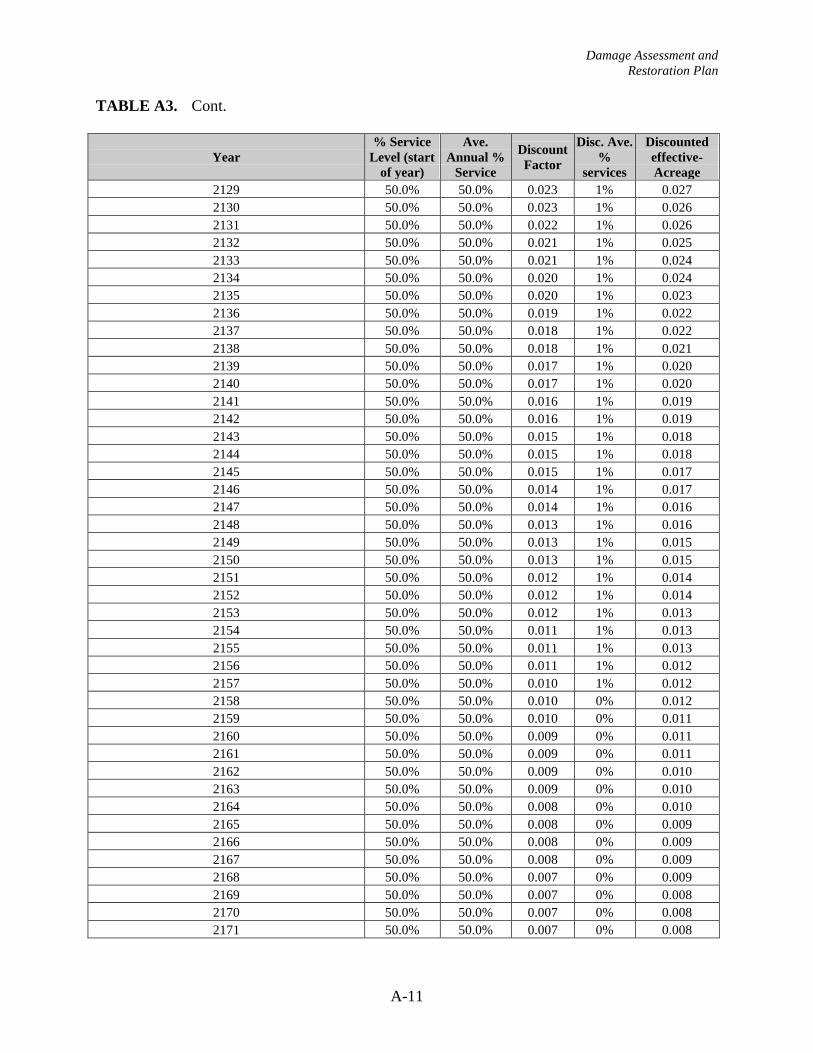
Damage Assessment and
Restoration Plan
A-11
TABLE A3. Cont.
Year
% Service
Level (start
of year)
Ave.
Annual %
Service
Discount
Factor
Disc. Ave.
%
services
Discounted
effective-
Acreage
2129 50.0% 50.0% 0.023 1% 0.027
2130 50.0% 50.0% 0.023 1% 0.026
2131 50.0% 50.0% 0.022 1% 0.026
2132 50.0% 50.0% 0.021 1% 0.025
2133 50.0% 50.0% 0.021 1% 0.024
2134 50.0% 50.0% 0.020 1% 0.024
2135 50.0% 50.0% 0.020 1% 0.023
2136 50.0% 50.0% 0.019 1% 0.022
2137 50.0% 50.0% 0.018 1% 0.022
2138 50.0% 50.0% 0.018 1% 0.021
2139 50.0% 50.0% 0.017 1% 0.020
2140 50.0% 50.0% 0.017 1% 0.020
2141 50.0% 50.0% 0.016 1% 0.019
2142 50.0% 50.0% 0.016 1% 0.019
2143 50.0% 50.0% 0.015 1% 0.018
2144 50.0% 50.0% 0.015 1% 0.018
2145 50.0% 50.0% 0.015 1% 0.017
2146 50.0% 50.0% 0.014 1% 0.017
2147 50.0% 50.0% 0.014 1% 0.016
2148 50.0% 50.0% 0.013 1% 0.016
2149 50.0% 50.0% 0.013 1% 0.015
2150 50.0% 50.0% 0.013 1% 0.015
2151 50.0% 50.0% 0.012 1% 0.014
2152 50.0% 50.0% 0.012 1% 0.014
2153 50.0% 50.0% 0.012 1% 0.013
2154 50.0% 50.0% 0.011 1% 0.013
2155 50.0% 50.0% 0.011 1% 0.013
2156 50.0% 50.0% 0.011 1% 0.012
2157 50.0% 50.0% 0.010 1% 0.012
2158 50.0% 50.0% 0.010 0% 0.012
2159 50.0% 50.0% 0.010 0% 0.011
2160 50.0% 50.0% 0.009 0% 0.011
2161 50.0% 50.0% 0.009 0% 0.011
2162 50.0% 50.0% 0.009 0% 0.010
2163 50.0% 50.0% 0.009 0% 0.010
2164 50.0% 50.0% 0.008 0% 0.010
2165 50.0% 50.0% 0.008 0% 0.009
2166 50.0% 50.0% 0.008 0% 0.009
2167 50.0% 50.0% 0.008 0% 0.009
2168 50.0% 50.0% 0.007 0% 0.009
2169 50.0% 50.0% 0.007 0% 0.008
2170 50.0% 50.0% 0.007 0% 0.008
2171 50.0% 50.0% 0.007 0% 0.008

Damage Assessment and
Restoration Plan
A-12
TABLE A3. Cont.
Year
% Service
Level (start
of year)
Ave.
Annual %
Service
Discount
Factor
Disc. Ave.
%
services
Discounted
effective-
Acreage
2172 50.0% 50.0% 0.007 0% 0.008
2173 50.0% 50.0% 0.006 0% 0.007
2174 50.0% 50.0% 0.006 0% 0.007
2175 50.0% 50.0% 0.006 0% 0.007
2176 50.0% 25.0% 0.006 0% 0.003
Total Discounted Service Acre Years Restored 24.3

Damage Assessment and
Restoration Plan
B-1
APPENDIX B
USGS Monthly Statistics for Discharges in the Obed River

Damage Assessment and
Restoration Plan
B-2
USGS 03539800 OBED RIVER NEAR LANCING, TN
Morgan County, Tennessee
Hydrologic Unit Code 06010208
Latitude = 36°04'53.11", Longitude = 84°40'13.33" NAD27
Drainage area 518 square miles
Gage datum 891.91 feet above sea level NGVD29
00060, Discharge, cubic feet per second,
YEAR Monthly mean in cfs (Calculation Period: 1957-05-01 -> 2005-09-30)
Jan Feb Mar Apr May Jun Jul Aug Sep Oct Nov Dec
1957 735.5 664.6 57.0 10.9 100.6 586.7 3,829 2,655
1958 991.3 872.9 1,514 2,399 1,948 70.7 39.3 104.3 20.9 10.5 65.8 187.3
1959 1,442 1,686 1,551. 1,454 386.7 404.1 152.2 294.8 147.4 113.4 742.2 2,848
1960 1,594 1,913 2,503 885.2 911.6 127.9 240.7 66.4 812.6 690.2 754.8 1,034
1961 1,222 2,948 3,313 2,005 838.8 1,475 328.5 235.9 24.0 11.8 158.9 2,269
1962 3,551 3,611. 2,597 3,327 115.4 183.7 73.4 15.0 114.5 294.7 1,355 956.8
1963 792.1 1,330. 4,183 337.9 588.0 162.4 341.8 115.1 33.2 1.87 4.98 43.5
1964 1,499 2,031 3,473 3,031 641.0 215.2 94.5 224.3 71.6 165.2 337.3 1,622
1965 1,692 1,056 3,479 1,605 548.5 301.0 464.0 172.2 69.9 87.4 112.9 139.7
1966 505.7 2,401 1,066 1,453 1,741 86.1 62.9 108.2 79.3 188.1 875.8 1,567
1967 979.6 1,318 2,368 593.1 1,342 410.1 2,323 359.9 82.6 317.3 1,134 3,149
1968 2,526 353.9 2,149 1,679 807.3 144.9 28.6 12.0 1.43
1973 3,982 1,635 3,918 1,390. 1,060. 251.3 79.9 32.9 2,071 2,642
1974 4,780. 2,688 2,212 1,164 1,135 193.6 28.4 40.6 268.3 280.2 1,026 2,327
1975 2,838 2,884 6,220. 1,054 886.2 204.9 45.9 70.7 822.4 1,552 1,667 1,382
1976 2,228 1,159 1,724 769.5 715.8 751.5 633.6 41.1 18.4 337.6 328.0 974.8
1977 1,123 793.1 1,839 3,522 420.6 152.4 45.6 75.5 345.5 656.0 2,994 2,101
1978 2,091 657.9 1,859 453.2 1,437 955.3 261.5 479.9 33.9 13.8 87.3 1,636
1979 4,239 2,099 2,005 2,013 1,499 465.5 2,572 156.1 426.3 588.8 2,152 1,056
1980 2,170. 831.0 3,923 1,187 833.4 87.7 11.3 7.13 8.02 1.58 40.0 127.7
1981 69.5 1,248 1,005 1,939 393.0 916.8 29.9 47.9 97.2 445.8 716.2 1,420
1982 3,288 1,974 1,964 793.8 545.1 222.6 146.6 405.6 856.4 116.3 926.2 3,074
1983 881.3 1,773 896.9 3,056 2,517 409.5 37.2 15.6 5.01 13.2 918.3 2,429
1984 1,227 1,435 2,353 1,524 4,066 152.4 724.5 303.7 26.9 515.1 1,659 1,247
1985 1,184 2,193 682.3 802.0 303.2 103.6 64.9 587.4 87.3 594.0 1,064 833.6
1986 302.8 1,991 791.8 260.8 599.9 288.9 33.5 10.1 82.3 276.5 2,225 1,872
1987 1,299 1,746 1,127 1,531 370.1 195.5 290.7 20.0 23.8 26.5 118.8 404.7
1999 1,866 852.3 1,529 544.8 1,843 47.3 5.28 9.40 29.7 132.3
2000 568.4 1,216 1,525 2,283 384.4 287.9 76.8 62.9 13.3 4.05 36.0 519.6
2001 1,098 2,887 965.6 826.4 255.5 82.7 96.6 260.1 29.6 21.3 146.1 833.5

Damage Assessment and
Restoration Plan
B-3
2002 3,465 895.3 2,730. 1,549 1,552 91.0 110.3 16.4 72.2 177.3 1,281 2,447
2003 515.2 4,696 689.0 2,505 3,649 746.9 163.5 122.6 812.3 148.6 1,073 1,453
2004 1,274 2,638 2,341 1,168 514.2 651.4 636.0 150.6 2,220. 570.0 1,668 3,879
2005 2,028 2,256 954.3 1,606 1,132 97.1 378.6 249.5 44.4 21.2 250.4 713.9
2006 2,091 1,262 935.5 2,412 374.3 153.5 49.9 134.6 275.4
Mean of
monthly
Discharge
1,740 1,840 2,140 1,580 1,130 383 387 151 235 269 965 1,510
** No Incomplete Data is used for Statistical Calculation

Damage Assessment and
Restoration Plan
C-1
APPENDIX C
Stream Injury and Restoration Calculations

Damage Assessment and
Restoration Plan
C-2
TABLE C1. Injury (DSAYs) calculated for 2.41 acres of impacted stream services for the
Clear Creek Seep Reach.
Year Post Spill
% Service
Level (start
of year)
% Service
Loss (start of
year)
Ave. %
Service Loss
Discount
Factor
Disc. Ave. %
Services Lost
Discounted
Service Acre-
Years Lost
0 Jul-02 0% 100% 88% 1.000 88% 0.526
0.25 Oct-02 25% 75% 73% 0.993 72% 0.294
0.42 Dec-02 30% 70% 60% 0.988 59% 0.829
1 2003 50% 50% 38% 0.971 36% 0.876
2 2004 75% 25% 38% 0.943 35% 0.850
3 2005 50% 50% 38% 0.915 34% 0.826
4 2006 75% 25% 38% 0.888 33% 0.802
5 2007 50% 50% 50% 0.863 43% 1.038
6 2008 50% 50% 38% 0.837 31% 0.756
7 2009 75% 25% 25% 0.813 20% 0.489
8 2010 75% 25% 38% 0.789 30% 0.712
9 2011 50% 50% 50% 0.766 38% 0.922
10 2012 50% 50% 50% 0.744 37% 0.895
11 2013 50% 50% 50% 0.722 36% 0.869
12 2014 50% 50% 50% 0.701 35% 0.844
13 2015 50% 50% 50% 0.681 34% 0.819
14 2016 50% 50% 38% 0.661 25% 0.597
15 2017 75% 25% 25% 0.642 16% 0.386
16 2018 75% 25% 38% 0.623 23% 0.562
17 2019 50% 50% 50% 0.605 30% 0.728
18 2020 50% 50% 50% 0.587 29% 0.707
19 2021 50% 50% 38% 0.570 21% 0.515
20 2022 75% 25% 13% 0.554 7% 0.167
21 2023 100% 0% 0% 0.587 0% 0.000
Total Discounted Service Acre Years Lost 16.01

Damage Assessment and
Restoration Plan
C-3
TABLE C2. Injury (DSAYs) calculated for 2.26 acres of impacted stream services for the
Clear Creek Downstream Reach.
Year Post Spill Year
% Service
Level (start
of year)
% Service
Loss (start
of year)
Ave. %
Service Loss
Discount
Factor
Disc. Ave. %
Services
Lost
Discounted
Service Acre-
Years Lost
0 Jul-02 0% 100% 83% 1.000 83% 0.466
0.25 Oct-02 35% 65% 60% 0.993 60% 0.229
0.42 Dec-02 45% 55% 40% 0.988 40% 0.519
1 2003 75% 25% 20% 0.971 19% 0.439
2 2004 85% 15% 23% 0.943 21% 0.479
3 2005 70% 30% 20% 0.915 18% 0.414
4 2006 90% 10% 20% 0.888 18% 0.402
5 2007 70% 30% 30% 0.863 26% 0.585
6 2008 70% 30% 20% 0.837 17% 0.379
7 2009 90% 10% 10% 0.813 8% 0.184
8 2010 90% 10% 20% 0.789 16% 0.357
9 2011 70% 30% 30% 0.766 23% 0.520
10 2012 70% 30% 30% 0.744 22% 0.505
11 2013 70% 30% 30% 0.722 22% 0.490
12 2014 70% 30% 30% 0.701 21% 0.476
13 2015 70% 30% 30% 0.681 20% 0.462
14 2016 70% 30% 20% 0.661 13% 0.299
15 2017 90% 10% 10% 0.642 6% 0.145
16 2018 90% 10% 20% 0.623 12% 0.282
17 2019 70% 30% 30% 0.605 18% 0.410
18 2020 70% 30% 30% 0.587 18% 0.398
19 2021 70% 30% 20% 0.570 11% 0.258
20 2022 90% 10% 5% 0.554 3% 0.063
21 2023 100% 0% 0% 0.538 0% 0.000
Total Discounted Service Acre Years Lost 8.76

Damage Assessment and
Restoration Plan
C-4
TABLE C3. Injury (DSAYs) calculated for 1.62 acres of impacted stream services for the
White Creek Reach.
Year Post Spill Year
% Service
Level (start
of year)
% Service
Loss (start
of year)
Ave. %
Service Loss
Discount
Factor
Disc. Ave. %
Services
Lost
Discounted
Service Acre-
Years Lost
0 Jul-02 0% 100% 83% 1.000 83% 0.334
0.25 Oct-02 35% 65% 60% 0.993 60% 0.164
0.42 Dec-02 45% 55% 40% 0.988 40% 0.371
1 2003 75% 25% 20% 0.971 19% 0.314
2 2004 85% 15% 10% 0.943 9% 0.152
3 2005 95% 5% 3% 0.915 2% 0.037
4 2006 100% 0% 0% 0.888 0% 0.000
5 2007 100% 0% 0% 0.863 0% 0.000
6 2008 100% 0% 0% 0.837 0% 0.000
7 2009 100% 0% 0% 0.813 0% 0.000
8 2010 100% 0% 0% 0.789 0% 0.000
9 2011 100% 0% 0% 0.766 0% 0.000
10 2012 100% 0% 0% 0.744 0% 0.000
11 2013 100% 0% 0% 0.722 0% 0.000
12 2014 100% 0% 0% 0.701 0% 0.000
13 2015 100% 0% 0% 0.681 0% 0.000
14 2016 100% 0% 0% 0.661 0% 0.000
15 2017 100% 0% 0% 0.642 0% 0.000
16 2018 100% 0% 0% 0.623 0% 0.000
17 2019 100% 0% 0% 0.605 0% 0.000
18 2020 100% 0% 0% 0.587 0% 0.000
19 2021 100% 0% 0% 0.570 0% 0.000
20 2022 100% 0% 0% 0.554 0% 0.000
21 2023 100% 0% 0% 0.538 0% 0.000
Total Discounted Service Acre Years Lost 1.37

Damage Assessment and
Restoration Plan
C-5
TABLE C4. Golliher Creek Restoration Inputs. 50% of the benthic macroinvertebrates would
return to the creek system one year after the remediation was complete. Complete
recovery of macroinvertebrates is expected two years after remediation. The
lifespan of the limestone treatment ponds are expected to be 30 years. A 3%
discount factor was used.
Year Post Spill Year
% Service
Level
(start of
year)
Ave. %
Service
Level
Discount Factor
Disc. Ave.
% Services
Gained
Discounted
Service Acre-
Years Gained
0 2002 0% 0% 1.000 0% 0.000
1 2003 0% 0% 0.971 0% 0.000
2 2004 0% 0% 0.943 0% 0.000
3 2005 0% 0% 0.915 0% 0.000
4 2006 0% 0% 0.888 0% 0.000
5 2007 0% 0% 0.863 0% 0.000
6 2008 0% 25% 0.837 21% 0.381
7 2009 50% 75% 0.813 61% 1.109
8 2010 100% 100% 0.789 79% 1.435
9 2011 100% 100% 0.766 77% 1.393
10 2012 100% 100% 0.744 74% 1.353
11 2013 100% 100% 0.722 72% 1.313
12 2014 100% 100% 0.701 70% 1.275
13 2015 100% 100% 0.681 68% 1.238
14 2016 100% 100% 0.661 66% 1.202
15 2017 100% 100% 0.642 64% 1.167
16 2018 100% 100% 0.623 62% 1.133
17 2019 100% 100% 0.605 61% 1.100
18 2020 100% 100% 0.587 59% 1.068
19 2021 100% 100% 0.570 57% 1.037
20 2022 100% 100% 0.554 55% 1.007
21 2023 100% 100% 0.538 54% 0.977
22 2024 100% 100% 0.522 52% 0.949
23 2025 100% 100% 0.507 51% 0.921
24 2026 100% 100% 0.492 49% 0.894
25 2027 100% 100% 0.478 48% 0.868
26 2028 100% 100% 0.464 46% 0.843
27 2029 100% 100% 0.450 45% 0.819
28 2030 100% 100% 0.437 44% 0.795
29 2031 100% 100% 0.424 42% 0.772
30 2032 100% 100% 0.412 41% 0.749
31 2033 100% 100% 0.400 40% 0.727
32 2034 100% 100% 0.388 39% 0.706
33 2035 100% 100% 0.377 38% 0.686
34 2036 100% 100% 0.366 37% 0.666
35 2037 100% 100% 0.355 36% 0.646
36 2038 100% 100% 0.345 35% 0.627
37 2039 100% 50% 0.335 17% 0.305
Total Discounted Service Acre Years Gained: 30.161
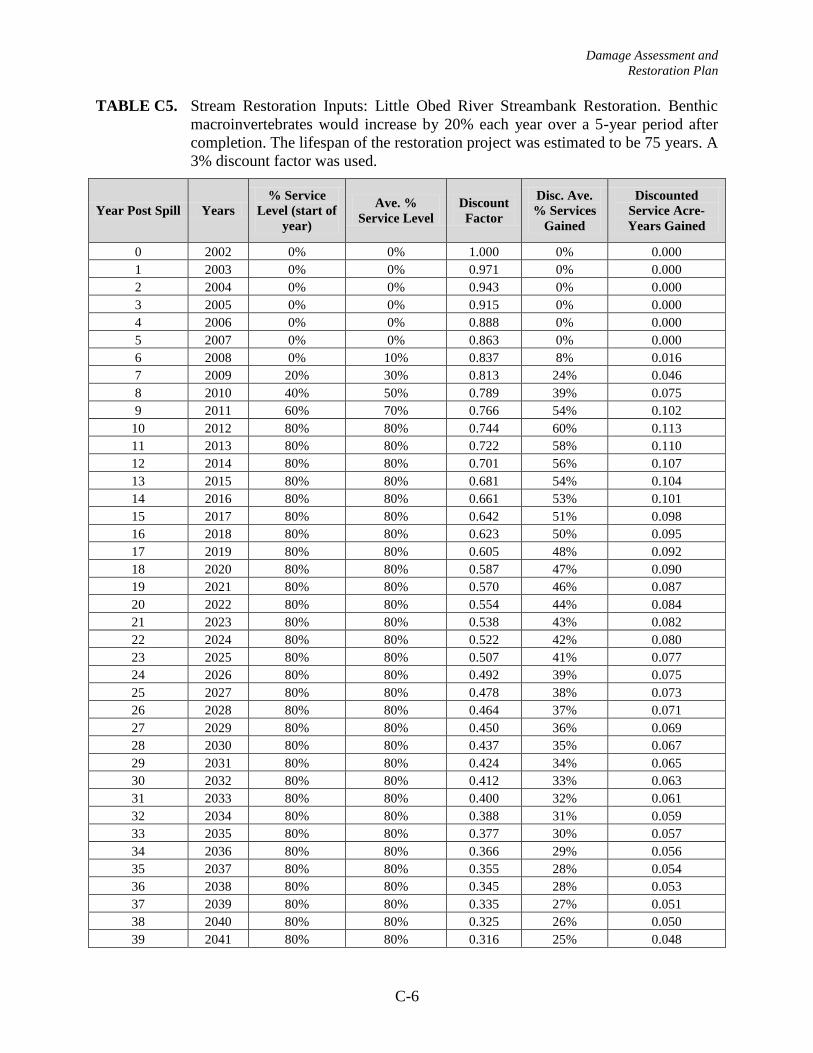
Damage Assessment and
Restoration Plan
C-6
TABLE C5. Stream Restoration Inputs: Little Obed River Streambank Restoration. Benthic
macroinvertebrates would increase by 20% each year over a 5-year period after
completion. The lifespan of the restoration project was estimated to be 75 years. A
3% discount factor was used.
Year Post Spill Years
% Service
Level (start of
year)
Ave. %
Service Level
Discount
Factor
Disc. Ave.
% Services
Gained
Discounted
Service Acre-
Years Gained
0 2002 0% 0% 1.000 0% 0.000
1 2003 0% 0% 0.971 0% 0.000
2 2004 0% 0% 0.943 0% 0.000
3 2005 0% 0% 0.915 0% 0.000
4 2006 0% 0% 0.888 0% 0.000
5 2007 0% 0% 0.863 0% 0.000
6 2008 0% 10% 0.837 8% 0.016
7 2009 20% 30% 0.813 24% 0.046
8 2010 40% 50% 0.789 39% 0.075
9 2011 60% 70% 0.766 54% 0.102
10 2012 80% 80% 0.744 60% 0.113
11 2013 80% 80% 0.722 58% 0.110
12 2014 80% 80% 0.701 56% 0.107
13 2015 80% 80% 0.681 54% 0.104
14 2016 80% 80% 0.661 53% 0.101
15 2017 80% 80% 0.642 51% 0.098
16 2018 80% 80% 0.623 50% 0.095
17 2019 80% 80% 0.605 48% 0.092
18 2020 80% 80% 0.587 47% 0.090
19 2021 80% 80% 0.570 46% 0.087
20 2022 80% 80% 0.554 44% 0.084
21 2023 80% 80% 0.538 43% 0.082
22 2024 80% 80% 0.522 42% 0.080
23 2025 80% 80% 0.507 41% 0.077
24 2026 80% 80% 0.492 39% 0.075
25 2027 80% 80% 0.478 38% 0.073
26 2028 80% 80% 0.464 37% 0.071
27 2029 80% 80% 0.450 36% 0.069
28 2030 80% 80% 0.437 35% 0.067
29 2031 80% 80% 0.424 34% 0.065
30 2032 80% 80% 0.412 33% 0.063
31 2033 80% 80% 0.400 32% 0.061
32 2034 80% 80% 0.388 31% 0.059
33 2035 80% 80% 0.377 30% 0.057
34 2036 80% 80% 0.366 29% 0.056
35 2037 80% 80% 0.355 28% 0.054
36 2038 80% 80% 0.345 28% 0.053
37 2039 80% 80% 0.335 27% 0.051
38 2040 80% 80% 0.325 26% 0.050
39 2041 80% 80% 0.316 25% 0.048
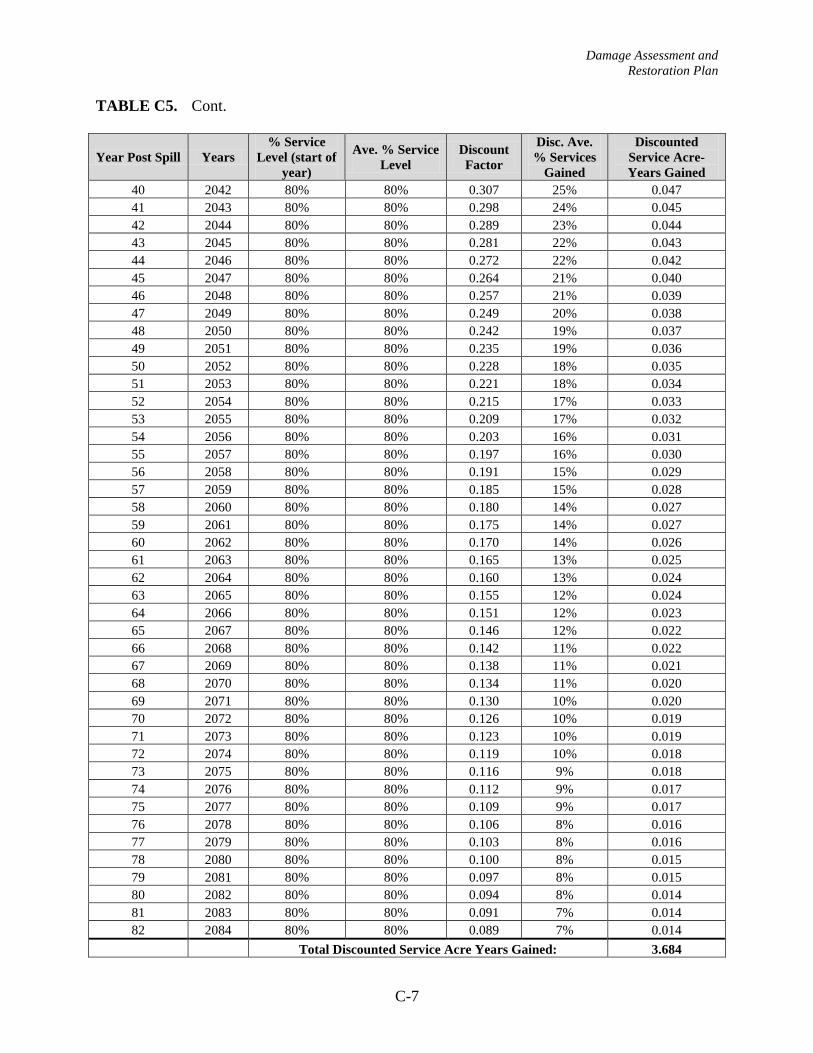
Damage Assessment and
Restoration Plan
C-7
TABLE C5. Cont.
Year Post Spill Years
% Service
Level (start of
year)
Ave. % Service
Level
Discount
Factor
Disc. Ave.
% Services
Gained
Discounted
Service Acre-
Years Gained
40 2042 80% 80% 0.307 25% 0.047
41 2043 80% 80% 0.298 24% 0.045
42 2044 80% 80% 0.289 23% 0.044
43 2045 80% 80% 0.281 22% 0.043
44 2046 80% 80% 0.272 22% 0.042
45 2047 80% 80% 0.264 21% 0.040
46 2048 80% 80% 0.257 21% 0.039
47 2049 80% 80% 0.249 20% 0.038
48 2050 80% 80% 0.242 19% 0.037
49 2051 80% 80% 0.235 19% 0.036
50 2052 80% 80% 0.228 18% 0.035
51 2053 80% 80% 0.221 18% 0.034
52 2054 80% 80% 0.215 17% 0.033
53 2055 80% 80% 0.209 17% 0.032
54 2056 80% 80% 0.203 16% 0.031
55 2057 80% 80% 0.197 16% 0.030
56 2058 80% 80% 0.191 15% 0.029
57 2059 80% 80% 0.185 15% 0.028
58 2060 80% 80% 0.180 14% 0.027
59 2061 80% 80% 0.175 14% 0.027
60 2062 80% 80% 0.170 14% 0.026
61 2063 80% 80% 0.165 13% 0.025
62 2064 80% 80% 0.160 13% 0.024
63 2065 80% 80% 0.155 12% 0.024
64 2066 80% 80% 0.151 12% 0.023
65 2067 80% 80% 0.146 12% 0.022
66 2068 80% 80% 0.142 11% 0.022
67 2069 80% 80% 0.138 11% 0.021
68 2070 80% 80% 0.134 11% 0.020
69 2071 80% 80% 0.130 10% 0.020
70 2072 80% 80% 0.126 10% 0.019
71 2073 80% 80% 0.123 10% 0.019
72 2074 80% 80% 0.119 10% 0.018
73 2075 80% 80% 0.116 9% 0.018
74 2076 80% 80% 0.112 9% 0.017
75 2077 80% 80% 0.109 9% 0.017
76 2078 80% 80% 0.106 8% 0.016
77 2079 80% 80% 0.103 8% 0.016
78 2080 80% 80% 0.100 8% 0.015
79 2081 80% 80% 0.097 8% 0.015
80 2082 80% 80% 0.094 8% 0.014
81 2083 80% 80% 0.091 7% 0.014
82 2084 80% 80% 0.089 7% 0.014
Total Discounted Service Acre Years Gained: 3.684

Damage Assessment and
Restoration Plan
C-8
TABLE C6. Stream Restoration Inputs: Little Obed River, Invasive Vegetation Removal.
Stream length = 750 ft; stream width = 5 ft. Vegetation (invasive and natural)
provided 50% of services before removal. After removal of invasive vegetation,
the services increased by 10% each year, reaching 90%. The lifespan of the
restoration project was estimated to be 75 years. A 3% discount factor was used.
Year Post Spill Year
% Service
Level (start of
year)
Ave. %
Service
Level
Discount
Factor
Disc. Ave. %
Services
Gained
Discounted Service
Acre-Years Gained
0 2002 0% 0% 1.000 0% 0.000
1 2003 0% 0% 0.971 0% 0.000
2 2004 0% 0% 0.943 0% 0.000
3 2005 0% 0% 0.915 0% 0.000
4 2006 0% 0% 0.888 0% 0.000
5 2007 0% 0% 0.863 0% 0.000
6 2008 0% 0% 0.837 0% 0.000
7 2009 50% 5% 0.813 4% 0.003
8 2010 60% 15% 0.789 12% 0.010
9 2011 70% 25% 0.766 19% 0.016
10 2012 80% 30% 0.744 22% 0.005
11 2013 80% 30% 0.722 22% 0.005
12 2014 80% 30% 0.701 21% 0.005
13 2015 80% 30% 0.681 20% 0.004
14 2016 80% 30% 0.661 20% 0.004
15 2017 80% 30% 0.642 19% 0.004
16 2018 80% 30% 0.623 19% 0.004
17 2019 80% 30% 0.605 18% 0.004
18 2020 80% 30% 0.587 18% 0.004
19 2021 80% 30% 0.570 17% 0.004
20 2022 80% 30% 0.554 17% 0.004
21 2023 80% 30% 0.538 16% 0.003
22 2024 80% 30% 0.522 16% 0.003
23 2025 80% 30% 0.507 15% 0.003
24 2026 80% 30% 0.492 15% 0.003
25 2027 80% 30% 0.478 14% 0.003
26 2028 80% 30% 0.464 14% 0.003
27 2029 80% 30% 0.450 14% 0.003
28 2030 80% 30% 0.437 13% 0.003
29 2031 80% 30% 0.424 13% 0.003
30 2032 80% 30% 0.412 12% 0.003
31 2033 80% 30% 0.400 12% 0.003
32 2034 80% 30% 0.388 12% 0.003
33 2035 80% 30% 0.377 11% 0.002
34 2036 80% 30% 0.366 11% 0.002
35 2037 80% 30% 0.355 11% 0.002
36 2038 80% 30% 0.345 10% 0.002
37 2039 80% 30% 0.335 10% 0.002
38 2040 80% 30% 0.325 10% 0.002
39 2041 80% 30% 0.316 9% 0.002

Damage Assessment and
Restoration Plan
C-9
TABLE C6. Cont.
Year Post Spill Year
% Service
Level (start of
year)
Ave. %
Service
Level
Discount
Factor
Disc. Ave. %
Services
Gained
Discounted Service
Acre-Years Gained
40 2042 80% 30% 0.307 9% 0.002
41 2043 80% 30% 0.298 9% 0.002
42 2044 80% 30% 0.289 9% 0.002
43 2045 80% 30% 0.281 8% 0.002
44 2046 80% 30% 0.272 8% 0.002
45 2047 80% 30% 0.264 8% 0.002
46 2048 80% 30% 0.257 8% 0.002
47 2049 80% 30% 0.249 7% 0.002
48 2050 80% 30% 0.242 7% 0.002
49 2051 80% 30% 0.235 7% 0.002
50 2052 80% 30% 0.228 7% 0.001
51 2053 80% 30% 0.221 7% 0.001
52 2054 80% 30% 0.215 6% 0.001
53 2055 80% 30% 0.209 6% 0.001
54 2056 80% 30% 0.203 6% 0.001
55 2057 80% 30% 0.197 6% 0.001
56 2058 80% 30% 0.191 6% 0.001
57 2059 80% 30% 0.185 6% 0.001
58 2060 80% 30% 0.180 5% 0.001
59 2061 80% 30% 0.175 5% 0.001
60 2062 80% 30% 0.170 5% 0.001
61 2063 80% 30% 0.165 5% 0.001
62 2064 80% 30% 0.160 5% 0.001
63 2065 80% 30% 0.155 5% 0.001
64 2066 80% 30% 0.151 5% 0.001
65 2067 80% 30% 0.146 4% 0.001
66 2068 80% 30% 0.142 4% 0.001
67 2069 80% 30% 0.138 4% 0.001
68 2070 80% 30% 0.134 4% 0.001
69 2071 80% 30% 0.130 4% 0.001
70 2072 80% 30% 0.126 4% 0.001
71 2073 80% 30% 0.123 4% 0.001
72 2074 80% 30% 0.119 4% 0.001
73 2075 80% 30% 0.116 3% 0.001
74 2076 80% 30% 0.112 3% 0.001
75 2077 80% 30% 0.109 3% 0.001
76 2078 80% 30% 0.106 3% 0.001
77 2079 80% 30% 0.103 3% 0.001
78 2080 80% 30% 0.100 3% 0.001
79 2081 80% 30% 0.097 3% 0.001
80 2082 80% 30% 0.094 3% 0.001
81 2083 80% 30% 0.091 3% 0.001
82 2084 80% 30% 0.089 3% 0.001
Total Discounted Service Acre Years Gained: 0.176

Damage Assessment and
Restoration Plan
C-10
TABLE C7. Stream Restoration Inputs: Little Obed River, Bog Garden Construction, 2.12
acres. Increase in services was 5% each year for the first five years after
completion, to a maximum of services 25% which continued for 75 years. A 3%
discount factor was used.
Year Post Spill Year
% Service
Level (start of
year)
Ave. %
Service
Level
Discount
Factor
Disc. Ave. %
Services
Gained
Discounted Service
Acre-Years Gained
0 2002 0% 0% 1.000 0% 0.000
1 2003 0% 0% 0.971 0% 0.000
2 2004 0% 0% 0.943 0% 0.000
3 2005 0% 0% 0.915 0% 0.000
4 2006 0% 0% 0.888 0% 0.000
5 2007 0% 0% 0.863 0% 0.000
6 2008 0% 3% 0.837 2% 0.044
7 2009 5% 8% 0.813 6% 0.129
8 2010 10% 13% 0.789 10% 0.210
9 2011 15% 18% 0.766 13% 0.285
10 2012 20% 23% 0.744 17% 0.356
11 2013 25% 25% 0.722 18% 0.384
12 2014 25% 25% 0.701 18% 0.372
13 2015 25% 25% 0.681 17% 0.362
14 2016 25% 25% 0.661 17% 0.351
15 2017 25% 25% 0.642 16% 0.341
16 2018 25% 25% 0.623 16% 0.331
17 2019 25% 25% 0.605 15% 0.321
18 2020 25% 25% 0.587 15% 0.312
19 2021 25% 25% 0.570 14% 0.303
20 2022 25% 25% 0.554 14% 0.294
21 2023 25% 25% 0.538 13% 0.285
22 2024 25% 25% 0.522 13% 0.277
23 2025 25% 25% 0.507 13% 0.269
24 2026 25% 25% 0.492 12% 0.261
25 2027 25% 25% 0.478 12% 0.254
26 2028 25% 25% 0.464 12% 0.246
27 2029 25% 25% 0.450 11% 0.239
28 2030 25% 25% 0.437 11% 0.232
29 2031 25% 25% 0.424 11% 0.225
30 2032 25% 25% 0.412 10% 0.219
31 2033 25% 25% 0.400 10% 0.212
32 2034 25% 25% 0.388 10% 0.206
33 2035 25% 25% 0.377 9% 0.200
34 2036 25% 25% 0.366 9% 0.194
35 2037 25% 25% 0.355 9% 0.189
36 2038 25% 25% 0.345 9% 0.183
37 2039 25% 25% 0.335 8% 0.178
38 2040 25% 25% 0.325 8% 0.173
39 2041 25% 25% 0.316 8% 0.168
40 2042 25% 25% 0.307 8% 0.163

Damage Assessment and
Restoration Plan
C-11
TABLE C7. Cont.
Year Post Spill Year
% Service
Level (start of
year)
Ave. %
Service
Level
Discount
Factor
Disc. Ave. %
Services
Gained
Discounted Service
Acre-Years Gained
41 2043 25% 25% 0.298 7% 0.158
42 2044 25% 25% 0.289 7% 0.153
43 2045 25% 25% 0.281 7% 0.149
44 2046 25% 25% 0.272 7% 0.145
45 2047 25% 25% 0.264 7% 0.140
46 2048 25% 25% 0.257 6% 0.136
47 2049 25% 25% 0.249 6% 0.132
48 2050 25% 25% 0.242 6% 0.128
49 2051 25% 25% 0.235 6% 0.125
50 2052 25% 25% 0.228 6% 0.121
51 2053 25% 25% 0.221 6% 0.118
52 2054 25% 25% 0.215 5% 0.114
53 2055 25% 25% 0.209 5% 0.111
54 2056 25% 25% 0.203 5% 0.108
55 2057 25% 25% 0.197 5% 0.104
56 2058 25% 25% 0.191 5% 0.101
57 2059 25% 25% 0.185 5% 0.098
58 2060 25% 25% 0.180 5% 0.096
59 2061 25% 25% 0.175 4% 0.093
60 2062 25% 25% 0.170 4% 0.090
61 2063 25% 25% 0.165 4% 0.087
62 2064 25% 25% 0.160 4% 0.085
63 2065 25% 25% 0.155 4% 0.082
64 2066 25% 25% 0.151 4% 0.080
65 2067 25% 25% 0.146 4% 0.078
66 2068 25% 25% 0.142 4% 0.075
67 2069 25% 25% 0.138 3% 0.073
68 2070 25% 25% 0.134 3% 0.071
69 2071 25% 25% 0.130 3% 0.069
70 2072 25% 25% 0.126 3% 0.067
71 2073 25% 25% 0.123 3% 0.065
72 2074 25% 25% 0.119 3% 0.063
73 2075 25% 25% 0.116 3% 0.061
74 2076 25% 25% 0.112 3% 0.060
75 2077 25% 25% 0.109 3% 0.058
76 2078 25% 25% 0.106 3% 0.056
77 2079 25% 25% 0.103 3% 0.055
78 2080 25% 25% 0.100 2% 0.053
79 2081 25% 25% 0.097 2% 0.051
80 2082 25% 25% 0.094 2% 0.050
81 2083 25% 25% 0.091 2% 0.048
82 2084 25% 13% 0.089 1% 0.024
Total Discounted Service Acre Years Gained: 12.60
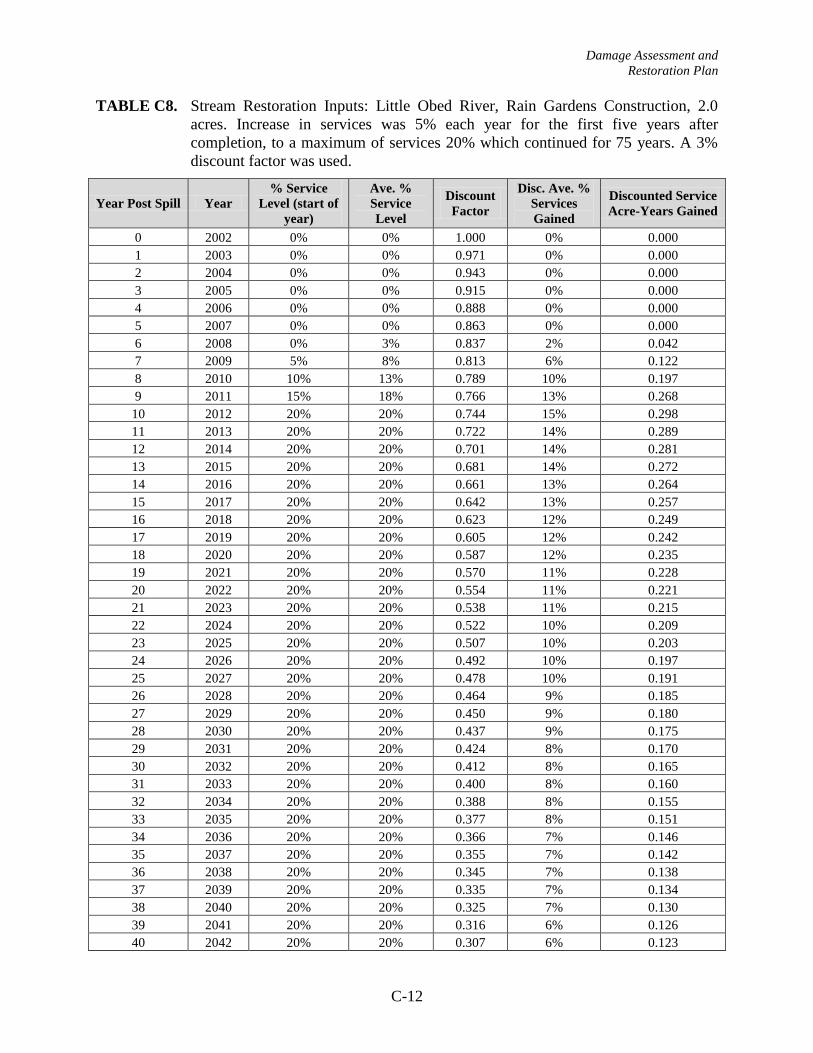
Damage Assessment and
Restoration Plan
C-12
TABLE C8. Stream Restoration Inputs: Little Obed River, Rain Gardens Construction, 2.0
acres. Increase in services was 5% each year for the first five years after
completion, to a maximum of services 20% which continued for 75 years. A 3%
discount factor was used.
Year Post Spill Year
% Service
Level (start of
year)
Ave. %
Service
Level
Discount
Factor
Disc. Ave. %
Services
Gained
Discounted Service
Acre-Years Gained
0 2002 0% 0% 1.000 0% 0.000
1 2003 0% 0% 0.971 0% 0.000
2 2004 0% 0% 0.943 0% 0.000
3 2005 0% 0% 0.915 0% 0.000
4 2006 0% 0% 0.888 0% 0.000
5 2007 0% 0% 0.863 0% 0.000
6 2008 0% 3% 0.837 2% 0.042
7 2009 5% 8% 0.813 6% 0.122
8 2010 10% 13% 0.789 10% 0.197
9 2011 15% 18% 0.766 13% 0.268
10 2012 20% 20% 0.744 15% 0.298
11 2013 20% 20% 0.722 14% 0.289
12 2014 20% 20% 0.701 14% 0.281
13 2015 20% 20% 0.681 14% 0.272
14 2016 20% 20% 0.661 13% 0.264
15 2017 20% 20% 0.642 13% 0.257
16 2018 20% 20% 0.623 12% 0.249
17 2019 20% 20% 0.605 12% 0.242
18 2020 20% 20% 0.587 12% 0.235
19 2021 20% 20% 0.570 11% 0.228
20 2022 20% 20% 0.554 11% 0.221
21 2023 20% 20% 0.538 11% 0.215
22 2024 20% 20% 0.522 10% 0.209
23 2025 20% 20% 0.507 10% 0.203
24 2026 20% 20% 0.492 10% 0.197
25 2027 20% 20% 0.478 10% 0.191
26 2028 20% 20% 0.464 9% 0.185
27 2029 20% 20% 0.450 9% 0.180
28 2030 20% 20% 0.437 9% 0.175
29 2031 20% 20% 0.424 8% 0.170
30 2032 20% 20% 0.412 8% 0.165
31 2033 20% 20% 0.400 8% 0.160
32 2034 20% 20% 0.388 8% 0.155
33 2035 20% 20% 0.377 8% 0.151
34 2036 20% 20% 0.366 7% 0.146
35 2037 20% 20% 0.355 7% 0.142
36 2038 20% 20% 0.345 7% 0.138
37 2039 20% 20% 0.335 7% 0.134
38 2040 20% 20% 0.325 7% 0.130
39 2041 20% 20% 0.316 6% 0.126
40 2042 20% 20% 0.307 6% 0.123

Damage Assessment and
Restoration Plan
C-13
TABLE C8. Cont.
Year Post Spill Year
% Service
Level (start of
year)
Ave. %
Service
Level
Discount
Factor
Disc. Ave. %
Services
Gained
Discounted Service
Acre-Years Gained
41 2043 20% 20% 0.298 6% 0.119
42 2044 20% 20% 0.289 6% 0.116
43 2045 20% 20% 0.281 6% 0.112
44 2046 20% 20% 0.272 5% 0.109
45 2047 20% 20% 0.264 5% 0.106
46 2048 20% 20% 0.257 5% 0.103
47 2049 20% 20% 0.249 5% 0.100
48 2050 20% 20% 0.242 5% 0.097
49 2051 20% 20% 0.235 5% 0.094
50 2052 20% 20% 0.228 5% 0.091
51 2053 20% 20% 0.221 4% 0.089
52 2054 20% 20% 0.215 4% 0.086
53 2055 20% 20% 0.209 4% 0.084
54 2056 20% 20% 0.203 4% 0.081
55 2057 20% 20% 0.197 4% 0.079
56 2058 20% 20% 0.191 4% 0.076
57 2059 20% 20% 0.185 4% 0.074
58 2060 20% 20% 0.180 4% 0.072
59 2061 20% 20% 0.175 3% 0.070
60 2062 20% 20% 0.170 3% 0.068
61 2063 20% 20% 0.165 3% 0.066
62 2064 20% 20% 0.160 3% 0.064
63 2065 20% 20% 0.155 3% 0.062
64 2066 20% 20% 0.151 3% 0.060
65 2067 20% 20% 0.146 3% 0.059
66 2068 20% 20% 0.142 3% 0.057
67 2069 20% 20% 0.138 3% 0.055
68 2070 20% 20% 0.134 3% 0.054
69 2071 20% 20% 0.130 3% 0.052
70 2072 20% 20% 0.126 3% 0.051
71 2073 20% 20% 0.123 2% 0.049
72 2074 20% 20% 0.119 2% 0.048
73 2075 20% 20% 0.116 2% 0.046
74 2076 20% 20% 0.112 2% 0.045
75 2077 20% 20% 0.109 2% 0.044
76 2078 20% 20% 0.106 2% 0.042
77 2079 20% 20% 0.103 2% 0.041
78 2080 20% 20% 0.100 2% 0.040
79 2081 20% 20% 0.097 2% 0.039
80 2082 20% 20% 0.094 2% 0.038
81 2083 20% 20% 0.091 2% 0.036
82 2084 20% 10% 0.089 1% 0.018
Total Discounted Service Acre Years Gained: 9.650

Damage Assessment and
Restoration Plan
D-1
APPENDIX D
List of Preparers, Agencies and Contacts Consulted
Damage Assessment and
Restoration Plan
D-2
List of Preparers
U.S. Department of the Interior
National Park Service
Philip Campbell, Obed Wild and Scenic River
Amy Mathis, Obed Wild and Scenic River
Steve Bakalez, Big South Fork National River and Recreation Area
Rick Dawson, FLAT Representative
Bruce Peacock, Economist
Tennessee Department of Environment and Conservation
Jonathan Burr
Debbie Mann
Patrick Parker
U.S. Fish and Wildlife Service
Steven R. Alexander
U.S. Department of the Interior
Jerry Thornton, Counsel
Research Planning, Inc.
Heidi Dunagan
Jacqueline Michel
List of Agencies and Contacts Consulted
To be completed after public review.

Damage Assessment and
Restoration Plan
APPENDIX E
USFWS Consultation

Damage Assessment and
Restoration Plan

Damage Assessment and
Restoration Plan

Damage Assessment and
Restoration Plan

Damage Assessment and
Restoration Plan

Damage Assessment and
Restoration Plan
APPENDIX F
Tribal Council Consultation

Damage Assessment and
Restoration Plan

Damage Assessment and
Restoration Plan
APPENDIX G
State Historic Preserveration Office Consultation

Damage Assessment and
Restoration Plan