Dam FRP - Guidance for Flood Risk Analysis and Mappinghydrology and hydraulic modeling software such...
21
Guidance for Flood Risk Analysis and Mapping Dam-Specific Non-Regulatory Flood Risk Datasets May 2016
Transcript of Dam FRP - Guidance for Flood Risk Analysis and Mappinghydrology and hydraulic modeling software such...

Guidance for Flood Risk Analysis and Mapping
Dam-Specific Non-Regulatory Flood Risk Datasets
May 2016

Dam-Specific Non-Regulatory Flood Risk Datasets May 2016 Guidance Document 68 Page i
Requirements for the Federal Emergency Management Agency (FEMA) Risk Mapping, Assessment, and Planning (Risk MAP) Program are specified separately by statute, regulation, or FEMA policy (primarily the Standards for Flood Risk Analysis and Mapping). This document provides guidance to support the requirements and recommends approaches for effective and efficient implementation. Alternate approaches that comply with all requirements are acceptable.
For more information, please visit the FEMA Guidelines and Standards for Flood Risk Analysis and Mapping webpage (www.fema.gov/guidelines-and-standards-flood-risk-analysis-and-mapping). Copies of the Standards for Flood Risk Analysis and Mapping policy, related guidance, technical references, and other information about the guidelines and standards development process are all available here. You can also search directly by document title at FEMA Resource and Document Library (www.fema.gov/resource-document-library).
Dam-Specific Non-Regulatory Flood Risk Datasets May 2016 Guidance Document 68 Page ii
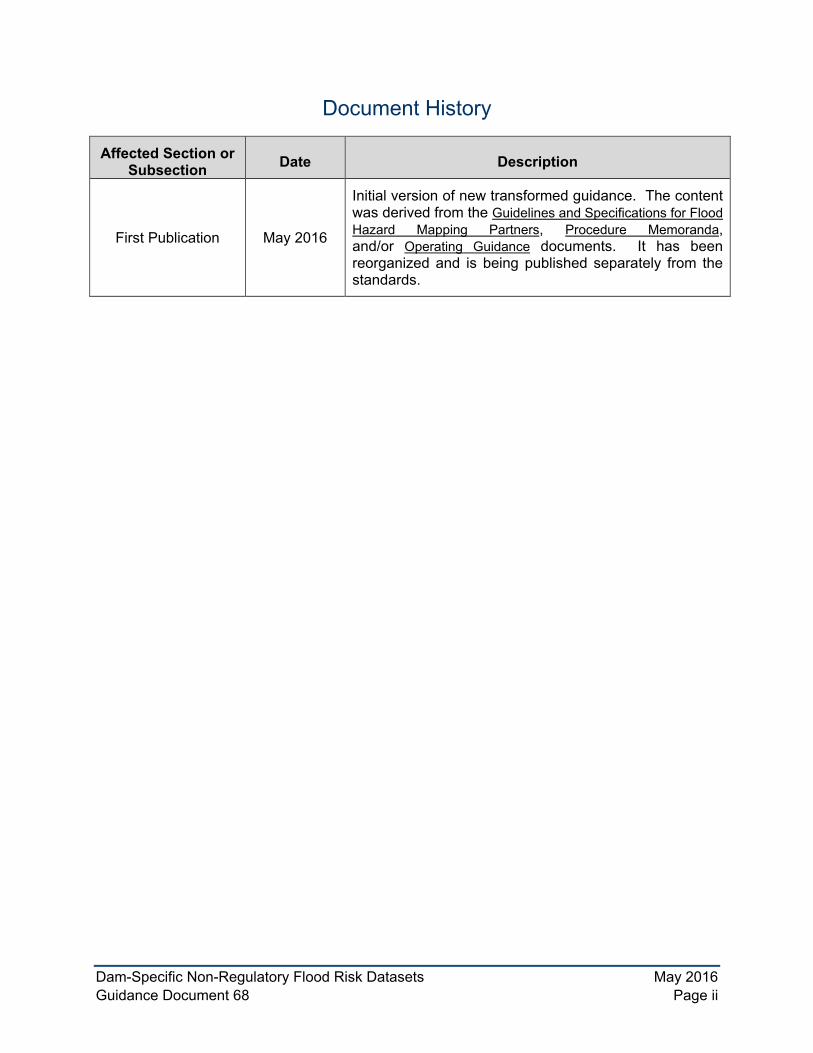
Document History
Affected Section or Subsection Date Description
First Publication May 2016
Initial version of new transformed guidance. The content was derived from the Guidelines and Specifications for Flood Hazard Mapping Partners, Procedure Memoranda, and/or Operating Guidance documents. It has been reorganized and is being published separately from the standards.
Dam-Specific Non-Regulatory Flood Risk Datasets May 2016 Guidance Document 68 Page iii
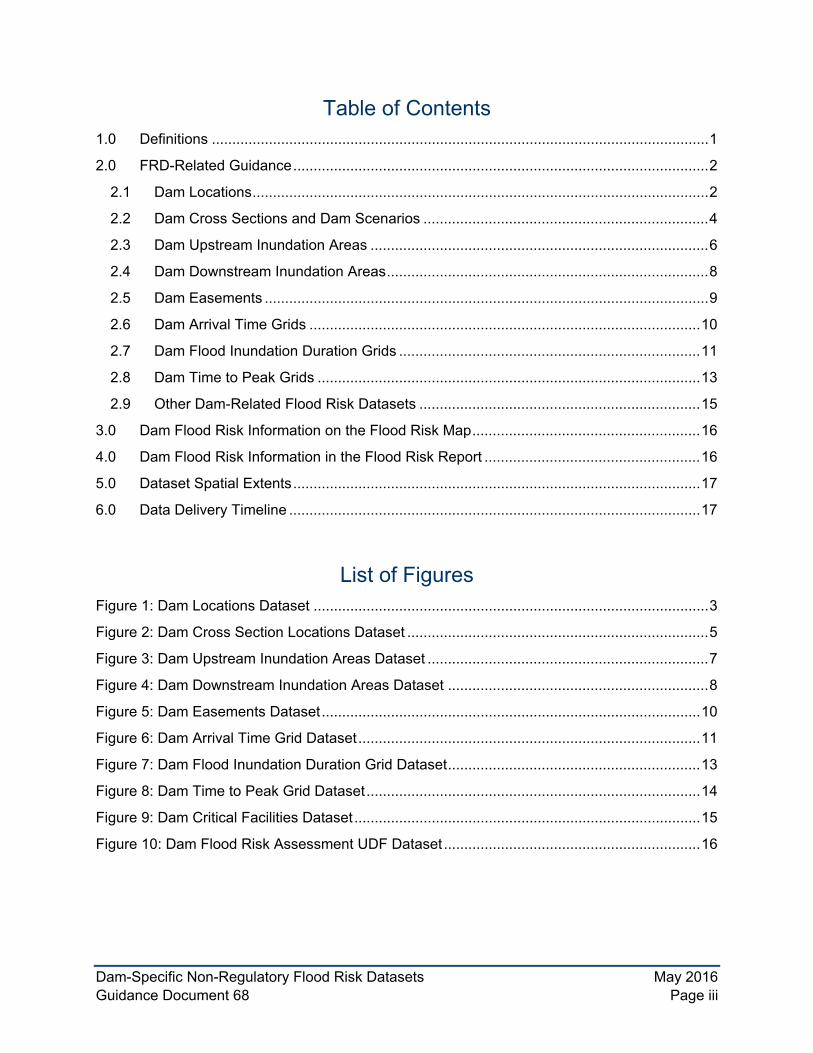
Table of Contents 1.0 Definitions .......................................................................................................................... 1
2.0 FRD-Related Guidance ...................................................................................................... 2
2.1 Dam Locations ................................................................................................................ 2
2.2 Dam Cross Sections and Dam Scenarios ...................................................................... 4
2.3 Dam Upstream Inundation Areas ................................................................................... 6
2.4 Dam Downstream Inundation Areas ............................................................................... 8
2.5 Dam Easements ............................................................................................................. 9
2.6 Dam Arrival Time Grids ................................................................................................ 10
2.7 Dam Flood Inundation Duration Grids .......................................................................... 11
2.8 Dam Time to Peak Grids .............................................................................................. 13
2.9 Other Dam-Related Flood Risk Datasets ..................................................................... 15
3.0 Dam Flood Risk Information on the Flood Risk Map ........................................................ 16
4.0 Dam Flood Risk Information in the Flood Risk Report ..................................................... 16
5.0 Dataset Spatial Extents .................................................................................................... 17
6.0 Data Delivery Timeline ..................................................................................................... 17
List of Figures Figure 1: Dam Locations Dataset ................................................................................................. 3
Figure 2: Dam Cross Section Locations Dataset .......................................................................... 5
Figure 3: Dam Upstream Inundation Areas Dataset ..................................................................... 7
Figure 4: Dam Downstream Inundation Areas Dataset ................................................................ 8
Figure 5: Dam Easements Dataset ............................................................................................. 10
Figure 6: Dam Arrival Time Grid Dataset .................................................................................... 11
Figure 7: Dam Flood Inundation Duration Grid Dataset .............................................................. 13
Figure 8: Dam Time to Peak Grid Dataset .................................................................................. 14
Figure 9: Dam Critical Facilities Dataset ..................................................................................... 15
Figure 10: Dam Flood Risk Assessment UDF Dataset ............................................................... 16

Dam-Specific Non-Regulatory Flood Risk Datasets May 2016 Guidance Document 68 Page 1
1.0 Definitions Dam Flood Risk Products have been developed to effectively communicate risk to a broad audience. These products comprise the following datasets: Dam Locations, Dam Cross Sections (and associated Dam Scenario Lookup Table and Dam Cross Section Model Results Lookup Table), Dam Upstream Inundation Areas, Dam Downstream Inundation Areas, Dam Easements, Dam Arrival Time Grids, Dam Flood Inundation Duration Grids, and Dam Time to Peak Grids. There are other datasets not discussed here that may be better suited for helping to communicate dam risks. Therefore, this is not intended be an all-inclusive list of the only dam datasets that could or should be produced as a Flood Risk Product. References directing individuals towards other existing information and resources that communicate dam risks should be provided in the Flood Risk Report (FRR), rather than duplicating that data within the Flood Risk Database (FRD). These additional resources may include FEMA’s GeoDam-BREACH software and documentation, the Army Corps of Engineers National Inventory of Dams, United States Geological Survey’s National Hydrography Dataset, the Natural Resources Conservation Service’s WinDAM B software, and the National Weather Service’s river mechanics models including BREACH and SMPDBK models. Additional resources that provide guidance for other flood risk datasets that can be produced in dam areas are also available, such as the Flood Depth & Analysis Grids Guidance, Flood Risk Assessment Guidance, Changes Since Last FIRM Guidance, and Areas of Mitigation Interest Guidance.
As with many enhanced risk datasets, decisions to deviate from the products described herein should take into consideration available data and project funding, the desire for and commitment to appropriate use of the data by project stakeholders, and community capacity for utilizing this data. If products are developed or datasets are enhanced in ways that are not described herein, the Mapping Partner should provide adequate documentation so that any such supplemental datasets could be beneficial to future Flood Risk Projects.
Regions and Mapping Partners should use discretion when considering whether to produce these dam datasets and where to apply them as part of a Flood Risk Project. Key decision factors are the accessibility of dam analysis modeling information and the ability to identify locations for which the creation of these datasets could be expected to increase the community’s risk awareness and/or lead them to mitigation actions. However, the availability of dam modeling information is not the only criteria to use when identifying the Dam Flood Risk Datasets to be funded; another key factor is an awareness of local dam management processes and topographic characteristics. It is, therefore, important that the applicability or benefit to the end user of the data be taken into account when selecting the Dam Flood Risk Datasets to be included in the project.
Additionally, if any of the Dam Flood Risk Products could introduce confusion or unnecessary complication for affected communities, or if any of the dam flood risk data otherwise might not specifically help the community better understand risk and take appropriate mitigation action, it may be best to avoid the use of those datasets. In other words, although it may be possible to create a particular Dam Flood Risk Dataset, the creation, use, and/or distribution of such datasets should be carried out with discretion in terms of usability and efficacy. Details on the appropriate application of each Dam Flood Risk Dataset are included in each dataset’s discussion below.

Dam-Specific Non-Regulatory Flood Risk Datasets May 2016 Guidance Document 68 Page 2
2.0 FRD-Related Guidance The Dam-Specific Flood Risk Datasets include the following tables and raster datasets in the FRD:
• S_RM_Dams_Pt: “Dam Locations”
• S_Dams_XS_Ln: “Dam Cross Sections” (also includes guidance for L_Dams_Scenario: “Dams Scenario Definition Table” and L_Dams_XS_MDL_Results: “Dam Model Results by Cross-Sections”
• S_US_Inundation_Ar: “Dam Upstream Inundation Areas”
• S_DS_Inundation_Ar: “Dam Downstream Inundation Areas”
• S_Easement_Ar: “Dam Easements”
• Arrv_xxxxxxxx Raster Dataset: “Dam Arrival Time Grids”
• FID_xxxxxxx Raster Dataset: “Dam Flood Inundation Duration Grids”
• Peak_xxxxxxx Raster Dataset: “Dam Time to Peak Grids”
Guidance specific to each of these tables is below.
2.1 Dam Locations
2.1.1 Definition and Purpose
This dataset contains point locations for dams that are included as part of a Flood Risk Project. Each dam will have one point placed at the center of the dam. The purpose of the point is to identify the location of the dam and to provide unique identification information.
2.1.2 Guidance for Creation
The analysis required to produce these points and associated data fields typically involves placing a point at the approximate longitudinal center of the dam, as shown in Figure 1. The use of georeferenced imagery can aid in placing the point in the correct location in relation to where the dam is located.

Dam-Specific Non-Regulatory Flood Risk Datasets May 2016 Guidance Document 68 Page 3
Figure 1: Dam Locations Dataset
The point itself is not used for analysis, but rather is used to populate dam-related data fields for the S_RM_Dams_Pt spatial table as detailed in the Flood Risk Database Technical Reference. The primary data fields include the following: commonly used name, dam descriptive information (including year built, length, height, storage volume, construction type, and drainage area), Hazard Class, National Inventory of Dams Identifier, owner’s name, and location (community, state). Specific domain values have been established for the dam construction type (D_Const_Typ table) and dam hazard class (D_HAZ_Class) as detailed in the Domain Tables Technical Reference.
The National Inventory of Dams may also be helpful in both locating the dam in question and also populating many of the data fields. Research of historical documents may also be beneficial, including review of digital drawings and reports or physical records at state, county, or municipal offices. Even when detailed information is provided by communities, careful inspection of design information and possibly field inspection is recommended (particularly for older dams) because dams are often upgraded over time to meet more stringent design guidelines.
2.1.3 Guidance for Use
This dataset is meant to provide key information about the dam and to provide unique identification within a Flood Risk Project. For studies with multiple dams, data field values from this dataset, such as year built or hazard class, can be used to produce maps showing relative information across a study and indicate locations with higher potential hazard. Since this dataset also includes the dam identification data linkage to other datasets, such as the National Inventory of Dams, it also serves as a connection to leverage other databases and their associated datasets.
Dam point placement

Dam-Specific Non-Regulatory Flood Risk Datasets May 2016 Guidance Document 68 Page 4
2.2 Dam Cross Sections and Dam Scenarios
2.2.1 Definition and Purpose
The dam cross section dataset contains lines representing the cross sections used in the dam release hydraulic model. There are three tables associated with dam cross sections: the Cross Section Line Spatial Table, the Dam Scenarios Definition Table, and the Dam Scenarios Results Data Table.
The Cross Section Line Spatial Table provides the location of the cross section along with data fields providing physical identification of the cross section including the associated stream, reach, dam, and the stream stationing at the cross section.
The Dam Scenarios Definition Table describes each scenario that was modeled for the dam. The scenario is defined as the unique combination of the flooding event, release type, and the condition of the reservoir at the time of the release.
The Dam Cross Section Model Results Lookup table provides modeling results for each model scenario. Results from multiple flood scenarios may exist within the related lookup table for each dam in such a way that users of the data can compare/contrast different scenarios.
2.2.2 Guidance for Creation
The S_Dams_XS_Ln spatial table contains the cross section locations and associated data fields. Figure 2 shows an example of these cross sections. Cross sections can be created using hydrology and hydraulic modeling software such the Army Corps of Engineers HEC-RAS software, or within specialized dam breach modeling software such as FEMA’s GeoDam-BREACH, the Natural Resources Conservation Service’s WinDAM B software, and the National Weather Service’s river mechanics models including BREACH and SMPDBK models. The use of these models does require some knowledge of hydraulic modeling and their associated guidance on cross section placement. Consult the model documentation for recommendations on cross section placement, especially in locations with dramatic changes in elevation and floodplain width. Automatic cross section creation tools may be used, but manual changes should be applied based on the locations of these dramatic changes.

Dam-Specific Non-Regulatory Flood Risk Datasets May 2016 Guidance Document 68 Page 5
Figure 2: Dam Cross Section Locations Dataset
The placement and spacing of cross sections will also have a significant impact on the stability of one dimensional unsteady models using the full Saint Venant Equation (including HEC-RAS, MIKE 11, and SWMM). In general, these unsteady models will become more stable as changes in invert elevations between cross sections decrease, and as the distance between the cross sections decrease. Interpolated cross sections and manual creation of low flow pilot channels with relatively small flow capacity may be necessary to stabilize some models.
The S_Dams_XS_Ln spatial table includes data fields for stream/river station, distance downstream from dam, and stream name. Selected outputs from the dam analysis are stored in the Dam Cross Section Model Results Lookup table (defined below).
The L_Dam_Scenario data table, as detailed in the Flood Risk Database Technical Reference, describes each scenario that was modeled for the dam. The Scenario Identification value is based on concatenation of abbreviations for the flooding event, release type, and the condition of the reservoir at the time of the release. Each of these three items is defined by a unique domain table. The D_Event domain table lists a range of possible event values, include percent annual chance events, Probable Maximum Flood (PMF), fractions of PMF, Probable Maximum Precipitation (PMP), fractions of PMP, Sunny Day, and Flood of Record. The D_Release_Typ domain type lists possible release types including piping, overtopping, and gate failure. The D_Reservoir_Cond domain table lists the possible reservoir conditions used for dam modeling scenarios including full, normal pool, primary spillway, and without dam.
The L_Dams_XS_MDL_Results data table is used to store the results from the dam modeling. This table also has data fields that can be populated to link to additional Dams Flood Risk datasets. Primary data fields in this table include water surface elevation, time to the arrival of the dam release, time to peak of dam release, and the duration time for dam release. The time
Dam-Specific Non-Regulatory Flood Risk Datasets May 2016 Guidance Document 68 Page 6
to arrival of dam release is defined as the time when there is a 1.0 foot increase in water surface elevation (WSEL) from the pre-scenario base flow, and the time to peak of dam release is defined as the time when the peak WSEL occurs. The flood inundation duration time is calculated by subtracting the arrival time from the time the flooding ends (when the WSELs fall back to 1.0 foot above the pre-scenario base flow level).
2.2.3 Guidance for Use
The cross sections are a primary component for hydraulic modeling; however, they are also used to summarize results at a specific location along a reach. For example, the cross sections are used to summarize results at specific locations, including calculated WSEs, flows, and velocities. Information from this database are consistent with riverine cross sections used to create the cross sections in the FIRM database and to populate the floodway data table in FIS reports.
The main use for these cross section data will likely be as an intermediate product that is used to produce other Dams Flood Risk Assessment datasets, such as scenario-specific flood inundation boundaries or arrival time raster datasets. Also, when Flood Risk Project budgets may not allow development of all possible Dams Flood Risk Assessment datasets, the cross section tables may be populated to allow for future additional data development.
2.3 Dam Upstream Inundation Areas
2.3.1 Definition and Purpose
This dataset contains polygons showing flood inundation areas upstream of a dam for various scenarios. Multiple flood scenarios may exist within the feature class for each dam, and the polygons can be attributed in such a way that users of the data can compare/contrast different scenarios. For example, users can symbolize the polygons to indicate the area between normal pool and the top of dam.
2.3.2 Guidance for Creation
The spatial analysis used to create these polygons involves mapping the WSEL associated with each scenario being produced (pool of the reservoir for 1% annual chance flood, design event (top of dam), etc.). The inundation polygons for each scenario should be discrete and non-overlapping, as shown in Figure 3, and similar to how the 1% and 0.2% annual chance flood polygons are produced and stored within the FIRM Database. The S_US_Inundation_Ar spatial table includes data fields to identify the dam scenario for each polygon and the location (communities and political areas) associated with the polygon.
2.3.3 Guidance for Use
This dataset could be used by communities as a planning tool to estimate the inundation level upstream of the dam that is studied. These areas may be outside of the 1% annual-chance floodplain for many potential dam conditions (e.g., ½ PMF, PMF, or the top of dam scenario), because many dams are designed to pass the 1% annual chance flood with freeboard. Many dam owners are responsible for the area located within the “shadow” of the dam. This would include the inundation limits caused from the top of dam elevation moving upstream. This

Dam-Specific Non-Regulatory Flood Risk Datasets May 2016 Guidance Document 68 Page 7
dataset will help define this area and also can be used for easement determination so development does not occur within this shadow. It is possible that a potential failure in dam operation (e.g., collapsing or blocked culvert) could increase the likelihood of the top of dam conditions upstream of the dam. This information may be useful for emergency management (e.g., road closures, traffic control points, evacuation routes, identification of critical facilities, and emergency transportation).
Figure 3: Dam Upstream Inundation Areas Dataset
While the regulatory 1% annual-chance flood event is represented by the mapped boundaries of the Special Flood Hazard Area (SFHA), there may remain areas at-risk for flooding for dam scenarios that produce floods larger than the 1% annual chance event, impacting areas outside of the SFHA. Therefore, this product should be used to communicate this risk to community members outside of the SFHA to aid with local planning efforts.. Since there are scenarios where flooding associated with a dam could have potential risks outside the SFHA, FEMA encourages homeowners outside the mapped SFHAs to take advantage of a Preferred Risk Policy (PRP). Communities may choose to use this dataset to encourage implementation of PRPs for these areas that are beyond the regulatory SFHA. More information on PRPs can be found on the FEMA website (www.fema.gov/media-library/assets/documents/17576?id=3907).
Generally, the flood risk datasets are provided to communities with the intention of providing enhanced flood hazard and/or flood risk information. However, this dataset should be presented to (and used by) communities with discretion, because this dataset represents conditions that may be less likely than the 1% annual-chance flood.

Dam-Specific Non-Regulatory Flood Risk Datasets May 2016 Guidance Document 68 Page 8
2.4 Dam Downstream Inundation Areas
2.4.1 Definition and Purpose
This dataset contains polygons showing flood inundation areas downstream of a dam for various release and dam failure scenarios. Multiple flood and dam failure scenarios may exist within the feature class for each dam, and the polygons will be attributed in such a way that users of the data can compare/contrast different scenarios. For example, users can symbolize the polygons to indicate the area between the 1% annual chance event and a sunny day release.
2.4.2 Guidance for Creation
The spatial analysis used to create these polygons is similar to the creation of the Upstream Inundation Areas, and involves mapping the WSEL associated with each scenario being modeled. The inundation polygons for each scenario should be discrete and non-overlapping, as shown in Figure 4. The S_DS_Inundation_Ar spatial table includes data fields to identify the dam breach scenario for each polygon and the location (communities and political areas) associated the polygon.
Figure 4: Dam Downstream Inundation Areas Dataset
2.4.3 Guidance for Use
This dataset could be used by communities as a planning tool to estimate the inundation level downstream of the dam that was analyzed. The dataset should leverage and supplement available data from Emergency Action Plan (EAPs) and state data related to downstream

Dam-Specific Non-Regulatory Flood Risk Datasets May 2016 Guidance Document 68 Page 9
hazard classifications. Similar to the upstream inundation areas, this downstream dataset may go outside of SFHA for different breach scenarios, because many dams are designed to pass the 1% annual chance flood with a limited amount of freeboard. While the regulatory 1% annual chance flood event is represented by the mapped boundaries of the SFHA, there may be additional areas at-risk from flooding, so this product should be used to communicate this risk to people outside of the SFHA. In the case of modeling of sunny day failures, it may also be valuable to educate community members on the risks involved if a dam failure were to occur under normal operating conditions.
2.5 Dam Easements
2.5.1 Definition and Purpose
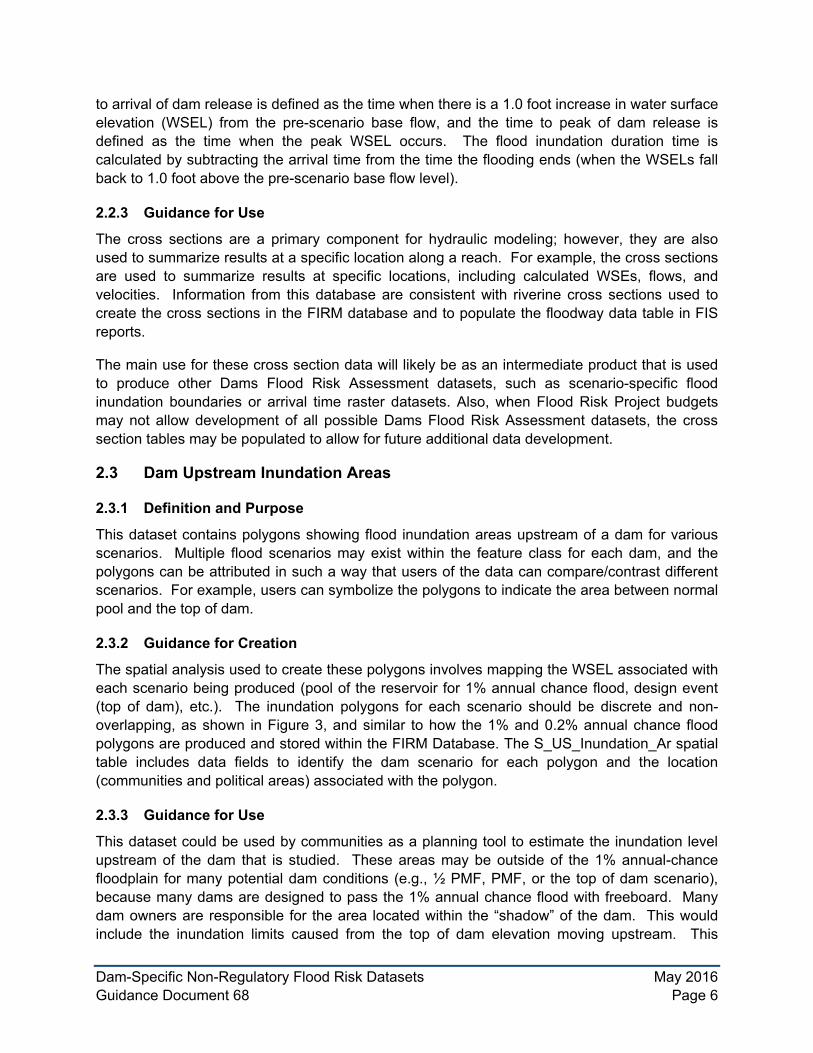
This dataset contains polygons showing existing easement polygons (where available) that limit or restrict development near dams. Easements can be for upstream or downstream inundation areas. Dam safety, emergency managers and local planners can utilize this data with upstream and downstream inundation areas to communicate at-risk areas that are already encumbered as well as target future possible easements. The easement polygons include information on the types of easements present, and the reasons an easement is required. The polygons should be associated with a specific dam location dataset.
2.5.2 Guidance for Creation
The easement area, as shown in Figure 5, is a polygon dataset. Since an easement is a legal property rights matter, existing digital data for the easements may be able to be obtained from a government agency at the local or state level or environmental conservation groups. An example at the national level is the National Conservation Easement Database, which contains easements compiled from land trusts and public agencies throughout the United States. Easements boundaries often change over time, so a careful investigation of historic and existing conditions is recommended for the most recent source data. However, if digital data is not available, but the easement boundary is known or identifiable, it can be created by digitizing the perimeter of the area while viewing orthoimagery.
The S_Easement_Ar spatial table for easements include the data fields associated with easement owner, date easement was acquired, type of easement, description, and image of easement document (if available). The type of easement is defined by the D_Esmt_Typ domain table and has types including conservation, drainage, and flowage.
2.5.3 Guidance for Use
This dataset could be used by communities to inform the public of the location of existing easements associated with dams. It is not uncommon for this information to be lost when a change of ownership occurs, so by emphasizing this information it is less likely that someone will construct a structure within an existing easement without understanding the risks involved. This information could effectively inform communities what parts of parcels may be at risk of flooding for modeled scenarios regardless of whether or not they are in the current mapped 1% annual chance floodplain. Dam safety, emergency managers, and local planners can utilize this data with upstream and downstream inundation areas to communicate at-risk areas that are already encumbered as well as target future easements.
Dam-Specific Non-Regulatory Flood Risk Datasets May 2016 Guidance Document 68 Page 10
Figure 5: Dam Easements Dataset
2.6 Dam Arrival Time Grids
2.6.1 Definition and Purpose
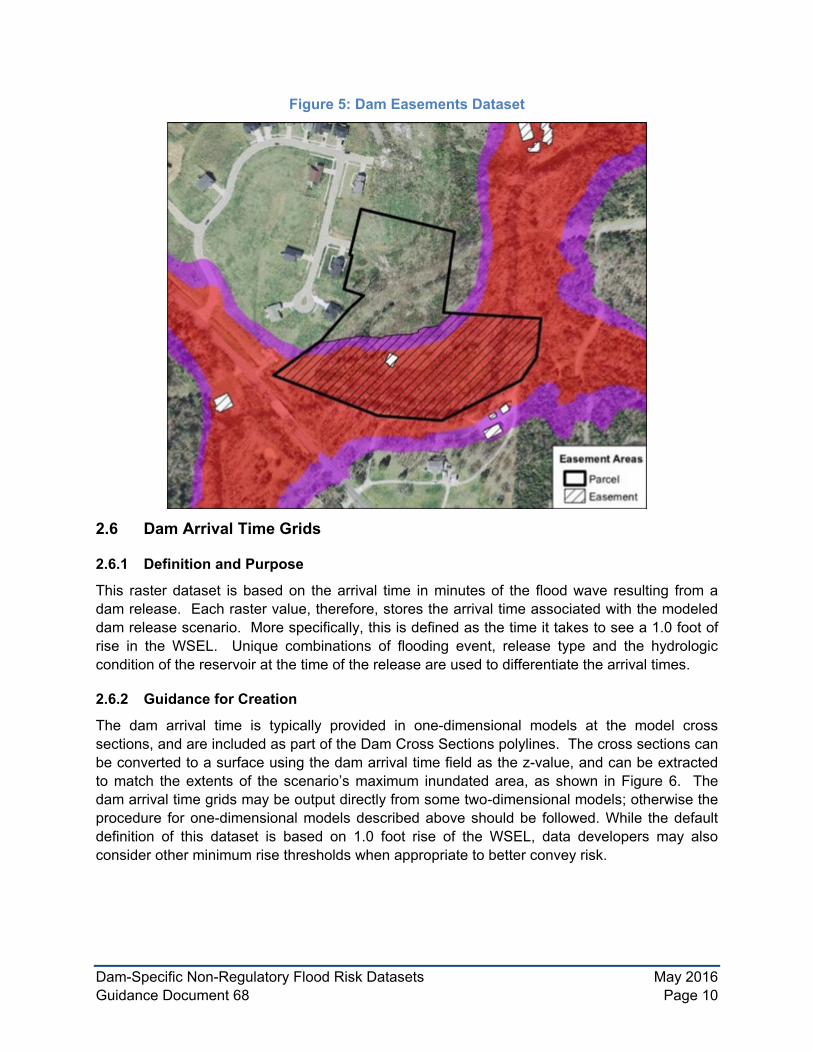
This raster dataset is based on the arrival time in minutes of the flood wave resulting from a dam release. Each raster value, therefore, stores the arrival time associated with the modeled dam release scenario. More specifically, this is defined as the time it takes to see a 1.0 foot of rise in the WSEL. Unique combinations of flooding event, release type and the hydrologic condition of the reservoir at the time of the release are used to differentiate the arrival times.
2.6.2 Guidance for Creation
The dam arrival time is typically provided in one-dimensional models at the model cross sections, and are included as part of the Dam Cross Sections polylines. The cross sections can be converted to a surface using the dam arrival time field as the z-value, and can be extracted to match the extents of the scenario’s maximum inundated area, as shown in Figure 6. The dam arrival time grids may be output directly from some two-dimensional models; otherwise the procedure for one-dimensional models described above should be followed. While the default definition of this dataset is based on 1.0 foot rise of the WSEL, data developers may also consider other minimum rise thresholds when appropriate to better convey risk.
Dam-Specific Non-Regulatory Flood Risk Datasets May 2016 Guidance Document 68 Page 11
Figure 6: Dam Arrival Time Grid Dataset
.
The naming convention for these raster datasets is “Arrv_xxxxxxxx”, where the x’s correspond to a specific dam breach scenario, using the naming convention in the L_Dam_Scenario table in the FRD. The Flood Risk Database Technical Reference includes additional details on these naming conventions. An arrival time grid can be created for each unique dam release scenario that was modeled.
2.6.3 Guidance for Use
This dataset can be in conjunction with some of the previously defined Dams Flood Risk datasets, such as downstream inundation areas, to show locations at risk for flooding from a dam breach. The dataset may also be in existing EAPs for high hazard dams. Communities can use these data as a planning tool to estimate the arrival time of a flood due to a dam breach and make educated decisions on the types of warning systems that may be necessary to protect community members from incoming flooding due to a dam breach. The arrival time values can also guiding planning efforts where arrival time may be too quick to allow for evacuation. This information will be useful for emergency management (e.g., road closures, traffic control points, evacuation routes, identification of critical facilities, and emergency transportation).
2.7 Dam Flood Inundation Duration Grids
2.7.1 Definition and Purpose
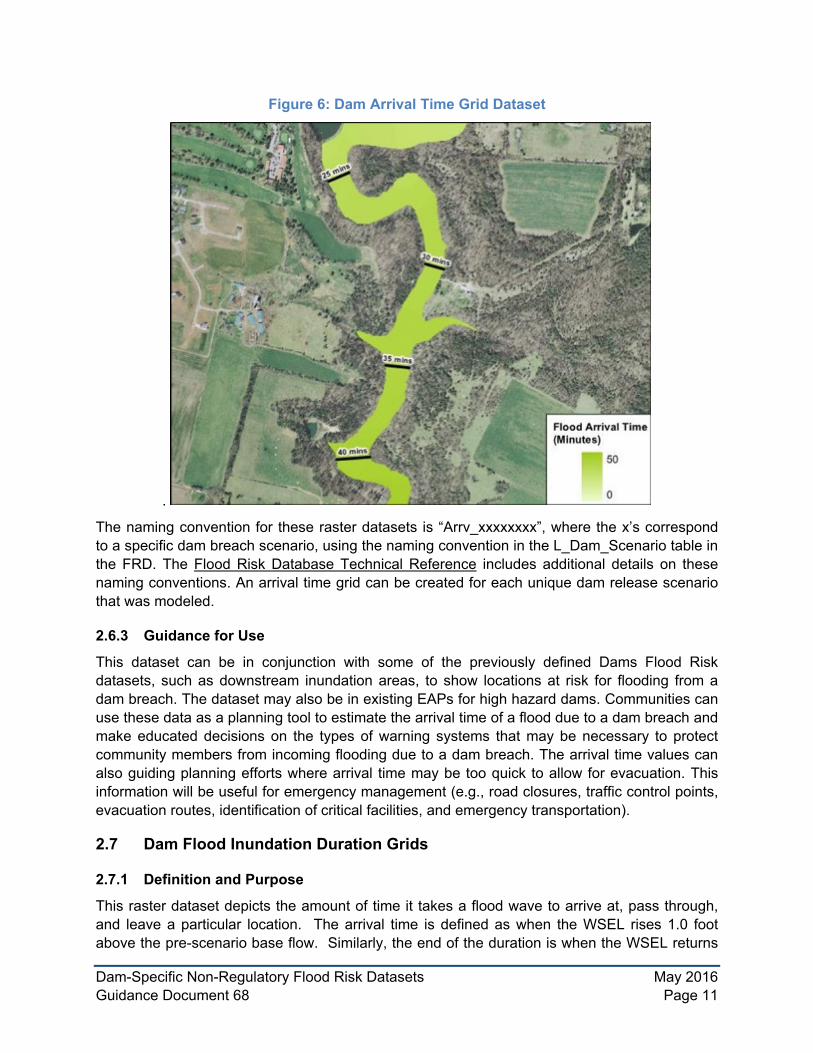
This raster dataset depicts the amount of time it takes a flood wave to arrive at, pass through, and leave a particular location. The arrival time is defined as when the WSEL rises 1.0 foot above the pre-scenario base flow. Similarly, the end of the duration is when the WSEL returns

Dam-Specific Non-Regulatory Flood Risk Datasets May 2016 Guidance Document 68 Page 12
to within 1.0 foot of the pre-scenario base flow. Time is measured in minutes. Unique combinations of flooding event, release type and the hydrologic condition of the reservoir at the time of the release are used to differentiate the flood inundation duration raster datasets.
2.7.2 Guidance for Creation
The spatial analysis required to produce these raster datasets closely resembles that required to create the dam arrival time grids. The extent of the raster datasets are the same as the dam arrival grid, so the arrival time grid can be used if it has already been created; otherwise, the extents of this grid should match the maximum inundation area associated with the scenario being modeled. Figure 7 shows an example of this raster dataset.
The dam arrival time and flood finish time are typically provided in one-dimensional models at the model cross sections. The flood duration is calculated by subtracting the dam arrival time from the dam finish time, and both the flood duration and flood arrival time are included as part of the Dam Cross Sections polylines. The cross sections can be converted to a surface using the flood duration field as the z-value, and then can be extracted to the extent of the arrival time grid.
The dam flood arrival time and flood ending time grids may be output directly from some two-dimensional models. These two grids can be subtracted to create the dam flood duration inundation grids, or if the grids are not provided then the procedure for one-dimensional models described above should be followed.
The naming convention for these raster datasets is “FID_xxxxxxxx”, where the x’s correspond to a specific dam breach scenario. The Flood Risk Database Technical Reference includes additional details on the naming convention that should be used based on the dam scenario.
Dam-Specific Non-Regulatory Flood Risk Datasets May 2016 Guidance Document 68 Page 13
Figure 7: Dam Flood Inundation Duration Grid Dataset
2.7.3 Guidance for Use
This dataset could be used by communities as a planning tool to estimate the duration of flooding due to a dam breach. Used in conjunction with information from EAPs, this dataset can be used to make educated decisions on the types of warning systems that may be necessary to protect community members from incoming flooding due to a dam breach, and to inform community members how long flooding may last after the arrival time. This information may be useful for emergency management (e.g., road closures, traffic control points, evacuation routes, identification of critical facilities, and emergency transportation).
2.8 Dam Time to Peak Grids
2.8.1 Definition and Purpose
This raster dataset depicts the time it takes for the peak of the inundation to reach a particular location. Time is measured in minutes. Unique combinations of flooding event, release type and the hydrologic condition of the reservoir at the time of the release are used to differentiate the time to peak raster datasets.
2.8.2 Guidance for Creation
The spatial analysis required to produce these raster datasets closely resembles that required to create the dam arrival time grids. The extent of the raster datasets are the same as the dam arrival grid, so the arrival time grid can be used if it has already been created; otherwise, the
Dam-Specific Non-Regulatory Flood Risk Datasets May 2016 Guidance Document 68 Page 14
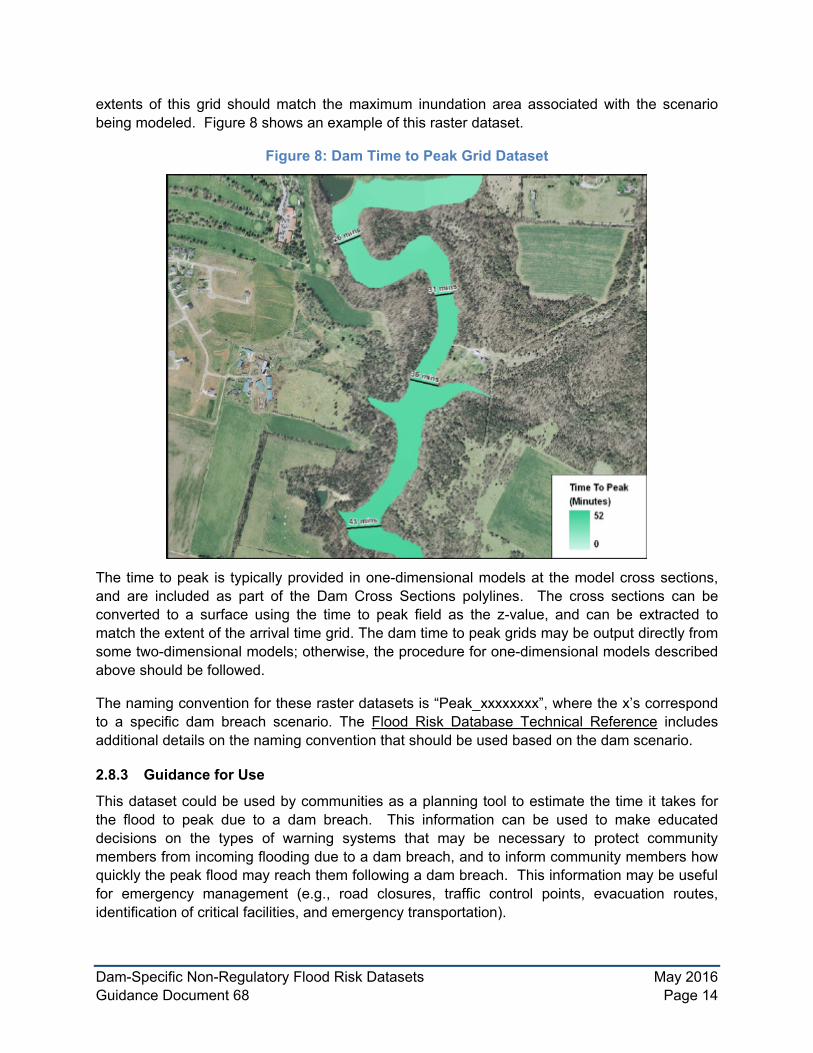
extents of this grid should match the maximum inundation area associated with the scenario being modeled. Figure 8 shows an example of this raster dataset.
Figure 8: Dam Time to Peak Grid Dataset
The time to peak is typically provided in one-dimensional models at the model cross sections, and are included as part of the Dam Cross Sections polylines. The cross sections can be converted to a surface using the time to peak field as the z-value, and can be extracted to match the extent of the arrival time grid. The dam time to peak grids may be output directly from some two-dimensional models; otherwise, the procedure for one-dimensional models described above should be followed.
The naming convention for these raster datasets is “Peak_xxxxxxxx”, where the x’s correspond to a specific dam breach scenario. The Flood Risk Database Technical Reference includes additional details on the naming convention that should be used based on the dam scenario.
2.8.3 Guidance for Use
This dataset could be used by communities as a planning tool to estimate the time it takes for the flood to peak due to a dam breach. This information can be used to make educated decisions on the types of warning systems that may be necessary to protect community members from incoming flooding due to a dam breach, and to inform community members how quickly the peak flood may reach them following a dam breach. This information may be useful for emergency management (e.g., road closures, traffic control points, evacuation routes, identification of critical facilities, and emergency transportation).
Dam-Specific Non-Regulatory Flood Risk Datasets May 2016 Guidance Document 68 Page 15
2.9 Other Dam-Related Flood Risk Datasets In addition to the dams-related datasets detailed earlier, there are a number of additional Flood Risk Datasets that can be developed for dams.
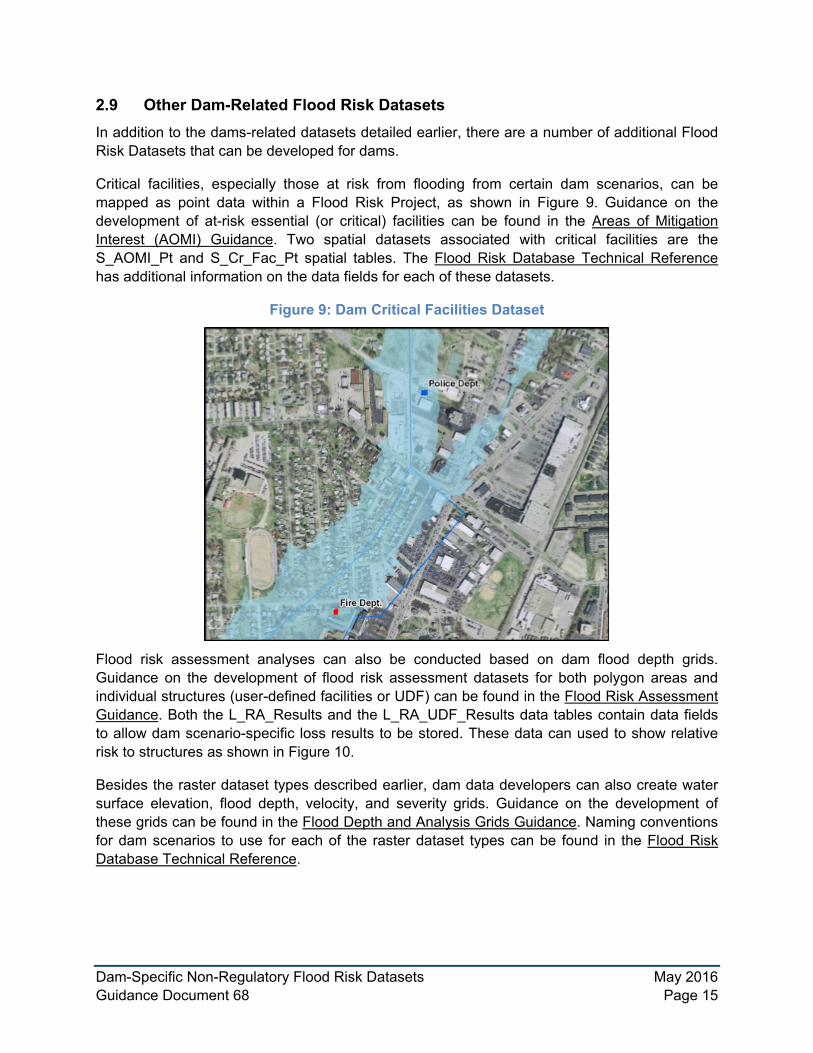
Critical facilities, especially those at risk from flooding from certain dam scenarios, can be mapped as point data within a Flood Risk Project, as shown in Figure 9. Guidance on the development of at-risk essential (or critical) facilities can be found in the Areas of Mitigation Interest (AOMI) Guidance. Two spatial datasets associated with critical facilities are the S_AOMI_Pt and S_Cr_Fac_Pt spatial tables. The Flood Risk Database Technical Reference has additional information on the data fields for each of these datasets.
Figure 9: Dam Critical Facilities Dataset
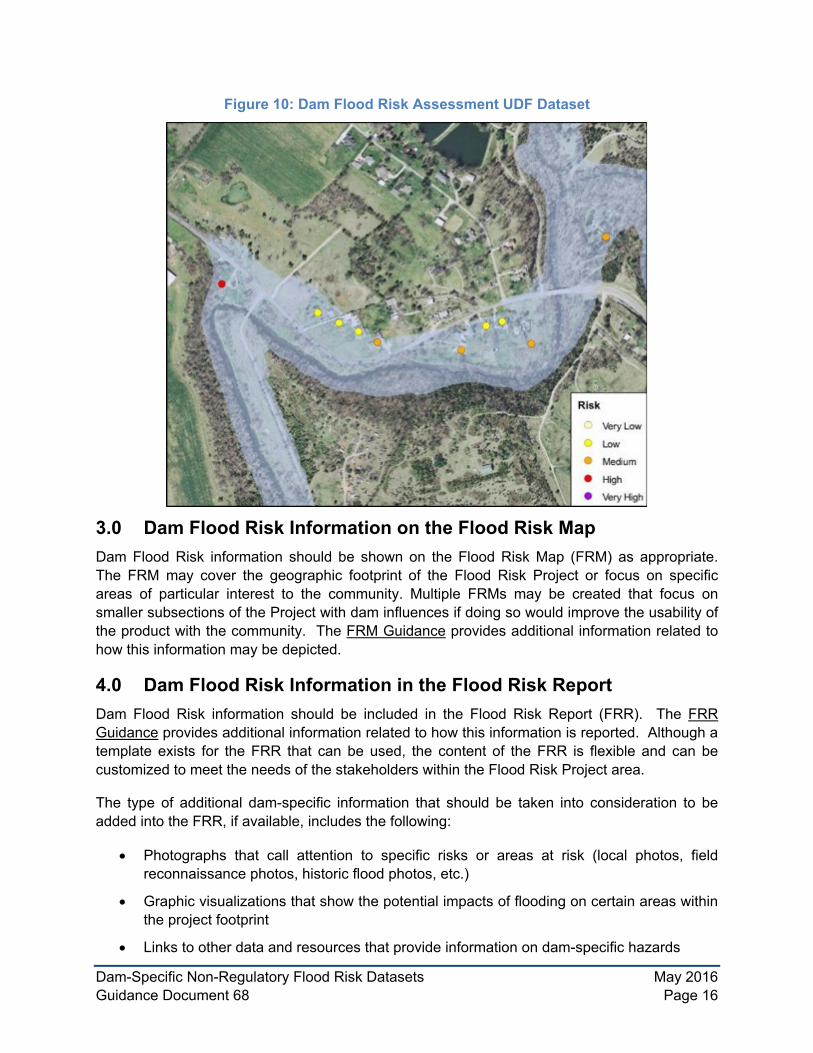
Flood risk assessment analyses can also be conducted based on dam flood depth grids. Guidance on the development of flood risk assessment datasets for both polygon areas and individual structures (user-defined facilities or UDF) can be found in the Flood Risk Assessment Guidance. Both the L_RA_Results and the L_RA_UDF_Results data tables contain data fields to allow dam scenario-specific loss results to be stored. These data can used to show relative risk to structures as shown in Figure 10.
Besides the raster dataset types described earlier, dam data developers can also create water surface elevation, flood depth, velocity, and severity grids. Guidance on the development of these grids can be found in the Flood Depth and Analysis Grids Guidance. Naming conventions for dam scenarios to use for each of the raster dataset types can be found in the Flood Risk Database Technical Reference.
Dam-Specific Non-Regulatory Flood Risk Datasets May 2016 Guidance Document 68 Page 16
Figure 10: Dam Flood Risk Assessment UDF Dataset
3.0 Dam Flood Risk Information on the Flood Risk Map Dam Flood Risk information should be shown on the Flood Risk Map (FRM) as appropriate. The FRM may cover the geographic footprint of the Flood Risk Project or focus on specific areas of particular interest to the community. Multiple FRMs may be created that focus on smaller subsections of the Project with dam influences if doing so would improve the usability of the product with the community. The FRM Guidance provides additional information related to how this information may be depicted.
4.0 Dam Flood Risk Information in the Flood Risk Report Dam Flood Risk information should be included in the Flood Risk Report (FRR). The FRR Guidance provides additional information related to how this information is reported. Although a template exists for the FRR that can be used, the content of the FRR is flexible and can be customized to meet the needs of the stakeholders within the Flood Risk Project area.
The type of additional dam-specific information that should be taken into consideration to be added into the FRR, if available, includes the following:
• Photographs that call attention to specific risks or areas at risk (local photos, field reconnaissance photos, historic flood photos, etc.)
• Graphic visualizations that show the potential impacts of flooding on certain areas within the project footprint
• Links to other data and resources that provide information on dam-specific hazards
Dam-Specific Non-Regulatory Flood Risk Datasets May 2016 Guidance Document 68 Page 17
5.0 Dataset Spatial Extents The dam-specific Flood Risk datasets should only be produced within the extents defined by the project footprint (S_FRD_Proj_Ar in the FRD). Within this Flood Risk Project area, they may be produced for single or multiple stream or river reaches, depending on applicability and data availability. The data delivered should not extend beyond S_FRD_Proj_Ar.
6.0 Data Delivery Timeline The Flood Risk Database Guidance provides recommendations as to when the Dam Flood Risk datasets should generally be provided to communities during the life of a Flood Risk Project, and the conditions under which they should be updated after their initial delivery.