DALLAS/FORT WORTH INTERNATIONAL … CHECKPOINTS Tiger Team 2005 Improving Throughput PLANNING...
29
SECURITY CHECKPOINTS Tiger Team 2005 Improving Throughput PLANNING DEPARTMENT DALLAS/FORT WORTH INTERNATIONAL AIRPORT Revised July 2006
-
Upload
phungkhanh -
Category
Documents
-
view
218 -
download
3
Transcript of DALLAS/FORT WORTH INTERNATIONAL … CHECKPOINTS Tiger Team 2005 Improving Throughput PLANNING...

SECURITY CHECKPOINTS Tiger Team 2005
Improving Throughput
PLANNING DEPARTMENT
DALLAS/FORT WORTH INTERNATIONAL AIRPORT
Revised July 2006
Table of Contents
Page Executive Summary 3 Study Objectives 4 Procedure 5 Standard Improvements 8 Issues to Avoid 16 Conclusions 17 Appendix A, Summary Of Checkpoint C10 Test Results A-1 Appendix B, Results of Testing for Placement of Bag/Slipper Display B-1
Dallas/Fort Worth International Airport Security Checkpoints: Improving Throughput Page 2
Executive Summary
Background During early spring of 2005, DFW officials were concerned that checkpoint wait times for airport passengers were becoming excessive. They were particularly concerned that projections indicated wait times could reach one hour during the peak summer travel period, if the screening process was not improved. Therefore, a review was conducted to identify ways to reduce checkpoint wait times and improve the experience for the traveling public. Modifications had to be completed by mid-May to support the summer travel schedule. Objective The Airport’s security checkpoints were studied with two goals in mind. First, it was important to improve the passengers’ understanding and comfort with the security screening process, in order to increase their ease of maneuvering this part of their travel. Second, amid potential TSA staff reductions, the Airport sought to avoid increased passenger wait times at checkpoints. Both goals were achieved with the highest security standards maintained. Findings The study revealed that the majority of checkpoint delays occurred in two primary locations: 1) immediately upstream of the x-ray machine, due to passenger failure to fully divest their belongings, and 2) immediately downstream of the x-ray machine, where passengers collect their belongings. Study results show that improved signage, ample and clear tabletop space for divesting, and a two-line merge at the x-ray machine reduced delays prior to the x-ray. Congestion following the x-ray machine was diminished by extending the distance the passengers moved beyond the x-ray before replacing their belongings. Factors working together to achieve this included roller bed extensions, improved space allocation, additional tables and benches provided toward the checkpoint exit, and signage to direct passengers beyond the x-ray area. Delays were also identified due to disruptions in power supply, cross-traffic stopping to view FIDS, delivery of concessionaire supplies, and TSA monitoring of exit corridors adjacent to the checkpoint. Results From this study a number of checkpoint enhancements were identified and implemented, yielding a 33% increase in throughput and a 9 minute reduction in the average wait time (43%). The resulting capacity increase across the airport’s 18 checkpoints to 240 passengers per lane per hour far exceeded the initial study goal of 200 passengers per lane per hour. The changes did not affect TSA screening activities, but focused on improving the passenger’s understanding of his/her role in the process. In addition, the average wait experienced by passengers during peak check-in times did not increase despite continuing traffic increases throughout the Summer 2005.
Dallas/Fort Worth International Airport Security Checkpoint: Improving Throughput Page 3
Study Objectives
The DFW Planning Department operated as an in-house consultant, leading the initiative with six primary objectives for the review.
1) To develop and implement short-term throughput improvements at security checkpoints
• To manage peak summer passenger demand • To minimize additional delays due to anticipated TSA staff reductions
2) To increase the average throughput per hour per lane to 200 passengers • To avoid hour long waits during the summer 2005, a consultant study
had shown that 200 passengers per hour would accomplish this goal 3) To partner with the TSA, air carriers, and DFW staff
• To fully understand each party’s issues • To seek collaborative solutions
4) To improve the experience for passengers
• To reduce anxiety • To improve the ease and speed with which customers pass through
security • To maintain high levels of customer satisfaction
5) To monitor expectations
• To understand limitations due to the physical configurations of the checkpoints and terminals
• To consider cost and time implications • To keep the project scope within 60 days
6) To complete the study and implementation on a limited schedule
• To complete study: 6 weeks • To complete implementation: 2 weeks • To meet a completion deadline of mid-May 2005 • To familiarize TSA staff with process improvements prior to Memorial
Day 2005
Dallas/Fort Worth International Airport Security Checkpoint: Improving Throughput Page 4
Procedure
Initially, the cross-organizational team was brought together for clarification of purpose, identification of specific problems, and idea generation for solutions. DFW Planning conducted on-site surveys observing passenger behavior, TSA requirements, and the affects of various changes on both. What was observed during these surveys was critical in developing possible improvements. Observations
• The x-ray is the critical element in the flow process. • Optimization requires eliminating downtime for the x-ray. • Boarding Passes were often sent through the x-ray, causing delays. • Often passengers were not fully divested upon reaching the x-ray, causing
delays. • Some passengers waited until arrival at the x-ray to begin divesting, causing
delays. • Too many signs resulted in passengers ignoring them all. • Passenger anxiety increased with the appearance of disorganization at the
checkpoint. • Increased anxiety produced passenger confusion regarding the divesting
process, causing delays at the x-ray. • X-ray screening stopped temporarily while passengers gathered belongings on
the composure side. • X-ray screening stopped temporarily while passengers put on their shoes next
to the roller bed. • Secondary screening was often required due to failure to remove belts, shoes,
cell phones, etc. • X-ray screening stopped temporarily when the secondary screening queue was
full (two people). • Backflow alarms for adjacent exit corridors caused temporary delays. • X-rays routinely went down due to power or maintenance issues. • Crowds viewing FIDS blocked checkpoint exits, increasing congestion and
causing delays. • Crowds at concessions kiosks blocked checkpoint exits, increasing congestion
and causing delays. In every instance above, the x-ray is the constraining factor. Although many other factors cause delays at the checkpoint, it is important to understand that each one relates back to a delay in the ability of the x-ray screener to maintain a constant flow. The focus for improving throughput became elimination of delays for the x-ray operator due to 1) passenger failure to fully divest and 2) passenger failure to quickly gather belongings and move beyond the x-ray area.
Dallas/Fort Worth International Airport Security Checkpoint: Improving Throughput Page 5
Procedure
To determine the best solution, the study group brainstormed ideas with regard to the observations collected. Seven alternative divesting area layouts were designed (see Appendix A), including single line x-ray feeds, dual line x-ray feeds requiring a merge at the x-ray, and a corral setup where divesting occurs at tables prior to choosing an x-ray line. During testing of these alternatives, the team collected throughput data, noted observations regarding passenger behavior and comfort levels, and observed the ease or difficulty of transferring bins and belongings to the x-ray belt. Divesting Layout Observations
• A two-line merge at the x-ray reduces delays by allowing one line to continue if the other is not fully divested upon reaching the x-ray, reducing delays for the x-ray operator.
• Both lines should be equi-distant from the x-ray to reduce passenger anxiety over whose turn is next.
• The distance between the table and the x-ray belt should not exceed 4 feet to eliminate multiple trips between the table and the belt for transfer of items.
• Bins should be provided upstream of the divesting tables to encourage earlier divesting.
• Removal of bins from the table top allows more passengers to begin divesting early.
• Providing ample divesting tables pulls passengers into the process sooner and out of the queue, reducing passenger anxiety over reaching their gate on time.
• Twelve linear feet of table top space per line is optimal to allow several people to divest simultaneously.
• Generous vacant space within the divesting area improves the flow by allowing passengers to easily maneuver belongings.
• Passengers did not always see the farthest lines, reducing the productivity of those x-rays.
• Passengers often exhibit follow-the-leader behavior. It became evident very quickly that improved communication of the divesting procedure would facilitate checkpoint operations, reducing both delays and passenger anxiety. Both verbal and illustrative communication methods were tested as well as the most effective placement for this communication. Communication Method Observations
• Pictograms with minimal text were most effective in being read and understood by the majority of passengers.
• Signage placement was found to be most effective when easily referenced during divesting, resulting in placement down the centerline of the tables.
• Redundant and unnecessary signage was removed. Observations revealed that passengers were more likely to read signs if the number of signs was minimal and the message was quickly comprehended.
• TSA has several regulatory signs that are required. These regulation signs were removed from stanchion toppers and reorganized in consistent sizes and
Dallas/Fort Worth International Airport Security Checkpoint: Improving Throughput Page 6
Procedure
frames on the checkpoint wall to improve sign visibility and checkpoint appearance.
• Verbal cues during divesting were tested and found helpful. Local TSA routinely give verbal queues to passengers regarding divesting procedures.
• Floor arrows and divesting line numbers were found helpful to assist passengers in identifying available divesting lines.
An executive interest in providing bags for pocket items and slippers to encourage early shoe removal resulted in complimentary provision of these helpful items at each checkpoint across DFW Airport. To determine optimal placement of the display for these items yielding highest usage and minimal impact on other ticket checking and divesting activities, the display was tested within the divesting area, next to the ticket checker, and prior to ticket checking activities. Bag & Slipper Display Placement Observations (see Appendix B)
• Display placement within the divesting area resulted in cross traffic flows and additional time for passengers to decide what to place in the bag, causing delays at the x-ray.
• Display placement next to the ticket checker caused the passenger’s attention to be divided between the two activities, resulting in delays with ticket checking and, therefore, delays with divesting resulting in delays for the x-ray.
• Display placement at least 10 feet prior to the ticket checker yielded best results with a sustained queue as passengers took a moment to consider usage of the items without causing any delays in ticket checking or divesting activities.
Bag & Slipper Usage Observations
• Bags had a positive affect on earlier divesting of pocket items. • Slippers had a positive affect on earlier removal of shoes. • Throughput rates did not indicate a significant increase due to the use of bags
and slippers. • As a customer service initiative, the bags and slippers remained a part of the
DFW security process.
Dallas/Fort Worth International Airport Security Checkpoint: Improving Throughput Page 7
Standard Improvements
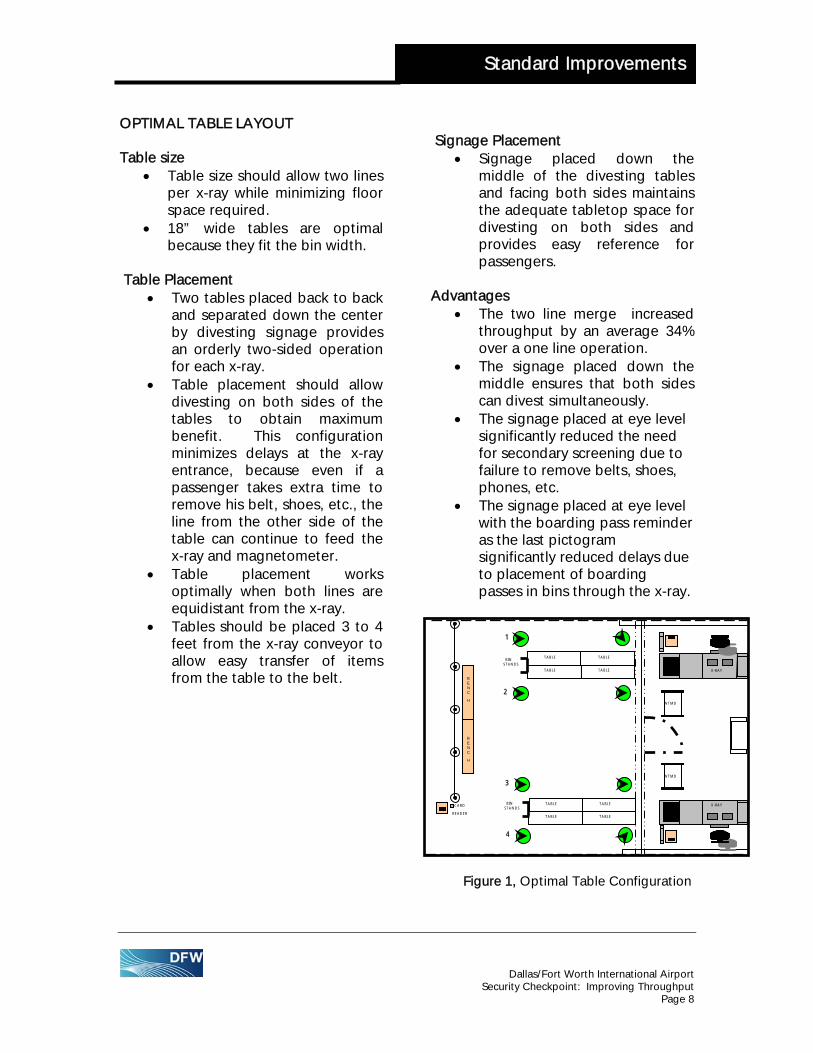
OPTIMAL TABLE LAYOUT Table size
• Table size should allow two lines per x-ray while minimizing floor space required.
• 18” wide tables are optimal because they fit the bin width.
Table Placement
• Two tables placed back to back and separated down the center by divesting signage provides an orderly two-sided operation for each x-ray.
• Table placement should allow divesting on both sides of the tables to obtain maximum benefit. This configuration minimizes delays at the x-ray entrance, because even if a passenger takes extra time to remove his belt, shoes, etc., the line from the other side of the table can continue to feed the x-ray and magnetometer.
• Table placement works optimally when both lines are equidistant from the x-ray.
• Tables should be placed 3 to 4 feet from the x-ray conveyor to allow easy transfer of items from the table to the belt.
Signage Placement
• Signage placed down the middle of the divesting tables and facing both sides maintains the adequate tabletop space for divesting on both sides and provides easy reference for passengers.
Advantages
• The two line merge increased throughput by an average 34% over a one line operation.
• The signage placed down the middle ensures that both sides can divest simultaneously.
• The signage placed at eye level significantly reduced the need for secondary screening due to failure to remove belts, shoes, phones, etc.
• The signage placed at eye level with the boarding pass reminder as the last pictogram significantly reduced delays due to placement of boarding passes in bins through the x-ray.
Figure 1, Optimal Table Configuration
TABLE
TABLE TABLE TABLE
TABLE
TABLE
TABLE TABLE
TABLE
CARD
READER
BINSTANDS
BINSTANDS
4
3
2
1
X-RAY
X-RAY
WTMD
WTMD
BENC
H
BENC
H
Dallas/Fort Worth International Airport Security Checkpoint: Improving Throughput Page 8
Standard Improvements
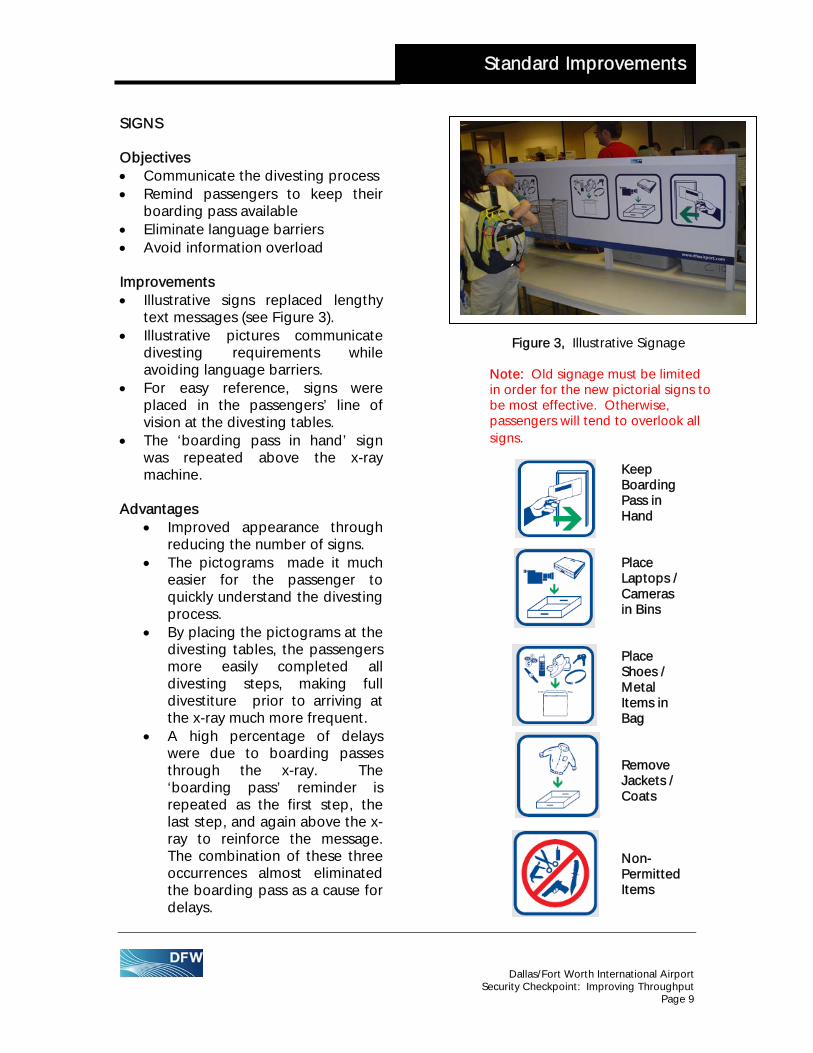
SIGNS Objectives • Communicate the divesting process • Remind passengers to keep their
boarding pass available • Eliminate language barriers • Avoid information overload Improvements • Illustrative signs replaced lengthy
text messages (see Figure 3). • Illustrative pictures communicate
divesting requirements while avoiding language barriers.
Figure 3, Illustrative Signage Note: Old signage must be limited in order for the new pictorial signs to be most effective. Otherwise, passengers will tend to overlook all signs.
• For easy reference, signs were placed in the passengers’ line of vision at the divesting tables.
• The ‘boarding pass in hand’ sign was repeated above the x-ray machine.
Advantages
• Improved appearance through reducing the number of signs.
• The pictograms made it much easier for the passenger to quickly understand the divesting process.
• By placing the pictograms at the divesting tables, the passengers more easily completed all divesting steps, making full divestiture prior to arriving at the x-ray much more frequent.
• A high percentage of delays were due to boarding passes through the x-ray. The ‘boarding pass’ reminder is repeated as the first step, the last step, and again above the x-ray to reinforce the message. The combination of these three occurrences almost eliminated the boarding pass as a cause for delays.
Keep Boarding Pass in
and H Place Laptops / Cameras
Bins in Place Shoes / Metal Items in
ag B Remove Jackets / Coats Non-Permitted Items
Dallas/Fort Worth International Airport Security Checkpoint: Improving Throughput Page 9
Standard Improvements
FLOOR ARROWS
• ssengers to open lanes for
• ine, leaving the far lines vacant
at times
•
•
t to the cker (see Figure 4).
•
•
•
•
r due to no one being in those lines.
OOR ARROWS
• ssengers to open lanes for
• ine, leaving the far lines vacant
at times
•
•
t to the cker (see Figure 4).
•
•
•
•
r due to no one being in those lines.
Objectives
Direct paObjectives
Direct padivesting Reduce passenger tendency to stop at the first l
divesting Reduce passenger tendency to stop at the first l
Improvements
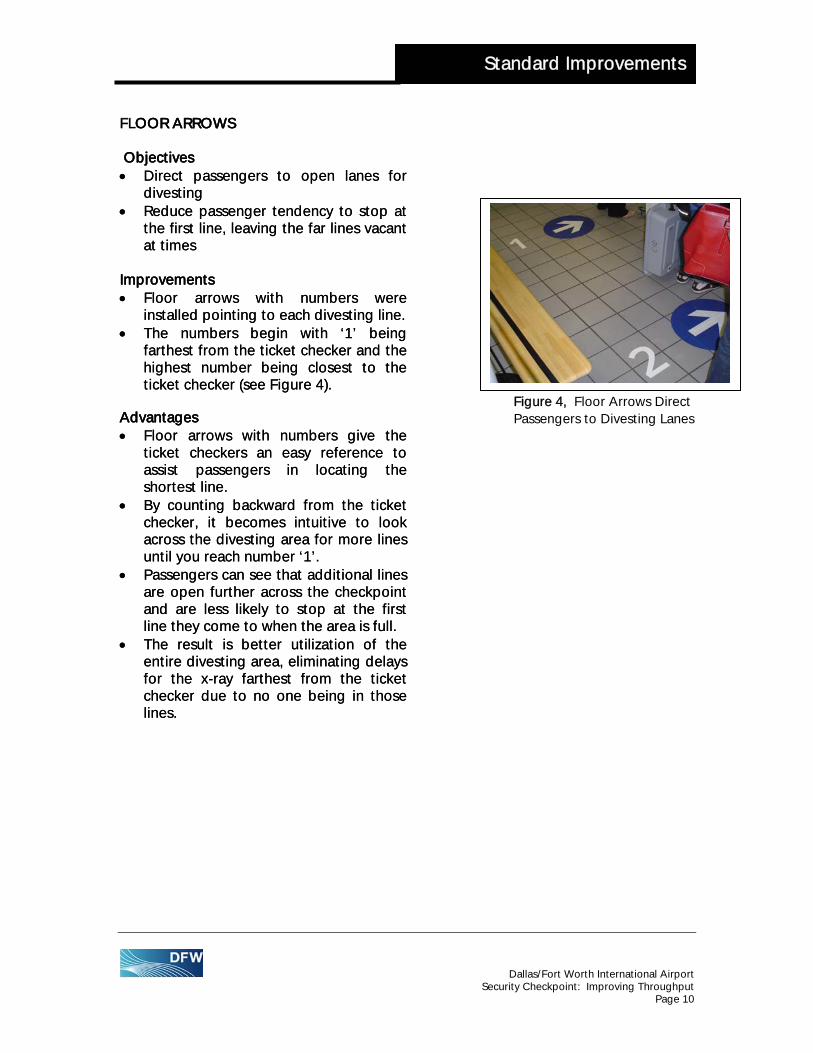
Floor arrows with numbers were Improvements
Floor arrows with numbers were installed pointing to each divesting line. The numbers begin with ‘1’ being farthest from the ticket checker and the highest number being closes
installed pointing to each divesting line. The numbers begin with ‘1’ being farthest from the ticket checker and the highest number being closesticket che
ticket che
Figure 4, Floor Arrows Direct Advantages
Floor arrows with numbers give the ticket checkers an easy reference to assist passen
Advantages Floor arrows with numbers give the ticket checkers an easy reference to assist passen
Passengers to Divesting Lanes
gers in locating the shortest line. By counting backward from the ticket checker, it becomes intuitive to look across the divesting area fo
gers in locating the shortest line. By counting backward from the ticket checker, it becomes intuitive to look across the divesting area for more lines until you reach number ‘1’. Passengers can see that additional lines are open further across the checkpoint and are less likely to stop at the first
r more lines until you reach number ‘1’. Passengers can see that additional lines are open further across the checkpoint and are less likely to stop at the first line they come to when the area is full. The result is better utilization of the entire divesting area, eliminating delays for the x-ray farthest from the ticket checke
line they come to when the area is full. The result is better utilization of the entire divesting area, eliminating delays for the x-ray farthest from the ticket checke
Secur
Dallas/Fort Worth Inteity Checkpoint: Impro
rnational Airport ving Throughput
Page 10
Standard Improvements
BIN HOLDERS Objectives • Increase tabletop space for divesting • Encourage earlier divesting • Provide organized appearance of bins
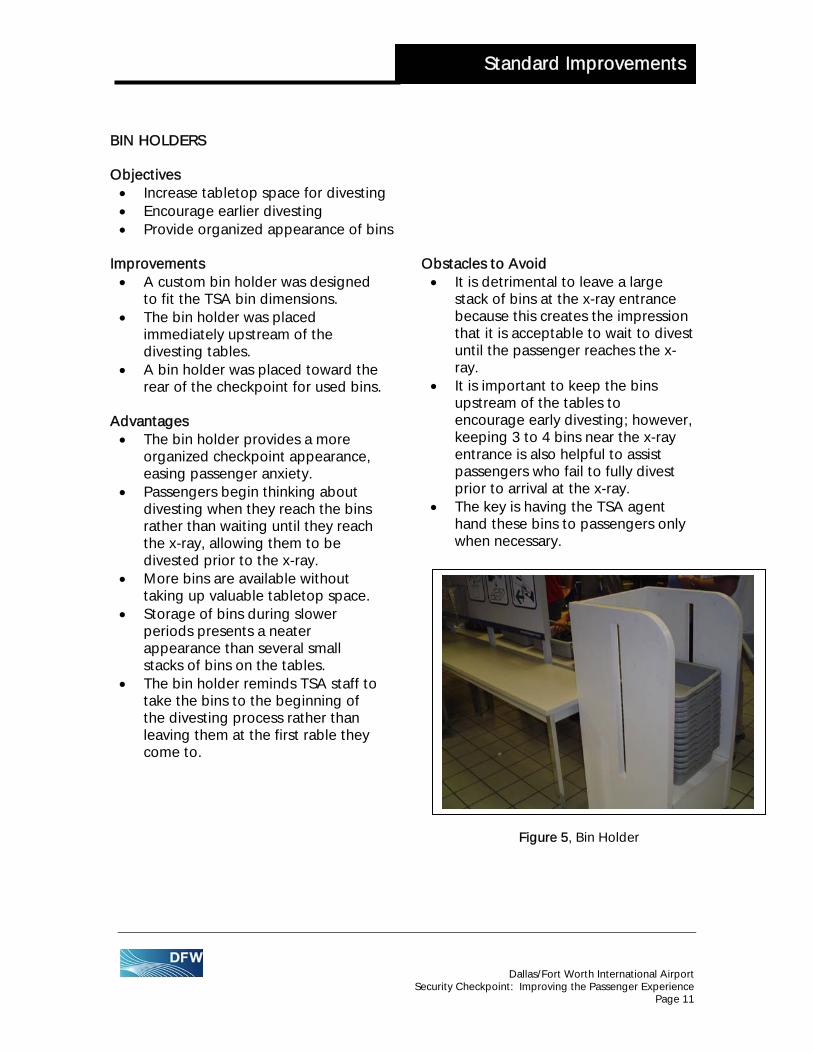
Improvements • A custom bin holder was designed
to fit the TSA bin dimensions. • The bin holder was placed
immediately upstream of the divesting tables.
• A bin holder was placed toward the rear of the checkpoint for used bins.
Advantages • The bin holder provides a more
organized checkpoint appearance, easing passenger anxiety.
• Passengers begin thinking about divesting when they reach the bins rather than waiting until they reach the x-ray, allowing them to be divested prior to the x-ray.
• More bins are available without taking up valuable tabletop space.
• Storage of bins during slower periods presents a neater appearance than several small stacks of bins on the tables.
• The bin holder reminds TSA staff to take the bins to the beginning of the divesting process rather than leaving them at the first rable they come to.
Obstacles to Avoid • It is detrimental to leave a large
stack of bins at the x-ray entrance because this creates the impression that it is acceptable to wait to divest until the passenger reaches the x-ray.
• It is important to keep the bins upstream of the tables to encourage early divesting; however, keeping 3 to 4 bins near the x-ray entrance is also helpful to assist passengers who fail to fully divest prior to arrival at the x-ray.
• The key is having the TSA agent hand these bins to passengers only when necessary.
Figure 5, Bin Holder
Dallas/Fort Worth International Airport Security Checkpoint: Improving the Passenger Experience Page 11

Standard Improvements
ADDITIONAL BINS
CONVEYOR (3) Max. of 3 Bins on Conveyor X-RAY (3) Max. of 3 Bins in x-ray RE-COMPOSURE AREA (18) 9 Bins per 6’ Roller Extension Bin Storage Unit in Re-Composure Area
Objectives • Eliminate potential delays from
shortage of bins • Allow full use of additional divesting
tables Improvements • Calculated process max capacity for
bins, dependent upon checkpoint layout
• Determined additional buffer to allow process to continue while bins are being re-supplied
• Provided additional bins for each checkpoint, as necessary. Bin ordering information is provided in Figure 7.
Computations • Calculate the maximum number of bins
the process can hold plus a buffer for re-supply in the divesting area.
Figure 6, Maximum Bins by Each Process Component
• See Figure 6 for the number of bins that each component of the process will hold.
Advantages • Eliminates delays at the x-ray due to
passengers being unable to divest due to lack of bins available.
Secu
Figure 7, Bin Order Information
Dallas/Fort Worth International Airport rity Checkpoint: Improving the Passenger Experience
Page 12
Standard Improvements
DIVESTING BAGS & SLIPPERS Objectives • Encourage early divesting • Allow prompt exit from x-ray area Improvements • Provided clear plastic drawstring
bags with dimensions of 12”x18”. • Provided disposable slippers. Advantages • Bags eliminate the need for digging
change, watches, etc. out of the small bowls, resulting in a quicker exit from the x-ray area and reducing delays at the x-ray due to congestion in the composure area.
• Clear bags allow customers to quickly identify their belongings post x-ray.
• Slippers protect bare feet from high traffic floors.
• Slippers encourage passengers to walk further beyond the x-ray area prior to putting on their shoes.
DIVESTIN BAG & SLIPPER DISPLAY Objective• Illustr
bags • Provi
acces• Provi
arriva• Minim
tasks• Minim Improvem• Displ
10 fecheck
• An adproviaccomrecon
Advantag• Provid
the b• Clearl
for th
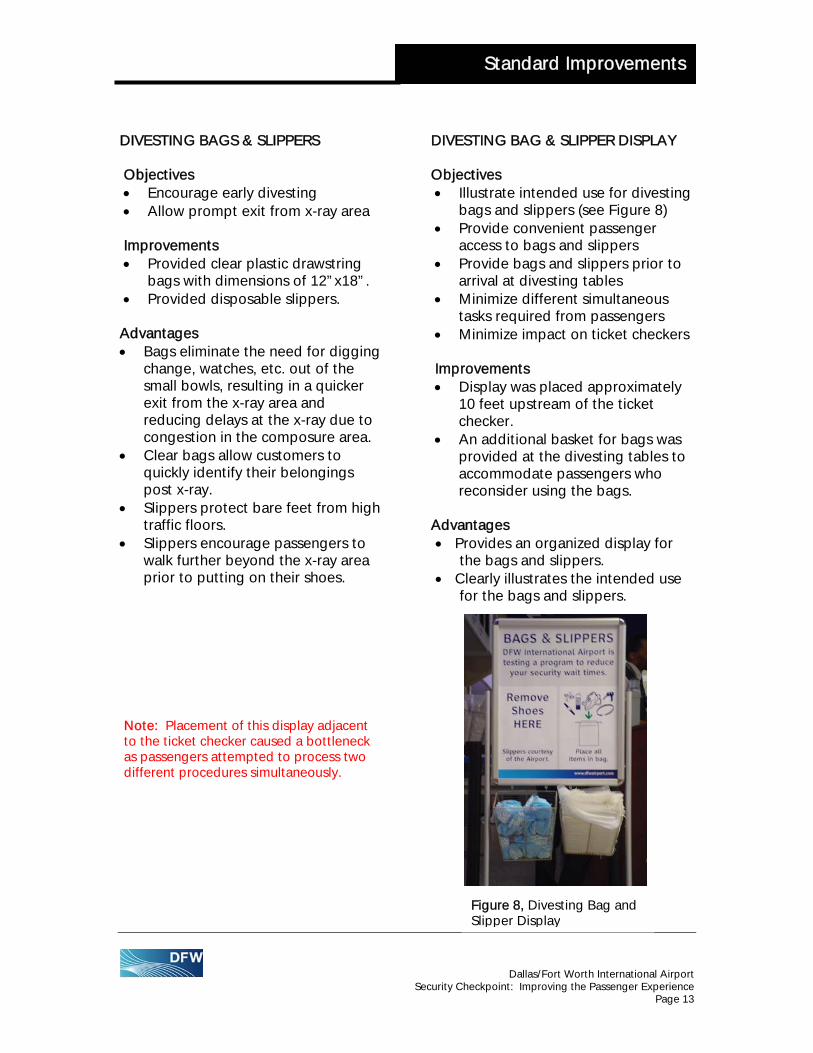
Note: Placement of this display adjacent to the ticket checker caused a bottleneck as passengers attempted to process two different procedures simultaneously.
FiguSlip
Security Checkp
G
s ate intended use for divesting and slippers (see Figure 8) de convenient passenger s to bags and slippers de bags and slippers prior to l at divesting tables ize different simultaneous
required from passengers ize impact on ticket checkers
ents ay was placed approximately et upstream of the ticket er. ditional basket for bags was
ded at the divesting tables to modate passengers who
sider using the bags.
es es an organized display for ags and slippers. y illustrates the intended use e bags and slippers.
re 8, Divesting Bag and per Display
Dallas/Fort Worth International Airport oint: Improving the Passenger Experience
Page 13
Standard Improvements
ROLLER EXTENSIONS Objectives • Alleviate post x-ray congestion • Minimize post x-ray delays Improvements • Installed one additional 6-foot
roller bed extension to the back end of each x-ray where space permitted.
Advantages • The congestion point is moved
farther away from the critical magnetometer/x-ray processing area, reducing x-ray delays caused by congestion near the x-ray.
• The post x-ray space available for belongings increased by 50%, reducing x-ray delays because the bags could not move forward until passengers picked up the ones that had been screened already.
TRASH CANS Objectives • Provide for proper disposal of used
bags & slippers Improvements • Additional trash cans were
provided at the rear of each checkpoint.
Ad• Reduces the need for TSA staff to
pick up bags left on tables, benches or floors.
vantages
• Keeps the checkpoint appearance neat and orderly.
BENCHES Objectives • Aide passengers in shoe removal
and replacement • Minimize delays caused by shoe
removal and replacement Improvements • Provided benches in the divesting
area. Observations showed that the benches were seldom used for divesting; however, they were greatly appreciated by the passengers who did use them.
• Provided benches in the composure area. Observations showed that the benches on the composure side were used regularly by passengers to replace shoes or reorganize themselves prior to leaving the checkpoint.
Advantages • On the divesting side, customers
who needed to sit down to remove their shoes appreciated the benches.
• On the composure side, passengers moved toward the benches, and therefore the rear of the checkpoint, reducing congestion within the checkpoint that, in turn, causes delays for the x-ray.
Note: Make sure that the benches are designed not to tip when an adult sits on one end.
Dallas/Fort Worth International Airport Security Checkpoint: Improving the Passenger Experience Page 14

Standard Improvements
OTHER FACTORS THAT AFFECT THROUGHPUT Objectives • Reduce delays resulting from non-
checkpoint related activities Improvements • Relocated kiosks
DFW assisted in relocating two concessions kiosks located across from checkpoint exits.
• Relocated FIDS
In conjunction with airlines, DFW relocated FIDS that were across from congested checkpoint exits. FIDS located on the non-secure side of the terminal were relocated to increase the available space for checkpoint queuing.
Advantages • Relocation of concessions kiosks
provided a less crowded environment for shoppers.
• Relocation of kiosks also reduced congestion in the walkway, enabling passengers to exit the checkpoint more quickly and reduce backups causing x-ray delays.
• Relocation of FIDS on the secure side of the checkpoint reduced congestion in the walkway, enabling passengers to exit the checkpoint more quickly and reduce backups causing x-ray delays.
Dallas/Fort Worth International Airport Security Checkpoint: Improving the Passenger Experience Page 15

Issues to Avoid
Remember that change can often make people uncomfortable. Some pitfalls may be avoided with good communication before proceeding with changes. • Communication with all affected stakeholders is key. This was accomplished at a
relatively high level with weekly meetings with decision makers within each organization.
• Obtain buy-in from all airline supervisors, terminal managers, and TSA supervisors
prior to implementing changes. It is important to make sure that each organization has clearly communicated the upcoming changes as well as the advantages anticipated down to their employees who actually work in the environment.
• The airport could schedule meetings in which airport staff, along with TSA and
airline personnel, brief these groups. It is important for the groups to understand that the study process occurred in the field and that their own colleagues participated in the tests and resulting improvements. This can significantly increase their confidence in the upcoming changes.
• Collaborate regarding any unique obstacles at each individual checkpoint.
Dallas/Fort Worth International Airport Security Checkpoint: Improving Throughput Page 16

Conclusions
DFW International Airport continuously monitors checkpoint performance with an eye toward constant improvement. • Throughput capacity (per lane average) increased by 33% without capital
improvements to the checkpoints, resulting in an improved average capacity across the 18 checkpoints airport-wide of 240 passengers per lane per hour.
• Max wait time has dropped by an average of 9 minutes across DFW from 21
minutes to 12 (43% reduction). • Overall, stakeholders agree that the process is easier for passengers to
understand, as well as more efficient in moving them quickly through security. • Passenger traffic continued to rise 1-2% per week throughout the Summer 2005,
but the average max wait time remained constant at 12 minutes during peak hours.
• J.D. Powers 2005 survey results indicated that passengers are “Pleased/Delighted”
with security check at DFW International Airport. • J.D. Powers 2005 survey results indicated a higher passenger satisfaction rating for
security check at DFW International Airport in 2005 than in any of the previous four years.
Dallas/Fort Worth International Airport Security Checkpoint: Improving Throughput Page 17
Appendix ACheckpoint C10 Test Results
CAUSES OF DELAYS 1. Passenger reluctance to remove shoes 2. Boarding passes placed in the x-ray bins, requiring TSA assistance 3. Laptop still in its bag; jacket or bag placed on top of laptop, etc. 4. Families coming through the checkpoint, as the adults help the children 5. A full selectee queue, waiting for TSA assistance 6. Passenger failure to fully divest prior to walking through the metal detector (see
Table A1)
Men Jackets, Belts, Phones, Shoes
Women Jackets, Belts, Jewelry Table A1, Items not Fully Divested 7. Daytime concession deliveries through the checkpoint 8. Congestion in the composure area 9. TSA requiring assistance with a bag check in the x-ray 10. X-ray out of service (maintenance or power supply issue). Improvements to both the divesting and composing areas were shown to reduce delays and facilitate job performance by TSA personnel and ticket checkers. The optimal layout was determined through a series of tests. All layouts considered are included in this appendix, with the best results observed from Layout #4. Divesting instructions depicted through illustrations with minimal text increased occurrences of passengers being fully divested prior to reaching the x-ray and metal detector. It is important to note that the constraining factor is the x-ray process. While the speed of this process cannot be increased, many factors on either side of it do leave room for improvement.
A-1

Appendix ACheckpoint C10 Test Results
OBSERVATIONS Layout #1 Observations The first test layout for the divesting area used double tables in the center and a single row of tables against each wall. Bins were placed upstream from tables in a bin holder (see Figure A1).
• Placing bins in a holder upstream of the tables provided clear table space for divesting.
• Passengers showed a preference for the outer lanes because those appeared to be the primary line into the x-ray.
• The center tables were not always used. • With a single row of narrow tables, two bins holding passenger belongings
were pushed off onto the floor. • This layout would require additional bins. • Passengers divesting at center tables tend to get at the back of the wall lines
rather than creating a merge at the x-ray.
Figure A1, Divesting Area Table Configuration, Test #1
A-2
Appendix ACheckpoint C10 Test Results
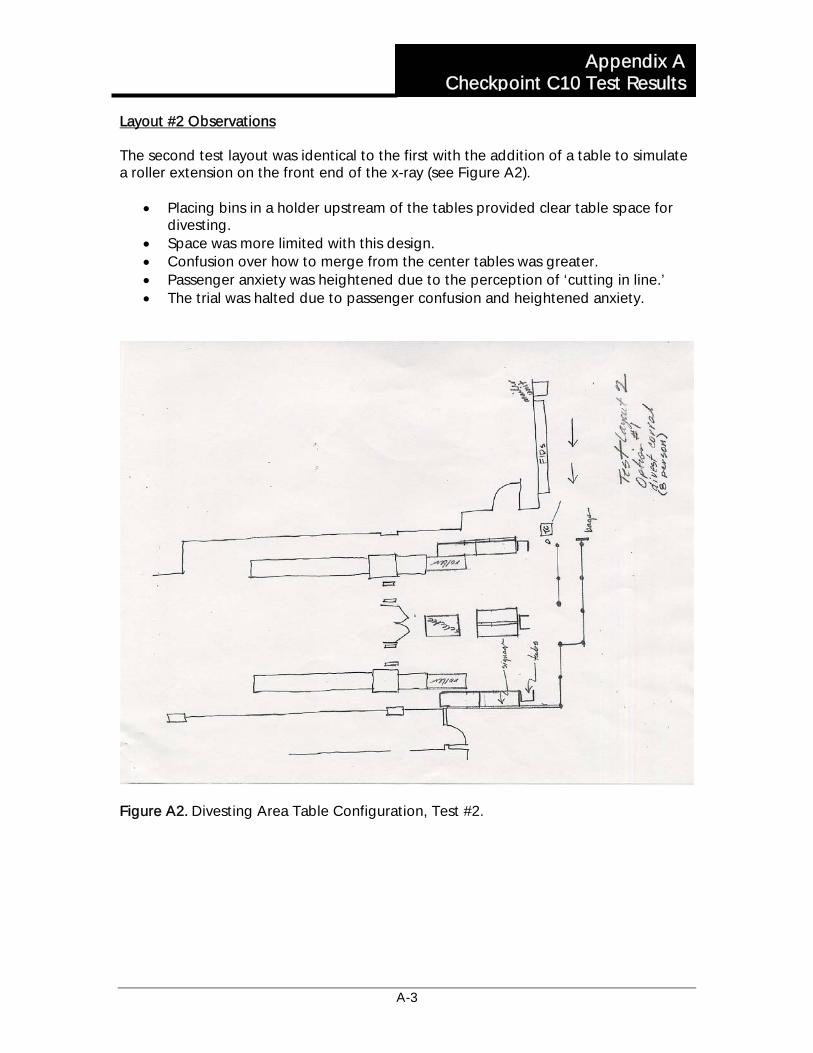
Layout #2 Observations The second test layout was identical to the first with the addition of a table to simulate a roller extension on the front end of the x-ray (see Figure A2).
• Placing bins in a holder upstream of the tables provided clear table space for divesting.
• Space was more limited with this design. • Confusion over how to merge from the center tables was greater. • Passenger anxiety was heightened due to the perception of ‘cutting in line.’ • The trial was halted due to passenger confusion and heightened anxiety.
Figure A2. Divesting Area Table Configuration, Test #2.
A-3
Appendix ACheckpoint C10 Test Results
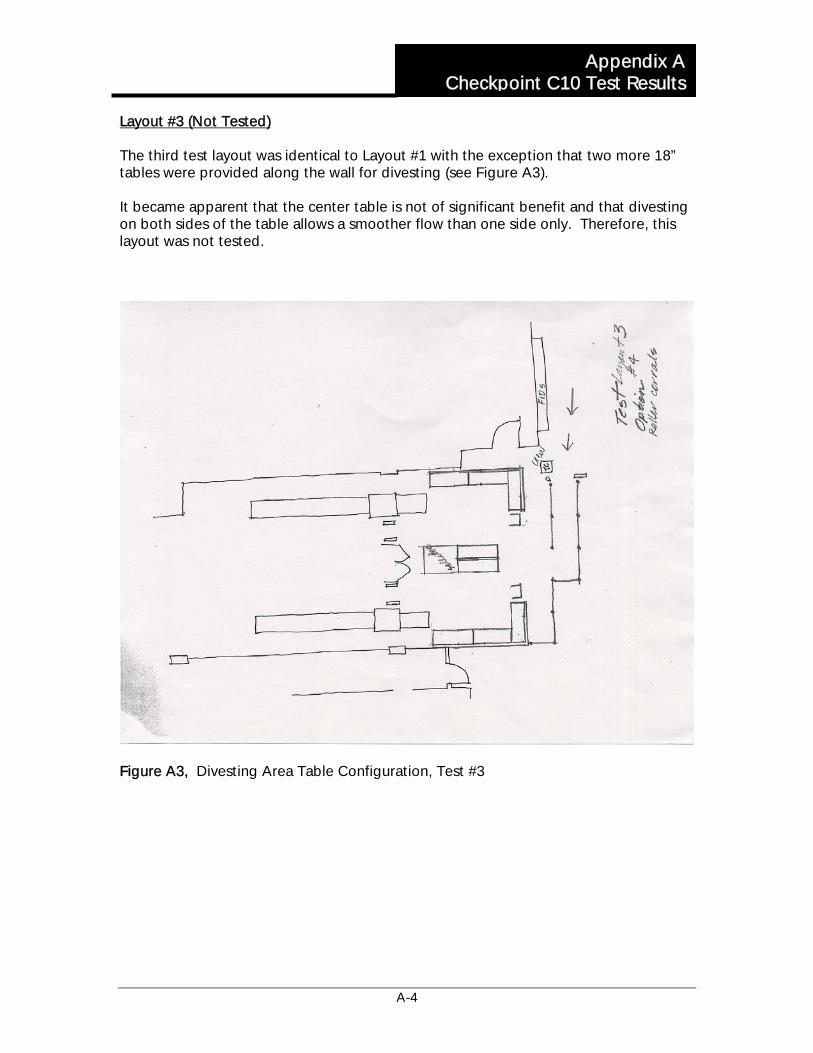
Layout #3 (Not Tested) The third test layout was identical to Layout #1 with the exception that two more 18” tables were provided along the wall for divesting (see Figure A3). It became apparent that the center table is not of significant benefit and that divesting on both sides of the table allows a smoother flow than one side only. Therefore, this layout was not tested.
Figure A3, Divesting Area Table Configuration, Test #3
A-4

Appendix ACheckpoint C10 Test Results
Layout #4 – Best Results Test Layout #4 eliminated the center tables and moved the double row of the side tables in line with the x-rays (see Figure A4). Observations
• Placing bins in a bin holder upstream of the tables, rather than stacking them on top of the tables, provided clear, ample table space for divesting.
• Two narrow tables placed back-to-back allowed divesting on both sides of tables at the same time. The optimal configuration consists of 4 tables (18” x 6’ each).
• Illustrative divesting instructions placed between the two back-to-back tables served as a quick reminder to passengers for correct divesting procedures.
• Passengers were comfortable using both sides of tables. • With floor stickers directing traffic to both sides, passengers used both sides of
tables without additional verbal prompting from ticket checking employees. • Two lines merging at the x-ray worked well when both sides of the divesting
table are equidistant from the x-ray belt. • Passengers were reluctant to go ahead of someone still divesting unless the
TSA staff waved them through. • Eliminating the center divesting tables used in previous trials allowed additional
space in the queue area for wheel chairs, strollers, and rolling bags. • Additional bins were needed.
Figure A4, Divesting Area Table Configuration, Test #4
A-5

Appendix ACheckpoint C10 Test Results
Layout #5 (Not Tested) Test Layout #5 was identical to Layout #4 with the exception that the tables were moved toward the center of the divesting area rather than in line with the x-ray (see Figure A5). It became apparent that the lines from each side of the divesting tables should be equidistant from the x-ray to create the desired merge without heightened passenger anxiety. Therefore, this layout was not tested.
Figure A5. Divesting Area Table Configuration, Test #5.
A-6

Appendix ACheckpoint C10 Test Results
Layout #6 (Not Tested) Test Layout #6 was configured to test a corral type setting. The theory to be tested was whether an advantage is gained by eliminating the line once in the divesting area. Passengers could simply step up to the x-ray as they were ready (see Figure A6). Levels of passenger traffic were very high on the day of testing. The team did not want to disrupt the flow of passengers through the checkpoint by implementing this layout. It was not tested at a later time because it does not allow a two-line merge at the x-ray, which was previously proven effective through repeated tests.
Figure A6, Divesting Area Table Configuration, Test #6
A-7
Appendix ACheckpoint C10 Test Results
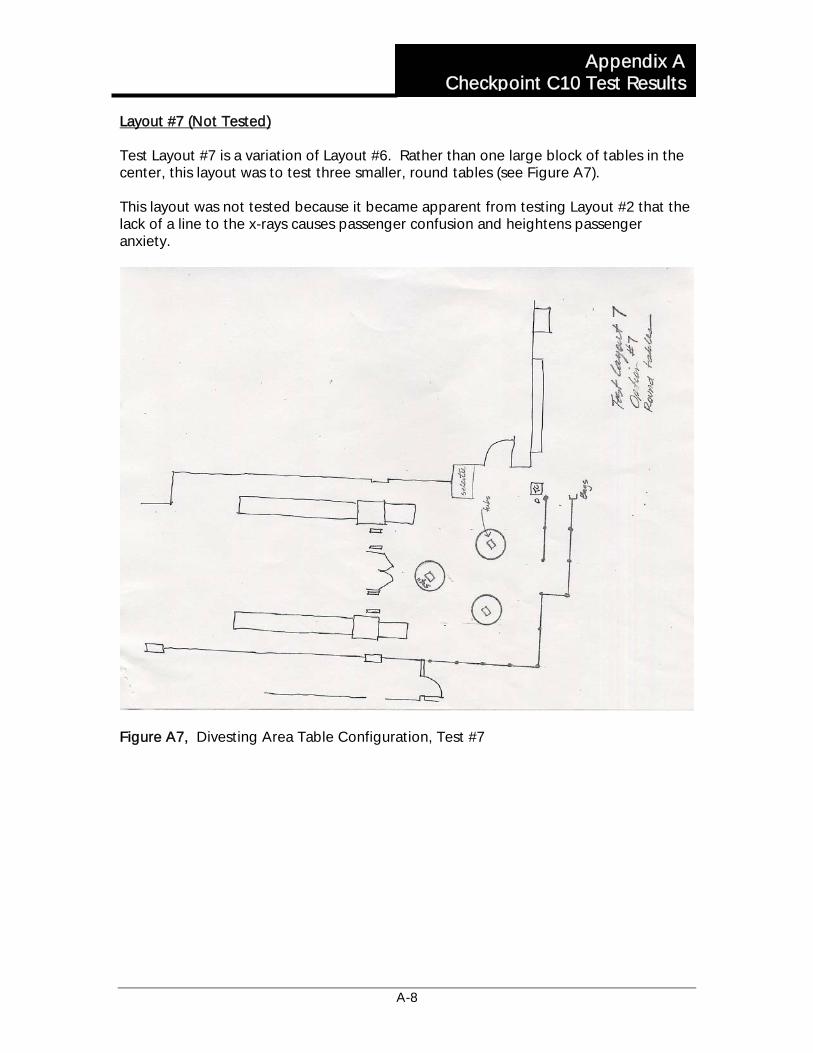
Layout #7 (Not Tested) Test Layout #7 is a variation of Layout #6. Rather than one large block of tables in the center, this layout was to test three smaller, round tables (see Figure A7). This layout was not tested because it became apparent from testing Layout #2 that the lack of a line to the x-rays causes passenger confusion and heightens passenger anxiety.
Figure A7, Divesting Area Table Configuration, Test #7
A-8

Appendix ACheckpoint C10 Test Results
MISCELLANEOUS TESTS Verbal Cues (Using Layout #4) The TSA staff perception was that verbal reminders are very helpful in reducing the number of Boarding Pass Assists required and the number of alarms set off due to failure to fully divest. Although the actual number was not tracked, there were several families that came through the checkpoint during the test period. This may have offset the expected throughput increase resulting from reduced assists and second magnetometer scans. Improved Signage in Combination with Layout #4 Over a 4-hour test period, an average of four boarding pass assists and 12 alarms occurred per hour. Although no baseline data was available for comparison, previous observations had yielded a much higher boarding pass assist rate. TSA staff also felt that the alarm rate for failure to fully divest was lower. Bag & Slipper Display Placed by Ticket Checker (Using Layout #4) The slippers were used almost exclusively by women. There were not enough bags and slippers used to significantly affect the throughput numbers at the checkpoint. However, given proper education and time to get used to them, these will likely prove beneficial.
Test Time Period
Total Throughput
Bags Used Slippers Used
Large Bags
60 min. 480 33 12 pair
Small Bags
60 min. 473 22 9 pair
Table A2. Passenger Use of Bags and Slippers, Display by Ticket Checker. Bag & Slipper Display Placed in Center of Divesting Area (Using Layout #4) With this layout, only the line on the far side that walked past the display picked up any bags. Again, primarily women used the slippers.
Test Time Period
Total Throughput
Bags Used Slippers Used
Large Bags
60 min. 451 17 13 pair
Table A3. Passenger Use of Bags and Slippers, Display in Divesting Area. Actual Placement of Bag & Slipper Display At a later time, the bag and slipper display was tested in the queue area, approximately 10 feet prior to the ticket checker. This was found to be the optimal location because it gave the passengers time to consider their options without being concerned about showing their boarding pass and ID at the same time. See Appendix B for results.
A-9
Appendix ACheckpoint C10 Test Results
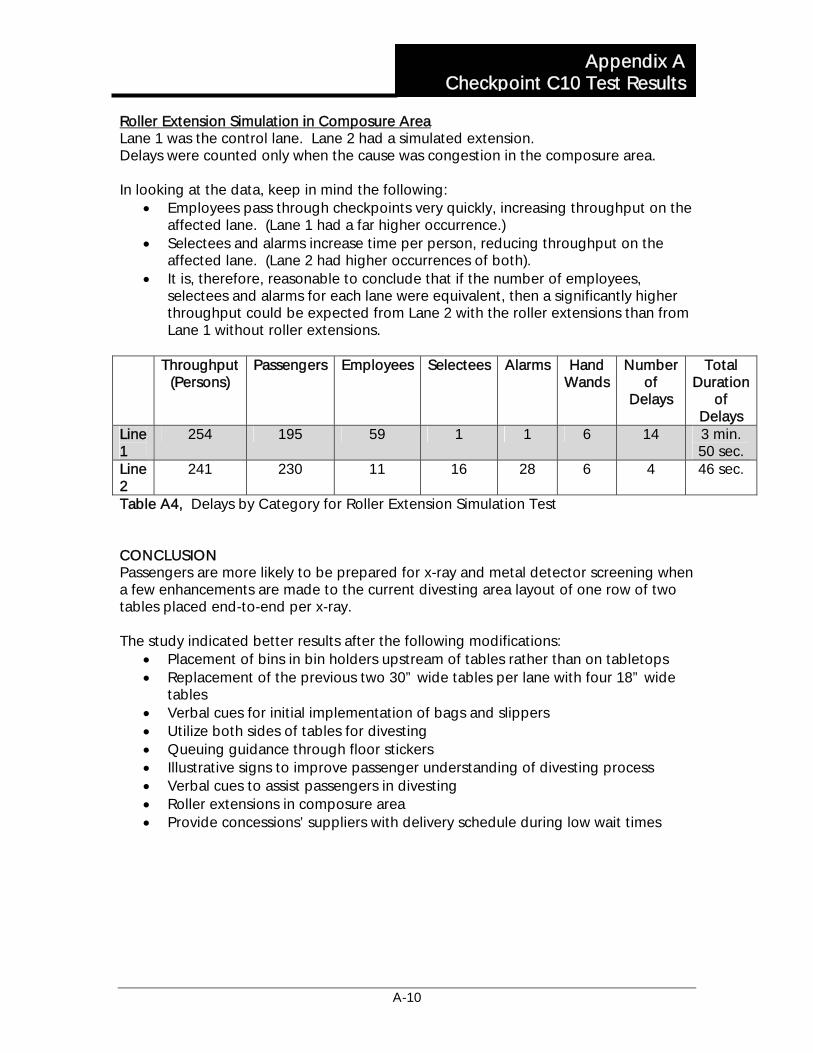
Roller Extension Simulation in Composure Area Lane 1 was the control lane. Lane 2 had a simulated extension. Delays were counted only when the cause was congestion in the composure area. In looking at the data, keep in mind the following:
• Employees pass through checkpoints very quickly, increasing throughput on the affected lane. (Lane 1 had a far higher occurrence.)
• Selectees and alarms increase time per person, reducing throughput on the affected lane. (Lane 2 had higher occurrences of both).
• It is, therefore, reasonable to conclude that if the number of employees, selectees and alarms for each lane were equivalent, then a significantly higher throughput could be expected from Lane 2 with the roller extensions than from Lane 1 without roller extensions.
Throughput
(Persons) Passengers Employees Selectees Alarms Hand
Wands Number
of Delays
Total Duration
of Delays
Line 1
254 195 59 1 1 6 14 3 min. 50 sec.
Line 2
241 230 11 16 28 6 4 46 sec.
Table A4, Delays by Category for Roller Extension Simulation Test CONCLUSION Passengers are more likely to be prepared for x-ray and metal detector screening when a few enhancements are made to the current divesting area layout of one row of two tables placed end-to-end per x-ray. The study indicated better results after the following modifications:
• Placement of bins in bin holders upstream of tables rather than on tabletops • Replacement of the previous two 30” wide tables per lane with four 18” wide
tables • Verbal cues for initial implementation of bags and slippers • Utilize both sides of tables for divesting • Queuing guidance through floor stickers • Illustrative signs to improve passenger understanding of divesting process • Verbal cues to assist passengers in divesting • Roller extensions in composure area • Provide concessions’ suppliers with delivery schedule during low wait times
A-10
Appendix ACheckpoint C10 Test Results
The benefits of these enhancements to the C10 checkpoint divesting area were:
• Improved orderly appearance of checkpoint entry • Encouraged passengers to begin divesting early • Improved communication of divesting requirements • Encouraged passenger use of bags and slippers • Improved customer perception of being “in the process” rather than still
waiting • Reduced the number of Boarding Pass assists required • Reduced congestion at the x-ray exit • Encouraged concession suppliers to make deliveries during low-wait times
A-11
Appendix BBag/Slipper Display Location
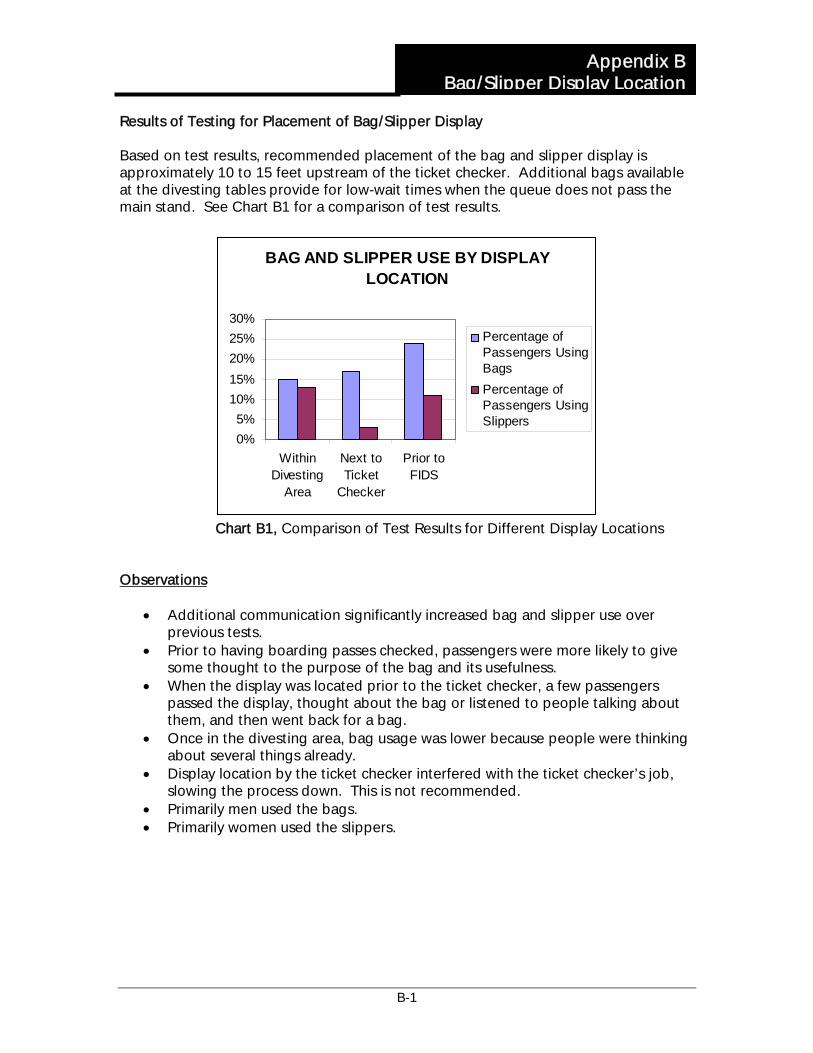
Results of Testing for Placement of Bag/Slipper Display Based on test results, recommended placement of the bag and slipper display is approximately 10 to 15 feet upstream of the ticket checker. Additional bags available at the divesting tables provide for low-wait times when the queue does not pass the main stand. See Chart B1 for a comparison of test results.
BAG AND SLIPPER USE BY DISPLAY LOCATION
0%5%
10%15%20%25%30%
WithinDivesting
Area
Next toTicket
Checker
Prior toFIDS
Percentage ofPassengers UsingBagsPercentage ofPassengers UsingSlippers
Chart B1, Comparison of Test Results for Different Display Locations Observations
• Additional communication significantly increased bag and slipper use over previous tests.
• Prior to having boarding passes checked, passengers were more likely to give some thought to the purpose of the bag and its usefulness.
• When the display was located prior to the ticket checker, a few passengers passed the display, thought about the bag or listened to people talking about them, and then went back for a bag.
• Once in the divesting area, bag usage was lower because people were thinking about several things already.
• Display location by the ticket checker interfered with the ticket checker’s job, slowing the process down. This is not recommended.
• Primarily men used the bags. • Primarily women used the slippers.
B-1