DALGARANGA GOLD MINE ROBUST UPDATED MINERAL RESOURCE · Previously, a large number of wireframe...
76
(Voluntary Administrators Appointed) 57 139 522 900 P.O. Box 1449, West Perth, Western Australia 6872 Level 1, 41-47 Colin Street, West Perth, Western Australia 6005 Telephone +61 8 9481 3434, Facsimile +61 8 9481 0411 Email: [email protected], Web: www.gascoyneresources.com.au August 28 th 2019 Australian Securities Exchange Limited Via Electronic Lodgement DALGARANGA GOLD MINE – ROBUST UPDATED MINERAL RESOURCE Updated Mineral Resource Estimate for the Dalgaranga Gold Project of 802,500 oz gold; The Gilbey’s Main ore body includes +530 koz of Measured and Indicated resources and a further +150koz of Inferred resources representing +86% of the entire Dalgaranga Mineral Resource; The updated resource model reconciles well with (i) the current mining operations 1 and (ii) the historic Equigold production; The updated resource model is robust and will form the basis of an updated Mineral Reserve and Life of Mine Plan (LOMP); New estimate constrained within optimised pit shells based on a gold price of A$2,400 2 per ounce; Excellent reconciliation results in July against Localised Uniform Conditioning (LUC) Mineral Resource model; New LUC model checked against Equigold historical production data from the Gilbey’s Main zone mined from 1996 to 2000; Company Total Mineral Resource of some 1.8Moz of contained gold; Gascoyne Resources Limited (“Gascoyne” or “Company”)(ASX:GCY) provides an updated Mineral Resource Estimate for the Dalgaranga Gold Project. The updated Mineral Resource estimate is 28.2Mt @ 0.9 g/t for 803k ounces of contained gold. Including the Glenburgh project (1.0Moz, see announcement 24 th of July 2014), the Combined Total Company Mineral Resource now stands at 1.8Moz of contained gold. An updated Ore Reserve and LOMP for Dalgaranga is being developed, based on the new LUC Resource model focussing on accessing the Gilbey’s Main ore zone as soon as practicable, with mine sequencing and processing schedules that maximise value. The updated Ore Reserve is expected in early September 2019. Dalgaranga Resource Update Gascoyne engaged independent consultants to update the Mineral Resource modelling and estimation. New Mineral Resource estimates for the Gilbey’s area (Gilbey’s, Gilbey’s South, Sly Fox and Plymouth deposits) have been completed by Cube Consulting Pty Ltd (Cube). The updated Golden Wings deposit model and Mineral Resource estimation was completed by SD2 Pty Ltd (SD2). The Mineral Resource is reported within a A$2,400 2 optimised pit shell, whereas previous Mineral Resources were reported unconstrained. The updated global Dalgaranga Mineral Resource estimate is shown below in Table 1 and Table 2. 1. Refer to ASX announcement “Dalgaranga Operations Update” dated 16 August 2019. 2. The mineralisation is constrained within an optimised pit shell using a gold price of $2,400 which demonstrates that there is a reasonable expectation that it will become economic (as per section 41 of the JORC Code 2012).
Transcript of DALGARANGA GOLD MINE ROBUST UPDATED MINERAL RESOURCE · Previously, a large number of wireframe...

(Voluntary Administrators Appointed) 57 139 522 900
P.O. Box 1449, West Perth, Western Australia 6872 Level 1, 41-47 Colin Street, West Perth, Western Australia 6005 Telephone +61 8 9481 3434, Facsimile +61 8 9481 0411 Email: [email protected], Web: www.gascoyneresources.com.au
August 28th 2019 Australian Securities Exchange Limited Via Electronic Lodgement
DALGARANGA GOLD MINE – ROBUST UPDATED MINERAL RESOURCE
Updated Mineral Resource Estimate for the Dalgaranga Gold Project of 802,500 oz gold;
The Gilbey’s Main ore body includes +530 koz of Measured and Indicated resources and a further +150koz of Inferred resources representing +86% of the entire Dalgaranga Mineral Resource;
The updated resource model reconciles well with (i) the current mining operations1 and (ii) the historic Equigold production;
The updated resource model is robust and will form the basis of an updated Mineral Reserve and Life of Mine Plan (LOMP);
New estimate constrained within optimised pit shells based on a gold price of A$2,4002 per ounce;
Excellent reconciliation results in July against Localised Uniform Conditioning (LUC) Mineral Resource model;
New LUC model checked against Equigold historical production data from the Gilbey’s Main zone mined from 1996 to 2000;
Company Total Mineral Resource of some 1.8Moz of contained gold;
Gascoyne Resources Limited (“Gascoyne” or “Company”)(ASX:GCY) provides an updated Mineral Resource
Estimate for the Dalgaranga Gold Project. The updated Mineral Resource estimate is 28.2Mt @ 0.9 g/t for 803k
ounces of contained gold.
Including the Glenburgh project (1.0Moz, see announcement 24th of July 2014), the Combined Total Company Mineral
Resource now stands at 1.8Moz of contained gold.
An updated Ore Reserve and LOMP for Dalgaranga is being developed, based on the new LUC Resource model
focussing on accessing the Gilbey’s Main ore zone as soon as practicable, with mine sequencing and processing
schedules that maximise value. The updated Ore Reserve is expected in early September 2019.
Dalgaranga Resource Update
Gascoyne engaged independent consultants to update the Mineral Resource modelling and estimation. New
Mineral Resource estimates for the Gilbey’s area (Gilbey’s, Gilbey’s South, Sly Fox and Plymouth deposits) have
been completed by Cube Consulting Pty Ltd (Cube). The updated Golden Wings deposit model and Mineral
Resource estimation was completed by SD2 Pty Ltd (SD2).
The Mineral Resource is reported within a A$2,4002 optimised pit shell, whereas previous Mineral Resources were reported unconstrained.
The updated global Dalgaranga Mineral Resource estimate is shown below in Table 1 and Table 2.
1. Refer to ASX announcement “Dalgaranga Operations Update” dated 16 August 2019. 2. The mineralisation is constrained within an optimised pit shell using a gold price of $2,400 which demonstrates that there is a reasonable expectation
that it will become economic (as per section 41 of the JORC Code 2012).

The approach taken for the interpretation of mineralisation domains differs markedly from that used in the previous Mineral Resource estimates. Previously, a large number of wireframe models predicated on a 0.5g/t Au cut-off grade, with allowance for up to 2m of internal waste, were used to delineate the mineralisation. This update estimate has focussed on delineating broad mineralisation envelopes with a high tolerance for internal waste, based on areas of similar geological controls and has resulted in a large reduction in the number of mineralisation wireframe models.
Table 1 : Dalgaranga Gold Project
June 2019 Summary Mineral Resource Statement
Classification Mt Au g/t Au koz
Measured 1.6 0.91 45.5
Indicated 19.4 0.90 560.1
Measured + Indicated 21.0 0.90 605.7
Inferred 7.2 0.85 196.8
TOTAL 28.2 0.89 802.5
Note:
1. The Mineral Resource for the Gilbey’s, Gilbey’s South, Plymouth, and Sly Fox deposits has been compiled under the supervision of Mr
Michael Job and Mr Michael Millad. Mr. Michael Job is a Principal Geologist/Geostatistician at Cube Consulting Pty Ltd and a Fellow of
the Australasian Institute of Mining and Metallurgy. Mr Michael Millad is a Director and Principal Geologist/Geostatistician at Cube
Consulting Pty Ltd, and a Member of the Australasian Institute of Geoscientists. Both Mr Job and Mr Millad have sufficient experience
that is relevant to the style of mineralisation and type of deposit under consideration and to the activity that was undertaken to qualify
as a Competent Persons, as defined in the 2012 Edition of the ‘Australasian Code for Reporting of Exploration Results, Mineral Resources
and Ore Reserves (The Joint Ore Reserves Committee Code – JORC 2012 Edition).
2. The Mineral Resource for the Golden Wings deposit has been compiled by Mr Scott Dunham, a Competent Person who is a Fellow of The
Australasia Institute of Mining and Metallurgy and an employee of SD2 Pty Ltd. Mr Dunham has sufficient experience that is relevant to
the style of mineralisation and type of deposit under consideration and to the activity that was undertaken to qualify as a Competent
Persons, as defined in the 2012 Edition of the ‘Australasian Code for Reporting of Exploration Results, Mineral Resources and Ore Reserves
(The Joint Ore Reserves Committee Code – JORC 2012 Edition).
3. Mineral Resource estimates are not precise calculations and the reported estimate is dependant on the interpretation of limited data
pertaining to the location, shape, continuity of the mineralisation and the quality and quantity of the samples of the mineralisation.
4. Effective date of 30 June 2019.
5. Mineral Resources that are not Ore Reserves do not have demonstrated economic viability. The estimate of Mineral Resources may be
materially affected by environmental, permitting, legal, title, taxation, socio-political, marketing, or other relevant issues.
6. Mineral Resources are reported above a cut-off grade of 0.3g/t Au.
7. Mineral Resources are reported within a constraining pit shell, provided to Cube and SD2 by GCY, based on a gold price of A$2,400 and
based on Measured, Indicated and Inferred categories. Key inputs to the pit optimisation were as follows: Current Average Mining Costs
= A$3.20 per tonne; Current Average Processing Costs = A$9.92 (Oxide) to A$12.85 (Fresh) per tonne; Slope Angles = 30° to 56°; Process
Recovery = 73% (Black Shale) and 87.45% (Fresh Other) to 94% (Oxide Other).
8. Figures may not add up exactly due to rounding.
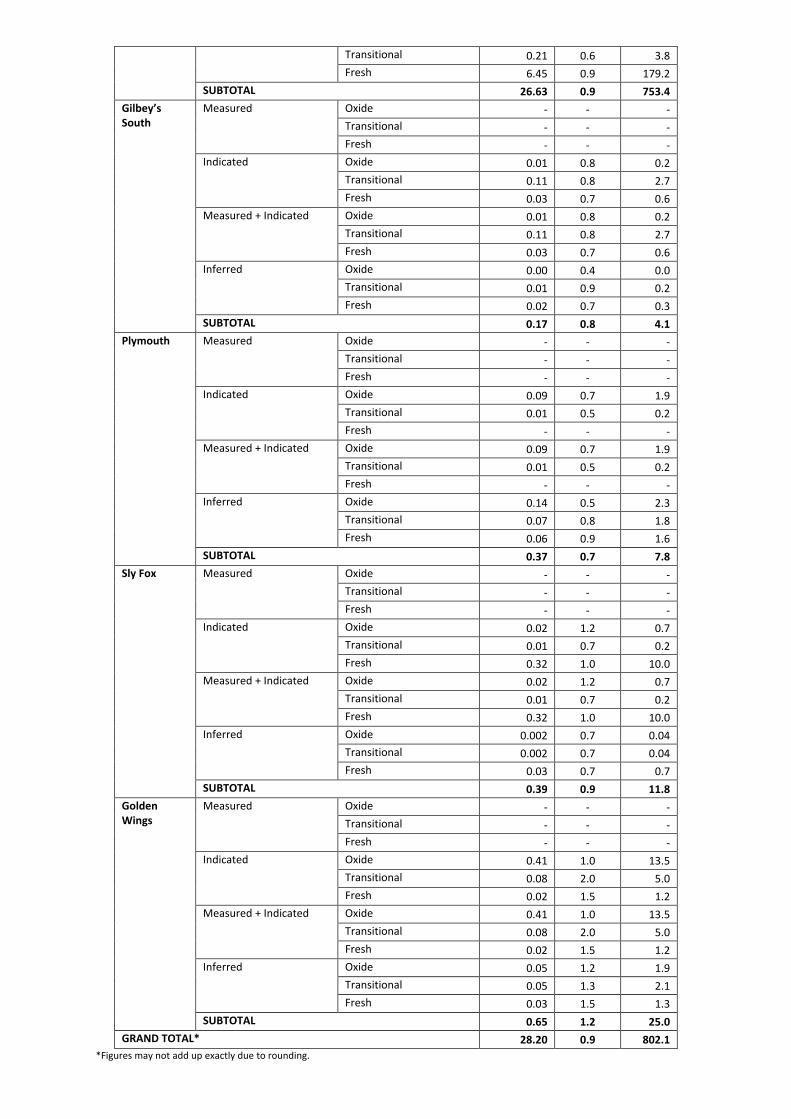
Table 2 : Dalgaranga Gold Project
June 2019 Summary Mineral Resource Statement
All Deposits, Resource Category, Oxide State In-Situ Inside MII A$2400 Pit Shells @ 0.3g/t Au Cut - off
Deposit Classification Oxidation State Mt Au g/t Au koz
Gilbey’s Measured Oxide 0.12 1.3 4.7
Transitional 0.40 1.0 13.0
Fresh 1.05 0.8 27.8
Indicated Oxide 0.41 0.8 10.0
Transitional 1.12 0.9 31.7
Fresh 16.78 0.9 481.7
Measured + Indicated Oxide 0.52 0.9 14.7
Transitional 1.52 0.9 44.7
Fresh 17.82 0.9 509.5
Inferred Oxide 0.11 0.5 1.6
Transitional 0.21 0.6 3.8
Fresh 6.45 0.9 179.2
SUBTOTAL 26.63 0.9 753.4
Gilbey’s South
Measured Oxide - - -
Transitional - - -
Fresh - - -
Indicated Oxide 0.01 0.8 0.2
Transitional 0.11 0.8 2.7
Fresh 0.03 0.7 0.6
Measured + Indicated Oxide 0.01 0.8 0.2
Transitional 0.11 0.8 2.7
Fresh 0.03 0.7 0.6
Inferred Oxide 0.00 0.4 0.0
Transitional 0.01 0.9 0.2
Fresh 0.02 0.7 0.3
SUBTOTAL 0.17 0.8 4.1
Plymouth Measured Oxide - - -
Transitional - - -
Fresh - - -
Indicated Oxide 0.09 0.7 1.9
Transitional 0.01 0.5 0.2
Fresh - - -
Measured + Indicated Oxide 0.09 0.7 1.9
Transitional 0.01 0.5 0.2
Fresh - - -
Inferred Oxide 0.14 0.5 2.3
Transitional 0.07 0.8 1.8
Fresh 0.06 0.9 1.6
SUBTOTAL 0.37 0.7 7.8
Sly Fox Measured Oxide - - -
Transitional - - -
Fresh - - -
Indicated Oxide 0.02 1.2 0.7
Transitional 0.01 0.7 0.2
Fresh 0.32 1.0 10.0
Measured + Indicated Oxide 0.02 1.2 0.7
Transitional 0.01 0.7 0.2
Fresh 0.32 1.0 10.0
Inferred Oxide 0.002 0.7 0.04
Transitional 0.002 0.7 0.04
Fresh 0.03 0.7 0.7
SUBTOTAL 0.39 0.9 11.8
Golden Wings
Measured Oxide - - -
Transitional - - -
Fresh - - -
Indicated Oxide 0.41 1.0 13.5
Transitional 0.08 2.0 5.0
Fresh 0.02 1.5 1.2
Measured + Indicated Oxide 0.41 1.0 13.5
Transitional 0.08 2.0 5.0
Fresh 0.02 1.5 1.2
Inferred Oxide 0.05 1.2 1.9
Transitional 0.05 1.3 2.1
Fresh 0.03 1.5 1.3
SUBTOTAL 0.65 1.2 25.0
GRAND TOTAL* 28.20 0.9 802.1
*Figures may not add up exactly due to rounding.
Comparison to Previous Mineral Resource
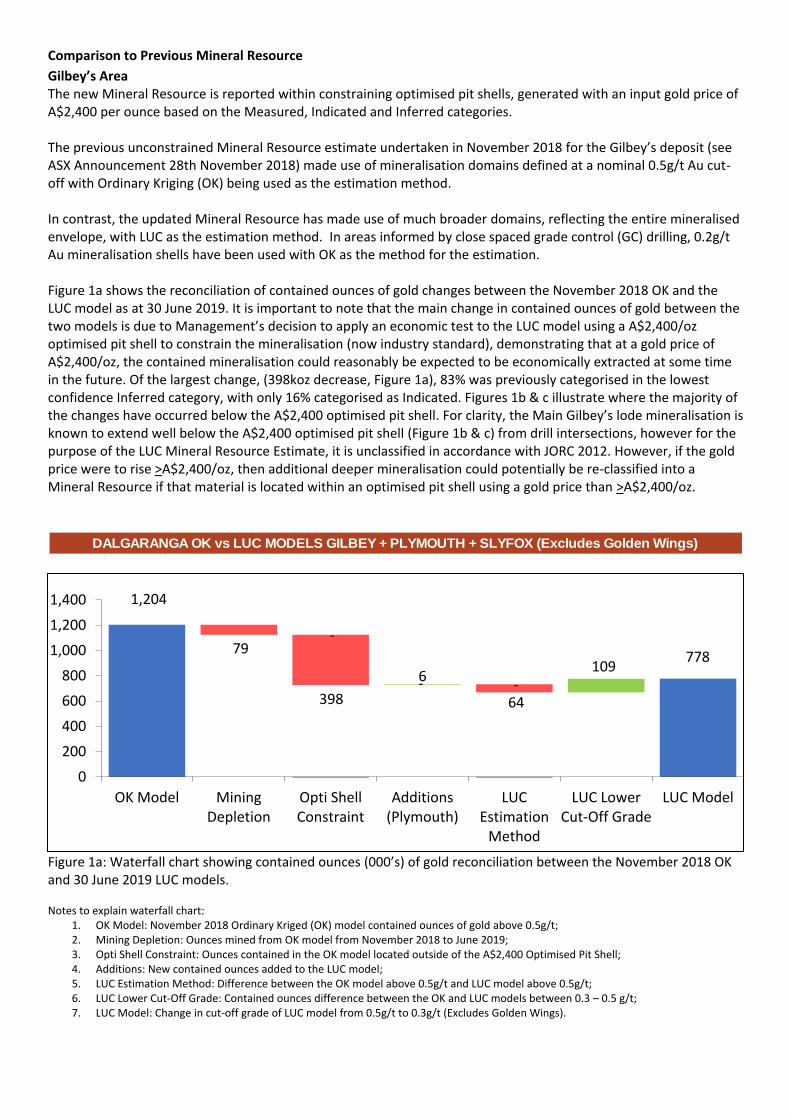
Gilbey’s Area The new Mineral Resource is reported within constraining optimised pit shells, generated with an input gold price of A$2,400 per ounce based on the Measured, Indicated and Inferred categories. The previous unconstrained Mineral Resource estimate undertaken in November 2018 for the Gilbey’s deposit (see ASX Announcement 28th November 2018) made use of mineralisation domains defined at a nominal 0.5g/t Au cut-off with Ordinary Kriging (OK) being used as the estimation method. In contrast, the updated Mineral Resource has made use of much broader domains, reflecting the entire mineralised envelope, with LUC as the estimation method. In areas informed by close spaced grade control (GC) drilling, 0.2g/t Au mineralisation shells have been used with OK as the method for the estimation. Figure 1a shows the reconciliation of contained ounces of gold changes between the November 2018 OK and the LUC model as at 30 June 2019. It is important to note that the main change in contained ounces of gold between the two models is due to Management’s decision to apply an economic test to the LUC model using a A$2,400/oz optimised pit shell to constrain the mineralisation (now industry standard), demonstrating that at a gold price of A$2,400/oz, the contained mineralisation could reasonably be expected to be economically extracted at some time in the future. Of the largest change, (398koz decrease, Figure 1a), 83% was previously categorised in the lowest confidence Inferred category, with only 16% categorised as Indicated. Figures 1b & c illustrate where the majority of the changes have occurred below the A$2,400 optimised pit shell. For clarity, the Main Gilbey’s lode mineralisation is known to extend well below the A$2,400 optimised pit shell (Figure 1b & c) from drill intersections, however for the purpose of the LUC Mineral Resource Estimate, it is unclassified in accordance with JORC 2012. However, if the gold price were to rise >A$2,400/oz, then additional deeper mineralisation could potentially be re-classified into a Mineral Resource if that material is located within an optimised pit shell using a gold price than >A$2,400/oz.
Figure 1a: Waterfall chart showing contained ounces (000’s) of gold reconciliation between the November 2018 OK and 30 June 2019 LUC models. Notes to explain waterfall chart:
1. OK Model: November 2018 Ordinary Kriged (OK) model contained ounces of gold above 0.5g/t; 2. Mining Depletion: Ounces mined from OK model from November 2018 to June 2019; 3. Opti Shell Constraint: Ounces contained in the OK model located outside of the A$2,400 Optimised Pit Shell; 4. Additions: New contained ounces added to the LUC model; 5. LUC Estimation Method: Difference between the OK model above 0.5g/t and LUC model above 0.5g/t; 6. LUC Lower Cut-Off Grade: Contained ounces difference between the OK and LUC models between 0.3 – 0.5 g/t; 7. LUC Model: Change in cut-off grade of LUC model from 0.5g/t to 0.3g/t (Excludes Golden Wings).
DALGARANGA OK vs LUC MODELS GILBEY + PLYMOUTH + SLYFOX (Excludes Golden Wings)
79
398 -
64
109
-
-
1,204
6 778
0
200
400
600
800
1,000
1,200
1,400
OK Model MiningDepletion
Opti ShellConstraint
Additions(Plymouth)
LUCEstimation
Method
LUC LowerCut-Off Grade
LUC Model

Figure 1b: Shows a significant proportion of the Inferred Mineral Resource Category for the November 2018 OK extending below the A$2,400 optimised pit shell.
Figure 1c: Shows the distribution of Mineral Resource Categories in the LUC model constrained within the A$2,400 optimised pit shell. As the previous November 2018 Gilbey’s OK Mineral Resource Model was defined at a nominal >0.5g/t Au cut-off, comparisons between the models have been undertaken at this cut-off within the A$2,400 optimised pit shell. Comparisons are shown in Table 3 for the Gilbey’s Main zone and Table 4 for the Gilbey’s peripheral zones.

The updated Dalgaranga project has been divided into a number of areas for comparison of the new June 2019 LUC OKGC model to the November 2018 OK model (Figures 2 and 3):
Gilbey’s Main – encompassing the Main Porphyry Zone and the hangingwall lodes (primarily LUC Domains
101, 201 and 202).
Peripheral Zones:
Gilbey’s East – encompassing the GCY era eastern cutback area (LUC Domains 401 and 402).
Gilbey’s Starter Pit – takes in the GCY era cutback to the immediate south of the Equigold historical pit (LUC
Domains 103, and southern portion of Domain 201).
Gilbey’s South – far southern GCY era cutback area (LUC Domains 501 and 502).
Gilbey’s North – far northern GCY era cutback area (LUC Domain 102).
The comparisons show that the tonnes have increased and the grade decreased to different degrees in the new model.
Table 3: Unclassified comparison for in-situ material (as at 30 June 2019) within the A$2,400 resource pit shell, and reported at 0.5g/t Au – Gilbey’s Main area
LUC OKGC June 2019 OK Nov 2018 LUC 2019 minus OK 2018
Mt Au g/t Au koz Mt Au g/t Au koz Mt Au g/t Au koz
17.79 1.10 629.2 16.22 1.32 690.8 10% -17% -9%
Table 4: Unclassified comparison for in-situ material (as at 30 June 2019) within the A$2,400 resource pit shell, and reported at 0.5g/t Au – Peripheral Zones of Gilbey’s East, Starter Pit, North and South areas combined
LUC OKGC June 2019 OK Nov 2018 LUC 2019 minus OK 2018
Mt Au g/t Au koz Mt Au g/t Au koz Mt Au g/t Au koz
0.67 0.99 21.4 0.51 1.62 26.5 32% -39% -19%
The change has not been material in the Gilbey’s Main area (9% less gold metal), which comprises the bulk of the Mineral Resource, and was the focus of the historical Equigold mining (Table 3). Figures 2 and 3 shows the LUC Domains; the Gilbey’s Main porphyry and hangingwall lodes are Domains 101, 201 and 202.

Figure 2: Gilbey’s Area Plan view (local grid) of the broad estimation domains for LUC estimation Areas peripheral to the Gilbey’s Main Porphyry Zone, which have been the primary focus of mining to date, reflect a material drop in estimated gold metal due to higher tonnage in combination with a drop in grade under the same reporting conditions.
Figure 3: Gilbey’s Area Isometric view looking down-dip on the north-south limb domains, with red dashed line indicating the approximate shape of the fold axis The historical Equigold Actual production figures were compared to the combined LUC and OK GC model. The comparison was undertaken within the historical pit volume, and the Mineral Resource was reported at a 0.7g/t Au cut-off, to mimic the mining cut-off used by Equigold. Figures for the total volume are compared in Table 5 and the tonnes, grade and gold ounces are compared by elevation slice in Figure 4 to Figure 6.

Table 5: Comparison of Equigold Actual Production to the LUC OK GC Model
Equigold Actual LUC OK GC Model @ 0.7g/t Au %difference (Model - Equigold)
kt Au koz Au g/t kt Au koz Au g/t kt Au koz Au g/t
4,392 218 1.54 4,125 204 1.54 -6.1% -6.4% -0.3%
Figure 4: Tonnes comparison by elevation slice – Equigold Actuals vs LUC OK GC Model
Figure 5: Gold grade comparison by elevation slice – Equigold Actuals vs LUC OK GC Model
0
100,000
200,000
300,000
400,000
500,000
600,000
700,000
800,0004
30
to
42
0
42
0 t
o 4
10
41
0 t
o 4
00
40
0 t
o 3
90
39
0 t
o 3
80
38
0 t
o 3
70
37
0 t
o 3
60
36
0 t
o 3
50
35
0 t
o 3
40
34
0 t
o 3
30
33
0 t
o 3
20
32
0 t
o 3
10
31
0 t
o 3
00
Ton
ne
s
Elevation Slice
Actual t LUC OKGC t
0.00
0.20
0.40
0.60
0.80
1.00
1.20
1.40
1.60
1.80
2.00
43
0 t
o 4
20
42
0 t
o 4
10
41
0 t
o 4
00
40
0 t
o 3
90
39
0 t
o 3
80
38
0 t
o 3
70
37
0 t
o 3
60
36
0 t
o 3
50
35
0 t
o 3
40
34
0 t
o 3
30
33
0 t
o 3
20
32
0 t
o 3
10
31
0 t
o 3
00
Gra
de
(A
u p
pm
)
Elevation Slice
Actual Au ppm LUC OKGC Au ppm

Figure 6: Gold ounces comparison by elevation slice – Equigold Actuals vs LUC OK GC Model
The global comparison for the Equigold mined volume shows that the Mineral Resource falls within approximately 6% of the actuals in terms of the tonnes and gold ounces prediction, with the gold grade being virtually identical for both at 1.54g/t Au. This is considered to be an excellent result. The comparison volume encompasses primarily the Gilbey’s Main Porphyry Zone (LUC Domain 101) with a subordinate amount of material also having been mined from the hangingwall lode Domain 202. The comparison by elevation slice shows agreement between the model and Equigold actuals, with the exception of the 390m to 410m elevation range, where the model is significantly under-estimating the tonnes and therefore the gold ounces. The reason for this is likely due to the inability of the Resource drilling data to adequately characterise a zone of supergene enrichment in this portion of the oxide zone. However, for the most part, the predictive ability of the model is considered to be good within the volume of comparison, both on a global and semi-local basis. Since the LOMP calls for the vast majority of gold to be mined in this area, primarily targeting the volume below the Equigold pit, this is an important result supporting the robustness of the LUC estimation methods used. Appendix 1 contains notes related to the Mineral Resource Estimate for Gilbey’s, Gilbey’s South, Sly Fox and Plymouth Deposits compiled under the supervision of Mr Michael Job, Principal Geologist/Geostatistician and Mr Michael Millad, Director and Principal Geologist/Geostatistician at Cube Consulting Pty Ltd. Additional information is contained in Appendix 3. (JORC Table 1). Golden Wings The previous unconstrained Mineral Resource estimate undertaken for Golden Wings was in 2017 (pre-Mining) which made use of mineralisation domains defined at a nominal 0.5g/t Au cut-off with Ordinary Kriging (OK) being used as the estimation method. The new updated Mineral Resource, depleted for Mining was estimated using the LUC methodology. The Mineral Resource estimate of 0.65Mt at 1.2g/t for 25.0koz of contained gold (Table 2) is reported within a constraining optimised pit shell using a $2,400 per ounce gold price. Appendix 2 Contains notes related to the Mineral Resource Estimate for Golden Wings deposit compiled under the supervision of Mr Scott Dunham an employee of SD2 Pty Ltd. Additional information is contained in Appendix 4. (JORC Table 1)
0
5,000
10,000
15,000
20,000
25,000
30,000
35,000
40,000
45,000
43
0 t
o 4
20
42
0 t
o 4
10
41
0 t
o 4
00
40
0 t
o 3
90
39
0 t
o 3
80
38
0 t
o 3
70
37
0 t
o 3
60
36
0 t
o 3
50
35
0 t
o 3
40
34
0 t
o 3
30
33
0 t
o 3
20
32
0 t
o 3
10
31
0 t
o 3
00
Met
al (
Au
oz)
Elevation Slice
Actual oz LUC OKGC oz

Appendix 1
Listing Rule 5.8.1
Pursuant to ASX listing rule 5.8.1, and in addition to the information contained in Appendix 3, the Company provides
the following in respect of the 2019 Dalgaranga Resource update for the Gilbey’s, Gilbey’s South, Sly Fox and
Plymouth Resource update:
Notes on Gilbey’s, Gilbey’s South, Sly Fox and Plymouth Deposits and Mineral Resource Estimate
Dalgaranga Deposit Geology and Geological interpretation;
Regional Geology
The Dalgaranga Gold Project is located within the Dalgaranga Greenstone Belt in the Murchison Province of Western
Australia (Figure 15). The northeast trending belt consists of high magnesium basalt, tholeiitic basalt, intermediate
volcanic, felsic intrusive porphyry, and a volcano-sedimentary sequence dominated by black shale and volcaniclastic
lithologies. Felsic volcanic rocks outcrop on the western side of the belt, north of the Gilbey’s and Golden Wings
deposits. The Greenstone sequence is intruded by large gabbro complexes in the north (Mt Farmer, Mt Charles) and
to the west (Dalgaranga Hill). The stratigraphy has been folded into two regional synforms which plunge in opposite
directions, separated by a regional fault/shear along the western side of the Mt Farmer gabbro sill, westwards to the
south side of the gabbroic Dalgaranga Hill. The Dalgaranga Greenstone Belt is intruded by a number of post-tectonic
granites separated by zones of amphibolite and mafic schists intruded by pegmatites. East-west trending Proterozoic
dykes of dolerite and gabbro intrude the Greenstone sequences.
Geophysical interpretation of the region shows large scale northeast structures and a general fabric also oriented
northeast. The fabric and structures cross cut folded stratigraphy and are synonymous with regional mineralised
corridors.
Gilbey’s
Gold mineralisation in the Gilbey’s area (Gilbey’s, Sly Fox and Plymouth) is hosted within folded sequences, with the
Gilbey’s deposit located on the northern limb of a regional anticline, within a dextral ductile shear 100-200m wide.
The shear zone trends northeast and dips northwest, sub-parallel to the stratigraphy which strikes between 055° -
065°.
The stratigraphic package from east to west is footwall dolerite/gabbro and footwall shale. To the immediate west of
this are interbedded volcaniclastics, sheared shale and porphyry, that collectively are termed the Main Porphyry Zone,
and which host most of the gold mineralisation at Gilbey’s. The hangingwall unit is a package of high magnesium basalt,
intrusive gabbro and dolerite. The Gilbey’s Anticline is partially overturned with the northern limb (as described above)
dipping to the northwest, with the southern/eastern limb (host to Gilbey’s South and Sly Fox deposits) sub-vertical or
dipping steeply north.
The main body of mineralisation in the Gilbey’s deposit, the Main Porphyry Zone, varies from 20m to 110m in width
(Figure 7). The combined thickness of the Main Porphyry Zone and parallel mineralised zones is up to 200m wide.
While the thickness of shale units is highly variable along strike, they are consistently located within the mineralised
Main Porphyry Zone and footwall positions. The porphyry, however, appears to lens out or plunge to the north and
south.

Figure 7: Cross-section interpretation of the Gilbey’s deposit at local grid 4000mN, looking northwards
The footwall shale is moderately graphitic, pyritic and usually contains pyrrhotite. It varies from 10m thick in the south
to over 20m thick in the north. This unit appears to form the eastern boundary to the strongest deformation, acting in
a very ductile manner during the deformation.
The style of mineralisation at Gilbey’s can be described as a quartz-pyrite-carbonate veined ductile shear system. Pyrite
is the most common sulphide, however pyrrhotite is also a common sulphide particularly in the shale mineralised
zones. Biotite/sericite and carbonate alteration are synonymous with mineralisation.
The major control on mineralisation at Gilbey’s is structure. A major ductile shear hosts the mineralisation, with the
ore grade material developing as consistently wide sub-parallel lodes in the areas of strongest shearing. This structure
was folded prior to gold mineralisation by north-northwest striking (local grid) subvertical high strain zones which were
subsequently refolded by east-west striking sub-vertical folds. A flat, late vein stage system is visible in the footwall
and ore-zone; all four sets of quartz + sulphide veins are variably mineralised. The predominant mineralised veins are
narrow, discontinuous and parallel to the shear zone, forming as ductile syn-deformational shear veins and rotated
tensional veins within the overall sheared sequence and shallow dipping, short range north-northwest striking linking
structures. Short strike northwest to north-northwest and east-west trending structures offset the stratigraphy having
only minor influence on the geometry of mineralisation.
In the north of the Gilbey’s deposit the stratigraphy and mineralisation is sinistrally offset by a fault, with apparent
offset of ~70m, or alternatively the mineralisation is dragged into a more north-south zone of shearing. The
shale/porphyry host sequence continues northward.
Lesser amounts of mineralisation outside of the Main Porphyry Zone are associated with highly discontinuous
structures in the footwall and hangingwall. While the historical Equigold mining focussed on the upper portion of the
Main Porphyry Zone, the bulk of the GCY mining from 2018 to date has been within these areas of lesser structural
and mineralisation continuity.
Plymouth
The Plymouth deposit is located approximately 150m northwest of Sly Fox and south of Gilbey’s (Figure 16). At
Plymouth the higher grade mineralisation is related to a north trending and westerly dipping zone defined to date by
drilling to be over 150m in length; open to the north and open down dip. Gold mineralisation occurs within quartz
veined and silica-pyrite-biotite altered schists. Mineralisation is most consistent at a vertical depth of ~60-80m. Highly
oxidised / leached upper saprolite to about 30m vertical depth has inconsistent grade on most sections
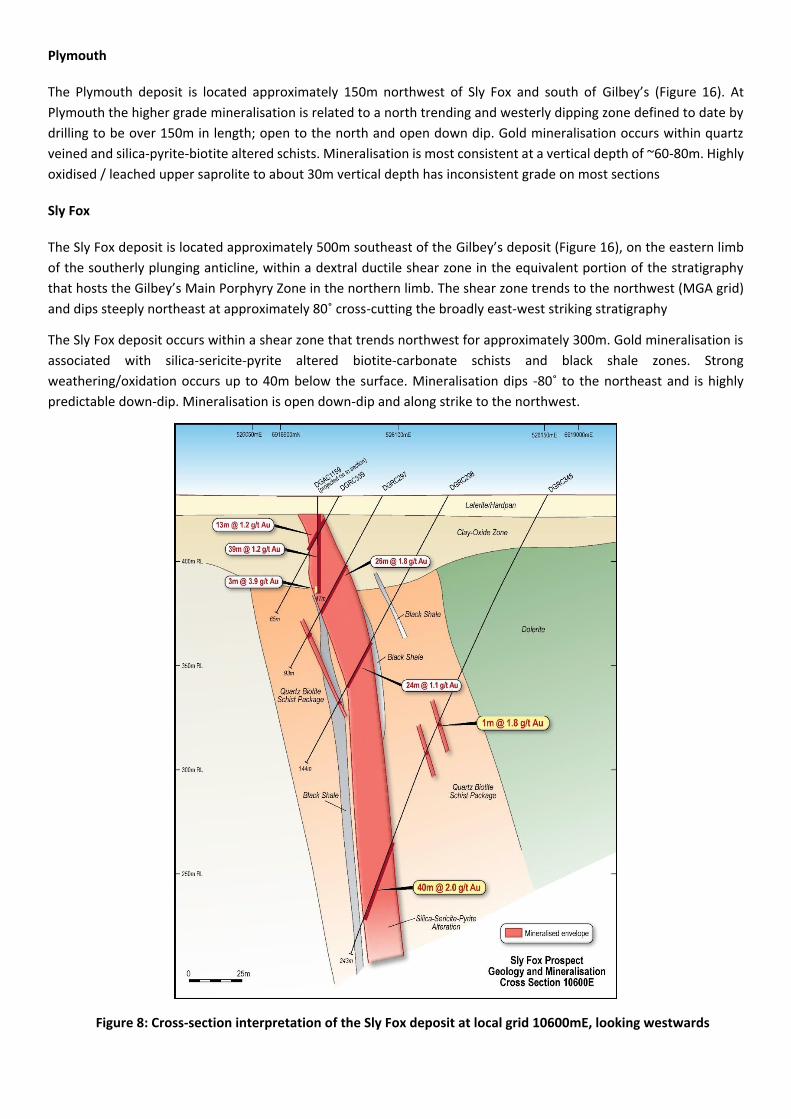
Sly Fox
The Sly Fox deposit is located approximately 500m southeast of the Gilbey’s deposit (Figure 16), on the eastern limb
of the southerly plunging anticline, within a dextral ductile shear zone in the equivalent portion of the stratigraphy
that hosts the Gilbey’s Main Porphyry Zone in the northern limb. The shear zone trends to the northwest (MGA grid)
and dips steeply northeast at approximately 80˚ cross-cutting the broadly east-west striking stratigraphy
The Sly Fox deposit occurs within a shear zone that trends northwest for approximately 300m. Gold mineralisation is
associated with silica-sericite-pyrite altered biotite-carbonate schists and black shale zones. Strong
weathering/oxidation occurs up to 40m below the surface. Mineralisation dips -80˚ to the northeast and is highly
predictable down-dip. Mineralisation is open down-dip and along strike to the northwest.
Figure 8: Cross-section interpretation of the Sly Fox deposit at local grid 10600mE, looking westwards
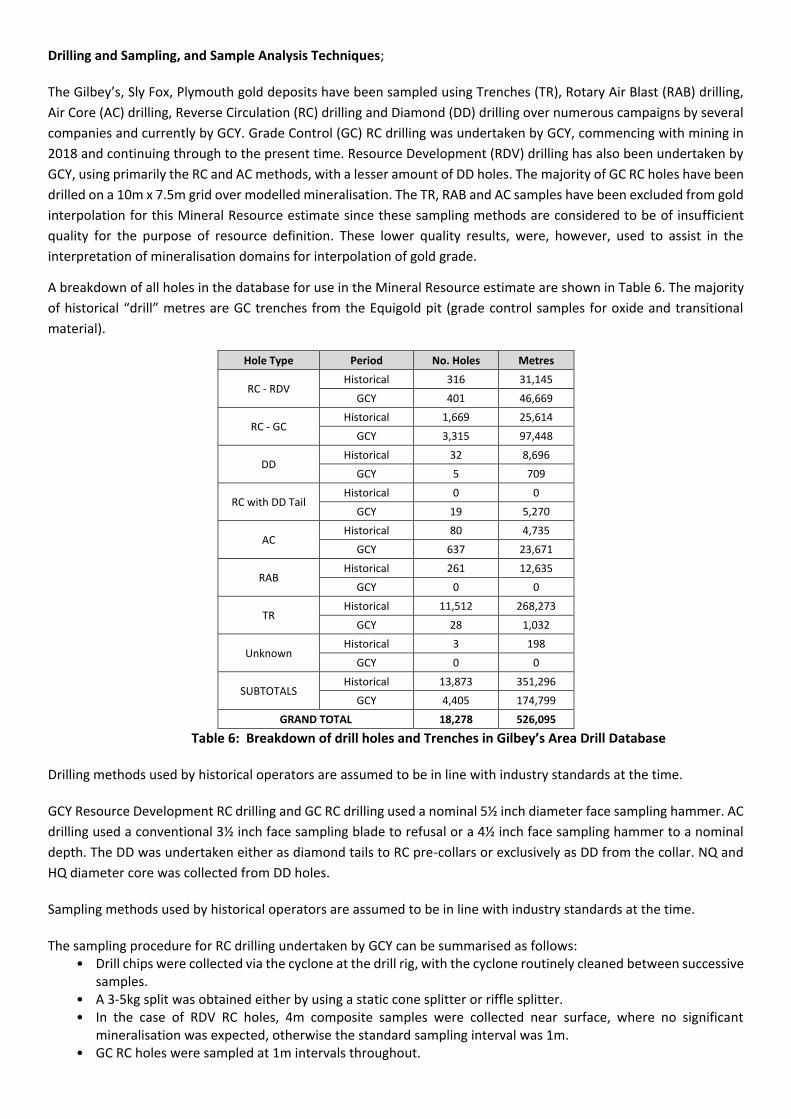
Drilling and Sampling, and Sample Analysis Techniques;
The Gilbey’s, Sly Fox, Plymouth gold deposits have been sampled using Trenches (TR), Rotary Air Blast (RAB) drilling,
Air Core (AC) drilling, Reverse Circulation (RC) drilling and Diamond (DD) drilling over numerous campaigns by several
companies and currently by GCY. Grade Control (GC) RC drilling was undertaken by GCY, commencing with mining in
2018 and continuing through to the present time. Resource Development (RDV) drilling has also been undertaken by
GCY, using primarily the RC and AC methods, with a lesser amount of DD holes. The majority of GC RC holes have been
drilled on a 10m x 7.5m grid over modelled mineralisation. The TR, RAB and AC samples have been excluded from gold
interpolation for this Mineral Resource estimate since these sampling methods are considered to be of insufficient
quality for the purpose of resource definition. These lower quality results, were, however, used to assist in the
interpretation of mineralisation domains for interpolation of gold grade.
A breakdown of all holes in the database for use in the Mineral Resource estimate are shown in Table 6. The majority
of historical “drill” metres are GC trenches from the Equigold pit (grade control samples for oxide and transitional
material).
Hole Type Period No. Holes Metres
RC - RDV Historical 316 31,145
GCY 401 46,669
RC - GC Historical 1,669 25,614
GCY 3,315 97,448
DD Historical 32 8,696
GCY 5 709
RC with DD Tail Historical 0 0
GCY 19 5,270
AC Historical 80 4,735
GCY 637 23,671
RAB Historical 261 12,635
GCY 0 0
TR Historical 11,512 268,273
GCY 28 1,032
Unknown Historical 3 198
GCY 0 0
SUBTOTALS Historical 13,873 351,296
GCY 4,405 174,799
GRAND TOTAL 18,278 526,095
Table 6: Breakdown of drill holes and Trenches in Gilbey’s Area Drill Database
Drilling methods used by historical operators are assumed to be in line with industry standards at the time.
GCY Resource Development RC drilling and GC RC drilling used a nominal 5½ inch diameter face sampling hammer. AC
drilling used a conventional 3½ inch face sampling blade to refusal or a 4½ inch face sampling hammer to a nominal
depth. The DD was undertaken either as diamond tails to RC pre-collars or exclusively as DD from the collar. NQ and
HQ diameter core was collected from DD holes.
Sampling methods used by historical operators are assumed to be in line with industry standards at the time.
The sampling procedure for RC drilling undertaken by GCY can be summarised as follows: • Drill chips were collected via the cyclone at the drill rig, with the cyclone routinely cleaned between successive
samples. • A 3-5kg split was obtained either by using a static cone splitter or riffle splitter. • In the case of RDV RC holes, 4m composite samples were collected near surface, where no significant
mineralisation was expected, otherwise the standard sampling interval was 1m. • GC RC holes were sampled at 1m intervals throughout.

The sampling procedure for DD drilling undertaken by GCY can be summarised as follows: • Half-core samples were collected for the NQ diameter core, with the left hand side of the core being sampled
in all cases. • Quarter core samples were collected in the case of HQ core, with the left hand side of the left hand half being
sampled.
The sampling procedure for AC drilling undertaken by GCY can be summarised as follows: • 4m composite samples of 3-5kg were collected for all AC drill holes using a spearing method. • Where significant mineralisation was detected in a 4m composite samples, 1m samples were collected from
the relevant interval and re-submitted for analysis.
Detailed logging for most historical holes exists in the GCY database.
GCY Reverse Circulation, DD and Aircore Logging procedures • Current RC and AC chips are geologically logged at 1m intervals and to geological boundaries respectively. • RDV RC hole chip trays and end of hole chips from AC drilling have been stored for future reference. • Drill chips from GC RC drill holes are not retained, with exceptions being retained to confirm lithological
logging. • RC and AC chip logging recorded the lithology, oxidation state, colour, alteration, sulphides and veining. • DD holes have all been geologically, structurally and geotechnically logged. • The core was photographed tray-by-tray, both wet and dry. • Historical collars were reportedly surveyed to within ±1m accuracy. • All drill hole collars were surveyed in the MGA94 Zone 50 grid. • GCY drill collars have been surveyed by DGPS equipment and mine site Surveyors. • The hole collars and downhole survey azimuths were transformed to Gilbey’s local grid for use in this Mineral
Resource estimate. The rotation parameters specified involve an anticlockwise rotation of approximately 45°, in addition to the grid co-ordinate shift. This means that the Gilbey’s Main Porphyry Zone strikes almost exactly north-south and Sly Fox east-west in the local grid system.
• For GCY drilling, a down hole survey was taken at least every 30m in RC and DD holes by electronic multi-shot tool by the drilling contractors.
• GC RC drill holes completed after August 2018, except for a few holes where equipment was not available, were surveyed with a minimum of two surveys per hole.
• Gyro surveys have been undertaken on selected holes to validate the multi shot surveys. • AC holes were not down hole surveyed due to their shallow nature.
No sample recovery information is available for historical drilling.
Information on GCY drill sample recovery is as follows: • RC and AC samples were visually checked for recovery, moisture and contamination. • RC and AC sample recovery was visually assessed and recorded where significantly reduced. Very little
sample loss was noted. • The DD drill core was measured and orientated to determine recovery, which was generally 100%. The
diamond drilling recovery was therefore excellent with very little to no core loss identified. • Sample recoveries are generally high. No significant sample loss was recorded with a corresponding increase
in gold present. Sample bias is not anticipated, and no preferential loss/gain of grade material was noted.
Drill Spacing and Orientation
Initial exploration by GCY was targeting discrete areas that may host mineralisation. Consequently Resource drilling pre-2018 was not grid based. However, when viewed with historical data, the drill holes lie on existing grid lines and within 25m - 100m of an existing hole.
RDV drilling in most of the Dalgaranga Project areas is nominally at a 25m – 40m spacing, but becomes less dense at depth.
GC drilling has been to test areas of modelled resources and is generally at a spacing of 10m x 7.5m.
The RDV drill spacing in unmined volumes is sufficiently dense in areas where relatively long range mineralisation continuity has been demonstrated, the best examples of this being the Main Porphyry Zone at Gilbey’s (previously mined by Equigold) and at Sly Fox. Peripheral zones at Gilbey’s, such as the Gilbey’s Eastern Cutback, Gilbey’s Far North, Gilbey’s Starter Pit and Gilbey’s South areas, have been proven by GC drilling to be much more discontinuous, and therefore difficult to model with high confidence using RDV data only. However, the mineralised zones have sufficient continuity in both geology and grade to be considered appropriate for the Mineral Resource and Ore Reserve estimation procedures and classification categories specified under the 2012 JORC Code.
The majority of drill holes have a dip of -60° towards local grid east. one program of 10m x 10m spaced holes in early 2018 tested an alternative drilling direction of -60° towards local grid southeast, however the change was not seen as an improvement and all subsequent drilling has been towards local grid east at the Gilbey’s deposit and the Plymouth deposit, where local grid north – south striking mineralisation predominates. For the east – west striking Sly Fox and Gilbey’s South deposits, holes are appropriately oriented towards local grid south.
The vast majority of the drill holes used are thus considered to be oriented near-optimally for intersection of gold mineralisation structures, ruling out any material bias due to drill orientation.
Sample Security
No information is available concerning sample security procedures for historical drilling.
For GCY era sampling, the chain of custody is managed by GCY: • RC samples collected pre-2018 were delivered daily to the Toll depot in Mt Magnet by GCY personnel. • Toll delivered the samples directly to the assay laboratory in Perth. In some cases Company personnel have
delivered the samples directly to the laboratory. • DD core was transported directly to Perth for cutting and dispatched to the assay laboratory for analysis. • 2018-2019 grade control samples and 2019 deep RC resource drilling samples are collected immediately as
drilled and stored in a designated area at the Dalgaranga mine site administration office. • They are stored in closed bulk bags, numbered and ordered ready for transport. To ready the bulk bags for
transport they are strapped to pallets, limiting the chance to tamper with sample bags during transport. • The samples are sent once or twice weekly directly to MinAnalytical Laboratory via the Company’s preferred
transport provider. • Consignments are specific to GCY, thereby limiting potential security issues.
Analytical Methods
No information is available in the database for historical sample analysis.
GCY Analyses
Prior to 2017, RDV samples sent to MinAnalytical were analysed by Fire Assay, using a 25g charge, with an AAS finish.
Subsequent to this, all DD and RC samples were analysed by Fire Assay, using a 50g charge, with AAS finish.
The GC RC samples sent to MinAnalytical after mid-2018 were analysed by Photon Assay. This method involves the
bombardment of the 250-500g charge with high energy X-Rays, leading to excitation of atomic nuclei and the
consequent release of elemental signature gamma-rays, which are measured for gold content. It is a non-destructive
method. GCY has undertaken comparisons to Fire Assay results on duplicate samples and this has shown that the
Photon method, while being somewhat less precise at lower gold grades, is unbiased. Precision is observed to increase
with gold grade.
The GC RC samples sent to the Dalgaranga Mine Site Laboratory for PAL analysis were analysed by the PAL1000 for 65
minutes. A 100ml of solution is collected and centrifuged. A 10ml aliquot is then collected and assayed for gold by AAS
technique. The PAL method is considered to be a partial recovery method, but comparisons to Fire Assay at Dalgaranga
show that recovery is very high, with a non-material difference being evident.

The AC samples were analysed by Aqua Regia dissolution of a 25g charge, with an AAS finish. This method is considered
to be a partial method. Aqua Regia can digest many different mineral types including most oxides, sulphides and
carbonates but will not totally digest refractory or silicate minerals.
Quality Assurance and Quality Control
Primary assay data for a total of 144,513 AC, RC and DD samples, as well as 5,209 CRMs (3.5% insertion rate), 1,934
Blanks (1.3% insertion rate), and 3,013 Field Duplicates (2% insertion rate), were reviewed.
The quality of the assay data was assessed by analysing the Certified Reference Material (CRM or Standards) and
duplicate samples in terms of accuracy and precision. The precision analysis determines how closely the results can be
repeated, while the accuracy analysis determines how similar the results are to the reported CRM value.
Mineral Resource Estimation Methodology;
The previous Mineral Resource estimate was based on the delineation of gold lodes at a 0.5g/t Au cut-off, with
allowance for up to 2m of internal waste. This resulted in the generation of 74 lode wireframe models for Gilbey’s
alone. For this Resource update a different approach to modelling of the gold grade was undertaken.
• A first set of very broad LUC domains, representing distinct geological zones or trends, have been defined. A
nominal cut-off grade of 0.2g/t Au has been used, where possible, but in many areas, especially those peripheral
to the Main Porphyry Zones at Gilbey’s and Sly Fox, the boundary has been demarcated at even lower grades. All
available drill data were used, and no spatial restrictions save for the limits of the drilling extent were applied.
• A very high tolerance for internal waste has been allowed for the broad domains. No specific width tolerance was
implemented, with large amounts of low grade material included if it was deemed to form part of the general
geological feature governing the domain.
• Very poor reconciliation results have been recorded against the previous OK Mineral Resource estimate and as a
result, management commenced a review and decided to commence an update of the Mineral Resource models
exploring different modelling techniques to improve performance in March 2019. A linear interpolation method
such as Ordinary Kriging (OK), if implemented inside such broad domains with a highly positively skewed gold
grade distribution (as is the case at Dalgaranga), would run a high risk of over-smoothing the grade using relatively
wide spaced (RDV) assay data. This is likely to result in an unrealistically distorted grade-tonnage relationship for
the block estimates. After reviewing previous performance against the OK model, it was decided instead to use
Localised Uniform Conditioning (LUC), which is a non-linear method designed specifically for the purpose of
estimating the grade-tonnage profile of relatively small blocks using wide spaced data. If well implemented, LUC
does not result in over-smoothed estimates and should provide a more realistic representation of the grade-
tonnage relationship for long term planning.
• The broad domain with LUC approach taken does not rely on a highly deterministic wireframe volume boundary
close to or at the economic cut-off, but lies well below the cut-off. This means that the volume of economic
material is determined instead by the assay data and their relative locations within the broad envelope. This
method is considered to be a more objective and lower risk approach than was previously undertaken, especially
in areas where continuity is low.
• A second set of ‘OK GC’ domains were generated, but restricted to the volume of material covered by GCY GC
drilling. Because of the much greater data density, it was deemed possible to apply a more rigid set of constraints
on the domain volume definition in such areas. Leapfrog software was used to produce domain solid models at a
0.2g/t Au cut-off, with allowance for up to 2m of internal waste. Any solids having a volume less than 50m3 were
deleted and therefore excluded from interpolation.
• These ‘OK GC’ domains were estimated using OK, since the dense data precludes the need to use a more
sophisticated interpolation strategy to prevent over-smoothing.
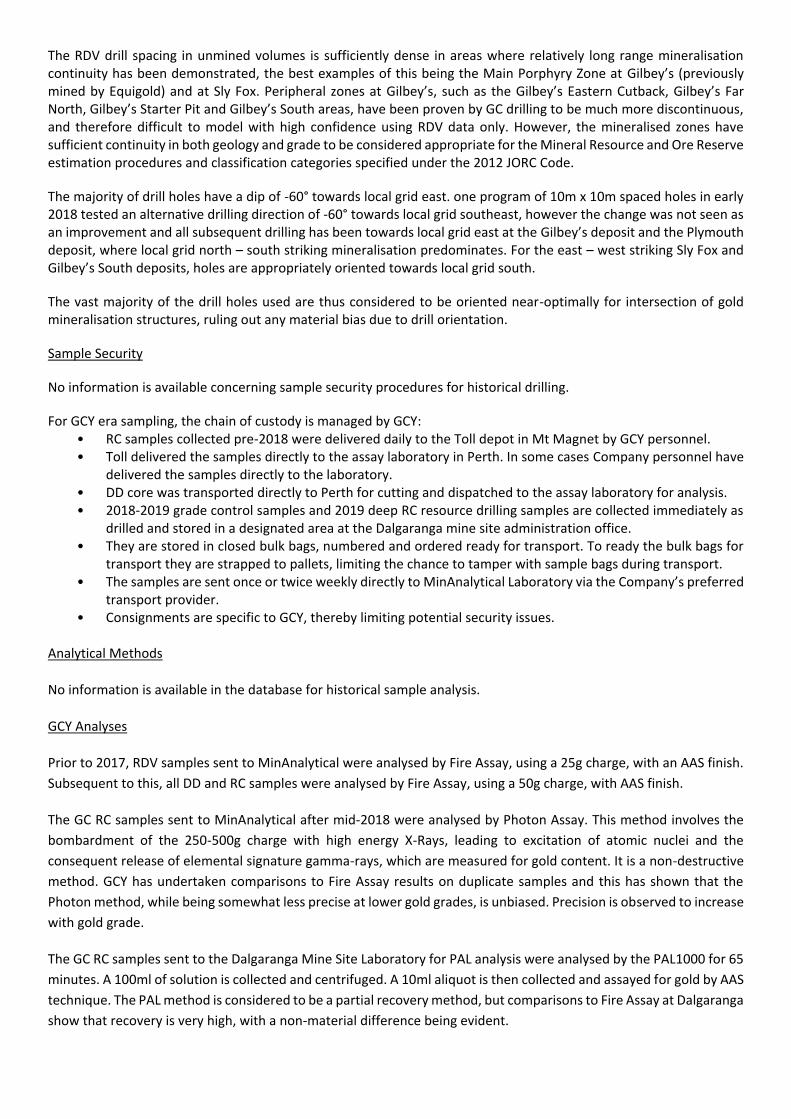
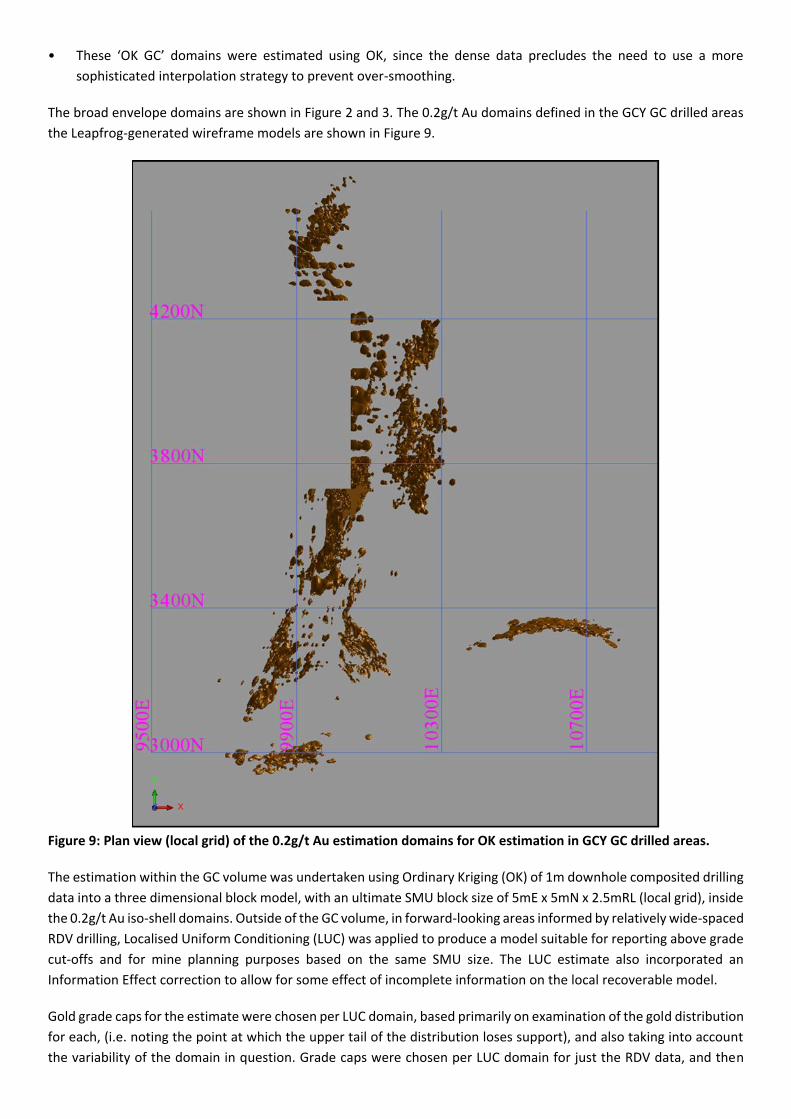
The broad envelope domains are shown in Figure 2 and 3. The 0.2g/t Au domains defined in the GCY GC drilled areas
the Leapfrog-generated wireframe models are shown in Figure 9.
Figure 9: Plan view (local grid) of the 0.2g/t Au estimation domains for OK estimation in GCY GC drilled areas.
The estimation within the GC volume was undertaken using Ordinary Kriging (OK) of 1m downhole composited drilling
data into a three dimensional block model, with an ultimate SMU block size of 5mE x 5mN x 2.5mRL (local grid), inside
the 0.2g/t Au iso-shell domains. Outside of the GC volume, in forward-looking areas informed by relatively wide-spaced
RDV drilling, Localised Uniform Conditioning (LUC) was applied to produce a model suitable for reporting above grade
cut-offs and for mine planning purposes based on the same SMU size. The LUC estimate also incorporated an
Information Effect correction to allow for some effect of incomplete information on the local recoverable model.
Gold grade caps for the estimate were chosen per LUC domain, based primarily on examination of the gold distribution
for each, (i.e. noting the point at which the upper tail of the distribution loses support), and also taking into account
the variability of the domain in question. Grade caps were chosen per LUC domain for just the RDV data, and then
again for all the composite data. The reason for this was that the LUC estimate was first run using RDV data only, with
a final run using all the data.
A set of grade caps was also chosen for the GC domains, for use in the OK estimation of gold grade.
Variogram models for gold grade, per estimation domain, were produced by transforming the capped composite data
to Gaussian space, modelling the spatial structure, and then back-transforming the model to real space for use in
estimation. This process reduces the impact of outliers on the experimental variogram calculation, allowing for
elucidation of the true underlying spatial structure.
Oxidation/weathering state was assigned using the relevant wireframe solid and surface models.
Historical reports indicate that 27 historical dry density measurements were recorded for Gilbey’s, but that the data
was unlocated. Values of 2.0t/m3 for oxide, 2.4t/m3 for transitional and 2.8t/m3 for fresh material were historically
assigned by Equigold, and these values have been used in this Mineral Resource update. Additionally, a dry density
value of 1.8t/m3 has been applied to dump material, none of which is reported in the Mineral Resource.
A total of 312 bulk density measurements were taken on GCY core samples, collected from diamond holes drilled at
the Gilbey’s deposit and analysed using the water immersion technique. The measurements were all sourced from
fresh rock. The GCY measurements average 2.8t/m3 and no difference is noted between mineralised and non-
mineralised fresh material.
The block model was depleted using surfaces representing pre-mining topography and the topography inclusive of
surface mining as at the end of June 2019.
The Criteria used for classification, including drill and data spacing and distribution
The Mineral Resource has been classified and reported in accordance with the 2012 JORC Australasian Code for
Reporting of Mineral Resources and Ore Reserves (JORC Code). The Dalgaranga mineralisation is sufficiently drilled to
allow classification as Measured, Indicated or Inferred (Table 1).
The following points are considered to be material in the classification of the Dalgaranga Mineral Resource:
Geological interpretation – The current geological interpretations including mineralisation, structure, weathering,
and lithology are considered the best possible with available information.
Drill hole spacing and sampling density – Mineralisation interpretations are based on a variable drill hole spacing.
The data spacing includes 10m x 7.5m for GC drilling and is variable for RDV drilling. In most of the Dalgaranga
Project areas, the RDV drill spacing is nominally at a 25m – 40m spacing, but becomes less dense at depth.
The LUC estimate of the gold resources, ‘calibrated’ to some extent to a GC model based on the dense GC drill
data, with distance-limiting applied where considered appropriate to account for the limited continuity of high
grade material. In the peripheral zones where this ‘calibration’ has been used, the confidence in the estimate is
considered to be lower than, for instance, the significantly less erratic and more continuous Gilbey’s Main Porphyry
Zone. Open pit mining (SMU 5mE x 5mN x 2.5mRL) is the current method planned for the Life-of-Mine.
The Measured Mineral Resource is only the mineralisation defined within or peripheral to the historical close
spaced GC drilling within the Gilbey’s Main Porphyry Zone (LUC Domain 101), situated at the base of the Equigold
pit. Indicated Mineral Resource is defined within and peripheral to the GCY GC drilling at Plymouth and the
peripheral zones at Gilbey’s. Indicated resources have been extended to depths well beyond the GC drilling only
in the Gilbey’s Main Porphyry Zone (LUC Domain 101) and at Sly Fox (LUC Domain 701), which are defined by RDV
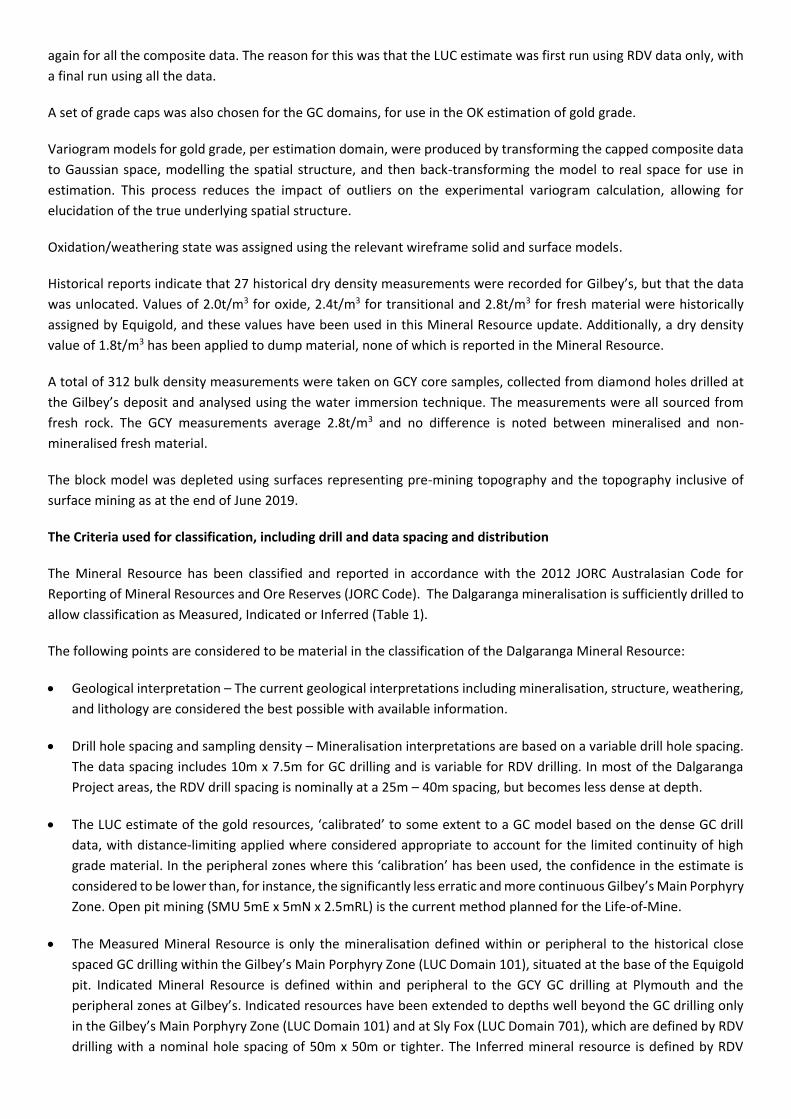
drilling with a nominal hole spacing of 50m x 50m or tighter. The Inferred mineral resource is defined by RDV
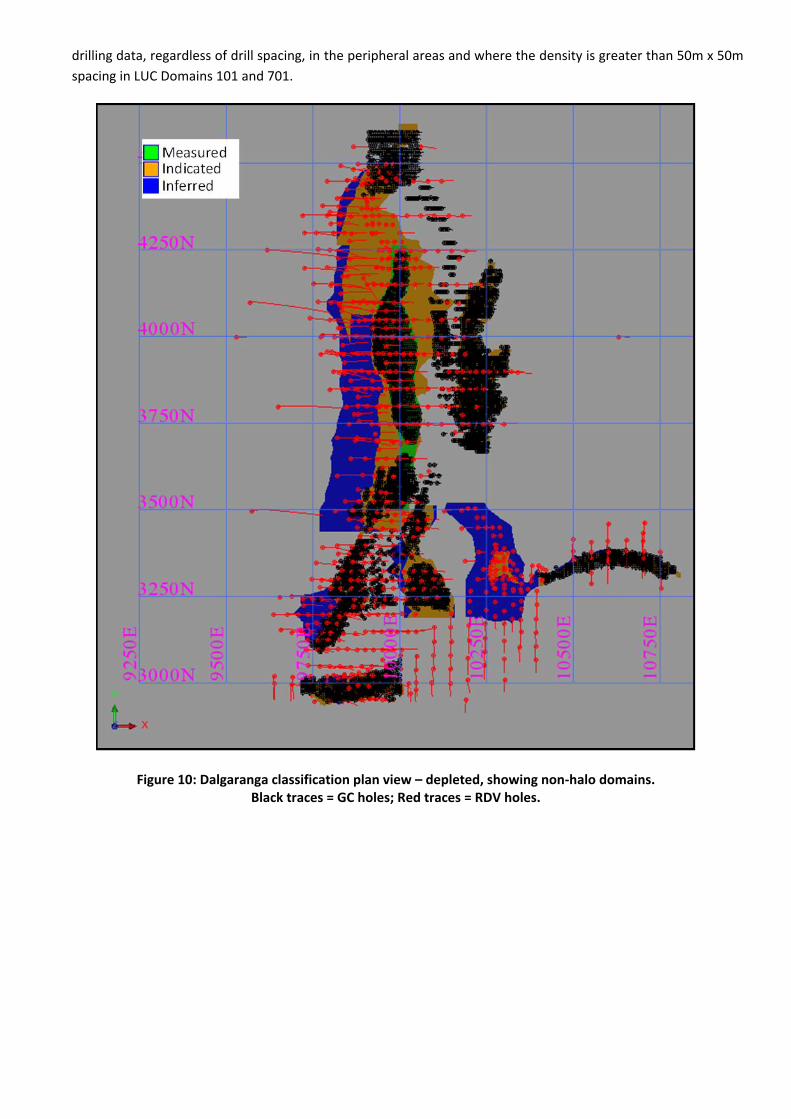
drilling data, regardless of drill spacing, in the peripheral areas and where the density is greater than 50m x 50m
spacing in LUC Domains 101 and 701.
Figure 10: Dalgaranga classification plan view – depleted, showing non-halo domains. Black traces = GC holes; Red traces = RDV holes.

Figure 11: Dalgaranga classification plan view – depleted, showing non-halo domains. Black traces = GC holes; Red traces = RDV holes.
Figure 12: Dalgaranga classification long section view looking towards the west (local grid) – depleted, showing non-halo domains. Black traces = GC holes; Red traces = RDV holes.
Mining and Metallurgical Methods and Parameters, and other material modifying factors considered to date
The Gilbey’s deposit was previously mined as an open pit in the period 1996 to 2000, and the current phase of mining
involves extending and deepening the existing open pit.
Metallurgical test work was conducted on the Gilbey’s deposit by Equigold prior to mining of the deposit from 1996
to 2000. GCY has access to extensive reconciliation records from that period of operation. The remaining
mineralisation has the same characteristics as the mined material. Further metallurgical test work was conducted on
samples obtained from GCY surface drilling, from each material type at the Gilbey’s deposit as part of Dalgaranga Gold
Project Feasibility Study (ASX release on 25th November 2016). Year to date Mill Production Sampling has shown that
gold recovery is currently averaging 89%. Black (carbonaceous) shales occurring within the mineralised sequence are
known to result in lower recoveries. The black shales have been modelled using implicit methods (Leapfrog) and were
flagged into the block model. A gold recovery of 73% is currently in use, which is at the lower end of metallurgical test
work that was undertaken on black shale material.
Appendix 2
Listing Rule 5.8.1
Pursuant to ASX listing rule 5.8.1, and in addition to the information contained in Appendix 3, the Company provides
the following in respect of the 2019 Dalgaranga Resource update for the Golden Wings Mineral Resource estimate:
Notes on Golden Wings Deposits and Mineral Resource Estimate
Dalgaranga Deposit Geology and Geological interpretation;
Regional Geology
The Dalgaranga Gold Project occurs within the Dalgaranga Greenstone Belt in the Murchison Province of Western
Australia). The northeast trending belt consists of high magnesium basalt, tholeiitic basalt, intermediate volcanic, felsic
intrusive porphyry, and a volcano-sedimentary sequence dominated by black shale and volcaniclastic lithologies. Felsic
volcanic rocks outcrop on the western side of the belt, north of the Gilbey’s and Golden Wings deposits. The
Greenstone sequence is intruded by large gabbro complexes in the north (Mt Farmer, Mt Charles) and to the west
(Dalgaranga Hill). The stratigraphy has been folded into two regional synforms which plunge in opposite directions,
separated by a regional fault/shear along the western side of the Mt Farmer gabbro sill, westwards to the south side
of the gabbroic Dalgaranga Hill. The Dalgaranga Greenstone Belt is intruded by a number of post-tectonic granites
separated by zones of amphibolite and mafic schists intruded by pegmatites. East-west trending Proterozoic dykes of
dolerite and gabbro intrude the Greenstone sequences.
Geophysical interpretation of the region shows large scale northeast structures and a general fabric also oriented
northeast. The fabric and structures cross cut folded stratigraphy and are synonymous with regional mineralised
corridors.
Golden Wings
The Golden Wings deposit lies on the south eastern side of the Dalgaranga Greenstone belt some 4km north of the
Gilbey’s deposit.
The overlying laterites at Golden Wings are gold enriched and were subject to some mining by Equigold, the pisolitic
horizon is some 3-10m thick with patchy gold grades. GCY mined the remnant gold rich laterites when mining
recommenced in 2018.
The host rocks for the oxide and primary gold lodes at Golden Wings consist of a sequence of high magnesium basalts,
basalt and interflow sediments (black shales) and minor porphyries. Quartz gabbro occurs on the northern side of the
deposit. These rock units have been sheared to form quartz biotite chlorite schists, with the strike of the geology
interpreted to be east-west in a broad shear zone. A well-developed weathering profile occurs at Golden Wings; at
surface a mixed hardpan residual pisolitic laterite horizon occurs which is up to 10m thick, below which residual
mottled and saprolitic clay zones are developed, in places strong oxidation occurs to a depth of 80m or more.
The deposit has a complex deformation history. As outlined by Davis (2019) there are five recognised deformation
events (Figure 13). The D1 event, present as an east-west striking zone of subvertical cleavage, is the primary
directional control on the Golden Wings mineralisation. The D1 strain zone has been subsequently folded to form two
distinct structural domains; one in the north of the open pit and one in the south.

Figure 13: Description of key structural geology events (After Davis, 2019)
The mineralisation shows a correlation to the structural framework of the deposit, thickening and thinning in response
to the various strain zones developed in the rock mass. This has led to multiple higher-grade shoots, primarily at the
intersection of S1 and other foliations at Golden Wings.
Drilling and Sampling, and Sample Analysis Techniques;
Historic Drill Data
Exploration and production from the Golden Wings mineralisation dates back to the mid-1990’s. Therefore, the
geology database includes results from companies and activities before GCY gained possession of the tenement. Of
the 2,294 drill holes recorded in the Golden Wings database, 552 are identified as non-GCY data. The vast majority of
these 552 holes are either RAB (113) or ‘LAT’ (354) and only 81 are either diamond drill holes (1) or reverse circulation
holes (80).
All RAB, ‘LAT’ and aircore (AC) holes have been excluded from the 2019 resource estimate. This is a material change
from the 2017 estimate which allowed both ‘LAT’ and AC samples to inform the block model. SD2’s decision to exclude
RAB, ‘LAT’ and AC drill holes is based on the potential sample quality associated with these drilling and sampling
methods combined with the additional drill coverage provided by GCYs more recent drilling programs.
Of the 81 RC and DDH drilled by companies prior to GCY, 37 were excluded on the advice of GCY.
Drilling and sampling were by Newcrest and Equigold and followed standard industry practice as defined at the time
of execution. Samples were collected from face-sampling bits in RC drilling with the drill chips collected in a cyclone
prior to splitting in a riffle splitter. Nominal sample length is 1.0m with a final sample weight of between 2-3kg sent to
the laboratory for analysis. Newcrest note some challenges with sampling wet, sticky clays and in these instances grab
samples were collected from the drill cuttings.

Gascoyne Drill Data
There are 1,742 holes that were drilled by GCY. This total includes holes adjacent to but not intersecting the Golden
Wings mineralisation. Forty-four holes were excluded by GCY due either to unacceptable quality, lack of assay data,
or holes superseded by more up to date grade control drilling. SD2 applied a further data filter, requiring all holes used
in the estimate to have complete collar, down-hole survey and sampling data. After this filtering 1,590 holes remained
in the database. A further 498 holes were not relevant to the remaining Golden Wings resource (largely holes testing
the now depleted lateritic mineralisation) leaving 1,092 holes (36,065.75m) in the immediate area of the mineral
resource.
One diamond drill hole was used in the resource estimate. The other 1,091 holes were drilled by reverse circulation
methods. RC drilling and sampling was by conventional 5½” face-sampling bit with samples collected in a cyclone prior
to splitting. The cyclone sample was split using either a riffle or cone splitter to reduce sample mass to between 2.5
and 4kg. Field duplicates were collected as part of GCYs quality management system.
RC drilling limits the precision of contact definition due to the sampling method. Of necessity, sample intervals are
fixed a nominal 1.0m regardless of any geological contact. The nominal 1.0m has a relatively low precision, commonly
ranging from 0.8m to 1.2m in Australian drilling operations due to sample hang-up and delimitation errors. This 1.0m
fixed length impacts on the precision of the domain boundary, potentially impacting on the estimation of the grade-
tonnage curve and is a factor to be considered in resource classification. In the absence of supporting diamond drilling
data, a resource defined solely by RC samples is, in SD2’s opinion unlikely to meet the requirements of being classified
as a Measured Resource under the JORC Code.
The location of drill hole collars for all of the holes used in this estimate were surveyed by differential GPS (DGPS) to a
precision of +/-1m. Coordinates were recorded in MGA94 Zone 50 grid and a calculated local mine grid. This estimate
was completed in the MGA94 Zone 50 system.
The precision and accuracy drill hole collars are considered suitable for resource estimation. The collar coordinate
precision is consistent with the sample length precision and SD2 considers the data fit-for-purpose.
For longer drill holes (greater than ~40m), the dip and dip-azimuth of the drill holes used in this estimate were recorded
by a variety of methods. Prior to September 2016, 30m down-hole surveys were collected using an electronic multi-
shot survey tool operated by the drilling contractors. Post September 2016 a Champ gyroscopic survey tool has been
used. The change of survey methodology was prompted following an internal review by GNT which indicated the
potential for magnetic minerals to interfere with the multi-shot tool. The Champ tool is operated by the drilling
contractor and surveys from the bottom of the hole towards the top at 30m intervals with the final measurement
taken within 3m or less to the collar.
The survey frequency for longer holes ranges between one reading every 12.5m to one reading every 50m with an
average of one reading every 29m.
For shorter, grade control holes the planned (design) dip and azimuth were adopted (typically -60 towards 180 or
vertical).
The survey methods and frequency adopted by GCY are common industry practice and are reasonable for resource
estimate. All resource and grade control drill holes are geologically logged using a standardised logging legend. The
majority of drilling is reverse circulation and therefore the geological data is restricted to lithology and alteration with
texture and structure largely destroyed by the drilling process. Holes are logged using the site’s GeoBank logging
system and uploaded to the central geological database.
GCY Analyses – Analytical Methods
Prior to 2017, resource definition drilling (RDV) samples sent to MinAnalytical were analysed by Fire Assay, using a 25g
charge, with an AAS finish.
The GC RC samples sent to MinAnalytical after mid-2018 were analysed by Photon Assay as described below.
GCY’s RC drill chips for both grade control (GC) and RDV were analysed in Perth at the NATA accredited facility owned
and operated by Minanalytical Laboratories Pty Ltd. The analysis technique is PhotonAssay™, a relatively new
analytical method developed by the Commonwealth Scientific and Industrial Research Organisation (CSIRO) and
commercialised by Chrysos Corp.
PhotonAssay is based on gamma activation analysis (GAA). Samples are exposed to a high-energy X-ray source which
causes excitation of the atomic nuclei in the sample. As the nuclei return to a non-excited state a gamma-ray signature
is emitted. The nature and strength of this signature is used to calculate elemental gold grade. The technique is non-
destructive and works directly on rock chips or drill core as well on pulverised samples.
The GC RC samples sent to the Dalgaranga Mine Site Laboratory for PAL analysis were analysed by the PAL1000 for 65
minutes. A 100ml of solution is collected and centrifuged. A 10ml aliquot is then collected and assayed for gold by AAS
technique.
Quality Assurance and Quality Control
Data quality and assessment of the fit-for-purpose incorporates aspect of drilling, sampling, analysis and database
management. SD2 reviewed procedures and outcomes and assessed quality performance based on data supplied by
GCY. This included the analytical performance of a range of different certified reference materials (CRMs) processed
in batch with GCY grade control samples.
Mineral Resource Estimation Methodology;
The Golden Wings resource was estimated by Localised Uniform Conditioning (LUC) using Datamine Software Studio
RM. The mineralisation was constrained by a 3-dimensional volume developed by Indicator Kriging (IK) at a 0.25g/t Au
threshold and contoured above a 35% probability of grade exceeding 0.25g/t Au (i.e., the 35% iso-surface of the
0.25g/t Au indicator Figure 14). This constraining envelope was selected based on evidence derived from open pit
mining exposures, interpreted structural geological controls and as-mined grade control ore/waste boundaries.
For the IK estimation used to define the constraining volume, drill hole sample data was composited to a nominal 2.0m
from the top of hole downwards. These composites were then transformed into binary indicators (0, 1) at the 0.25g/t
threshold. Experimental variograms of this binary transform were used to develop indicator variogram models. The
indicators were estimated via Ordinary Kriging using search parameters derived on the basis of the variogram model
and the sample-to-block configuration. The resulting indicator estimate was then contoured in 3-dimensions using the
iso-surfacing tools provided in Studio RM. These iso-surfaces were reviewed and modified to improve their correlation
to the exposed (in pit) geology. The Golden Wings mineralisation style includes a high proportion of isolated gold
intersections and several of these isolated intersections were not captured by the IK and iso-surface model.
Intersections exceeding 2.0m at a grade greater than 0.5 g/t Au were incorporated into the mineralisation
interpretation and given a restricted spatial zone of influence (derived from the variogram model) to prevent these
intersections from adversely impacting on the quality of the estimate.
For the LUC grade estimation, samples were composited to a nominal 2.0m within the constraining volume. The
frequency distribution of these 2.0m composites was examined and grade caps of 7 g/t (Domain 1001) and 17 g/t
(Domain 1002) were applied. These caps reflect the point where the rate of change in the coefficient of variation (CV)

stabilises as high-grade composites are sequentially removed from the population. The grade caps correspond to the
98.3% and 99.25% distribution respectively.
Experimental variograms were calculated based on the 2.0m composites and variogram models were fitted to the
experimental results. The variogram models have a moderate nugget effect (~36%); however the slope near the origin
is steep with more than 50% of the total variance occurring within the first 5m.
The LUC was estimated in four stages:
An initial estimate of the panel grade (at a support of 10m x 5m x 5m) using Ordinary Kriging of the 2.0m
composites;
Subsequent Uniform Conditioning (UC) of the panel estimates to a selective mining unit (SMU) of 10m x 5m x 2.5m
based on the dispersion variance of the panel estimate. The SMU was selected after discussions with GNT and
reflects the minimum volume likely to be marked out as an individual dig unit during grade control. The UC change-
of-support was developed for grades ranging from 0.0g/t Au to 16.25g/t Au at 0.25g/t intervals;
Development of an SMU support grade estimate to rank the SMU distribution within each panel. This estimate
was by Ordinary Kriging using modified search parameters to reduce the smoothing and enhance the ranking
outcome; and
Allocation of SMU-support metal and grade to individual SMU blocks based on the panel UC grade-tonnage curve
and the ranking estimate. This is the final ‘localisation’ step in an LUC estimate.
Bulk density was assigned to the estimate based on estimated oxidation state. Oxidation surfaces were derived from
geological logging and are largely unchanged from the 2017 estimate. Bulk density ranges from 2.0 g/cm3 to 2.8 g/cm.
These values are based on the results of tests conducted at the nearby Gilbey’s open pit during feasibility study and
are supported by project-to-date tonnage reconciliation performance against the ore treatment plant.
The LUC estimate is a so-called ‘recoverable resource’ estimate. It incorporates an allowance for mining recovery as
the SMU support of 10m x 5m x 2.5m (XYZ) assuming perfect selection (i.e., that every SMU-size block can be perfectly
mined independently of the surrounding blocks.) The estimate does not include other factors that contribute to mining
loss and dilution such as blast-associated mixing, dig block decisions and the physical interaction of mining equipment
and the broken rock mass.
The reporting cut-off grade is 0.3g/t Au and is based on economic studies completed by GCY. It corresponds to the
current (April 2019) mining cut-off grade for oxide material.
Figure 14: Golden Wings 0.25 gold grade indicator - 35% probability iso-surface

Criteria used for classification, including drill and data spacing and distribution
The resource is classified according to the JORC Code as Indicated Resource and Inferred Resource. There is no
Measured Resource at Golden Wings. In classifying the resource SD2 considered:
Sampling type, spacing and quality;
Geological factors including the geological setting and mineralisation style;
Database integrity;
The relative dimensions of the mineralisation compared to the available data;
Recent mining activities and operational performance; and
Uncertainty associated with alternate, reasonable geological interpretations, variogram models and estimation
parameters.
In SD2’s opinion the data available for resource estimation is fit-for-purpose. No data quality or database integrity
issues affected the resource classification. The main factor affecting the classification is the highly variable nature of
both the geology and the grade distribution. This variability limits confidence in the resource estimate even after close-
spaced grade control drilling. At best geological continuity can be assumed between points of observation, not
confirmed. Therefore, the highest classification under the JORC Code is Indicated Resource.
To classify the resource SD2 investigated the local and average sample distribution. Initially this analysis involved
determining the number of samples informing each block during estimation and the average distance of those
samples. Blocks supported by more than 10 samples within eight meters were considered well informed. Blocks
supported by more than 10 samples within 15m were considered less well informed. Blocks supported by less than 10
samples or where the average distance to the samples exceeded 15m were considered poorly informed.
Using this sample spacing analysis SD2 developed 3D surfaces separating the majority of well informed, less informed
and poorly informed blocks. These surfaces partitioned the resource into Indicated, Inferred and Unclassified
mineralisation. The Indicated-to-Inferred boundary largely lies along a horizontal plane at approximately 360m RL
except for the centre of the pit where additional, deep drilling focused on the high-grade core allowed the boundary
to be lowered to approximately 310m RL.
The mineral resource is classified using the guidelines published in the JORC Code (2012). This includes consideration
of the geological setting and understanding of the controlling geological features, the quality and quantity of
supporting data including drill holes, mapping and sampling and consideration of the likelihood of future economic
extraction (the ‘reasonable prospects test’). There is no Measured Resource. Indicated Resource refers to
mineralisation where there are more than 10 samples within eight metres. This volume was defined by a surface that
reflect the average drill hole spacing and corresponds to a horizontal plan at approximately 360m RL with a depth
extension to 310m RL in the centre of the designed open pit where additional deep drilling exists. Inferred Resource
corresponds to mineralisation where there are more than 10 samples within 15m. Mineralisation where there are
fewer than 10 samples within 15m is unclassified and has not been reported.
Mining and Metallurgical Methods and Parameters, and other material modifying factors considered to date
Metallurgical recovery performance has been demonstrated by both the current mining operation and dedicated
metallurgical sampling completed in 2013 and in 2016 (documented in Dalgaranga Gold Project Feasibility Study - ASX
release on 25th November 2016)

Metallurgical recovery, based on current operational performance, is high, ranging from 95% to 99% with relatively
low residence times (24 hours or less). Metallurgical performance is not considered an impediment to the potential
economic viability at Golden Wings.
References.
Davis, T., 2019. A Review of the structural geology of the Golden Wings and Gilbey’s gold deposits, Dalgaranga,
Western Australia. Internal company report by Impel Geoscience.
Figure 15: Project Locations in the Gascoyne and Murchison Regions

Figure 16: Dalgaranga Gold Project Deposit and Prospect Layout
On behalf of Gascoyne Resources Limited Eva O’Malley Company Secretary
For further information, please contact: Media enquiries: Creditor & Shareholder enquiries: Shane Murphy [email protected] Strategic Communications FTI Consulting Ph: +61 8 9485 8888 / 0420 945 291 E: [email protected]
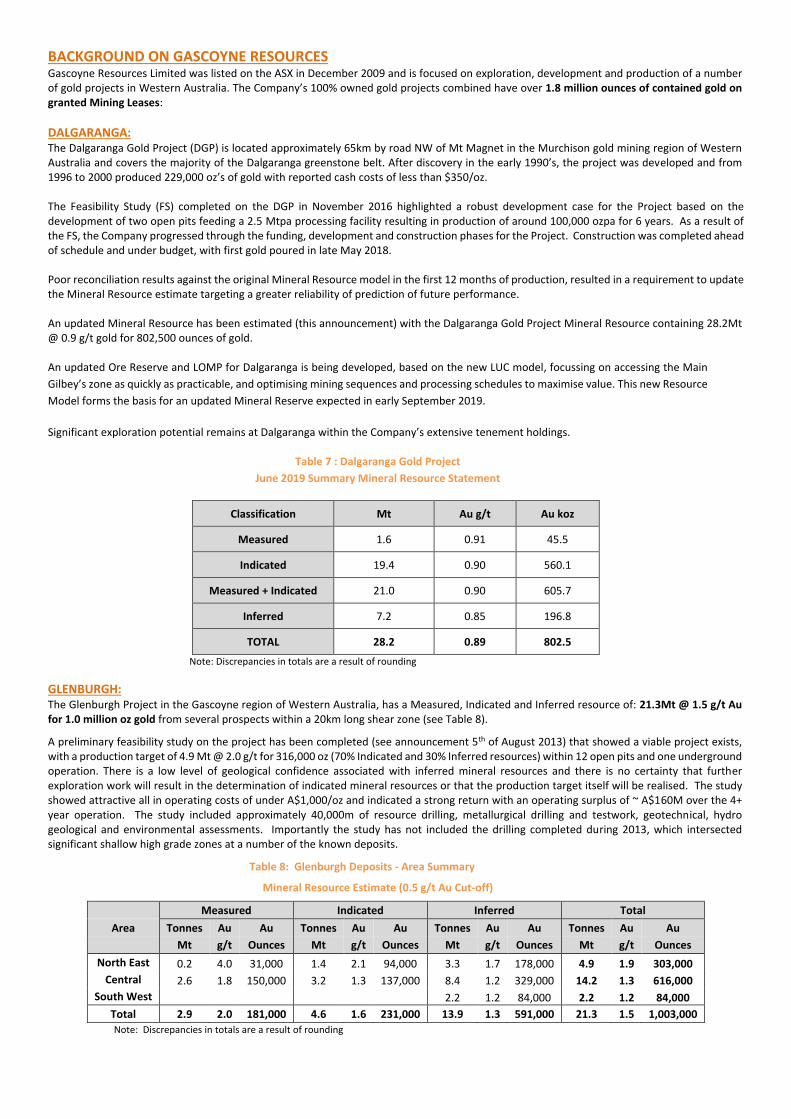
BACKGROUND ON GASCOYNE RESOURCES Gascoyne Resources Limited was listed on the ASX in December 2009 and is focused on exploration, development and production of a number of gold projects in Western Australia. The Company’s 100% owned gold projects combined have over 1.8 million ounces of contained gold on granted Mining Leases:
DALGARANGA: The Dalgaranga Gold Project (DGP) is located approximately 65km by road NW of Mt Magnet in the Murchison gold mining region of Western Australia and covers the majority of the Dalgaranga greenstone belt. After discovery in the early 1990’s, the project was developed and from 1996 to 2000 produced 229,000 oz’s of gold with reported cash costs of less than $350/oz. The Feasibility Study (FS) completed on the DGP in November 2016 highlighted a robust development case for the Project based on the development of two open pits feeding a 2.5 Mtpa processing facility resulting in production of around 100,000 ozpa for 6 years. As a result of the FS, the Company progressed through the funding, development and construction phases for the Project. Construction was completed ahead of schedule and under budget, with first gold poured in late May 2018. Poor reconciliation results against the original Mineral Resource model in the first 12 months of production, resulted in a requirement to update the Mineral Resource estimate targeting a greater reliability of prediction of future performance. An updated Mineral Resource has been estimated (this announcement) with the Dalgaranga Gold Project Mineral Resource containing 28.2Mt @ 0.9 g/t gold for 802,500 ounces of gold. An updated Ore Reserve and LOMP for Dalgaranga is being developed, based on the new LUC model, focussing on accessing the Main
Gilbey’s zone as quickly as practicable, and optimising mining sequences and processing schedules to maximise value. This new Resource
Model forms the basis for an updated Mineral Reserve expected in early September 2019.
Significant exploration potential remains at Dalgaranga within the Company’s extensive tenement holdings.
Table 7 : Dalgaranga Gold Project
June 2019 Summary Mineral Resource Statement
Classification Mt Au g/t Au koz
Measured 1.6 0.91 45.5
Indicated 19.4 0.90 560.1
Measured + Indicated 21.0 0.90 605.7
Inferred 7.2 0.85 196.8
TOTAL 28.2 0.89 802.5
Note: Discrepancies in totals are a result of rounding
GLENBURGH: The Glenburgh Project in the Gascoyne region of Western Australia, has a Measured, Indicated and Inferred resource of: 21.3Mt @ 1.5 g/t Au for 1.0 million oz gold from several prospects within a 20km long shear zone (see Table 8).
A preliminary feasibility study on the project has been completed (see announcement 5th of August 2013) that showed a viable project exists, with a production target of 4.9 Mt @ 2.0 g/t for 316,000 oz (70% Indicated and 30% Inferred resources) within 12 open pits and one underground operation. There is a low level of geological confidence associated with inferred mineral resources and there is no certainty that further exploration work will result in the determination of indicated mineral resources or that the production target itself will be realised. The study showed attractive all in operating costs of under A$1,000/oz and indicated a strong return with an operating surplus of ~ A$160M over the 4+ year operation. The study included approximately 40,000m of resource drilling, metallurgical drilling and testwork, geotechnical, hydro geological and environmental assessments. Importantly the study has not included the drilling completed during 2013, which intersected significant shallow high grade zones at a number of the known deposits.
Table 8: Glenburgh Deposits - Area Summary
Mineral Resource Estimate (0.5 g/t Au Cut-off)
Measured Indicated Inferred Total
Area Tonnes Au Au Tonnes Au Au Tonnes Au Au Tonnes Au Au
Mt g/t Ounces Mt g/t Ounces Mt g/t Ounces Mt g/t Ounces
North East 0.2 4.0 31,000 1.4 2.1 94,000 3.3 1.7 178,000 4.9 1.9 303,000
Central 2.6 1.8 150,000 3.2 1.3 137,000 8.4 1.2 329,000 14.2 1.3 616,000
South West 2.2 1.2 84,000 2.2 1.2 84,000
Total 2.9 2.0 181,000 4.6 1.6 231,000 13.9 1.3 591,000 21.3 1.5 1,003,000
Note: Discrepancies in totals are a result of rounding

EGERTON: The project includes the high grade Hibernian deposit and the high grade Gaffney’s Find prospect, which lie on granted mining leases. Previous drilling includes high grade intercepts, 14m @ 71.7 g/t gold, 34m @ 14.8 g/t gold, 8m @ 11.4 g/t gold, 2m @ 147.0 g/t gold, and 5m @ 96.7 g/t gold associated with quartz veining in shallow south-west plunging shoots. The Hibernian deposit has only been drill tested to 70m below surface and there is strong potential to expand the deposit with drilling testing deeper extensions to known shoots and targeting new shoot positions. Extensions to mineralised trends and new regional targets will be tested with Aircore during drilling campaigns.
Further information is available at www.gascoyneresources.com.au Competent Persons Statement
The information in this announcement that relates to Mineral Resources for the Gilbey’s, Gilbey’s South, Plymouth, and Sly Fox gold deposits at the Dalgaranga project has been compiled under the supervision of Mr Michael Job and Mr Michael Millad. Mr Michael Job is a Principal Geologist/Geostatistician at Cube Consulting Pty Ltd and a Fellow in good standing of the Australian Institute of Mining and Metallurgy. Mr Michael Millad is a Director and Principal Geologist/Geostatistician at Cube Consulting Pty Ltd, and a Member in good standing of the Australian Institute of Geoscientists. Both Mr Job and Mr Millad have sufficient experience that is relevant to the style of mineralisation and type of deposit under consideration and to the activity that was undertaken to qualify as a Competent Persons, as defined in the 2012 Edition of the ‘Australasian Code for Reporting of Exploration Results, Mineral Resources and Ore Reserves (The Joint Ore Reserves Committee Code – JORC 2012 Edition). Mr Michael Job and Mr Michael Millad consent to the inclusion of the data in the form and context in which it appears.
The information in this announcement that relates to Mineral Resource for the Golden Wings gold deposit at the Dalgaranga project has been compiled by Mr Scott Dunham, a Competent Person who is a Fellow of The Australia Institute of Mining and Metallurgy and an employee of SD2 Pty Ltd. Mr Dunham has sufficient experience that is relevant to the style of mineralisation and type of deposit under consideration and to the activity that was undertaken to qualify as a Competent Persons, as defined in the 2012 Edition of the ‘Australasian Code for Reporting of Exploration Results, Mineral Resources and Ore Reserves (The Joint Ore Reserves Committee Code – JORC 2012 Edition).
Information in this announcement relating to the Dalgaranga project is based on data compiled by Gascoyne’s Chief Geologist Mr Julian Goldsworthy who is a member of The Australasian Institute of Mining and Metallurgy. Mr Goldsworthy has sufficient experience which is relevant to the style of mineralisation and type of deposit under consideration and to the activity which they are undertaking to qualify as Competent Persons under the 2012 Edition of the Australasian Code for reporting of Exploration Results, Mineral Resources and Ore Reserves. Mr Goldsworthy consents to the inclusion of the data in the form and context in which it appears.
The Glenburgh Mineral Resources have been estimated by RungePincockMinarco Limited, an external consultancy, and are reported under the 2012 Edition of the Australasian Code for reporting of Exploration Results, Mineral Resources and Ore Reserves (see 24th July 2014 titled “High Grade Domains Identified Within Updated Glenburgh Gold Mineral Resource”). The company confirms that it is not aware of any new information or data that materially affects the information included in the original market announcements and, in the case of estimates of Mineral Resources that all material assumptions and technical parameters underpinning the estimate in the relevant market announcement continue to apply and have not materially changed. The company confirms that the form and context in which the Competent Person’s findings are presented have not materially modified from the original market announcements.
The Glenburgh 2004 JORC resource (released to the ASX on April 29th 2013) which formed the basis for the preliminary Feasibility Study was classified as Indicated and Inferred and as a result, is not sufficiently defined to allow conversion to an ore reserve; the financial analysis in the preliminary Feasibility Study is conceptual in nature and should not be used as a guide for investment. It is uncertain if additional exploration will allow conversion of the Inferred resource to a higher confidence resource (Indicated or Measured) and hence if a reserve could be determined for the project in the future. Production targets referred to in the preliminary Feasibility Study and in this report are conceptual in nature and include areas where there has been insufficient exploration to define an Indicated mineral resource. There is a low level of geological confidence associated with inferred mineral resources and there is no certainty that further exploration work will result in the determination of indicated mineral resources or that the production target itself will be realised. This information was prepared and first disclosed under the JORC Code 2004, the resource has now been updated to conform to the JORC 2012 guidelines. This new JORC 2012 resource, reported above, will form the basis for any future studies.
The Mt Egerton drill intersections referred to in this announcement were prepared and first disclosed under the JORC Code 2004. They have not been updated since to comply with the JORC Code 2012 on the basis that the information has not materially changed since it was last reported.
Information in this announcement relating to the Mt Egerton Gold Project is based on data compiled by Gascoyne’s Chief Geologist Mr Julian Goldsworthy who is a member of The Australasian Institute of Mining and Metallurgy. Mr Goldsworthy has sufficient experience which is relevant to the style of mineralisation and type of deposit under consideration and to the activity which he is undertaking to qualify as Competent Persons under the 2004 Edition of the Australasian Code for reporting of Exploration Results, Mineral Resources and Ore Reserves. Mr Goldsworthy consents to the inclusion of the data in the form and context in which it appears

Appendix 3: JORC Table 1 for Gilbey’s, Gilbey’s South, Plymouth and Sly Fox Deposits
Dalgaranga Gold Project – Table 1 (JORC Code, 2012)
Section 1 Sampling Techniques and Data
(Criteria in this section apply to all succeeding sections.)
Criteria JORC Code explanation Commentary
Sampling
techniques
Nature and quality of sampling (eg cut channels, random chips, or specific
specialised industry standard measurement tools appropriate to the
minerals under investigation, such as down hole gamma sondes, or
handheld XRF instruments, etc). These examples should not be taken as
limiting the broad meaning of sampling.
Include reference to measures taken to ensure sample representivity and
the appropriate calibration of any measurement tools or systems used.
Aspects of the determination of mineralisation that are Material to the
Public Report.
In cases where ‘industry standard’ work has been done this would be
relatively simple (eg ‘reverse circulation drilling was used to obtain 1 m
samples from which 3 kg was pulverised to produce a 30 g charge for fire
assay’). In other cases more explanation may be required, such as where
there is coarse gold that has inherent sampling problems. Unusual
commodities or mineralisation types (eg submarine nodules) may warrant
disclosure of detailed information.
The Dalgaranga gold deposits have been sampled using Trenches (TR)
Rotary Air Blast (RAB) drilling, Air Core (AC) drilling, Reverse Circulation (RC)
drilling and Diamond (DD) drilling over numerous campaigns by several
companies and currently by Gascoyne Resources Limited (GCY). Grade
Control (GC) RC drilling was undertaken by GCY in 2018 - 2019 (since
commencement of mining) with the majority of holes drilled on a 10m x
7.5m grid over modelled mineralisation. The TR, RAB and AC samples have
been excluded from gold interpolation for this Mineral Resource estimate
since these sampling methods are considered to be of insufficient quality
for the purpose of resource definition. These lower quality results, were,
however, used to assist in the interpretation of mineralisation domains for
interpolation of gold grade.
Sampling procedures followed by historic operators are assumed to be in
line with industry standards at the time.
During historical (pre-2017) resource drilling campaigns, RC drilling was
used to obtain 1m samples which were split by either cone or riffle splitter
at the rig to produce a 3 - 5kg sample. In some cases a 4m composite sample
of approximately 3 – 5kg was collected from the top portion of the holes
considered unlikely to host significant mineralisation. The samples were
transported to the laboratory for analysis via 25g Fire Assay. Where
anomalous results were detected in the 4m composites, single metre re-
split samples were collected for subsequent analysis, also via 25g Fire Assay.
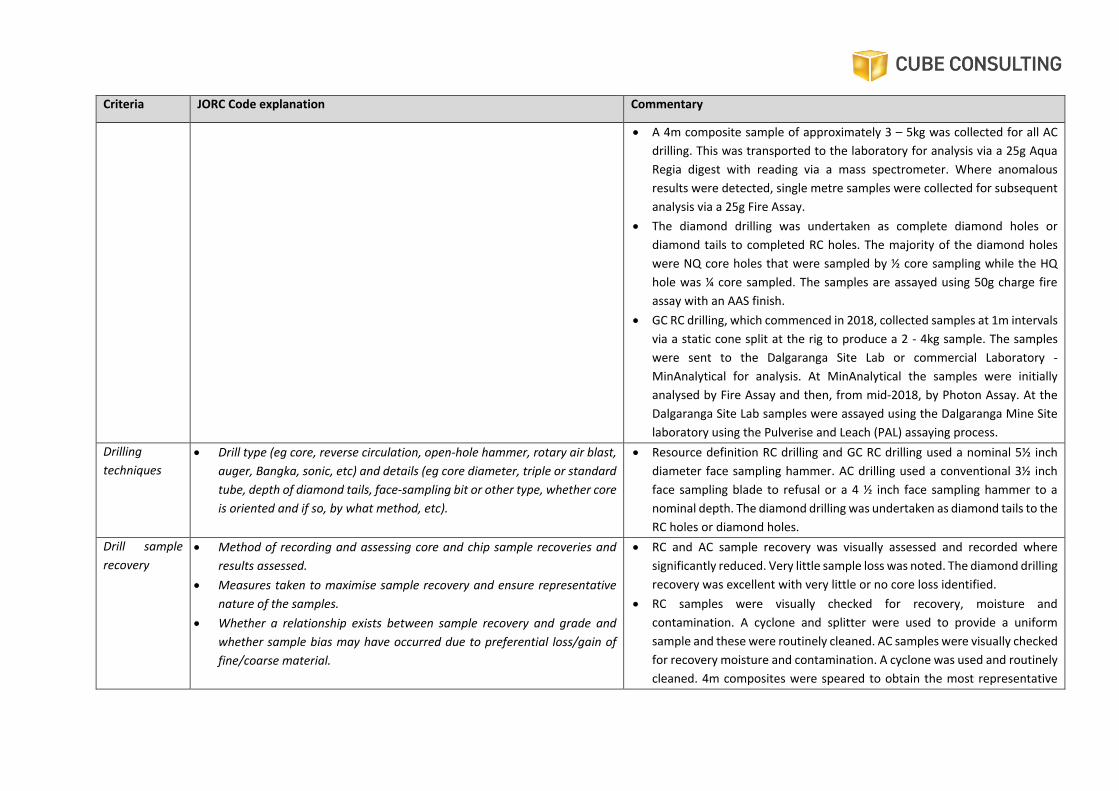
Criteria JORC Code explanation Commentary
A 4m composite sample of approximately 3 – 5kg was collected for all AC
drilling. This was transported to the laboratory for analysis via a 25g Aqua
Regia digest with reading via a mass spectrometer. Where anomalous
results were detected, single metre samples were collected for subsequent
analysis via a 25g Fire Assay.
The diamond drilling was undertaken as complete diamond holes or
diamond tails to completed RC holes. The majority of the diamond holes
were NQ core holes that were sampled by ½ core sampling while the HQ
hole was ¼ core sampled. The samples are assayed using 50g charge fire
assay with an AAS finish.
GC RC drilling, which commenced in 2018, collected samples at 1m intervals
via a static cone split at the rig to produce a 2 - 4kg sample. The samples
were sent to the Dalgaranga Site Lab or commercial Laboratory -
MinAnalytical for analysis. At MinAnalytical the samples were initially
analysed by Fire Assay and then, from mid-2018, by Photon Assay. At the
Dalgaranga Site Lab samples were assayed using the Dalgaranga Mine Site
laboratory using the Pulverise and Leach (PAL) assaying process.
Drilling
techniques
Drill type (eg core, reverse circulation, open-hole hammer, rotary air blast,
auger, Bangka, sonic, etc) and details (eg core diameter, triple or standard
tube, depth of diamond tails, face-sampling bit or other type, whether core
is oriented and if so, by what method, etc).
Resource definition RC drilling and GC RC drilling used a nominal 5½ inch
diameter face sampling hammer. AC drilling used a conventional 3½ inch
face sampling blade to refusal or a 4 ½ inch face sampling hammer to a
nominal depth. The diamond drilling was undertaken as diamond tails to the
RC holes or diamond holes.
Drill sample
recovery
Method of recording and assessing core and chip sample recoveries and
results assessed.
Measures taken to maximise sample recovery and ensure representative
nature of the samples.
Whether a relationship exists between sample recovery and grade and
whether sample bias may have occurred due to preferential loss/gain of
fine/coarse material.
RC and AC sample recovery was visually assessed and recorded where
significantly reduced. Very little sample loss was noted. The diamond drilling
recovery was excellent with very little or no core loss identified.
RC samples were visually checked for recovery, moisture and
contamination. A cyclone and splitter were used to provide a uniform
sample and these were routinely cleaned. AC samples were visually checked
for recovery moisture and contamination. A cyclone was used and routinely
cleaned. 4m composites were speared to obtain the most representative

Criteria JORC Code explanation Commentary
sample possible for AC drilling.
DD drilling was undertaken and the core measured and orientated to
determine recovery, which was generally 100%. The diamond core has been
consistently sampled with the left hand side of the NQ hole sampled, while
for the HQ, the left hand side of the left hand half was sampled.
Sample recoveries are generally high. No significant sample loss was
recorded with a corresponding increase in gold present. Sample bias is not
anticipated, and no preferential loss/gain of grade material was noted.
Logging Whether core and chip samples have been geologically and geotechnically
logged to a level of detail to support appropriate Mineral Resource
estimation, mining studies and metallurgical studies.
Whether logging is qualitative or quantitative in nature. Core (or costean,
channel, etc) photography.
The total length and percentage of the relevant intersections logged.
Detailed logging exists for most historic holes in the data base.
Current RC and AC chips are geologically logged at 1m intervals and to
geological boundaries respectively. RC Resource hole chip trays and end of
hole chips from AC drilling have been stored for future reference.
Drill chips from GC RC drill holes are not retained, with exceptions being
retained to confirm lithological logging.
DD drill holes have all been geologically, structurally and geotechnically
logged. The diamond core was photographed tray-by-tray, both wet and
dry.
RC and AC chip logging recorded the lithology, oxidation state, colour,
alteration and veining.
All GCY drill holes were logged in full.
Sub-sampling
techniques
and sample
preparation
If core, whether cut or sawn and whether quarter, half or all core taken.
If non-core, whether riffled, tube sampled, rotary split, etc and whether
sampled wet or dry.
For all sample types, the nature, quality and appropriateness of the sample
preparation technique.
Quality control procedures adopted for all sub-sampling stages to
maximise representivity of samples.
Measures taken to ensure that the sampling is representative of the in-situ
material collected, including for instance results for field duplicate/second-
half sampling.
Diamond drilling completed by GCY was sawn as ½ core (for NQ) or ¼ core
(for HQ) and sampled. Previous companies have conducted diamond drilling
- it is unclear whether ½ core or ¼ core was taken by previous operators.
RC chips were riffle or cone split at the rig to produce a 2 - 4kg sample at 1m
intervals. AC samples were collected as 4m composites (unless otherwise
noted) using a spear of the drill spoil. Samples were generally dry. 1m AC
resamples are riffle split or speared.
At MinAnalytical the samples were analysed by either Fire Assay or from
mid-2018, by Photon Assay. Both techniques involve drying the sample. For
Fire Assay the sample is crushed and pulverised then assayed for gold using

Criteria JORC Code explanation Commentary
Whether sample sizes are appropriate to the grain size of the material
being sampled.
a 50g charge lead collection Fire Assay with AAS finish. For Photon Assay,
the sample is crushed to nominal 85% passing 2mm, linear split and a
nominal 500g sub sample taken (method code PAP3502R). The 500g sample
is assayed for gold by Photon Assay (method code PAAU2) along with quality
control samples including certified reference materials, blanks and sample
duplicates.
At the Dalgaranga Site Lab, samples were assayed using the PAL assaying
process. The PAL technique involves drying of the drill chips, followed by a
split to 250-500g of material, which is processed in the PAL1000 for 65
minutes; 100ml of solution is collected and centrifuged, 10ml aliquot is
collected and assayed for gold by AAS technique.
Field QAQC procedures call for the insertion of 1 in 25 certified reference
materials (CRM) ‘standards’ and 1 in 50 field duplicates for RC and AC drilling
and the insertion of “blank” samples. Diamond drilling has 1 in 25 CRMs
included.
Field duplicates were collected during RC and AC drilling. Further sampling
(lab umpire assays) is conducted if it is considered necessary.
A sample size of 2 - 5 kg was collected from the original RC sample of 20 –
40kg depending on material density. This size is considered appropriate and
representative of the material being sampled given the width and continuity
of the intersections, and the grain size of the material being collected, as an
industry standard.
Criteria JORC Code explanation Commentary
Quality of
assay data
and laboratory
tests
The nature, quality and appropriateness of the assaying and laboratory
procedures used and whether the technique is considered partial or total.
For geophysical tools, spectrometers, handheld XRF instruments, etc, the
parameters used in determining the analysis including instrument make
and model, reading times, calibrations factors applied and their derivation,
etc.
Nature of quality control procedures adopted (eg standards, blanks,
duplicates, external laboratory checks) and whether acceptable levels of
accuracy (ie lack of bias) and precision have been established.
All historical RC samples were analysed using a 25 or 50g charge Fire Assay
with an AAS finish which is an industry sample for gold analysis.
A 25g Aqua Regia digest with an MS finish has been used for AC samples.
Aqua Regia can digest many different mineral types including most oxides,
sulphides and carbonates but will not totally digest refractory or silicate
minerals. Historically the samples have been analysed by both Aqua Regia
digest and a leachwell process. Significant differences were recorded
between these analytical techniques.
The DD sampling was assayed using Fire Assay with a 50g charge and an AAS
finish. Additional quartz washes of the grinding mills are undertaken by the
lab, before and after samples which contain visible gold.
Photon Assay of RC grade control in 2018 and 2019 has utilised the same
QAQC protocols to ensure quality of the assays, the non-destructive nature
of the Photon Assay technique provides an alternative assay technique to
Fire Assay and is considered a partial technique due to the fact matrix
characteristics will alter the detection limits, this is not considered
significant at a grade control level.
The PAL assay method used at the Dalgaranga Site Lab is considered to be a
partial method, with gold extraction dependent on a leaching process.
No geophysical tools have been used at Gilbey’s.
No QAQC results are available for historical (pre-GCY) sampling.
GCY Field QAQC procedures include the insertion of both field duplicates
and standards, as well as ‘blank' samples. Laboratory QAQC involves the use
of internal certified reference materials, blanks, splits and replicates.
Analysis of the field duplicates shows that for the PAL and Photon assays,
there is a relatively low degree of repeatability, with the average CV being
at approximately 40%, which is at the limit of the ‘acceptable’ range of 20%
to 40%. The Fire Assay duplicate samples, although highly variable, fall
within the ‘acceptable’ range with an average CV of 37%.
No pulp duplicates were submitted by GCY, but the laboratory pulp

Criteria JORC Code explanation Commentary
duplicates for the Fire Assay and Photon methods at MinAnalytical both fail
the precision test, with average CV’s of 23% and 24%, respectively
(‘acceptable’ range is considered to be 10% to 20%).
The PAL and Photon assay standards pass the accuracy test, with no
significant bias being evident. However, both fail the precision test for
standards. The Fire Assay samples pass both the accuracy and precision
tests for standards.
The blank samples returned satisfactory results.
The actual insertion rates for duplicates and standards are considered to be
too low, while those for blanks are deemed to be satisfactory.
While precision appears to be a noteworthy issue for GC samples, the QAQC
results are believed to be sufficiently satisfactory to support the use of the
drill assay data for Mineral Resource estimation. Approximately 96% of the
tonnage and 95% pf the gold metal reported in this Mineral Resource is
informed by Resource Development (RDV) drilling analysed by Fire Assay,
which returned relatively good QAQC results.
Verification of
sampling and
assaying
The verification of significant intersections by either independent or
alternative company personnel.
The use of twinned holes.
Documentation of primary data, data entry procedures, data verification,
data storage (physical and electronic) protocols.
Discuss any adjustment to assay data.
No independent sampling has been undertaken by Cube.
Significant intersections were visually field verified by company geologists.
No twinned holes have been drilled to date - although GC drilling has
confirmed mineralisation thickness and tenor in oxide material below pallid
zone depletion.
Field data were collected using Field Marshal software on tablet computers
for pre-2018 drilling campaign, post January 2018 the Geobank Mobile
software was used to collect Geological logging data. The data pre-2018 was
sent to Mitchell River Group for validation and compilation into an SQL
database server, for post January 2018 the data was processed and
validated by in-house database administration and compiled into the SQL
database
Assay values that were below detection limit were adjusted to equal half of
the detection limit value, with a minimum floor value of 0.001g/t Au set in

Criteria JORC Code explanation Commentary
all such instances.
Unsampled intervals denoted by a large negative value were reset to null
values and were therefore ignored during estimation.
Null or missing assay intervals were examined on a case-by-case basis. Some
of these intervals cross known zones of mineralisation and in such instances
no action was taken (i.e., null retained). In cases where the surrounding
results and specific location supported the assumption that the assay
intervals were not sampled due to a decision taken by a geologist on the
lack of visible mineralisation, grade values of 0.001g/t Au were inserted.
Location of
data points
Accuracy and quality of surveys used to locate drill holes (collar and down-
hole surveys), trenches, mine workings and other locations used in Mineral
Resource estimation.
Specification of the grid system used.
Quality and adequacy of topographic control.
All drill hole collars were surveyed in the MGA94 Zone 50 grid.
Historical collars were surveyed to within +/- 1m.
GCY drill collars have been surveyed by DGPS equipment and mine site
Surveyors. A down hole survey was taken at least every 30m in RC holes by
electronic multi-shot tool by the drilling contractors. Gyro surveys have
been undertaken on selected holes to validate the multi shot surveys. GC
drill holes completed after August 2018, except for a few holes where
equipment was not available, were surveyed with a minimum of two
surveys per hole.
The hole collars and downhole survey azimuths were transformed to
Gilbey’s local grid for use in this mineral resource estimate.
An aerial topographic survey was flown in 2016. A 5m resolution was used
for Mineral Resource estimation and is considered appropriate. Monthly
DTM and orthophoto images are collected via drone photography providing
excellent ongoing control on topography.
Data spacing
and
distribution
Data spacing for reporting of Exploration Results.
Whether the data spacing and distribution is sufficient to establish the
degree of geological and grade continuity appropriate for the Mineral
Resource and Ore Reserve estimation procedure(s) and classifications
applied.
Whether sample compositing has been applied.
Initial exploration by GCY was targeting discrete areas that may host
mineralisation. Consequently Resource drilling pre-2018 was not grid based.
However, when viewed with historic data, the drill holes lie on existing grid
lines and within 25m - 100m of an existing hole.
RDV drilling in most of the Dalgaranga Project areas is nominally at a 25m –
40m spacing, but becomes less dense at depth.

Criteria JORC Code explanation Commentary
GC drilling has been to test areas of modelled resources and is generally at
a spacing of 10m x 7.5m.
The RDV drill spacing in unmined volumes is sufficiently dense in areas
where relatively long range mineralisation continuity has been
demonstrated, the best examples of this being the Main Porphyry Zone at
Gilbey’s (previously mined by Equigold) and at Sly Fox. Peripheral zones at
Gilbey’s, such as the Gilbey’s Eastern Cutback, Gilbey’s Far North, Gilbey’s
Starter Pit and Gilbey’s South areas, have been proven by GC drilling to be
much more discontinuous, and therefore difficult to model with high
confidence using RDV data only. However, the mineralised zones have
sufficient continuity in both geology and grade to be considered appropriate
for the Mineral Resource and Ore Reserve estimation procedures and
classification categories specified under the 2012 JORC Code.
Drill assay intervals were composited to 1m for the purpose of gold grade
estimation.
Orientation of
data in
relation to
geological
structure
Whether the orientation of sampling achieves unbiased sampling of
possible structures and the extent to which this is known, considering the
deposit type.
If the relationship between the drilling orientation and the orientation of
key mineralised structures is considered to have introduced a sampling
bias, this should be assessed and reported if material.
The majority of drill holes have a dip of -60° towards local grid east. one
program of 10m x 10m spaced holes in early 2018 tested an alternative
drilling direction of -60° towards local grid southeast, however the change
was not seen as an improvement and all subsequent drilling has been
towards local grid east at the Gilbey’s deposit and the Plymouth deposit,
where local grid north – south striking mineralisation predominates. For the
the east – west striking Sly Fox and Gilbey’s South deposits, holes are
appropriately oriented towards local grid south.
The vast majority of the drill holes used are thus considered to be oriented
near-optimally for intersection of gold mineralisation structures, ruling out
any material bias due to drill orientation.
Sample
security
The measures taken to ensure sample security. Chain of custody is managed by GCY. RC samples collected pre-2018 were
delivered daily to the Toll depot in Mt Magnet by GCY personnel. Toll
delivered the samples directly to the assay laboratory in Perth. In some
cases company personnel have delivered the samples directly to the

Criteria JORC Code explanation Commentary
laboratory. DD core was transported directly to Perth for cutting and
dispatch to the assay laboratory for analysis.
2018-2019 grade control samples and 2019 deep RC resource drilling
samples are collected immediately as drilled and stored in a designated area
at the Dalgaranga mine site administration office. They are stored in closed
bulk bags, numbered and ordered ready for transport. To ready the bulk
bags for transport they are strapped to pallets, limiting the chance to
tamper with sample bags during transport. The samples are sent once or
twice weekly directly to Minanalytical Laboratory via the company’s
preferred transport provider. Consignments are specific to GCY, thereby
limiting potential security issues.
Audits or
reviews
The results of any audits or reviews of sampling techniques and data. Data pre-2018 was validated by Mitchell River Group prior to loading into
the SQL database. Any errors within the data were returned to GCY for
validation. All data collection and sampling protocols are to an industry
standard and have passed independent technical review.
Section 2 Reporting of Exploration Results
(Criteria listed in the preceding section also apply to this section.)
Criteria JORC Code explanation Commentary
Mineral
tenement and
land tenure
status
Type, reference name/number, location and ownership including
agreements or material issues with third parties such as joint ventures,
partnerships, overriding royalties, native title interests, historical sites,
wilderness or national park and environmental settings.
The security of the tenure held at the time of reporting along with any
known impediments to obtaining a licence to operate in the area.
The Dalgaranga Gold Operation is situated on tenement number M59/749. GNT
(100% Gascoyne Resources - wholly owned subsidiary company) has a whole
100% interest in the tenement.
The tenement is in good standing and no known impediments exist.
Exploration
done by other
parties
Acknowledgment and appraisal of exploration by other parties. The tenement area has been previously explored by numerous companies
including BHP, Newcrest and Equigold. Mining was carried out by Equigold in a
JV with Western Reefs NL from 1996 – 2000.
Geology Deposit type, geological setting and style of mineralisation. Regionally, the Dalgaranga Gold Project lies within the Archean Dalgaranga
Greenstone Belt in the Murchison Province of Western Australia.
At the Gilbey’s deposit, most gold mineralisation is associated with shears
situated within biotite-sericite-carbonate pyrite altered schists with quartz-
carbonate veining within a porphyry-shale-mafic (dolerite, gabbro, basalt) rock
package (Gilbey’s Main Porphyry Zone and Sly Fox). The Gilbey’s Main Porphyry
Zone trends north – south and dips moderately-to-steeply to the west on local
grid while Sly Fox trends east – west and dips steeply to the north. These two
trends define the orientation of the limbs of an anticlinal structure, with a highly
disrupted area being evident in the hinge zone.
Lesser amounts of mineralisation outside of the porphyry-shale-mafic zones are
associated with highly discontinuous structures in the footwall and hangingwall
of the sheared porphyry-shale-mafic lithologies. The bulk of the GCY mining
from 2018 to date has been within these areas of lesser structural and
mineralisation continuity.

Criteria JORC Code explanation Commentary
Drill hole
Information
A summary of all information material to the understanding of the
exploration results including a tabulation of the following information for
all Material drill holes:
o easting and northing of the drill hole collar
o elevation or RL (Reduced Level – elevation above sea level in metres)
of the drill hole collar
o dip and azimuth of the hole
o down hole length and interception depth
o hole length.
If the exclusion of this information is justified on the basis that the
information is not Material and this exclusion does not detract from the
understanding of the report, the Competent Person should clearly explain
why this is the case.
All exploration results have previously been reported by GCY between 2013 and
2019.
All information has been included in the appendices. No drill hole information
has been excluded.
Data
aggregation
methods
In reporting Exploration Results, weighting averaging techniques,
maximum and/or minimum grade truncations (eg cutting of high grades)
and cut-off grades are usually Material and should be stated.
Where aggregate intercepts incorporate short lengths of high grade results
and longer lengths of low grade results, the procedure used for such
aggregation should be stated and some typical examples of such
aggregations should be shown in detail.
The assumptions used for any reporting of metal equivalent values should
be clearly stated.
Exploration results are not being reported.
Not applicable as a Mineral Resource is being reported.
Metal equivalent values have not been used.

Criteria JORC Code explanation Commentary
Relationship
between
mineralisation
widths and
intercept
lengths
These relationships are particularly important in the reporting of
Exploration Results.
If the geometry of the mineralisation with respect to the drill hole angle is
known, its nature should be reported.
If it is not known and only the down hole lengths are reported, there should
be a clear statement to this effect (eg ‘down hole length, true width not
known’).
Most drill holes are angled to local grid east for the Gilbey’s and Plymouth
deposits and grid south for the Sly Fox and Gilbey’s South deposits so that
intersections are orthogonal to the expected orientation of mineralisation. It is
interpreted that true width is approximately 70-100% of downhole
intersections.
Diagrams Appropriate maps and sections (with scales) and tabulations of intercepts
should be included for any significant discovery being reported These
should include, but not be limited to a plan view of drill hole collar locations
and appropriate sectional views.
Relevant diagrams have been included within the Mineral Resource report main
body of text.
Balanced
reporting
Where comprehensive reporting of all Exploration Results is not
practicable, representative reporting of both low and high grades and/or
widths should be practiced to avoid misleading reporting of Exploration
Results.
Exploration results are not being reported.
Other
substantive
exploration
data
Other exploration data, if meaningful and material, should be reported
including (but not limited to): geological observations; geophysical survey
results; geochemical survey results; bulk samples – size and method of
treatment; metallurgical test results; bulk density, groundwater,
geotechnical and rock characteristics; potential deleterious or
contaminating substances.
All interpretations for Gilbey’s mineralisation are consistent with observations
made and information gained during previous and current mining at the
Gilbey’s open pit.
Further work The nature and scale of planned further work (eg tests for lateral
extensions or depth extensions or large-scale step-out drilling).
Diagrams clearly highlighting the areas of possible extensions, including
the main geological interpretations and future drilling areas, provided this
information is not commercially sensitive.
Dalgaranga is at a mining stage. Infill drilling for mining grade control will be
completed during an ongoing grade control process.
Refer to diagrams in the body of text within the Mineral Resource report.

Section 3 Estimation and Reporting of Mineral Resources
(Criteria listed in section 1, and where relevant in section 2, also apply to this section.)
Criteria JORC Code explanation Commentary
Database
integrity
Measures taken to ensure that data has not been corrupted by, for
example, transcription or keying errors, between its initial collection and
its use for Mineral Resource estimation purposes.
Data validation procedures used.
For GCY drilling, geological and field data is collected using Field Marshall or
Geobank Mobile software on tablet computers. Historical drilling data has been
captured from historical drill logs.
The data is verified by company geologists before being sent either to Mitchell
River Group for validation or passing Geobank Software validation protocols for
further review by staff Geologists and compilation into a SQL database server.
Historic data has been verified by checking historical reports on the project.
The data is verified by company geologists before the data is sent to Mitchell
River Group (pre 2018) for further validation and compilation into a SQL
database server. Historic data has been verified by checking historical reports
on the project. Current data is verified by company geologists into present SQL
database
Cube has undertaken a number of validation checks on the database, which
include, but are not limited to, checks for overlapping intervals, checks for
missing data/records, visual checks on drill hole traces to identify any possible
survey issues, checks for out of range values and checks of survey, assay and
geology table depths relative to the recorded maximum depth of drilling. No
major issues were detected.
All drill types, including RAB, Trench and AC sample types, were utilised for
mineralisation domain modelling. However, the RAB, Trench and AC samples
were considered invalid for gold grade estimation/interpolation (insufficient
sample quality) and so were excluded from these processes. The predominant
drill type used for estimation is RC, with a minor number of available DD
samples being available for use.
Site visits Comment on any site visits undertaken by the Competent Person and the
outcome of those visits.
If no site visits have been undertaken indicate why this is the case.
One of the Competent Persons for this resource estimate (Michael Job) visited
site on a regular basis between January and April 2019.

Criteria JORC Code explanation Commentary
Geological
interpretation
Confidence in (or conversely, the uncertainty of) the geological
interpretation of the mineral deposit.
Nature of the data used and of any assumptions made.
The effect, if any, of alternative interpretations on Mineral Resource
estimation.
The use of geology in guiding and controlling Mineral Resource
estimation.
The factors affecting continuity both of grade and geology.
The confidence in the geological interpretation is considered to be variable.
Within the Gilbey’s Main Porphyry Zone and at Sly Fox, the confidence is high,
being based on previous mining history and visual confirmation in outcrop and
within the Gilbey’s and Sly Fox open pits. Confidence in areas peripheral to the
porphyry-shale-mafic packages is lower, given the discontinuous nature of the
geological structures and mineralisation, allied with a high degree of
weathering in the relatively shallow cutbacks mined by GCY to date, which
limits the usefulness of visual outcrop observations.
Geochemistry and geological logging has been used to assist identification of
lithology and mineralisation. Outcrops of mineralisation and host rocks within
the open pits have assisted with definition of the geometry of the
mineralisation.
Alternative interpretations of the mineralisation, particularly in the peripheral
discontinuous zones, have been shown to have a significant impact on the
Mineral Resource estimation. The assumptions of continuity need to be
identified and carefully considered in such areas, in order to avoid
misrepresenting the mineralised volume and continuity. The identification of
the orientation component of the mineralisation geometry does not present as
large a risk and is better understood.
The porphyry-shale-mafic zones are clearly more favourable for the
development of relatively continuous mineralisation, while peripheral areas are
less favourable. This knowledge has been considered during the modelling work
for the Mineral Resource estimate.
Grade control drilling has confirmed overall geological continuity. It has also
highlighted areas of poor grade continuity due to near surface depletion and
less favourable geological factors. Grade continuity appears to be increasing at
depth, even in more erratic peripheral areas, with decreased weathering.
Dimensions The extent and variability of the Mineral Resource expressed as length
(along strike or otherwise), plan width, and depth below surface to the
upper and lower limits of the Mineral Resource.
The Gilbey’s Mineral Resource has an overall local grid north-south strike length
of approximately 2,000m. The overall mineralised width of Gilbey’s varies but
for the majority is approximately 800m wide. The elevation extent of Gilbey’s
is from -100mRL to 450mRL (i.e. to roughly 550m below surface).
The Plymouth Mineral Resource has an overall local grid north-south strike
length of approximately 350m. The average mineralised width is approximately
150m. The elevation extent of Plymouth is from 300mRL to 450mRL (i.e. to

Criteria JORC Code explanation Commentary
roughly 150m below surface).
The Sly Fox Mineral Resource has an overall local grid east-west strike length of
approximately 600m. The average mineralised width is approximately 150m.
The elevation extent of Sly Fox is from 200mRL to 450mRL (i.e. to roughly 250m
below surface).
Estimation and
modelling
techniques
The nature and appropriateness of the estimation technique(s) applied
and key assumptions, including treatment of extreme grade values,
domaining, interpolation parameters and maximum distance of
extrapolation from data points. If a computer assisted estimation method
was chosen include a description of computer software and parameters
used.
The availability of check estimates, previous estimates and/or mine
production records and whether the Mineral Resource estimate takes
appropriate account of such data.
The assumptions made regarding recovery of by-products.
Estimation of deleterious elements or other non-grade variables of
economic significance (eg sulphur for acid mine drainage
characterisation).
In the case of block model interpolation, the block size in relation to the
average sample spacing and the search employed.
Any assumptions behind modelling of selective mining units.
Any assumptions about correlation between variables.
Description of how the geological interpretation was used to control the
resource estimates.
Discussion of basis for using or not using grade cutting or capping.
The process of validation, the checking process used, the comparison of
model data to drill hole data, and use of reconciliation data if available.
Two estimation/interpolation approaches were used for gold grade.
The first method used was Localised Uniform Conditioning (LUC), which is a
non-linear method developed specifically for the estimation of the grade
distribution for blocks that are small relative to the available data spacing (i.e.
Selective Mining Unit [SMU} sized blocks). LUC is able to produce SMU scale
block grade estimates that are not over-smoothed. Over-smoothing is a
problem that has long been recognised when using standard linear methods
such as Ordinary Kriging (OK) for positively skewed and highly variable gold
grade distributions, where the data spacing is relatively wide. The Dalgaranga
gold grade distributions are universally positively skewed and highly variable.
The second method used was OK, but only in the volume covered by modern
GCY GC drilling (10m x 7.5m spacing). The use of a linear estimate in areas
informed by such dense data is considered to be appropriate.
Eleven broad mineralisation domains were interpreted for LUC gold
interpolation using Surpac 6.7.1 software. An additional mineralised waste
‘halo’ domain was also defined surrounding the eleven domains, out to the limit
of drilling, in order to provide a representation of gold grade for future
exploration and infill drill targeting purposes.
Three LUC domains were defined on the north- south limb of the anticline,
corresponding roughly to the porphyry-shale-mafic lithological zone (Domain
codes 101, 102 and 103). Domain 101 represents the Main Porphyry Zone, and
encapsulates the most continuous and voluminous mineralisation. Domain 102
is to the north of Domain 101 and represents a less continuous zone of
mineralisation that has been displaced to the west by a cross-cutting fault.
Domain 103 is south of Domain 101, and encapsulates a near-surface zone of
mineralisation that is situated close to the fold hinge zone. These domains were
the primary target of historical Equigold mining. Domain 102 has been partially
mined by GCY in the Gilbey’s North cutback.
LUC Domains 201 and 202 represent a relatively narrow band of westerly
Criteria JORC Code explanation Commentary
dipping mineralisation in the hangingwall (i.e. to the west) of the Main Porphyry
Zone. This structure is oblique to Domain 101 and gradually approaches Domain
101 to the north, where it eventually merges with the Main Porphyry Zone
mineralisation.
LUC Domains 401 and 402 represent north – south striking diffuse and
discontinuous mineralisation in the footwall (i.e. to the east) of the Main
Porphyry Zone. These domains have recently been mined by GCY in the Gilbey’s
Eastern cutback.
LUC Domains 501 and 502 are situated at the far southern end of the project
area, and encompass erratic and discontinuous mineralisation situated within
the east – west striking limb of the anticline to the immediate south of the Main
Porphyry Zone. These domains have recently been mined by GCY in the stand-
alone Gilbey’s South pit.
LUC Domain 601 represents the Plymouth deposit, which is situated at the
western end of Sly Fox, but strikes north – south, and appears to be a southern
extension to the Domain 401 and 402 footwall mineralisation. Plymouth is also
characterised by erratic and discontinuous gold mineralisation and has not
been mined to date.
LUC Domain 701 represents the Sly Fox mineralisation envelope, which strikes
east – west on local grid.
The mineralised waste ‘halo’ LUC domain has been designated Domain 900.
In addition to the aforementioned geological associations, the LUC domain
boundaries were designed so as to capture very broadly the main
mineralisation trends and settings. A very high tolerance for incorporation of
internal waste was therefore applied. Where possible, a nominal grade cut-off
of 0.2g/t Au was employed, but, especially in the more erratic peripheral zones,
the boundaries were often defined at a lower grade, in order to ensure that all
the potential mineralisation was captured in a sensibly continuous shape, while
at the same time ensuring that the relatively depleted near-surface pallid zone
was excluded (unless assay data showed otherwise) and while limiting the
extrapolation of volume beyond the available drill data. This approach stands
in contrast to the previous Mineral Resource estimate, which attempted to
define much narrower zones of mineralisation at a higher 0.5g/t Au nominal
cut-off grade. The number of estimation domains used in the current Mineral

Criteria JORC Code explanation Commentary
Resource estimate is thus much reduced from the previous work.
The domains for OK estimation in the GC volume were defined using implicit
modelling (Leapfrog software). These GC areas include the Gilbey’s Eastern
cutback, Gilbey’s North, Gilbey’s South, Sly Fox and Gilbey’s Starter Pit, the
latter being situated between the Main Porphyry Zone and Gilbey’s South. An
indicator variable defined at a threshold of 0.2g/t Au was modelled by the
implicit method. This approach resulted in multiple volume solids being
defined, especially in the areas where mineralisation is erratic and
discontinuous. The OK GC domains therefore differ from the LUC domains in
that they largely reject the internal waste that was captured within the LUC
domains.
Gold grade composites were produced to equalise sample support using the
‘best-fit’ method in Surpac 6.7.1, with a target length of 1m.
Gold grade caps were selected per domain, with due consideration given to the
robustness of the upper tail of the gold distribution and the spatial continuity
within the domain.
LUC estimation was undertaken using an initial ‘Panel’ block size of 15mE x
15mN x 5mRL (local grid). The E and N dimension were chosen based on a
nominal RDV drill spacing of between 25m and 30m in most areas. The vertical
Panel dimension was set at double the current flitch height of 2.5mRL, and is
supported by the dense 1m composite data in the downhole direction. The
ultimate SMU estimation block size for the LUC was set at 5mE x 5mN x 2.5mRL,
in order to reflect the current view on practical mining selectivity, with the
vertical dimension matched to the flitch height. Equal E and N dimensions were
selected for the blocks since the block model represents a mix of north – south
and east – west striking ore bodies on the local grid.
The master Surpac block model was designed with a 5mE x 5mN x 2.5mRL
parent block size, with allowance for sub-blocks down to 2.5mE x 2.5mN x
1.25mRL for accurate volume definition.
Gold grade variogram models were undertaken for all LUC and OK GC domains
by transforming the composite data to Gaussian space, modelling a Gaussian
variogram, and then back-transforming the Gaussian models to real space for
use in interpolation. This transformation method de-skews the gold data and
thereby enhances the detection of the true underlying spatial structure. All
Criteria JORC Code explanation Commentary
available valid RDV and GC composites were used for variography, thus
ensuring the best possible definition at short ranges. The gold variogram
models clearly show that the Porphyry Main Zone and Sly Fox have significantly
greater ranges of continuity than the more erratic peripheral zones.
LUC estimation was undertaken initially using just RDV data as input. During a
series of trial LUC runs, it was realised that the use of standard capping and
search parameters was unable to account for the reduced grade observed in
some of the more erratic and discontinuously mineralised areas once GC drilling
was undertaken. The RDV data only LUC runs were therefore compared to the
OK GC models within the various GC volumes, which cover most of the areas in
question. Distance limiting above a specified grade threshold was applied to the
Panel estimate in the LUC workflow, in order to inhibit the propagation of high
grade composites in the estimation. The distance limiting thresholds were
picked by identifying inflexions in the gold grade distribution and distance limits
were based largely on the practical range of the relevant gold grade variograms.
The practical range is defined as being the distance at which the variogram
reaches between 80% and 90% of the sill value. The distance limiting
parameters are believed to reflect the reality that some parts of the Dalgaranga
Project are characterised by high grade continuity that is significantly less that
the RDV drill spacing. This exercise thus serves the important purpose of
‘calibrating’ the forward-looking part of the Mineral Resource model, which is
informed primarily by relatively wide spaced RDV data, by reference to the
densely sampled GC volume. The distance limiting parameters defined by this
exercise were utilised in the final LUC runs, which used all available valid data
(i.e. RDV + GC).
LUC estimation commenced with the large Panel block estimates, which is
undertaken using OK. This was followed by a Change of Support (CoS) step,
which uses the composite gold grade distribution and variogram model to
define a gold grade distribution at the SMU block scale. An Information Effect
correction, which accounts for the imperfect predictions that dense GC data will
produce, was modelled as part of the CoS, assuming a GC drill spacing of 8mX x
10mY x 1mRL. Uniform Conditioning (UC) was then undertaken to produce a
model of the SMU block grade, tonnage and metal distribution within each
Panel, which is conditioned to the Panel grade. The resulting array variables for

Criteria JORC Code explanation Commentary
a range of cut-off grades is stored in the Panel block model. Finally, LUC is
undertaken whereby the UC SMU block grade distribution stored in the Panel
model is devolved to the SMU block model via a discretization post-processing
procedure, thus resulting in a single grade value per SMU block.
Search radius parameters for the LUC process were based on the anisotropy
evident in the variograms, and by visual inspection of the pattern of informing
composite selection. Discoidal shaped searches were used throughout, with
major and semi-major axes radii being equal to each other and four times
longer than the minor axis search radius. Anisotropic composite selection was
activated, whereby the distance to a sample is considered to be a proportion of
the distance to the ellipsoid surface. In addition, four quadrants were used in
the search, with a maximum limit set for the number of allowable composites
for each quadrant, in order to limit the number of samples selected from a
single hole. Minimum (8) and maximum (24) numbers of allowable samples
were selected based on Quantitative Kriging Neighbourhood Analysis. The use
and method of selection of distance limiting parameters for some domains has
already been discussed above. Only a single estimation pass was implemented
to avoid the production of artefacts at pass boundaries, which are undesirable,
especially for non-linear estimation, where the effect of such artefacts can be
amplified during the CoS step.
OK GC estimation was undertaken using only composites falling within the
0.2g/t implicitly generated wireframes. The estimation block size used was the
chosen SMU size of 5mE x 5mN x 2.5mRL, with any SMU block having at least
one sub-block falling within the wireframes being tagged for estimation. The
resulting estimates were devolved to sub-block level, and any blocks falling
outside of the wireframes were assigned a background grade of 0.001g/t Au.
The sub-block grades were then re-blocked back to the 5m x 5m x 2.5m SMU
block size. The final OK GC estimates thus incorporate dilution at the edges of
the 0.2g/t Au domains.
Search radius parameters for the OK GC process were based on the anisotropy
evident in the variograms, and by visual inspection of the pattern of informing
composite selection. Discoidal shaped searches were used throughout, with
major and semi-major axes radii being equal to each other and four times
longer than the minor axis search radius. Anisotropic composite selection was

Criteria JORC Code explanation Commentary
activated, whereby the distance to a sample is considered to be a proportion of
the distance to the ellipsoid surface. In addition, four quadrants were used in
the search, with a maximum limit set for the number of allowable composites
for each quadrant, in order to limit the number of samples selected from a
single hole. A minimum of 2 and maximum of 8 samples were allowed for
estimation. No distance limiting parameters were applied.
In the case of both the LUC and OK GC estimation, locally varying rotations were
used for both the variogram model and search neighbourhood. These were
based on interpreted surfaces that reflect the plane of maximum continuity of
the gold mineralisation within each domain. The major and semi-major axes of
the variograms and searches were thus oriented parallel to situated within
these planes.
The OK GC model was stamped over the LUC model in the various GC volumes
defined by the extents of the modern Gascoyne GC drilling.
Isatis v2018 was used to undertake the LUC and OK GC estimation, with the
results being imported into the master Surpac block model.
No variables other than gold grade were interpolated.
The gold model was validated by comparison of global composite means and
block estimate means. Swath plots by northing and elevation slice were
generated to compare composite grades to estimated block grades at the semi-
local scale. In those areas where distance limiting was applied during
interpolation, the global and semi-local checks reveal that the mean estimated
gold grade is somewhat lower than the composite means, as would be
expected, but the estimated grade fluctuations are observed to mirror those of
the input composites. Agreement between composites and block estimates was
generally observed to be good. Visual checks of the block estimates against the
raw assay data were undertaken, with good local agreement being observed. A
check Inverse Distance Squared estimate, with distance limiting parameters
identical to those used in the LUC process, was also compared and agreed well
with the primary estimates.
Wherever feasible, the estimated Mineral Resource was compared to mining
and production data. The production data from the Equigold mining period are
considered to be the most definitive, since they involve little or no mixing of
sources. A nominal 0.7g/t Au cut-off was used during the Equigold mining with

Criteria JORC Code explanation Commentary
actual total production from the historical pit reported as 4.39Mt at 1.54g/t Au
for 217.8koz Au. The Mineral Resource was reported within the historical
Equigold pit volume, predicting 4.12Mt at 1.54g/t Au for 203.9koz Au. The
tonnes and gold metal therefore agree to within a margin of approximately 6%.
The production data were also compared to the Mineral Resource model on a
10m elevation slice basis and, with a few exceptions, the agreement is observed
to be close. The Equigold pit primarily targeted the Gilbey’s Main Porphyry
Zone, represented largely by Domain 101 in this Mineral Resource estimate.
Since May 2019, GCY has made significant changes to its grade control
practices, both in terms of the grade control modelling process and the design
of dig blocks based on the GC model. This has resulted in the definition of
broader dig blocks than before. The OK GC portion of the Mineral Resource
model was produced using similar methods and parameters to the current GC
practice. Reconciliation data from May and June 2019 have shown a significant
improvement on a mill-to-mine basis, with a previous shortfall of generally over
30% in gold ounces narrowing to less than 10% in May 2019 and then to within
1% in June 2019. The Mineral Resource has, in peripheral areas, been calibrated
to the GC model, upon which much of the mine figures are based.
Moisture Whether the tonnages are estimated on a dry basis or with natural
moisture, and the method of determination of the moisture content.
Density and tonnage was estimated on a dry in situ basis.
Cut-off
parameters
The basis of the adopted cut-off grade(s) or quality parameters applied. A cut-off grade of 0.3g/t Au was used for reporting the Mineral Resource, based
on the latest economic analysis of the Dalgaranga Project.
Mining factors
or assumptions
Assumptions made regarding possible mining methods, minimum mining
dimensions and internal (or, if applicable, external) mining dilution. It is
always necessary as part of the process of determining reasonable
prospects for eventual economic extraction to consider potential mining
methods, but the assumptions made regarding mining methods and
parameters when estimating Mineral Resources may not always be
rigorous. Where this is the case, this should be reported with an
explanation of the basis of the mining assumptions made.
Open pit mining is currently underway at Dalgaranga. The existing LOM plan
calls for the continuation of open pit mining to access and extract a large
portion of the more continuous Gilbey’s Main Porphyry Zone.
The LUC portion of the model, is considered to account for all mining dilution
due to incorporation of all data in a broad envelope for the base estimation
processes. The OK GC portion is considered to partially account for dilution due
to the re-blocking undertaken as part of the estimation process.
Metallurgical
factors or
assumptions
The basis for assumptions or predictions regarding metallurgical
amenability. It is always necessary as part of the process of determining
reasonable prospects for eventual economic extraction to consider
potential metallurgical methods, but the assumptions regarding
Year to date Mill Production Sampling has shown that gold recovery is currently
averaging 89%.
Black (carbonaceous) shales occurring within the mineralised sequence are
known to result in lower recoveries. The black shales have been modelled using

Criteria JORC Code explanation Commentary
metallurgical treatment processes and parameters made when reporting
Mineral Resources may not always be rigorous. Where this is the case, this
should be reported with an explanation of the basis of the metallurgical
assumptions made.
implicit methods (Leapfrog) and were flagged into the block model. A gold
recovery of 73% is currently in use, which is at the lower end of metallurgical
test work that was undertaken on black shale material.
Environmental
factors or
assumptions
Assumptions made regarding possible waste and process residue disposal
options. It is always necessary as part of the process of determining
reasonable prospects for eventual economic extraction to consider the
potential environmental impacts of the mining and processing operation.
While at this stage the determination of potential environmental impacts,
particularly for a greenfields project, may not always be well advanced,
the status of early consideration of these potential environmental impacts
should be reported. Where these aspects have not been considered this
should be reported with an explanation of the environmental assumptions
made.
No assumptions were made regarding environmental restrictions.
Bulk density Whether assumed or determined. If assumed, the basis for the
assumptions. If determined, the method used, whether wet or dry, the
frequency of the measurements, the nature, size and representativeness
of the samples.
The bulk density for bulk material must have been measured by methods
that adequately account for void spaces (vugs, porosity, etc), moisture and
differences between rock and alteration zones within the deposit.
Discuss assumptions for bulk density estimates used in the evaluation
process of the different materials.
There are 27 density measurements collected during historical drilling
programs at Gilbey’s. GCY have recorded an additional 312 measurements from
the fresh zone.
Density is measured using the water immersion technique. Moisture is
accounted for in the measuring process and measurements were separated for
lithology, mineralisation and weathering.
It is assumed there are minimal void spaces in the rocks within the Gilbey’s
deposit. Values applied in the Gilbey’s block model are similar to other known
bulk densities from similar geological terrains.
Classification The basis for the classification of the Mineral Resources into varying
confidence categories.
Whether appropriate account has been taken of all relevant factors (ie
relative confidence in tonnage/grade estimations, reliability of input data,
confidence in continuity of geology and metal values, quality, quantity and
distribution of the data).
Whether the result appropriately reflects the Competent Person’s view of
the deposit.
The Mineral Resource estimate is reported here in compliance with the 2012
Edition of the 'Australasian Code for Reporting of Exploration Results, Mineral
Resources and Ore Reserves' by the Joint Ore Reserves Committee (JORC).
The Mineral Resource was classified as Measured, Indicated and Inferred
Mineral Resource based on data quality, sample spacing, geological
understanding of mineralisation controls and geological/mineralisation
continuity.
At the Gilbey’s Main Porphyry Zone (Domain 101), the Measured Mineral
Resource was defined within areas of grade control drilling. The Indicated
Mineral Resource was defined within areas of close spaced diamond and RC
drilling of less than 40m x 40m, and where the continuity and predictability of
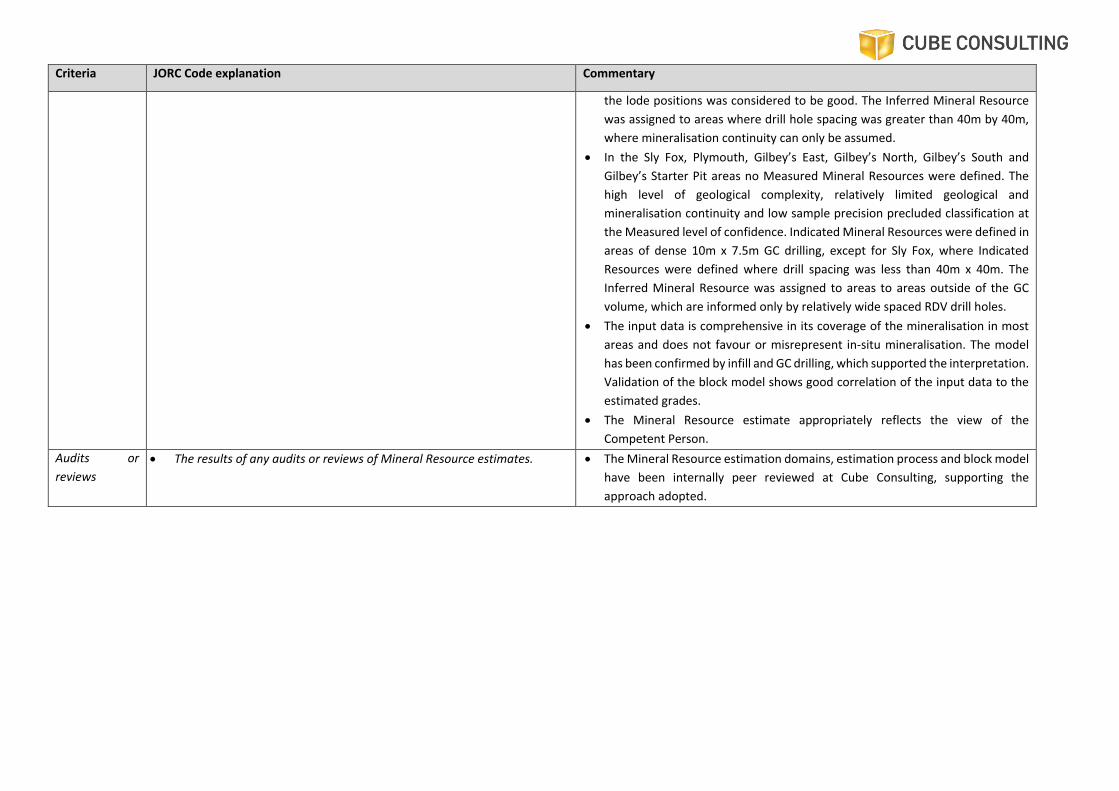
Criteria JORC Code explanation Commentary
the lode positions was considered to be good. The Inferred Mineral Resource
was assigned to areas where drill hole spacing was greater than 40m by 40m,
where mineralisation continuity can only be assumed.
In the Sly Fox, Plymouth, Gilbey’s East, Gilbey’s North, Gilbey’s South and
Gilbey’s Starter Pit areas no Measured Mineral Resources were defined. The
high level of geological complexity, relatively limited geological and
mineralisation continuity and low sample precision precluded classification at
the Measured level of confidence. Indicated Mineral Resources were defined in
areas of dense 10m x 7.5m GC drilling, except for Sly Fox, where Indicated
Resources were defined where drill spacing was less than 40m x 40m. The
Inferred Mineral Resource was assigned to areas to areas outside of the GC
volume, which are informed only by relatively wide spaced RDV drill holes.
The input data is comprehensive in its coverage of the mineralisation in most
areas and does not favour or misrepresent in-situ mineralisation. The model
has been confirmed by infill and GC drilling, which supported the interpretation.
Validation of the block model shows good correlation of the input data to the
estimated grades.
The Mineral Resource estimate appropriately reflects the view of the
Competent Person.
Audits or
reviews
The results of any audits or reviews of Mineral Resource estimates. The Mineral Resource estimation domains, estimation process and block model
have been internally peer reviewed at Cube Consulting, supporting the
approach adopted.

Criteria JORC Code explanation Commentary
Discussion of
relative
accuracy/
confidence
Where appropriate a statement of the relative accuracy and confidence
level in the Mineral Resource estimate using an approach or procedure
deemed appropriate by the Competent Person. For example, the
application of statistical or geostatistical procedures to quantify the
relative accuracy of the resource within stated confidence limits, or, if such
an approach is not deemed appropriate, a qualitative discussion of the
factors that could affect the relative accuracy and confidence of the
estimate.
The statement should specify whether it relates to global or local
estimates, and, if local, state the relevant tonnages, which should be
relevant to technical and economic evaluation. Documentation should
include assumptions made and the procedures used.
These statements of relative accuracy and confidence of the estimate
should be compared with production data, where available.
The reported Mineral Resources constitute a local resource estimate. All
Measured and Indicated Mineral Resources would be available for economic
evaluation.
Production data and reconciliation undertaken between mining and Mineral
Resources indicate a good comparison with the estimate.
Appendix 4: JORC Table 1 for Golden Wings Deposits
Dalgaranga Gold Project – Table 1 (JORC Code, 2012)
Section 1 Sampling Techniques and Data
(Criteria in this section apply to all succeeding sections.)

Criteria JORC Code explanation Commentary
Sampling
techniques
Nature and quality of sampling (eg cut
channels, random chips, or specific
specialised industry standard
measurement tools appropriate to the
minerals under investigation, such as down
hole gamma sondes, or handheld XRF
instruments, etc). These examples should
not be taken as limiting the broad meaning
of sampling.
Include reference to measures taken to
ensure sample representivity and the
appropriate calibration of any
measurement tools or systems used.
Aspects of the determination of
mineralisation that are Material to the
Public Report.
In cases where ‘industry standard’ work
has been done this would be relatively
simple (eg ‘reverse circulation drilling was
used to obtain 1 m samples from which 3
kg was pulverised to produce a 30 g charge
for fire assay’). In other cases more
explanation may be required, such as
where there is coarse gold that has
inherent sampling problems. Unusual
commodities or mineralisation types (eg
submarine nodules) may warrant
disclosure of detailed information.
Reverse circulation drilling for both grade control
(10m sections by 5m on-section spacing) and
resource definition (20-25m sections by 25m on-
section spacing) drilled at a nominal 60 to the
south. Historical drilling from pre-GNT owners is
routinely updated by grade control sampling.
Standard 1.0m RC sampling using an in-circuit cone
splitter to produce nominal 3kg sample mass.
Sample mass reduced to 500g by riffle splitting and
analysed by PhotonAssay (gamma activation analysis
of GAA)

Criteria JORC Code explanation Commentary
Drilling
techniques
Drill type (eg core, reverse circulation,
open-hole hammer, rotary air blast, auger,
Bangka, sonic, etc) and details (eg core
diameter, triple or standard tube, depth of
diamond tails, face-sampling bit or other
type, whether core is oriented and if so, by
what method, etc).
Reverse circulation drilling, 5½” face sampling bit.
Diamond drilling as diamond tails to RC at HQ/NQ
diameter

Criteria JORC Code explanation Commentary
Drill sample recovery Method of recording and assessing core and chip
sample recoveries and results assessed.
Measures taken to maximise sample recovery and
ensure representative nature of the samples.
Whether a relationship exists between sample recovery
and grade and whether sample bias may have occurred
due to preferential loss/gain of fine/coarse material.
Visual assessment of RC recovery. Very little sample loss
was noted during drilling.
RC samples visually checked for moisture and
contamination with routine drilling audits/reviews to
monitor performance
Field duplicates collected via dual port cone splitter and
used to monitor sampling precision. No sampling bias
was detected.
Logging Whether core and chip samples have been geologically
and geotechnically logged to a level of detail to support
appropriate Mineral Resource estimation, mining
studies and metallurgical studies.
Whether logging is qualitative or quantitative in nature.
Core (or costean, channel, etc) photography.
The total length and percentage of the relevant
intersections logged.
RC chips logged (1.0m intervals) for lithology, oxidation,
colour, alteration and veining. RC chip trays stored for
future reference.
Logging data collected electronically and transferred to
centralized database with in-process validation of
logging codes.
All drill holes logged in full.
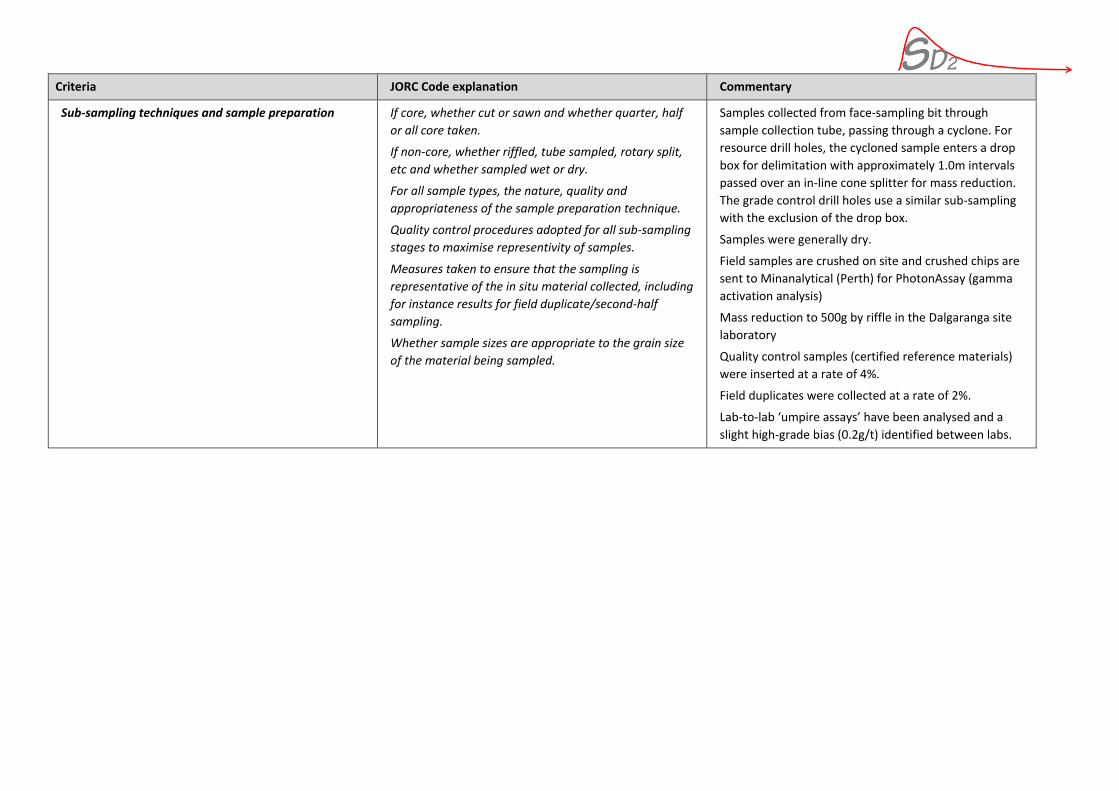
Criteria JORC Code explanation Commentary
Sub-sampling techniques and sample preparation If core, whether cut or sawn and whether quarter, half
or all core taken.
If non-core, whether riffled, tube sampled, rotary split,
etc and whether sampled wet or dry.
For all sample types, the nature, quality and
appropriateness of the sample preparation technique.
Quality control procedures adopted for all sub-sampling
stages to maximise representivity of samples.
Measures taken to ensure that the sampling is
representative of the in situ material collected, including
for instance results for field duplicate/second-half
sampling.
Whether sample sizes are appropriate to the grain size
of the material being sampled.
Samples collected from face-sampling bit through
sample collection tube, passing through a cyclone. For
resource drill holes, the cycloned sample enters a drop
box for delimitation with approximately 1.0m intervals
passed over an in-line cone splitter for mass reduction.
The grade control drill holes use a similar sub-sampling
with the exclusion of the drop box.
Samples were generally dry.
Field samples are crushed on site and crushed chips are
sent to Minanalytical (Perth) for PhotonAssay (gamma
activation analysis)
Mass reduction to 500g by riffle in the Dalgaranga site
laboratory
Quality control samples (certified reference materials)
were inserted at a rate of 4%.
Field duplicates were collected at a rate of 2%.
Lab-to-lab ‘umpire assays’ have been analysed and a
slight high-grade bias (0.2g/t) identified between labs.
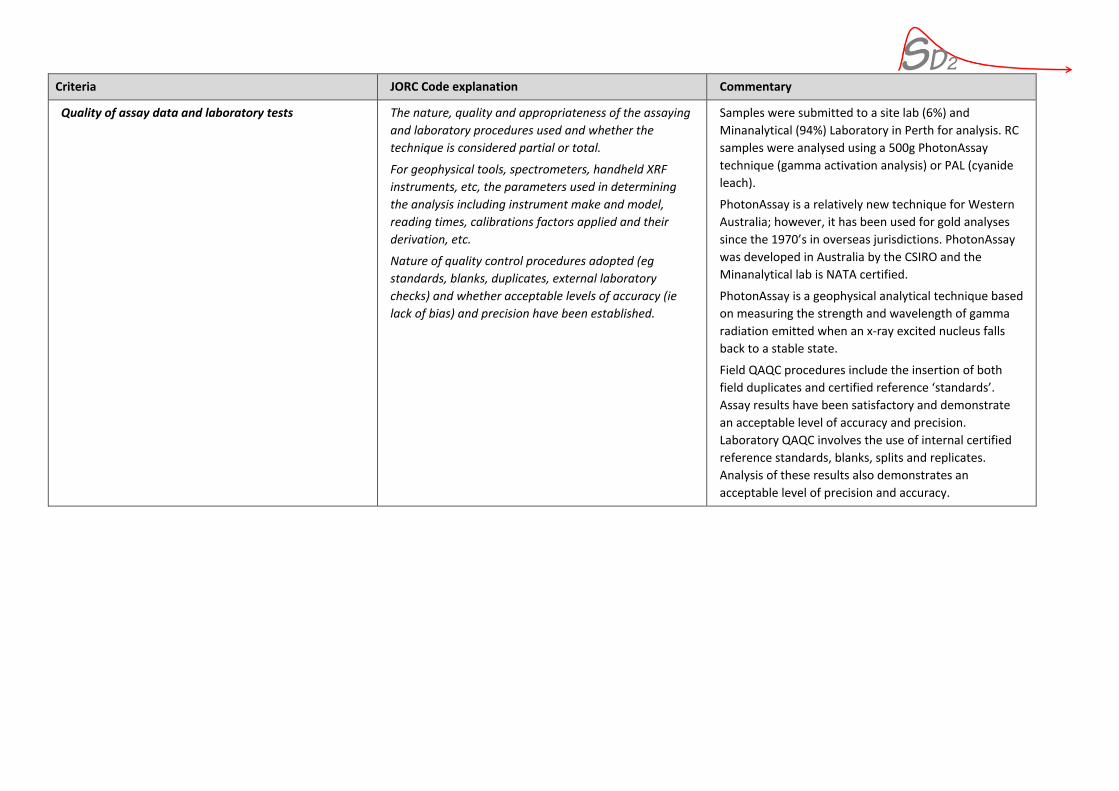
Criteria JORC Code explanation Commentary
Quality of assay data and laboratory tests The nature, quality and appropriateness of the assaying
and laboratory procedures used and whether the
technique is considered partial or total.
For geophysical tools, spectrometers, handheld XRF
instruments, etc, the parameters used in determining
the analysis including instrument make and model,
reading times, calibrations factors applied and their
derivation, etc.
Nature of quality control procedures adopted (eg
standards, blanks, duplicates, external laboratory
checks) and whether acceptable levels of accuracy (ie
lack of bias) and precision have been established.
Samples were submitted to a site lab (6%) and
Minanalytical (94%) Laboratory in Perth for analysis. RC
samples were analysed using a 500g PhotonAssay
technique (gamma activation analysis) or PAL (cyanide
leach).
PhotonAssay is a relatively new technique for Western
Australia; however, it has been used for gold analyses
since the 1970’s in overseas jurisdictions. PhotonAssay
was developed in Australia by the CSIRO and the
Minanalytical lab is NATA certified.
PhotonAssay is a geophysical analytical technique based
on measuring the strength and wavelength of gamma
radiation emitted when an x-ray excited nucleus falls
back to a stable state.
Field QAQC procedures include the insertion of both
field duplicates and certified reference ‘standards’.
Assay results have been satisfactory and demonstrate
an acceptable level of accuracy and precision.
Laboratory QAQC involves the use of internal certified
reference standards, blanks, splits and replicates.
Analysis of these results also demonstrates an
acceptable level of precision and accuracy.

Criteria JORC Code explanation Commentary
Verification of sampling and assaying The verification of significant intersections by either
independent or alternative company personnel.
The use of twinned holes.
Documentation of primary data, data entry procedures,
data verification, data storage (physical and electronic)
protocols.
Discuss any adjustment to assay data.
Significant intersections were visually field verified by
company geologists.
Some hole twinning has occurred during routine grade
control drilling. Where there are differences between
historical drill hole results and grade control results the
historical data has been excluded from the estimate.
Q-Q analysis was completed by comparing historical
assays with GNT assays. The results indicate that there
is no significant bias present.
No factors or adjustments were made to the assay data.
Assay data is supplied by the site lab and Minanalytical
in and electronic format and uploaded directly into
GNT’s geological database. The upload process includes
review and approval to minimize the risk of invalid
results.
Location of data points Accuracy and quality of surveys used to locate drill holes
(collar and down-hole surveys), trenches, mine workings
and other locations used in Mineral Resource
estimation.
Specification of the grid system used.
Quality and adequacy of topographic control.
All drill hole collars were surveyed in the MGA94 Zone
50 grid. Historical collars were surveyed to within +/-
1m. GCY drill collars have been surveyed by DGPS
equipment.
Holes drilled prior to September 2016 were surveyed
with an electronic multishot system at 30m intervals.
Post September 2016 a gyroscopic survey tool was used
to collect 30m down-hole surveys with a final
measurement approximately 3m from the hole collar.
Some early grade control holes were not surveyed and
have assumed dip/azimuth. These holes are in mined
out portions of the deposit.
Routine (monthly) aerial topographic surveys are
completed as part of monitoring mining activities.
Surveys are processed and certified by a licensed mine
surveyor.

Criteria JORC Code explanation Commentary
Data spacing and distribution Data spacing for reporting of Exploration Results.
Whether the data spacing and distribution is sufficient
to establish the degree of geological and grade
continuity appropriate for the Mineral Resource and Ore
Reserve estimation procedure(s) and classifications
applied.
Whether sample compositing has been applied.
RC grade control is on 10m sections with holes every 5-
6m on section. Samples are collected at nominal 1.0m
intervals down-hole from collar to end-of-hole.
Resource definition drilling is wider-space, typically on a
25m x 25m grid.
SD2 adopted a low grade threshold to define the
mineralised zone. The geometry and extents of the
mineralisation was defined using an implicit modeling
method with manual control to minimize modeling
artefacts. By definition the implicit method applied is
data-driven and dependent on the data spacing. In
SD2’s opinion the modelled volume is a realistic
representation of the mineralised system.
Samples were composited to nominal 2.0m intervals
prior to defining the mineralised domains and grade
estimation.
Orientation of data in relation to geological structure Whether the orientation of sampling achieves unbiased
sampling of possible structures and the extent to which
this is known, considering the deposit type.
If the relationship between the drilling orientation and
the orientation of key mineralised structures is
considered to have introduced a sampling bias, this
should be assessed and reported if material.
Drilling sections are orientated perpendicular to the
strike of the mineralised host rocks at Golden Wings,
which is towards the south. The drilling is angled at -60°
which is approximately perpendicular to the dip of the
stratigraphy.
No orientation-based sampling bias has been identified
in the data
Sample security The measures taken to ensure sample security. Chain of custody is managed by GCY. RC samples are
collected from site and transported to Perth for analysis
using contracted transport companies. Sample batches
are labelled and sample identifiers cross-checked at
dispatch and on receipt. Analytical results are returned
electronically indexed by the GNT supplied sample
identifier. The laboratory has no access to data
regarding hole location or purpose.

Criteria JORC Code explanation Commentary
Audits or reviews The results of any audits or reviews of sampling
techniques and data.
There have been no external audits of sampling
techniques.
The geological database has been reviewed by SD2 as a
part of this resource estimate. Minor omissions
identified in the review were resolved by GCY.
Section 2 Reporting of Exploration Results
(Criteria listed in the preceding section also apply to this section.)

Criteria JORC Code explanation Commentary
Mineral
tenement and
land tenure
status
Type, reference name/number, location and ownership including
agreements or material issues with third parties such as joint
ventures, partnerships, overriding royalties, native title interests,
historical sites, wilderness or national park and environmental
settings.
The security of the tenure held at the time of reporting along with
any known impediments to obtaining a license to operate in the
area.
The Dalgaranga Project is situated on tenement number M59/749. GCY has a whole
100% interest in the tenement.
The tenement is in good standing and no known impediments exist.
Exploration
done by other
parties
Acknowledgment and appraisal of exploration by other parties. The tenement area has been previously explored by numerous companies including
BHP, Newcrest and Equigold. Mining was carried out by Equigold in a JV with Western
Reefs NL from 1996 – 2000.
Geology Deposit type, geological setting and style of mineralisation. Regionally, the Dalgaranga Project lies within the Archean Dalgaranga Greenstone Belt
in the Murchison Province of Western Australia. At Golden Wings, two styles of in situ
mineralisation are evident, with gold zones occurring as the following in fresh rock at
depths around 100m: sericite-chlorite- quartz schists after mafic rocks or sediments;
and quartz- pyrite-arsenopyrite plunging lodes within biotite-sericite-carbonate-pyrite
schists related to quartz feldspar porphyry intrusions.
The mineralisation is complexly deformed and the structural geological history forms an
integral role in the location and tenor of gold mineralisation.
Drill hole
Information
A summary of all information material to the understanding of
the exploration results including a tabulation of the following
information for all Material drill holes:
easting and northing of the drill hole collar
elevation or RL (Reduced Level – elevation above sea level in
metres) of the drill hole collar
dip and azimuth of the hole
down hole length and interception depth
hole length.
If the exclusion of this information is justified on the basis that the
information is not Material and this exclusion does not detract
from the understanding of the report, the Competent Person
should clearly explain why this is the case.
A complete list of drill holes used in this estimate is included as Appendix D of this
report.
All RAB and air core drilling has been excluded from this estimate.
37 pre-GCY holes were excluded on the advice of the site geology team. These holes
were removed after twinning by more recent drill holes.
Criteria JORC Code explanation Commentary
Data
aggregation
methods
In reporting Exploration Results, weighting averaging techniques,
maximum and/or minimum grade truncations (eg cutting of high
grades) and cut-off grades are usually Material and should be
stated.
Where aggregate intercepts incorporate short lengths of high
grade results and longer lengths of low grade results, the
procedure used for such aggregation should be stated and some
typical examples of such aggregations should be shown in detail.
The assumptions used for any reporting of metal equivalent
values should be clearly stated.
No metal equivalents were used in this estimate.
Data aggregation for estimation involved compositing samples to a nominal 2.0m within
the estimation domains. Grade caps were applied to the composited samples based on
a statistical analysis of the grade frequency population.
Composites were length-weighted with no consideration of bulk density.
Relationship
between
mineralisation
widths and
intercept
lengths
These relationships are particularly important in the reporting of
Exploration Results.
If the geometry of the mineralisation with respect to the drill hole
angle is known, its nature should be reported.
If it is not known and only the down hole lengths are reported,
there should be a clear statement to this effect (eg ‘down hole
length, true width not known’).
Drill holes are oriented on north-south sections dipping at approximately 60. This
pattern is approximately orthogonal to the trend of the mineralisation and therefore
intersections will approximate the true width of the mineralised zone.
Diagrams Appropriate maps and sections (with scales) and tabulations of
intercepts should be included for any significant discovery being
reported These should include, but not be limited to a plan view of
drill hole collar locations and appropriate sectional views.
Refer to the body of this report. 3-dimensional perspective views of the data used for
the estimate and the domains derived from the data are included though-out.
Balanced
reporting
Where comprehensive reporting of all Exploration Results is not
practicable, representative reporting of both low and high grades
and/or widths should be practiced to avoid misleading reporting
of Exploration Results.
Not applicable for resource estimate. Refer to GCY public releases for details of
exploration results.
Other
substantive
exploration
data
Other exploration data, if meaningful and material, should be
reported including (but not limited to): geological observations;
geophysical survey results; geochemical survey results; bulk
samples – size and method of treatment; metallurgical test
results; bulk density, groundwater, geotechnical and rock
characteristics; potential deleterious or contaminating
substances.
Golden Wings is an active mining operation. Observations including geological features
and trends, production performance and mining-metallurgical related productivity are
available and, where appropriate, have been used for this resource estimate. This
include data relating to broken bulk density, tonnes and grade reconciliation and
economic performance. SD2 not that reconciliation data for Golden Wings is limited to
the performance of a 3-operation blend supplied to the ore treatment plant.
Criteria JORC Code explanation Commentary
Further work The nature and scale of planned further work (eg tests for lateral
extensions or depth extensions or large-scale step-out drilling).
Diagrams clearly highlighting the areas of possible extensions,
including the main geological interpretations and future drilling
areas, provided this information is not commercially sensitive.
Grade control drilling will continue as mining progresses.
Exploration for mineralisation external to the currently defined open pit will continue,
targeting preferred zones identified by the improved geological knowledge obtained
during mining.
Section 3 Estimation and Reporting of Mineral Resources

Criteria JORC Code explanation Commentary
Database integrity Measures taken to ensure that data has not been
corrupted by, for example, transcription or keying
errors, between its initial collection and its use for
Mineral Resource estimation purposes.
Data validation procedures used.
Geological logs are electronically captured at the time
of logging using GeoBiz software with in-built data
validation and restricted logging legends. Logs are
uploaded to the central geology database where a
second level of validation is applied.
Assay data is supplied directly from the laboratory in
electronic format and uploaded to the central geology
database. Data must be manually ‘accepted’ and passes
through a routine series of validation steps.
Prior to estimation SD2 reviewed the geology and assay
data and completed standard validation tests to check
for:
Duplicate sample intervals
Gaps in the sample interval / hole trace
Invalid results (e.g. negative assays)
Collar coordinates within the project area
Valid rates of change for down-hole surveys
Site visits Comment on any site visits undertaken by the
Competent Person and the outcome of those visits.
If no site visits have been undertaken indicate why this
is the case.
The Competent Person visited the Golden Wings
operation in April 2019 and inspected the operation
including:
Viewing the open pit operation and geology
Discussing the mineralisation with the site geology
team
No drilling/sampling was observed due to operational
constraints

Criteria JORC Code explanation Commentary
Geological interpretation Confidence in (or conversely, the uncertainty of) the
geological interpretation of the mineral deposit.
Nature of the data used and of any assumptions made.
The effect, if any, of alternative interpretations on
Mineral Resource estimation.
The use of geology in guiding and controlling Mineral
Resource estimation.
The factors affecting continuity both of grade and
geology.
The Golden Wings geology is complex exhibiting
features controlled by multiple phases of structural
deformation. This combined with the relatively high
nugget effect and skewed grade distribution impacts on
the confidence in the geological interpretation.
Multiple alternative interpretations were examined for
this estimate. SD2 developed and modelled a range of
scenarios based on the available data. This analysis
highlighted areas of higher/lower uncertainty. On a
global-basis the remaining tonnes and grade for the
different scenarios were within a small range, generally
exhibiting less than 10% difference. The exception to
this is the 2017 estimate where the interpretation
tended to exaggerate grade continuity and contrast
resulting in material difference in the estimated grade-
tonnage curve.
The geological interpretation was based on an indicator
estimate at a 0.25g/t threshold. 3D surfaces (iso-
contours) were modelled around this indicator and a
35% probability of grade exceeding 0.25 g/t was
selected as the best representation of the geology. This
choice was based on consideration of the mapped
geometry of mineralised zone and the size, shape and
orientation of dig blocks created from detailed grade
control data.
The resulting 3D surfaces were examined and compared
to the known mineralisation controls (𝐿31 and 𝐿4
1 )
demonstrating good overall alignment.
The geological interpretation is consistent with the
indicator variography and reflects the nature of the
exposed geology including regions of relatively high
continuity combined with regions dominated by short,
impersistent grades.

Criteria JORC Code explanation Commentary
Dimensions The extent and variability of the Mineral Resource
expressed as length (along strike or otherwise), plan
width, and depth below surface to the upper and lower
limits of the Mineral Resource.
The Golden Wings Mineral Resource area extends over
a strike length of 840m (from 528,950mE – 529,790mE)
and includes the 175m vertical interval from 430mRL to
255mRL.

Estimation and modelling techniques The nature and appropriateness of the estimation
technique(s) applied and key assumptions, including
treatment of extreme grade values, domaining,
interpolation parameters and maximum distance of
extrapolation from data points. If a computer assisted
estimation method was chosen include a description of
computer software and parameters used.
The availability of check estimates, previous estimates
and/or mine production records and whether the
Mineral Resource estimate takes appropriate account of
such data.
The assumptions made regarding recovery of by-
products.
Estimation of deleterious elements or other non-grade
variables of economic significance (eg sulphur for acid
mine drainage characterisation).
In the case of block model interpolation, the block size in
relation to the average sample spacing and the search
employed.
Any assumptions behind modelling of selective mining
units.
Any assumptions about correlation between variables.
Description of how the geological interpretation was
used to control the resource estimates.
Discussion of basis for using or not using grade cutting
or capping.
The process of validation, the checking process used, the
comparison of model data to drill hole data, and use of
reconciliation data if available.
Grade estimation was by Uniform Conditioning (UC)
with a post-processing localization step (localized
Uniform Conditioning or LUC). This is a non-linear
estimation method based on discrete Gaussian change
of support applied to an underlying Ordinary Kriged
(panel) model. LUC was selected based on
consideration of the nature of the mineralisation and
the sampling statistics.
The mineralisation was divided into 2 domains. In each
domain, the influence of extreme grades was examined
prior to panel model estimation. Extreme grades were
capped based on analysis of the change in coefficient of
variation (CV) as the capping grade decreased. The
capping value was set where the rate of change
stabilised.
Variogram models were developed for the largest
(southern) domain and adopted for the northern
domain. Experimental variograms for the northern
domain were poorly structured due to low sample
numbers. SD2 adopted the southern variogram model
based on proximity and statistical similarity between
the 2 zones.
Estimation was completed in Datamine Studio RM
(v1.4.205.0)
This estimate was compared to the 2017 estimate;
however the fundamental difference in interpretation
precluded any meaningful outcome.
This estimate was compared to recent production from
Golden Wings; however, the blending of Golden Wings
ore with 2 other sources precludes any meaningful
outcome.
This estimate was compared to the shapes and volumes
of dig blocks developed by the mine geology team
during grade control. While not conclusive, the
predicted ore/waste showed a high correlation to the
dig block design geometry and volume.

Criteria JORC Code explanation Commentary
No by-products were modelled or are anticipated
No deleterious elements were estimated or anticipated.
The major contributors to economic performance are
gold grade and material type (oxidation).
UC panel size was set to 10m x 5m x 5m (XYZ) and LUC
sub-blocks (SMU) to 10m x 5m x 2.5m (XYZ). The panel
size is approximately equal to the final grade control
drill hole spacing and 50% of the resource definition
drill hole spacing.
The selective mining unit (SMU) was defined after
discussions with site personnel and reflects the
minimum volume that would be blocked out during
grade control.
The search range was dictated by the variogram model.
The search was in three passes. In the first pass search
ranges were twice the variogram range reflecting the
high nugget and steep slope of the variogram near the
origin. For blocks not estimated in the first pass the
range was increased by a factor of 2 and a further
factor of 2 for the third pass (if required). 87.5% of
panels were estimated in the first pass, 12% in the
second pass and 0.5% in the third pass. Average
estimated grades for passes 2 and 3 are 25% and 32%
lower than grades estimated in pass 1 indicating that
the wider-spaced data (bigger search range) is
concentrated in lower grade areas of the
mineralisation. This is consistent with the underlying
data spatial distribution.
Moisture Whether the tonnages are estimated on a dry basis or
with natural moisture, and the method of determination
of the moisture content.
Tonnages and grades were estimated on a dry, in situ
basis

Criteria JORC Code explanation Commentary
Cut-off parameters The basis of the adopted cut-off grade(s) or quality
parameters applied.
The resource is reported above 0.3 g/t Au. This cut-off
reflects the economic cut-off currently used by GCY in
the open pit operation. As such, the cut-off is consistent
with the ‘reasonable prospects’ test required under the
JORC Code.
Mining factors or assumptions Assumptions made regarding possible mining methods,
minimum mining dimensions and internal (or, if
applicable, external) mining dilution. It is always
necessary as part of the process of determining
reasonable prospects for eventual economic extraction
to consider potential mining methods, but the
assumptions made regarding mining methods and
parameters when estimating Mineral Resources may
not always be rigorous. Where this is the case, this
should be reported with an explanation of the basis of
the mining assumptions made.
The Golden Wings resource estimate is based on the
following assumptions:
Open pit mining
SMU 10m x 5m x 2.5m (XYZ)
Good mining practice and mining equipment consistent
with the SMU size such that mining losses and dilution
are minimized
The current (April 2019) open pit design, and
Mining concurrent with production from the nearby
Gilbey’s open pit.

Criteria JORC Code explanation Commentary
Metallurgical factors or assumptions The basis for assumptions or predictions regarding
metallurgical amenability. It is always necessary as part
of the process of determining reasonable prospects for
eventual economic extraction to consider potential
metallurgical methods, but the assumptions regarding
metallurgical treatment processes and parameters
made when reporting Mineral Resources may not
always be rigorous. Where this is the case, this should
be reported with an explanation of the basis of the
metallurgical assumptions made.
The Golden Wings resource estimate is based on an
assumption that there is sufficient ‘hard rock’ ore from
the adjacent Gilbey’s open pit to blend with Golden
Wings. This blending is required due to the high clay
content at Golden Wings. Treating the Golden Wings
mineralisation in isolation would most likely incur
increased materials handling costs in the crushing and
grinding circuit.
Metallurgical performance is supported by the current
Golden Wings operation and metallurgical tests
completed during the feasibility study. When material
above the cut-off grade is treated (in a blend) the ore
treatment plant performance is in line with
expectations. If large volumes of below cut-off are
included in the blend metallurgical performance is
adversely impacted.
Metallurgical samples collected during the feasibility
study indicate very high recoveries from both oxidized
and fresh material (between 95% and 98%).
Environmental factors or assumptions Assumptions made regarding possible waste and
process residue disposal options. It is always necessary
as part of the process of determining reasonable
prospects for eventual economic extraction to consider
the potential environmental impacts of the mining and
processing operation. While at this stage the
determination of potential environmental impacts,
particularly for a greenfields project, may not always be
well advanced, the status of early consideration of these
potential environmental impacts should be reported.
Where these aspects have not been considered this
should be reported with an explanation of the
environmental assumptions made.
GCY have the required environmental approvals for the
Golden Wings operation. SD2 is unaware of any
material changes or past performance issues likely to
impact on approval to mine Golden Wings.

Criteria JORC Code explanation Commentary
Bulk density Whether assumed or determined. If assumed, the basis
for the assumptions. If determined, the method used,
whether wet or dry, the frequency of the
measurements, the nature, size and representativeness
of the samples.
The bulk density for bulk material must have been
measured by methods that adequately account for void
spaces (vugs, porosity, etc), moisture and differences
between rock and alteration zones within the deposit.
Discuss assumptions for bulk density estimates used in
the evaluation process of the different materials.
No bulk density samples are available for Golden Wings.
Limited sampling exists at the nearby Gilbey’s open pit
and the results of conventional Archimedes analysis of
the Gilbey’s samples have been adopted for Golden
Wings.
In situ bulk density is assigned by material type (Oxide,
transition, fresh). Oxidation boundaries are interpreted
from geological logs of the drill hole data. Oxide is
assigned a bulk density of 2.0 g/cm. Transition is
assigned a bulk density of 2.4 g/cm and fresh is
assigned a bulk density of 2.8.
To date, the tonnage reconciliation from the combined
Gilbey’s and Golden Wings ore fed to the ore treatment
plant has been between 97% and 103%. While Golden
Wings is a relatively small proportion of the blend and
to date production has been from the oxide zone only,
the close correlation between the mine and mill tonnes
supports the assigned bulk density.

Criteria JORC Code explanation Commentary
Classification The basis for the classification of the Mineral Resources
into varying confidence categories.
Whether appropriate account has been taken of all
relevant factors (ie relative confidence in tonnage/grade
estimations, reliability of input data, confidence in
continuity of geology and metal values, quality, quantity
and distribution of the data).
Whether the result appropriately reflects the Competent
Person’s view of the deposit.
There is no Measured Resource at Golden Wings.
The resource has been classified as Indicated or
Inferred after consideration of sample quality and
quantity, the geological setting, database integrity, the
dimensions of the mineralisation, and recent mining
activities.
SD2 developed a classification surface separating
Indicated and Inferred Resources. This surface was
modeled in 3D and blocks above classified as Indicated
while block below were classified as Inferred. The
classification surface was driven by the sample-to-block
geometry. In areas of closely spaced drilling (more than
10 samples within 8m) the resource was classified as
Indicted. SD2 consider this level of data support
sufficient to assume geological continuity between
points of observation. Areas where there were more
than 10 samples within 15m were classified as Inferred.
SD2 consider this level of data support sufficient to
imply but not verify geological continuity.
Regions of the deposit where there are less than 10
samples within a 15m radius were not classified and
have been excluded from the resource tabulation.
Audits or reviews The results of any audits or reviews of Mineral Resource
estimates.
No audit/review has been completed for SD2’s Golden
Wings 2019 Resource estimate.
The change in estimation approach used in this
estimate compared to the 2017 resource was driven in
part by multiple reviews of the 2017 model including
reports by SD2, GCY and RPM.

Criteria JORC Code explanation Commentary
Discussion of relative accuracy/ confidence Where appropriate a statement of the relative accuracy
and confidence level in the Mineral Resource estimate
using an approach or procedure deemed appropriate by
the Competent Person. For example, the application of
statistical or geostatistical procedures to quantify the
relative accuracy of the resource within stated
confidence limits, or, if such an approach is not deemed
appropriate, a qualitative discussion of the factors that
could affect the relative accuracy and confidence of the
estimate.
The statement should specify whether it relates to
global or local estimates, and, if local, state the relevant
tonnages, which should be relevant to technical and
economic evaluation. Documentation should include
assumptions made and the procedures used.
These statements of relative accuracy and confidence of
the estimate should be compared with production data,
where available.
As a part of the 2019 mineral resource estimate, SD2
conducted tonnes and grade sensitivity analysis. This
analysis was based on investigating different geological
interpretations and applying different SMUs, search and
estimation parameters. The sensitivity analysis shows
that the key drivers for the resource are:
The geological interpretation and continuity
assumptions and
The grade capping applied to the estimate
For a given geological interpretation the sensitivity
modelling showed a grade precision of +/- 10%. While
this is not a statistical confidence limit test it
demonstrates the likely range of resource grades.
Different domaining assumptions were much more
variable and outcomes were dependent on the type of
interpretation applied, for example unconstrained
implicit modelling using naïve Leapfrog Geo shapes
showed a massive (and unrealistic) increase in tonnes.
The current domain volume is a close match to grade
control dig block volumes, locations and geometry and
is therefore, in SD2’s opinion, the most appropriate
choice of geological interpretation in the absence of
conflicting data.
No meaningful reconciliation data is available for past
Golden Wings production. Golden Wings is part of a 3-
operation blend being fed to the ore treatment plant
and the uncertainty associated with assumptions
required to back allocate tonnes and grade to each
operation outweighs the precision of the estimates.


![[Product Monograph Template - Standard] - Pfizer · PDF filePRODUCT MONOGRAPH . PrTAZOCIN® Piperacillin and Tazobactam powder for injection . 2.0g/0.25g, 3g/0.375g, 4.0g/0.5g per](https://static.fdocuments.in/doc/165x107/5aa7236e7f8b9ab8228bd94a/product-monograph-template-standard-pfizer-monograph-prtazocin-piperacillin.jpg)