
Dale and Betty Bumpers Vaccine Research Center
26
Dale and Betty Bumpers Vaccine Research Center National Institute of Allergy and Infectious Diseases National Institutes of Health Richard A. Koup Vaccine Research Center Lymph node structure and HIV-1 infection: T cell immunopathogenesis
description
Dale and Betty Bumpers Vaccine Research Center National Institute of Allergy and Infectious Diseases National Institutes of Health. Lymph node structure and HIV-1 infection: T cell immunopathogenesis. Richard A. Koup Vaccine Research Center. Background. - PowerPoint PPT Presentation
Transcript of Dale and Betty Bumpers Vaccine Research Center

Dale and Betty Bumpers
Vaccine Research CenterNational Institute of Allergy and Infectious DiseasesNational Institutes of Health
Richard A. KoupVaccine Research Center
Lymph node structure and HIV-1 infection:
T cell immunopathogenesis

Background
• HIV replication is active in lymph nodes throughout the course of HIV infection
• HIV leads to an initial hypertrophy, followed by involution of lymphoid tissues (Tim Schacker)
• SIV infection in rhesus macaques has a similar pathogenesis to HIV infection in humans (Guido Silvestri) and can be used to study the immuno-pathogenesis of HIV infection in lymph nodes
• In this talk I will concentrate on using acute and early SIV infection of rhesus macaques to model HIV pathogenesis in lymph nodes

Janeway’s Immunobiology (8th Edition)
The Lymph Node has a Complicated Structure

Simplified LN Structure
Paracortical Area(T cells)
Lymphoid Follicle(B cells)
Germinal Center(B and T cells)
Light Zone(T/B cell interaction)
Dark Zone(B cell proliferation)

Simplified LN Structure – HIV Infection
Uninfected Infected - Early
Germinal Center Hypertrophy
(increased germinal center T cells)
Loss of non-germinal
center T cells
Infected - Late

Outline
• Virus replication in LN during acute/early HIV/SIV infection
• Changes in CD4 T cell populations in LNs during acute/early HIV/SIV replication
• Underlying mechanisms• Non-T cell consequences

SIV as a model for HIV infection
Nature 434:1093-7, 2005

Pla
sma
Vira
l Loa
d (L
og10
)
Acute Infection: Plasma Viral Loads

CD
4 T
Cel
ls, %
of C
D3+
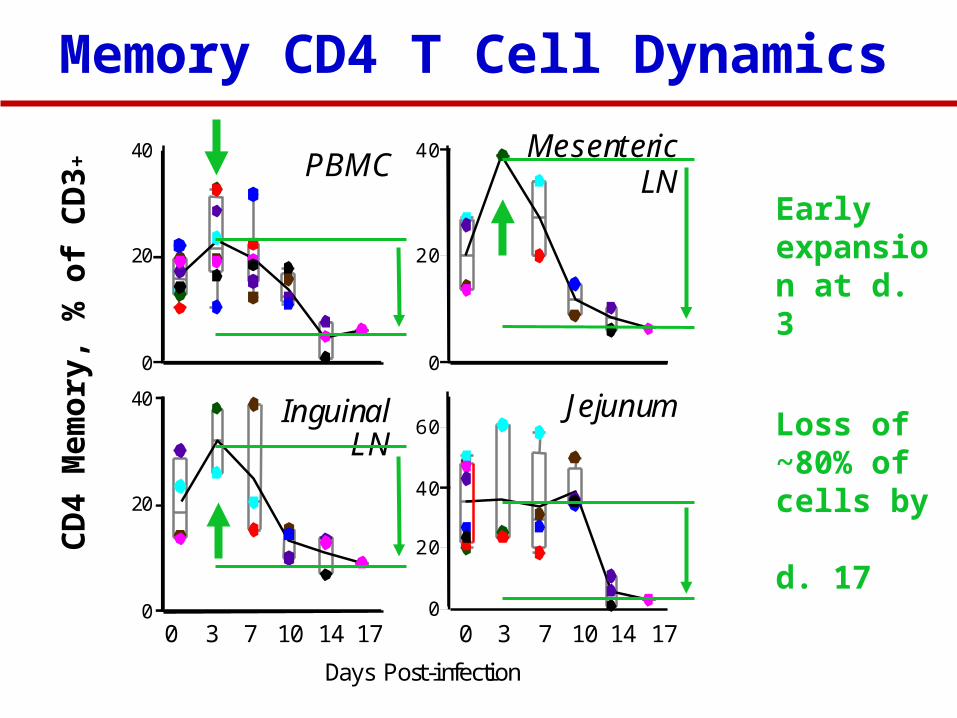
Total CD4 Cell Dynamics
0
20
40 InguinalLN
0
20
40
60Jejunum
0
20
40 MesentericLN
0
20
40 PBMC
0 3 7 10 14 17 0 3 7 10 14 17
Days Post-infection
CD
4 M
emor
y, %
of C
D3+
Memory CD4 T Cell Dynamics
Early expansion at d. 3
Loss of ~80% of cells by d. 17

Cell-Associated Viral Loads
0
1x10⁵
2x10⁵
0
1x10⁵
2x10⁵
0
1x10⁵
2x10⁵
0
1x10⁵
2x10⁵
Naive CD4 T Cells Memory CD4 T Cells
PBMC
Inguinal LN
Mesenteric LN
Jejunum
Days Post-infection3 7 10 14 17 3 7 10 14 17
Cel
l-Ass
ocia
ted
Vira
l Loa
d (g
ag C
opie
s / 1
05 cel
ls)

These data do not take into account structural localization within the LN
• Where is the virus replicating with respect to the paracortical T cell zone and the light zone of the germinal center?
• What is happening to CD4 T cell frequency in these areas during acute and early SIV infection?
Paracortical T cell zone
Light zone of the germinal center

Surface markers can distinguish CD4 T cells from these different areas
Paracortical T cell zone
Light zone of the germinal center
CD95
CD
28
CD8
CD
4
CD3
Aqu
a
FSC-A
FSC
-H
PD-1
CC
R7
0 103 10 4 105
0
10 2
10 3
10 4
10 5
70.8
19.5

Where does SIV replicate?
PD-1
CC
R7
0
0.5
1.0
1.5
Early SIV (>2 months)
0
1
2
3
4
5
Acute SIV (3-21 days)
SIV
Gag
DN
A (c
opie
s/ce
ll)
SIV
Gag
DN
A (c
opie
s/ce
ll)p=0.0078p=0.0156
0 103 104 1050
102
103
104
105
ICO
S
CD150
Paracortical T cell zone
Light zone of the germinal center
Would expect to see depletion of CD4 T cells in
germinal centers

SIV: Relative accumulation of CD4 T cells in GCs
0 102
103
104
105
0
102
103
104
105
29.1
12.9
47.8
PD-1
CC
R7
CCR7high
PD-1lowCCR7high/low
PD-1dimTFH
% o
f CM
CD
4 T
cells
SIV acute SIV earlySIV-

CD4 PD1 Ki-67
Michael Gerner, Ron Germain
Light zone:T - B cell interaction
Dark zone:B cell proliferation
Accumulation of GC CD4 T cells during SIV infection: Abundant GCs with retained architecture

Mechanism?
Uninfected Infected - Early
?

No correlation between VLs and percent GC T cells during SIV infection
Percent GC T cells in LN
Vira
l Loa
ds

GC T cells
% o
f CM
CD
4 T
cells
Accumulation of GC T cells is associated with general immune activation (sCD14)
p=0.0013p=0.0004
p=0.0164
sCD
14 (x
106 p
g/m
l)
SIV acute SIV early (high % of TFH)SIV- SIV early (low % of TFH)

SIV: Relative accumulation of GC T cells
IL-6 signaling drives the up-regulation of Bcl-6 and enhanced T cell responses that are seen
during chronic LCMV infection in mice.
Does IL-6 production drive the accumulation of GC T cells during early SIV infection in monkeys?

SIV- SIV+ (early)
p=0.0215
Increase in the IL-6/IL-6R axis is associated with GC T cell accumulation during SIV infection
Plas
ma
IL-6
(pg/
ml) p=0.0136
Percent GC T cells in LN
IL6R
a on
GC
T c
ells
(MFI
)

Mechanism?
Uninfected Infected - Early
IL-62)Altered phospho STAT (3>1)3)
GC T cell differentiation4)
Immune activation1)
Petrovas et al, J. Clin. Invest., 2012

SIV -SIV chronic (low % GC T cells)SIV chronic (high % GC T cells)
p=0.015
0 10 2 10 3 10 4 10 5
010 2
10 3
10 4
10 5
86.1
0 10 3 10 4 10 5
010 2
10 3
10 4
10 5
28.7
0 10 3 10 4 10 5
0
10 3
10 4
10 5
9.84
6.4922.3
61.3
0 10 3 10 4 10 5
0
10 3
10 4
10 5
15.8
0.721.87
81.5
Aqu
a
SSC CD20
CD
3
PNA
IgG
PBMC
LN
LN
PNAhighIgGlow
PNAhighIgGhigh
SIV- SIV+
low TSIV+
high T
GC T cells are TFH that influence B cells differentiation and antibody production
SIV chronic (low % GC T cells)
SIV chronic (high % GC T cells)
gp120
p=0.051
SIV-
spec
ific
IgG
(ti
ter,
x104 )
0
2.5
5
7.5
10

Conclusions• HIV/SIV replication is profound during acute infection• This leads to a massive depletion of memory CD4 T cells
in the LN and gut• CD4 T cell depletion from the gut leads to microbial
translocation and general immune activation (discussed elsewhere)
• Immune activation promotes differentiation of T cells in the LN which move to and accumulate in the GCs (lymphoid hypertrophy)– Non-pathogenic SIV controls immune activation
• Continued immune activation ultimately leads to fibrosis of the lymph nodes

Simplified LN Structure – HIV Infection
Uninfected Infected - Early
Germinal Center Hypertrophy
(increased germinal center T cells)
Loss of non-germinal
center T cells
Infected - Late
Directinfection:
CD4 depletion
Immune activation:
GC hypertrophy followed by
fibrosis
Dale and Betty Bumpers
Vaccine Research CenterNational Institute of Allergy and Infectious DiseasesNational Institutes of Health
Costas PetrovasTakuya YamamotoKristin BoswellJoseph CasazzaRob ParisDavid Ambrozak
Immunology Laboratory NIAID/NCI CollaboratorsMichael GernerRon Germain
Human Immunology Section
Netanya SandlerDaniel Douek
ImmunoTechnology SectionMario Roederer
Lab Animal Medicine
John-Paul ToddSrinivas Rao