Daiwa Investment Conference Tokyo 2018 · This document contains “forward-looking statements”...
68
Management Strategy Sumitomo Mitsui Financial Group, Inc. February & March 2018
Transcript of Daiwa Investment Conference Tokyo 2018 · This document contains “forward-looking statements”...

Management Strategy
Sumitomo Mitsui Financial Group, Inc.
February & March 2018

This document contains “forward-looking statements” (as defined in the U.S. Private Securities Litigation Reform Act of 1995), regarding the intent, belief or current expectations of us and our managements with respect to our future financial condition and results of operations. In many cases but not all, these statements contain words such as “anticipate,” “believe,” “estimate,” “expect,” “intend,” “may,” “plan,” “probability,” “risk,” “project,” “should,” “seek,” “target,” “will” and similar expressions. Such forward-looking statements are not guarantees of future performance and involve risks and uncertainties, and actual results may differ from those expressed in or implied by such forward-looking statements contained or deemed to be contained herein. The risks and uncertainties which may affect future performance include: deterioration of Japanese and global economic conditions and financial markets; declines in the value of our securities portfolio; incurrence of significant credit-related costs; our ability to successfully implement our business strategy through our subsidiaries, affiliates and alliance partners; and exposure to new risks as we expand the scope of our business. Given these and other risks and uncertainties, you should not place undue reliance on forward-looking statements, which speak only as of the date of this document. We undertake no obligation to update or revise any forward-looking statements.
Please refer to our most recent disclosure documents such as our annual report on Form 20-F and other documents submitted to the U.S. Securities and Exchange Commission, as well as our earnings press releases, for a more detailed description of the risks and uncertainties that may affect our financial conditions and our operating results, and investors’ decisions.
Definitions
Consolidated :SMFG (consolidated)
Non-consolidated :SMBC (non-consolidated)
SMFG :Sumitomo Mitsui Financial Group
SMBC :Sumitomo Mitsui Banking Corporation
SMBC Trust :SMBC Trust Bank
SMFL :Sumitomo Mitsui Finance and Leasing
SMBC Nikko :SMBC Nikko Securities
SMBC Friend :SMBC Friend Securities
SMCC :Sumitomo Mitsui Card Company
SMBCCF :SMBC Consumer Finance
SMAM :Sumitomo Mitsui Asset Management
SMBCAC : SMBC Aviation Capital
Overview of the four business units
Retail (RT) Business Unit :
Domestic retail and SME businesses
SMBC (RT), SMBC Nikko (RT), SMBC Friend, SMBC Trust
(RT), SMCC, Cedyna, SMBCCF, others
Wholesale (WS) Business Unit :
Domestic large/mid-size corporation business
SMBC (WS), SMBC Nikko (WS), SMBC Trust (WS), SMFL
(Domestic), others
International (Inter.) Business Unit :
SMBC (Inter.), SMBC Nikko (Inter.), SMBC Trust (Inter.),
SMFL (Inter.), others
Global Markets (GM) Business Unit :
Market / Treasury related businesses
SMBC (Treasury), SMBC Nikko (Product), others
2
Agenda
Progress of the Medium-Term Management Plan I
II 3Q, FY3/2018 performance
III Capital Policy
IV Key Takeaways
3

I Progress of the Medium-Term Management Plan

Adopt a progressive dividend policy targeting payout ratio of 40%
Dividend per share forecast for FY3/2018 is 160 yen, a 10 yen increase year on year
Policy for share buybacks will be laid out after the finalization of Basel III reforms
Shareholder Return Policy
Capital
Efficiency ROE 7~8%
Maintain at least 7%
notwithstanding
accumulation of capital
Cost
Efficiency OHR
1% reduction
compared with
FY3/2017
Reduce to around 60% at
the earliest opportunity
(FY3/2017: 62.1%)
Financial
Soundness
CET1
ratio*1,2 10%
Maintain capital in line with
likely raised requirement
(FY3/2017 8.3%)
Business Environment
Challenging earnings
environment
Tighter international
regulations
New opportunities from
technology and social
trends
Key considerations
Improve capital, asset,
and cost efficiencies
Healthy risk-taking versus
credit cost control
Balance among
financial soundness,
enhancing shareholder
returns, and growth
investments
*1 Calculated with RWA inflated by 25% compared to the current level based on our assumption of the final impact
of Basel III reforms
*2 CET1: excludes net unrealized gains on other securities
RWA: excludes RWA associated with net unrealized gains on stocks
To achieve sustainable growth by combining
the Group’s strengths with more focused
business management
FY3/2020 Financial Targets
Core Policy
Integration Integration across the Group
and globally to achieve sustainable
growth
Discipline Disciplined business
management
Focus Focus on our strengths to generate
growth
2 3 1
Overview of Medium-Term Management Plan (FY3/2018-FY3/2020)
5
Announced May 2017

Prioritize business fields when allocating resources to enhance capital efficiency
Maintain our competitive advantage in the domestic retail and wholesale businesses and generate stable earnings
Transformation of business/asset portfolio
SMFG’s competitive advantage
Business growth for SMFG
Grow
Business portfolio transformation
Build
Enhance
Transform
Businesses
competing
with domestic
regional banks
Japan mid-sized
enterprises
Asia-centric
Global products
Global large
corporations
Trust banking / Asset
management
Sales & Trading
Mortgage
loans
Domestic
retail
business
Credit
card
Wealth
management
Review of group operations
(Launched in 2017)
Turning SMFL to an equity method affiliate (around 4Q, FY3/19)
Reorganize SMFL into a platform for the strategic joint leasing
partnership for SMFG and Sumitomo Corporation.
Each company will own 50% of SMFL going forward
SMFG will turn SMBCAC to an equity method affiliate, while
maintaining the ownership ratio of the company
(Ownership ratio of SMBCAC: SMBC32%, SMFL68%)
Financial impact (Post-Basel III reforms basis)
RWA :approx. JPY(3) tn
CET1 ratio :around +40bp
Impact on P/L :approx. JPY(4) bn annually
March Turning Kansai Urban Banking Corporation and
THE MINATO BANK to equity method affiliates
August Yahoo! JAPAN to consolidate The Japan Net Bank
August Changing shareholder composition of POCKET CARD
(ITOCHU and FamilyMart to raise its shareholdings)
November Reorganization of the joint leasing partnership of SMFL
- SMFG and Sumitomo Corp will respectively own
50% of SMFL
- SMFG will turn SMFL to an equity method affiliate
Discipline
6

Key initiatives
Made steady progress in executing key initiatives as well as cost control in daily operations on a group-wide
basis
Cost control: Improving productivity and efficiency
Key initiatives
7
Discipline
Business reform to improve efficiency
Utilize technology to improve efficiency of head office business processes
Consolidate head office functions and infrastructure of group companies
Retail branch reorganization
Transform 430 branches to next-generation branches
Enhance self/remote transactions and administration processes
Productivity and efficiency improvement through branch reforms
Reorganization of group companies
Merge SMBC Nikko and SMBC Friend
Strengthen business integration of SMCC and Cedyna
(Clarification of roles and sharing of management resources)
Progress
• Working on reducing 830 K hours of workload
(400 people) with RPA (Robotic Process Automation)
• Integrating group functions (e.g. launched group-
wide procurement system)
• On track to transform 100 branches to next-
generation branches by the end of Mar. 2018
• Centralized back-office operations
• Completed merger of SMBC Nikko and
SMBC Friend in Jan. 2018
(# of branches: total 185 → 148)
Daily operation control
Cost reduction: JPY 50 bn (in 3 years), JPY 100 bn (mid-term)
JPY 20 bn
JPY 20 bn
JPY 10 bn
+ Effect on personnel
through key initiatives to improve efficiency
Reduce workload of 4,000 people (generate capacity)
0
500
1,000
1,500
Mar. 14 Mar. 15 Mar. 16 Mar. 17 Dec. 17
Nikko fund wrap
SMBC fund wrap
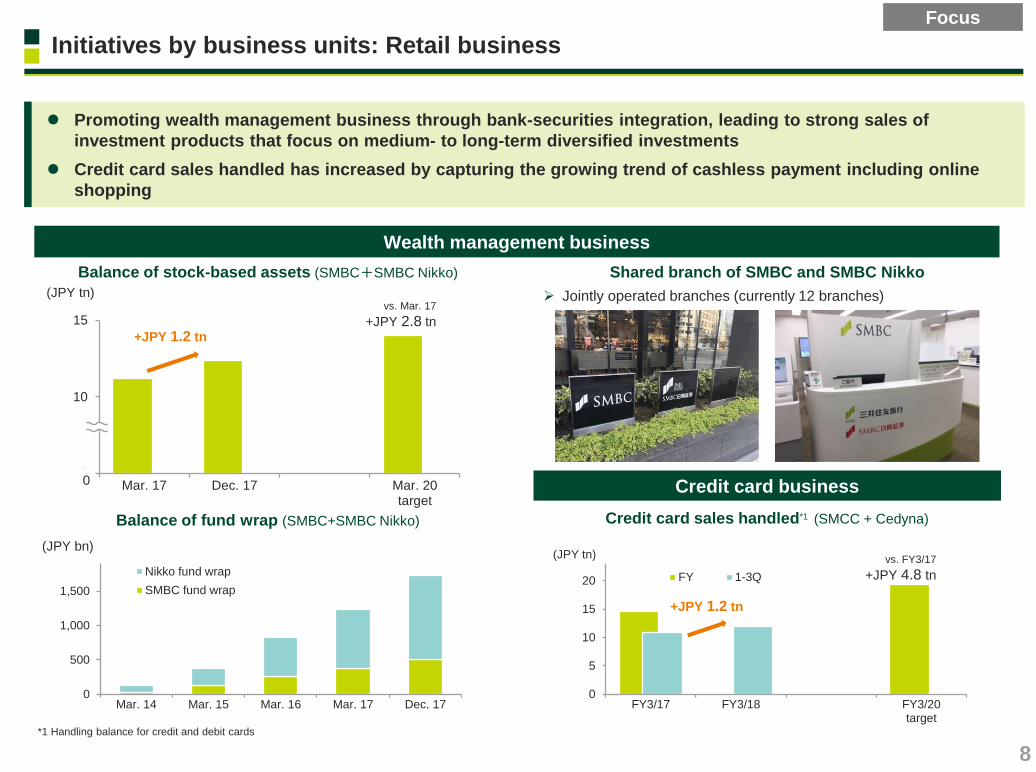
Initiatives by business units: Retail business
Promoting wealth management business through bank-securities integration, leading to strong sales of
investment products that focus on medium- to long-term diversified investments
Credit card sales handled has increased by capturing the growing trend of cashless payment including online
shopping
Wealth management business
Credit card business
*1 Handling balance for credit and debit cards
Focus
Shared branch of SMBC and SMBC Nikko
Jointly operated branches (currently 12 branches)
(JPY bn)
Credit card sales handled*1 (SMCC + Cedyna)
0
5
10
15
20
FY3/17 FY3/18 FY3/20target
(JPY tn)
FY 1-3Q
Balance of fund wrap (SMBC+SMBC Nikko)
Balance of stock-based assets (SMBC+SMBC Nikko)
5
10
15
Mar. 17 Dec. 17 Mar. 20target
(JPY tn)
0
vs. Mar. 17
+JPY 2.8 tn
vs. FY3/17
+JPY 4.8 tn
8
+JPY 1.2 tn
+JPY 1.2 tn
FY3/17 1-3QFY3/18
FY3/20target
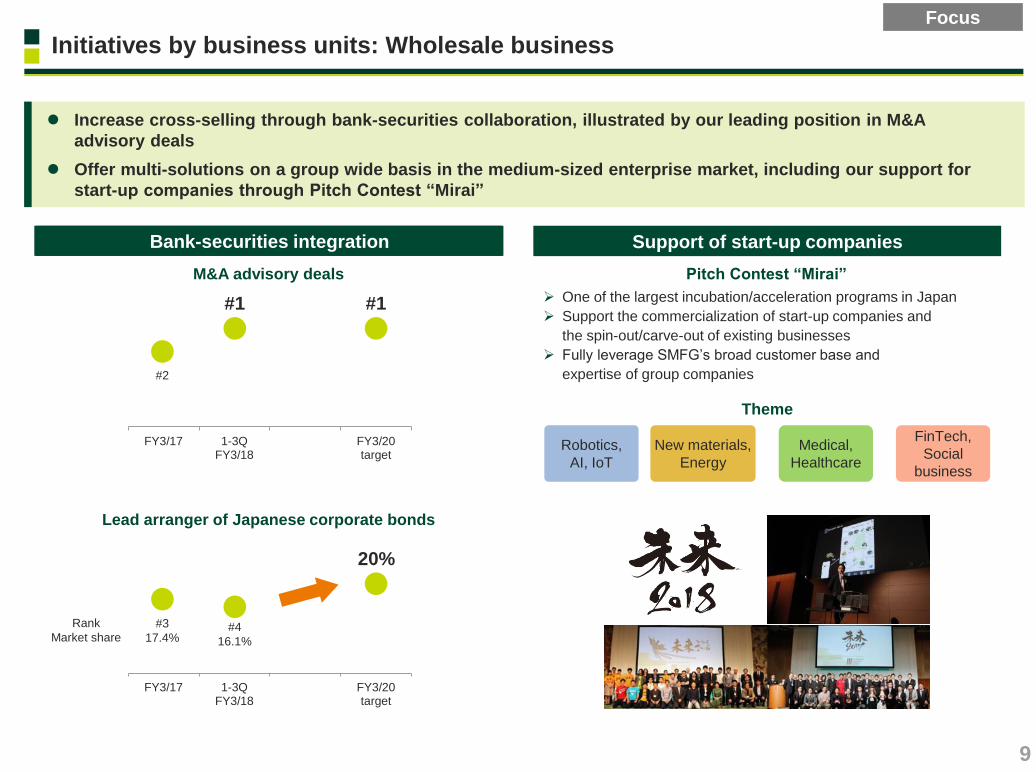
Initiatives by business units: Wholesale business
Increase cross-selling through bank-securities collaboration, illustrated by our leading position in M&A
advisory deals
Offer multi-solutions on a group wide basis in the medium-sized enterprise market, including our support for
start-up companies through Pitch Contest “Mirai”
Bank-securities collaboration*1 Lead arranger of Japanese corporate bonds
0
10
20
30
(Thousand) (Thousand)
0
2
4
6
8
Asset Management Investment banking
Focus
Bank-securities integration Support of start-up companies
FY3/17 1-3QFY3/18
FY3/20target
#4
16.1%
#3
17.4%
20%
Lead arranger of Japanese corporate bonds
M&A advisory deals
#1
#2
#1
Pitch Contest “Mirai”
One of the largest incubation/acceleration programs in Japan
Support the commercialization of start-up companies and
the spin-out/carve-out of existing businesses
Fully leverage SMFG’s broad customer base and
expertise of group companies
FinTech,
Social
business
Robotics,
AI, IoT
New materials,
Energy
Medical,
Healthcare
Theme
9
Rank
Market share

0
1
2
3
全体 Client-focused Credit-focused プロファイ・トレード
Initiatives by business units: International business
Promote cross-selling to targeted clients through bank-securities integration (Bond underwriting, FX,
derivatives, etc.)
Arranged multiple project bond transactions by leveraging our strong project finance capabilities
Portfolio of international business
*1 PF: Project Finance, TF: Trade Finance *2 Excludes up-front fees *3 Excludes deals issued by SMFG
Japanese/
non-Japanese
large corporate
clients
approx. 60%
High profit
assets:
approx. 20%
PF・TF*1:
approx. 20%
Target to allocate around 45% to high profit assets and
PF・ TF under disciplined operation
Average margin*2
PF・TF*1 IBU
Total
High profit
assets
Japanese/
non-Japanese
large corporate clients
(%)
Focus
Bank-securities integration
0
50
FY3/17 FY3/18 FY3/20target
FY 1H
Sharing account plans and prioritizing resources to targeted clients
Cross-selling multiple products including bonds, FX and derivatives
Providing JPY related solutions (Samurai bond, JPY sub debt)
Active book runner (Securities)*3
YoY
1.6x
(#) vs. FY3/17
1.5x
"Global Bank of the Year“ of 2017
from Project Finance International
Cross-selling to targeted clients
1-3Q
Bank
Securities
Project bond
By leveraging our strong project finance
capabilities, we served as active book
runners in multiple project bond deals
• Independent Water & Power Project
in UAE (Dec 2017)
• Wind farm project in India (Aug 2017)
0
500
1-3QFY3/17
1-3QFY3/18
Gross profit of non-Japanese
corporates (EMEA and the Americas)
(USD mn)
10

AI monitors transactions of
deposits/payments, etc
and compares them with
patterns that indicate
deterioration
Digitalization
Focus on businesses that can be monetized and lead to the generation and commercialization of new platforms
Started demonstration tests of new systems that utilize technologies such as blockchain and AI
Cross-boarder trade platform Detecting signs of credit deterioration
By blockchain and IoT, build a cross-boarder trade platform and
collaborate with companies from various industries
Settlement IoT Finance Added Value Data
analysis
exporter
(supplier)
forwarder
shipping
company
forwarder
importer
(buyer)
Cross-boarder trade platform
(blockchain)
Digitization of documents
Detect signs of our corporate customers’ credit deterioration earlier
than analyzing their financial statements by utilizing AI to monitor
transactions of deposits/payments, etc.
Our plan is to systematize this model in the next fiscal year
FY Next FY
Analyze Closing financial
statements
Earlier discovery
Detection
(after utilizing AI)
Detection
(Now)
Integration
AI monitoring system
11
Receive
financial statements

II 3Q, FY3/2018 performance

*1 Converted into USD at Dec. 2017 exchange rate of USD 1 = JPY 113.00 *2 Before provision for general reserve for possible loan losses *3 Ratio to full-year target *4 Includes JPY 200 bn of dividends from SMBC Nikko associated with making SMBC Nikko a direct subsidiary of SMFG *5 Excludes non-recurring losses *6 Excludes profit from overseas equity-method affiliates of SMBC Nikko (consolidated subsidiaries of SMFG)
(JPY bn) 1-3Q,
2017
FY3/18
target 1H,
FY3/18
YOY
change
Co
nso
lid
ate
d
Consolidated gross
profit 1,465.8 2,242.1 +68.3
General and
administrative expenses (894.6) (1,351.8) (6.6)
Overhead ratio 61.0% 60.3% (1.6)%
Equity in gains (losses)
of affiliates 30.2 40.1 +21.4
Consolidated
net business profit*2
601.3
930.4
<82%>*3
+83.1
1,130
Total credit cost (34.1) (51.9) +16.1 (210)
Gains (losses) on stocks 51.5 89.0 +47.2
Ordinary profit 615.5 959.5 +146.2 970
Profit attributable
to owners of parent
420.2
648.1
<103%>*3
+103.4
630
ROE 10.1% 10.3% +0.8%
No
n-c
on
so
lid
ate
d Gross banking profit 709.1 1,062.3 (211.4)
Expenses*5 (403.8) (606.5) +10.2
Banking profit*2 305.3 455.9 (201.2) 610
Total credit cost 25.5 35.2 +32.8 (80)
Ordinary profit 368.5 558.1 (116.3) 580
Net income 284.5 432.7 (110.5) 450
USD 19.8 bn *1
USD 3.8 bn *1
USD 4.0 bn *1
USD 4.9 bn *1
USD 8.5 bn *1
USD 9.4 bn *1
USD 8.2 bn *1
Domestic loan-to-deposit spread (Non-consolidated)
Reduction of strategic shareholdings (book value)
Reduction results in Apr.-Dec. 2017: approx. JPY 65 bn
Consent of sales from clients (outstanding) as of Dec. 2017:
approx. JPY 105 bn
*4
USD 5.7 bn *1
Consolidated gross profit increased mainly due to the strong
performance of investment product sales at SMBC Nikko and
continuous growth of the credit card and overseas businesses
General and Administrative expenses increased along with the
top-line growth of SMBC Nikko and SMCC. We will continue to
focus on cost control on a group-wide basis
Gains (losses) on stocks increased because of larger gains on
sales of strategic shareholdings
(%) FY3/18
1Q-3Q YoY
change 1Q 2Q 3Q
Interest earned on loans and bills
discounted 0.98 (0.08) 0.99 0.98 0.98
Interest paid on deposits, etc. 0.00 (0.01) 0.00 0.00 0.00
Loan-to-deposit spread 0.98 (0.07) 0.99 0.98 0.98
(Ref) Excludes loans to the Japanese government, etc. Interest earned on loans and bills
discounted 1.02 (0.10) 1.04 1.02 1.01
Loan-to-deposit spread 1.02 (0.09) 1.04 1.02 1.01
3Q, FY3/2018 performance
Income statement
Contribution of subsidiaries
to Profit attributable to owners of parent
13
(JPY bn) 1-3Q,
2017 (JPY bn)
1-3Q,
2017 YOY
change
YOY
change
SMBC Nikko*6 48 +23 SMCC 11 +0
SMBCCF 42 (4) SMAM 2 +1
SMFL 28 +4 SMBC Trust (5) +7
Cedyna 17 (6)
Per share information (Consolidated)
(JPY/Share) 1-3Q,
2017
FY3/18
target YOY change
Profit attributable
to owners of parent 459.53 +61.15 446.64
(JPY/Share) 1-3Q,
2017 Change from
Mar. 31, 2017
Net assets 7,485.80 +584.13

III Capital Policy

Sustainable growth
of corporate value
ROE target*2
7~8%
*1 Calculated with RWA inflated by 25% compared to the current level based on our May 2017 assumption of the
final impact of Basel III reforms
CET1: excludes net unrealized gains on other securities
RWA: excludes RWA associated with gains on stocks
CET1 ratio on a Basel III fully-loaded basis (including net unrealized gains on other securities)
exceeds CET1 ratio Post-Basel III reforms basis by about 4%
*2 On a stockholders’ equity basis
*3 Managerial accounting basis utilizing RWA calculated based on the final impact of Basel III reforms
Enhancing
shareholder returns
Investing
for growth
CET 1 ratio Target*1: 10%
Progressive dividend policy
Payout ratio
Target 40%
Investment criteria
Fits with our strategy
ROE*3 of over 8% after
synergies and excluding
amortization of goodwill
Risk is manageable
Securing
financial soundness
Basic capital policy
Balance “securing financial soundness”, “enhancing shareholder returns”, and “investing for growth”
Adopt a progressive dividend policy and target payout ratio of 40%
We will lay out our updated capital policy in May 2018 after thorough consideration including discussions at the
board meeting
15

Common Equity Tier 1 capital ratio target (Post-Basel III reforms basis) is 10%
The Basel III reforms were finalized with a capital floor of 72.5%, which is higher than our original assumption of
70%. However, with the revisions being eased in areas including the CVA risk framework and operational risk,
we expect the final impact of RWA inflation against the current Basel III basis will be almost at the same level as
our original assumption (around 25% inflation) under the Medium-Term Management Plan
We expect to achieve the CET1 ratio target as planned with accumulation of retained earnings and control of RWA
8.3 9.0
[9.7]*3 [10.8]*3 11.9
13.5 12.2
Post-Basel III reforms basis*2
Accumulation of CET1 ratio
Accumulation of retained
earnings
+45 - 50 bp / year
Regional banks subsidiaries
turned into equity method
affiliates
around +30bp
SMFL turned into an equity
method affiliate
around +40bp
CET1 ratio
(%)
9.9 10.0 10.8
12
8
4
0
Target
10%
Basel III fully-loaded basis*1
Net unrealized
gains on other
securities
(JPY tn) Mar. 16 Mar. 17 Dec. 17
Risk-weighted assets
(RWA) [Excludes RWA associated
with net unrealized gains on
stocks]
65.9
70.6
71.3
CET1 capital (of which
net unrealized gains
on other securities)
7.90 (1.35)
8.68 (1.54)
9.67 (1.95)
12
8
4
0
更新済
Mar. 17 Dec. 17
88.8 [85.6]
89.5 [85.3]
8.68 (1.54)
9.67 (1.95)
( excl. net unrealized gains )
Capital position
*1 Based on the definition applicable for March 31, 2019 *2 CET1 excludes net unrealized gains on other securities. RWA excludes RWA associated with net unrealized gains on stocks. Based on the current estimation of the final impact of RWA inflation from the Basel III reforms *3 CET1 includes net unrealized gains on other securities. RWA includes RWA associated with net unrealized gains on stocks
RwA(株式含み益)
17/3
17,890 x 250% x 72.5% = 32,425.62 億円(3.2兆円)
17/12
22,940 x 250% x 72.5% = 41,578.75億円(4.1兆円)
( March 2019 definition )
[incl. net unrealized gains]*3
~Mar 2018
4Q,FY3/19
16
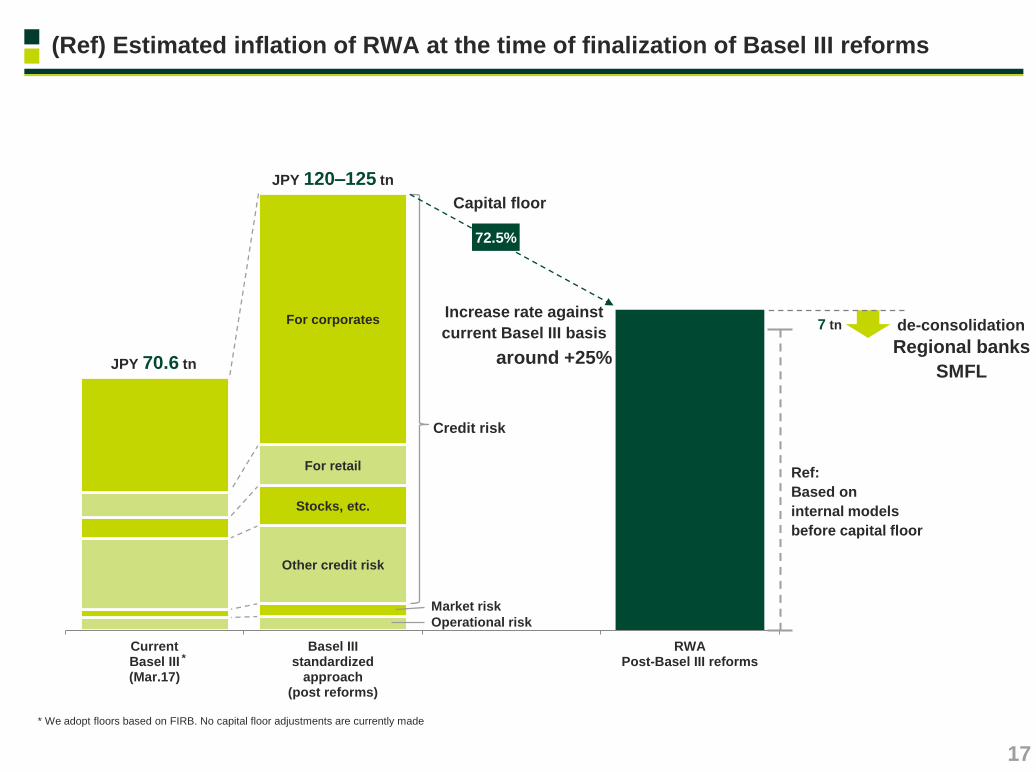
Other credit risk
Stocks, etc.
For retail
For corporates
CurrentBasel III(Mar.17)
Basel IIIstandardized
approach(post reforms)
RWAPost-Basel III reforms
JPY 70.6 tn
JPY 120–125 tn
Ref:
Based on
internal models
before capital floor
Capital floor
Credit risk
72.5%
Market risk
Operational risk
*
Increase rate against
current Basel III basis
around +25%
(Ref) Estimated inflation of RWA at the time of finalization of Basel III reforms
* We adopt floors based on FIRB. No capital floor adjustments are currently made
17
Regional banks
SMFL
de-consolidation 7 tn

Sep. 15 Mar. 16 Mar. 17 Dec. 17
CET1 (Basel III fully-loaded basis, excluding net unrealized gains on other securities)
Book value of domestic listed stocks within other securities
Ratio of stocks to CET1 capital
To 14% by
around 2020
Strategic shareholdings and reduction plan (Consolidated basis)
* SMFG consolidated basis: Book value of domestic listed stocks/CET1 capital (Basel III fully-loaded basis, excluding net unrealized gains on other securities)
(JPY tn)
Reduce the ratio by half
within 5 years
Toward a level
appropriate for
G-SIFIs
Reduction plan
(announced Nov. 2015) 28%
Aim to halve the ratio* of stocks to CET1 during the five years starting from the end of Sep. 2015
– Reduce the book value of domestic listed stocks of up to about 30%, or about JPY 500 bn (JPY 100 bn per year)
– Continue to execute sales and get consent of sales from clients to achieve the full-year target of JPY 100 bn reduction
Strategic shareholdings
6.40 6.55 7.14
27% 24%
1.80 1.69 1.79
7.73
21%
1.62
Reduction results for Apr.– Dec. 2017
approx. JPY 65 bn
(Total reduction from Sep. 2015– Dec. 2017 :
approx. JPY 180 bn)
Consent of sales from clients
(outstanding, Dec. 2017)
approx. JPY 105 bn
(Aggregated amount since Sep. 2015 :
approx. JPY 290 bn)
18
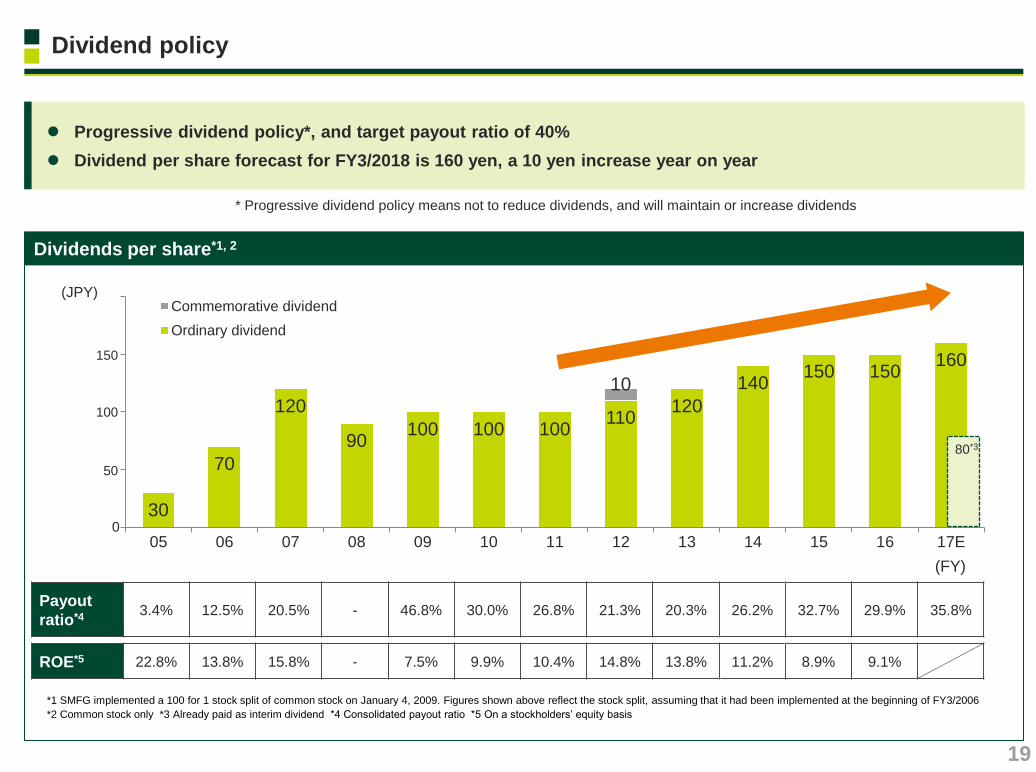
*1 SMFG implemented a 100 for 1 stock split of common stock on January 4, 2009. Figures shown above reflect the stock split, assuming that it had been implemented at the beginning of FY3/2006
*2 Common stock only *3 Already paid as interim dividend *4 Consolidated payout ratio *5 On a stockholders’ equity basis
(FY)
Payout
ratio*4 3.4% 12.5% 20.5% - 46.8% 30.0% 26.8% 21.3% 20.3% 26.2% 32.7% 29.9% 35.8%
ROE*5 22.8% 13.8% 15.8% - 7.5% 9.9% 10.4% 14.8% 13.8% 11.2% 8.9% 9.1%
Dividends per share*1, 2
30
70
120
90 100 100 100
110 120
140 150 150
160
10
05 06 07 08 09 10 11 12 13 14 15 16 17E
Commemorative dividend
Ordinary dividend
(JPY)
150
100
50
0
Dividend policy
Progressive dividend policy*, and target payout ratio of 40%
Dividend per share forecast for FY3/2018 is 160 yen, a 10 yen increase year on year
*3
19
80*3
* Progressive dividend policy means not to reduce dividends, and will maintain or increase dividends

Making good progress in the Medium-Term Management Plan that
focuses on efficiency to become a financial group with high quality
We have been implementing concrete measures such as transformation of
business and asset portfolio, accelerating Group-wide collaboration and
promoting digitalization.
The bottom-line profit for 3Q, FY3/2018 reached 103% of the full-year target.
The full-year target remains unchanged against potential deterioration of the
business environment.
We expect to achieve the CET1 ratio target as planned with accumulation of
retained earnings and our continued efforts to control RWA.
We will lay out our updated capital policy in May 2018.
Key takeaways
20
Appendix

Japan Research Institute 100% Other business
100% Securities Services
SMBC Aviation Capital
60%
30%
40%
10%
Leasing
60%
Sumitomo Mitsui Card
Cedyna
SMBC Consumer Finance
100%
66%
100%
100%
34%
Consumer Finance
SMFG Card & Credit
Sumitomo Corporation
NTT docomo
60%
【No. of accounts: approx. 2.8 mn】
【No. of card holders: approx. 26 mn】
【No. of existing customers: approx. 17 mn】
【No. of accounts of unsecured loans : approx. 1.3 mn】
Became a wholly-owned subsidiary in May 2011
Became a wholly-owned subsidiary in Apr. 2012
Sumitomo Mitsui Financial Group
100%
JPY 204 tn Consolidated total assets
13.11 % Consolidated Common Equity Tier 1 capital ratio
JPY 166 tn Assets
JPY 107 tn Deposits
JPY 76 tn Loans
approx. 28 mn No. of retail accounts
approx. 82,000 No. of corporate loan clients
Sumitomo Mitsui Banking Corporation
SMBC Trust Bank 100% Became a wholly-owned subsidiary in Oct. 2013
SMFL Capital*2
100%
Sumitomo Mitsui Finance and Leasing
Merged with SMBC Friend in Jan. 2018
Sumitomo Mitsui Asset Management Became a subsidiary in Jul. 2016
SMBC Nikko Securities Became a wholly-owned subsidiary in Oct. 2009
Moody’s S&P Fitch R&I JCR
A1/P-1 A-/ - A/F1 A+/ - AA-/ -
Credit ratings
Moody’s S&P Fitch R&I JCR
A1/P-1 A/A-1 A/F1 AA-/a-1+ AA/J-1+
Credit ratings
Acquired Citibank Japan’s retail banking business in Nov. 2015
Reorganization of leasing business – SMFG and Sumitomo Corp will
respectively own 50% of SMFL
– SMBC AC ownership will change to SMBC 32%, SMFL 68%
– Both SMFL and SMBC AC will become SMFG’s equity method affiliates
– SMFL Capital will merge with SMFL
Target : Jan.-Mar.2019
Group structure*1
*1 As of Sep. 30, 2017 for figures *2 Changed name from GE Japan GK to SMFL Capital Company, Limited in Sep. 2016
22

10.3 10.0
8.9 8.8 8.6
6.7
5.9
0
2
4
6
8
10
12
14
0.99
0.88
0.82
0.6
0.8
1.0
SMFG MUFG Mizuho FG
(%)
Proportion of loans to individuals & SMEs
63.2% 62.7% 59.3%
0.0
Peer comparison
Domestic loan-to-deposit spread*2
*1 Based on each company’s disclosure. 3Q, FY3/18 results for SMFG, MUFG, 1H, FY3/18 results for Mizuho FG, and FY12/17 results for others *2 1H, FY3/18 results. Based on each company’s disclosure. The figures shown in the graph are: non-consolidated figures of SMBC for SMFG, non-consolidated figures of The Bank of Tokyo-Mitsubishi
UFJ for MUFG, and non-consolidated figures of Mizuho Bank for Mizuho FG 23
ROE*1
(%)
備忘:Citi、BarclaysはROEマイナスだったので、
削除。次回以降戻す

ROE
In order to comply with regulations, accumulation of capital will be prioritized for the time being.
However, we will secure at least 7% of ROE. In addition, by steadily enacting initiatives of the Medium-Term
Management Plan, we will pursue upsides when business environment including regulations turns favorable
Steadily increase bottom-line profit despite expected profit decline due to structural factors
ROE*1 Net income
FY3/2017 FY3/2020
S&T
International
RT bank
securities
WS non-
interest
600
(JPY bn)
*3 Effects of negative interest rates, decline of domestic loan spreads and higher foreign
currency funding costs
Structural
factors*3 500
600
FY3/2017 FY3/2020
*1 On a stockholders’ equity basis
*2 Excluding special factors, such as the effects of implementing the consolidated corporate-
tax system
7%
8% 7.8%
After eliminating
special factors*2
Pursue upsides when
business environment
turns favorable
Bottom line
Financial targets
7–8%
After eliminating
special factors*2
24

Overhead ratio
Improve productivity on a group-wide basis and start reducing the overhead ratio
Establish downward trend of overhead ratio and aim at around 60% at the earliest opportunity after FY3/2020
Overhead ratio Changes in expenses
(JPY bn)
FY3/2017 FY3/2020
1,812.4
Effects of
initiatives
Costs for past
investments and
revenue-linked
variable cost
Strategic
investments /
investments for
optimization
Reorganization of
regional bank
subsidiaries
(80)
(50)
Mid- to long-term
effects
(100) plus 1,900
1,800
0
(%)
Impact including acquisition
of Citibank Japan’s retail
banking business
Improvement over
FY3/2017
Down to 60% at
the earliest
opportunity
0
55.7
Previous
Mid-Term
Plan
FY3/2014 FY3/2017 FY3/2020
62.1
New
Mid-Term
Plan
54.2
55
60
25

Projections by business unit
Notes:
1 ROE for each unit is managerial accounting basis with RWA calculated assuming Basel III reforms are finalized. ROE for the International Business Unit excludes the mid- to long-term foreign
currency funding costs. ROE for the Global Markets Business Unit does not include interest-rate risk associated to the banking account. The objectives on RWA written in the three year plan are
determined based on the current regulation
2 FY3/2017 comparison for ROE is image of three-year developments of ROE from FY3/2017 estimates when formulating the Medium-Term Management Plan
3 FY3/2017 comparisons for ROE and Net business profit are after adjustments for interest rate and exchange rate impacts
4 FY3/2017 results for each unit are managerial accounting basis, pursuant to current regulation
ROE
Net business profit (JPY bn)
RWA
(JPY tn)
FY3/2020
target
FY3/2020
target
FY3/2017
[of which
credit RWA]
FY3/2017
comparison Three year plan
FY3/2017
comparison
Retail 7%
Expenses will initially increase due to initiatives such as
branch reorganization. The cost reduction effects of
the initiatives and the merger of SMBC Nikko and SMBC
Friend will appear in the latter of the period
Reduce overall RWA while strengthening businesses
such as credit cards and consumer finance
285 +15 13.6
[12.8]
Wholesale 10%
While net business profit will increase by strengthening
securities business, etc, net income will slightly
decrease with the normalization of credit costs
Reduce RWA through sales of strategic shareholdings
475 +10 20.8
[20.4]
International 9%
Expenses will initially increase with costs of past
investments and strategic investments in the securities
business, but in the latter of the period, profits will
increase by generating returns on the
investments/initiatives that have been made
Reduce the growth rate of RWA in three years by half
compared to the previous three years (+22%). Control
the increase in the latter of the period
415 +50 21.9
[20.4]
Global
Markets 39%
Increase in profit is expected by enhancing the Sales &
Trading business
Reduce RWA through nimble portfolio management 335 +20
6.9
[4.6]
26

(JPY bn) FY3/17*1 1H,
FY3/18 1H,
FY3/17*1
YOY
change*2
Retail
Business Unit
Gross profit 628.2 1,288.9 633.0 +21.3
Expenses (514.8) (1,015.4) (506.1) (4.2)
Overhead ratio 82.0% 78.8% 80.0% (2.1)%
Others 3.3 12.2 5.6 +2.4
Net business profit 116.6 285.7 132.5 +19.5
ROE*3, 4 - - 6.5% -
RWA (JPY tn) *3, 5 - - 13.5 -
Wholesale
Business Unit
Gross profit 371.7 775.6 362.0 (11.6)
Expenses (166.2) (346.7) (171.0) (1.6)
Overhead ratio 44.7% 44.7% 47.2% +1.9%
Others 20.1 44.1 23.8 +4.2
Net business profit 225.6 473.0 214.8 (9.0)
ROE*3, 4 - - 10.4% -
RWA (JPY tn) *3, 5 - - 20.0 -
International
Business Unit
Gross profit 259.2 585.8 311.0 +17.5
Expenses (112.3) (251.9) (139.2) (9.7)
Overhead ratio 43.3% 43.0% 44.8% +0.6%
Others 21.6 30.2 30.3 +15.1
Net business profit 168.4 364.1 202.1 +22.9
ROE*3, 4 - - 10.4% -
RWA (JPY tn) *3, 5 - - 22.3 -
Global Markets
Business Unit
Gross profit 203.1 346.6 196.4 (8.0)
Expenses (25.6) (50.3) (26.6) 0.0
Overhead ratio 12.6% 14.5% 13.5% +0.5%
Others 3.4 8.1 8.5 +1.9
Net business profit 181.0 304.4 178.3 (6.1)
ROE*3, 4 - - 35.9% -
RWA (JPY tn) *3, 5 - - 7.0 -
Gross profit, ROE and RWA by group-wide business units
*1 Figures for FY3/17 were adjusted retrospectively in the Business Unit basis which was introduced in FY3/18 *2 After adjustments of interest rates and exchange rates, etc. *3 Preliminary figure *4 ROE for each unit is managerial accounting basis with RWA calculated assuming Basel III reforms are finalized. ROE for the International Business Unit excludes the mid- to long-term foreign currency funding costs. ROE for the Global Markets Business Unit does not include interest-rate risk associated to the banking account *5 RWA is calculated based on Basel III transitional basis 27

5
10
15
20
25
FY3/17 1-3QFY3/18
FY3/20target
5
10
15
20
25
FY3/17 1-3QFY3/18
FY3/20target
0
50
FY3/17 FY3/18 FY3/20target
FY 1-3Q
0
100
200
300
FY3/17 FY3/18 FY3/20target
FY 1-3Q
0
500
FY3/17 FY3/18 FY3/20target
FY 1-3Q
0
5
10
15
Mar. 17 Dec. 17 Mar. 20target
vs. Mar. 17
+JPY 2.8 tn
0
10
20
30
40
50
FY3/17 1-3QFY3/18
FY3/20target
0
5
10
15
20
FY3/17 FY3/18 FY3/20target
FY 1-3Qvs. FY3/17
+JPY 4.8 tn
(SMBC+SMBC Nikko) (SMCC+Cedyna) (SMBC)
5
10
15
20
25
FY3/17 1-3QFY3/18
FY3/20target
#4
16.1%
#3
17.4%
20% #1
#2
#1
#4 #4
#1
(JPY tn)
(USD mn)
(JPY bn)
(JPY tn) (%)
0
1
2
Mar. 17 Dec. 17 Mar. 20target
vs. Mar. 17
+JPY 190 bn
(JPY tn)
Balance of stock-based assets Credit card sales handled Utilization rate for digital
channels Balance of card loans
Lead arranger of Japanese
corporate bonds (league table)
Lead arranger of IPO deals
(league table)
M&A advisory deals
(league table) S&T profits
Non-asset based profit (Asia) Active book runner (Securities) Distribution amount
vs. FY3/17
+23%
Retail
Wholesale
International
Global Markets
O&D
0
1
2
FY3/17 FY3/18 FY3/20target
FY 1-3Q(#)
vs. FY3/17
+JPY 65 bn
(JPY tn) vs. FY3/17
1.5x vs. FY3/17
1.5x
vs. FY3/17
+15%
KPI
28
Rank
Market share

*6
17/9P 更新不要
Breakdown of gross profit
Breakdown of consolidated gross profit by business units*1
Breakdown of consolidated gross profit by accounting items
*1 Managerial accounting basis *2 Sum of SMBC, SMBC Europe, SMBC (China) and SMBC Trust *3 Sum of domestic income on loans and deposits for both yen and foreign currencies *4 After adjustments of interest rates and exchange rates, etc. *5 Numbers excluding SMBC are rounded *6 Includes JPY200bn of dividends from SMBC Nikko (2Q, FY3/17. eliminated in SMFG consolidated figures)
FY3/17 1H,
FY3/18 YOY
change*4
Wealth management business 320.8 170.3 +14.1
Credit card business 365.5 184.2 +6.1 Non-consolidated income on loans
(excl. consumer finance) 160.0 73.2 (6.9)
Domestic card loans 258.7 134.5 +6.8
Consumer finance business 287.1 150.6 +9.7
Retail Business Unit 1,288.9 633.0 +21.3
S
M
B
C
Income on loans 183.8 90.3 (2.4)
Money remittance, electronic banking 62.7 31.8 +0.4
Foreign exchange 37.9 20.0 +1.6
Loan syndication 48.7 22.1 +2.5
Structured finance 35.2 7.3 (13.0)
Security business 93.7 35.6 (7.9)
Leasing business 116.5 61.3 +9.4
Wholesale Business Unit 775.6 362.0 (11.6)
Asset related income*2 378.4 205.9 +7.9
Loan related fees*2 108.6 49.0 +0.5
Security business 37.7 18.5 (0.8)
Aircraft leasing 46.8 23.7 +0.0
International Business Unit 585.8 311.0 +17.5
SMBC’s Treasury Unit 272.4 156.3 (9.3)
Global Markets Business Unit 346.6 196.4 (8.0)
Consolidated gross profit 2,920.7 1,465.8 +48.3
SMBC’s domestic income on loans and deposits*3 493.5 236.3 (7.8)
International Business Unit’s income on loans and deposits*2 249.9 131.4 +4.6
of which:
of which:
of which:
of which:
of which:
of which:
of which:
of which:
FY3/17 1H,
FY3/18 YOY
change*4
Consolidated gross profit 2,920.7 1,465.8 +48.3
Net interest income 1,358.6 708.1 +47.5
SMBC 1,138.9 480.6 (159.3)
SMBCCF 163.0 85.0 +5.0
Trust fees 3.8 1.9 +0.2
Net fees and commissions 1,013.3 484.6 +20.5
SMBC 348.9 144.0 (7.9)
SMCC 203.0 96.0 +7.0
SMBC Nikko 176.0 85.0 +7.0
Cedyna 117.0 53.0 (1.0)
SMBCCF 66.0 35.0 +3.0
Net trading income + Net other operating income
545.0 271.2 (20.0)
SMBC 173.9 83.5 (37.9)
SMFL 149.0 81.0 +15.0
SMBC Nikko 148.0 79.0 +9.0
of which:
of which:
of which:
29

Gains (losses) on bonds
Gains (losses) on bonds (Non-consolidated)
Interest rate, stock price, and exchange rate
要更新 17/9P
Exchange rate JPY / USD Nikkei Stock Average Interest rate of JGB, US Treasury, and Bund
(1)
0
1
2
3
4
5 10Y US Treasury yields
10Y JGB yields
10Y German Bund yields
(%)
70
80
90
100
110
120
130
(JPY/USD)
10,000
12,000
14,000
16,000
18,000
20,000
22,000
24,000
(JPY)
(JPY bn) FY3/17 1H,
FY3/18 YOY
Change
Gains (losses) on bonds 43.7 19.7 (38.3)
Domestic operations 8.2 6.4 (12.0)
International operations 25.5 13.4 (26.4)
FY3/15 FY3/16 FY3/17 FY3/18 FY3/15 FY3/16 FY3/17 FY3/18 FY3/15 FY3/16 FY3/17 FY3/18
30

(JPY bn) 1H,
FY3/18 YOY change
Expenses (894.6) (12.6)
Overhead ratio 61.0% (1.2)%
(JPY bn) 1H,
FY3/18 YOY change
SMBC*2 (403.8) (1.8)
SMBC Nikko (125.0) (5.0)
SMCC (83.0) (5.0)
Cedyna (57.0) +1.0
SMBCCF (53.0) (2.0)
SMFL (43.0) (6.0)
SMBC Trust (25.0) +0.0
SMAM (8.0) (4.0)
By company (major Group companies)*1
Consolidated
他社経費率の算出 ・外銀⇒SMBC日興 ・邦銀⇒ SMBC日興 or 手許(連結経費[MUFGのみ決算短信(傘下銀行の臨時処理分を含む)参照]÷連結粗利益。 各社プレゼン資料に記載された経費率は、各々定義が異なる為、使用せず)
Overhead ratio comparison*3
17/9P 更新不要?
Expenses
*1 Numbers excluding SMBC are rounded *2 Excludes non-recurring losses *3 Consolidated basis. Based on each company’s disclosure. G&A expenses (for Japanese banks, includes non-recurring losses of subsidiary banks) divided by top-line profit (net of insurance claims). 3Q, FY3/18 results for SMFG, MUFG and Mizuho FG. FY12/17 results for others 31
58 59 60
63
68 69 69
73
77
0
10
20
30
40
50
60
70
80
90
100
(%)

(JPY bn) FY3/17
results
FY3/18
target 1H,
FY3/18
results
YOY
change
Consolidated
net business profit*2 1,132.9 601.3 1,130 (2.9)
Total credit cost (164.4) (34.1) (210) (45.6)
Ordinary profit 1,005.9 615.5 970 (35.9)
Profit
attributable to
owners of parent
706.5 420.2 630 (76.5)
Banking profit*2 846.7 305.3 610 (236.7)
Total credit cost (61.1) 25.5 (80) (18.9)
Ordinary profit 864.0 368.5 580 (284.0)
Net income 681.8 284.5 450 (231.8)
Per share dividend (JPY) 150 80 160 +10
Assumptions of earnings target*4
FY3/17
actual
FY3/18
estimate
3M TIBOR 0.06% 0.06%
Federal funds target rate 1.00% 1.25%
Exchange
rate
JPY/USD 112.19 110.00
JPY/EUR 119.84 125.00
Co
ns
oli
da
ted
N
on
-co
ns
oli
date
d
Consolidated net business profit
Expected to earn almost the same level as FY3/17
by increasing non-interest income and expanding the
overseas business in spite of impacts from the
declining interest rates and declining spreads of
domestic loans
Total credit cost
The full-year target remains unchanged against the
continuing uncertain market environment though the
pace of total credit cost recorded in the first half was
lower than our target
Profit attributable to owners of parent
The full-year target remains unchanged against
potential deterioration of the business environment in
spite of the high progress rate in the first half
USD 10.1 bn *1
USD 7.7 bn *1
USD 6.1 bn *1
USD 7.5 bn *1
USD 6.3 bn *1
USD 9.0 bn *1
revised from original assumption
of EUR 1 = JPY 115.00
*3
*3
*3
要更新? 17/9P
Earnings target for FY3/2018
*1 Converted into USD at Mar. 31, 2017 exchange rate of USD 1 = JPY 112.19 *2 Before provision for general reserve for possible loan losses *3 Includes JPY200 bn of dividends from SMBC Nikko (eliminated in SMFG consolidated figures) *4 (Ref) Nominal GDP growth rate: FY3/2017 result was +1.1%; FY3/2018 forecast estimated by Japan Research Institute was +1.6% as of May 2017,
+1.6% as of Nov.2017; Nikkei stock average: JPY18,909.26 as of Mar. 31, 2017, JPY 20,356.28 as of Sep. 30, 2017 32

Balance sheet
Consolidated B/S (Dec. 31, 2017) [vs. Mar. 31, 2017]
*1 Managerial accounting basis *2 Global Corporate Banking Division *3 Sum of Corporate Banking Division and SMEs covered by Retail Banking Unit *4 After adding back the portion of housing loans securitized in 1-3Q, FY3/18 of approx. JPY 220 bn *5 Other securities *6 Non-consolidated *7 Sum of SMBC, SMBCE and SMBC (China) *8 Including NCD *9 Including CDs and CP *10 Sum of loans, trade bills and securities of Marketing units *11 Includes deposit placed with central banks, etc.
Domestic loans outstanding
JPY 53.9 tn
By domestic Marketing units*1
Balance in the BOJ’s current
account
Dec. 31, 2017 JPY 37.9 tn
Spread-based (repriced within 1 year)
47%
Prime-rate-based
5%
Prime-rate-based (consumer)
17%
Others (Loans denominated
in foreign currencies,
overdraft, etc.)
19%
Spread-based (more than 1 year)
12%
(JPY tn, at period-end) Dec.
2017 Change from
Mar. 2017
Large corporations*2 15.2 (0.4)
Mid-sized corporations
& SMEs*3 18.0 +0.4
Individuals 13.7 (0.1)
Non-consolidated
Non-consolidated
Consolidated
*4
Loans
81.9 [+1.7]
Deposits (includes NCD)
135.5 [+5.8]
Other liabilities
60.5 [+3.6]
Other assets
48.7 [+2.6]
Securities
25.8 [+1.2]
Total net assets 12.1 [+0.9]
Cash and due from banks
51.7 [+4.9]
Total assets 208.1 [+10.4]
(JPY tn)
Loan to deposit ratio 60.4 %
Domestic*6 53.9 [(0.6)]
Overseas*1,7 26.2 [+2.5]
Domestic*6,8 97.1 [+2.5]
Overseas*1,7,9 30.1 [+2.7]
Domestic deposits outstanding
JPY 91.0 tn
By type of depositor
Ordinary deposits
64% Time deposits
20%
Current deposits
10%
Others (Sundry deposits,
etc.) 3% Foreign currency
deposits 3%
(JPY tn) Mar.16 Mar.17 Dec.17
Total 82.1 87.7 91.0
Individuals 42.3 43.6 45.7
Corporates 39.8 44.1 45.3
Non-consolidated
Of which Stocks*5 JPY 4.2 tn
Of which JGBs*5 JPY 8.6 tn
Of which Foreign bonds*5 JPY 7.0 tn
(Ref) Non-JPY B/S items*1,7
SP
33
(USD bn)
Assets / Liabilities 450
Mid-to long-term
funding (incl. corporate bonds,
currency swaps, etc.)
CDs & CP
Interbank (incl. Repo)
Deposits
(incl. deposits
from central banks) Interest earning
assets*10
Others*11 (consists mainly of
highly liquid assets)
Foreign bonds, NCD
217
99
70
62 44
305
101

(JPY tn, %) 1H
FY3/18 YOY
change
Domestic loans (Non-consolidated) 53.0 +2.2
Excluding loans to the Japanese government, etc. and SMFG
49.9 +2.1
of which
Large corporations*5 15.6 +1.5
Mid-sized corporations & SMEs*6 17.2 +0.7
Individuals 13.9 (0.3)
IBU’s interest earning assets*7, 8 (USD bn, %)
270.3 +28.0
*9
54.0 53.9
21.3 22.8
75.4 76.7
Dec.16 Dec.17
47.7 49.3 50.1 54.5
15.8 18.9 19.2
21.1 63.4
68.3 69.3 75.6
Jun.14 Mar.15 Mar.16 Mar.17
Overseas offices and offshore banking accounts
Domestic offices (excluding offshore banking account)
*1, 2 *1, 2 *1,2
[3.1]*3 [3.2]*3 [3.5]*3 [1.3]*3
(JPY tn)
(JPY tn, %) 1H
FY3/18 YOY
change
Domestic loans (Non-consolidated) 0.78 (0.06)
Excluding loans to the Japanese government, etc. and SMFG
0.83 (0.07)
of which
Large corporations*5 0.52 (0.07)
Mid-sized corporations & SMEs*6 0.71 (0.07)
Individuals 1.47 (0.02)
IBU’s interest earning assets*7, 8 (USD bn, %)
1.16 (0.06)
17/9 メリル 要更新 Loans
Loan balance (Non-consolidated) Domestic loan-to-deposit spread (Non-consolidated)
Average loan balance*4 Average loan spread*4
*1 Exchange rates using TTM as of Dec. 2016: USD 1 = JPY 116.49, EUR 1 = JPY 122.68, Mar. 2017: USD 1 = JPY 112.19, EUR 1 = JPY 119.84, and Dec. 2017: USD 1 = JPY 113.00, EUR 1 = JPY 134.99 *2 Includes balance of SMBC Canada Branch which was newly opened in Nov. 2016 and took over business of wholly-owned subsidiary SMBC of Canada *3 Of which loans to the Japanese government, etc. and SMFG *4 Managerial accounting basis *5 Global Corporate Banking Division *6 Sum of Corporate Banking Division and SMEs covered by Retail Banking Unit *7 Sum of SMBC, SMBC Europe and SMBC (China) *8 Sum of loans, trade bills, and securities *9 After adjustments for exchange rates, etc. 34
(%) FY3/18
1-3Q YoY
change 1Q 2Q 3Q
Interest earned on loans and
bills discounted 0.98 (0.08) 0.99 0.98 0.98
Interest paid on deposits, etc. 0.00 (0.01) 0.00 0.00 0.00
Loan-to-deposit spread 0.98 (0.07) 0.99 0.98 0.98
(Ref) Excludes loans to the Japanese government, etc.
Interest earned on loans and
bills discounted 1.02 (0.10) 1.04 1.02 1.01
Loan-to-deposit spread 1.02 (0.09) 1.04 1.02 1.01

Wholesale business
Loan balance of Wholesale Banking Unit*1, 2 Bank-securities collaboration*4
Domestic corporate loan spread*1, 3 League tables (1-3Q, FY3/2018)*5
*1 Managerial accounting basis. Excludes loans to the Japanese government, etc. *2 Quarterly average *3 Monthly average loan spread of existing loans *4 Accumulated no. of cases via referral / intermediary services from SMBC to SMBC Nikko *5 SMBC Nikko Securities for Global equity & equity-related and JPY denominated bonds. SMFG for Financial advisor and IPO. Source: SMBC Nikko, based on data from Thomson Reuters *6 Japanese corporate related only. Includes overseas offices *7 Consisting of corporate bonds, FILP agency bonds, municipality bonds for proportional shares as lead manager, and samurai bonds *8 Excludes REIT IPO. Includes overseas offices *9 Japanese corporate related only. Group basis
0
10
20
30
(Non-consolidated)
(Thousand) (Thousand)
12
14
16
1Q 2Q 3Q 4Q 1Q 2Q 3Q 4Q 1Q 2Q 3Q 4Q 1Q 2Q 3Q
(JPY tn)
Mid-sized corporations and SMEs (CBD*)
Large corporations (GLCBD*)
FY3/16 FY3/17 FY3/15
* CBD : Corporate Banking Division
* GLCBD : Global Corporate Banking Division
FY3/18
Dec. 17 0.4%
0.6%
0.8%
1.0%
1.2%
1.4%
Mar.14 Sep.14 Mar.15 Sep.15 Mar.16 Sep.16 Mar.17 Sep.17
Mid-sized corporations and SMEs (CBD, RTBU*)
Large corporations (GLCBD)
Apr. 14
Rank Mkt
share
Global equity & equity-related (book runner, underwriting amount)*6
#5 8.6%
JPY denominated bonds (lead manager, underwriting amount)*7
#4 16.9%
Japanese corporate bonds (lead manager, underwriting amount)
#4 16.1%
IPO (lead manager, No. of deals)*8 #4 14.8%
Financial advisor (M&A, No. of deals)*9 #1 5.6%
Financial advisor (M&A, transaction volume)*9 #5 9.1%
(Non-consolidated)
0
2
4
6
8
Asset Management Investment banking
* RTBU : SMEs covered by Retail Banking Unit
Increased due to
large M&A bridge loan
made at the end of Mar.17
35

Overseas business
Overseas loan balance (includes trade bills)*1, 2 Overseas deposit balance*1, 2
Overseas loan spread*1, 5
*1 Managerial accounting basis. Sum of SMBC, SMBC Europe and SMBC (China). *2 Converted into USD at respective period-end exchange rates *3 Year-on-year changes exclude impact of changes in local currency / USD *4 Includes balance of SMBC Canada Branch which was opened in Nov. 2016 and took over business of wholly-owned subsidiary SMBC of Canada *5 Monthly average loan spread of existing loans *6 Includes deposits from central banks *7 Bonds issued by SMFG and SMBC *8 Issued in overseas market. Targeting foreign institutional investors *9 TLAC bonds
75 82
80 89
53 61
208
232
Dec.16 Dec.17
[+18]
[+5]
[+8]
[+4] 70 74 71 75
54 62 72 84
47 45
52 53 172
181 195
211
Mar.14 Mar.15 Mar.16 Mar.17
EMEA
Americas
Asia
[YOY (exclude impact of changes in exchange rates) *3]
Dec. 17 0.4%
0.6%
0.8%
1.0%
1.2%
1.4%
Sep.08 Sep.09 Sep.10 Sep.11 Sep.12 Sep.13 Sep.14 Sep.15 Sep.16 Sep.17
Foreign currency
bonds outstanding*7
(USD bn)
Senior 32.9 44.1 40.7 51.5
Subordinated 4.1 4.1 4.0 4.1
[+29]
[+24]
[YOY (exclude impact of changes in exchange rates)*3]
[+4]
[+1]
Senior / Sub Issue Date Currency Amount (mn) Tenor Coupon
Senior (SMFG) *9 Jan, 17, 2018 USD
1,500
500
750
5y
5y
10y
3.102%
3mL+74bp
3.544%
Senior (SMBC) Jan. 17, 2018 USD 1,250
750
2y
2y
2.514%
3mL+35bp
108 121 153
180
80 76
70 58
18 12
17 7
Mar.14 Mar.15 Mar.16 Mar.17
CDs & CP : less than 3 months
CDs & CP : 3 months or more
Deposits
(USD bn) (USD bn)
162 191
57
63 11
13 229
266
Dec.16 Dec.17*4 *4 *4 *4 *4 *4
*6
• Increase of short-term trade financing
and loans to financial institutions
• Improved average obligor gradings of borrowers
Benchmark issues of foreign currency bonds*8 (since Jan. 2018)
206 210
240 244
36

NPLs and Total credit cost
NPLs and NPL ratio*1 Total credit cost and Total credit cost ratio*2
*1 NPL ratio = NPLs based on the Financial Reconstruction Act (excluding normal assets) / Total claims *2 Total credit cost ratio = Total credit cost / Total claims
37
17/9 メリル
Variances between Consolidated and Non-consolidated
(JPY bn) 1H
FY3/18
1H
FY3/18 YOY
change YOY
change
SMBCCF 42 +3 Cedyna 7 +1
SMCC 9 +3 others 2 (10)
Total 60 (3)
(JPY bn)
Total claims (top: Consolidated, bottom: Non-consolidated)
79 85 87 93 93 96
73 79 80 87 87 89
(JPY tn)
0.92
0.83
0.56 0.48
0.64% 0.54%
0.99% 0.87%
Dec.16 Dec.17
68.0 51.9
(2.4)
(35.2)
1-3QFY3/17
1-3QFY3/18
(49.1)
7.8
102.8
164.4
(123.9)
(80.1)
(3.2)
61.1
(6)bp
1bp
12bp
18bp
(17)bp
(10)bp
(0)bp
7bp
FY3/14 FY3/15 FY3/16 FY3/17
Conslidated
Non-consolidated1.37
1.17
0.99 0.93
0.88
0.77
0.62 0.57 1.74%
1.39%
1.15% 1.00%
1.21% 0.97%
0.78% 0.65%
Mar.14 Mar.15 Mar.16 Mar.17
(JPY tn) 千
Conslidated
Non-consolidated
Variances between Consolidated and Non-consolidated
(JPY bn) 1H, FY3/18 YOY change
Total 60 (3)
SMBCCF 42 +3
SMCC 9 +3
Cedyna 7 +1
of which:

0
5
10
15
20
25
30
35
Mar.02 Mar.03 Mar.04 Mar.05 Mar.06 Mar.07 Mar.08 Mar.09 Mar.10 Mar.11 Mar.12 Mar.13 Mar.14 Mar.15 Mar.16 Mar.17 Dec.17
(JPY tn)
More than 10 years
5 to 10 years
1 to 5 years
1 year or less
Non-consolidated
of which JGBs (JPY tn)
26.2 13.8 14.0 9.8 8.0 8.6
Average
duration (years)*1
2.7 3.6 3.4 2.3 1.5 1.7 2.4 1.8 1.1 1.4 1.9 1.8 1.1 1.8 2.8 2.9 2.4
Unrealized
gains (losses) (JPY bn)*2
37.6 108.7 (101.9) 7.7 (282.2) (151.4) (129.5) (1.2) 116.1 71.9 104.4 95.3 60.0 45.9 103.8 57.5 40.9
28.9
11.2
31.5
16.3 16.4
12.3 10.6
(Total balance of Other securities with maturities and bonds classified as held-to-maturity – total of JGBs, Japanese local government bonds and Japanese corporate bonds)
11.3
38
17/9P
Yen bond portfolio
*1 Excludes bonds classified as held-to-maturity, bonds for which hedge-accounting is applied, and private placement bonds. Duration of 15-year floating rate JGBs is regarded as zero. Duration at Mar. 02 is for JGB portfolio only *2 15-year floating-rate JGBs have been evaluated at their reasonably estimated price from Mar. 09

(JPY tn)
Mar. 2013 Mar. 2016 Mar. 2017 Dec. 2017
Balance sheet
amount
Net unrealized
gains (losses)
Balance sheet
amount
Net unrealized
gains (losses)
Balance sheet
amount
Net unrealized
gains (losses)
Balance sheet
amount
Net unrealized
gains (losses)
Yen-denominated bonds 30.4 0.17 13.2 0.13 11.4 0.07 11.9 0.05
of which JGB 27.0 0.12 10.3 0.08 8.5 0.03 9.0 0.01
Held-to-maturity 5.5 0.06 2.2 0.02 1.2 0.01 0.4 0.00
Others 21.5 0.06 8.1 0.06 7.3 0.02 8.6 0.01
Foreign bonds
(Other securities) 6.5 0.03 7.1 (0.11) 7.0 (0.12)
Yen-denominated bonds 28.9 0.16 12.3 0.12 10.6 0.06 11.3 0.04
of which JGB 26.2 0.11 9.8 0.07 8.0 0.03 8.6 0.01
Held-to-maturity 5.5 0.06 2.0 0.01 0.9 0.01 0.1 0.00
Others 20.7 0.06 7.8 0.06 7.1 0.02 8.5 0.01
Foreign bonds
(Other securities) 5.2 0.02 5.6 (0.10) 5.5 (0.11)
Co
ns
oli
da
ted
N
on
-co
ns
oli
date
d
Bond portfolio
39

Lowered interest rates
Ordinary deposits 0.001% since Feb. 16, 2016
Time deposits 0.01% since Mar. 1, 2016
Initiatives against inflow of large funds from
corporations (especially financial institutions)
Charge fees for correspondent accounts of
foreign banks
Foreign deposits; raised interest rates, launched
marketing campaigns
Increase sales of wrap accounts and low risk and
low return investment products
Strengthen commission business
Expand non-banking business
Initiatives to increase high value-added loans
by providing solutions
BOJ’s negative interest rate policy
Introduction of “Quantitative and Qualitative Monetary
Easing with a Negative Interest Rate” (Feb. 2016)*1
Introduction of “Quantitative and Qualitative Monetary
Easing with Yield Curve Control” (Sep. 2016)*2
“Yield curve control”
“Inflation-overshooting commitment”
JPY 208 tn
JPY 121 tn
JPY 25 tn
Dec. 2017
BOJ’s current
account balance
40
Initiatives for negative interest rate policy
Control deposit balance
Promote shifts from savings to asset building
Diversify revenue sources Initiatives to secure loan margin
*1 Source: The Bank of Japan (“Key Points of Today’s Policy Decisions” on Jan. 29, 2016) “BOJ Current Account Balances by Sector (Dec. 2017)” on Jan. 16, 2018 for BOJ’s current account balance *2 Source: The Bank of Japan (“New Framework for Strengthening Monetary Easing: “Quantitative and Qualitative Monetary Easing with Yield Curve Control” on Sep. 21, 2016)

2,920.7
1,465.8
0
500
1,000
1,500
2,000
2,500
3,000
3,500
FY3/03 FY3/04 FY3/05 FY3/06 FY3/07 FY3/08 FY3/09 FY3/10 FY3/11 FY3/12 FY3/13 FY3/14 FY3/15 FY3/16 FY3/17 FY3/18
FY 1H
FY3/03
1H,
FY3/18
SMBC’s domestic loan / deposit
related revenue 35% 18%
International business (banking)
5% 18%
Group companies 18% 47%
Breakdown of contribution to Gross profit
(JPY bn)
0.00% 0.00% 0.00%0.0
0.4
0.8
1.2
1.6
2.0
2.4
Mar. 11 Mar. 12 Mar. 13 Mar. 14 Mar. 15 Dec. 15
千
BOJ's policy interest rate
Proportion of
International Business Unit within
Consolidated net business profit:
34%
3-tier system for
BOJ’s account;
0.1% / 0% / (0.1)%
41
0.5%
0.1% 0.15%
Changes in our business mix
Consolidated Gross profit

Focus on Seven Core Business Areas
Concept Strategic Focus
Enhance Enhance business base in
domestic market
1 Hold the number one retail banking franchise in Japan
2 Build on our lead position in the Japanese medium-sized
enterprise market
3 Increase market share in Corporate & Investment
Banking in key global markets
Grow Sustainable growth of US/EU
businesses
Make Asia our second mother market
4 Establish a top-tier position in product lines where
we are competitive globally
5 Accelerate our “Asia-centric” strategy
Build Build our new strengths for
future growth
6 Strengthen sales & trading capability
7 Develop asset-light businesses:
trust banking and asset management
Dig
italiz
atio
n
42

SMBC Nikko
43
Financial results (consolidated) Product sales*4
Net operating revenue*3 Overseas business
*1 Includes profit from overseas equity-method affiliates of SMBC Nikko (consolidated subsidiaries of SMFG) etc. *2 Recorded loss of JPY 12.0 bn as extraordinary loss at SMBC Nikko in 2H, FY3/17 on restructuring and liquidation of business alliance with Barclays *3 Fund wrap fee was separated from “Others” and presented as “Fund wrap fee and agency commissions on investment trusts” from FY3/18 and FY 3/17 was adjusted retrospectively *4 Includes sale of fund wrap from FY3/18 *5 Managerial accounting basis. Overseas offices total is defined as the total of : ・ Earnings of SMBC Nikko’s consolidated subsidiaries: SMBC Nikko Securities (Hong Kong) and SMBC Nikko Securities (Singapore) ・ Earnings of SMBC Nikko’s affiliated companies: Securities Product Group of SMBC Nikko Capital Markets and SMBC Nikko Securities America *6 Excludes deals of SMFG as the issuer
(JPY bn) FY3/17 1-3Q
FY3/18 YOY
change
Net operating
revenue 326.7 262.5 +35.4
SG&A expenses (250.9) (193.0) (11.9)
Ordinary income*1 80.0 72.4 +23.8
Profit attributable to
owners of parent*1, 2 46.9 49.5 +23.2 0
1
2
3
4
1Q, FY3/17 2Q 3Q 4Q 1Q, FY3/18 2Q 3Q
(JPY tn) Variable annuities/insurances
Subscription of equities
Domestic bonds
Foreign bonds
Fund wrap
Investment trusts
0
20
40
60
80
100
120
1Q,FY3/17
2Q 3Q 4Q 1Q,FY3/18
2Q 3Q
(JPY bn)
0
2
4
6
1Q,FY3/17
2Q 3Q 4Q 1Q,FY3/18
2Q 3Q
0
50
FY3/17 FY3/18 FY3/20target
FY 1-3Q
Others
Net trading income
Underwriting commissions
Subscription commissions on investment trust, Fund
wrap fee and agency commissions on investment trusts
Equity brokerage commissions (JPY bn)
Active book runner (Securities)*6
Earnings of overseas
offices*5 (#)
SMBCCF
44
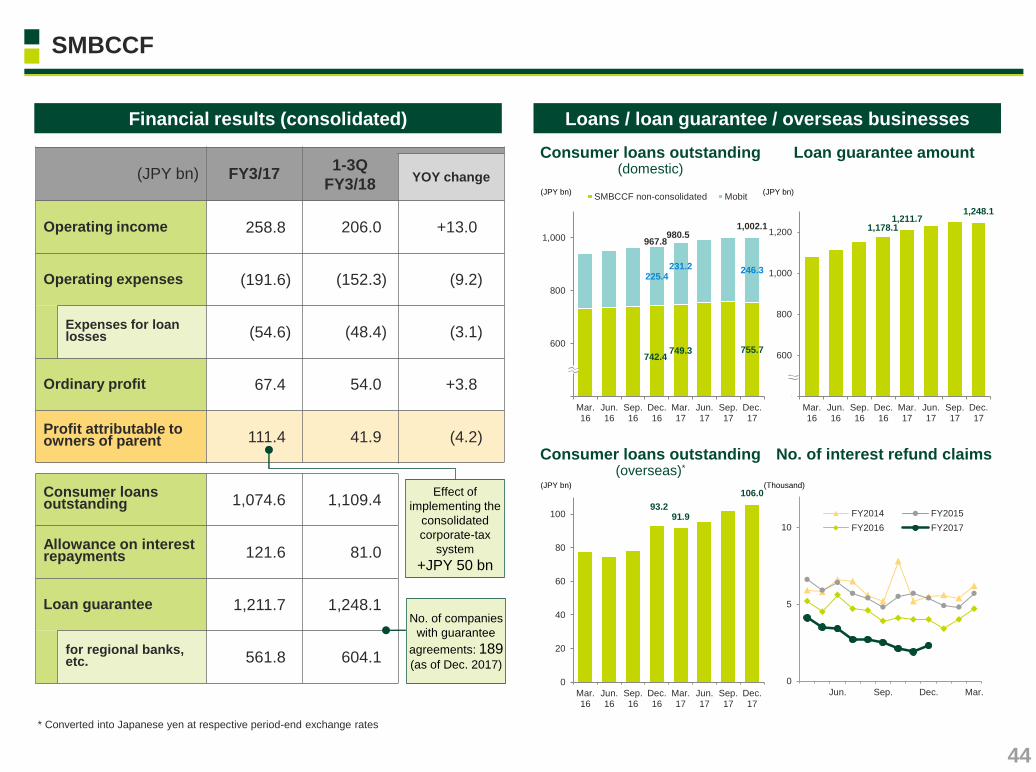
Financial results (consolidated) Loans / loan guarantee / overseas businesses
* Converted into Japanese yen at respective period-end exchange rates
Consumer loans outstanding (domestic)
Loan guarantee amount
No. of interest refund claims Consumer loans outstanding (overseas)*
0
5
10
Jun. Sep. Dec. Mar.
FY2014 FY2015
FY2016 FY2017
(JPY bn) FY3/17 1-3Q
FY3/18 YOY change
Operating income 258.8 206.0 +13.0
Operating expenses (191.6) (152.3) (9.2)
Expenses for loan losses (54.6) (48.4) (3.1)
Ordinary profit 67.4 54.0 +3.8
Profit attributable to owners of parent 111.4 41.9 (4.2)
Consumer loans outstanding 1,074.6 1,109.4
Allowance on interest repayments 121.6 81.0
Loan guarantee 1,211.7 1,248.1
for regional banks, etc. 561.8 604.1
No. of companies
with guarantee
agreements: 189 (as of Dec. 2017)
(JPY bn)
742.4 749.3 755.7
225.4 231.2 246.3
967.8 980.5
1,002.1
400
600
800
1,000
Mar.16
Jun.16
Sep.16
Dec.16
Mar.17
Jun.17
Sep.17
Dec.17
SMBCCF non-consolidated Mobit
1,178.1 1,211.7
1,248.1
400
600
800
1,000
1,200
Mar.16
Jun.16
Sep.16
Dec.16
Mar.17
Jun.17
Sep.17
Dec.17
93.2 91.9
106.0
0
20
40
60
80
100
Mar.16
Jun.16
Sep.16
Dec.16
Mar.17
Jun.17
Sep.17
Dec.17
(JPY bn)
(JPY bn)
(Thousand) Effect of
implementing the
consolidated
corporate-tax
system
+JPY 50 bn

0%
25%
50%
75%
100%
Total Asia Americas EMEA
Non-Japanese corporations and others (product type lending)Japanese corporations
165
181
195
211
227
0
50
100
150
200
250
Mar. 14 Mar. 15 Mar. 16 Mar. 17 Sep. 17
(USD bn)
Non-Japanese corporations and others(product type lending)Japanese corporations
45
*3
Overseas loan balance classified by borrower type*1
Total*2 By region (Sep. 2017)*2
Major marketing channels in Asia (Sep. 2017)*2
*1 Geographic classification based on booking office *2 Managerial accounting basis. Sum of SMBC, SMBC Europe and SMBC (China). Includes trade bills after Mar. 2015 *3 Sum of SMBC and SMBC Indonesia
0%
25%
50%
75%
100%
Hong Kong Sydney Singapore China Indonesia Bangkok Seoul
Non-Japanese corporations and others (product type lending)Japanese corporations

Hong Kong Singapore Australia
China Indonesia Thailand
India Taiwan Korea
0
400
800
1,200
1,600
2,000
Mar.14 Mar.15 Mar.16 Mar.17 Sep.17
(JPY bn)
0
400
800
1,200
1,600
2,000
Mar.14 Mar.15 Mar.16 Mar.17 Sep.17
(JPY bn)
0
400
800
1,200
1,600
2,000
Mar.14 Mar.15 Mar.16 Mar.17 Sep.17
(JPY bn)
0
200
400
600
800
1,000
Mar.14 Mar.15 Mar.16 Mar.17 Sep.17
(JPY bn)
0
200
400
600
800
1,000
Mar.14 Mar.15 Mar.16 Mar.17 Sep.17
(JPY bn)
0
200
400
600
800
1,000
Mar.14 Mar.15 Mar.16 Mar.17 Sep.17
(JPY bn)
0
200
400
600
800
1,000
Mar.14 Mar.15 Mar.16 Mar.17 Sep.17
(JPY bn)
0
200
400
600
800
1,000
Mar.14 Mar.15 Mar.16 Mar.17 Sep.17
(JPY bn)
0
200
400
600
800
1,000
Mar.14 Mar.15 Mar.16 Mar.17 Sep.17
(JPY bn)
46
Loan balance in Asian countries/areas *1, 2
*1 Geographic classification based on borrowers’ domicile *2 Managerial accounting basis. Sum of SMBC, SMBC Europe, SMBC (China) and SMBC Indonesia. Loan balances are translated into JPY from each country’s local currency at the exchange rate of Sep. 30, 2017
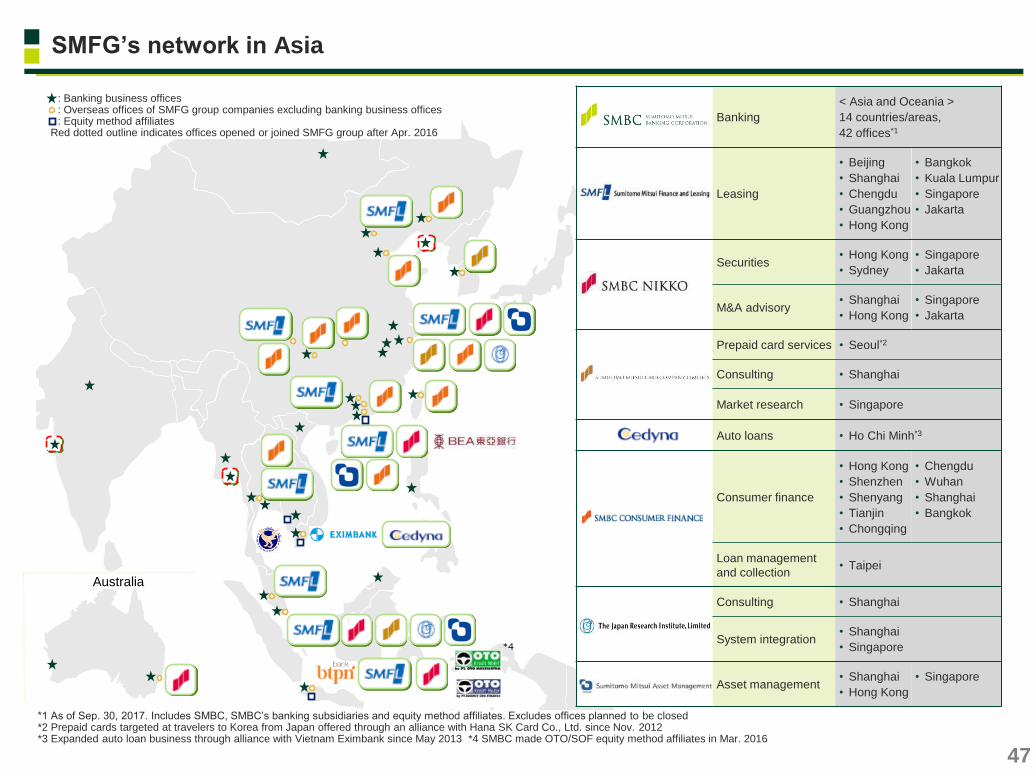
SMFG’s network in Asia
Australia
*4
: Banking business offices : Overseas offices of SMFG group companies excluding banking business offices : Equity method affiliates Red dotted outline indicates offices opened or joined SMFG group after Apr. 2016
Banking
< Asia and Oceania >
14 countries/areas,
42 offices*1
Leasing
• Beijing
• Shanghai
• Chengdu
• Guangzhou
• Hong Kong
• Bangkok
• Kuala Lumpur
• Singapore
• Jakarta
Securities • Hong Kong
• Sydney
• Singapore
• Jakarta
M&A advisory • Shanghai
• Hong Kong
• Singapore
• Jakarta
Prepaid card services • Seoul*2
Consulting • Shanghai
Market research • Singapore
Auto loans • Ho Chi Minh*3
Consumer finance
• Hong Kong
• Shenzhen
• Shenyang
• Tianjin
• Chongqing
• Chengdu
• Wuhan
• Shanghai
• Bangkok
Loan management
and collection • Taipei
Consulting • Shanghai
System integration • Shanghai
• Singapore
Asset management • Shanghai
• Hong Kong
• Singapore
47
*1 As of Sep. 30, 2017. Includes SMBC, SMBC’s banking subsidiaries and equity method affiliates. Excludes offices planned to be closed *2 Prepaid cards targeted at travelers to Korea from Japan offered through an alliance with Hana SK Card Co., Ltd. since Nov. 2012 *3 Expanded auto loan business through alliance with Vietnam Eximbank since May 2013 *4 SMBC made OTO/SOF equity method affiliates in Mar. 2016
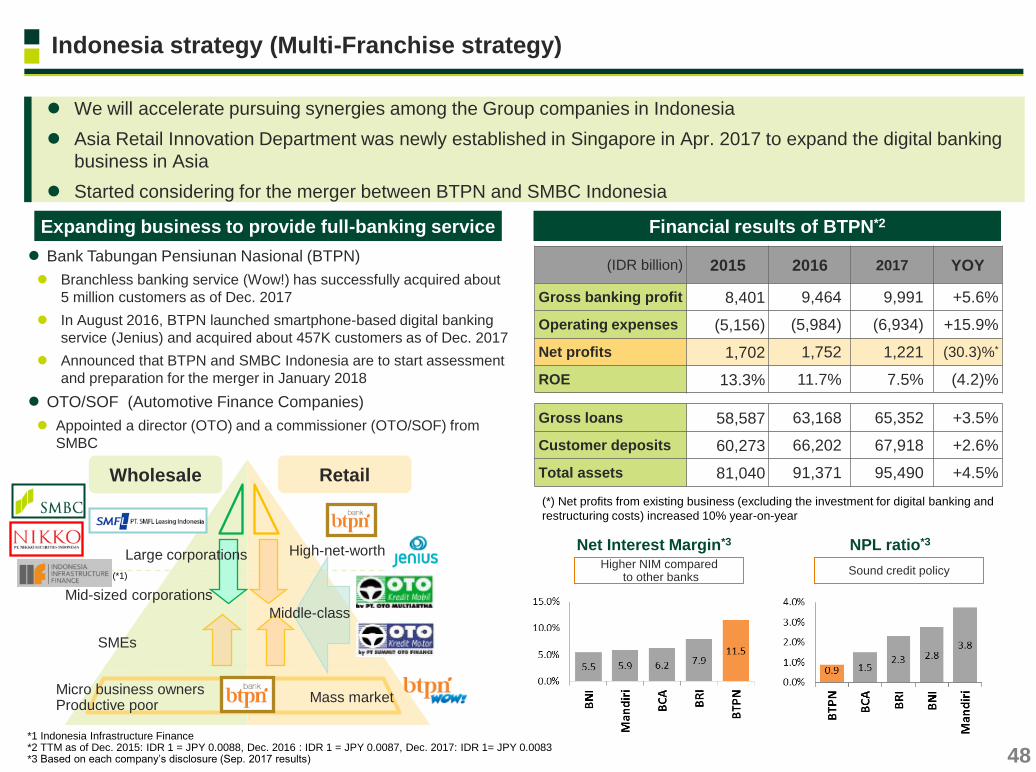
NPL ratio*3 Net Interest Margin*3
Large corporations
SMEs
Micro business owners Productive poor
Wholesale Retail
Mid-sized corporations
High-net-worth
Mass market
Middle-class
(*) Net profits from existing business (excluding the investment for digital banking and
restructuring costs) increased 10% year-on-year
(*1)
48
Indonesia strategy (Multi-Franchise strategy)
We will accelerate pursuing synergies among the Group companies in Indonesia
Asia Retail Innovation Department was newly established in Singapore in Apr. 2017 to expand the digital banking
business in Asia
Started considering for the merger between BTPN and SMBC Indonesia
Expanding business to provide full-banking service Financial results of BTPN*2
Sound credit policy Higher NIM compared
to other banks
Bank Tabungan Pensiunan Nasional (BTPN)
Branchless banking service (Wow!) has successfully acquired about
5 million customers as of Dec. 2017
In August 2016, BTPN launched smartphone-based digital banking
service (Jenius) and acquired about 457K customers as of Dec. 2017
Announced that BTPN and SMBC Indonesia are to start assessment
and preparation for the merger in January 2018
OTO/SOF (Automotive Finance Companies)
Appointed a director (OTO) and a commissioner (OTO/SOF) from
SMBC
(IDR billion) 2015 2016 2017 YOY
Gross banking profit 8,401 9,464 9,991 +5.6%
Operating expenses (5,156) (5,984) (6,934) +15.9%
Net profits 1,702 1,752 1,221 (30.3)%*
ROE 13.3% 11.7% 7.5% (4.2)%
Gross loans 58,587 63,168 65,352 +3.5%
Customer deposits 60,273 66,202 67,918 +2.6%
Total assets 81,040 91,371 95,490 +4.5%
*1 Indonesia Infrastructure Finance *2 TTM as of Dec. 2015: IDR 1 = JPY 0.0088, Dec. 2016 : IDR 1 = JPY 0.0087, Dec. 2017: IDR 1= JPY 0.0083 *3 Based on each company’s disclosure (Sep. 2017 results)

Aircraft leasing companies Country #
owned/managed
1 GECAS USA 1,324
2 AerCap Ireland 1,076
3 Avolon Ireland 585
4 SMBC AC Ireland 450
5 Nordic Aviation Capital Denmark 416
SMBC Aviation Capital results /
Number of owned and managed aircraft*1
(USD mn) 1-3Q
FY3/18 FY3/17
Total revenue*2 833 1,086
Net income 239 298
Aircraft asset 10,777 10,963
Net asset 2,207 1,967
American Railcar Leasing (ARL)
49
Extending loans to funds based on commitments from investors
Balance of claims : approx. USD 25 bn
Spread: around 150 bp
Sponsor finance for mid-sized corporations, LBO loans
Accounts for around 2% of our overseas loan balance.
Carefully select profitable transactions
Spread: around 350bp - 450bp
Products that we have strengths overseas
Aircraft-related business Railcar leasing
Subscription finance, Americas / EMEA middle market business*3
*1 As of Jan. 2018 (Source: Ascend “Airline Business”) *2 Leasing revenue + gains (losses) on sales of aircraft etc. Excludes redelivery adjustment *3 As of Dec. 31, 2017
Providing solutions to domestic and overseas aircraft investors
and offering aircraft leasing on a Group basis led by SMBC
Aviation Capital
SMBC Rail Services (a wholly-owned consolidated subsidiary in the U.S.)
U.S. based mid-sized railcar leasing company,
leased assets: USD 4.4 bn (as of Dec. 31, 2017)
Number of cars owned and managed: approx. 57 thousand
railcars (as of Dec. 31, 2017)
Our strengths
Well-diversified portfolio management
Young age of railcars
Well-diversified client base by industry
SMBC Rail Services fully acquired all equity interests of ARL,
the 6th largest railcar leasing company in the U.S.
Purchasing price of the entity was lower than the appraisal
value of the railcars conducted by a third party.
Therefore, impact to SMFG CET1 capital ratio is minimal

Corporate, sovereign and bank exposures
50
Domestic Overseas
1 Probability of Default. Probability of becoming default by obligor during one year *2 Loss Given Default. Percentage of loss assumed in the event of default by obligor; ratio of uncollectible amount of the exposure owned in the event of default
01020304050
JGB, etc.
Others
Default(7R, 8-10)
7(excl.7R)
4-6
1-3
(Consolidated) Total
(as of Sep. 30, 2017) JPY 103.1 trillion JPY 45.6 trillion
[as of Sep. 30, 2017] [as of Sep. 30, 2017]
PD*1 LGD*2 Risk Weight
0.06% 35.16% 18.31%
0.76% 34.20% 51.87%
14.23% 38.77% 172.18%
100.00% 47.37% 12.41%
0.82% 43.92% 56.88%
0.00% 35.30% 0.01%
PD*1 LGD*2 Risk Weight
0.12% 28.36% 15.93%
2.78% 24.11% 68.87%
17.16% 24.80% 126.69%
100.00% 62.66% 52.63%
1.00% 25.90% 25.16%
-
-
-
(JPY tn) (JPY tn)
1 - 3 (Very high - Satisfactory)
4 - 6 (Likely - Currently no
problem)
7 (excl. 7R)
(Borrowers requiring
caution)
7R, 8-10 (Substandard borrowers -
Bankrupt borrowers)
Others
Japanese Government, etc.
Internal Rating (Certainty of debt repayment) 0 10 20 30 40 50
Mar. 31, 2015
Mar. 31, 2016
Mar. 31, 2017
Sep. 30, 2017

Mar. 17 Sep. 17
0.8 0.8
(JPY tn)
Mar. 17 Sep. 17
1.4 1.6
(JPY tn)
Most borrowers are classified as
“1-3”*6 in our internal rating
Mar. 17 Sep. 17
3.2 2.9
0.3% of SMFG’s total exposure of approx. USD 1tn
(USD bn)
Loan and exposure to the UK / China / Russia
Loan balance in the UK*1, 2, 3 Loan balance in China*1, 2, 3, 5
Our operation in EMEA Exposure to Russia*7, 8
*1 Sum of SMBC, SMBC Europe and SMBC (China) *2 Geographic classification based on borrowers’ domicile *3 Loan balance are converted into JPY from each country’s local currency at the exchange rate of Sep.30, 2017 *4 Major group subsidiaries *5 Based on borrowers’ domicile for loan balance, booking office for classification of borrowers *6 Certainty of debt repayment is in the range of Very high - Satisfactory *7 Loans, commitment lines, guarantees, investments, etc. *8 SMFG consolidated 51
Japanese
(corporates)
Non-Japanese
(corporates, project finance)
Japanese
(corporates) Non-Japanese
(corporates, project finance)
Project finance Non-Japanese
corporates
Japanese corporates
Financial
institutions
Others
(Aircraft, leasing, etc.)
Brexit
Preparing to establish
a bank subsidiary and
a security subsidiary in
Frankfurt, Germany
subject to regulatory
approval
Offices in the UK and EU*4
SMBC
– Brussels, Dusseldorf, Frankfurt
– SMBC Europe
(London, Dublin, Amsterdam, Paris,
Prague, Milan, Madrid)
SMBC Nikko :London, Luxemburg
SMFL : Dublin, Frankfurt
Booking of loans
Loan balance in EMEA regions: Approx. JPY 6.5 tn
– of which around 20% is booked at SMBC Europe London

Exposure to resource-related sectors *1
52
*1 Loans, commitment lines, guarantees, investments, etc. *2 Majors, state-owned companies, etc. *3 Exploration & Production *4 Exchange rates using TTM as of Mar. 2016: USD 1 = JPY 112.62, Mar. 2017: USD 1 = JPY 112.19 and Dec. 2017: USD 1 = JPY 113.00
(JPY tn) Mar. 16
Ratio to
total
exposure Mar. 17
Ratio to
total
exposure Dec. 17
Ratio to
total
exposure
Integrated Oil & Gas*2 1.5 1.3% 1.3 1.1% 1.5 1.2%
Services (Drilling, field services) 0.5 0.4% 0.4 0.4% 0.4 0.3%
Upstream (E&P*3) 1.7 1.4% 1.5 1.2% 1.6 1.2%
Midstream (Storage/Transportation) 1.4 1.2% 1.4 1.1% 1.4 1.1%
Downstream (Refining) 0.7 0.6% 0.9 0.7% 1.0 0.8%
Oil and gas 5.8 5.0% 5.5 4.4% 5.8 4.6%
Other resources (Mining) 1.1 1.0% 0.9 0.8% 0.9 0.7%
Non-Japanese*4 (Resource-related sectors) 6.9 6.0% 6.4 5.2% 6.8 5.4%
o/w Upstream 0.2 0.2% 0.2 0.2% 0.2 0.1%
Oil and gas 1.6 1.4% 1.3 1.1% 1.3 1.0%
Other resources (Mining) 0.2 0.2% 0.2 0.2% 0.2 0.2%
Japanese (Resource-related sectors) 1.8 1.6% 1.5 1.2% 1.5 1.2%
Resource-related sectors 8.8 7.6% 7.9 6.4% 8.3 6.6% Oil and gas 7.4 6.4% 6.8 5.5% 7.1 5.7%
Other resources (Mining) 1.3 1.1% 1.1 0.9% 1.2 0.9%
Non-Japanese*4 38 32.9% 41 33.5% 44 35.0%
Japanese 77 67.1% 82 66.5% 82 65.0%
SMFG total exposure 115 100.0% 123 100.0% 126 100.0%
“Oil and gas” does not include petrochemical; Japanese “Other resources (Mining)” does not include general trading companies
Non-Japanese (resource-related sectors) : Corporate finance approx. 70%; Project finance approx. 30%
Japanese (resource-related sectors) : Corporate finance 100%. No NPLs
Exposure to resource-related sectors excluding project finance which are unaffected by resource prices is JPY 7.1 tn;
Exposure at default (EAD) to the sectors is JPY 6.2 tn as of Dec. 2017
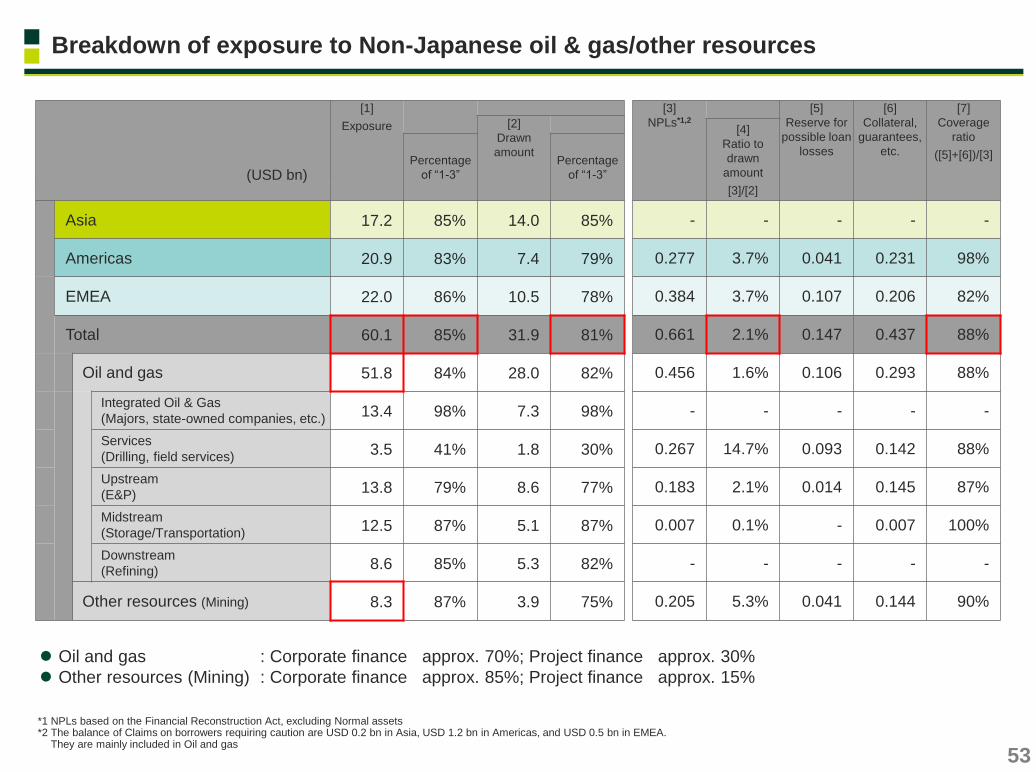
Oil and gas : Corporate finance approx. 70%; Project finance approx. 30%
Other resources (Mining) : Corporate finance approx. 85%; Project finance approx. 15%
(USD bn)
[1]
Exposure
[3]
NPLs*1,2
[5]
Reserve for
possible loan
losses
[6]
Collateral,
guarantees,
etc.
[7]
Coverage
ratio
([5]+[6])/[3]
[2]
Drawn
amount
[4]
Ratio to
drawn
amount
[3]/[2]
Percentage
of “1-3”
Percentage
of “1-3”
Asia 17.2 85% 14.0 85% - - - - -
Americas 20.9 83% 7.4 79% 0.277 3.7% 0.041 0.231 98%
EMEA 22.0 86% 10.5 78% 0.384 3.7% 0.107 0.206 82%
Total 60.1 85% 31.9 81% 0.661 2.1% 0.147 0.437 88%
Oil and gas 51.8 84% 28.0 82% 0.456 1.6% 0.106 0.293 88%
Integrated Oil & Gas
(Majors, state-owned companies, etc.) 13.4 98% 7.3 98% - - - - -
Services
(Drilling, field services) 3.5 41% 1.8 30% 0.267 14.7% 0.093 0.142 88%
Upstream
(E&P) 13.8 79% 8.6 77% 0.183 2.1% 0.014 0.145 87%
Midstream
(Storage/Transportation) 12.5 87% 5.1 87% 0.007 0.1% - 0.007 100%
Downstream
(Refining) 8.6 85% 5.3 82% - - - - -
Other resources (Mining) 8.3 87% 3.9 75% 0.205 5.3% 0.041 0.144 90%
53
Breakdown of exposure to Non-Japanese oil & gas/other resources
*1 NPLs based on the Financial Reconstruction Act, excluding Normal assets *2 The balance of Claims on borrowers requiring caution are USD 0.2 bn in Asia, USD 1.2 bn in Americas, and USD 0.5 bn in EMEA. They are mainly included in Oil and gas

Biometric
authentication
IoT Smartphones AI SNS Big data Blockchain API
Enhancing
the customer convenience
Generating
new businesses
Improving
productivity and efficiency
Upgrading
management
infrastructure
Platform
B2B
RPA
Workstyle reform
(public cloud)
MIS
Cyber security Smartphone
applications
Cashless payments
Proactively introduce new technologies and promote digitalization
Digitalization
54

55
United Nations Global Compact
UNEP Finance Initiative
CDP
Equator Principles
“Principles for Financial Action
toward a Sustainable Society
(Principles for Financial Action
for the 21st Century)”
ESG Indices selected by GPIF (Broad index)
ESG - Accreditation and support for initiatives
SRI Indices on which SMFG is listed Support for initiatives in Japan and Overseas
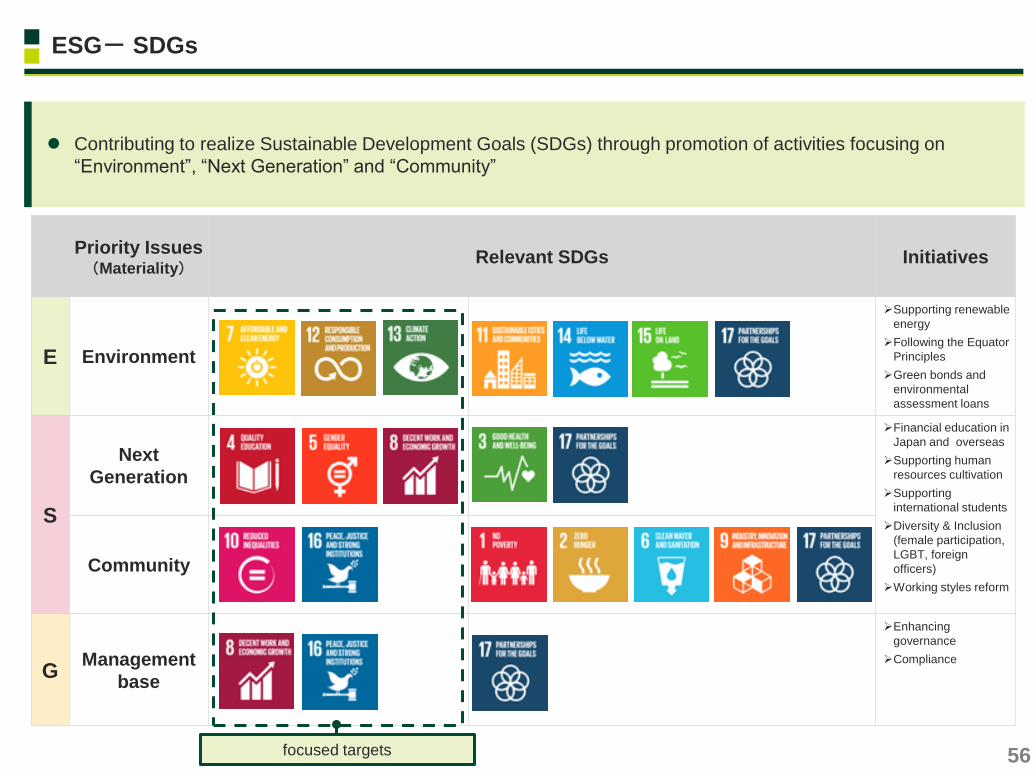
56
Priority Issues (Materiality)
Relevant SDGs Initiatives
E Environment
Supporting renewable
energy
Following the Equator
Principles
Green bonds and
environmental
assessment loans
S
Next
Generation
Financial education in
Japan and overseas
Supporting human
resources cultivation
Supporting
international students
Diversity & Inclusion
(female participation,
LGBT, foreign
officers)
Working styles reform
Community
G Management
base
Enhancing
governance
Compliance
focused targets
ESG- SDGs
Contributing to realize Sustainable Development Goals (SDGs) through promotion of activities focusing on
“Environment”, “Next Generation” and “Community”

Issued Euro denominated green bond (EUR 500mn in Oct.2017)
Project finance for renewable energy related projects (FY3/2017)
Regional breakdown
Geothermal
Hydro power
Biomass Marine power cable
46
projects
57
Sector breakdown
Solar
power
Wind
power
Americas
Europe
Oceania
46
projects
Working with the Equator Principles
Started implementation of the internal rules in June 2006.
Revision in line with the update to Equator Principles
Task Force on Climate-related Financial Disclosures (TCFD)
Set up a working group to respond to the final report
“Recommendations of the Task Force on Climate-related
Financial Disclosures” (TCFD established by Financial Stability
Board)
Obtain new third-party verification of environmental data
Reduction in CO2 emission of
major 10 group companies
have been verified by
a third-party
Environmental management
system
7 major Group
companies* obtained
ISO14001 certification
ESG - Environment
Promote environmental businesses Manage environmental risks
Reduce environmental impact
* SMBC, SMFL, SMBC Nikko, SMCC, Cedyna, SMBCCF, The Japan Research Institute, Limited
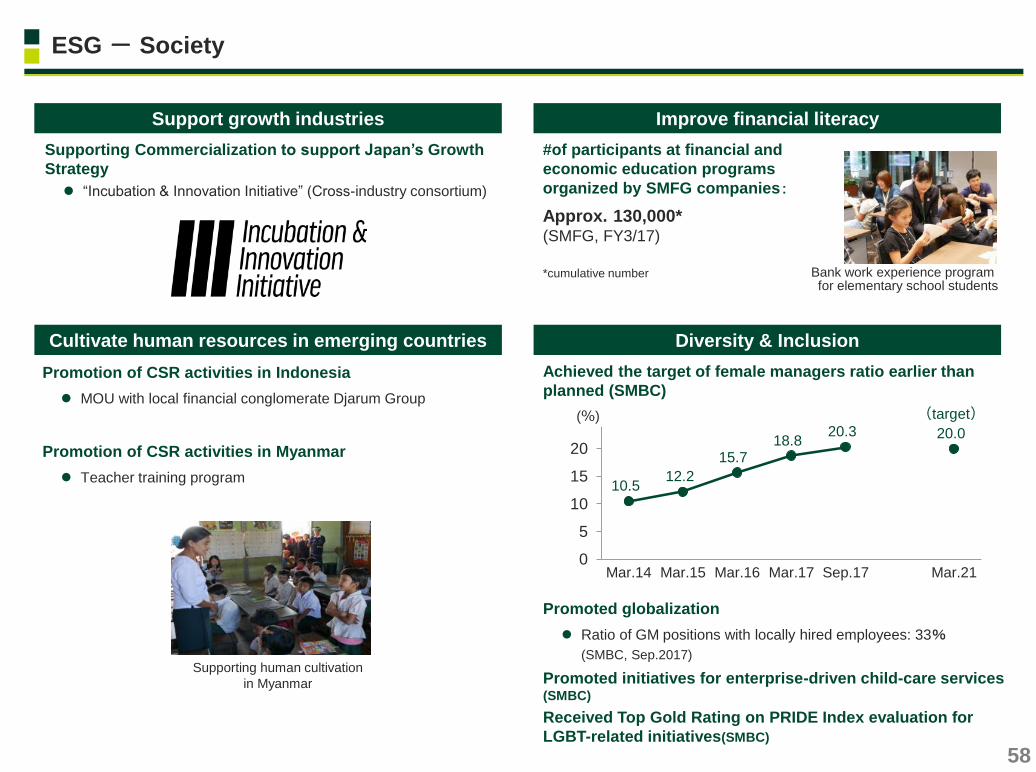
10.5 12.2
15.7 18.8
20.3
(target)
20.0
0
5
10
15
20
Mar.14 Mar.15 Mar.16 Mar.17 Sep.17 Mar.21
(%)
58
Promoted globalization
Ratio of GM positions with locally hired employees: 33%
(SMBC, Sep.2017)
Promoted initiatives for enterprise-driven child-care services (SMBC)
Received Top Gold Rating on PRIDE Index evaluation for
LGBT-related initiatives(SMBC)
Supporting Commercialization to support Japan’s Growth
Strategy
“Incubation & Innovation Initiative” (Cross-industry consortium)
#of participants at financial and
economic education programs
organized by SMFG companies:
Approx. 130,000* (SMFG, FY3/17)
*cumulative number
Promotion of CSR activities in Indonesia
MOU with local financial conglomerate Djarum Group
Promotion of CSR activities in Myanmar
Teacher training program
Supporting human cultivation
in Myanmar
Bank work experience program for elementary school students
Achieved the target of female managers ratio earlier than
planned (SMBC)
ESG - Society
Support growth industries Improve financial literacy
Cultivate human resources in emerging countries Diversity & Inclusion

◎:Chairman, ○:Member
Committee
(inside:outside)
Nomina
tion
(1:5)
Compen
sation
(2:4)
Audit
(2:3)
Risk
(1:4)
Masayuki
Matsumoto Outside director ○ ◎
Arthur M. Mitchell Outside director ○ ○
Shozo Yamazaki Outside director ○ ○
Masaharu Kohno Outside director ○ ○
Yoshinobu Tsutsui Outside director ◎ ○
Katsuyoshi Shinbo Outside director ◎ ○
Eriko Sakurai Outside director ○ ○
Koichi Miyata Chairman of the Board ○ ○
Takeshi Kunibe Director President ○
Jun Ohta
Director
Deputy President and
Executive Officer ◎
Toshiyuki
Teramoto Director ○
Toru Mikami Director ○
Hirohide Yamaguchi*2
Outside expert ○
Nobuyuki
Kinoshita*3 Outside expert ○
Board of Directors
Nomination Committee
Compensation Committee
Audit Committee
Sta
tuto
ry
Com
mitte
es
Objectives
Establish a “G-SIFIs Standard” governance framework
Strengthen the supervisory function of the Board of
Directors
Expedite execution of operations
Risk Committee
Supervisory
Execution
Outside directors
Increased the number of outside directors from five to seven
(ratio against the total number of directors increased from 36% to 41%)
Arranged a small meeting of outside director for investors
Internal Committees
Internal committees consist of a majority of outside directors*1
59
ESG - Governance (1)
Transformed into a Company with Three Committees Increased the number of outside directors
*1 Chairman of Nomination, Compensation and Auditing committees are also outside directors *2 Chairman of the Advisory Board of Nikko Research Center, Inc., former Deputy Governor of the Bank of Japan *3 Senior Advisor, Aflac Japan
June
2017
June
2017

Introduced Group-wide business units and CxO system to maximize business potential for the Group on a global
basis in April 2017
Revised the executive pay system that has a stronger link to financial results in order to ensure the management
is well aligned with the shareholder perspective
Introduction of New Stock Compensation Plans for
Executives utilizing restricted stock
Introduced compensation that is linked to financial targets of the
medium-term management plan and to our stock performance
Raise the ratio of stock-based compensation
Strengthen risk management through the introduction of a
system for (a) partial deferral of bonuses and (b) reducing or
returning compensation (Malus and Clawback)
SMFG SMBC Nikko Major
subsidiaries
SMBC
Head of
Business
Unit
Business units
(RT, WS, International, Global Markets)
President President President President
CxO Head office functions
Group Management Committee
Strengthen ability to support clients
Optimize overall resource usage
Sophisticate planning and management functions
Objectives
Introduction of Group-wide business units and CxO system
60
ESG - Governance (2)
New Group-wide operational structure Review of the executive pay system July
2017
April
2017

Capital and risk-weighted assets, consolidated
Capital ratio (transitional basis) Common Equity Tier 1 capital ratio
(fully-loaded*4)
*1~3 Subject to transitional arrangements. Regulatory adjustments of Tier 1 and Tier 2 include items that are either phased-in or phased-out as described in *1 and *2 below *1 80% of the original amounts are included *2 80% phase-out is reflected in the figures *3 Cap is 50% *4 Based on the Mar. 31, 2019 definition *5 Each figure represents 20% of the original amounts that are not included due to phase-in or included due to phase-out in the calculation of CET1 on a transitional basis *6 Until the first call date. Floating rate thereafter *7 Callable at any dividend payment date on and after the first call date, subject to prior confirmation of the FSA
(JPY bn)
Mar. 31,
2017
Dec. 31,
2017
Common Equity Tier 1 capital (CET1) 8,608.5 9,516.4
Total stockholders’ equity related to common stock 8,013.3 8,551.0
Accumulated other comprehensive income*1 1,290.0 1,606.5
Regulatory adjustments related to CET1*1 (898.1) (853.2)
Tier 1 capital 9,946.2 11,002.4
Additional Tier 1 capital instruments 449.9 598.8
Eligible Tier 1 capital instruments (grandfathered)*3 812.9 812.9
Regulatory adjustments*1, 2 (172.9) (165.9)
Tier 2 capital 2,027.5 1,992.2
Tier 2 capital instruments 898.9 901.4
Eligible Tier 2 capital instruments (grandfathered)*3 873.1 777.3
Unrealized gains on other securities after 55% discount
and land revaluation excess after 55% discount*2 197.4 250.3
Regulatory adjustments*1, 2 (70.6) (67.4)
Total capital 11,973.7 12,994.6
Risk-weighted assets 70,683.5 71,336.8
Common Equity Tier 1 capital ratio 12.17% 13.34%
Tier 1 capital ratio 14.07% 15.42%
Total capital ratio 16.93% 18.21%
Issue
date
Amount
outstanding
Dividend
rate*6
First call
date*7 Type
SMFG Preferred
Capital JPY 1 Limited Feb. 2008 JPY 135.0 bn 3.52% Jan. 2018
Non
Step-up
Preferred securities which become callable in FY3/18
(JPY bn)
Mar. 31,
2017
Dec.31,
2017
Variance with CET1 on a transitional basis*5 70.2 157.2
Accumulated other comprehensive income 322.5 401.6
Net unrealized gains on other securities 308.5 389.3
Non-controlling interests (subject to be phased-out) (27.8) (31.1)
Regulatory adjustments related to CET1 (224.5) (213.3)
Common Equity Tier 1 capital 8,678.7 9,673.6
Risk-weighted assets 70,644.7 71,297.2
Common Equity Tier 1 capital ratio 12.2% 13.5%
Ref: Common Equity Tier 1 capital ratio
(excluding net unrealized gains) 10.0% 10.8%
of which:
of which:
of which:
of which:
of which:
of which:
Leverage ratio (transitional basis)
LCR (transitional basis)
(JPY bn) Dec. 31, 2017
Tier1 Capital 11,002.4
Leverage exposure 221,655.9
Leverage ratio 4.96%
Average Oct. – Dec. 2017
127.6%
61

0%
5%
10%
15%
20%
Sep. 2017
CET1: 12.9%
(JPY 9.1 tn)
AT1: 1.8% (JPY 1.3 tn)
Tier 2: 2.8% (JPY 2.0 tn)
Senior Debt: 4.1%
(JPY 2.9 tn)
Total capital plus SMFG senior debt to RWA*3
(Consolidated)
The FSA plans to allow Japanese G-SIBs to count the amount equivalent to 2.5% of RWA from Mar. 2019 and 3.5% of RWA from Mar. 2022 as external TLAC
Based on current calculations, we expect that the TLAC requirements based on RWA, post-Basel III reforms basis, will be more constraining than requirements based on the leverage ratio denominator
Contribution of Japanese Deposit Insurance Fund Reserves
Minimum external TLAC requirements Issuance amount of SMFG senior unsecured debt*2
(JPY tn) FY3/2016 FY3/2017 1H,
FY3/2018
Issuance amount
through the period 0.5 1.6 0.8
Amount outstanding
at period end 0.5 2.1 2.9
Total
capital*4 +
SMFG
Senior
debt
RWA = 21.8%
62
TLAC requirements
TLAC and capital buffer requirements for SMFG Meeting TLAC requirement
*1 Excludes countercyclical buffer. As for the G-SIB buffer, SMFG was allocated to bucket 1 (1.0%) according to the list published by the FSB in Nov. 2017 *2 Converted at the exchange rate as of Mar. 31, 2016 (FY3/2016) , as of Mar. 31, 2017 (FY3/2017) and as of Sep.30,2017 (1H, FY3/2018) *3 This figure is not the same as TLAC ratio *4 Transitional basis. We expect the calculation for TLAC ratio, when the TLAC requirements in Japan are finalized, will differ from the one for total capital ratio. For example, some items in total capital will
not be included in TLAC capital and vice versa
17/9P 更新不要
2019 -
2021
After
2022
Minimum external TLAC requirements
(RWA basis) 16% 18%
Plus capital buffers*1 19.5% 21.5%
Factoring treatment of access to
Deposit Insurance Fund Reserves 17.0% 18.0%
Minimum external TLAC requirements
(Leverage ratio denominator basis) 6% 6.75%
Plus leverage ratio buffer*1 n.a. 7.25%

63
Leverage ratio
Liquidity coverage ratio (LCR)
Net stable funding ratio (NSFR)
Additional loss absorbency requirement for G-SIBs
Transition period Fully implemented Basel II
2015:Start disclosure (minimum:3%)
2018:Migration to Pillar 1
2018:Introduce minimum standard
Bucket 5 (3.5%)
Bucket 1 (1.0%)
Leverage ratio and liquidity rules
Phase-in of deductions*3 40% 60% 80% 100% 100% 100% 100% 100%
Grandfathering of capital instruments 70% 60% 50% 40% 30% 20% 10% -
2015
60% 2016
70% 2017
80% 2018
90% 2019
100%
Additional loss absorbency requirement for G-SIBs
(Common Equity Tier 1 capital)
*1
*1, 2 Capital requirements
Tier 2
Additional Tier 1
Capital conservation
buffer*2
Minimum common
equity Tier 1 ratio
2022 2023 2024 2025 2026 2027
Revisions to the standardised and internal ratings-based approaches to credit risk 2022: Introduce
Risk weight for listed equity holdings (higher of AIRB and the following table) 100% 130% 160% 190% 220% 250%
Revised CVA and market risk frameworks 2022: Introduce
Revised operational risk framework 2022: Introduce
Output floor (Increase in RWA subject to 25% cap until 2026) 50% 55% 60% 65% 70% 72.5%
2022: Introduce revised exposure definition and G-SIB buffer
更新済
Application of Basel III
*1 Schedule based on final documents by BCBS, and domestic regulations *2 Countercyclical buffer (CCyB) omitted in the chart above; if applied, phased-in in the same manner as the Capital conservation buffer *3 Including amounts exceeding limit for deferred tax assets, mortgage servicing rights and investment in capital instruments of unconsolidated financial institutions
4.5% 4.5% 4.5% 4.5% 4.5% 4.5% 4.5% 4.5%
0.625% 1.25% 1.875% 2.5% 2.5% 2.5% 2.5% 1.5% 1.5% 1.5% 1.5% 1.5% 1.5% 1.5% 1.5% 2.0% 2.0% 2.0% 2.0% 2.0% 2.0% 2.0% 2.0% 8.0% 8.0% 8.625% 9.25% 9.875% 10.5% 10.5% 10.5% 10.5%
Mar.2012 Mar.15 Mar.16 Mar.17 Mar.18 Mar.19 Mar.20 Mar.21 Mar.22

64
Regulations Outline Finalized
at FSB or
BCBS
Domestic
regulation
Capital re
quirem
ent
Credit
Risk
Revisions to the
Standardised
Approach
・Seeks to improve the standardised approach for credit risk, including reducing reliance on external credit
ratings; increasing risk sensitivity; reducing national discretions; strengthening the link between the
standardised approach and the internal-rating based (IRB) approach; and enhancing comparability of capital
requirements across banks
Finished Unfinished
CVA risk framework ・Seeks to review the credit valuation adjustment (CVA) risk framework to capitalize the risk of future
changes in CVA that is an adjustment to the fair value of derivatives to account for counterparty’s credit risk Finished Unfinished
Market
Risk
IRRBB
(Interest-rate risk in
the banking book)
・Adoption of enhanced Pillar 2 approach; (i) more extensive guidance on the expectations for a bank's
IRRBB management process, (ii) enhanced disclosure requirements, (iii) an updated standardized
framework and (iv) a stricter threshold for identifying outlier banks
Finished Unfinished
Operational
Risk
Revisions to the
Standardised
Measurement
Approach
・Use of the Business Indicator (BI), a proxy of size of business, and the loss data for risk weighted assets
calculation
・Termination of the Advanced Measurement Approaches (AMA)
Finished Unfinished
Overall
Constraints on the
use of internal model
approaches
・Constraints on the use of the internal ratings based approach to credit risk; (i) applying the standardised
approach to exposures to equities, (ii) applying the F-IRB approach for exposures to financial institutions,
large corporates and medium sized corporates, or (iii) applying or raising floors to PDs/LGDs and revising
the estimation methods
Finished Unfinished
Capital floors based
on standardised
approaches
・Replacement of the Basel I-based transitional capital floor with a permanent floor based on standardised
approaches
・The output floor to be phased-in at 50% in 2022 with full implementation in 2027 at 72.5%
Finished Unfinished
Leverage ratio
requirement Leverage ratio
・A minimum requirement of 3% introduced in 2018
・The leverage ratio buffer for G-SIBs set at 50% of a G-SIB’s higher-loss absorbency risk-weighted
requirements
・Revisions to the exposure definitions including credit conversion factors for off-balance sheet items
Finished Finished in part
G-SIFI
regulation
TLAC
(total loss-absorbing
capacity)
・Minimum requirement of (i) 16% of RWA and 6% of the Basel III Tier 1 leverage ratio denominator as from
2019, (ii) 18% of RWA and 6.75% of the Basel III Tier 1 leverage ratio denominator as from 2022
・An access to credible ex-ante commitments to recapitalise a G-SIB in resolution may count toward a firm’s
TLAC as 2.5% RWA as from 2019 and 3.5% as from 2022
・Should be issued and maintained by resolution entities
Finished Unfinished
Sovereign
exposures
Regulatory treatment
of sovereign
exposures
・Basel Committee has completed its review of the regulatory treatment of sovereign exposures and decided
not to proceed the consultation process
Finished
(Unchanged) -
更新済
Progress of major regulatory discussions

Specified Item 1 measures
Liquidity support
Capital injection
Act on Special Measures for Strengthening
Financial Functions
Capital injection
Item 2 measures Financial assistance
exceeding payout cost
Suspension of payment
of deposits or
having negative net worth
Point of non-
viability
Yes*3
No
Framework Conditions A
rtic
le 1
02
of
Dep
osit In
su
ran
ce A
ct
(DIA
) Item 1 measures
Capital injection
Item 3 measures Nationalization
Specified Item 2 measures Supervision or control and
Financial assistance for orderly resolution
Suspension of payment
of deposits and
having negative net worth
Undercapitalized
No
Suspension of payment or
having negative net worth*2 Yes*3
Banks
only
Subject entities
Financial
institutions
including
banks and
BHCs
Banks
(Capital
injection may
be made
through BHC)
Systemic risk
Not
Required
Required
(Credit system
in Japan or
in a certain
region)
Required
(Financial
system such
as financial
market in
Japan)
No suspension of payment of
deposits*1 and not having
negative net worth
Exis
tin
g fra
me
wo
rk
Ne
wly
e
sta
blis
he
d
fra
me
wo
rk
Art
icle
12
6-2
of D
IA
Not having negative net worth No
65
17/9P 更新不要?
Public sector support and point of non-viability in Japan
*1 Including the likelihood of a suspension of payment of deposits *2 Including the likelihood of a suspension of payment or negative net worth *3 Specified in Q&A published by FSA on March 6, 2014

66
Apr. 2001 Jul. 2007 Jan. 2018
Aaa
• Bank of America
• Bank of New York Mellon
• Citibank
• JPMorgan Chase Bank
• Royal Bank of Scotland
• UBS
• Wells Fargo Bank
Aa1 • Bank of America
• Crédit Agricole • UBS
• Wells Fargo Bank
• Banco Santander
• Barclays Bank
• BNP Paribas
• Crédit Agricole
• Credit Suisse
• Deutsche Bank
• HSBC Bank
• ING Bank
• Nordea Bank
• Société Générale
• State Street Bank &Trust
Aa2
• Bank of New York Mellon
• Barclays Bank
• Citibank
• HSBC Bank
• ING Bank
• JPMorgan Chase Bank
• Royal Bank of Scotland
• State Street Bank & Trust
• SMBC
• BPCE(Banque Populaire)
• BTMU
• Mizuho Bank
• UniCredit • Bank of New York Mellon • Wells Fargo Bank
Aa3
• Banco Santander
• BNP Paribas
• BPCE(Banque Populaire)
• Deutsche Bank
• Société Générale
• UniCredit
• Goldman Sachs Bank • Morgan Stanley Bank • Bank of America
• BNP Paribas
• HSBC Bank
• ING Bank
• JPMorgan Chase Bank
• Nordea Bank
• State Street Bank & Trust
A1
• Credit Suisse
• Agricultural Bank of China
• Bank of China • ICBC • SMBC
• Bank of China
• Barclays Bank
• BTMU
• China Construction Bank
• Citibank
• Crédit Agricole
• Credit Suisse
• Goldman Sachs Bank
• ICBC
• Mizuho Bank
• Morgan Stanley Bank
• Royal Bank of Canada
• Standard Chartered
• UBS
A2 • BTMU • Standard Chartered • China Construction Bank • Standard Chartered
• Agricultural Bank of China
• Royal Bank of Scotland • Société Générale
A3
• SMBC • Mizuho Bank • Banco Santander
Baa1 • Agricultural Bank of China
• Bank of China • China Construction Bank
• ICBC
• UniCredit
Baa2
• Deutsche Bank
Credit ratings of G-SIBs (Operating banks, by Moody’s)*
* Long-term issuer ratings (if not available, long-term deposit ratings) of operating banks
SMBC
SMBC
SMBC
更新済

67
Credit ratings of G-SIBs (Holding companies, by Moody’s / S&P)*
* Long-term issuer ratings (if not available, Senior unsecured ratings for Moody’s) of holding companies
Jan. 2018
Moody’s S&P
Aaa
AAA
Aa1
AA+
Aa2
AA
Aa3
AA-
A1
• SMFG
• Bank of New York Mellon
• Mizuho
• MUFG
• State Street
A+
A2 • HSBC
• Standard Chartered
• Wells Fargo
• Bank of New York Mellon
• HSBC • State Street
• Wells Fargo A
A3
• Bank of America
• Goldman Sachs • JPMorgan
• Morgan Stanley
• SMFG
• Bank of America
• ING
• JPMorgan
• Mizuho
• MUFG
• UBS A-
Baa1 • Citigroup
• ING • UBS • Citigroup
• Credit Suisse
• Goldman Sachs
• Morgan Stanley
• Standard Chartered BBB+
Baa2 • Barclays • Credit Suisse • Barclays BBB
Baa3 • RBS • RBS BBB-
Ba1
BB+
SMFG
SMFG
更新済

68
(DI)
30
35
40
45
50
55
60
Apr.12 Oct.12 Apr.13 Oct.13 Apr.14 Oct.14 Apr.15 Oct.15 Apr.16 Oct.16 Apr.17 Oct.17
Household activity
Corporate activity
(2.0)
(1.0)
0.0
1.0
2.0
3.0
4.0
5.0
2Q12
3Q 4Q 1Q13
2Q 3Q 4Q 1Q14
2Q 3Q 4Q 1Q15
2Q 3Q 4Q 1Q16
2Q 3Q 4Q 1Q17
2Q 3Q 4Q
(%)
Japan CPI Japan Core CPI (Ex. Food)
Current Japanese economy
Real GDP growth rate*1 (annualized QOQ change) Economy watchers survey*2
Consumer price index*3 (YOY change) Real compensation of employees*4
*1 Source: Cabinet Office. Seasonally adjusted series. Household sector = Private consumption + Private residential investment, Inventories = Change in private and public inventory, Public demand = Government consumption + Public investment *2 Source: Cabinet Office. Diffusion index for current economic conditions *3 Source: Statistics Bureau. Core CPI: All items, less fresh foods *4 Source: Cabinet Office and Ministry of Internal Affairs and Communications
(20)
(15)
(10)
(5)
0
5
10
Q2 Q3 Q4 Q1 Q2 Q3 Q4 Q1 Q2 Q3 Q4 Q1 Q2 Q3 Q4 Q1 Q2 Q3 Q4 Q1 Q2 Q3 Q4
12 13 14 15 16 17
(contribution %)
(Y/Q)
Private non-resi.investment
Inventories
Net exports
Public demand
Household sector
Real GDP
(4)
(3)
(2)
(1)
0
1
2
3
4
1Q 2Q 3Q 4Q 1Q 2Q 3Q 4Q 1Q 2Q 3Q 4Q 1Q 2Q 3Q 4Q 1Q 2Q 3Q 4Q
2013 14 15 16 17
(%)
(Y/Q)
Number of employeeWages per personPricesNominal compensation of employeesReal compensation of employees