DAISI / PENTAHO...Using a PivotTable to analyze Pentaho - Drillable NRS Report 6. Group activities...
16
DAISI / PENTAHO Using Excel’s PivotTables to Analyze Program Data and Manage Student Testing Benjamin McDaniel Director for Adult Education Data and Accountability, ICCB
Transcript of DAISI / PENTAHO...Using a PivotTable to analyze Pentaho - Drillable NRS Report 6. Group activities...

DAISI / PENTAHOUsing Excel’s PivotTables to Analyze
Program Data and
Manage Student Testing
Benjamin McDaniel
Director for Adult Education Data and Accountability, ICCB
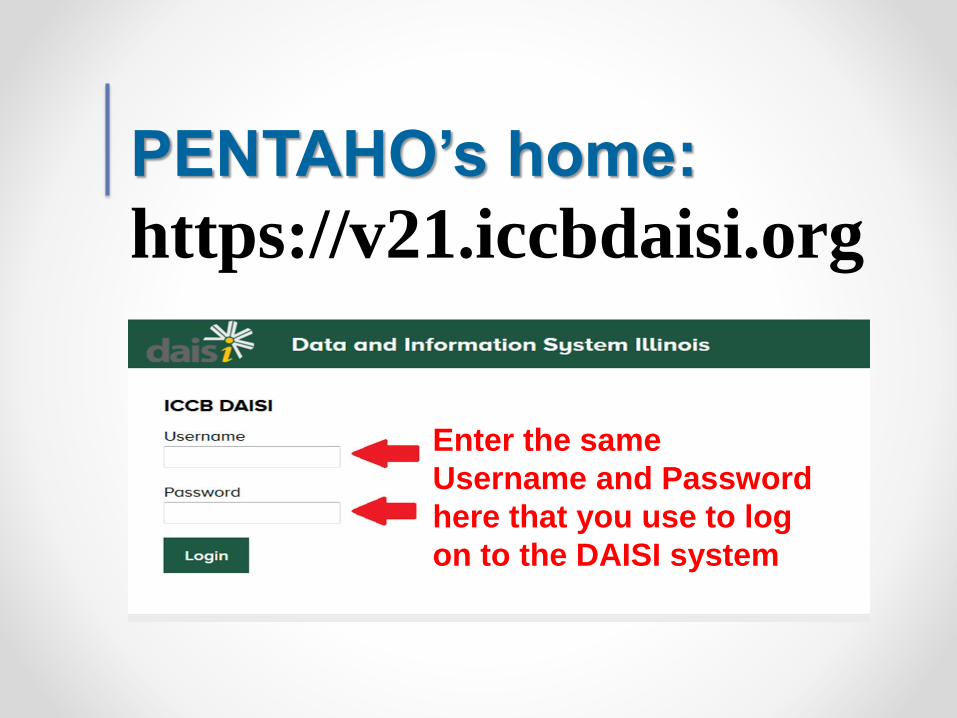
PENTAHO’s home:
Enter the same
Username and Password
here that you use to log
on to the DAISI system
https://v21.iccbdaisi.org
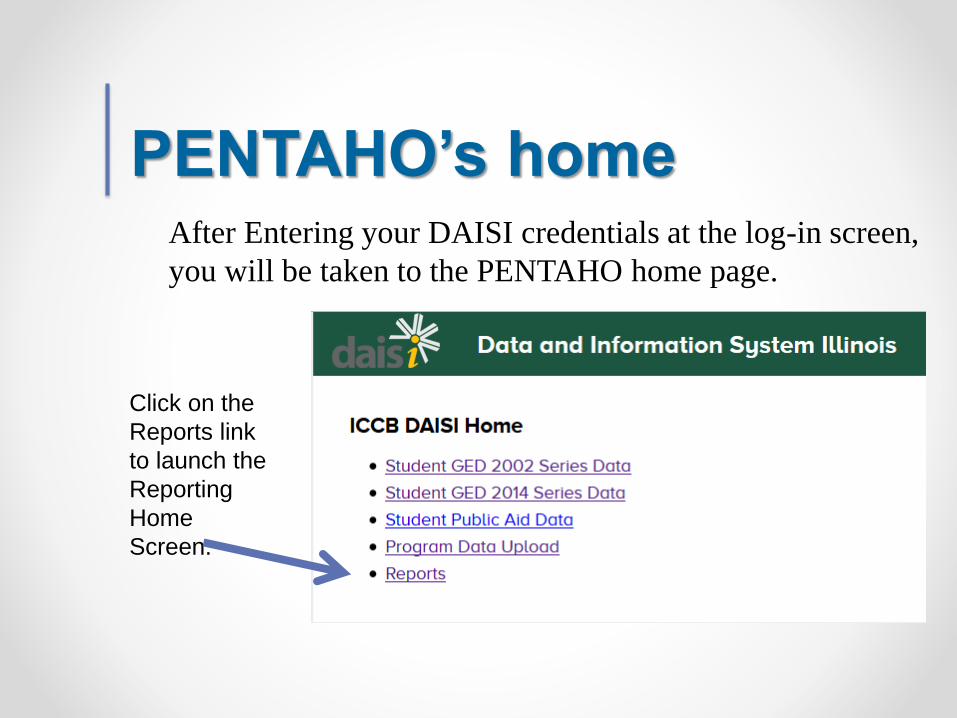
PENTAHO’s homeAfter Entering your DAISI credentials at the log-in screen,
you will be taken to the PENTAHO home page.
Click on the
Reports link
to launch the
Reporting
Home
Screen.

• In this session, we will cover the following:1. Overview of the basics of Excel’s PivotTable tool
2. Using a PivotTable to analyze NRS data through the Transition and Performance Report (T&P Report) available in DAISI
3. Group activities using PivotTables with mock T&P data
4. Individual activities using PivotTables with local program T&P data
5. Using a PivotTable to analyze Pentaho - Drillable NRS Report
6. Group activities using PivotTables with mock drillable Pentaho NRS report
7. Individual activities using PivotTables with local program drillable Pentaho NRS report
8. Using handout titled “PivotTable ideas to remember” to record ideas to take home
AGENDA & ACTIVITIES
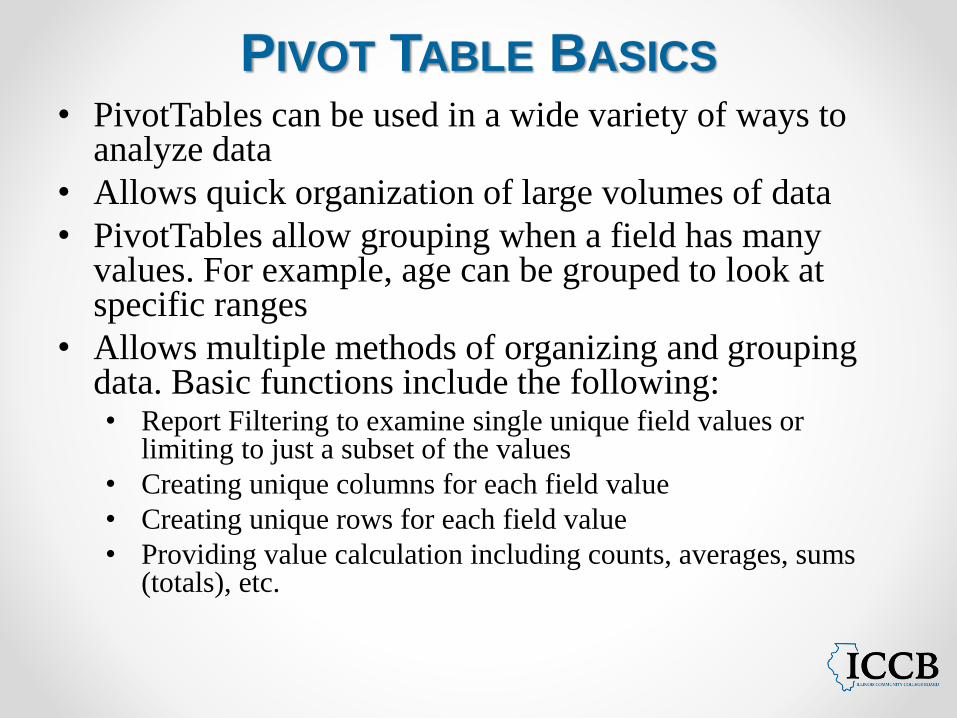
• PivotTables can be used in a wide variety of ways to analyze data
• Allows quick organization of large volumes of data
• PivotTables allow grouping when a field has many values. For example, age can be grouped to look at specific ranges
• Allows multiple methods of organizing and grouping data. Basic functions include the following:• Report Filtering to examine single unique field values or
limiting to just a subset of the values
• Creating unique columns for each field value
• Creating unique rows for each field value
• Providing value calculation including counts, averages, sums (totals), etc.
PIVOT TABLE BASICS
• Requires a spreadsheet with no empty columns or empty rows• Individual cells can be blank, but there should be no row or column completely
empty
• If using Excel 2013 the file may need to be saved in the .xslx format before beginning the work in a PivotTable
• When working in a PivotTable and field option choices disappear, simply click inside the PivotTable box to “re-activate” the table
• Double clicking a field that has been “counted” allows the user to see student level records used in that number calculation
• Importance of knowing the various data elements available in source file when creating a PivotTable
PIVOT TABLE BASICS CONTINUED…
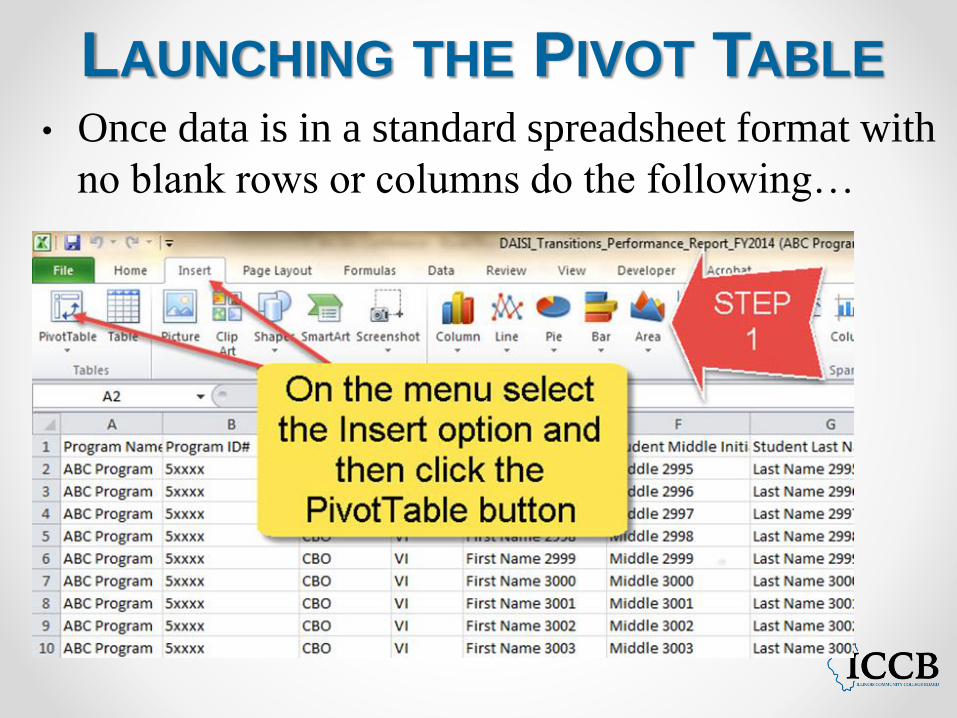
• Once data is in a standard spreadsheet format with
no blank rows or columns do the following…
LAUNCHING THE PIVOT TABLE
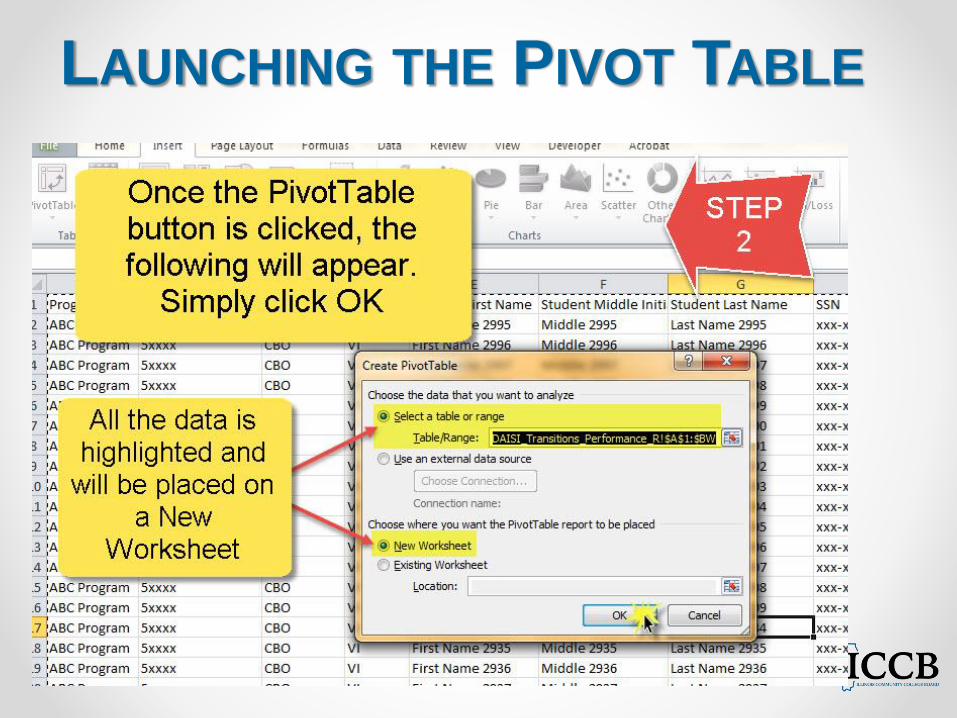
LAUNCHING THE PIVOT TABLE

UNDERSTANDING THE PIVOT
TABLE FORMAT
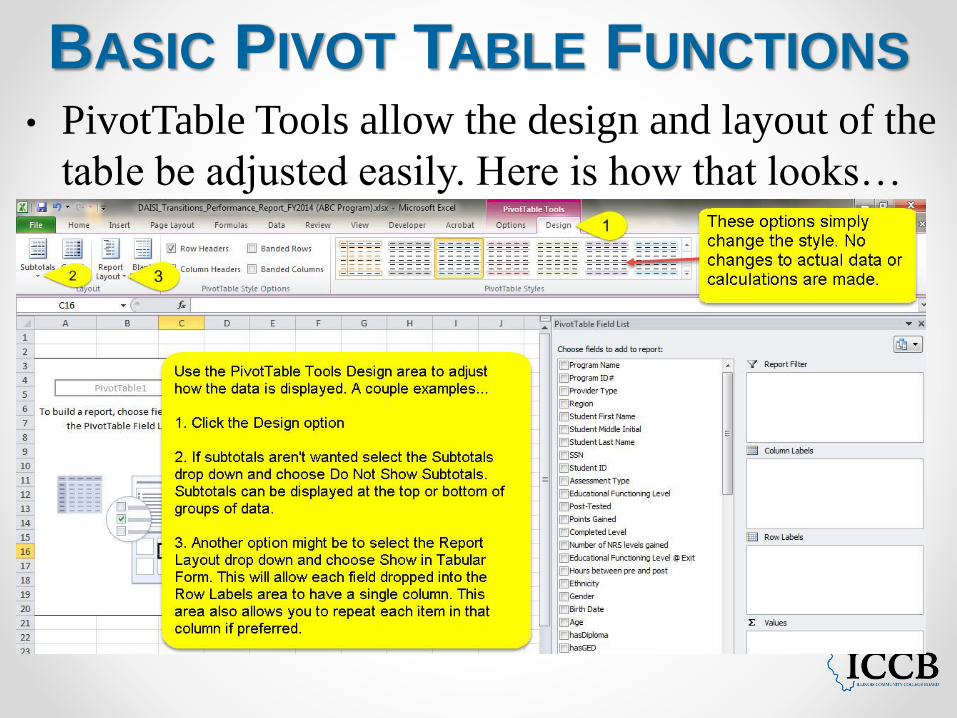
• PivotTable Tools allow the design and layout of the
table be adjusted easily. Here is how that looks…
BASIC PIVOT TABLE FUNCTIONS
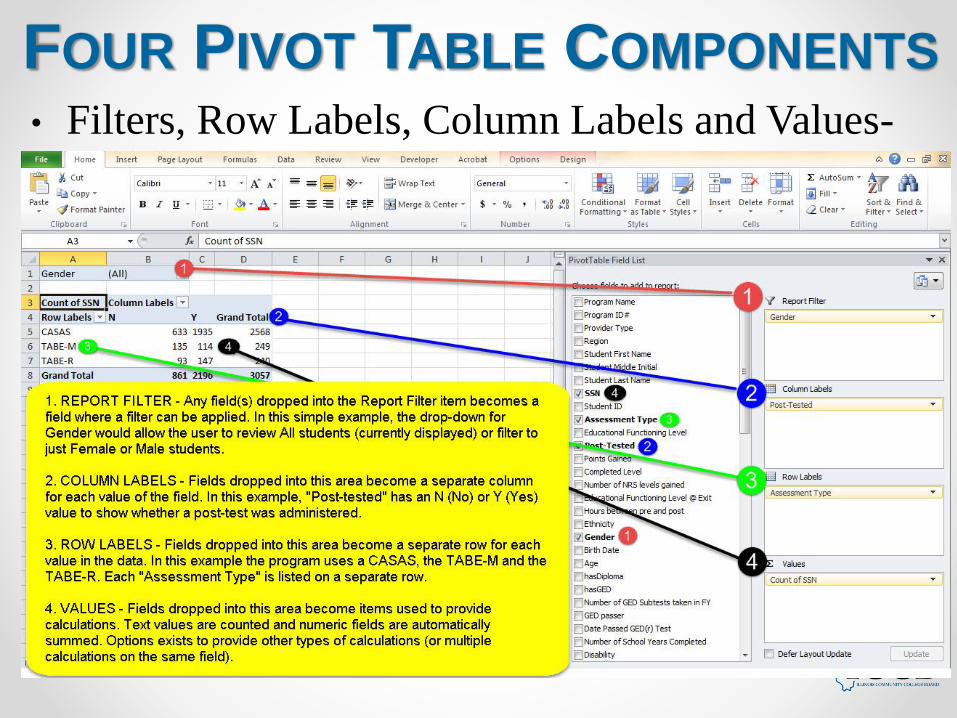
• Filters, Row Labels, Column Labels and Values-
FOUR PIVOT TABLE COMPONENTS
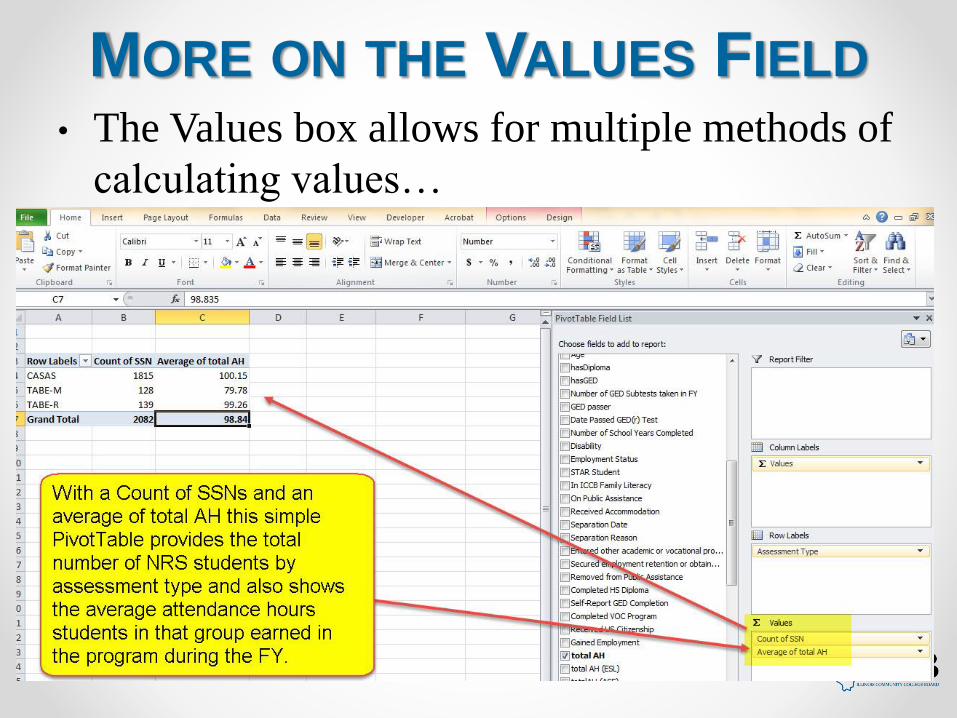
• The Values box allows for multiple methods of
calculating values…
MORE ON THE VALUES FIELD
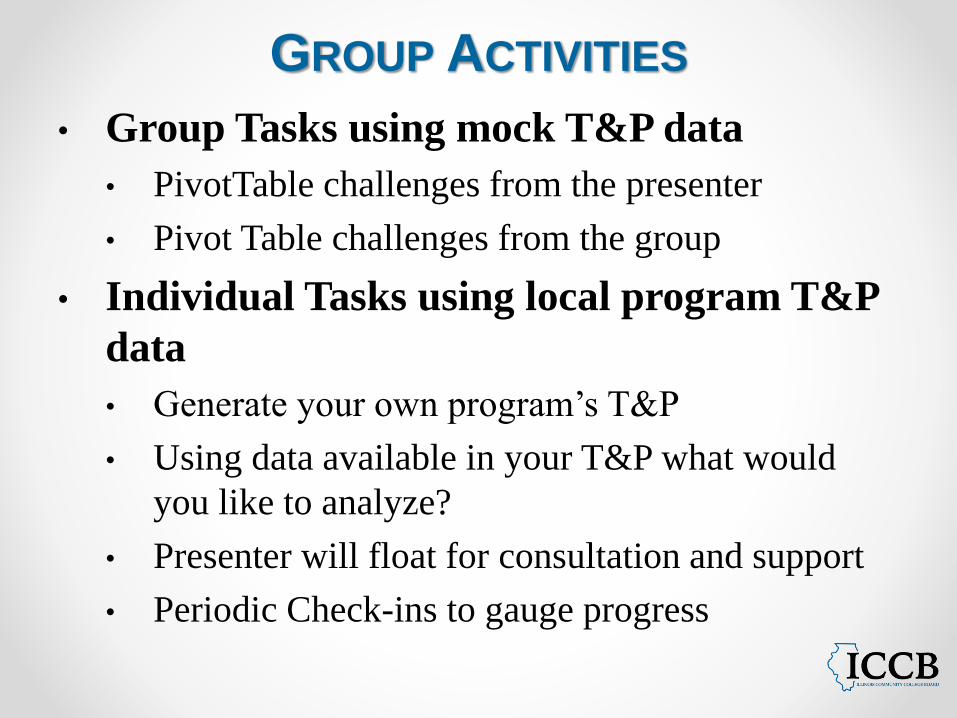
• Group Tasks using mock T&P data
• PivotTable challenges from the presenter
• Pivot Table challenges from the group
• Individual Tasks using local program T&P
data
• Generate your own program’s T&P
• Using data available in your T&P what would
you like to analyze?
• Presenter will float for consultation and support
• Periodic Check-ins to gauge progress
GROUP ACTIVITIES
• Return to large group discussion.
• Sharing of findings from individual work.
• Thoughts on the process?
• Things we still need to know /require
additional clarification?
• Other questions / comments?
FINAL THOUGHTS


THANK YOU FOR JOINING ME TODAY!


![[ Getting Acquainted with Pentaho Components ]reportes.fuxionbiotech.com/pentaho/docs/components.pdf · [ Getting Acquainted with Pentaho Components ]] ... Pentaho BA Suite helps](https://static.fdocuments.in/doc/165x107/5ad7ac027f8b9a991b8c5bad/-getting-acquainted-with-pentaho-components-getting-acquainted-with-pentaho-components.jpg)