Dairy Sector Risk and Risk Management in Europe Declan O Connor Cork Institute of Technology,...
33
Dairy Sector Risk and Risk Management in Europe Declan O Connor Cork Institute of Technology, Ireland 20th Annual National Workshop for Dairy Economists and Policy Analysts May 13, 2013
-
Upload
gerard-dorsey -
Category
Documents
-
view
216 -
download
0
Transcript of Dairy Sector Risk and Risk Management in Europe Declan O Connor Cork Institute of Technology,...
Dairy Sector Risk and Risk Management in Europe
Declan O ConnorCork Institute of Technology, Ireland
20th Annual National Workshop for Dairy Economists and Policy Analysts May 13, 2013
•Price Volatility in EU Dairy Markets – A New Era
•What is the Response?
•What are the Challenges?
•Conclusions
Overview
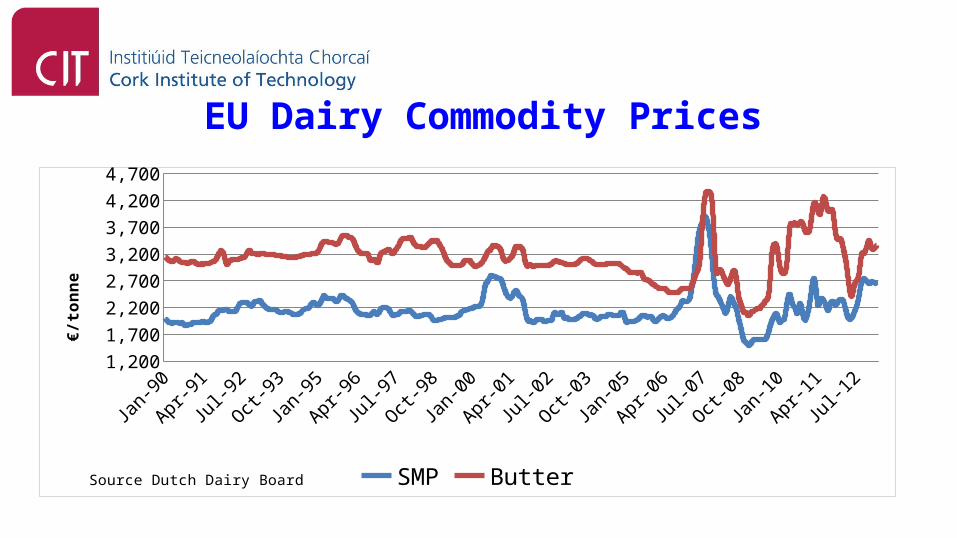
EU Dairy Commodity Prices
Jan-90
Jan-91
Jan-92
Jan-93
Jan-94
Jan-95
Jan-96
Jan-97
Jan-98
Jan-99
Jan-00
Jan-01
Jan-02
Jan-03
Jan-04
Jan-05
Jan-06
Jan-07
Jan-08
Jan-09
Jan-10
Jan-11
Jan-12
Jan-131,200
1,700
2,200
2,700
3,200
3,700
4,200
4,700
SMP Butter
€/to
nne
Source Dutch Dairy Board
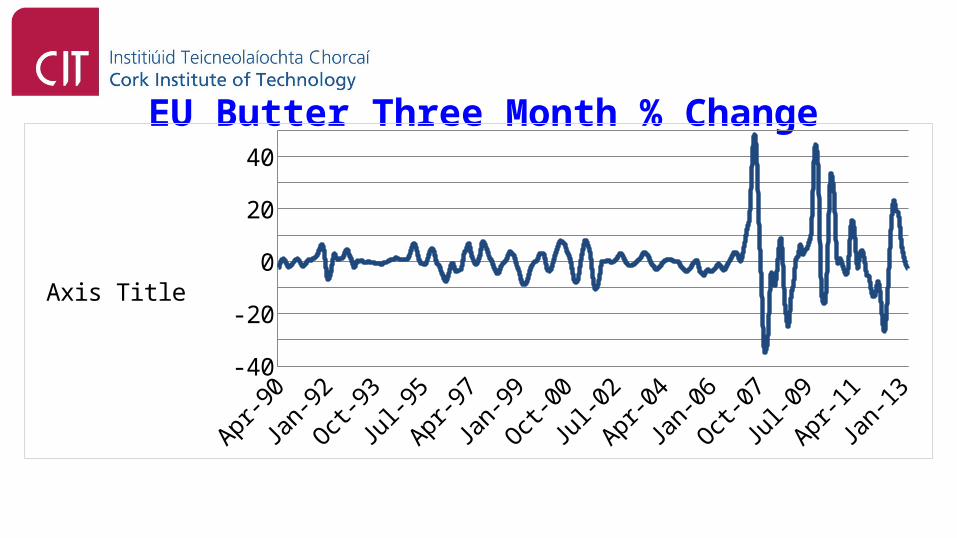
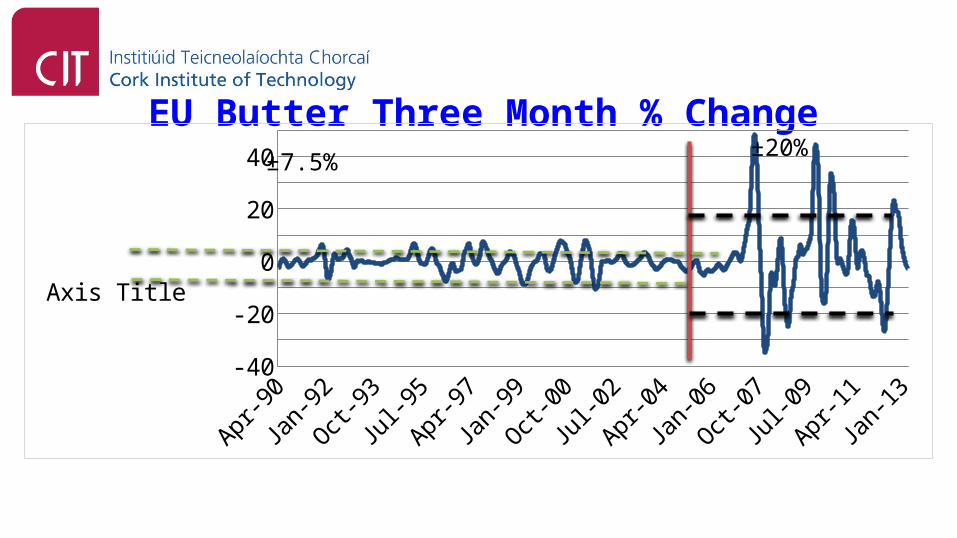
EU Butter Three Month % Change
Apr-90Jul-9
1
Oct-92Jan
-94
Apr-95Jul-9
6
Oct-97Jan
-99
Apr-00Jul-0
1
Oct-02Jan
-04
Apr-05Jul-0
6
Oct-07Jan
-09
Apr-10Jul-1
1
Oct-12
-40-30-20-10
01020304050
Axis Title
EU Butter Three Month % Change
Apr-90Jul-9
1
Oct-92Jan
-94
Apr-95Jul-9
6
Oct-97Jan
-99
Apr-00Jul-0
1
Oct-02Jan
-04
Apr-05Jul-0
6
Oct-07Jan
-09
Apr-10Jul-1
1
Oct-12
-40-30-20-10
01020304050
Axis Title
±7.5%±20%
1990-2001 2002-2013(3)€2,000
€2,500
€3,000
€3,500
€4,000
€4,500
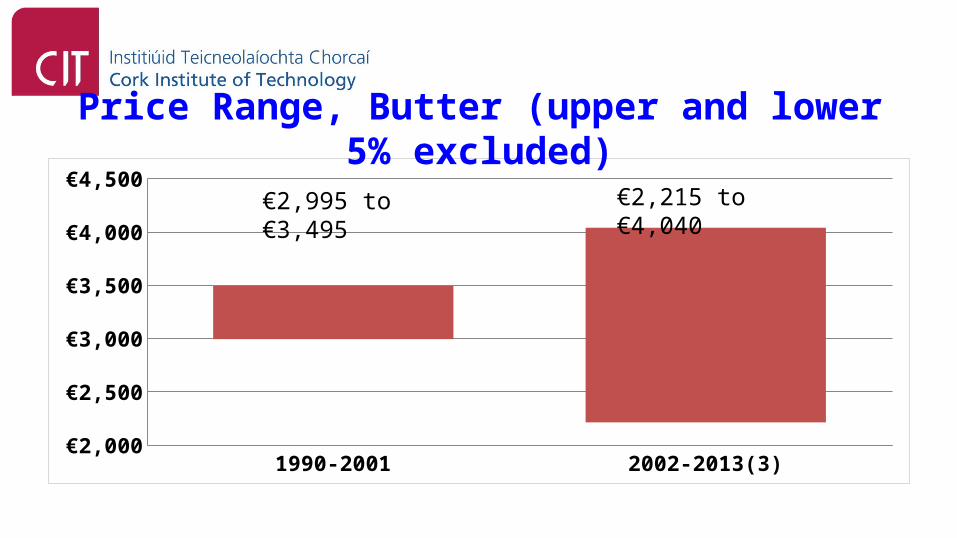
Price Range, Butter (upper and lower 5% excluded)
€2,995 to €3,495
€2,215 to €4,040
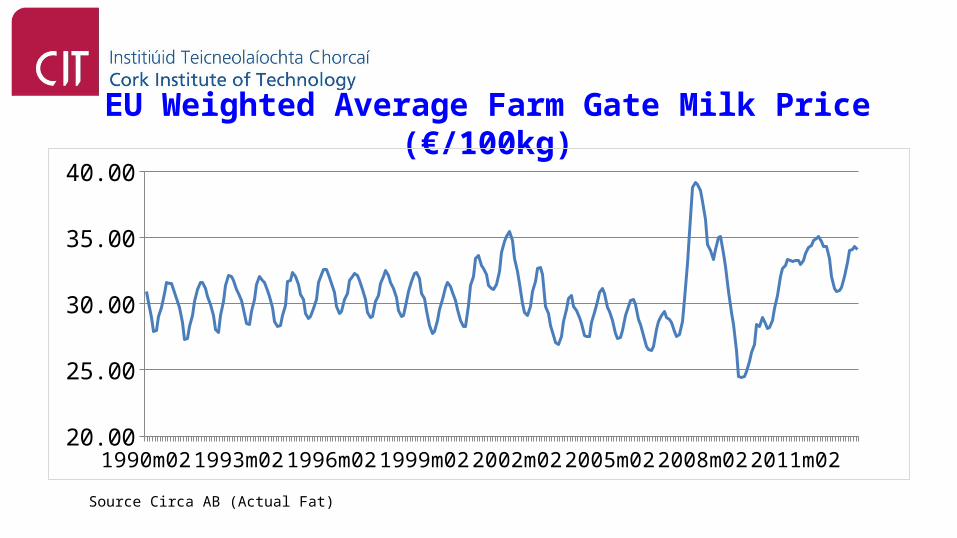
EU Weighted Average Farm Gate Milk Price (€/100kg)
1990m02 1992m09 1995m04 1997m11 2000m06 2003m01 2005m08 2008m03 2010m1020.0022.0024.0026.0028.0030.0032.0034.0036.0038.0040.00
Source Circa AB (Actual Fat)
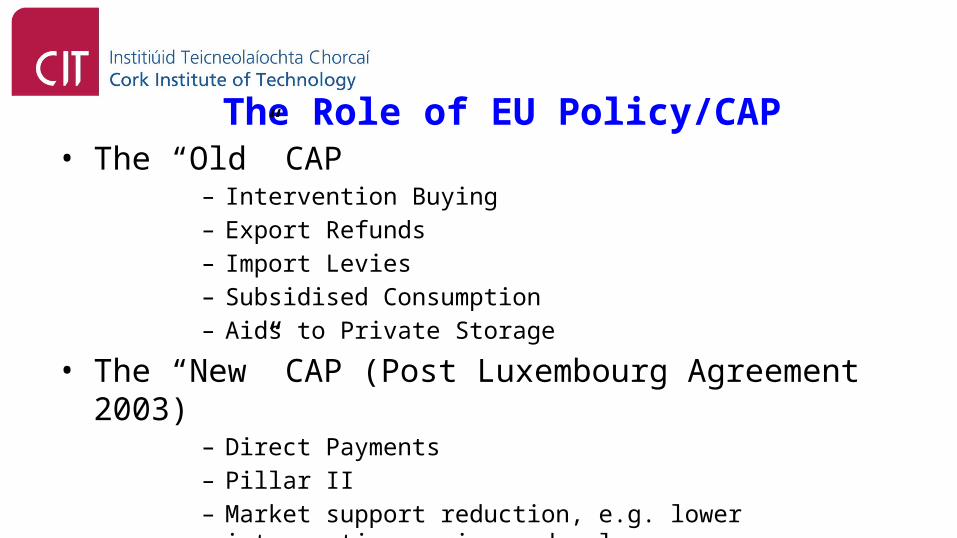
The Role of EU Policy/CAP• The “Old” CAP
– Intervention Buying– Export Refunds– Import Levies– Subsidised Consumption– Aids to Private Storage
• The “New” CAP (Post Luxembourg Agreement 2003)– Direct Payments– Pillar II – Market support reduction, e.g. lower intervention, price and volume
Hammock to Safety Net to……
•Price Volatility in EU Dairy Markets – A New Era
•What is the Response?
•What are the Challenges?
•Conclusions
Overview
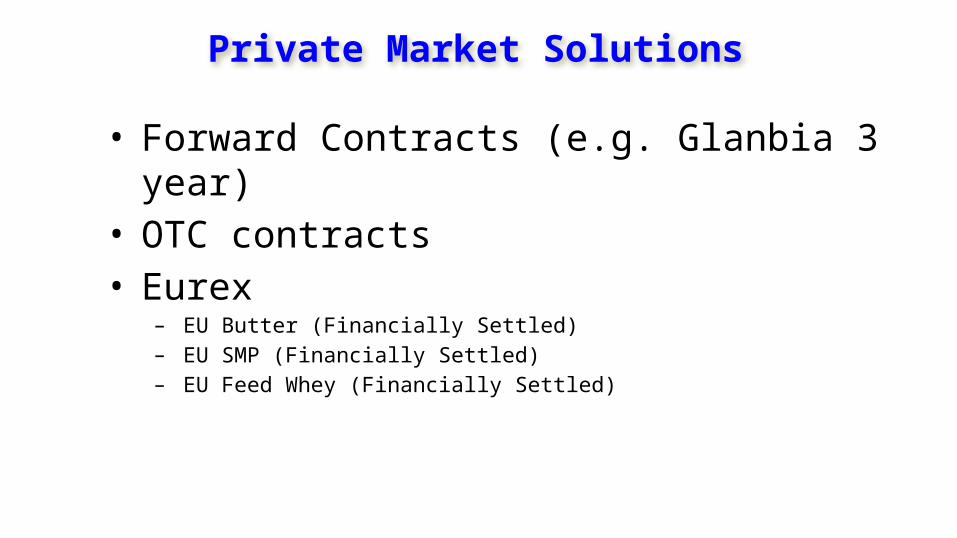
• Forward Contracts (e.g. Glanbia 3 year)• OTC contracts• Eurex
– EU Butter (Financially Settled) – EU SMP (Financially Settled)– EU Feed Whey (Financially Settled)
Private Market Solutions
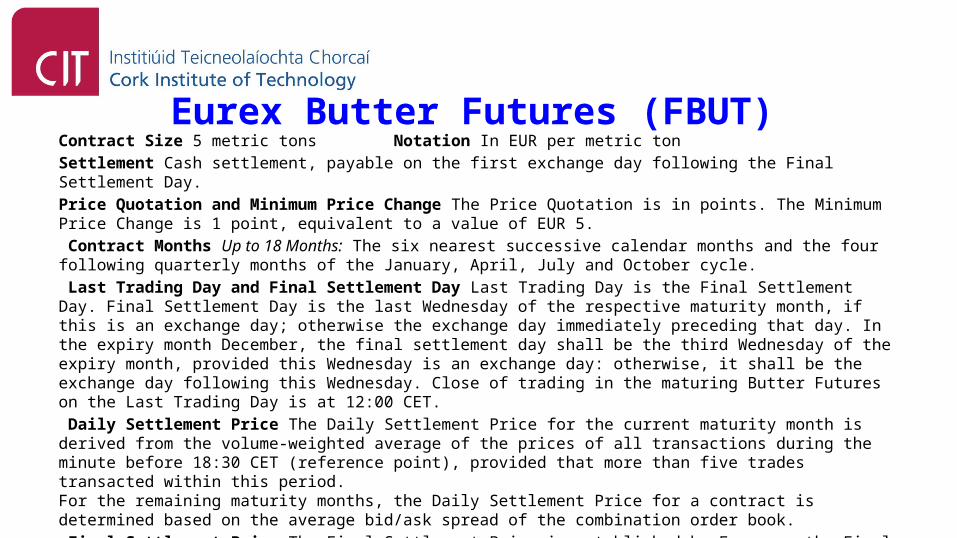
Eurex Butter Futures (FBUT)Contract Size 5 metric tons Notation In EUR per metric ton Settlement Cash settlement, payable on the first exchange day following the Final Settlement Day. Price Quotation and Minimum Price Change The Price Quotation is in points. The Minimum Price Change is 1 point, equivalent to a value of EUR 5. Contract Months Up to 18 Months: The six nearest successive calendar months and the four following quarterly months of the January, April, July and October cycle. Last Trading Day and Final Settlement Day Last Trading Day is the Final Settlement Day. Final Settlement Day is the last Wednesday of the respective maturity month, if this is an exchange day; otherwise the exchange day immediately preceding that day. In the expiry month December, the final settlement day shall be the third Wednesday of the expiry month, provided this Wednesday is an exchange day: otherwise, it shall be the exchange day following this Wednesday. Close of trading in the maturing Butter Futures on the Last Trading Day is at 12:00 CET. Daily Settlement Price The Daily Settlement Price for the current maturity month is derived from the volume-weighted average of the prices of all transactions during the minute before 18:30 CET (reference point), provided that more than five trades transacted within this period.For the remaining maturity months, the Daily Settlement Price for a contract is determined based on the average bid/ask spread of the combination order book. Final Settlement Price The Final Settlement Price is established by Eurex on the Final Settlement Day, based on the value of the Eurex Butter Index at 19:00 CET.
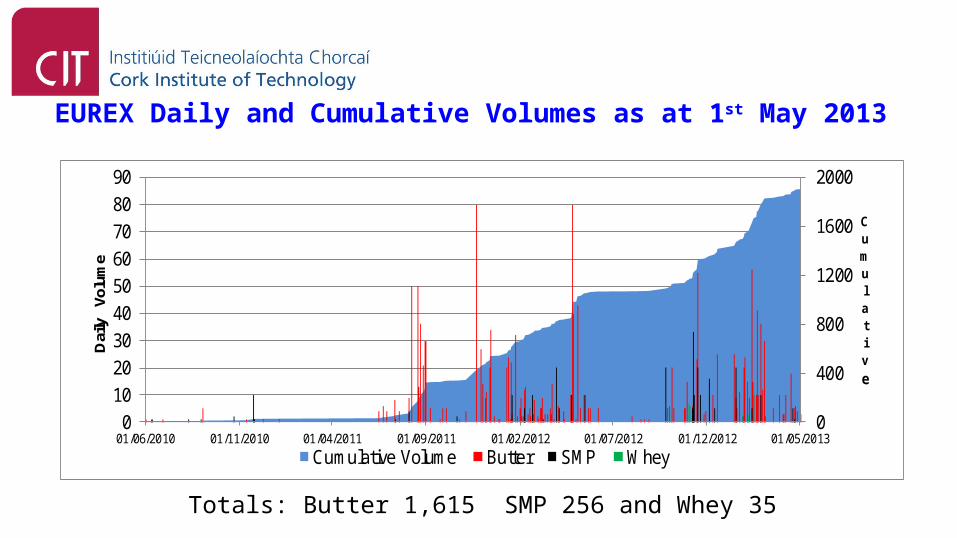
EUREX Daily and Cumulative Volumes as at 1st May 2013
0
400
800
1200
1600
2000
0
10
20
30
40
50
60
70
80
90
01/06/2010 01/11/2010 01/04/2011 01/09/2011 01/02/2012 01/07/2012 01/12/2012 01/05/2013
Cumulativ
e
Daily
Volume
Cumulative Volume Butter SMP Whey
Totals: Butter 1,615 SMP 256 and Whey 35
Recent and Future EU Policy/CAP
• High Level Group (Milk Package)– Written contracts between milk producers and processors– Possibility to negotiate contract terms collectively via producer
organizations– Specific rules for inter-branch organisations– Increased transparency and better information
• Current CAP Reform Proposals
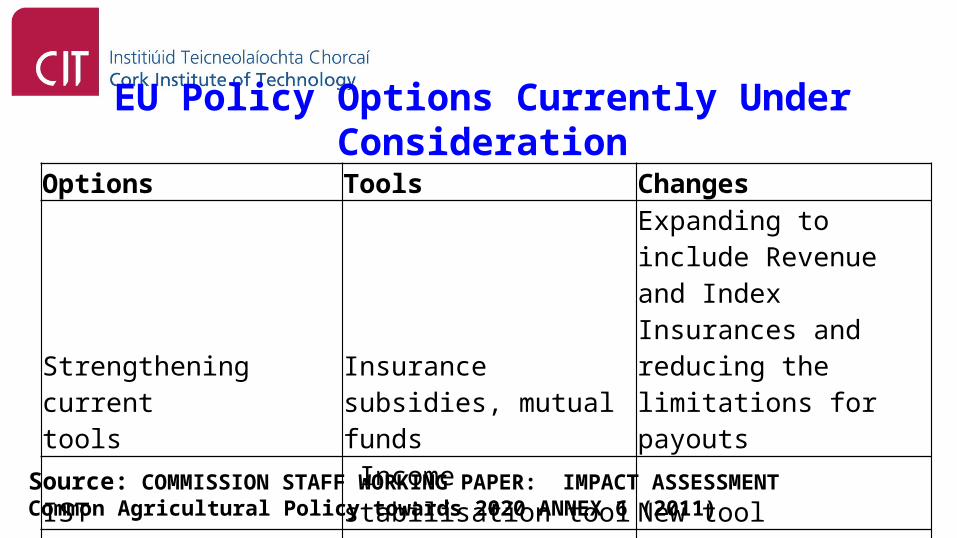
EU Policy Options Currently Under Consideration
Options Tools Changes
Strengthening current tools
Insurance subsidies, mutual funds
Expanding to include Revenue and Index Insurances and reducing the limitations for payouts
IST Income stabilisation tool New tool
Crisis fund Agricultural calamity fund New tool
Source: COMMISSION STAFF WORKING PAPER: IMPACT ASSESSMENT Common Agricultural Policy towards 2020 ANNEX 6 (2011)
EU Policy Options Cont.
European parliament proposalArticle 156A Measure to address severe imbalance in the market for milk and milk products
• Aid to producers who reduce production by 5% and levy on those who exceed 5%
• ..take into account the development of production costs, particularly the costs of inputs
Useful Sources for CAP Developments• http://ec.europa.eu/agriculture/index_en.htm (Agriculture and Rural
Development)• http://ec.europa.eu/agriculture/cap-post-2013/legal-proposals/index_en.htm
(Legal proposals for the CAP after 2013)• http://eu2013.ie/ireland-and-the-presidency/the-eu-and-policy-areas/agricult
ure-and-fisheries/ (Irish presidency)
• http://ec.europa.eu/agriculture/milk/index_en.htm (Milk and milk products)• http://capreform.eu/ (blog of news, views and analysis relating to the CAP)

•Price Volatility in EU Dairy Markets – A New Era
•What is the Response?
•What are the Challenges?
•Conclusions
Overview

Diverse Nature of EU Dairy SectorEU Ireland Denmark France Poland Slovenia
% of EU Production
3.9 3.5 17.4 7.0 0.4
Average Herd (Cows)
30 56 139 47 16 15
Average Yield (Kg/head)
6,489 5,282 8,589 6,926 4,952 5,682
Average Production per Farm (Kg)
191,951 294,359 1,194,338 328,544 76,817 86,040
Source: Dutch Dairy Board
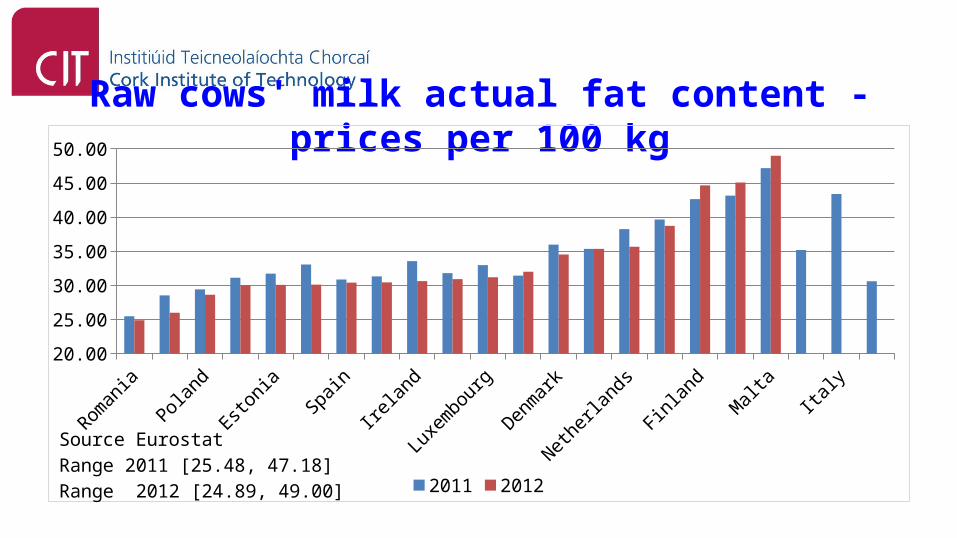
Raw cows' milk actual fat content - prices per 100 kg
Romania
Lithuania
Poland
Slovenia
Estonia
BelgiumSpain
Hungary
Ireland
Slovakia
Luxe
mbourg
Portugal
Denmark
Austria
Netherlands
Sweden
Finland
GreeceMalta
Germany
Italy
United Kingdom
20.00
25.00
30.00
35.00
40.00
45.00
50.00
2011 2012
Source EurostatRange 2011 [25.48, 47.18]Range 2012 [24.89, 49.00]
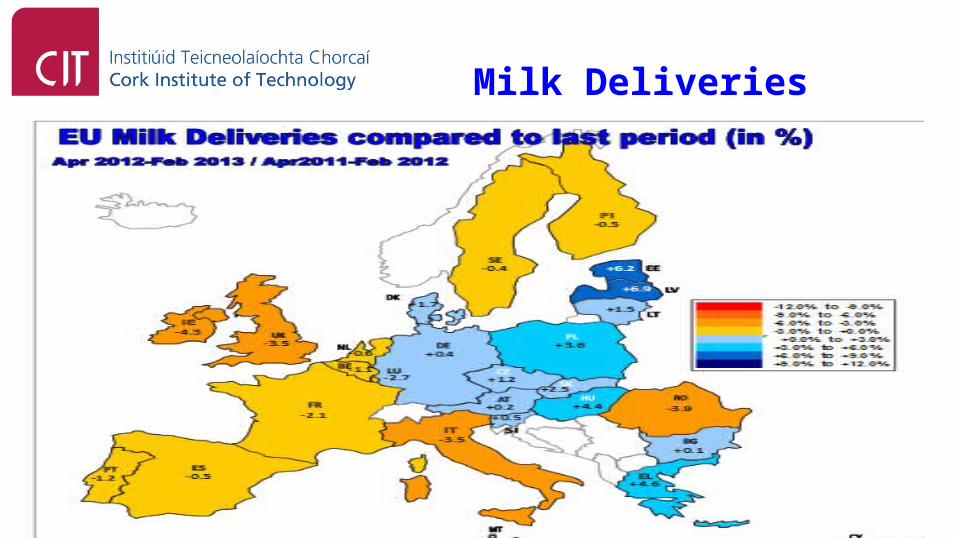
Milk Deliveries
How practical are the policy solutions?
• Time to design and implement• Data inadequacy• Financing• Co-financing
How practical are the Private Risk Management Solutions?
• These options are based on risk sharing or risk transfer so they will require
– Data– Education– Support
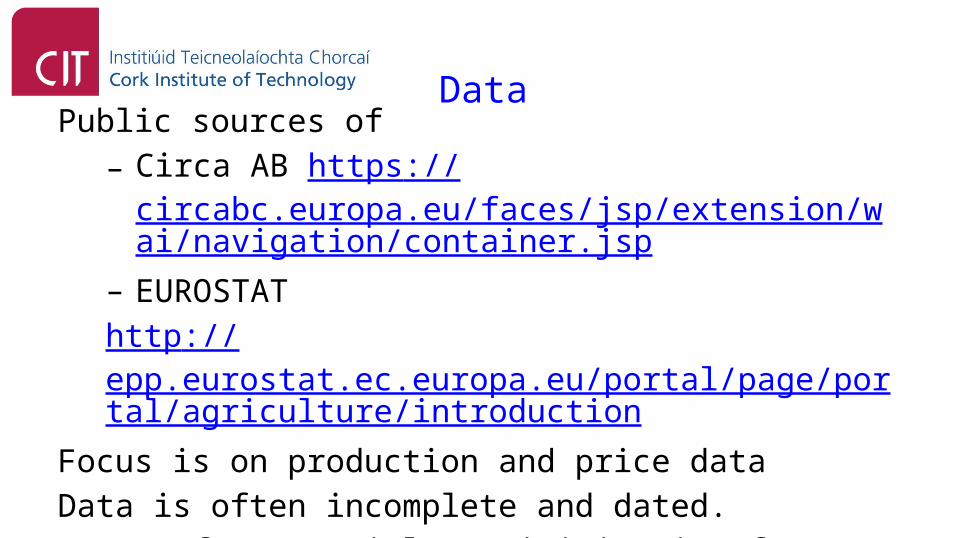
DataPublic sources of
– Circa AB https://circabc.europa.eu/faces/jsp/extension/wai/navigation/container.jsp
– EUROSTAThttp://epp.eurostat.ec.europa.eu/portal/page/portal/agriculture/introduction
Focus is on production and price dataData is often incomplete and dated. Issue of commercial sensitivity is often cited.

Data Cont.
Commercial sources • Some is free but usually quite dated• Are developing• Faster dissemination• More relevant data• More user friendly• Cost
End of Production Quota
• What are the expansion estimates?• ECOMM
– milk production is projected to register a cumulative increase of about 8% from 2009 to 2022, while milk delivered to dairies would increase by around 10%.
– By the last quota year (2014-15), EU milk deliveries are projected to be some 6% below quota.

End of Production Quota• OECD-FAO Agricultural Outlook 2012-2021
– 6.8% 2010 to 2021
• FAPRI– 4.2% 2010 to 2021
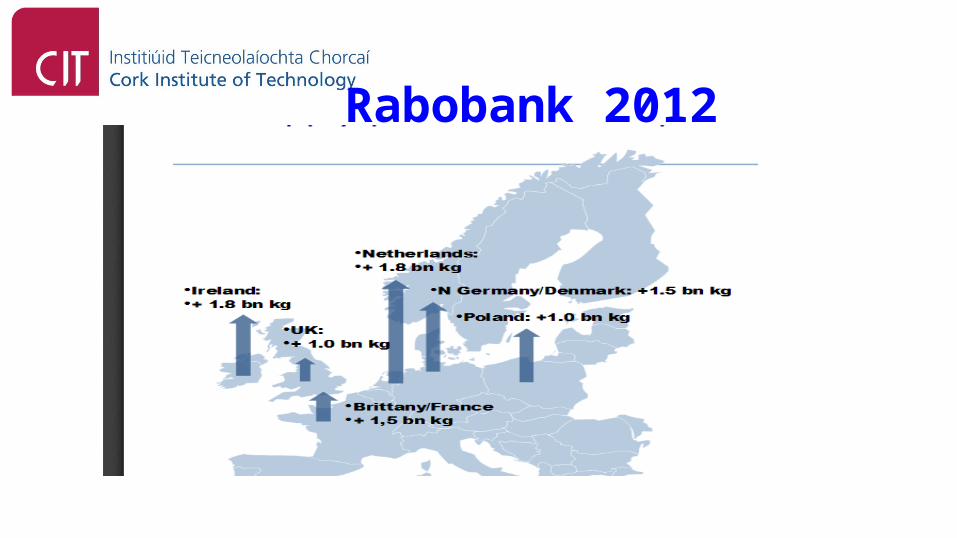
Rabobank 2012
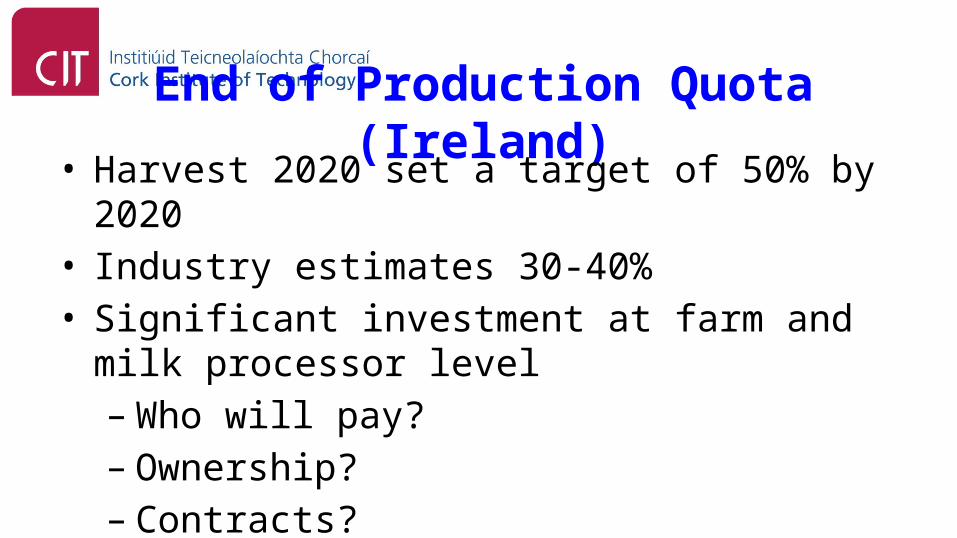
End of Production Quota (Ireland)• Harvest 2020 set a target of 50% by 2020• Industry estimates 30-40%• Significant investment at farm and milk processor
level– Who will pay?– Ownership?– Contracts?
•Price Volatility in EU Dairy Markets – A New Era
•What is the Response?
•What are the Challenges?
•Conclusions
Overview
Conclusions• Volatility in EU dairy is a relatively new phenomenon.• As well as being more volatile prices are reaching new highs
and lows.• Volatility is now on the agenda.• The EU dairy sector is quite heterogeneous so it is unlikely
that there will be a “one size fits all” solution to price volatility.
Conclusions cont.• Unlikely there will be a comprehensive solution in the short
run as there are gaps Data Education
• Farmers and processors will have to reconsider how they price milk.
• Learn from others (USDA/RMA, data, education).
Thank you
Declan O Connor PhDCork Institute of TechnologyPhone ++ 353 87 6151284
The support received through the Stimulus Fund of the Irish Dept. of Agriculture and Food for this research is gratefully acknowledged