Dairy Rations 2013 - Feed Supplements v HDF Diets.pdf · Dairy Rations 2013 Phosphorus & HDF ......
29
Dairy Rations 2013 Phosphorus & HDF Based Diets Diets are changing! Richard Keel UK Business Manager, Feed Supplements Car 07786 767571
Transcript of Dairy Rations 2013 - Feed Supplements v HDF Diets.pdf · Dairy Rations 2013 Phosphorus & HDF ......

Dairy Rations 2013Phosphorus & HDF Based Diets
Diets are changing!
Richard KeelUK Business Manager, Feed Supplements
Car 07786 767571
Grass Silage - Poor Source of Minerals
0
50
100
150
200
250
Supp
ly a
s %
of A
llow
ance
Ca P Mg Na Fe Cu Mn Co Zn I SeElementData: Based on a 625kg cow giving 30 litres
with a total DMI of 20kg, 11kgDM from grass silage

Maize Silage Mineral Profile vs Grass Silage
0%
10%
20%
30%
40%
50%
60%
70%
80%
90%
100%
Ca P Mg Na Fe Mn Co Zn Cu SeData; 2012
Feeding Concentrates & Raw Materials Review

RMs Ingredient “Spot” Cost Changes (£/t) – Dec 2011 to Dec 2012
-20
0
20
40
60
80
100
120
140
160
Soya hullsWheatfeedWheatSunflowerCitrusMineralsMolassesRapeHi Pro Soya
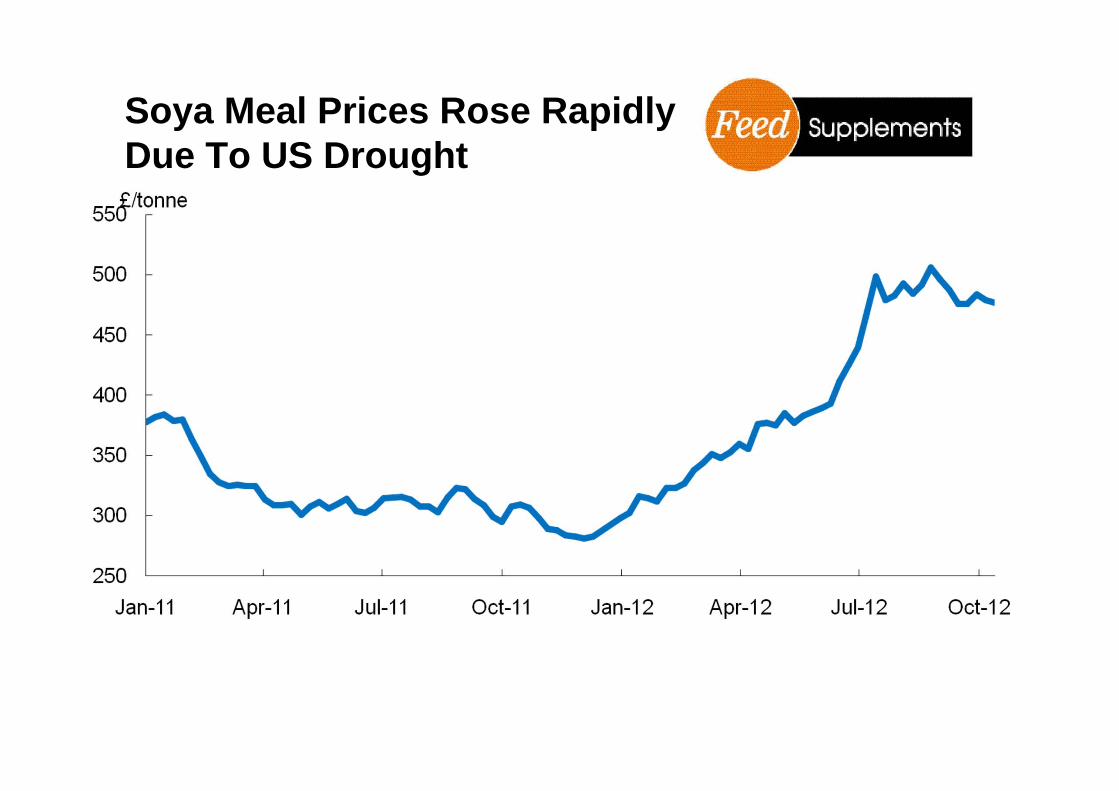
Soya Meal Prices Rose Rapidly Due To US Drought

Feed Prices Higher As A Result
200
220
240
260
280
300
320
340
360
Jan-12 Feb-12 Mar-12 Apr-12 May-12 Jun-12 Jul-12 Aug-12 Sep-12 Oct-12
£/tonne
Dairy 18 HSDairy 21 HSDairy 18 HDF

UK Raw “Spot” Material Market
Raw Material
November 2009
November 2010
November 2011
November 2012
% Change November
2011 v 2012Wheat 95 170 150 220 +48%
Hi Pro Soya 265 298 240 390 +63%
Rapemeal 117 208 176 250 +45%
Soya Hulls 90 148 147 185 +30%
Citrus Pulp 95 150 154 195 +30%
Wheatfeed 80 135 146 180 +30%
Sunflower 125 172 151 225 +48%
Milk Price pp/l
24.8 26.1 29.4 30 +2.5%
Milk Prices – source DEFRA (excludes any bonus’s)

Phosphorus Requirements

Phosphorus
Supply v Requirement

Current UK Allowances
Yield ARC (1965)g/day
TCORN (1991)g/day
DMI FiMkg
%Pin DM
Maintenance 33 39 11.5 0.345 41 48 12.5 0.3810 50 57 12.7 0.4515 59 59 13.8 0.4320 67 66 15.5 0.4325 76 78 17.3 0.4530 85 87 18.8 0.4635 93 97 20.3 0.4840 102 107 22.0 0.4945 111 116 23.9 0.4950 119 126 25.8 0.49Late Dry 41 43 10.0 0.43
Assuming 600kg Cow
Using TCORNFigures

Phosphorus & Reproduction• P Deficiency Often Associated with Poor Fertility
– difficult to separate effect of P from other dietary inadequacies
• Research Suggests 0.38%P in DM is Adequate (Wu et al)– for high yielding cows (9000l)
• Reducing P Means Reducing Costs– also reduces environmental impact
• But have we reduced too far for some HDF based diets?
• Time to check compound feed declaration tickets– Is DCP listed in the ingredients section as an addition?

Blood Tests
• We know freshly calved/mid lactation cows have a wide range of blood plasma values, whereas –
• Calcium is much more consistent

Phosphorus Content of Diets and Feeds
• Unsupplemented Dairy Diets– typically contain range 0.30-0.44%P on DM basis
• The Content of P in Forages is Variable– 0.2% - 0.6% in grass and grass silage
• P levels in Herbage Depend on Stage of Growth and Amount of Fertiliser N Supplied– positive relationship between P and Crude Protein
• Testing of Forages is Essential due to this Wide Range of P Content
• Soil contamination/Aluminium antagonises P phytate absorption– Many winter grass silage forages are heavily contaminated this year

Soil ContaminationAluminium v Phosphorus

Rising Feed CostsRe-formulation Of Dairy Rations
Compound FeedsBlendsTMR
Co-Products

Understanding Straights v Blends/Compound
Lab Data; 1999-2004
Element Unit Starch Dairy HDF Dairy SBP DDGS Hi Pro Soya
Calcium % 1.00 1.20 0.97 0.08 0.25
Phosphorus % 0.50 0.31 0.06 0.80 0.65
Magnesium % 0.45 0.45 0.17 0.30 0.30
Copper mg/kg 40 40 6 3 14
Manganese mg/kg 60 60 45 25 37
Zinc mg/kg 115 115 28 58 43
Selenium mg/kg 0.50 0.50 0.10 0.06 0.01
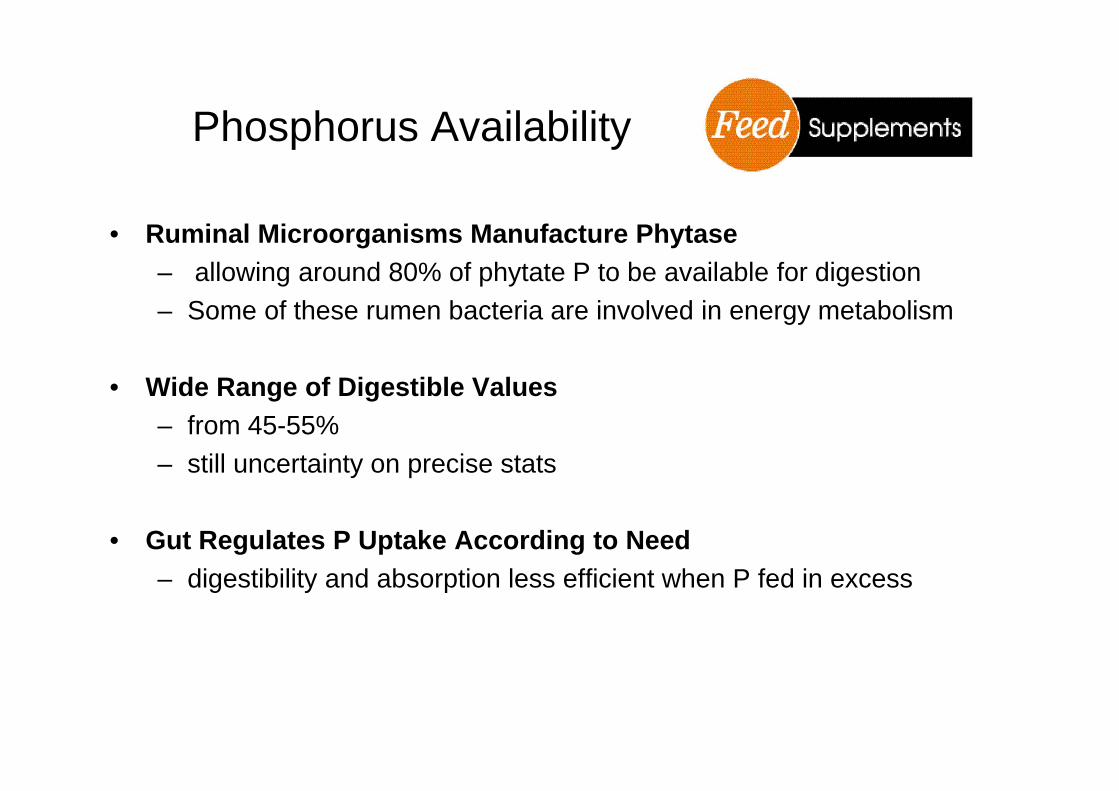
Phosphorus Availability
• Ruminal Microorganisms Manufacture Phytase– allowing around 80% of phytate P to be available for digestion– Some of these rumen bacteria are involved in energy metabolism
• Wide Range of Digestible Values– from 45-55%– still uncertainty on precise stats
• Gut Regulates P Uptake According to Need– digestibility and absorption less efficient when P fed in excess
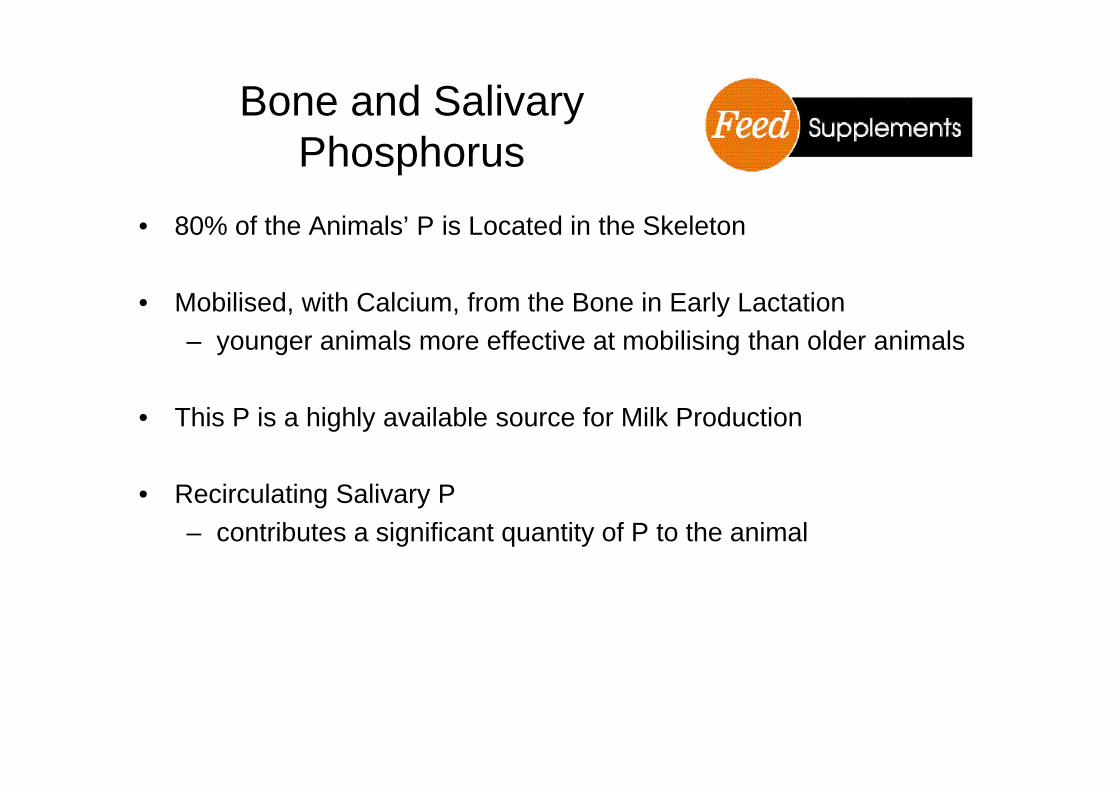
Bone and Salivary Phosphorus
• 80% of the Animals’ P is Located in the Skeleton
• Mobilised, with Calcium, from the Bone in Early Lactation– younger animals more effective at mobilising than older animals
• This P is a highly available source for Milk Production
• Recirculating Salivary P– contributes a significant quantity of P to the animal

Excess Dietary P is Excreted Not Stored
20
30
40
50
60
70
80
50 65 80 95 110 125P Intake (g/day)
Faec
al P
Exc
retio
n (g
/day
)
Source: Wu et al Penn State

Are We Feeding Too Much Or Too Little Phosphorus?
• Historical allowances for P were too high– research shows that 0.38%P in DM is sufficient for 9000l cows– compound feed could reduce P to 0.45%– some TMR requires very little P supplementation– BUT some TMR diets are now short on P
• for some early, mid AND late lactation diets
• Reducing P Content of Diets– reduces P wastage– allows more efficient utilisation– reduces environmental pollution– REDUCES COST– But can lead too P deficiency in lactating dairy cows

UK Recommendations
• Maximum of 0.4% P in DM – for total diet
• Compound Feeds reduced P to 0.5%
• Allows for Variable Digestibility & Feeding Rates
• Test Forages for P Content
• Review precisely what is in the formulation – Blend– Compound– TMR

Feed Compounders Cost & Space Savings
• Just reducing P from 0.6% to 0.5%= 1.0kg P less per tonne of cake
• 1.0kg P = 5.5kg DCP @18%DCP = £2.75 cost saving– also removes 1.25kg calcium
• Replacing Ca with limestone = 3.25kg limestone = circa £0.15
• Cost saving = £2.60/t cake
• And 1.75kg “formulation space"
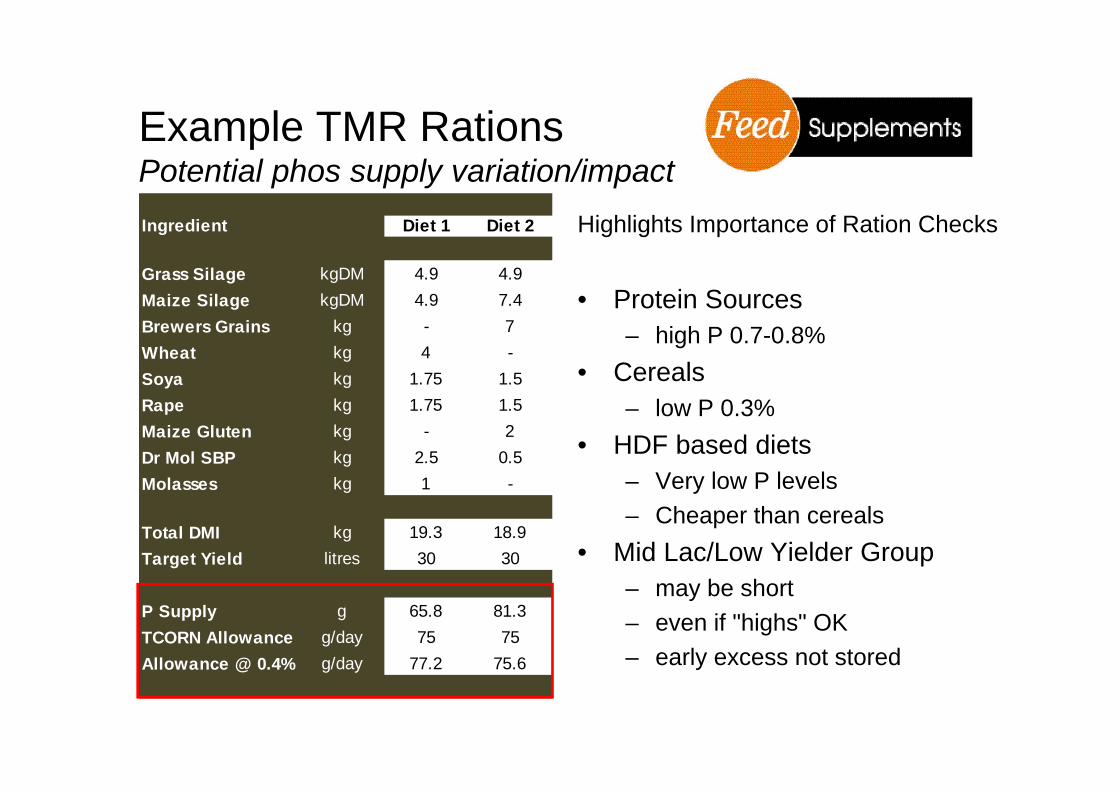
Example TMR RationsPotential phos supply variation/impact
Highlights Importance of Ration Checks
• Protein Sources– high P 0.7-0.8%
• Cereals– low P 0.3%
• HDF based diets– Very low P levels– Cheaper than cereals
• Mid Lac/Low Yielder Group– may be short– even if "highs" OK– early excess not stored
Ingredient Diet 1 Diet 2
Grass Silage kgDM 4.9 4.9Maize Silage kgDM 4.9 7.4Brewers Grains kg - 7Wheat kg 4 -Soya kg 1.75 1.5Rape kg 1.75 1.5Maize Gluten kg - 2Dr Mol SBP kg 2.5 0.5Molasses kg 1 -
Total DMI kg 19.3 18.9Target Yield litres 30 30
P Supply g 65.8 81.3TCORN Allowance g/day 75 75Allowance @ 0.4% g/day 77.2 75.6

Important to Know Phosphorus Status
• Reduced P in Purchased Feeds by some feed compounders– may reduce P intake below requirements– check declaration tickets
• Calcium requirements– target 1.7/2 to 1 (Ca/P)
• Essential to Analyse Forages to – determine P Level – understand antagonists– wide variation in forages– straights fairly constant

Balancing Phosphorus & Calcium Status
• P availability – is also affected by Ca levels
• By reducing the amount of P in the diet – we allow more ‘formulation space’ for calcium,
• Therefore optimising the ratio and overall supply of both P and Ca at a more accurate level

Calculation – Ca & P With Silage• Assuming 10kgDM silage + 10kg Cake
– 18.8kg DMI– 50/50 grass/maize silage
• Ca & P allowance– 0/7% & 0.4%/kg DMI– 132 & 75g requirement
• Average silage contains – 0.59% Ca & 0.33%P (Grass Silage) & 0.26%Ca & 0.25%P (Maize)– 43g & 29g supply
• Cake must contain – 0.9% Ca & 0.46%P

Solutions to Feeding High Phosphorus
• Some diets may require an additional 30 -50g DCP/hd/day via the TMR– Dependant on RMs fed
• Reduced use of Inorganic P Fertilisers– therefore potentially reducing forage P content
• Development of Total Manure Treatment Systems– rather than individual components of manure handling