
Dairy Products 04/04/2018 - nass.usda.gov Products Production by Product – United States: February...
20
Dairy Products ISSN: 1949-0399 Released April 4, 2018, by the National Agricultural Statistics Service (NASS), Agricultural Statistics Board, United States Department of Agriculture (USDA). February 2018 Highlights Total cheese output (excluding cottage cheese) was 982 million pounds, 4.2 percent above February 2017 but 10.5 percent below January 2018. Italian type cheese production totaled 424 million pounds, 4.3 percent above February 2017 but 10.6 percent below January 2018. American type cheese production totaled 397 million pounds, 6.1 percent above February 2017 but 8.5 percent below January 2018. Butter production was 169 million pounds, 4.7 percent above February 2017 but 7.4 percent below January 2018. Dry milk products (comparisons in percentage with February 2017) Nonfat dry milk, human - 159 million pounds, up 12.1 percent. Skim milk powder - 36.5 million pounds, down 8.9 percent. Whey products (comparisons in percentage with February 2017) Dry whey, total - 89.4 million pounds, up 14.6 percent. Lactose, human and animal - 86.8 million pounds, up 2.3 percent. Whey protein concentrate, total - 39.9 million pounds, up 10.7 percent. Frozen products (comparisons in percentage with February 2017) Ice cream, regular (hard) - 55.5 million gallons, down 5.8 percent. Ice cream, lowfat (total) - 35.2 million gallons, up 3.5 percent. Sherbet (hard) - 2.88 million gallons, up 6.4 percent. Frozen yogurt (total) - 4.62 million gallons, down 9.8 percent.
Transcript of Dairy Products 04/04/2018 - nass.usda.gov Products Production by Product – United States: February...

Dairy Products
ISSN: 1949-0399
Released April 4, 2018, by the National Agricultural Statistics Service (NASS), Agricultural Statistics Board, United States Department of
Agriculture (USDA).
February 2018 Highlights Total cheese output (excluding cottage cheese) was 982 million pounds, 4.2 percent above February 2017 but
10.5 percent below January 2018.
Italian type cheese production totaled 424 million pounds, 4.3 percent above February 2017 but 10.6 percent below
January 2018.
American type cheese production totaled 397 million pounds, 6.1 percent above February 2017 but 8.5 percent below
January 2018.
Butter production was 169 million pounds, 4.7 percent above February 2017 but 7.4 percent below January 2018.
Dry milk products (comparisons in percentage with February 2017)
Nonfat dry milk, human - 159 million pounds, up 12.1 percent.
Skim milk powder - 36.5 million pounds, down 8.9 percent.
Whey products (comparisons in percentage with February 2017)
Dry whey, total - 89.4 million pounds, up 14.6 percent.
Lactose, human and animal - 86.8 million pounds, up 2.3 percent.
Whey protein concentrate, total - 39.9 million pounds, up 10.7 percent.
Frozen products (comparisons in percentage with February 2017)
Ice cream, regular (hard) - 55.5 million gallons, down 5.8 percent.
Ice cream, lowfat (total) - 35.2 million gallons, up 3.5 percent.
Sherbet (hard) - 2.88 million gallons, up 6.4 percent.
Frozen yogurt (total) - 4.62 million gallons, down 9.8 percent.

2 Dairy Products (April 2018) USDA, National Agricultural Statistics Service
Contents
Dairy Products Production by Product – United States: February 2017 and 2018 ................................................................. 3
Whey and Modified Whey Products Production, Stocks, and Prices – United States: February 2017 and 2018 ................... 4
Condensed and Dry Milk Products Production, Stocks, and Shipments – United States:
February 2017 and 2018 .......................................................................................................................................................... 5
Dairy Products Production by Product and Month – United States: 2017 and 2018 .............................................................. 6
Total Cheese Production Excluding Cottage Cheese – States and United States: February 2017 and 2018 ........................ 13
American Cheese Production – States and United States: February 2017 and 2018 ............................................................ 14
Cheddar Cheese Production – States and United States: February 2017 and 2018 .............................................................. 14
Total Italian Cheese Production – States and United States: February 2017 and 2018 ........................................................ 15
Mozzarella Cheese Production – States and United States: February 2017 and 2018 .......................................................... 15
Butter Production – States and United States: February 2017 and 2018 .............................................................................. 16
Nonfat Dry Milk (Human) Production – States and United States: February 2017 and 2018 .............................................. 16
Dry Whey (Human) Production – States and United States: February 2017 and 2018 ........................................................ 17
Ice Cream, Regular (Hard) Production – States and United States: February 2017 and 2018 .............................................. 17
Dairy Products Regions ......................................................................................................................................................... 18
Statistical Methodology ......................................................................................................................................................... 19
Information Contacts ............................................................................................................................................................. 20
Dairy Products (April 2018) 3 USDA, National Agricultural Statistics Service
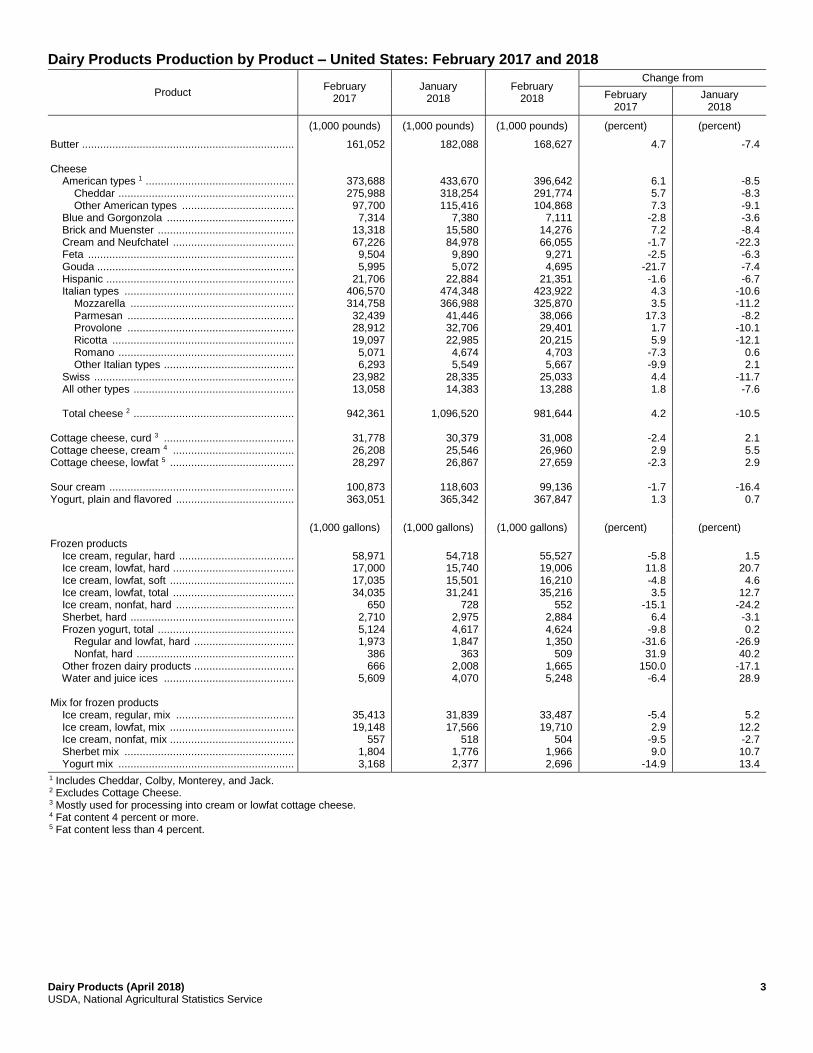
Dairy Products Production by Product – United States: February 2017 and 2018
Product February
2017 January
2018 February
2018
Change from
February 2017
January 2018
(1,000 pounds) (1,000 pounds) (1,000 pounds) (percent) (percent)
Butter ...................................................................... Cheese American types 1 ................................................. Cheddar .......................................................... Other American types ..................................... Blue and Gorgonzola .......................................... Brick and Muenster ............................................. Cream and Neufchatel ........................................ Feta .................................................................... Gouda ................................................................. Hispanic .............................................................. Italian types ........................................................ Mozzarella ...................................................... Parmesan ....................................................... Provolone ....................................................... Ricotta ............................................................ Romano .......................................................... Other Italian types ........................................... Swiss .................................................................. All other types ..................................................... Total cheese 2 ..................................................... Cottage cheese, curd 3 ........................................... Cottage cheese, cream 4 ........................................ Cottage cheese, lowfat 5 ......................................... Sour cream ............................................................. Yogurt, plain and flavored .......................................
161,052
373,688 275,988 97,700 7,314
13,318 67,226 9,504 5,995
21,706 406,570 314,758 32,439 28,912 19,097 5,071 6,293
23,982 13,058
942,361
31,778 26,208 28,297
100,873 363,051
182,088
433,670 318,254 115,416
7,380 15,580 84,978 9,890 5,072
22,884 474,348 366,988 41,446 32,706 22,985 4,674 5,549
28,335 14,383
1,096,520
30,379 25,546 26,867
118,603 365,342
168,627
396,642 291,774 104,868
7,111 14,276 66,055 9,271 4,695
21,351 423,922 325,870 38,066 29,401 20,215 4,703 5,667
25,033 13,288
981,644
31,008 26,960 27,659
99,136
367,847
4.7
6.1 5.7 7.3
-2.8 7.2
-1.7 -2.5
-21.7 -1.6 4.3 3.5
17.3 1.7 5.9
-7.3 -9.9 4.4 1.8
4.2
-2.4 2.9
-2.3
-1.7 1.3
-7.4
-8.5 -8.3 -9.1 -3.6 -8.4
-22.3 -6.3 -7.4 -6.7
-10.6 -11.2 -8.2
-10.1 -12.1
0.6 2.1
-11.7 -7.6
-10.5
2.1 5.5 2.9
-16.4
0.7
(1,000 gallons) (1,000 gallons) (1,000 gallons) (percent) (percent)
Frozen products Ice cream, regular, hard ...................................... Ice cream, lowfat, hard ........................................ Ice cream, lowfat, soft ......................................... Ice cream, lowfat, total ........................................ Ice cream, nonfat, hard ....................................... Sherbet, hard ...................................................... Frozen yogurt, total ............................................. Regular and lowfat, hard ................................. Nonfat, hard .................................................... Other frozen dairy products ................................. Water and juice ices ........................................... Mix for frozen products Ice cream, regular, mix ....................................... Ice cream, lowfat, mix ......................................... Ice cream, nonfat, mix ......................................... Sherbet mix ........................................................ Yogurt mix ..........................................................
58,971 17,000 17,035 34,035
650 2,710 5,124 1,973
386 666
5,609
35,413 19,148
557 1,804 3,168
54,718 15,740 15,501 31,241
728 2,975 4,617 1,847
363 2,008 4,070
31,839 17,566
518 1,776 2,377
55,527 19,006 16,210 35,216
552 2,884 4,624 1,350
509 1,665 5,248
33,487 19,710
504 1,966 2,696
-5.8 11.8 -4.8 3.5
-15.1 6.4
-9.8 -31.6 31.9
150.0 -6.4
-5.4 2.9
-9.5 9.0
-14.9
1.5
20.7 4.6
12.7 -24.2 -3.1 0.2
-26.9 40.2
-17.1 28.9
5.2 12.2 -2.7 10.7 13.4
1 Includes Cheddar, Colby, Monterey, and Jack. 2 Excludes Cottage Cheese. 3 Mostly used for processing into cream or lowfat cottage cheese. 4 Fat content 4 percent or more. 5 Fat content less than 4 percent.
4 Dairy Products (April 2018) USDA, National Agricultural Statistics Service
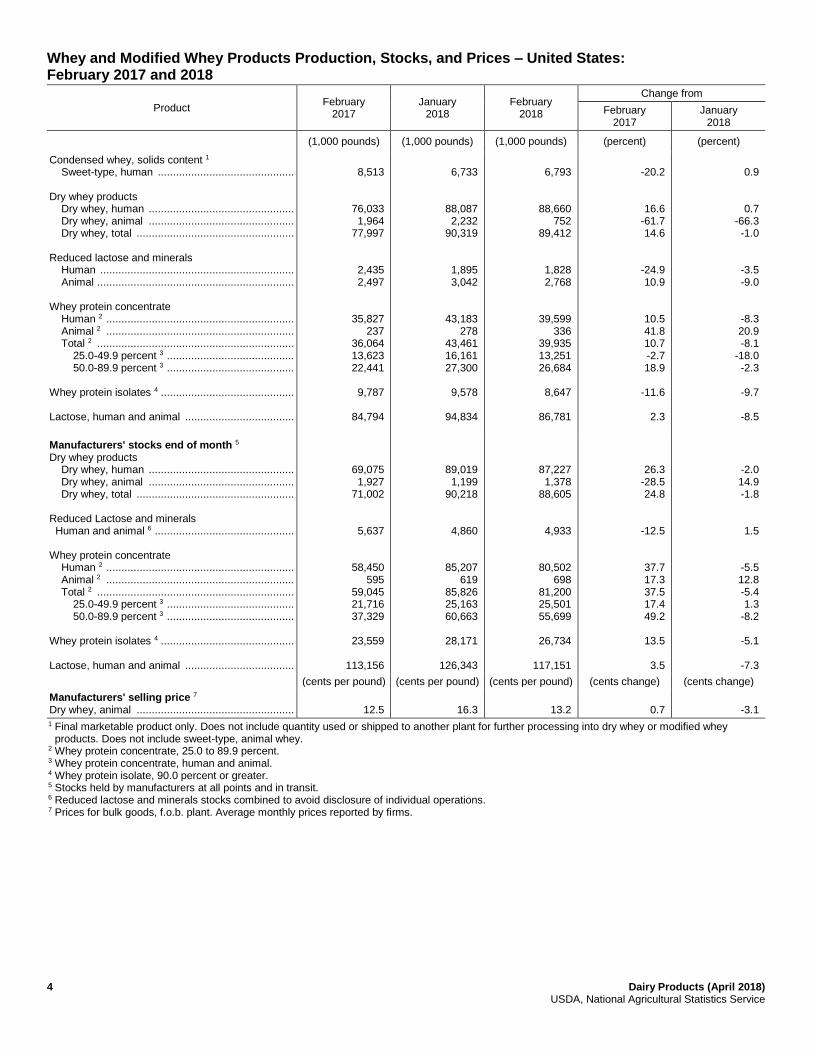
Whey and Modified Whey Products Production, Stocks, and Prices – United States: February 2017 and 2018
Product February
2017 January
2018 February
2018
Change from
February 2017
January 2018
(1,000 pounds) (1,000 pounds) (1,000 pounds) (percent) (percent)
Condensed whey, solids content 1 Sweet-type, human ............................................. Dry whey products Dry whey, human ................................................ Dry whey, animal ................................................ Dry whey, total .................................................... Reduced lactose and minerals Human ................................................................ Animal ................................................................. Whey protein concentrate Human 2 .............................................................. Animal 2 .............................................................. Total 2 ................................................................. 25.0-49.9 percent 3 .......................................... 50.0-89.9 percent 3 .......................................... Whey protein isolates 4 ............................................ Lactose, human and animal ....................................
8,513
76,033 1,964
77,997
2,435 2,497
35,827 237
36,064 13,623 22,441
9,787
84,794
6,733
88,087 2,232
90,319
1,895 3,042
43,183 278
43,461 16,161 27,300
9,578
94,834
6,793
88,660 752
89,412
1,828 2,768
39,599 336
39,935 13,251 26,684
8,647
86,781
-20.2
16.6 -61.7 14.6
-24.9 10.9
10.5 41.8 10.7 -2.7 18.9
-11.6
2.3
0.9
0.7 -66.3 -1.0
-3.5 -9.0
-8.3 20.9 -8.1
-18.0 -2.3
-9.7
-8.5
Manufacturers' stocks end of month 5 Dry whey products Dry whey, human ................................................ Dry whey, animal ................................................ Dry whey, total .................................................... Reduced Lactose and minerals Human and animal 6 .............................................. Whey protein concentrate Human 2 .............................................................. Animal 2 .............................................................. Total 2 ................................................................. 25.0-49.9 percent 3 .......................................... 50.0-89.9 percent 3 .......................................... Whey protein isolates 4 ............................................ Lactose, human and animal ....................................
69,075 1,927
71,002
5,637
58,450 595
59,045 21,716 37,329
23,559
113,156
89,019 1,199
90,218
4,860
85,207 619
85,826 25,163 60,663
28,171
126,343
87,227 1,378
88,605
4,933
80,502 698
81,200 25,501 55,699
26,734
117,151
26.3 -28.5 24.8
-12.5
37.7 17.3 37.5 17.4 49.2
13.5
3.5
-2.0 14.9 -1.8
1.5
-5.5 12.8 -5.4 1.3
-8.2
-5.1
-7.3
(cents per pound) (cents per pound) (cents per pound) (cents change) (cents change)
Manufacturers' selling price 7 Dry whey, animal ....................................................
12.5
16.3
13.2
0.7
-3.1
1 Final marketable product only. Does not include quantity used or shipped to another plant for further processing into dry whey or modified whey products. Does not include sweet-type, animal whey.
2 Whey protein concentrate, 25.0 to 89.9 percent. 3 Whey protein concentrate, human and animal. 4 Whey protein isolate, 90.0 percent or greater. 5 Stocks held by manufacturers at all points and in transit. 6 Reduced lactose and minerals stocks combined to avoid disclosure of individual operations. 7 Prices for bulk goods, f.o.b. plant. Average monthly prices reported by firms.

Dairy Products (April 2018) 5 USDA, National Agricultural Statistics Service
Condensed and Dry Milk Products Production, Stocks, and Shipments – United States: February 2017 and 2018
Product February
2017 January
2018 February
2018
Change from
February 2017
January 2018
(1,000 pounds) (1,000 pounds) (1,000 pounds) (percent) (percent)
Production Bulk condensed milk Skim, unsweetened ............................................ Dry milk products Dry buttermilk, total ............................................. Dry skim milk, animal .......................................... Dry whole milk .................................................... Milk protein concentrate, total 1 ........................... Nonfat dry milk, human ....................................... Skim milk powder, total 2 ..................................... Manufacturers' stocks end-of-month 3 Dry milk products Dry buttermilk, total ............................................. Dry skim milk, animal .......................................... Dry whole milk .................................................... Nonfat dry milk, human ....................................... Manufacturers' shipments 4 Dry milk products Nonfat dry milk, human .......................................
120,315
10,599 685
10,178 18,875
141,402 40,031
26,754 2,097
21,660 262,105
99,809
119,029
13,098 720
10,143 15,596
160,301 45,753
25,068 2,425
34,090 306,988
137,444
118,528
11,591 1,575
18,849 11,596
158,501 36,487
26,089 2,920
37,844 323,986
146,157
-1.5
9.4 129.9 85.2
-38.6 12.1 -8.9
-2.5 39.2 74.7 23.6
46.4
-0.4
-11.5 118.8 85.8
-25.6 -1.1
-20.3
4.1 20.4 11.0 5.5
6.3
1 Dry milk protein concentrate, 40-89.9 percent. 2 Includes protein standardized and blends. 3 Stocks held by manufacturers at all points and in transit. 4 For dry products, shipments of bulk goods.
6 Dairy Products (April 2018) USDA, National Agricultural Statistics Service
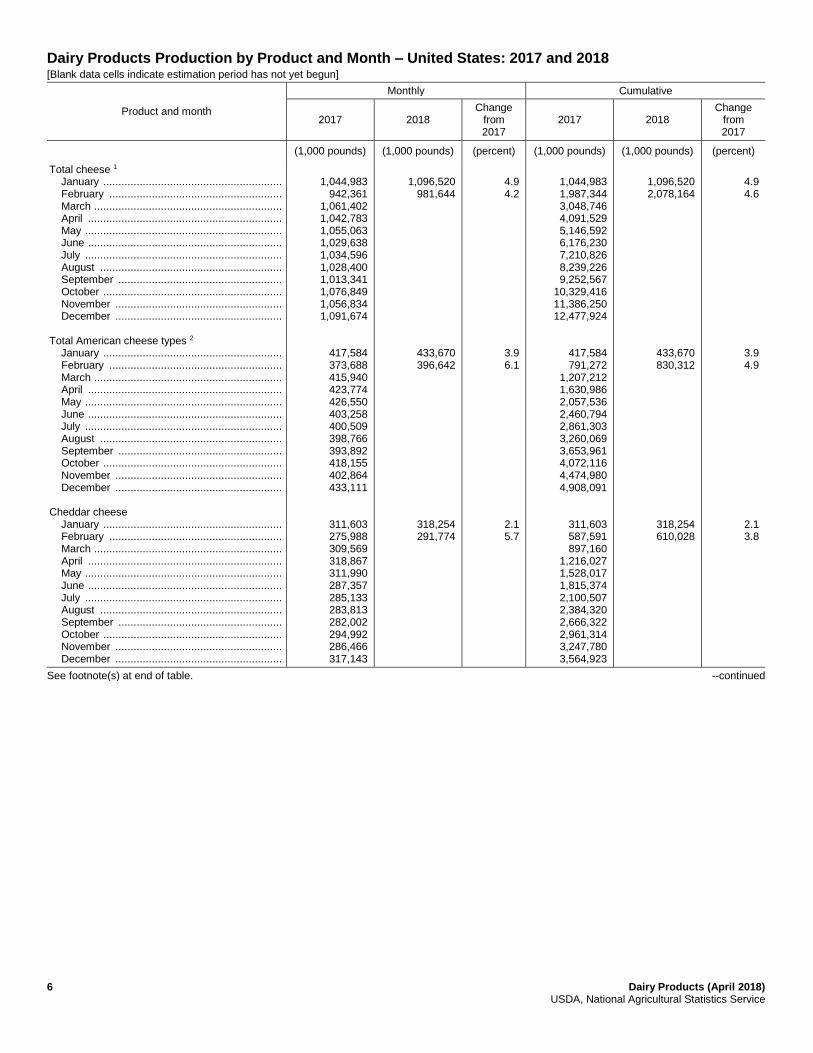
Dairy Products Production by Product and Month – United States: 2017 and 2018 [Blank data cells indicate estimation period has not yet begun]
Product and month
Monthly Cumulative
2017 2018 Change
from 2017
2017 2018 Change
from 2017
(1,000 pounds) (1,000 pounds) (percent) (1,000 pounds) (1,000 pounds) (percent)
Total cheese 1 January ........................................................... February ......................................................... March .............................................................. April ................................................................ May ................................................................. June ................................................................ July ................................................................. August ............................................................ September ...................................................... October ........................................................... November ....................................................... December ....................................................... Total American cheese types 2 January ........................................................... February ......................................................... March .............................................................. April ................................................................ May ................................................................. June ................................................................ July ................................................................. August ............................................................ September ...................................................... October ........................................................... November ....................................................... December ....................................................... Cheddar cheese January ........................................................... February ......................................................... March .............................................................. April ................................................................ May ................................................................. June ................................................................ July ................................................................. August ............................................................ September ...................................................... October ........................................................... November ....................................................... December .......................................................
1,044,983
942,361 1,061,402 1,042,783 1,055,063 1,029,638 1,034,596 1,028,400 1,013,341 1,076,849 1,056,834 1,091,674
417,584 373,688 415,940 423,774 426,550 403,258 400,509 398,766 393,892 418,155 402,864 433,111
311,603 275,988 309,569 318,867 311,990 287,357 285,133 283,813 282,002 294,992 286,466 317,143
1,096,520
981,644
433,670 396,642
318,254 291,774
4.9 4.2
3.9 6.1
2.1 5.7
1,044,983 1,987,344 3,048,746 4,091,529 5,146,592 6,176,230 7,210,826 8,239,226 9,252,567
10,329,416 11,386,250 12,477,924
417,584 791,272
1,207,212 1,630,986 2,057,536 2,460,794 2,861,303 3,260,069 3,653,961 4,072,116 4,474,980 4,908,091
311,603 587,591 897,160
1,216,027 1,528,017 1,815,374 2,100,507 2,384,320 2,666,322 2,961,314 3,247,780 3,564,923
1,096,520 2,078,164
433,670 830,312
318,254 610,028
4.9 4.6
3.9 4.9
2.1 3.8
See footnote(s) at end of table. --continued

Dairy Products (April 2018) 7 USDA, National Agricultural Statistics Service
Dairy Products Production by Product and Month – United States: 2017 and 2018 (continued) [Blank data cells indicate estimation period has not yet begun]
Product and month
Monthly Cumulative
2017 2018 Change
from 2017
2017 2018 Change
from 2017
(1,000 pounds) (1,000 pounds) (percent) (1,000 pounds) (1,000 pounds) (percent)
Total Italian cheese types January ............................................................... February ............................................................. March ................................................................. April .................................................................... May .................................................................... June ................................................................... July ..................................................................... August ................................................................ September .......................................................... October ............................................................... November ........................................................... December ........................................................... Mozzarella January ............................................................... February ............................................................. March ................................................................. April .................................................................... May .................................................................... June ................................................................... July ..................................................................... August ................................................................ September .......................................................... October ............................................................... November ........................................................... December ........................................................... Other Italian cheese types January ............................................................... February ............................................................. March ................................................................. April .................................................................... May .................................................................... June ................................................................... July ..................................................................... August ................................................................ September .......................................................... October ............................................................... November ........................................................... December ...........................................................
454,006 406,570 469,197 447,658 452,567 449,930 451,732 436,258 433,570 457,367 455,794 467,277
352,375 314,758 361,564 347,614 350,712 349,793 352,474 335,818 333,695 349,517 351,504 363,476
6,337 6,293 7,498 6,544 6,553 6,953 6,093 5,719 6,625 6,176 7,242 5,996
474,348 423,922
366,988 325,870
5,549 5,667
4.5 4.3
4.1 3.5
-12.4 -9.9
454,006 860,576
1,329,773 1,777,431 2,229,998 2,679,928 3,131,660 3,567,918 4,001,488 4,458,855 4,914,649 5,381,926
352,375 667,133
1,028,697 1,376,311 1,727,023 2,076,816 2,429,290 2,765,108 3,098,803 3,448,320 3,799,824 4,163,300
6,337 12,630 20,128 26,672 33,225 40,178 46,271 51,990 58,615 64,791 72,033 78,029
474,348 898,270
366,988 692,858
5,549 11,216
4.5 4.4
4.1 3.9
-12.4 -11.2
See footnote(s) at end of table. --continued
8 Dairy Products (April 2018) USDA, National Agricultural Statistics Service
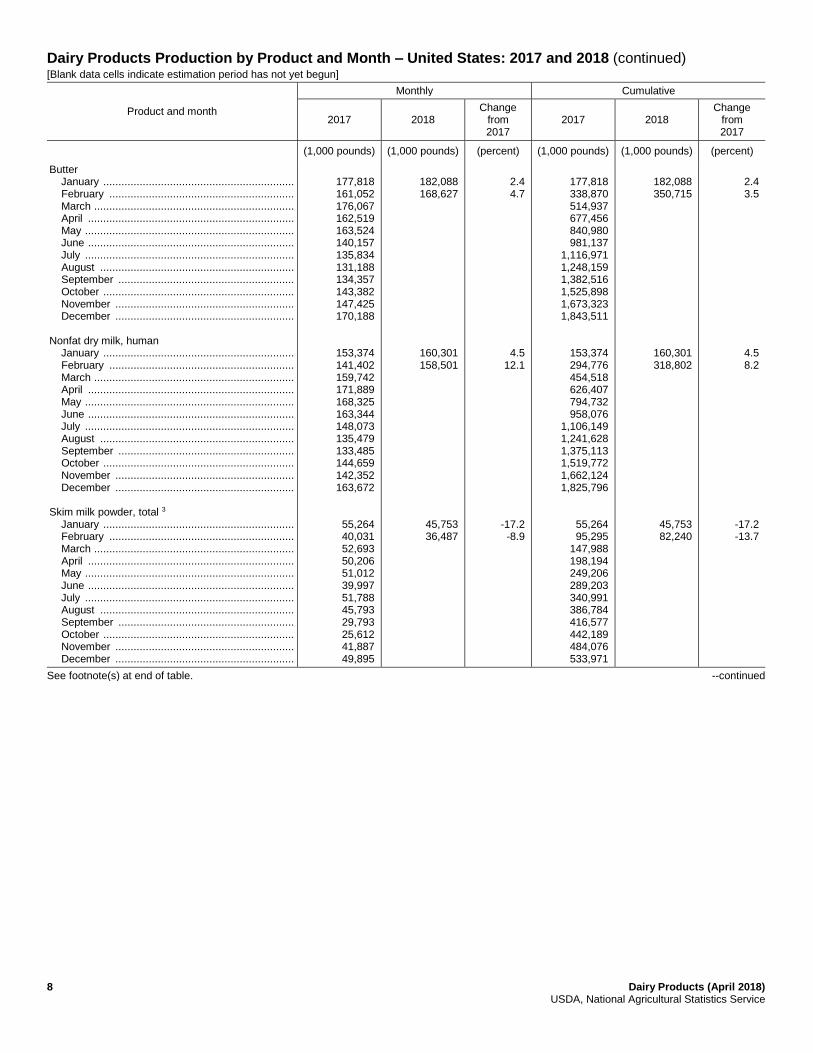
Dairy Products Production by Product and Month – United States: 2017 and 2018 (continued) [Blank data cells indicate estimation period has not yet begun]
Product and month
Monthly Cumulative
2017 2018 Change
from 2017
2017 2018 Change
from 2017
(1,000 pounds) (1,000 pounds) (percent) (1,000 pounds) (1,000 pounds) (percent)
Butter January ............................................................... February ............................................................. March .................................................................. April .................................................................... May ..................................................................... June .................................................................... July ..................................................................... August ................................................................ September .......................................................... October ............................................................... November ........................................................... December ........................................................... Nonfat dry milk, human January ............................................................... February ............................................................. March .................................................................. April .................................................................... May ..................................................................... June .................................................................... July ..................................................................... August ................................................................ September .......................................................... October ............................................................... November ........................................................... December ........................................................... Skim milk powder, total 3 January ............................................................... February ............................................................. March .................................................................. April .................................................................... May ..................................................................... June .................................................................... July ..................................................................... August ................................................................ September .......................................................... October ............................................................... November ........................................................... December ...........................................................
177,818 161,052 176,067 162,519 163,524 140,157 135,834 131,188 134,357 143,382 147,425 170,188
153,374 141,402 159,742 171,889 168,325 163,344 148,073 135,479 133,485 144,659 142,352 163,672
55,264 40,031 52,693 50,206 51,012 39,997 51,788 45,793 29,793 25,612 41,887 49,895
182,088 168,627
160,301 158,501
45,753 36,487
2.4 4.7
4.5 12.1
-17.2 -8.9
177,818 338,870 514,937 677,456 840,980 981,137
1,116,971 1,248,159 1,382,516 1,525,898 1,673,323 1,843,511
153,374 294,776 454,518 626,407 794,732 958,076
1,106,149 1,241,628 1,375,113 1,519,772 1,662,124 1,825,796
55,264 95,295
147,988 198,194 249,206 289,203 340,991 386,784 416,577 442,189 484,076 533,971
182,088 350,715
160,301 318,802
45,753 82,240
2.4 3.5
4.5 8.2
-17.2 -13.7
See footnote(s) at end of table. --continued
Dairy Products (April 2018) 9 USDA, National Agricultural Statistics Service
Dairy Products Production by Product and Month – United States: 2017 and 2018 (continued) [Blank data cells indicate estimation period has not yet begun]
Product and month
Monthly Cumulative
2017 2018 Change
from 2017
2017 2018 Change
from 2017
(1,000 pounds) (1,000 pounds) (percent) (1,000 pounds) (1,000 pounds) (percent)
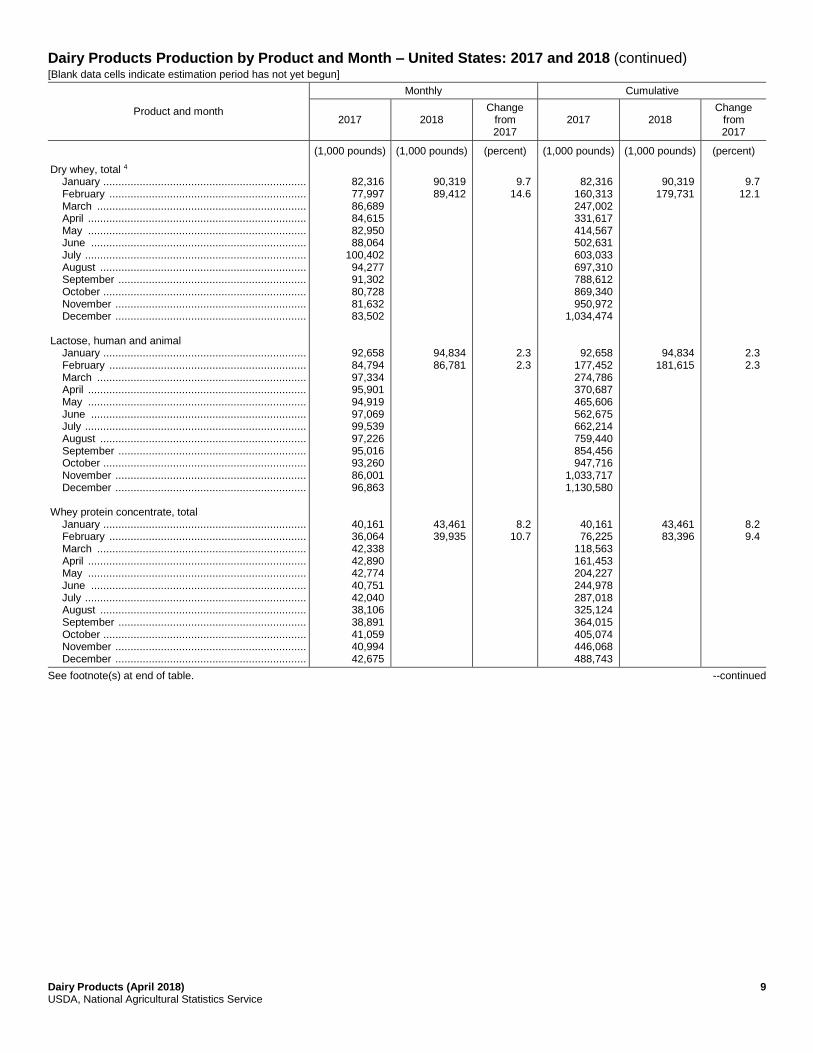
Dry whey, total 4 January ................................................................... February ................................................................. March ..................................................................... April ........................................................................ May ........................................................................ June ....................................................................... July ......................................................................... August .................................................................... September .............................................................. October ................................................................... November ............................................................... December ............................................................... Lactose, human and animal January ................................................................... February ................................................................. March ..................................................................... April ........................................................................ May ........................................................................ June ....................................................................... July ......................................................................... August .................................................................... September .............................................................. October ................................................................... November ............................................................... December ............................................................... Whey protein concentrate, total January ................................................................... February ................................................................. March ..................................................................... April ........................................................................ May ........................................................................ June ....................................................................... July ......................................................................... August .................................................................... September .............................................................. October ................................................................... November ............................................................... December ...............................................................
82,316 77,997 86,689 84,615 82,950 88,064
100,402 94,277 91,302 80,728 81,632 83,502
92,658 84,794 97,334 95,901 94,919 97,069 99,539 97,226 95,016 93,260 86,001 96,863
40,161 36,064 42,338 42,890 42,774 40,751 42,040 38,106 38,891 41,059 40,994 42,675
90,319 89,412
94,834 86,781
43,461 39,935
9.7
14.6
2.3 2.3
8.2 10.7
82,316
160,313 247,002 331,617 414,567 502,631 603,033 697,310 788,612 869,340 950,972
1,034,474
92,658 177,452 274,786 370,687 465,606 562,675 662,214 759,440 854,456 947,716
1,033,717 1,130,580
40,161 76,225
118,563 161,453 204,227 244,978 287,018 325,124 364,015 405,074 446,068 488,743
90,319
179,731
94,834 181,615
43,461 83,396
9.7
12.1
2.3 2.3
8.2 9.4
See footnote(s) at end of table. --continued
10 Dairy Products (April 2018) USDA, National Agricultural Statistics Service
Dairy Products Production by Product and Month – United States: 2017 and 2018 (continued) [Blank data cells indicate estimation period has not yet begun]
Product and month
Monthly Cumulative
2017 2018 Change
from 2017
2017 2018 Change
from 2017
(1,000 pounds) (1,000 pounds) (percent) (1,000 pounds) (1,000 pounds) (percent)
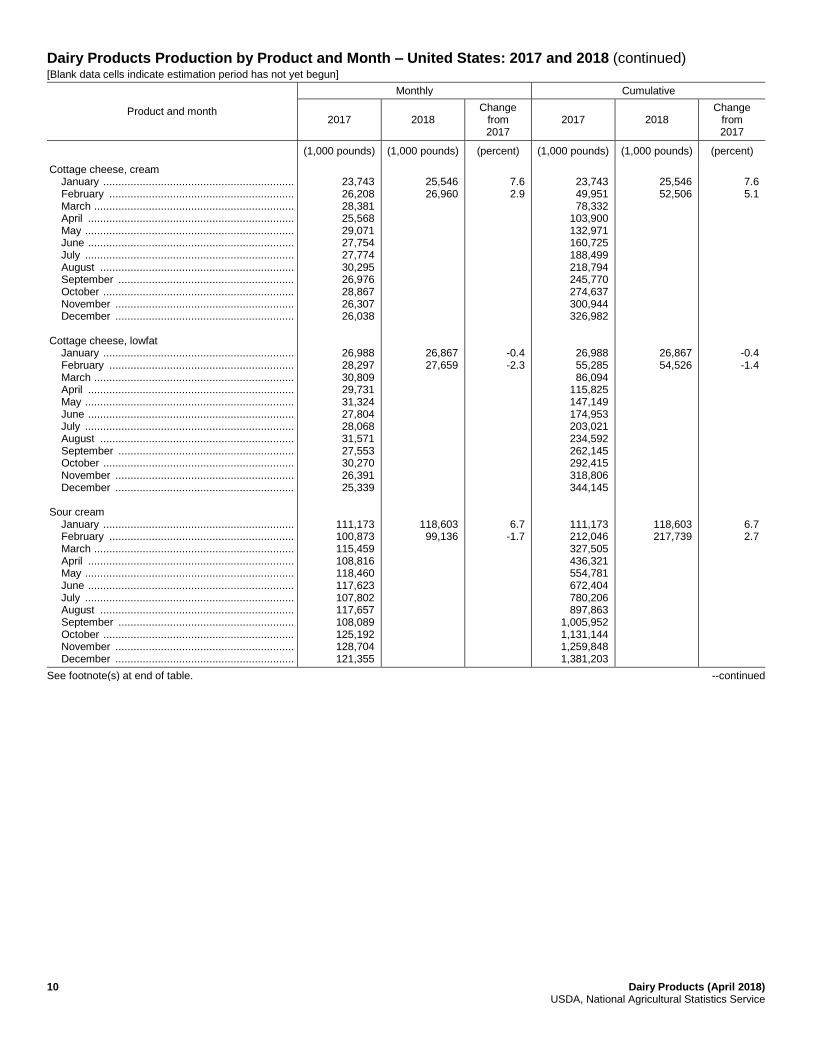
Cottage cheese, cream January ............................................................... February ............................................................. March .................................................................. April .................................................................... May ..................................................................... June .................................................................... July ..................................................................... August ................................................................ September .......................................................... October ............................................................... November ........................................................... December ........................................................... Cottage cheese, lowfat January ............................................................... February ............................................................. March .................................................................. April .................................................................... May ..................................................................... June .................................................................... July ..................................................................... August ................................................................ September .......................................................... October ............................................................... November ........................................................... December ........................................................... Sour cream January ............................................................... February ............................................................. March .................................................................. April .................................................................... May ..................................................................... June .................................................................... July ..................................................................... August ................................................................ September .......................................................... October ............................................................... November ........................................................... December ...........................................................
23,743 26,208 28,381 25,568 29,071 27,754 27,774 30,295 26,976 28,867 26,307 26,038
26,988 28,297 30,809 29,731 31,324 27,804 28,068 31,571 27,553 30,270 26,391 25,339
111,173 100,873 115,459 108,816 118,460 117,623 107,802 117,657 108,089 125,192 128,704 121,355
25,546 26,960
26,867 27,659
118,603 99,136
7.6 2.9
-0.4 -2.3
6.7 -1.7
23,743 49,951 78,332
103,900 132,971 160,725 188,499 218,794 245,770 274,637 300,944 326,982
26,988 55,285 86,094
115,825 147,149 174,953 203,021 234,592 262,145 292,415 318,806 344,145
111,173 212,046 327,505 436,321 554,781 672,404 780,206 897,863
1,005,952 1,131,144 1,259,848 1,381,203
25,546 52,506
26,867 54,526
118,603 217,739
7.6 5.1
-0.4 -1.4
6.7 2.7
See footnote(s) at end of table. --continued

Dairy Products (April 2018) 11 USDA, National Agricultural Statistics Service
Dairy Products Production by Product and Month – United States: 2017 and 2018 (continued) [Blank data cells indicate estimation period has not yet begun]
Product and month
Monthly Cumulative
2017 2018 Change
from 2017
2017 2018 Change
from 2017
(1,000 gallons) (1,000 gallons) (percent) (1,000 gallons) (1,000 gallons) (percent)
Ice cream, regular hard January ............................................................... February ............................................................. March ................................................................. April .................................................................... May .................................................................... June ................................................................... July ..................................................................... August ................................................................ September .......................................................... October ............................................................... November ........................................................... December ........................................................... Ice cream, lowfat total January ............................................................... February ............................................................. March ................................................................. April .................................................................... May .................................................................... June ................................................................... July ..................................................................... August ................................................................ September .......................................................... October ............................................................... November ........................................................... December ........................................................... Sherbet, hard January ............................................................... February ............................................................. March ................................................................. April .................................................................... May .................................................................... June ................................................................... July ..................................................................... August ................................................................ September .......................................................... October ............................................................... November ........................................................... December ...........................................................
57,108 58,971 75,411 69,572 72,703 75,426 70,705 73,477 60,924 58,215 50,343 49,480
28,935 34,035 41,263 39,010 43,609 44,929 42,299 43,250 32,551 32,603 26,486 25,936
3,024 2,710 3,530 3,463 3,290 3,582 2,978 3,483 3,192 2,675 2,777 2,210
54,718 55,527
31,241 35,216
2,975 2,884
-4.2 -5.8
8.0 3.5
-1.6 6.4
57,108
116,079 191,490 261,062 333,765 409,191 479,896 553,373 614,297 672,512 722,855 772,335
28,935 62,970
104,233 143,243 186,852 231,781 274,080 317,330 349,881 382,484 408,970 434,906
3,024 5,734 9,264
12,727 16,017 19,599 22,577 26,060 29,252 31,927 34,704 36,914
54,718
110,245
31,241 66,457
2,975 5,859
-4.2 -5.0
8.0 5.5
-1.6 2.2
See footnote(s) at end of table. --continued
12 Dairy Products (April 2018) USDA, National Agricultural Statistics Service
Dairy Products Production by Product and Month – United States: 2017 and 2018 (continued) [Blank data cells indicate estimation period has not yet begun]
Product and month
Monthly Cumulative
2017 2018 Change
from 2017
2017 2018 Change
from 2017
(1,000 pounds) (1,000 pounds) (percent) (1,000 pounds) (1,000 pounds) (percent)
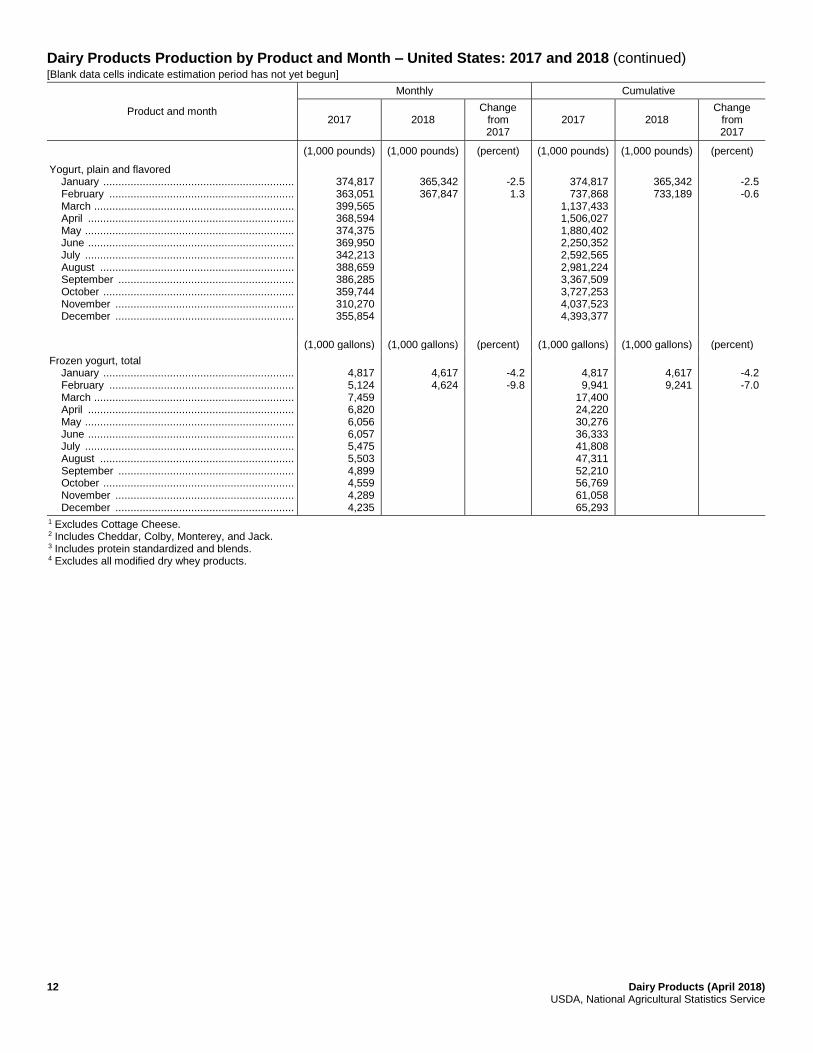
Yogurt, plain and flavored January ............................................................... February ............................................................. March .................................................................. April .................................................................... May ..................................................................... June .................................................................... July ..................................................................... August ................................................................ September .......................................................... October ............................................................... November ........................................................... December ...........................................................
374,817 363,051 399,565 368,594 374,375 369,950 342,213 388,659 386,285 359,744 310,270 355,854
365,342 367,847
-2.5 1.3
374,817 737,868
1,137,433 1,506,027 1,880,402 2,250,352 2,592,565 2,981,224 3,367,509 3,727,253 4,037,523 4,393,377
365,342 733,189
-2.5 -0.6
(1,000 gallons) (1,000 gallons) (percent) (1,000 gallons) (1,000 gallons) (percent)
Frozen yogurt, total January ............................................................... February ............................................................. March .................................................................. April .................................................................... May ..................................................................... June .................................................................... July ..................................................................... August ................................................................ September .......................................................... October ............................................................... November ........................................................... December ...........................................................
4,817 5,124 7,459 6,820 6,056 6,057 5,475 5,503 4,899 4,559 4,289 4,235
4,617 4,624
-4.2 -9.8
4,817 9,941
17,400 24,220 30,276 36,333 41,808 47,311 52,210 56,769 61,058 65,293
4,617 9,241
-4.2 -7.0
1 Excludes Cottage Cheese. 2 Includes Cheddar, Colby, Monterey, and Jack. 3 Includes protein standardized and blends. 4 Excludes all modified dry whey products.

Dairy Products (April 2018) 13 USDA, National Agricultural Statistics Service
Total Cheese Production Excluding Cottage Cheese – States and United States: February 2017 and 2018
State February
2017 January
2018 February
2018
Change from
February 2017
January 2018
(1,000 pounds) (1,000 pounds) (1,000 pounds) (percent) (percent)
California ............................. Idaho ................................... Illinois .................................. Iowa ..................................... Minnesota ............................ New Jersey .......................... New Mexico ......................... Ohio ..................................... Pennsylvania ....................... South Dakota ....................... Vermont ............................... Wisconsin ............................ Other States 1 ...................... United States ....................... Atlantic ................................ Central ................................. West ....................................
192,068 68,271 5,877
20,307 51,470 4,086
59,402 17,245 29,932 21,493 11,077
253,988
207,145
942,361
117,931 431,532 392,898
216,779 85,420 5,533
22,447 61,870 4,888
68,293 21,050 38,353 25,536 12,199
290,411
243,741
1,096,520
145,345 496,794 454,381
198,756 72,057 5,538
20,616 56,948 4,078
64,770 18,749 30,913 23,001 11,431
262,936
211,851
981,644
119,783 450,785 411,076
3.5 5.5
-5.8 1.5
10.6 -0.2 9.0 8.7 3.3 7.0 3.2 3.5
2.3
4.2
1.6 4.5 4.6
-8.3 -15.6
0.1 -8.2 -8.0
-16.6 -5.2
-10.9 -19.4 -9.9 -6.3 -9.5
-13.1
-10.5
-17.6 -9.3 -9.5
1 States not shown when fewer than 3 plants reported or individual plant operations could be disclosed.
14 Dairy Products (April 2018) USDA, National Agricultural Statistics Service
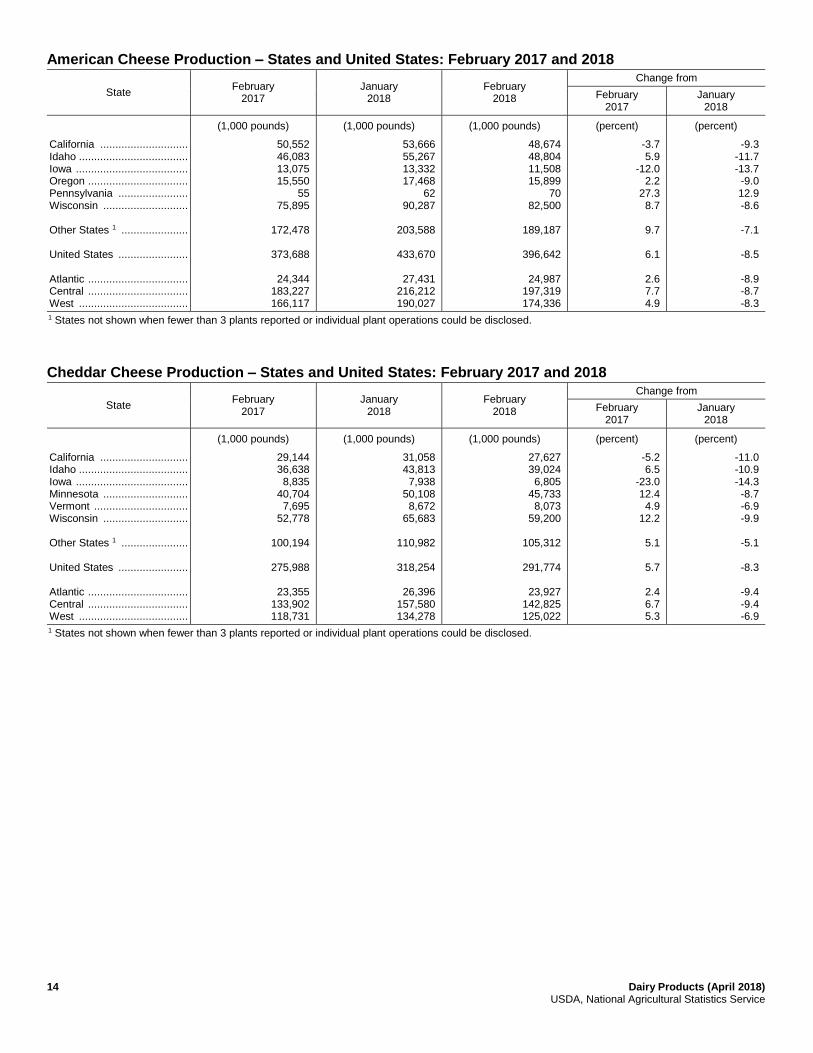
American Cheese Production – States and United States: February 2017 and 2018
State February
2017 January
2018 February
2018
Change from
February 2017
January 2018
(1,000 pounds) (1,000 pounds) (1,000 pounds) (percent) (percent)
California ............................. Idaho .................................... Iowa ..................................... Oregon ................................. Pennsylvania ....................... Wisconsin ............................ Other States 1 ...................... United States ....................... Atlantic ................................. Central ................................. West ....................................
50,552 46,083 13,075 15,550
55 75,895
172,478
373,688
24,344
183,227 166,117
53,666 55,267 13,332 17,468
62 90,287
203,588
433,670
27,431
216,212 190,027
48,674 48,804 11,508 15,899
70 82,500
189,187
396,642
24,987
197,319 174,336
-3.7 5.9
-12.0 2.2
27.3 8.7
9.7
6.1
2.6 7.7 4.9
-9.3 -11.7 -13.7 -9.0 12.9 -8.6
-7.1
-8.5
-8.9 -8.7 -8.3
1 States not shown when fewer than 3 plants reported or individual plant operations could be disclosed.
Cheddar Cheese Production – States and United States: February 2017 and 2018
State February
2017 January
2018 February
2018
Change from
February 2017
January 2018
(1,000 pounds) (1,000 pounds) (1,000 pounds) (percent) (percent)
California ............................. Idaho .................................... Iowa ..................................... Minnesota ............................ Vermont ............................... Wisconsin ............................ Other States 1 ...................... United States ....................... Atlantic ................................. Central ................................. West ....................................
29,144 36,638 8,835
40,704 7,695
52,778
100,194
275,988
23,355 133,902 118,731
31,058 43,813 7,938
50,108 8,672
65,683
110,982
318,254
26,396 157,580 134,278
27,627 39,024 6,805
45,733 8,073
59,200
105,312
291,774
23,927 142,825 125,022
-5.2 6.5
-23.0 12.4 4.9
12.2
5.1
5.7
2.4 6.7 5.3
-11.0 -10.9 -14.3 -8.7 -6.9 -9.9
-5.1
-8.3
-9.4 -9.4 -6.9
1 States not shown when fewer than 3 plants reported or individual plant operations could be disclosed.

Dairy Products (April 2018) 15 USDA, National Agricultural Statistics Service
Total Italian Cheese Production – States and United States: February 2017 and 2018
State February
2017 January
2018 February
2018
Change from
February 2017
January 2018
(1,000 pounds) (1,000 pounds) (1,000 pounds) (percent) (percent)
California ............................. Idaho ................................... Pennsylvania ....................... Wisconsin ............................ Other States 1 ...................... United States ....................... Atlantic ................................ Central ................................. West ....................................
121,923 17,604 19,758
128,917
118,368
406,570
52,850 167,823 185,897
142,319 23,336 23,169
145,181
140,343
474,348
62,645 191,464 220,239
129,427 18,164 19,978
132,687
123,666
423,922
52,655 175,131 196,136
6.2 3.2 1.1 2.9
4.5
4.3
-0.4 4.4 5.5
-9.1 -22.2 -13.8 -8.6
-11.9
-10.6
-15.9 -8.5
-10.9
1 States not shown when fewer than 3 plants reported or individual plant operations could be disclosed.
Mozzarella Cheese Production – States and United States: February 2017 and 2018
State February
2017 January
2018 February
2018
Change from
February 2017
January 2018
(1,000 pounds) (1,000 pounds) (1,000 pounds) (percent) (percent)
California ............................. Idaho ................................... Pennsylvania ....................... Wisconsin ............................ Other States 1 ...................... United States ....................... Atlantic ................................ Central ................................. West ....................................
111,573 16,619 17,218 83,862
85,486
314,758
34,862
106,349 173,547
127,839 22,452 20,196 94,050
102,451
366,988
42,014
121,237 203,737
115,974 17,656 16,519 86,700
89,021
325,870
34,079
110,645 181,146
3.9 6.2
-4.1 3.4
4.1
3.5
-2.2 4.0 4.4
-9.3 -21.4 -18.2 -7.8
-13.1
-11.2
-18.9 -8.7
-11.1
1 States not shown when fewer than 3 plants reported or individual plant operations could be disclosed.
16 Dairy Products (April 2018) USDA, National Agricultural Statistics Service
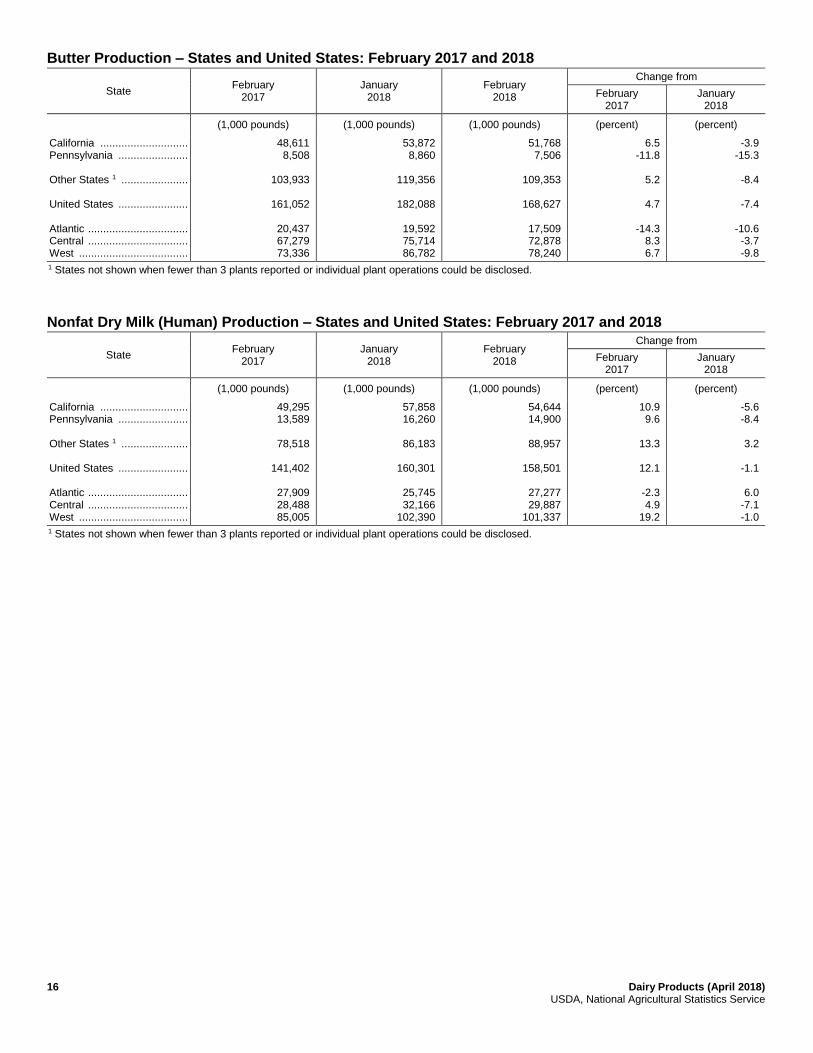
Butter Production – States and United States: February 2017 and 2018
State February
2017 January
2018 February
2018
Change from
February 2017
January 2018
(1,000 pounds) (1,000 pounds) (1,000 pounds) (percent) (percent)
California ............................. Pennsylvania ....................... Other States 1 ...................... United States ....................... Atlantic ................................. Central ................................. West ....................................
48,611 8,508
103,933
161,052
20,437 67,279 73,336
53,872 8,860
119,356
182,088
19,592 75,714 86,782
51,768 7,506
109,353
168,627
17,509 72,878 78,240
6.5 -11.8
5.2
4.7
-14.3
8.3 6.7
-3.9 -15.3
-8.4
-7.4
-10.6 -3.7 -9.8
1 States not shown when fewer than 3 plants reported or individual plant operations could be disclosed.
Nonfat Dry Milk (Human) Production – States and United States: February 2017 and 2018
State February
2017 January
2018 February
2018
Change from
February 2017
January 2018
(1,000 pounds) (1,000 pounds) (1,000 pounds) (percent) (percent)
California ............................. Pennsylvania ....................... Other States 1 ...................... United States ....................... Atlantic ................................. Central ................................. West ....................................
49,295 13,589
78,518
141,402
27,909 28,488 85,005
57,858 16,260
86,183
160,301
25,745 32,166
102,390
54,644 14,900
88,957
158,501
27,277 29,887
101,337
10.9 9.6
13.3
12.1
-2.3 4.9
19.2
-5.6 -8.4
3.2
-1.1
6.0
-7.1 -1.0
1 States not shown when fewer than 3 plants reported or individual plant operations could be disclosed.
Dairy Products (April 2018) 17 USDA, National Agricultural Statistics Service
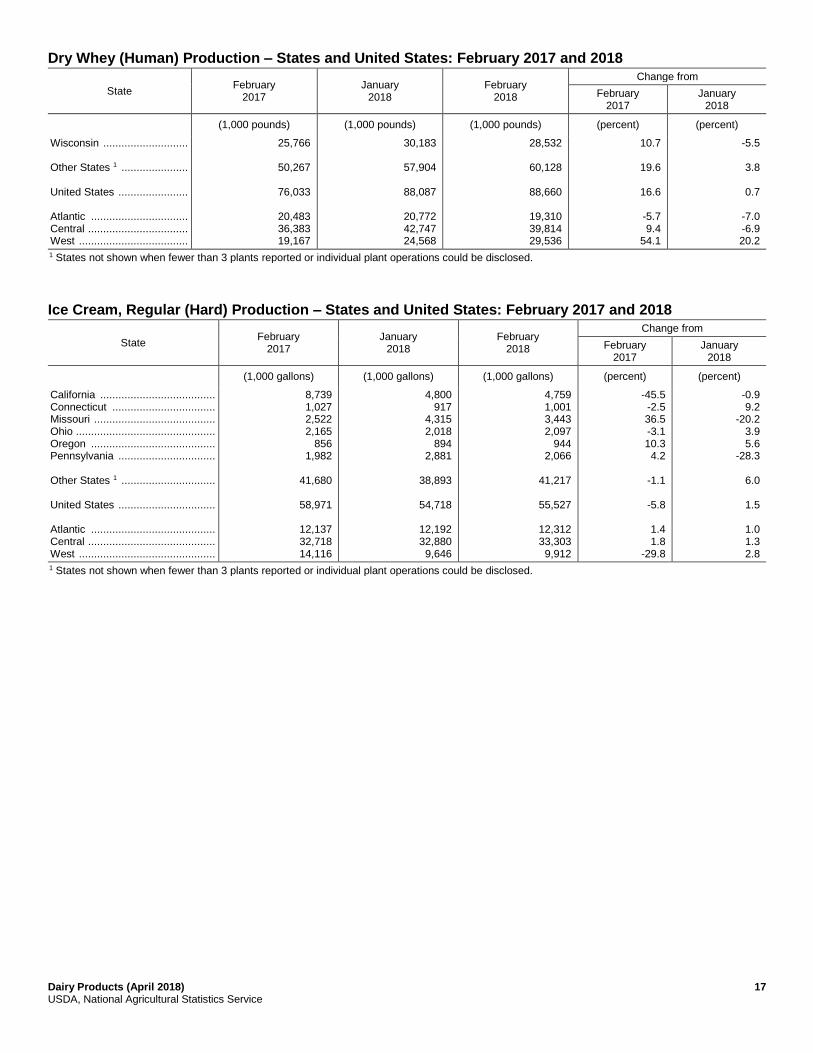
Dry Whey (Human) Production – States and United States: February 2017 and 2018
State February
2017 January
2018 February
2018
Change from
February 2017
January 2018
(1,000 pounds) (1,000 pounds) (1,000 pounds) (percent) (percent)
Wisconsin ............................ Other States 1 ...................... United States ....................... Atlantic ................................ Central ................................. West ....................................
25,766
50,267
76,033
20,483 36,383 19,167
30,183
57,904
88,087
20,772 42,747 24,568
28,532
60,128
88,660
19,310 39,814 29,536
10.7
19.6
16.6
-5.7 9.4
54.1
-5.5
3.8
0.7
-7.0 -6.9 20.2
1 States not shown when fewer than 3 plants reported or individual plant operations could be disclosed.
Ice Cream, Regular (Hard) Production – States and United States: February 2017 and 2018
State February
2017 January
2018 February
2018
Change from
February 2017
January 2018
(1,000 gallons) (1,000 gallons) (1,000 gallons) (percent) (percent)
California ...................................... Connecticut .................................. Missouri ........................................ Ohio .............................................. Oregon ......................................... Pennsylvania ................................ Other States 1 ............................... United States ................................ Atlantic ......................................... Central .......................................... West .............................................
8,739 1,027 2,522 2,165
856 1,982
41,680
58,971
12,137 32,718 14,116
4,800 917
4,315 2,018
894 2,881
38,893
54,718
12,192 32,880 9,646
4,759 1,001 3,443 2,097
944 2,066
41,217
55,527
12,312 33,303 9,912
-45.5 -2.5 36.5 -3.1 10.3 4.2
-1.1
-5.8
1.4 1.8
-29.8
-0.9 9.2
-20.2 3.9 5.6
-28.3
6.0
1.5
1.0 1.3 2.8
1 States not shown when fewer than 3 plants reported or individual plant operations could be disclosed.
18 Dairy Products (April 2018) USDA, National Agricultural Statistics Service
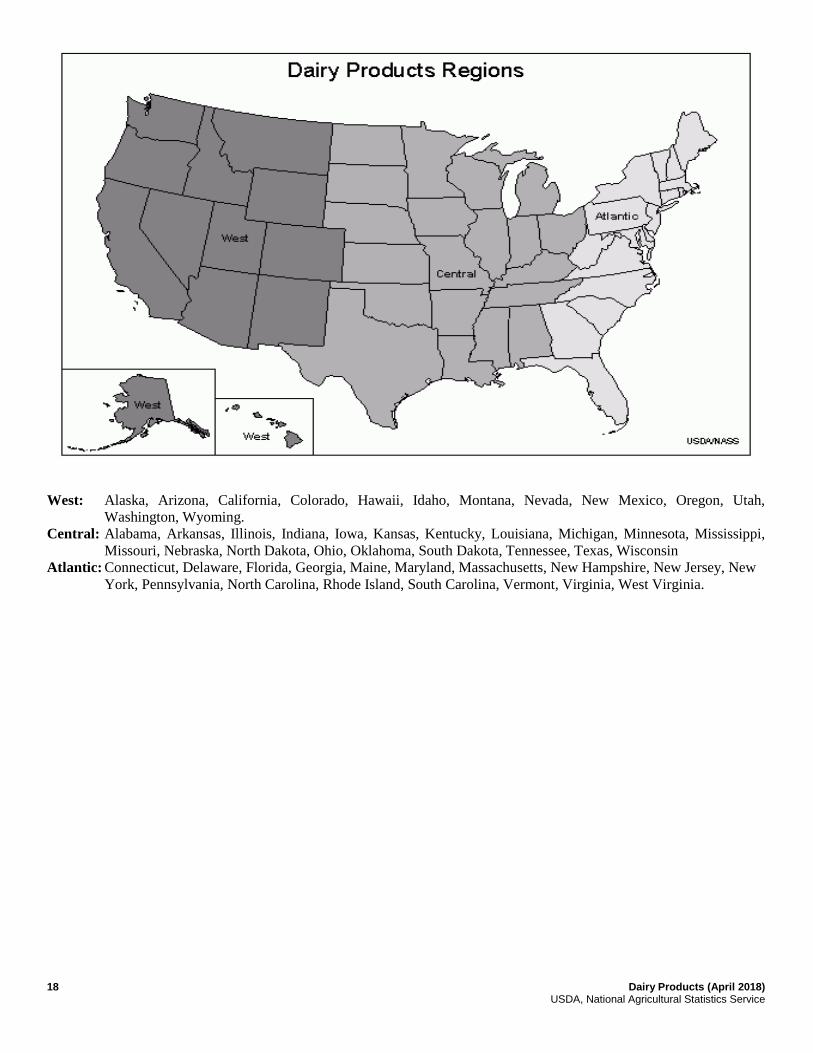
West: Alaska, Arizona, California, Colorado, Hawaii, Idaho, Montana, Nevada, New Mexico, Oregon, Utah,
Washington, Wyoming.
Central: Alabama, Arkansas, Illinois, Indiana, Iowa, Kansas, Kentucky, Louisiana, Michigan, Minnesota, Mississippi,
Missouri, Nebraska, North Dakota, Ohio, Oklahoma, South Dakota, Tennessee, Texas, Wisconsin
Atlantic: Connecticut, Delaware, Florida, Georgia, Maine, Maryland, Massachusetts, New Hampshire, New Jersey, New
York, Pennsylvania, North Carolina, Rhode Island, South Carolina, Vermont, Virginia, West Virginia.

Dairy Products (April 2018) 19 USDA, National Agricultural Statistics Service
Statistical Methodology Data Collection Period: Dairy products estimates are based upon survey data collected after the close of each month.
Production data are provided by the firms producing dairy products.
Sampling frames and sample size: In 2016, there were 1,272 manufacturers that produced one or more dairy products. In
states with small numbers of plants, reports are received from all plants each month. In states with large numbers of
plants, survey procedures are designed to obtain monthly reports from all large plants and from a sample of small plants.
In some states, the State Departments of Agriculture assist in collection of data, which eliminates duplicate reporting and
reduces respondent burden.
Modes of data collection: Data are collected by mail, personal and telephone interviews, facsimile, and via electronic
mail.
Terms and definitions: Firms complete the questionnaire using standard industry definitions and through the aid of
instructions and definitions provided on the questionnaire.
Reliability: Data for the Dairy Products report are collected by a Census of all known manufacturers of dairy products in
the United States. Firms producing large quantities of dairy products, along with a sample of smaller firms, are contacted
monthly to collect previous month production data. Those small firms not contacted monthly are contacted after the close
of the year to obtain previous year production. Production of products at small firms not contacted monthly are estimated
during the monthly survey based upon check data, and state and national trends. Small firms are defined as those that do
not make up a significant portion of the published total. Plants storing nonfat dry milk and dry whey are required under
Federal law as defined in Public Laws 106-532 and 107-171 to complete the Dairy Products report. Plants storing these
items are contacted monthly. Additionally, many state governments have mandated that dairy plants in their state
complete the Dairy Products report each month. Because the Dairy Products survey is a census, sampling error should not
affect the final estimates, however non-sampling errors are possible.
Estimating Procedures: In the Regional Field Office (RFO), data reported by firms are reviewed for reasonableness and
consistency by comparing with data reported in prior months and by data reported by other firms in the State. Each RFO
summarizes data at the Individual State level. State estimates are submitted to the Agricultural Statistics Board (ASB)
along with supporting comments where they are compared with surrounding states, their region, and national trends.
During both RFO and ASB review, plants are sometimes contacted again for further verification of numbers reported.
After ASB review, RFO data are summarized into a National level summary.
Revision Policy: Monthly estimates are subject to revision the month following the preliminary estimates. Annual
estimates are published in late April in the Dairy Products Yearly Summary report which includes any revisions made to
previous 2 years of estimates. Revisions are generally due to plant data that are received too late to be included in the
current report.

Information Contacts
Listed below are the commodity specialists in the Livestock Branch of the National Agricultural Statistics Service to
contact for additional information. E-mail inquiries may be sent to [email protected].
Travis Averill, Chief, Livestock Branch ......................................................................................................... (202) 720-3570
Scott Hollis, Head, Livestock Section ............................................................................................................ (202) 690-2424
Sherry Bertramsen – Livestock Slaughter ................................................................................................ (202) 720-3240
Holly Brenize – Sheep and Goats ............................................................................................................. (202) 720-0585
Donnie Fike – Dairy Products .................................................................................................................. (202) 690-3236
Heidi Gleich – Cattle, Cattle on Feed ....................................................................................................... (202) 720-3040
Mike Miller – Milk Production and Milk Cows ....................................................................................... (202) 720-3278
Seth Riggins – Hogs and Pigs ................................................................................................................... (202) 720-3106
Access to NASS Reports For your convenience, you may access NASS reports and products the following ways:
All reports are available electronically, at no cost, on the NASS web site: www.nass.usda.gov
Both national and state specific reports are available via a free e-mail subscription. To set-up this free
subscription, visit www.nass.usda.gov and click on “National” or “State” in upper right corner above “search”
box to create an account and select the reports you would like to receive.
For more information on NASS surveys and reports, call the NASS Agricultural Statistics Hotline at (800) 727-9540,
7:30 a.m. to 4:00 p.m. ET, or e-mail: [email protected].
The U.S. Department of Agriculture (USDA) prohibits discrimination against its customers, employees, and applicants for
employment on the basis of race, color, national origin, age, disability, sex, gender identity, religion, reprisal, and where
applicable, political beliefs, marital status, familial or parental status, sexual orientation, or all or part of an individual's
income is derived from any public assistance program, or protected genetic information in employment or in any program
or activity conducted or funded by the Department. (Not all prohibited bases will apply to all programs and/or
employment activities.)
If you wish to file a Civil Rights program complaint of discrimination, complete the USDA Program Discrimination
Complaint Form (PDF), found online at www.ascr.usda.gov/filing-program-discrimination-complaint-usda-customer, or
at any USDA office, or call (866) 632-9992 to request the form. You may also write a letter containing all of the
information requested in the form. Send your completed complaint form or letter to us by mail at U.S. Department of
Agriculture, Director, Office of Adjudication, 1400 Independence Avenue, S.W., Washington, D.C. 20250-9410, by fax
(202) 690-7442 or email at [email protected].