2012 Agricultural Outlook Update Dairy Outlook: Indiana Perspectives
http://amap.missouri.edu
Dairy Outlook and Issues Facing The Dairy Industry
Dr. Scott BrownAgricultural Markets and PolicyDivision of Applied Social Sciences
April 23, 2015
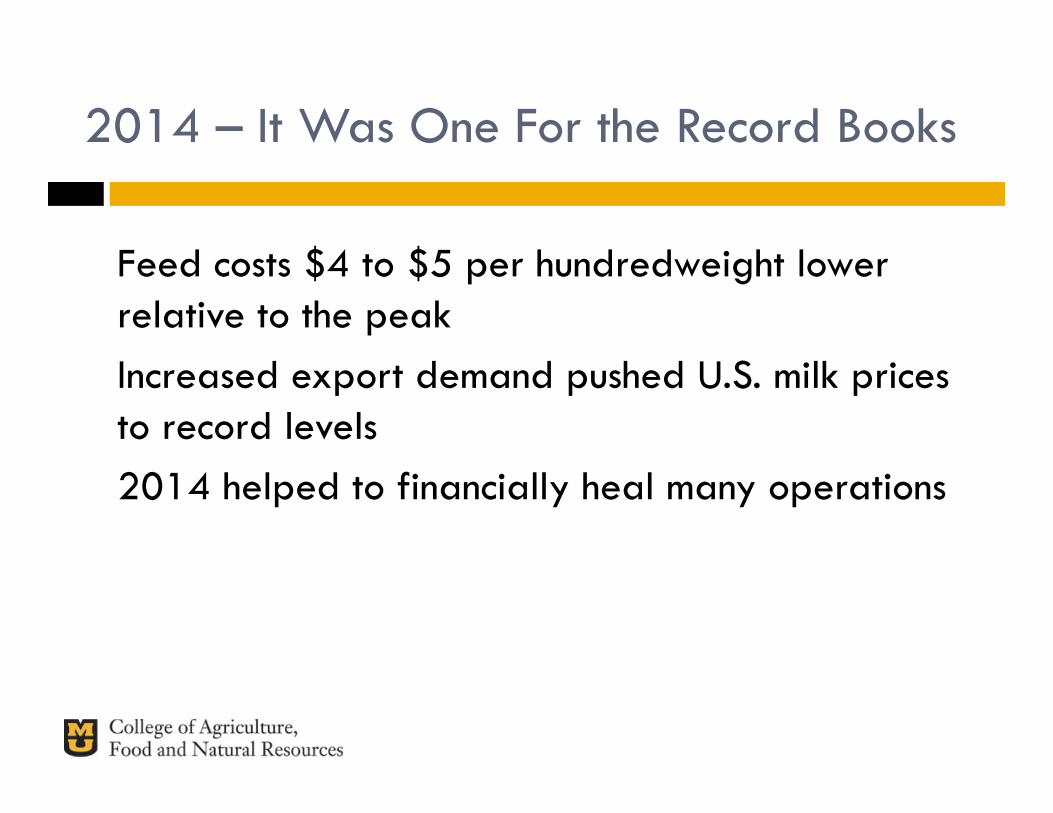
2014 – It Was One For the Record Books
� Feed costs $4 to $5 per hundredweight lower relative to the peak
� Increased export demand pushed U.S. milk prices to record levels
� 2014 helped to financially heal many operations
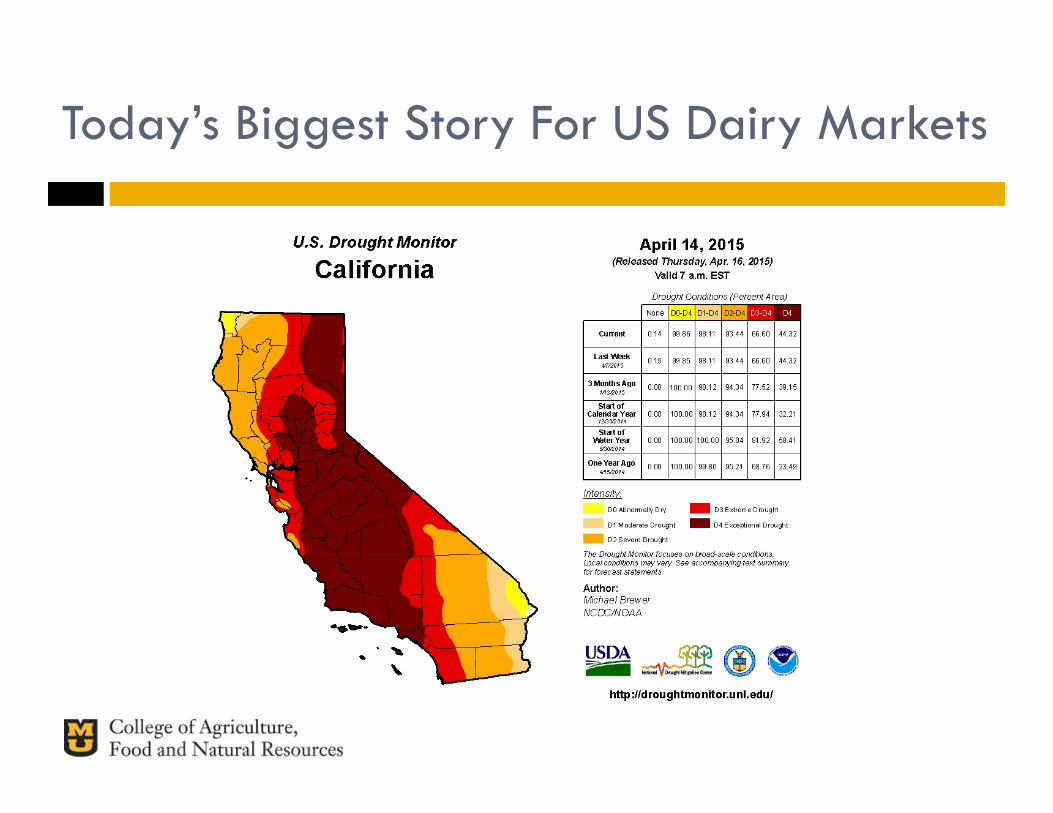
Today’s Biggest Story For US Dairy Markets
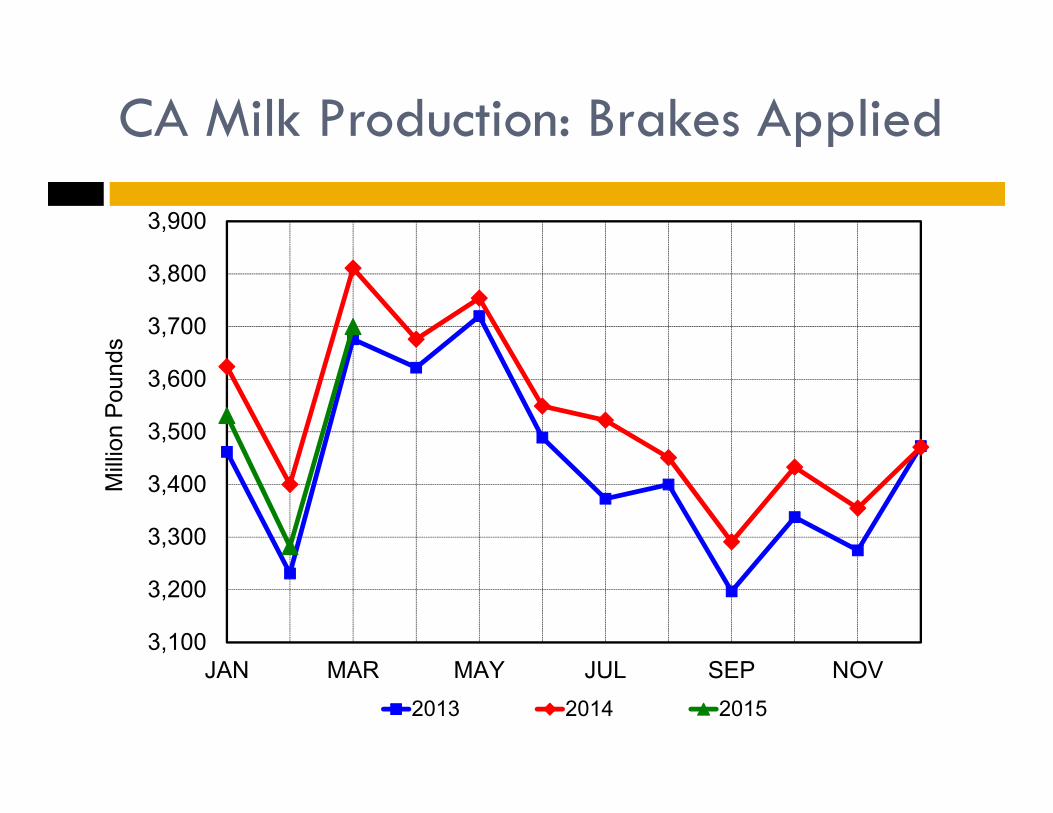
CA Milk Production: Brakes Applied
3,100
3,200
3,300
3,400
3,500
3,600
3,700
3,800
3,900
JAN MAR MAY JUL SEP NOV
Mill
ion
Pou
nds
2013 2014 2015
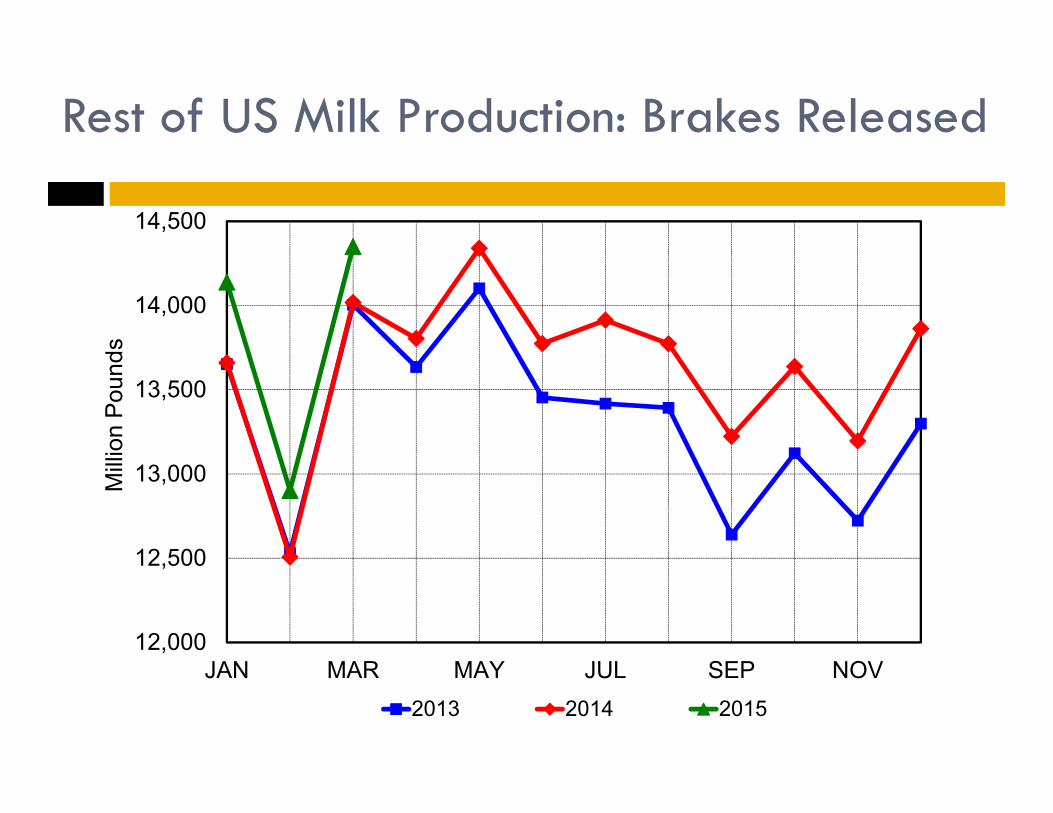
Rest of US Milk Production: Brakes Released
12,000
12,500
13,000
13,500
14,000
14,500
JAN MAR MAY JUL SEP NOV
Mill
ion
Pou
nds
2013 2014 2015
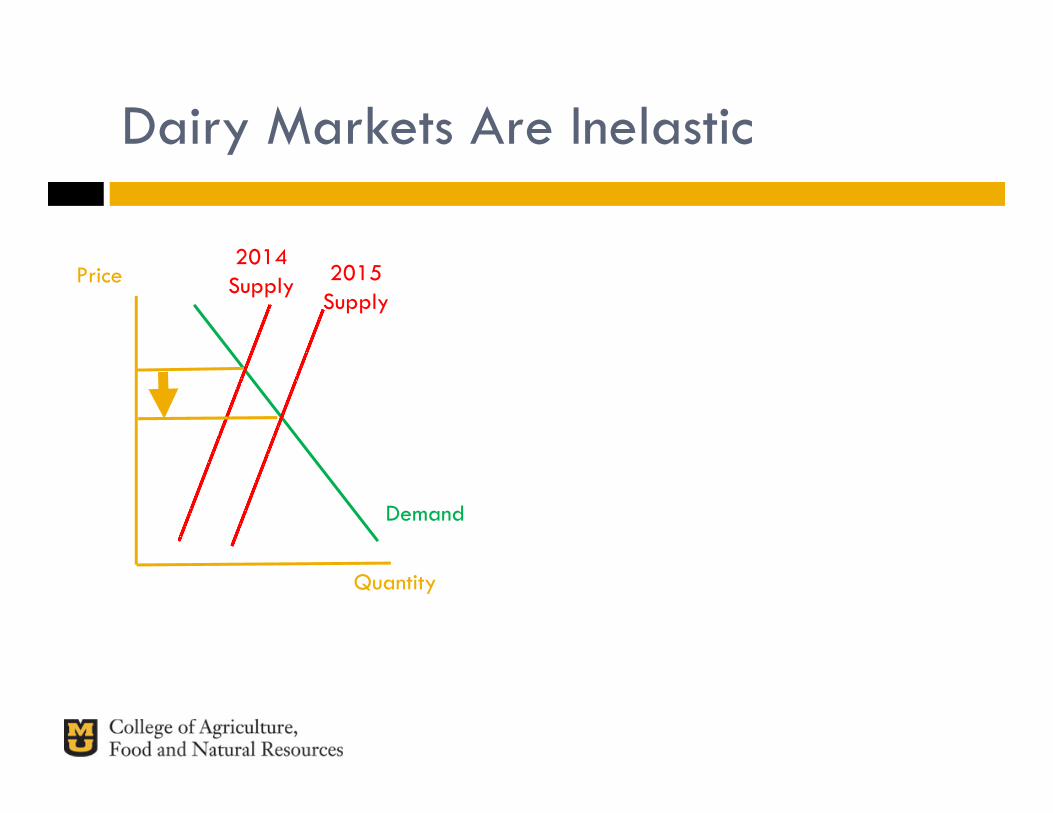
Dairy Markets Are Inelastic
Demand
2014Supply 2015
Supply
Quantity
Price
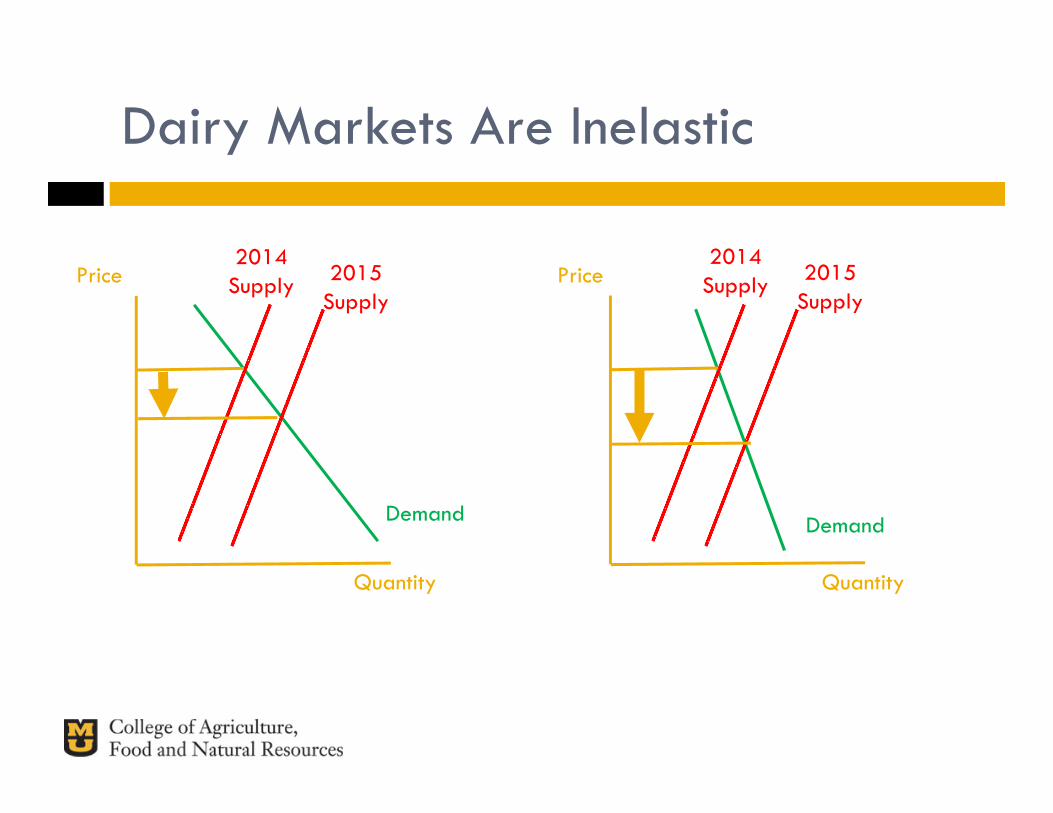
Dairy Markets Are Inelastic
Demand
2014Supply 2015
Supply
Demand
2014Supply 2015
Supply
QuantityQuantity
Price Price
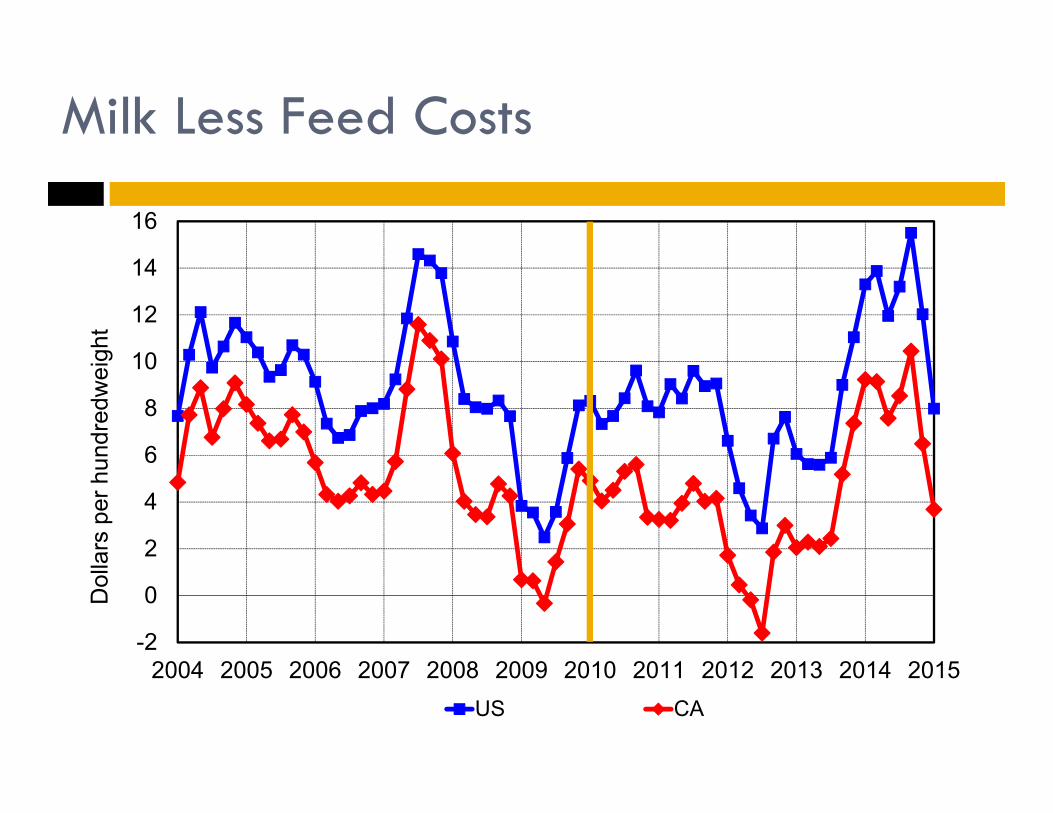
Milk Less Feed Costs
-2
0
2
4
6
8
10
12
14
16
2004 2005 2006 2007 2008 2009 2010 2011 2012 2013 2014 2015
Dol
lars
per
hun
dred
wei
ght
US CA
The Turndown In CA Milk Production
� The US dairy industry was headed for MUCH lower milk prices in 2015
� Milk supplies are generally plentiful across the US Even in the upper Midwest stories of $5 below minimum
pricing can be heard Tankers of milk not finding a home
� The turndown in CA milk production has muted lower milk prices
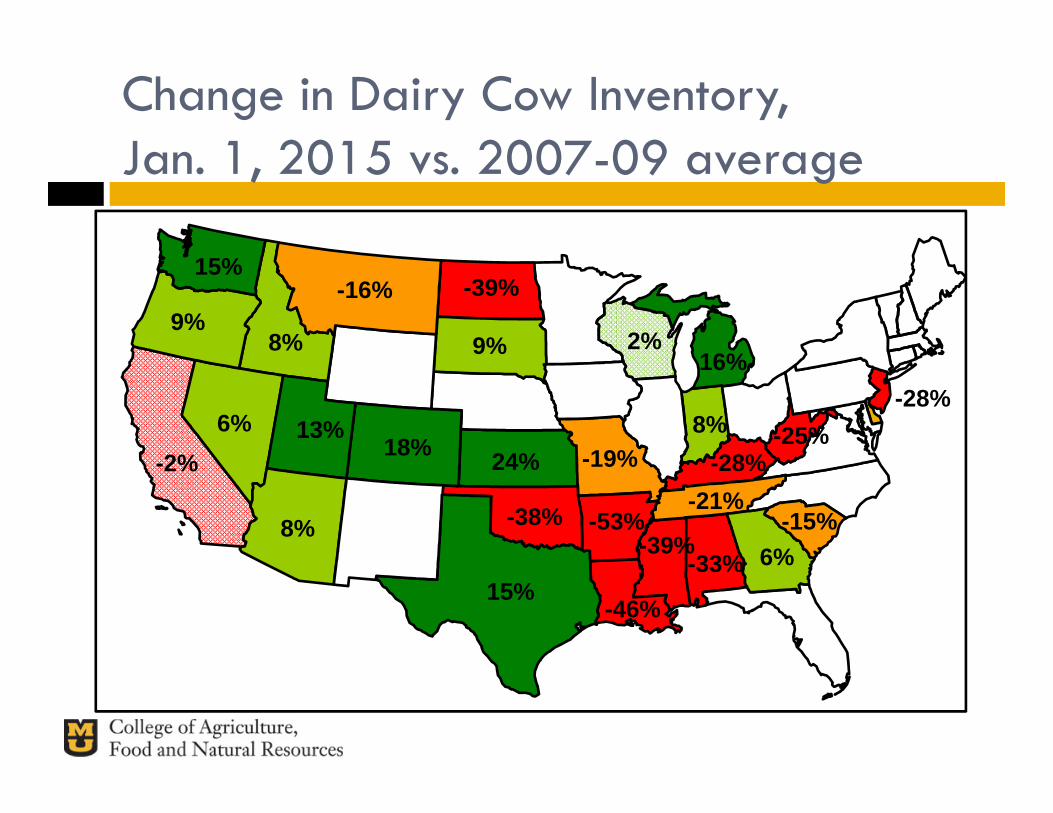
Change in Dairy Cow Inventory,Jan. 1, 2015 vs. 2007-09 average
24%
15%
18%
16%9%
8%
8%6%
9%
-19%
-16%
-15%-21%
-33%
-39%
-38%-39%
-46%
-53%
-28%
-28%-25%
6%8%
13%
15%
-2%
2%
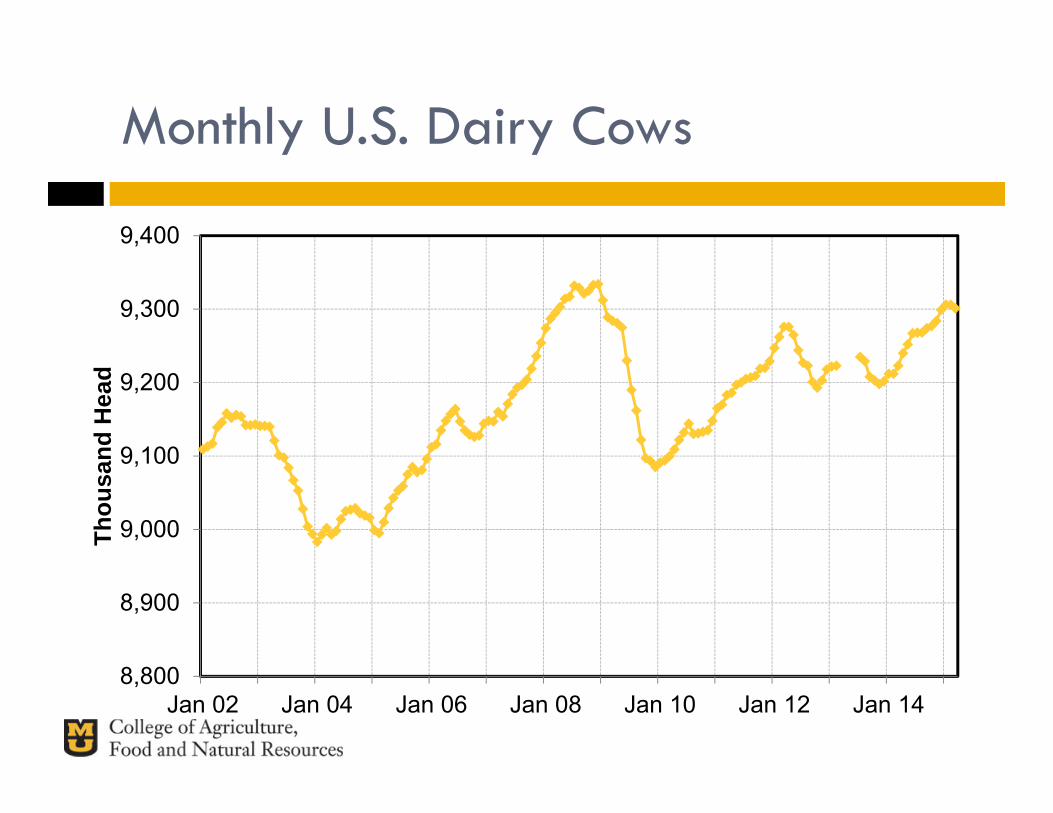
Monthly U.S. Dairy Cows
8,800
8,900
9,000
9,100
9,200
9,300
9,400
Jan 02 Jan 04 Jan 06 Jan 08 Jan 10 Jan 12 Jan 14
Thou
sand
Hea
d
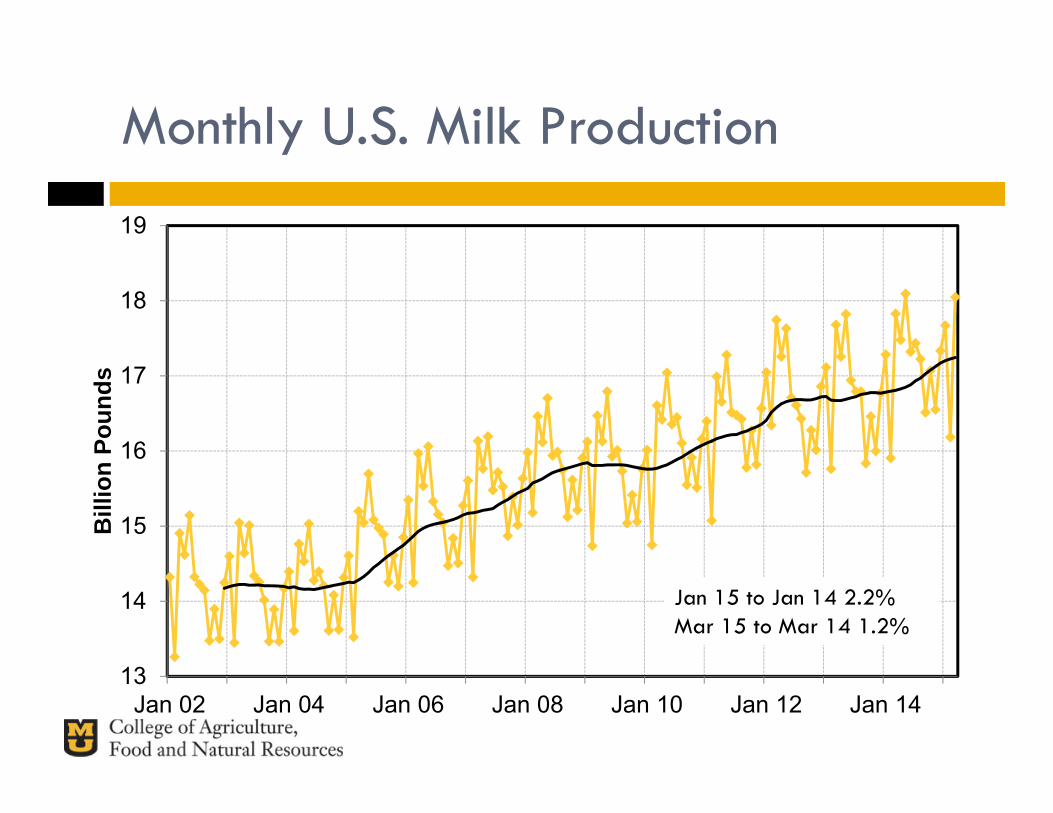
Monthly U.S. Milk Production
13
14
15
16
17
18
19
Jan 02 Jan 04 Jan 06 Jan 08 Jan 10 Jan 12 Jan 14
Bill
ion
Poun
ds
Jan 15 to Jan 14 2.2%Mar 15 to Mar 14 1.2%
My Biggest Risk Factor: Global Markets
� How quickly can US dairy exports recover?� Predicting China’s demand for US dairy products
challenging� Global milk supplies
Oceania Europe
� Stronger dollar hampering trade
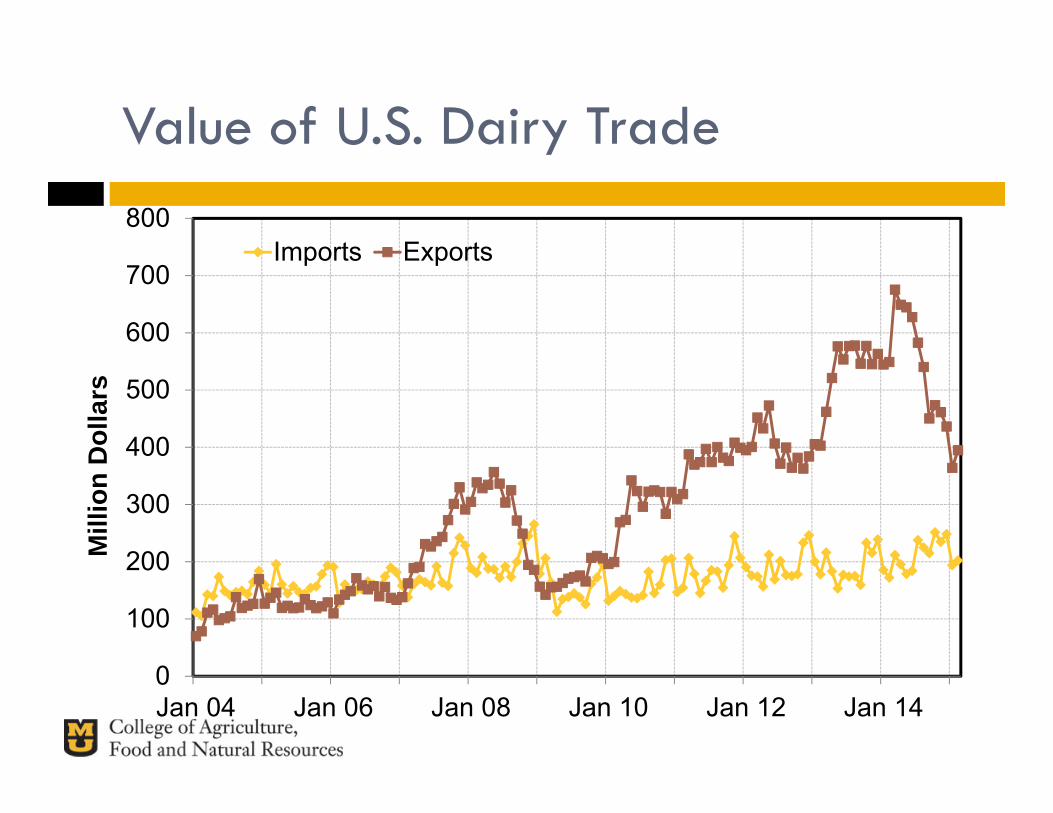
Value of U.S. Dairy Trade
0
100
200
300
400
500
600
700
800
Jan 04 Jan 06 Jan 08 Jan 10 Jan 12 Jan 14
Mill
ion
Dol
lars
Imports Exports
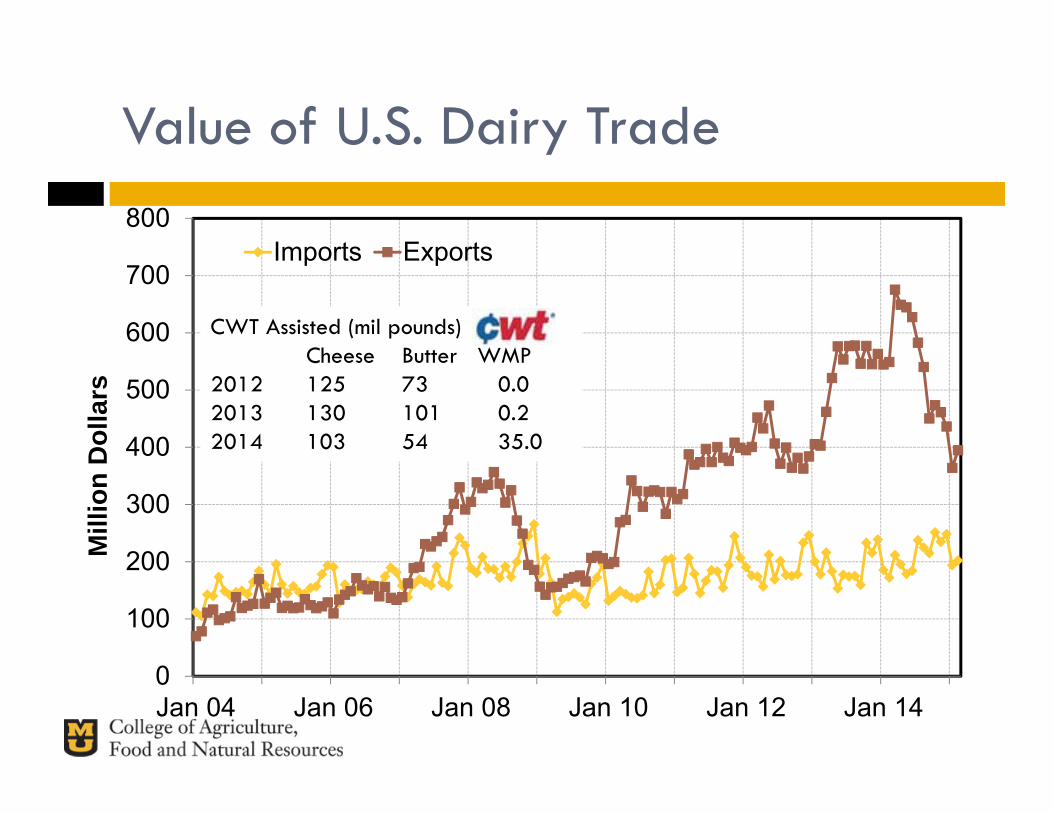
Value of U.S. Dairy Trade
0
100
200
300
400
500
600
700
800
Jan 04 Jan 06 Jan 08 Jan 10 Jan 12 Jan 14
Mill
ion
Dol
lars
Imports Exports
CWT Assisted (mil pounds)Cheese Butter WMP
2012 125 73 0.02013 130 101 0.22014 103 54 35.0
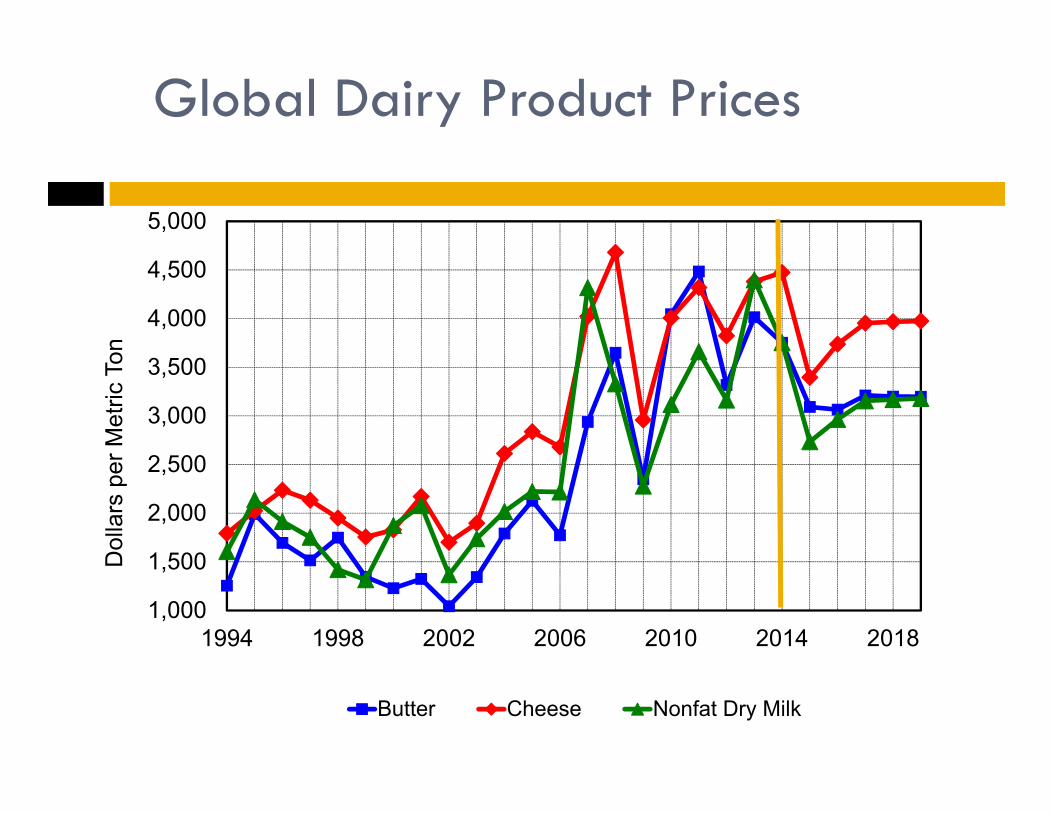
Global Dairy Product Prices
1,000
1,500
2,000
2,500
3,000
3,500
4,000
4,500
5,000
1994 1998 2002 2006 2010 2014 2018
Dol
lars
per
Met
ric T
on
Butter Cheese Nonfat Dry Milk
0100200300400500600700800
1990 1994 1998 2002 2006 2010 2014
Thou
sand
Met
ric T
ons
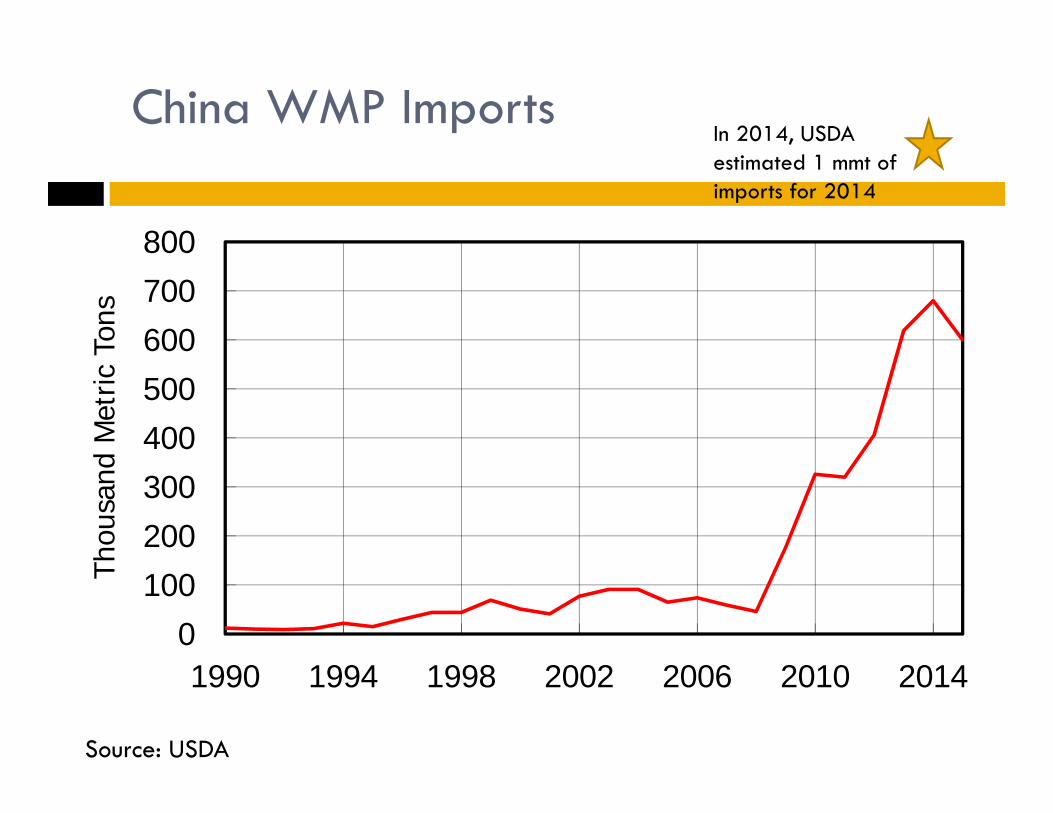
China WMP Imports
Source: USDA
In 2014, USDA estimated 1 mmt of imports for 2014
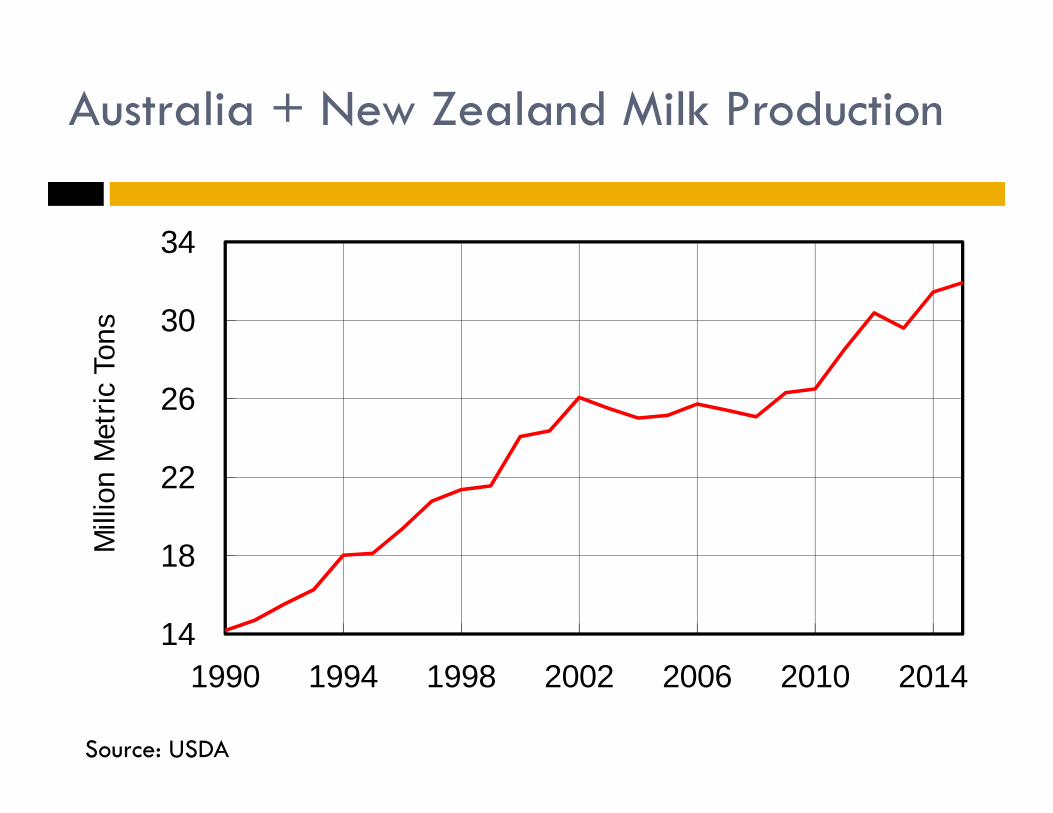
14
18
22
26
30
34
1990 1994 1998 2002 2006 2010 2014
Mill
ion
Met
ric T
ons
Australia + New Zealand Milk Production
Source: USDA
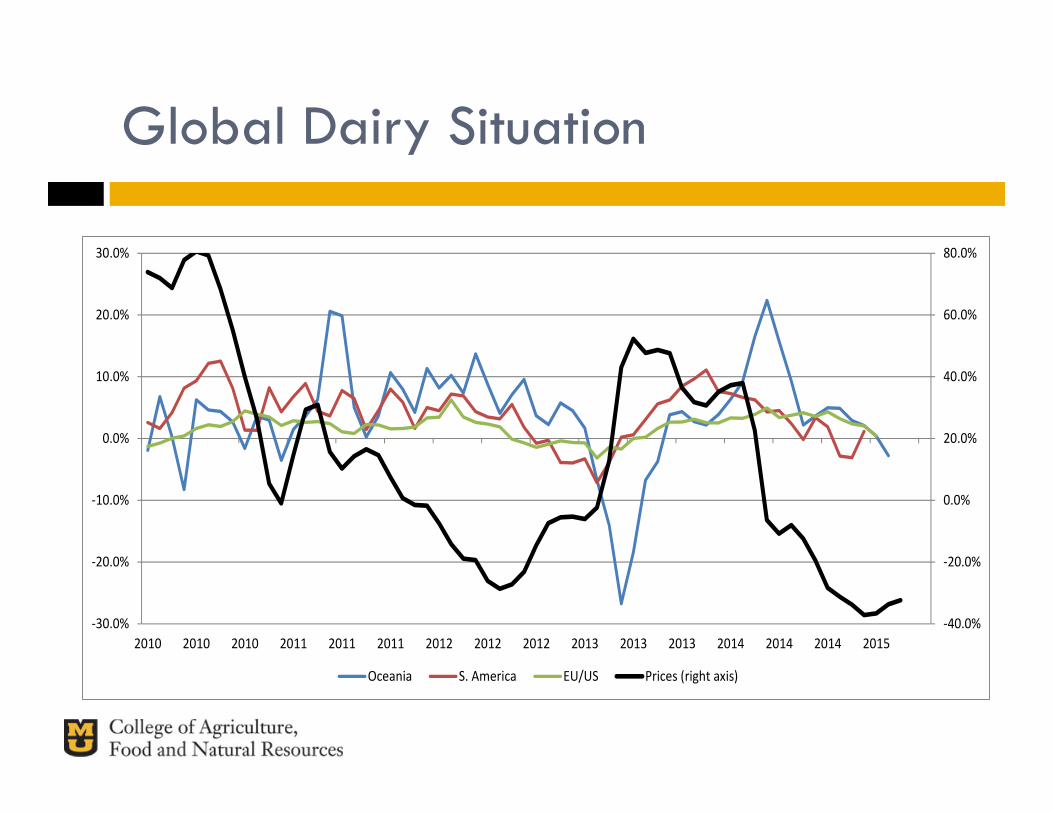
Global Dairy Situation
‐40.0%
‐20.0%
0.0%
20.0%
40.0%
60.0%
80.0%
‐30.0%
‐20.0%
‐10.0%
0.0%
10.0%
20.0%
30.0%
2010 2010 2010 2011 2011 2011 2012 2012 2012 2013 2013 2013 2014 2014 2014 2015
Oceania S. America EU/US Prices (right axis)
2015 – Lower Returns Ahead
� Milk prices have moved significantly lower Increased U.S. milk supplies Decreased export demand for U.S. dairy products
� Conventional wisdom suggests the 2nd half of 2015 will be better Requires export recovery Another good crop this year
� We have not seen the last time of below $12 all milk prices
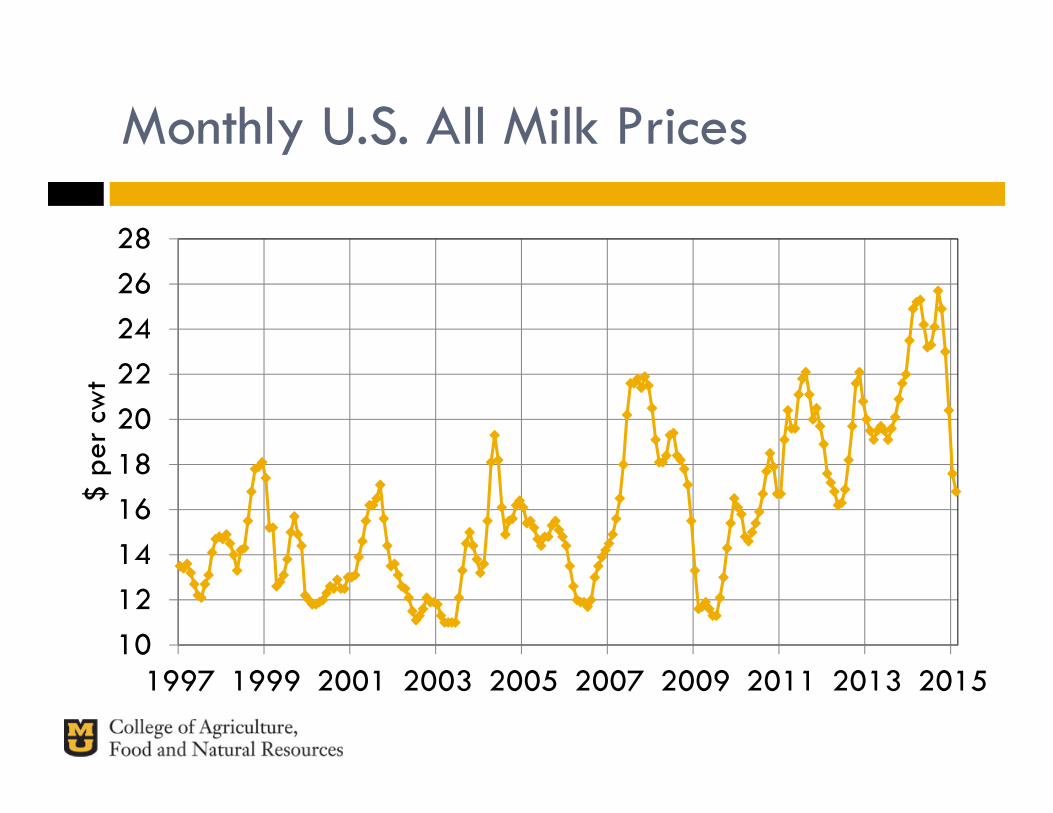
Monthly U.S. All Milk Prices
10121416182022242628
1997 1999 2001 2003 2005 2007 2009 2011 2013 2015
$ pe
r cw
t
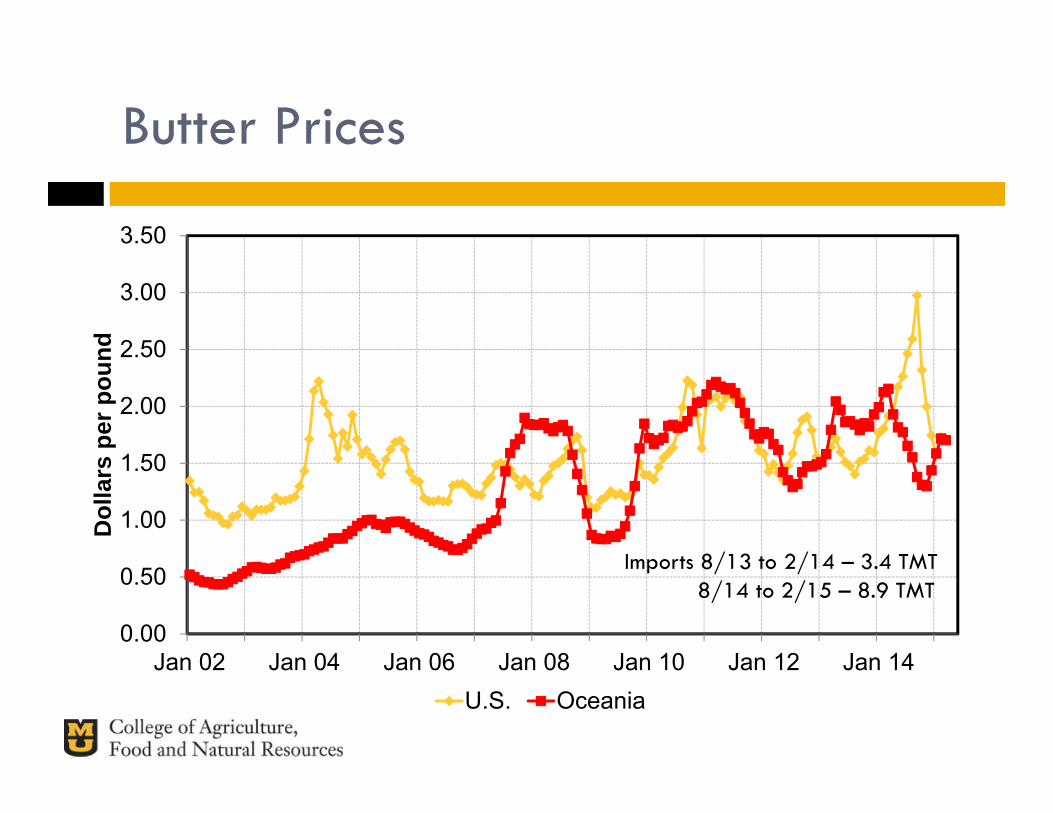
Butter Prices
0.00
0.50
1.00
1.50
2.00
2.50
3.00
3.50
Jan 02 Jan 04 Jan 06 Jan 08 Jan 10 Jan 12 Jan 14
Dol
lars
per
pou
nd
U.S. Oceania
Imports 8/13 to 2/14 – 3.4 TMT8/14 to 2/15 – 8.9 TMT
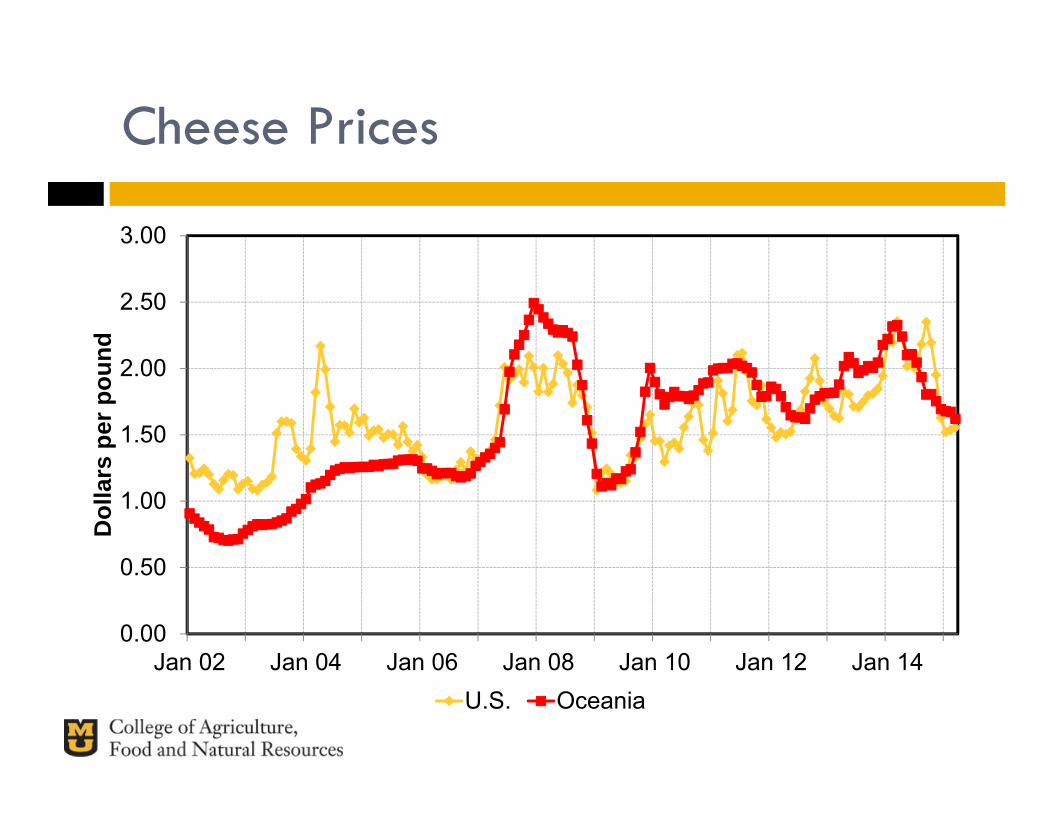
Cheese Prices
0.00
0.50
1.00
1.50
2.00
2.50
3.00
Jan 02 Jan 04 Jan 06 Jan 08 Jan 10 Jan 12 Jan 14
Dol
lars
per
pou
nd
U.S. Oceania
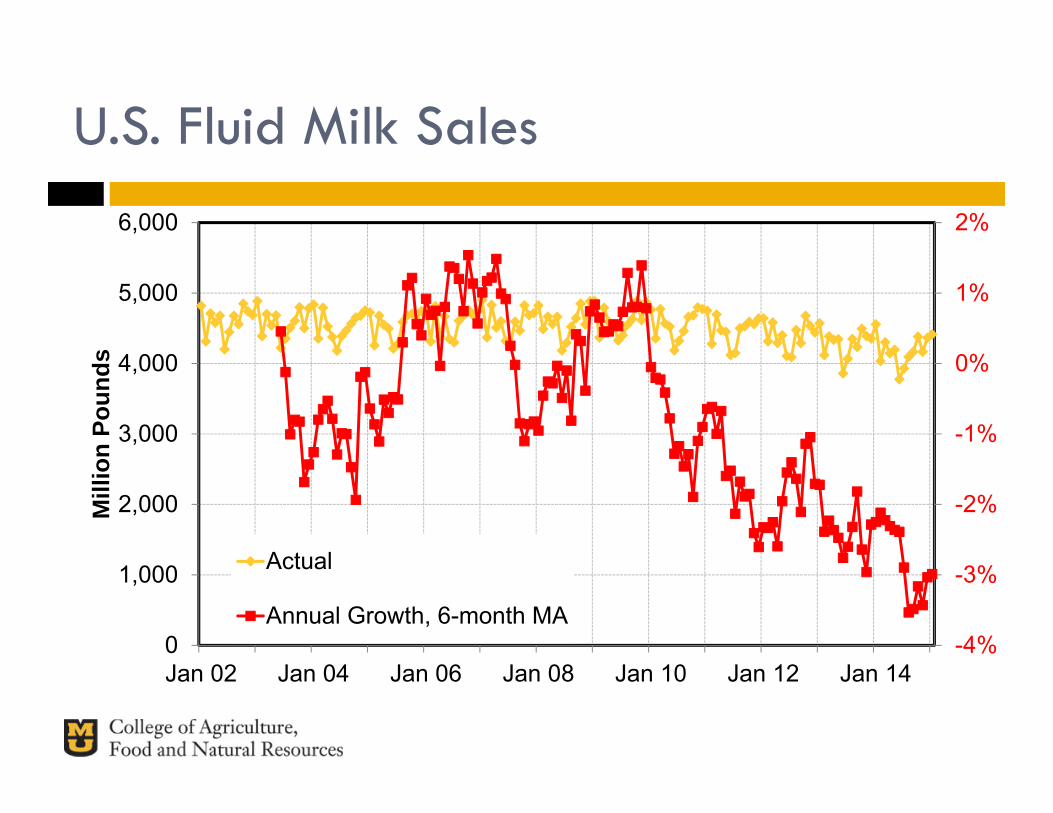
U.S. Fluid Milk Sales
-4%
-3%
-2%
-1%
0%
1%
2%
0
1,000
2,000
3,000
4,000
5,000
6,000
Jan 02 Jan 04 Jan 06 Jan 08 Jan 10 Jan 12 Jan 14
Mill
ion
Poun
ds
Actual
Annual Growth, 6-month MA
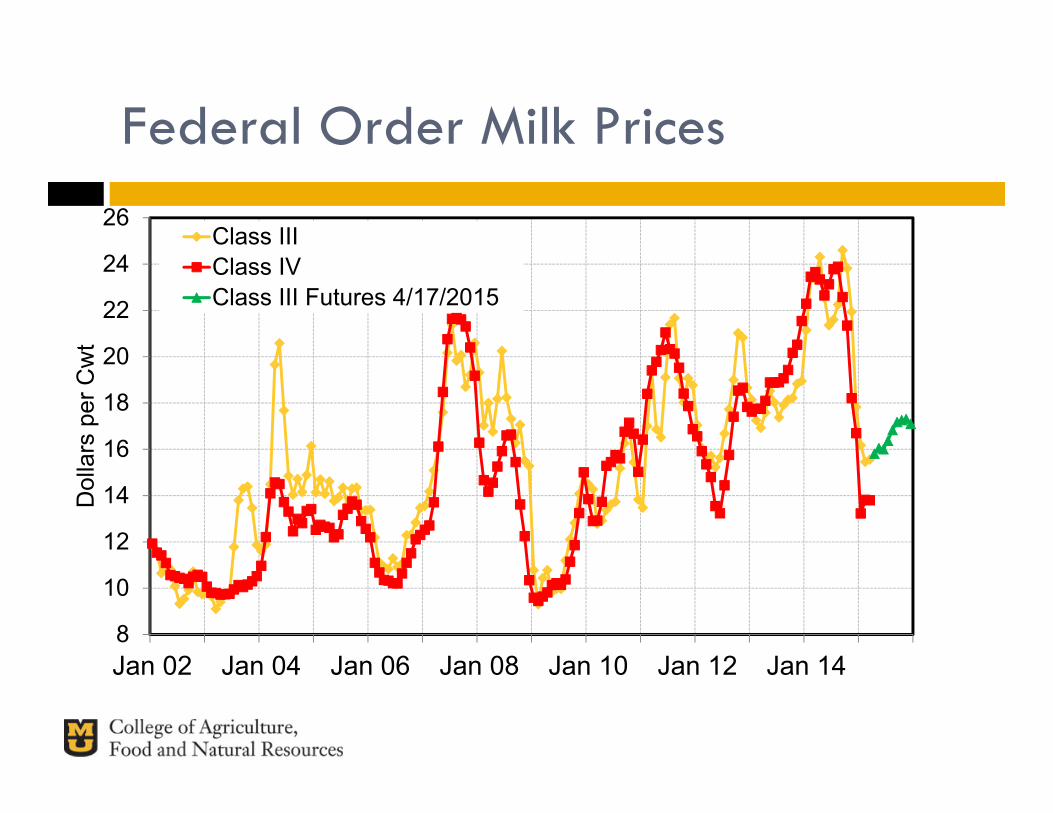
Federal Order Milk Prices
8
10
12
14
16
18
20
22
24
26
Jan 02 Jan 04 Jan 06 Jan 08 Jan 10 Jan 12 Jan 14
Dol
lars
per
Cw
t
Class IIIClass IVClass III Futures 4/17/2015
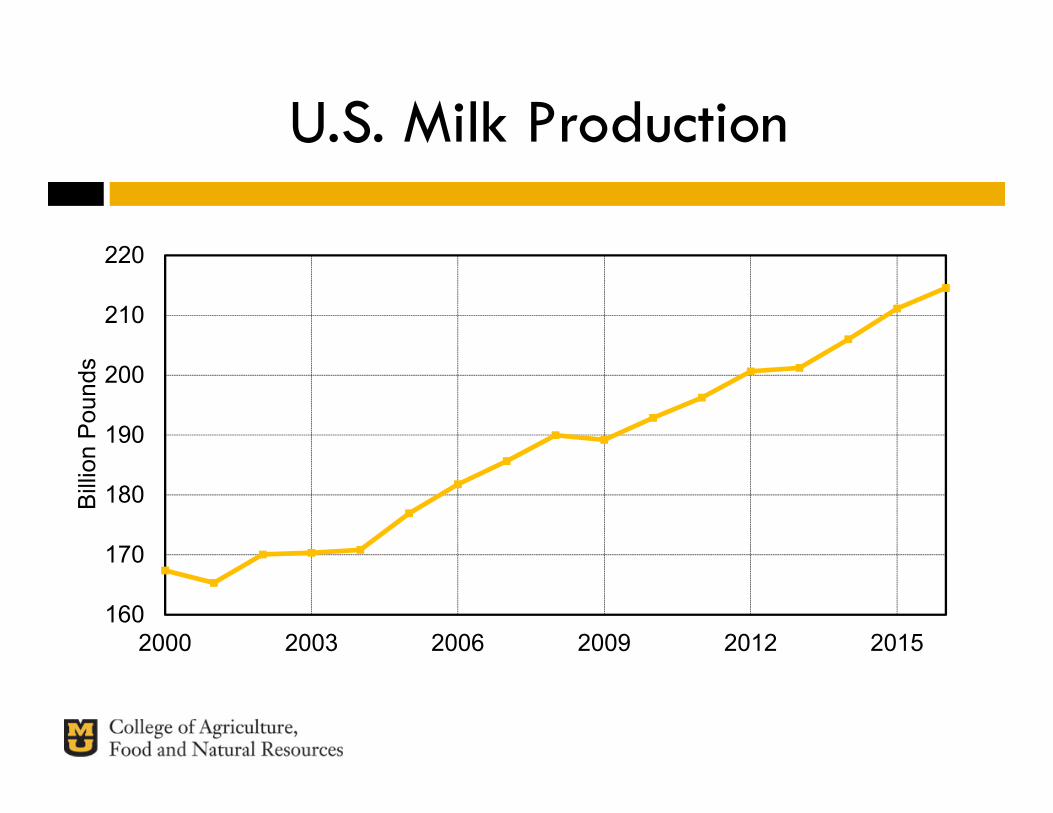
U.S. Milk Production
160
170
180
190
200
210
220
2000 2003 2006 2009 2012 2015
Bill
ion
Pou
nds
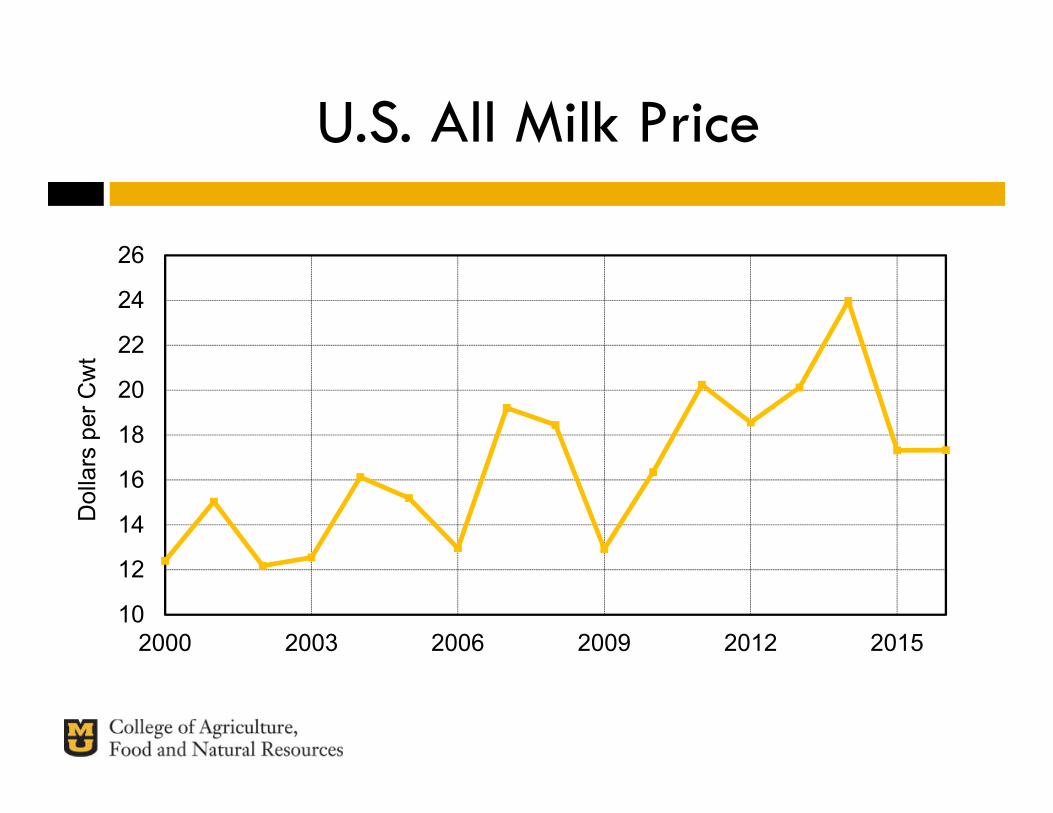
U.S. All Milk Price
10
12
14
16
18
20
22
24
26
2000 2003 2006 2009 2012 2015
Dol
lars
per
Cw
t
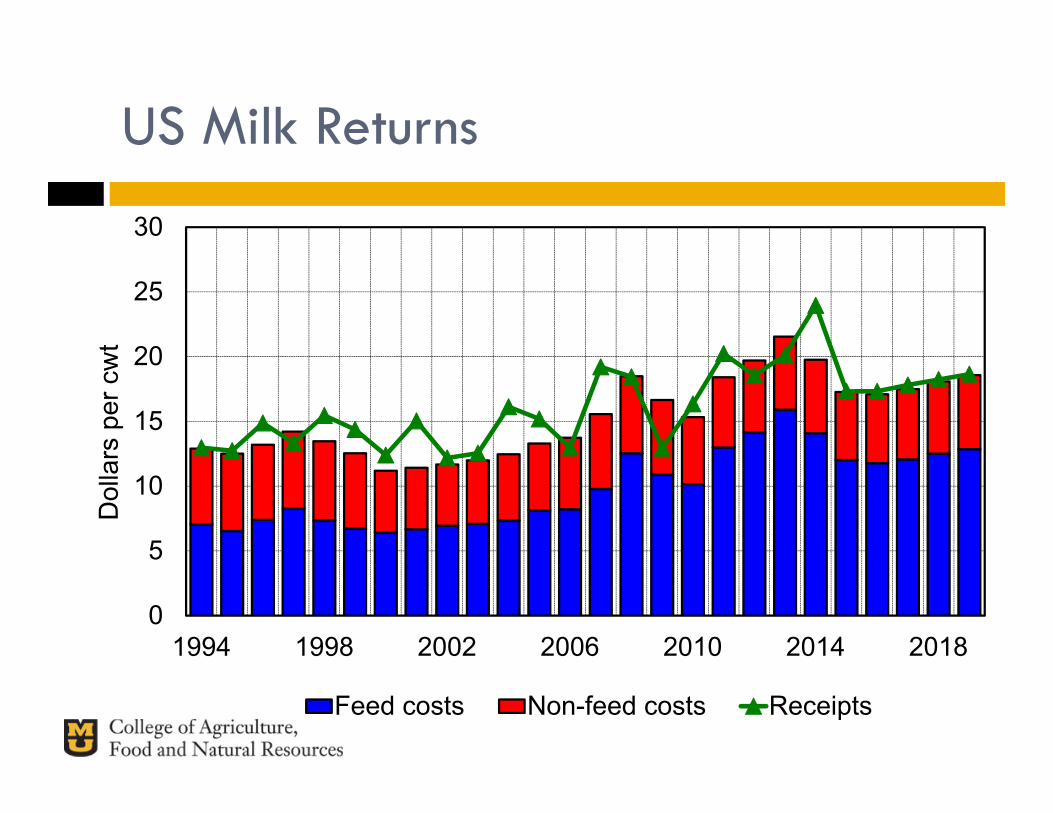
US Milk Returns
0
5
10
15
20
25
30
1994 1998 2002 2006 2010 2014 2018
Dol
lars
per
cw
t
Feed costs Non-feed costs Receipts
Margin Protection Program (MPP)
� Passing the 2014 farm bill was a monumental challenge
� Dairy had its fair share of fights Soviet-style dairy policy Supply management
� Dairy took a big swing at policy change� Too early to grade the program� Policy NEVER works under all market outcomes
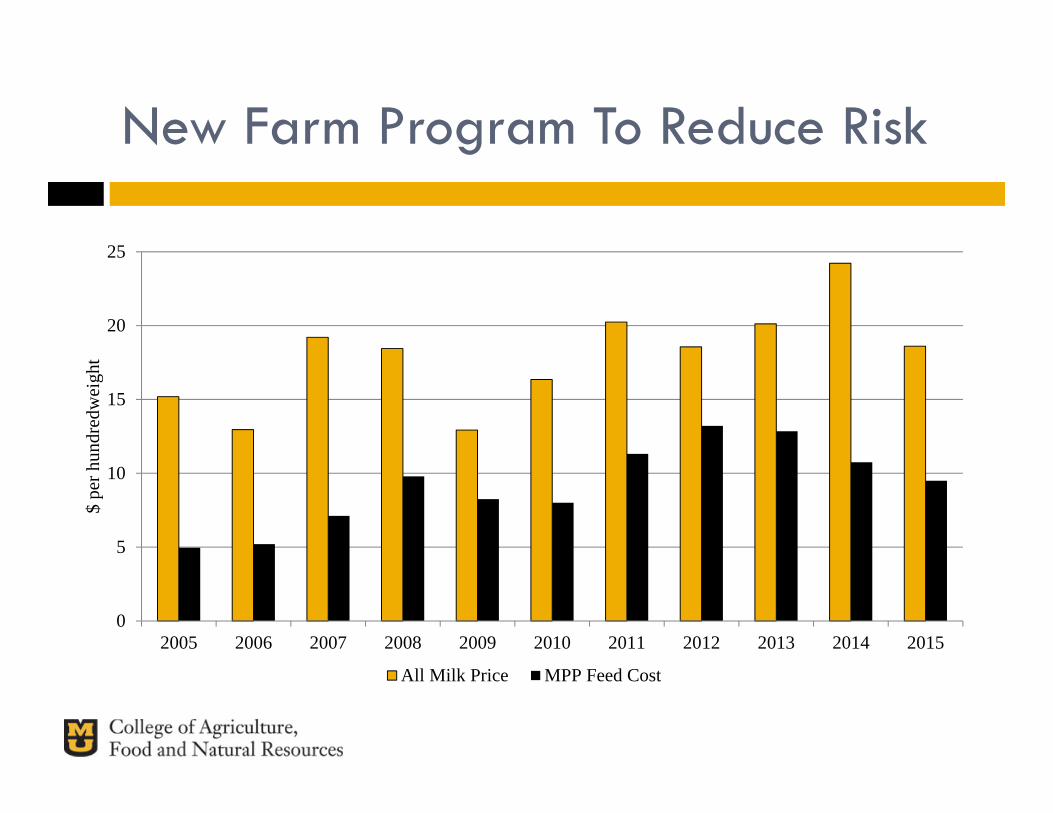
New Farm Program To Reduce Risk
0
5
10
15
20
25
2005 2006 2007 2008 2009 2010 2011 2012 2013 2014 2015
$ pe
r hun
dred
wei
ght
All Milk Price MPP Feed Cost
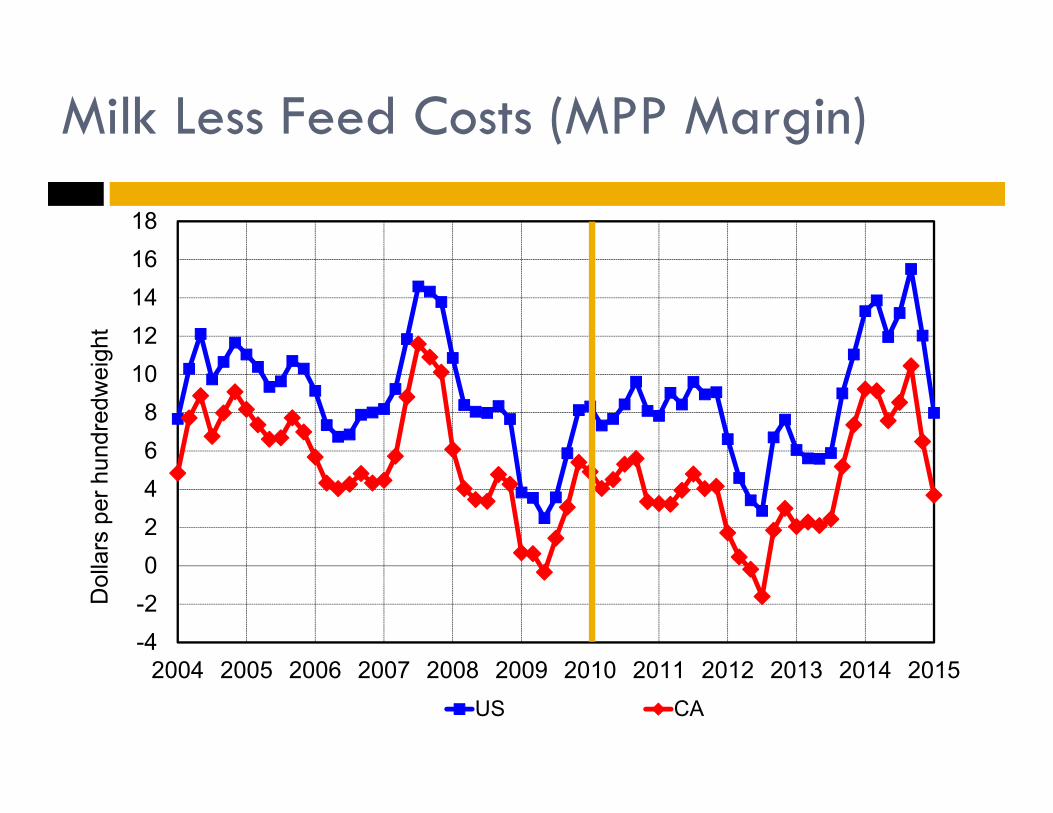
Milk Less Feed Costs (MPP Margin)
-4-202468
1012141618
2004 2005 2006 2007 2008 2009 2010 2011 2012 2013 2014 2015
Dol
lars
per
hun
dred
wei
ght
US CA
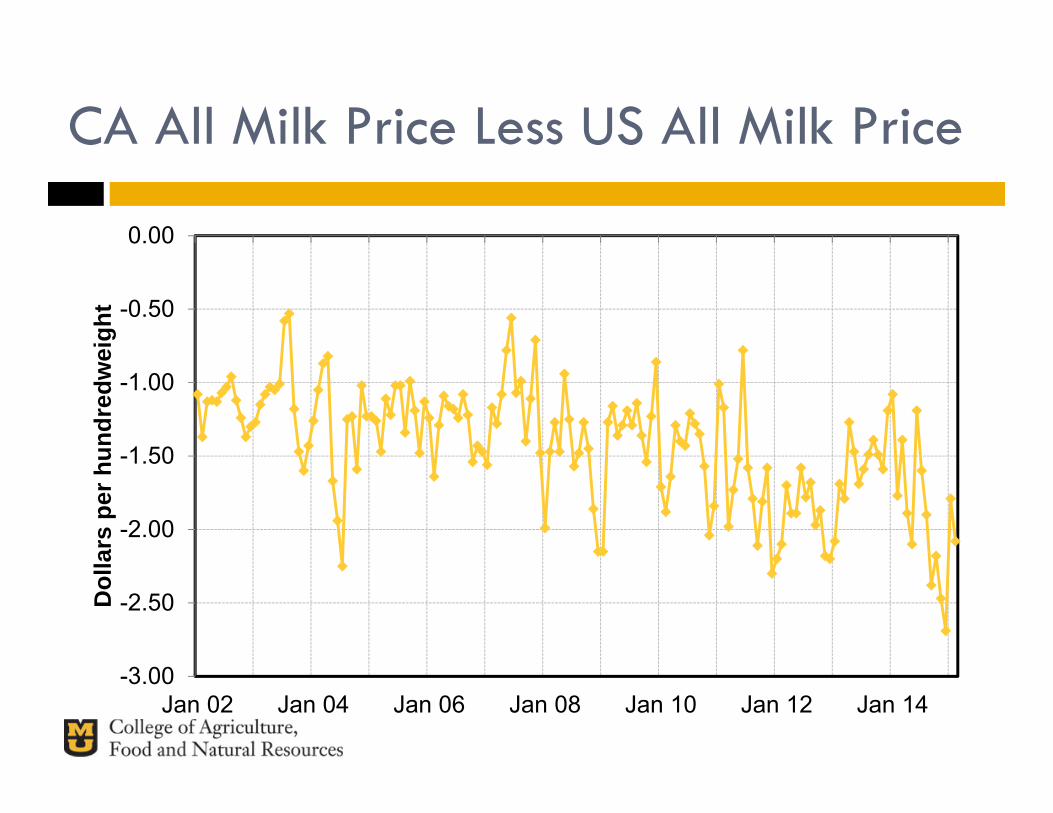
CA All Milk Price Less US All Milk Price
-3.00
-2.50
-2.00
-1.50
-1.00
-0.50
0.00
Jan 02 Jan 04 Jan 06 Jan 08 Jan 10 Jan 12 Jan 14
Dol
lars
per
hun
dred
wei
ght
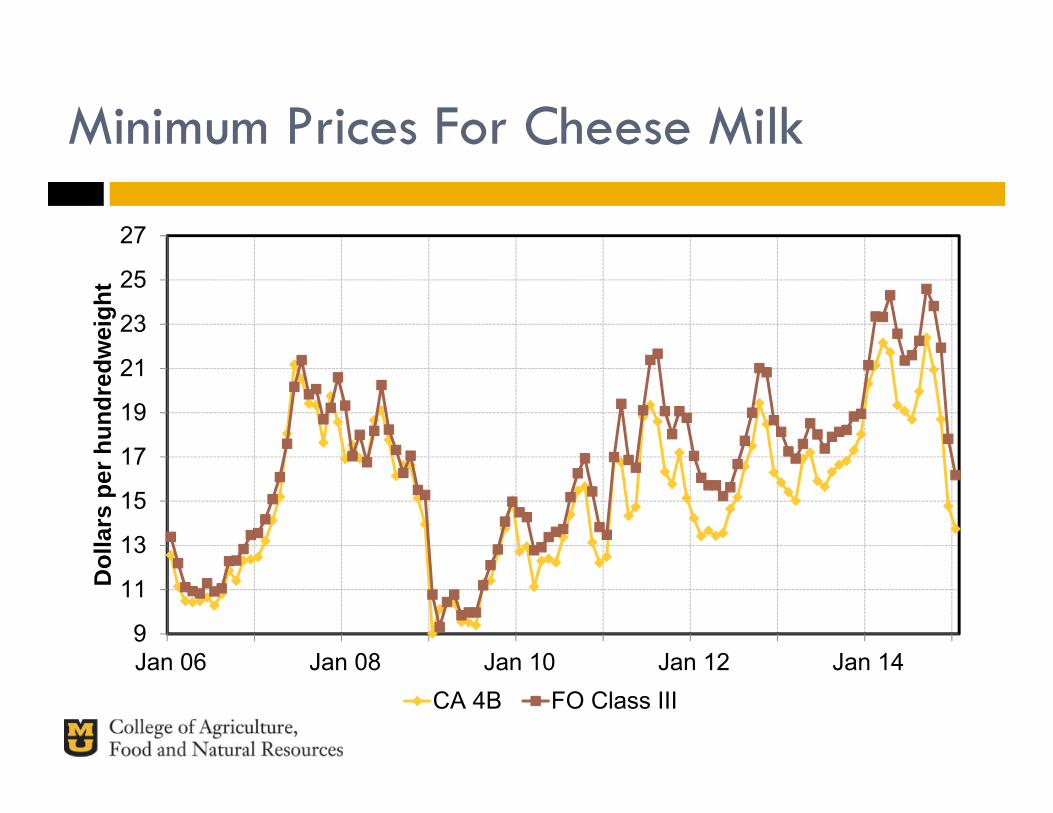
Minimum Prices For Cheese Milk
9
11
13
15
17
19
21
23
25
27
Jan 06 Jan 08 Jan 10 Jan 12 Jan 14
Dol
lars
per
hun
dred
wei
ght
CA 4B FO Class III
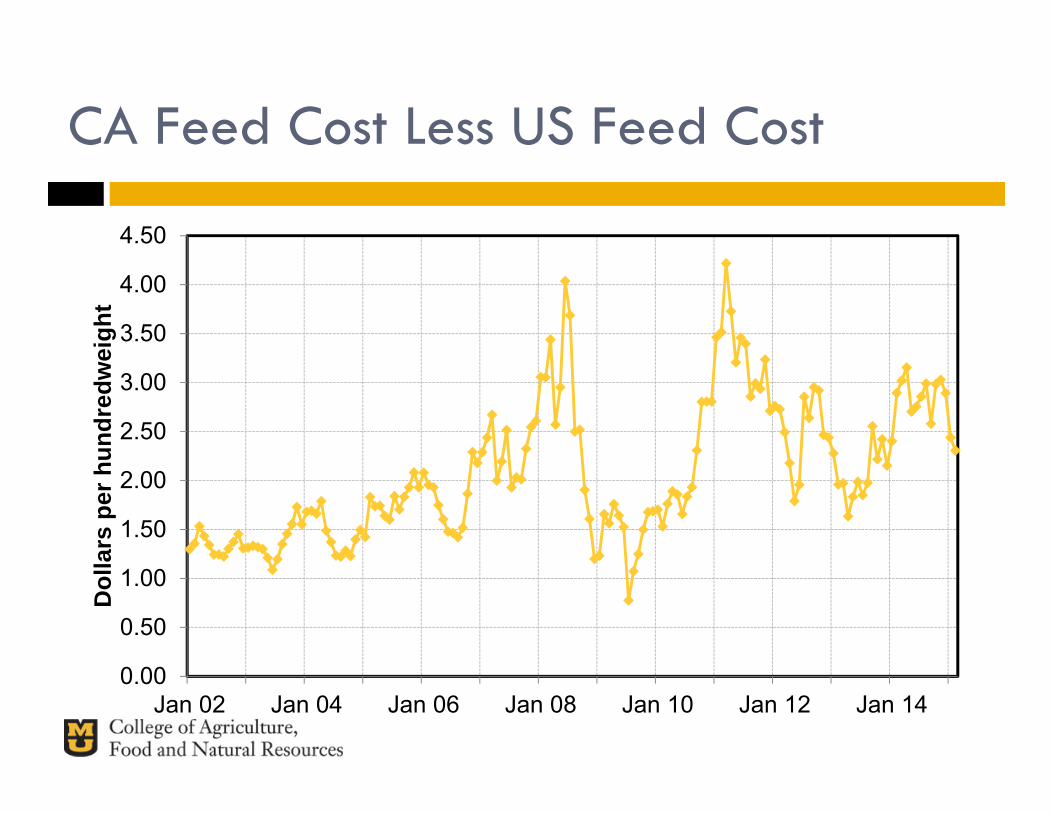
CA Feed Cost Less US Feed Cost
0.00
0.50
1.00
1.50
2.00
2.50
3.00
3.50
4.00
4.50
Jan 02 Jan 04 Jan 06 Jan 08 Jan 10 Jan 12 Jan 14
Dol
lars
per
hun
dred
wei
ght
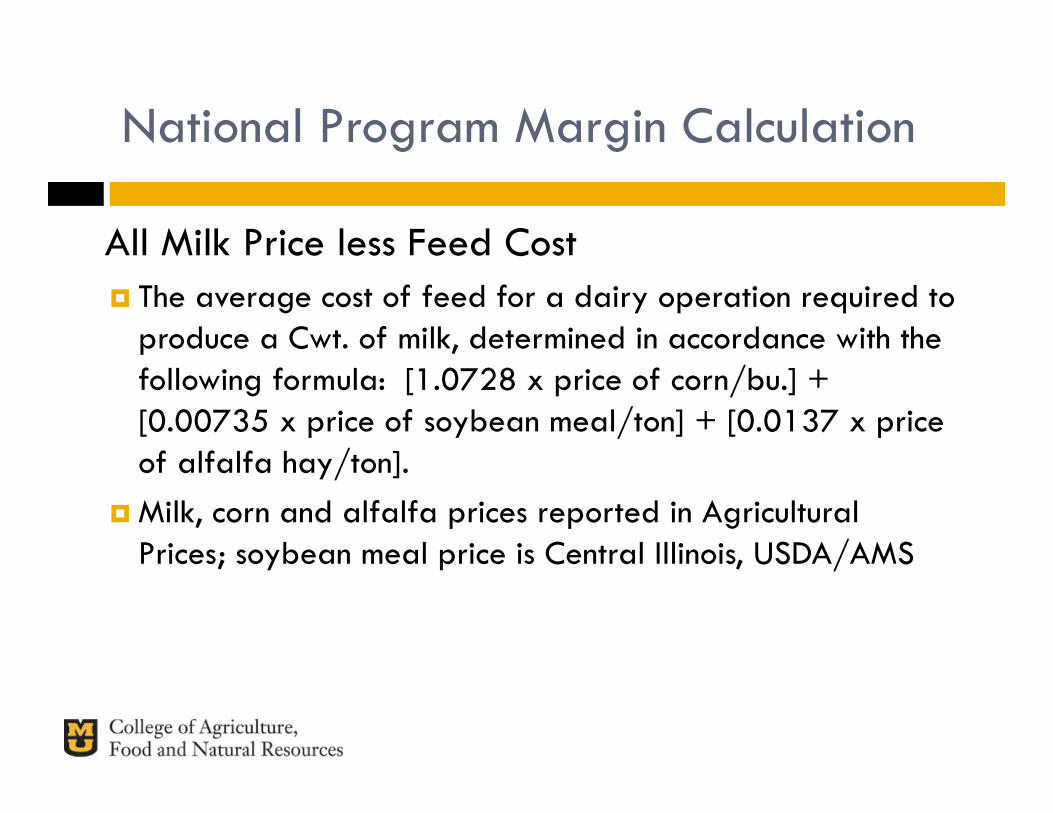
National Program Margin Calculation
� All Milk Price less Feed Cost The average cost of feed for a dairy operation required to
produce a Cwt. of milk, determined in accordance with the following formula: [1.0728 x price of corn/bu.] + [0.00735 x price of soybean meal/ton] + [0.0137 x price of alfalfa hay/ton].
Milk, corn and alfalfa prices reported in Agricultural Prices; soybean meal price is Central Illinois, USDA/AMS
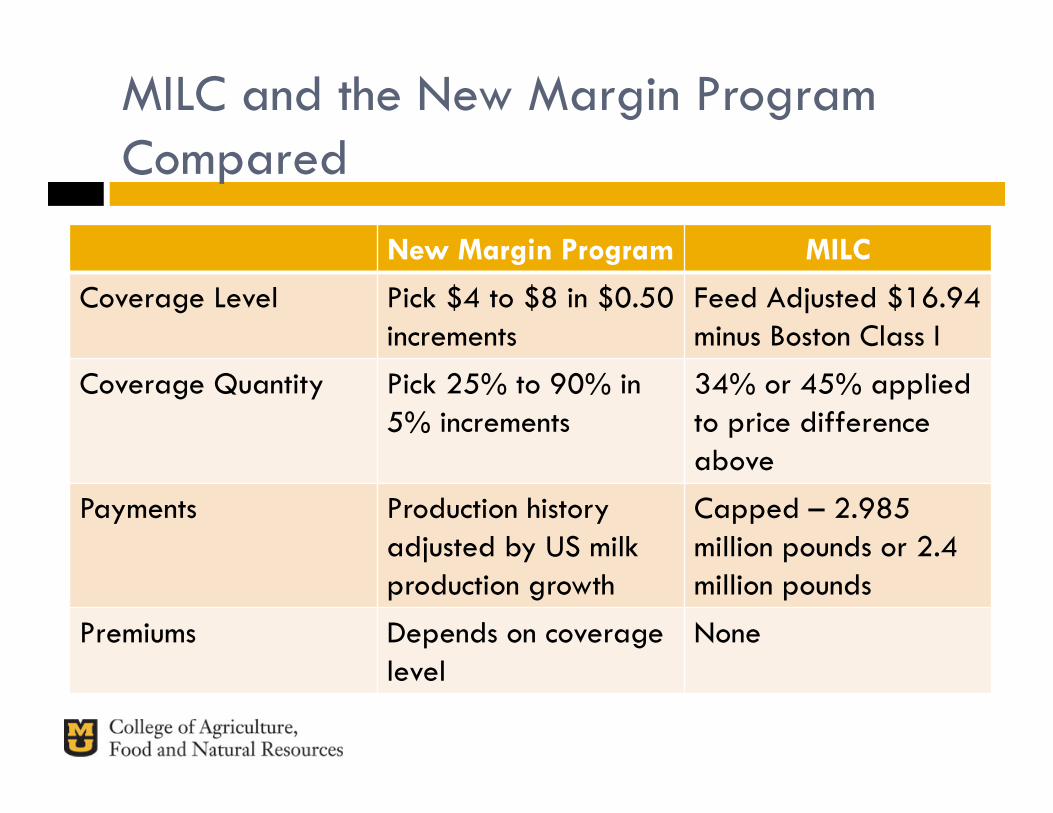
MILC and the New Margin Program Compared
New Margin Program MILC
Coverage Level Pick $4 to $8 in $0.50 increments
Feed Adjusted $16.94minus Boston Class I
Coverage Quantity Pick 25% to 90% in 5% increments
34% or 45% applied to price difference above
Payments Production history adjusted by US milk production growth
Capped – 2.985million pounds or 2.4 million pounds
Premiums Depends on coverage level
None
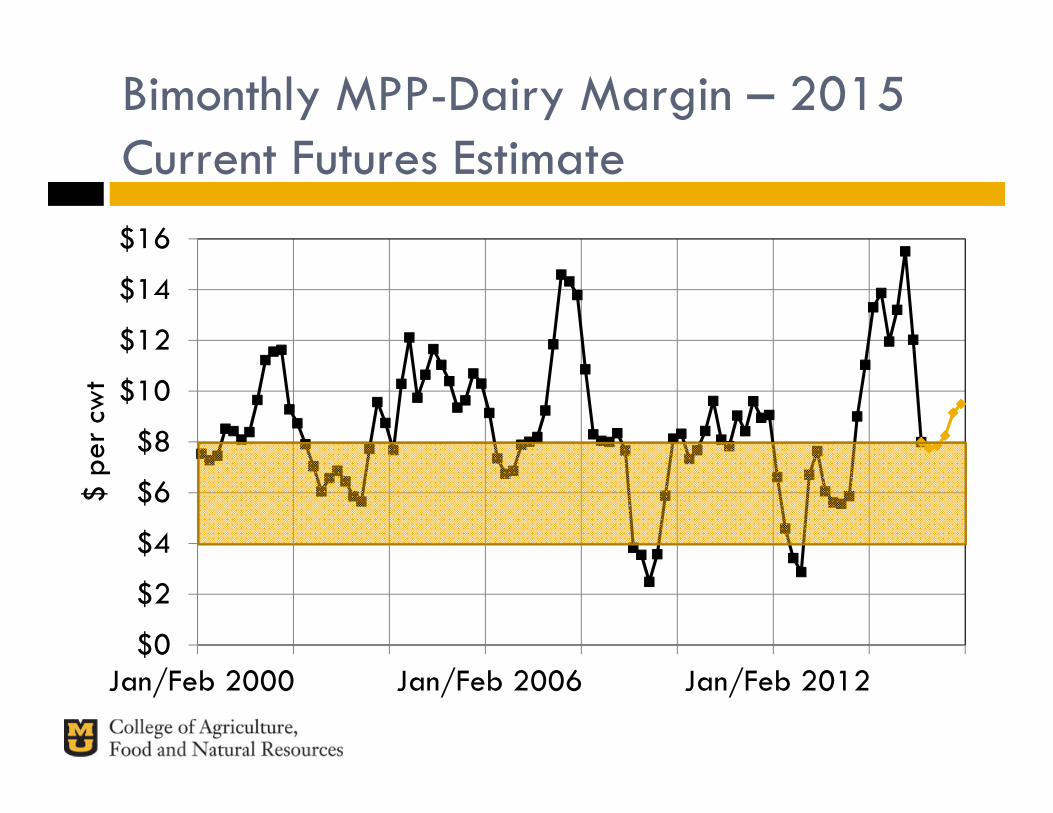
Bimonthly MPP-Dairy Margin – 2015 Current Futures Estimate
$0
$2
$4
$6
$8
$10
$12
$14
$16
Jan/Feb 2000 Jan/Feb 2006 Jan/Feb 2012
$ pe
r cw
t
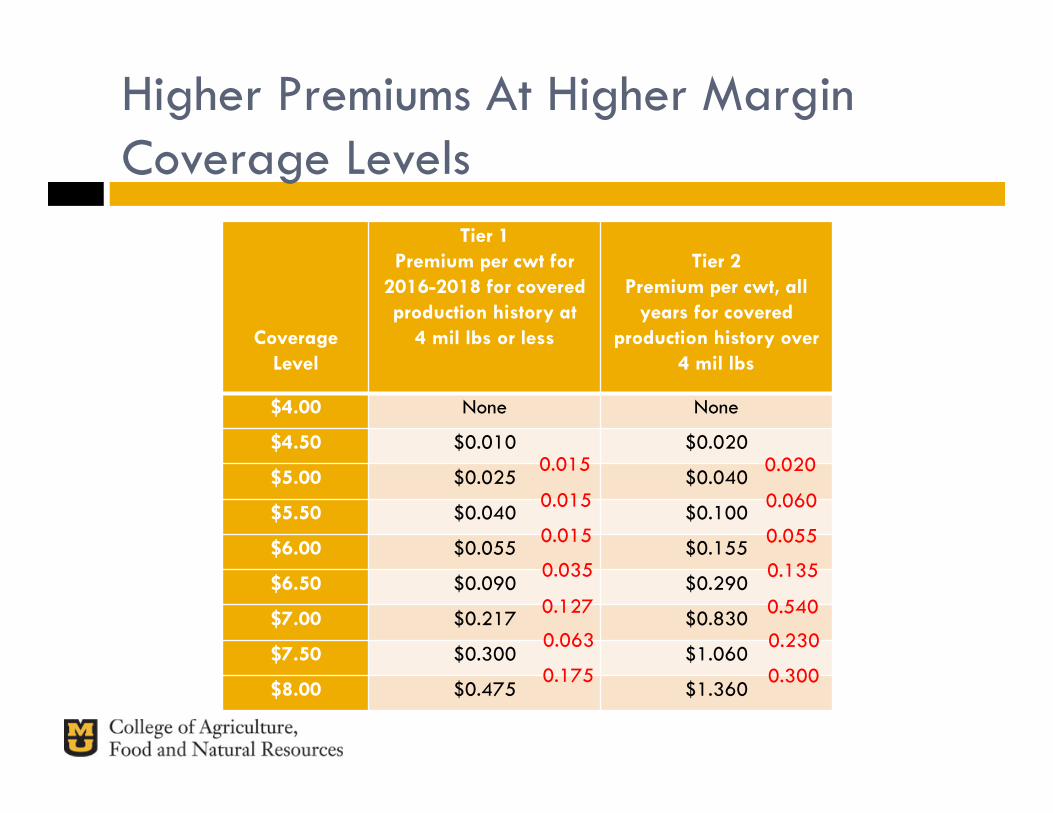
Higher Premiums At Higher Margin Coverage Levels
Coverage Level
Tier 1Premium per cwt for
2016-2018 for covered production history at
4 mil lbs or less
Tier 2Premium per cwt, all
years for covered production history over
4 mil lbs
$4.00 None None
$4.50 $0.010 $0.020
$5.00 $0.025 $0.040
$5.50 $0.040 $0.100
$6.00 $0.055 $0.155
$6.50 $0.090 $0.290
$7.00 $0.217 $0.830
$7.50 $0.300 $1.060
$8.00 $0.475 $1.360
0.015
0.015
0.015
0.035
0.127
0.063
0.175
0.020
0.060
0.055
0.135
0.540
0.230
0.300
Hindsight Is 20/20
� Looking backwards….. Small producers should have picked $4 or $8 Larger producers should have picked $4, $6.5, $8
� Looking forward…… Does not mean the same choices Premium cost versus safety net
My Observations After The First Signup
� Did producers think through the risk mitigation opportunities under MPP?
� More education needed on correlation of their margin to the MPP margin
� Use of futures markets versus MPP for risk protection 2015 Class III futures near $18 when 2015 signup started 2016 Class III futures near $16.75 today
� Producer tools focused too much on program maximization and not enough on risk management
� Tools need to compare risk reduction strategies
Work Needs To Start On 2016 Signup
� Signup period 7/1/2015 – 9/30/2015� Choice must be made further from the period of
coverage� This may highlight risk management versus program
maximization or cause producers not to enroll� Compare futures market cost versus MPP cost� Producers need to think about what level of
coverage they need to survive
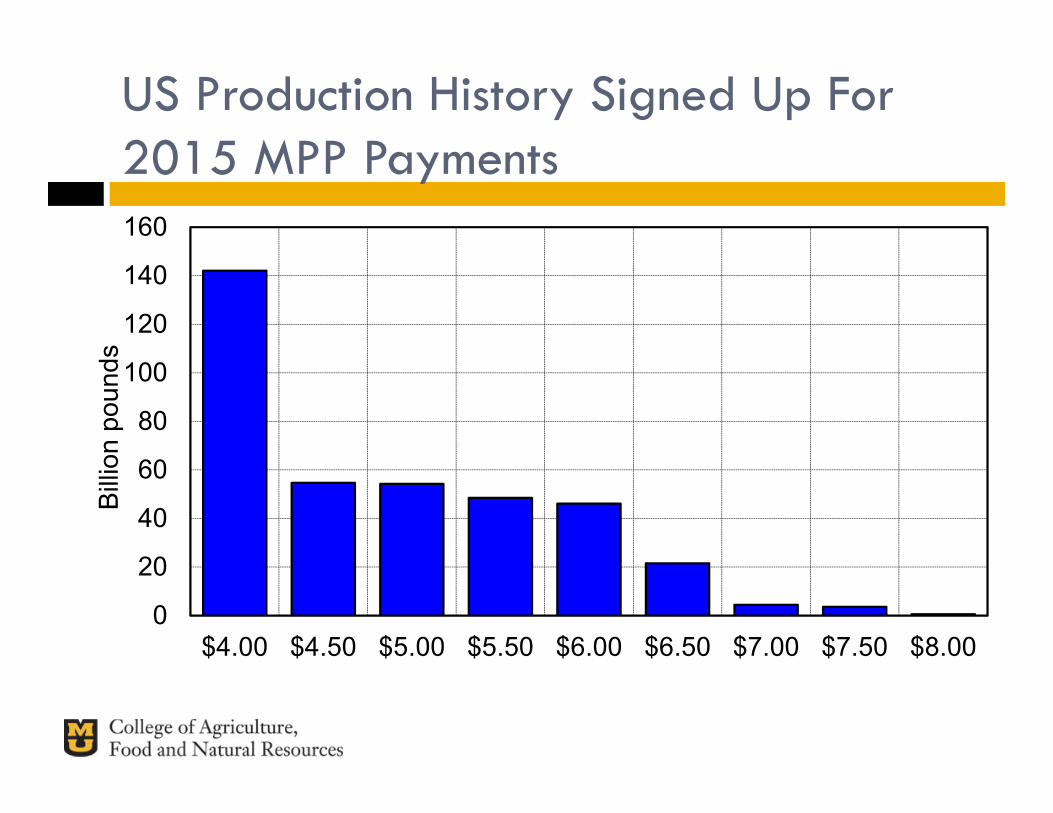
US Production History Signed Up For 2015 MPP Payments
0
20
40
60
80
100
120
140
160
$4.00 $4.50 $5.00 $5.50 $6.00 $6.50 $7.00 $7.50 $8.00
Billi
on p
ound
s
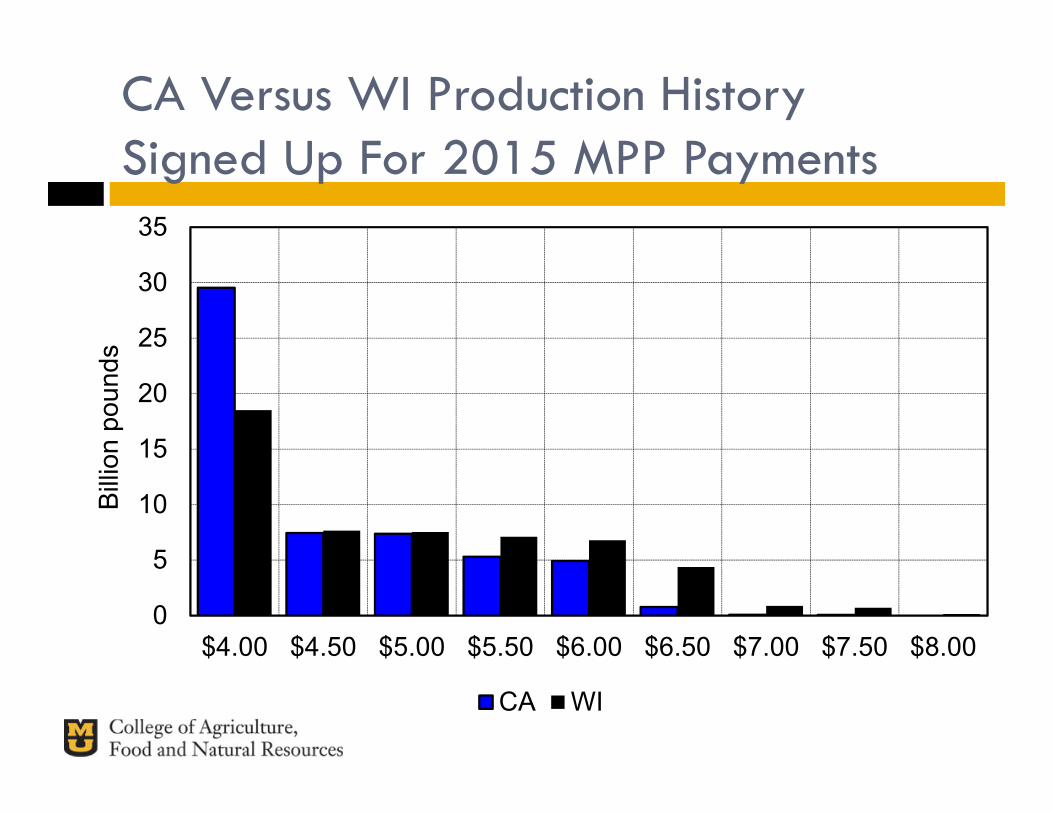
CA Versus WI Production History Signed Up For 2015 MPP Payments
0
5
10
15
20
25
30
35
$4.00 $4.50 $5.00 $5.50 $6.00 $6.50 $7.00 $7.50 $8.00
Billi
on p
ound
s
CA WI
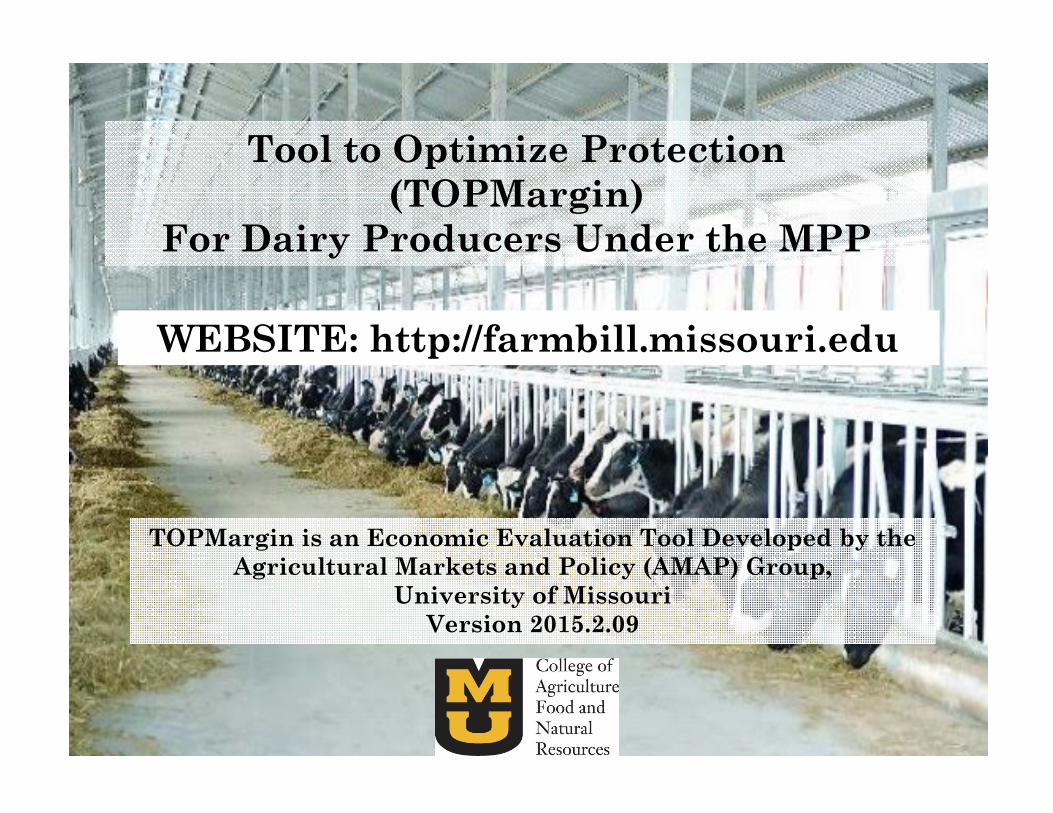
Tool to Optimize Protection (TOPMargin)
For Dairy Producers Under the MPP
TOPMargin is an Economic Evaluation Tool Developed by the Agricultural Markets and Policy (AMAP) Group,
University of MissouriVersion 2015.2.09
WEBSITE: http://farmbill.missouri.edu
TOPMargin – Dairy Margin Risk Tool
� Based on historical volatility, TOPMargin puts risk around the expected average margin outcome
� Let’s look at a 2,000,000 production history operation
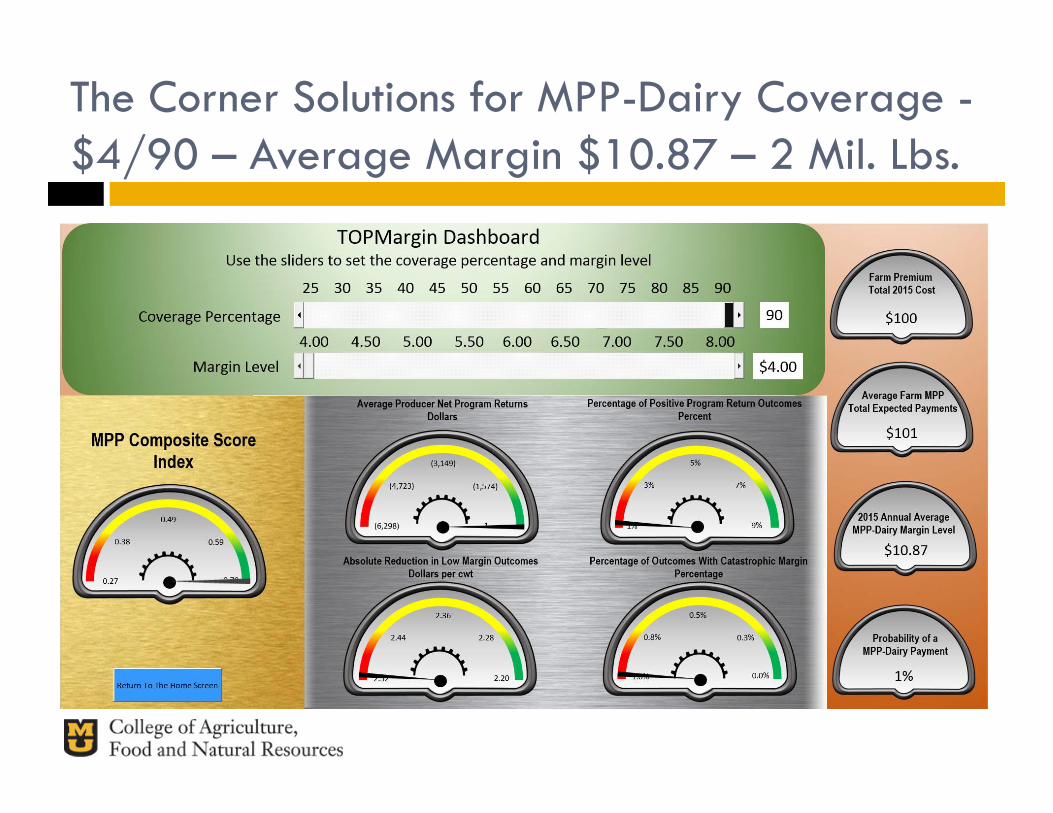
The Corner Solutions for MPP-Dairy Coverage -$4/90 – Average Margin $10.87 – 2 Mil. Lbs.

The Corner Solutions for MPP-Dairy Coverage -$8/90 – Average Margin $10.87 – 2 Mil. Lbs.
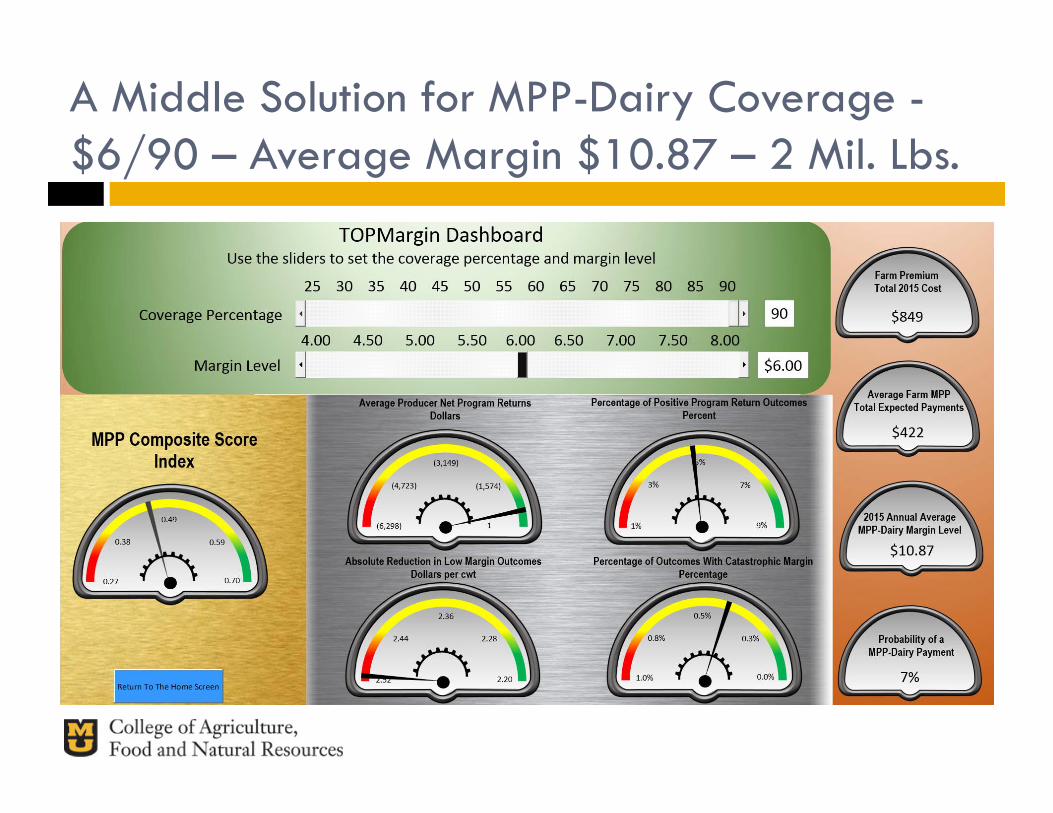
A Middle Solution for MPP-Dairy Coverage -$6/90 – Average Margin $10.87 – 2 Mil. Lbs.
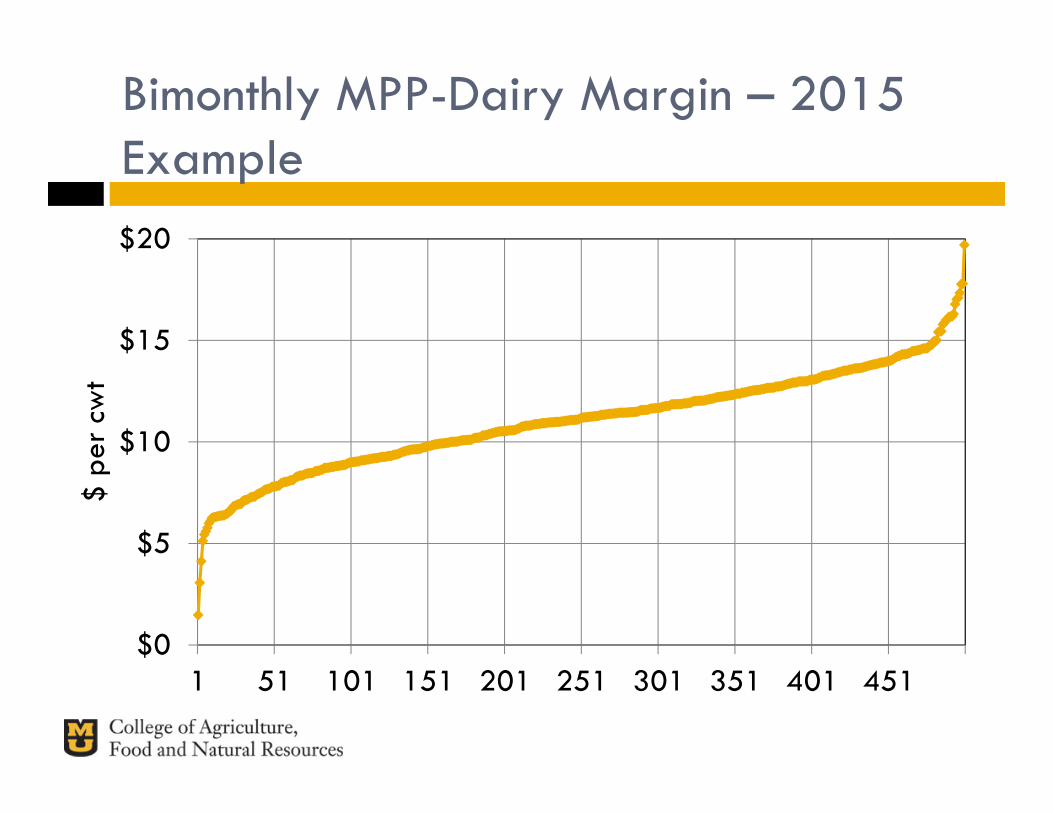
Bimonthly MPP-Dairy Margin – 2015 Example
$0
$5
$10
$15
$20
1 51 101 151 201 251 301 351 401 451
$ pe
r cw
t
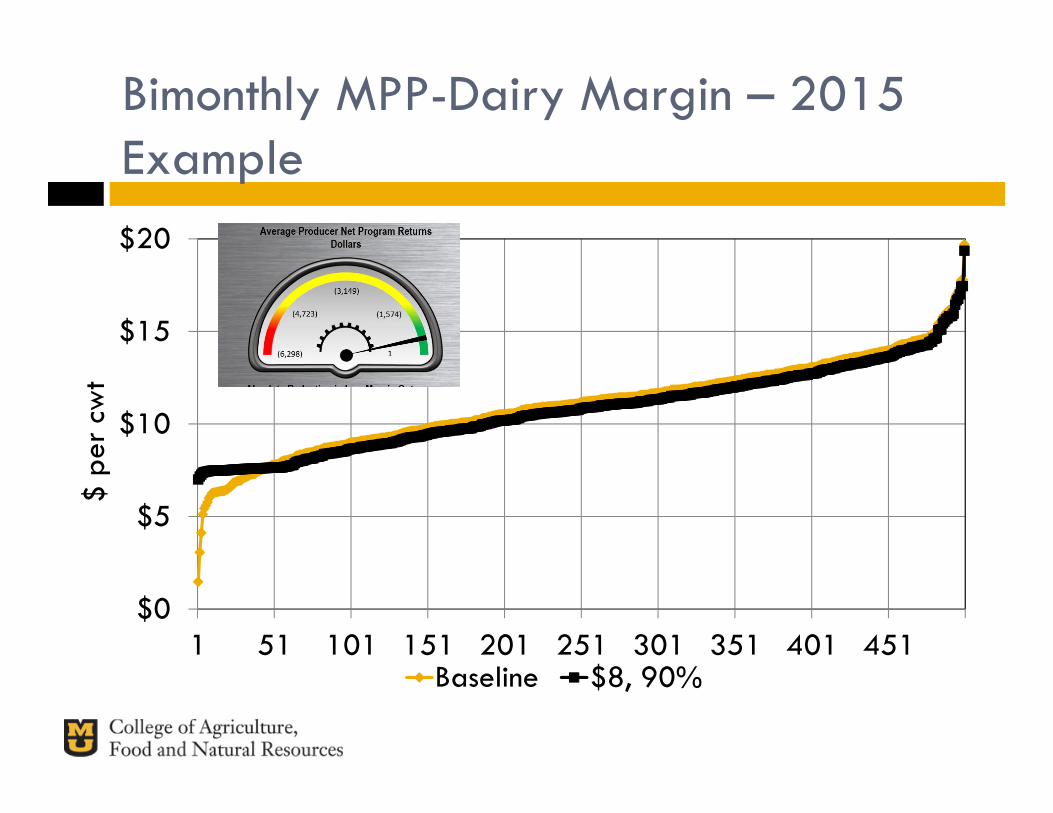
Bimonthly MPP-Dairy Margin – 2015 Example
$0
$5
$10
$15
$20
1 51 101 151 201 251 301 351 401 451
$ pe
r cw
t
Baseline $8, 90%
Summary
� 2015 will be a year of lower returns Export recovery necessary
No drought in the Midwest
� CA federal order will take time to resolve� Changes to financial/political landscape in CA could change relative
position� Need producers to use MPP as risk management not program
maximization� Download the tool to think through the alternatives
http://farmbill.missouri.edu
New web-based tool under development between University of Missouri and Texas A&M University