DAIRY MARKET NEWS WEEK OF APRIL 9 - 13, 2018 ... Dairy Market News reports...is part of USDA's...
31
DAIRY MARKET NEWS WEEK OF APRIL 9 - 13, 2018 VOLUME 85, REPORT 15 DAIRY MARKET NEWS AT A GLANCE TABLE OF CONTENTS Product Highlights/CME/DMN at a Glance 1 Weekly CME Activity/Butter Markets/NDPSR 2 Cheese Markets 3 Fluid Milk and Cream 4 Nonfat Dry Milk/Dry Buttermilk/Dry Whole Milk 5 Dry Whey/WPC 34%/Lactose/Casein 6 U.S. Dairy Cow Slaughter/Class Milk Prices 7 International Dairy Market News 8 CME Dairy Futures 9 April Supply and Demand Estimates 10 Consumer Price Index 12 February Milk Sales 13 Dairy Graphs G1 Dairy Market News Retail Report Dairy Market News Contacts CME GROUP CASH MARKETS (4/13) BUTTER: Grade AA closed at $2.2875. The weekly average for Grade AA is $2.3095(+.0355). CHEESE: Barrels closed at $1.4600 and 40# blocks at $1.6050. The weekly average for barrels is $1.4705(+.0230) and blocks, $1.6215 (+.0630). NONFAT DRY MILK: Grade A closed at $.7325. The weekly average for Grade A is $.7330 (+.0260). DRY WHEY: Extra grade dry whey closed at $.3050. The weekly average for dry whey is $.3050 (+.0160). BUTTER HIGHLIGHTS: Production is active throughout the nation as cream is readily available for butter manufacturing needs. In the West, there are reports of many states being in the spring flush, resulting in abundant milk volumes clearing through Class IV/4a utilization. Some industry contacts report that there is strong interest from export purchasers in multiple global localities, as butter prices are internationally competitive. Butter inventories are adequate to meet demand. Bulk butter prices range from 5 cents under to 8 cents over the market, based on the CME Group with various time periods and averages used. The market tone is bullish as spot market activity was heavy this week and prices inched higher. The CME Group weekly average for Grade AA butter is $2.3095, compared to $2.2740, last week’s average. CHEESE HIGHLIGHTS: Across the nation, cheesemakers are taking in plentiful milk supplies. In the Midwestern region, discounted spot milk loads continue to flow into vats; this week they range from $2 to $3.50 under Class. Spring flush is in effect in parts of the West, as some cheesemakers there are opting to limit their milk intakes. Orders are steady to strong nationwide. Food service sales have picked up with schools back in session ahead of summer break, and Western contacts suggest both barrel and block sales are healthy. With the milk intakes at increased/increasing levels, cheese production is apace. Some producers in the Midwest have reported using nonfat dry milk (NDM) to fortify cheese. The cheese market tone has bullish indicators. Although many contacts are somewhat concerned regarding the return of the large CME block-over-barrel price gap, there is a sense of contentment amongst producers regarding current price points and potentialities. The CME Group weekly average for barrels, $1.4705, is up $.0230 from last week’s average. The average for blocks, $1.6215, is up $.0630 from last week’s average. FLUID MILK: Milk supplies are heavy throughout the nation and are sufficient to meet processors’ needs. Overall, milk production is flat to increasing as the spring flush is at its peak in some areas and just starting in others. Many plant managers report running at full capacity. In the West, production is strong. However, there are reports of milk being in over supply and spilling into surrounding regions. Bottling has picked up due to schools reopening. Cream supplies are adequate to meet all manufacturing needs. However, some manufacturers are willing to sell their cream in lieu of processing. Ice cream producers are taking more loads of cream. Condensed skim markets are unchanged as there continues to be heavy supplies available in the Eastern and Western regions. Cream multiples for all Classes range 1.17-1.26 in the East, 1.16-1.25 in the Midwest, and 1.00-1.24 in the West. DRY PRODUCTS: United States low/medium heat nonfat dry milk (NDM) prices are mixed as some market participants are willing to pay $.70+ for NDM, however others believe the prices are not echoing current market conditions. The overall tone is mixed. High heat prices are steady to a tad higher. Spot sales remain light as offers are limited. Dry buttermilk prices are unchanged this week and market activities seem to be limited outside of contractual needs. The market undertone is relatively steady. Dry whole milk prices moved upward this week. A few processors believe the market is firming on strong demand, especially from the confectionary industry. Dry whey prices -CONTINUED ON PAGE 1A- CME GROUP CASH TRADING COMMODITY MONDAY TUESDAY WEDNESDAY THURSDAY FRIDAY :: WEEKLY :: WEEKLY APR 09 APR 10 APR 11 APR 12 APR 13 :: CHANGE* :: AVERAGE# CHEESE BARRELS $1.4775 $1.4775 $1.4775 $1.4600 $1.4600 :: :: $1.4705 (+.0275) (N.C.) (N.C.) (-.0175) (N.C.) :: (+.0100) :: (+.0230) 40# BLOCKS $1.6025 $1.6400 $1.6400 $1.6200 $1.6050 :: :: $1.6215 (N.C.) (+.0375) (N.C.) (-.0200) (-.0150) :: (+.0025) :: (+.0630) NONFAT DRY MILK GRADE A $.7275 $.7350 $.7350 $.7350 $.7325 :: :: $.7330 (N.C.) (+.0075) (N.C.) (N.C.) (-.0025) :: (+.0050) :: (+.0260) BUTTER GRADE AA $2.3200 $2.3200 $2.3200 $2.3000 $2.2875 :: :: $2.3095 (+.0325) (N.C.) (N.C.) (-.0200) (-.0125) :: (N.C.) :: (+.0355) DRY WHEY EXTRA GRADE $.3100 $.3000 $.3050 $.3050 $.3050 :: :: $.3050 (-.0100) (-.0100) (+.0050) (N.C.) (N.C.) :: (-.0150) :: (+.0160) CHEESE: carload = 40,000 lbs., BUTTER: carlot = 40,000-43,000 lbs. *Sum of daily changes. # Weekly averages are simple averages of the daily closing prices for the calendar week. Computed by Dairy Market News for international purposes. This data is available on the Internet at WWW.AMS.USDA.GOV/MARKET-NEWS/DAIRY
Transcript of DAIRY MARKET NEWS WEEK OF APRIL 9 - 13, 2018 ... Dairy Market News reports...is part of USDA's...

DAIRY MARKET NEWS
WEEK OF APRIL 9 - 13, 2018 VOLUME 85, REPORT 15
DAIRY MARKET NEWS AT A GLANCE
TABLE OF CONTENTS Product Highlights/CME/DMN at a Glance 1 Weekly CME Activity/Butter Markets/NDPSR 2 Cheese Markets 3 Fluid Milk and Cream 4 Nonfat Dry Milk/Dry Buttermilk/Dry Whole Milk 5
Dry Whey/WPC 34%/Lactose/Casein 6 U.S. Dairy Cow Slaughter/Class Milk Prices 7 International Dairy Market News 8 CME Dairy Futures 9 April Supply and Demand Estimates 10
Consumer Price Index 12 February Milk Sales 13 Dairy Graphs G1 Dairy Market News Retail Report Dairy Market News Contacts
CME GROUP CASH MARKETS (4/13) BUTTER: Grade AA closed at $2.2875. The weekly average for Grade AA is $2.3095(+.0355). CHEESE: Barrels closed at $1.4600 and 40# blocks at $1.6050. The weekly average for barrels is $1.4705(+.0230) and blocks, $1.6215 (+.0630). NONFAT DRY MILK: Grade A closed at $.7325. The weekly average for Grade A is $.7330 (+.0260). DRY WHEY: Extra grade dry whey closed at $.3050. The weekly average for dry whey is $.3050 (+.0160). BUTTER HIGHLIGHTS: Production is active throughout the nation as cream is readily available for butter manufacturing needs. In the West, there are reports of many states being in the spring flush, resulting in abundant milk volumes clearing through Class IV/4a utilization. Some industry contacts report that there is strong interest from export purchasers in multiple global localities, as butter prices are internationally competitive. Butter inventories are adequate to meet demand. Bulk butter prices range from 5 cents under to 8 cents over the market, based on the CME Group with various time periods and averages used. The market tone is bullish as spot market activity was heavy this week and prices inched higher. The CME Group weekly average for Grade AA butter is $2.3095, compared to $2.2740, last week’s average. CHEESE HIGHLIGHTS: Across the nation, cheesemakers are taking in plentiful milk supplies. In the Midwestern region, discounted spot milk loads continue to flow into vats; this week they range from $2 to $3.50 under Class. Spring flush is in effect in parts of the West, as some cheesemakers there are opting to limit their milk intakes. Orders are steady to strong nationwide. Food service sales have picked up with schools back in session ahead of summer break, and Western contacts suggest both barrel and block sales are healthy. With the milk intakes at increased/increasing levels, cheese production is apace. Some producers in the Midwest have reported using nonfat dry milk
(NDM) to fortify cheese. The cheese market tone has bullish indicators. Although many contacts are somewhat concerned regarding the return of the large CME block-over-barrel price gap, there is a sense of contentment amongst producers regarding current price points and potentialities. The CME Group weekly average for barrels, $1.4705, is up $.0230 from last week’s average. The average for blocks, $1.6215, is up $.0630 from last week’s average. FLUID MILK: Milk supplies are heavy throughout the nation and are sufficient to meet processors’ needs. Overall, milk production is flat to increasing as the spring flush is at its peak in some areas and just starting in others. Many plant managers report running at full capacity. In the West, production is strong. However, there are reports of milk being in over supply and spilling into surrounding regions. Bottling has picked up due to schools reopening. Cream supplies are adequate to meet all manufacturing needs. However, some manufacturers are willing to sell their cream in lieu of processing. Ice cream producers are taking more loads of cream. Condensed skim markets are unchanged as there continues to be heavy supplies available in the Eastern and Western regions. Cream multiples for all Classes range 1.17-1.26 in the East, 1.16-1.25 in the Midwest, and 1.00-1.24 in the West. DRY PRODUCTS: United States low/medium heat nonfat dry milk (NDM) prices are mixed as some market participants are willing to pay $.70+ for NDM, however others believe the prices are not echoing current market conditions. The overall tone is mixed. High heat prices are steady to a tad higher. Spot sales remain light as offers are limited. Dry buttermilk prices are unchanged this week and market activities seem to be limited outside of contractual needs. The market undertone is relatively steady. Dry whole milk prices moved upward this week. A few processors believe the market is firming on strong demand, especially from the confectionary industry. Dry whey prices
-CONTINUED ON PAGE 1A-
CME GROUP CASH TRADING COMMODITY MONDAY TUESDAY WEDNESDAY THURSDAY FRIDAY :: WEEKLY :: WEEKLY APR 09 APR 10 APR 11 APR 12 APR 13 :: CHANGE* :: AVERAGE# CHEESE BARRELS $1.4775 $1.4775 $1.4775 $1.4600 $1.4600 :: :: $1.4705 (+.0275) (N.C.) (N.C.) (-.0175) (N.C.) :: (+.0100) :: (+.0230) 40# BLOCKS $1.6025 $1.6400 $1.6400 $1.6200 $1.6050 :: :: $1.6215 (N.C.) (+.0375) (N.C.) (-.0200) (-.0150) :: (+.0025) :: (+.0630) NONFAT DRY MILK GRADE A $.7275 $.7350 $.7350 $.7350 $.7325 :: :: $.7330 (N.C.) (+.0075) (N.C.) (N.C.) (-.0025) :: (+.0050) :: (+.0260) BUTTER GRADE AA $2.3200 $2.3200 $2.3200 $2.3000 $2.2875 :: :: $2.3095 (+.0325) (N.C.) (N.C.) (-.0200) (-.0125) :: (N.C.) :: (+.0355) DRY WHEY EXTRA GRADE $.3100 $.3000 $.3050 $.3050 $.3050 :: :: $.3050 (-.0100) (-.0100) (+.0050) (N.C.) (N.C.) :: (-.0150) :: (+.0160)
CHEESE: carload = 40,000 lbs., BUTTER: carlot = 40,000-43,000 lbs. *Sum of daily changes. # Weekly averages are simple averages of the daily closing prices for the calendar week.
Computed by Dairy Market News for international purposes. This data is available on the Internet at WWW.AMS.USDA.GOV/MARKET-NEWS/DAIRY
Angelo
Evidenziato
Angelo
Evidenziato
Angelo
Evidenziato
Angelo
Evidenziato
Angelo
Evidenziato
Angelo
Evidenziato
Angelo
Evidenziato
Angelo
Evidenziato

-CONTINUED FROM PAGE 1- are mixed as some manufacturers note an uptick in demand and export demand has been fairly strong. While there are some feelings of optimism, overall market conditions are mixed. Whey protein concentrate WPC34% prices moved a tad higher this week. The market tone remains weak, although the demand for WPC34% that meets specific requirements remains strong. Lactose prices are steady to a bit higher. The demand is relatively solid and loads are moving well. Prices for acid and rennet have firmed. Acid casein demand is strong. INTERNATIONAL DAIRY MARKET NEWS (DMN): WESTERN AND EASTERN EUROPE: WESTERN OVERVIEW: Observers in Western Europe believe that late March milk production, while increasing seasonally, is also slightly higher than last year at the same time. Milk prices in Germany increased in 2017 to a three year high, according to AMI Markt Woche Milch. EASTERN OVERVIEW: Poland is actively cultivating new dairy export markets in China. A milk promotion program funded by EU funds is backing the effort. OCEANIA OVERVIEW: AUSTRALIA: Producers and manufacturers have some uncertainty as to what milk production outcome is expected for the coming milk season. A variable is decisions yet to be made by producers as to herds and how feed supplies and pastures end the current season. NEW ZEALAND: Dairy producers and agricultural lenders have already begun to assess budgets for the next New Zealand milk season. With some observers believing that whole milk powder prices might realistically remain in a range between $2,900 and $3,300/MT next season, a number of observers feel milk prices could be decent for producers. SOUTH AMERICA OVERWIEW: During the last two weeks in ARGENTINA, heavy rains saturated sections of the central region, arriving too late for summer crops but increasing moisture reserves for winter grains. Meanwhile, farm milk production is generally steady to slightly up, following autumn season patterns. Premiums for milk fat remain high, inflating manufacturing costs of several cream based processors. Cow milk production is stable in URUGUAY, in line with seasonal trends. The supply of milk is sufficient for most processing needs. The race for cream among several processors, including butter churners and cheese makers, is strong as supplies are scarce. Dairy exports from Uruguay to China are active and increased considerably in the first quarter of the year. However, in the same period, exports to Brazil have decreased substantially. In BRAZIL, unseasonable rain showers improved conditions for second-crop corn and cotton in key dairy states of northeastern Brazil. These relieved several weeks of dryness in some dairy basins of the country. NATIONAL RETAIL REPORT (DMN): Total conventional dairy advertisements decreased by 33 percent from last week to this week. On the organic side, ads decreased by 31 percent. Total conventional milk ads decreased by 29 percent, while organic milk ads decreased 18 percent. The weighted average price of conventional 8 ounce block cheese was $2.06, up 19 cents from last week. The U.S. average conventional one pound butter price was $3.23 this period while organic butter averaged $5.17. APRIL SUPPLY AND DEMAND ESTIMATES (WAOB): The milk production forecast for 2018 is unchanged from last month. The 2018 import forecast is reduced slightly on a fat basis, but is unchanged on a skim-solids basis. Exports on fat basis are unchanged from last month, but skim-solids-basis exports are raised on stronger sales of nonfat dry milk and skim milk powder, and lactose. The annual product price forecast for cheese is unchanged at the midpoint although the range is narrowed. Butter prices are expected to increase more slowly in the second half of the year and the price forecast is reduced. The nonfat
dry milk (NDM) price is reduced slightly on current prices. The annual whey price forecast is lowered on larger supplies and weaker demand. The Class III price is lowered on the lower whey price forecast while the Class IV price is down on lower NDM and butter price forecasts. The all milk price forecast is lowered to $15.60 to $16.10 per cwt. MARCH CONSUMER PRICE INDEX (BLS): The March CPI for all food is 252.4, up 1.3 percent from 2017. The dairy products index is 216.5, down 0.9 percent from a year ago. The following are the March to March changes for selected products: fresh whole milk is -5.1 percent; cheese, +0.8 percent; and butter, +0.6 percent. FEBRUARY MILK SALES: During February 2018, 3.7 billion pounds of packaged fluid milk products are estimated to have been sold in the United States. This was 1.6 percent lower than February 2017. Estimated sales of total conventional fluid milk products decreased 1.7 percent from February 2017 and estimated sales of total organic fluid milk products increased 1.0 percent from a year earlier. NOTICE: The Dairy Market News portal is moving to a new platform - My Market News, https://mymarketnews.ams.usda.gov/. This is part of USDA's launch of MARS, Market Analysis and Reporting Services, a state-of-the-art electronic data platform. For a short time, Dairy Market News reports will continue to appear on the existing portal, https://www.marketnews.usda.gov/mnp/da-home, and existing bookmarks will work. Dairy Market News suggests readers also create new bookmarks for favorite reports on the My Market News website to maintain easy access to reports.
WEEK OF APRIL 9 - 13, 2018 DAIRY MARKET NEWS VOLUME 85, REPORT 15
DAIRY MARKET NEWS AT A GLANCE
-1A-

DAIRY MARKET NEWS, APRIL 9 - 13, 2018 VOLUME 85, REPORT 15
NORTHEAST
Cream remains available for butter churning. Class IV cream
multiples ranged from 1.22 to 1.26. Production is active as
manufacturers are processing butter to fill customer needs. Some
contacts report that they are only churning butter for contract export
sales. Export volumes are above previous year over year volumes at
this time period. Inventories are in balance with demand. Sales of
bulk butter in domestic markets are 4 to 8 cents over the market of
the CME Group, with various time periods and averages used. The
market tone is bullish as spot market activity was heavy this week and prices inched higher. DAIRY PRODUCTS: According to NASS,
U.S. butter production for February 2018, totals 168.6 million
pounds, up 4.7 percent from last year, but down 7.4 percent from
January 2018. Cumulative 2018 butter production through February
totals 350.7 million pounds, 3.5 percent above the same period for
2017. February 2018 butter production in the Atlantic region totaled
27.3 million pounds, 2.3 percent below last year, but up 6.0 percent
from January 2018.
Prices for: Eastern U.S., All First Sales, F.O.B., Grade AA,
Conventional, and Edible Butter
Bulk Basis Pricing - 80% Butterfat $/LB: +0.0400 - +0.0800
Secondary Sourced Information:
Tuesday’s CME Group trading saw the daily cash butter price settle
at $2.3200, up $.0800 from last Tuesday.
This week, a cooperative export assistance program accepted
requests for export assistance to sell 842,166 pounds (382 metric
tons) of butter.
According to the NASS Dairy Products report, U.S. butter
production for February 2018, totals 168.6 million pounds, up 4.7
percent from last year, but down 7.4 percent from January 2018.
Cumulative 2018 butter production through February totals 350.7
million pounds, 3.5 percent above the same period for 2017.
February 2018 butter production in the Atlantic region totaled 27.3
million pounds, 2.3 percent below last year, but up 6.0 percent from
January 2018.
CENTRAL
Butter plant managers in the Central U.S. are receiving more cream
offers this week, although reported cream multiples are unchanged
week over week: 1.16 to 1.19 f.o.b. Butter sales are taking off, both
on and off of the CME marketplace. Some producers suggest there is
CONTINUED ON PAGE 2A
NATIONAL DAIRY PRODUCTS SALES REPORT
U.S. AVERAGES AND TOTAL POUNDS
WEEK ENDING
April 7, 2018
BUTTER CHEESE 40# BLOCKS
CHEESE BARRELS
38% MOISTURE DRY WHEY NDM
2.1868 8,244,199
1.5900 10,797,174
1.5407 12,618,853
0.2548 7,142,709
0.6962 17,717,544
Further data and revisions may be found on the internet at: http://www.ams.usda.gov/rules-regulations/mmr/dmr
BUTTER MARKETS
-2-
MONDAY, APRIL 9, 2018 CHEESE -- SALES: 10 CARS BARRELS: 1 @ $1.4775, 4 @ $1.4800, 1 @ $1.4825, 3 @ $1.4850, 1 @ $1.4875; UNFILLED BIDS: 1 CAR BARRELS @ $1.4500; 2 CARS 40 POUND BLOCKS: 1 @ $1.5500, 1 @ $1.6025; UNFILLED OFFERS: 1 CAR BARRELS @ $1.4850; 1 CAR 40 POUND BLOCKS @ $1.7000 NONFAT DRY MILK -- SALES: NONE; UNFILLED BIDS: 7 CARS GRADE A: 2 @ $0.6900, 1 @ $0.6950, 2 @ $0.7000, 1 @ $0.7025, 1 @ $0.7100; UNFILLED OFFERS: 1 CAR GRADE A @ $0.7350 BUTTER -- SALES: 12 CARS GRADE AA: 4 @ $2.3000, 2 @ $2.3050, 2 @ $2.3100, 2 @ $2.3150, 2 @ $2.3200; UNFILLED BIDS: 4 CARS GRADE AA: 2 @ $2.2775, 1 @ $2.2925, 1 @ $2.3000; UNFILLED OFFERS: 2 CARS GRADE AA @ $2.3275 DRY WHEY -- SALES: NONE; UNFILLED BIDS: 2 CARS EXTRA GRADE @ $0.2750; UNFILLED OFFERS: 1 CAR EXTRA GRADE @ $0.3100 TUESDAY, APRIL 10, 2018 CHEESE -- SALES: 6 CARS BARRELS: 1 @ $1.4775, 5 @ $1.4800; 1 CAR 40 POUND BLOCKS @ $1.6400; UNFILLED BIDS: 1 CAR BARRELS @ $1.4500; UNFILLED OFFERS: 2 CARS BARRELS @ $1.4900; 1 CAR 40 POUND BLOCKS @ $1.7000 NONFAT DRY MILK -- SALES: 5 CARS GRADE A: 1 @ $0.7350, 2 @ $0.7400, 2 @ $0.7450; UNFILLED BIDS: 16 CARS GRADE A: 10 @ $0.6500, 1 @ $0.7100, 1 @ $0.7200, 1 @ $0.7275, 2 @ $0.7300, 1 @ $0.7350; UNFILLED OFFERS: 3 CARS GRADE A: 2 @ $0.7450, 1 @ $0.7500 BUTTER -- SALES: 23 CARS GRADE AA: 1 @ $2.3100, 1 @ $2.3125, 4 @ $2.3175, 10 @ $2.3200, 3 @ $2.3225, 2 @ $2.3250, 2 @ $2.3300; UNFILLED BIDS: 6 CARS GRADE AA: 1 @ $2.2750, 1 @ $2.3000, 1 @ $2.3100, 1 @ $2.3125, 2 @ $2.3200; UNFILLED OFFERS: 4 CARS GRADE AA: 1 @ $2.3275, 1 @ $2.3300, 1 @ $2.3400, 1 @ $2.3800 DRY WHEY -- SALES: 1 CAR EXTRA GRADE @ $0.3000; UNFILLED BIDS: 2 CARS EXTRA GRADE: 1 @ $0.2800, 1 @ $0.2850; UNFILLED OFFERS: 1 CAR EXTRA GRADE @ $0.3050 WEDNESDAY, APRIL 11, 2018 CHEESE -- SALES: NONE; UNFILLED BIDS: NONE; UNFILLED OFFERS: 1 CAR BARRELS @ $1.4900; 1 CAR 40 POUND BLOCKS @ $1.6525 NONFAT DRY MILK -- SALES: 1 CAR GRADE A @ $0.7350; UNFILLED BIDS: 7 CARS GRADE A: 4 @ $0.7000, 1 @ $0.7150, 1 @ $0.7250, 1 @ $0.7350; UNFILLED OFFERS: 1 CAR GRADE A @ $0.7400 BUTTER -- SALES: 9 CARS GRADE AA: 2 @ $2.3150, 5 @ $2.3175, 2 @ $2.3200; UNFILLED BIDS: 7 CARS GRADE AA: 1 @ $2.2500, 2 @ $2.3000, 2 @ $2.3150, 1 @ $2.3175, 1 @ $2.3200; UNFILLED OFFERS: 2 CARS GRADE AA: 1 @ $2.3250, 1 @ $2.3400 DRY WHEY -- SALES: 1 CAR EXTRA GRADE @ $0.3050; UNFILLED BIDS: 2 CARS EXTRA GRADE: 1 @ $0.2850, 1 @ $0.2950; UNFILLED OFFERS: 1 CAR EXTRA GRADE @ $0.3100 THURSDAY, APRIL 12, 2018 CHEESE -- SALES: 11 CARS BARRELS: 1 @ $1.4600, 1 @ $1.4700, 9 @ $1.4775; UNFILLED BIDS: NONE; UNFILLED OFFERS: 3 CARS BARRELS: 2 @ $1.4650, 1 @ $1.4800; 3 CARS 40 POUND BLOCKS: 1 @ $1.6200, 1 @ $1.6500, 1 @ $1.6700 NONFAT DRY MILK -- SALES: NONE; UNFILLED BIDS: 5 CARS GRADE A: 1 @ $0.6900, 1 @ $0.7100, 1 @ $0.7150, 1 @ $0.7200, 1 @ $0.7300; UNFILLED OFFERS: 5 CARS GRADE A: 2 @ $0.7375, 2 @ $0.7400, 1 @ $0.7450 BUTTER -- SALES: NONE; UNFILLED BIDS: 2 CARS GRADE AA @ $2.2800; UNFILLED OFFERS: 2 CARS GRADE AA @ $2.3000 DRY WHEY -- SALES: NONE; UNFILLED BIDS: 2 CARS EXTRA GRADE: 1 @ $0.2600, 1 @ $0.2800; UNFILLED OFFERS: 1 CAR EXTRA GRADE @ $0.3050 FRIDAY, APRIL 13, 2018 CHEESE -- SALES: 2 CARS BARRELS @ $1.4600; 1 CAR 40 POUND BLOCKS @ $1.6050; UNFILLED BIDS: 1 CAR 40 POUND BLOCKS @ $1.4950; UNFILLED OFFERS: 3 CARS BARRELS: 1 @ $1.4600, 2 @ $1.4700; 3 CARS 40 POUND BLOCKS: 1 @ $1.6400, 1 @ $1.6500, 1 @ $1.6800 NONFAT DRY MILK -- SALES: NONE; UNFILLED BIDS: 5 CARS GRADE A: 2 @ $0.7000, 1 @ $0.7175, 1 @ $0.7200, 1 @ $0.7225; UNFILLED OFFERS: 6 CARS GRADE A: 1 @ $0.7325, 2 @ $0.7350, 2 @ $0.7375, 1 @ $0.7400 BUTTER -- SALES: 2 CARS GRADE AA: 1 @ $2.2825, 1 @ $2.2875; UNFILLED BIDS: 1 CAR GRADE AA @ $2.2500; UNFILLED OFFERS: 2 CARS GRADE AA: 1 @ $2.2900, 1 @ $2.3100 DRY WHEY -- SALES: NONE; UNFILLED BIDS: 3 CARS EXTRA GRADE: 2 @ $0.2700, 1 @ $0.2800; UNFILLED OFFERS: NONE

DAIRY MARKET NEWS, APRIL 9 - 13, 2018 VOLUME 85, REPORT 15
CONTINUED FROM PAGE 2
strong interest from export purchasers in multiple global localities, as
butter prices domestically are competitive. Adding to demand news,
domestic interest is also adequate. Many contacts are hopeful for
continued sangfroid on the butter market front, while choppy waters
continue in most other dairy segments. DMN National Retail Report-
Dairy for April 6-12 noted the national weighted average advertised
price for a 1 pound package of butter is $3.37, $.63 above one week
ago and $.44 above one year ago.
Prices for: Central U.S., All First Sales, F.O.B., Grade AA,
Conventional, and Edible Butter
Bulk Basis Pricing - 80% Butterfat $/LB: 0.0000 - +0.0700
Secondary Sourced Information:
In CME Group trading Wednesday, Grade AA butter closed at
$2.3200, compared to $2.3350 last Wednesday.
The NASS Dairy Products report noted U.S. butter production during
February 2018 in the Central region totaled 72.9 million pounds, 8.3
percent higher than one year ago. Total U.S. butter production during
February 2018 was 168.6 million pounds, 4.7 percent higher than last
year. January through February 2018 U.S. butter production totaled
350.7 million pounds, 3.5 percent higher than the same period in 2017.
WEST
In the West, butter production is strong. Due to many states being in
the spring flush, abundant milk loads are clearing through Class IV
utilization. Butter provisions are lavish enough to fulfill all customers'
inquiries. Butter sales are steady compared to last week. Demand
seems to be strong in the spot market as shown by lively buying
activities on the CME. Despite current market incertitude, market
participants are striving to reach sale agreements. Industry contacts
report that bulk butter interest is little to almost nonexistent. Bulk
butter pricing in the West this week is 5 cents below to 6.5 cents above the market, based on the CME Group with various periods and
averages used. The DMN National Retail Report–Dairy for the week
of April 6-12 found that the U.S. weighted average advertised price of
1 pound butter is $3.37 up $.63 from last week. The U.S. weighted
average price was $2.93 one year ago. The weighted average price in
the Southwest is $3.52, with a price range of $2.49-$3.99. The
weighted average price in the Northwest is $1.99, with no price range.
Prices for: Western U.S., All First Sales, F.O.B., Grade AA,
Conventional, and Edible Butter
Bulk Basis Pricing - 80% Butterfat $/LB: -0.0500 - +0.0650
Secondary Sourced Information:
This week, a cooperative export assistance program accepted requests
for 842,166 pounds (382 metric tons) of butter. So far this year, the
program has assisted member cooperatives who have contracts to sell
6.455 million pounds of butter (82% milkfat) in export markets. The
$2.3200, down $.0150 from a week ago.
2018 U.S. Butter and Milkfat Exports (USDA-FAS)
2018 Exports % Change From
(Million Lb.) 1 Year Ago
February 4.9 + 20
TOTAL, JAN - FEB 10.0 + 22
1 Canada 4.0 + 2
2 Mexico 1.8 + 29
3 Saudi Arabia 1.1 + 26
4 Dominican Republic 0.4 +829
5 South Korea 0.4 + 5
2018 U.S. Butter and Milkfat Imports (USDA-FAS)
(Imports for Consumption)
2018 Imports % Change From
(Million Lb.) 1 Year Ago
TOTAL, JAN-FEB 12.8 + 5
1 Ireland 7.9 + 39
2 Mexico 2.0 + 36
3 New Zealand 1.1 - 46
4 France 0.8 + 67
5 India 0.3 +128
2018 Imports % Change From
(Million Lb.) 1 Year Ago
February Imports
Total Butter, Fats, Milk (H.S. Code 0405) 6.8 + 2
Butter
Quota (H.S. Code 405101000) 0.9 + 92
Over Quota (H.S. Code 405102000) 4.4 + 7
AMF
Quota (H.S. Code 405901020) 0.5 - 63
Over Quota (H.S. Code 405902020) 0.9 + 38
Other Milk Fat 0.1 - 45
-2A-

DAIRY MARKET NEWS, APRIL 9 - 13, 2018 VOLUME 85, REPORT 15
CHEESE MARKETS
-3-
NORTHEAST
Milk volumes are plentiful in the Northeast region as the spring flush is just starting in some areas. Cheese processing is strong as cheese vats are full with milk supplies. Orders are steady from food service sectors and inventories are fairly stable. Spot activity for cheese barrels has picked up along with the price in some indices. The wholesale price for cheddar and Muenster increased $0.0200. However, the pro-cess cheese price shifted lower $0.0325. The Grade A Swiss price de-creased $0.1600. However, the Class III skim milk price for March 2018 saw a 56 cents increase from the previous month following the release of the March 2018 Announcement of Class and Component Prices. National Retail Report-Dairy, for April 6-12, 2018, noted the U.S. weighted average advertised price for 8 ounce cheese block was $1.87, down 15 cents from the previous week and down 24 cents from last year. The U.S. weighted average advertised price of 8 ounce cheese shreds was $1.93, a decrease of 13 cents from last week and down 30 cents from a year ago. Northeast region’s weighted average advertised price for 8 ounce cheese blocks was $2.21, 34 cents above the U.S. average, with a regional price range of $0.99-$2.99. The aver-age price for 8 oz. cheese shreds was $2.15, 22 cents above the nation-al average, with prices ranging $0.99-$2.99. In the Southeast region, the average price for 8 oz. cheese blocks was $1.76, 11 cents below the average U.S. price, with a regional price range of $0.99-$2.00. The average price for 8 oz. shreds was $1.88, 5 cents below the U.S. aver-age, with prices ranging $0.99-$2.50.
WHOLESALE SELLING PRICES: DELIVERED DOLLARS PER POUND(MIXED LOTS (1000-5000 POUNDS))
Cheddar 40 pound Block 2.0125-2.2975 Muenster 1.9975-2.3475 Process American 5 pound Sliced 1.5850-2.0650 Swiss 10-14 pound Cuts 3.0025-3.3250 Secondary Sourced Information: This week, a cooperative export assistance program accepted requests for export assistance to sell 1.250 million pounds (567 metric tons) of cheese. DAIRY PRODUCTS: According to NASS, U.S. total cheese production in February 2018 was 981.6 million pounds, 4.2 percent higher than a year ago, but 10.5 percent lower than last month. In the Atlantic region, total cheese production was 119.8 million pounds, 1.6 percent higher than a year ago, but 17.6 percent lower than the previ-ous month. Total February cheese production and percentage change, from last year for selected Eastern states are: February Production Million Lb. % Change From 1 Year Ago Pennsylvania 30.9 + 3.3 Vermont 11.4 + 3.2 New Jersey 4.1 - 0.2
MIDWEST
Cheese demand reports are generally positive from Midwestern pro-ducers this week, seemingly unchanged from a week ago. There are some warm spots on the weather forecast ahead of grilling season, although parts of the upper Midwest are expecting heavy snow over the weekend and into next week. Spot milk remains wholly discounted, from $2 to $3.50 under Class. Some cheesemakers who took on heavy loads of spot milk last week are no longer in need of milk. Also, as some cheesemakers have turned up production over the past few
weeks, they report fortifying with nonfat dry milk (NDM) in order to alleviate fairly heavy NDM stocks. The cheese markets are fairly steady. Some questions arise with contacts regarding the relatively sizeable CME block to barrel price gap, but generally Central cheese contacts view the markets with a bullish eye. The DMN National Re-tail Report-Dairy shows that April 6-12 Midwest ads for 8 ounce shred cheese have a weighted average advertised price of $1.68, 25 cents below the national average. Midwest prices range from $.99-$2.00. One year ago, the national price was $2.23. For 8 ounce blocks, the Midwest average price is $1.49, 38 cents below the national average price. Midwest ads are priced from $.99-$2.00. Last year, the national price was $2.11.
WISCONSIN WHOLESALE SELLING PRICES: DELIVERED DOLLARS PER POUND(MIXED LOTS (1000-5000 POUNDS))
Blue 5 pounds 2.1875-3.1750 Cheddar 40 pound Block 1.6475-2.0425 Monterey Jack 10 pounds 1.8950-2.1000 Mozzarella 5-6 pounds 1.7200-2.6600 Muenster 5 pounds 1.9200-2.3450 Process American 5 pound Loaf 1.5400-1.9000 Swiss 6-9 pound Cuts 2.5200-2.6375 Secondary Sourced Information: In CME Group trading Wednesday, cheese barrels closed at $1.4775, compared to $1.4500 last week. Blocks closed at $1.6400, compared to $1.5525 last week. Midwestern wholesale prices are down $.1600 for Swiss cuts, down $.0325 for process, but up $.0200 for all other types. Dairy Products (NASS) reports total U.S. cheese production, for Feb-ruary 2018, was 981.6 million pounds, 4.2 percent above last year. Central total cheese production for February 2018 was 450.8 million pounds, 9.3 percent lower than January 2018. For total cheese and vari-ous types of cheese, February 2018 U.S. and Central cheese production percentage changes compared to February 2017 were as follows: Feb Production 2018 vs 2017 U.S. Central Total + 4.2% + 4.5% American + 6.1% + 7.7% Cheddar + 5.7% + 6.7% Total Italian + 4.3% + 4.4% Mozzarella + 3.5% + 4.0%
WEST Western cheese production is increasing along the same trajectory as milk output. Dairy contacts say spring flush has commenced within areas of the Western region. Cheese makers have plenty of milk for most cheese processing needs. Industry contacts report demand has been strong for both blocks and barrels, but has recently subsided somewhat for barrel cheese, as suggested by a widening gap between block and barrel prices on the CME. Dairy industry contacts are trying to find the right balance within the warehouses and in the production schedules. In some cases, manufacturers are trying to defer cheese sales by placing more cheese into aging programs. However, others are trying to limit the amount of cheese produced by not taking on addi-tional loads of milk or by reducing the fortification of the cheese make process. And yet, other manufacturers are shifting some cheddar pro-duction to hard Italian cheese production in an effort to find the right product mix. Inventories are heavy, but not necessarily burdensome at this point. However, if U.S. and European cheese prices converge, manufacturers worry they may face the ineluctable realization that competition for export sales may become more fierce. The DMN Na-tional Retail Report-Dairy for the week of April 6-12 shows the U.S.
CONTINUED ON PAGE 3A

DAIRY MARKET NEWS, APRIL 9 - 13, 2018 VOLUME 85, REPORT 15
CHEESE MARKETS
CONTINUED FROM PAGE 3 weighted average advertised retail price for an 8 ounce pack of natural shredded cheese is $1.93, down $.13 from last week. Packs average $1.33 in the Southwest and $2.50 in the Northwest. One year ago, the national price was $2.23. For 8 ounce blocks, the U.S. price is $1.87, down $.15 from last week. Blocks average $1.92 in the Southwest and $2.50 in the Northwest. One year ago, the national price was $2.11. In the West, wholesale prices were down $.0325 for process, but up $.0200 for cheddar block, cuts and Monterey Jack. Swiss cut wholesale prices are down $.1600 from last week.
WHOLESALE SELLING PRICES: DELIVERED DOLLARS PER POUND(MIXED LOTS (1000-5000 POUNDS))
Cheddar 10 pound Cuts 1.8600-2.0800 Cheddar 40 pound Block 1.6800-2.1250 Monterey Jack 10 pounds 1.8700-2.0300 Process American 5 pound Loaf 1.5275-1.7850 Swiss 6-9 pound Cuts 2.5800-3.0100
Secondary Sourced Information: This week, a cooperative export assistance program accepted requests for export assistance on contracts to sell 1.250 million pounds (567 metric tons) of cheese. So far this year, the program has assisted mem-ber cooperatives who have contracts to sell 30.413 million pounds of American-type cheeses in export markets. In CME Group trading Wednesday, barrels closed at $1.4775, up $.0275 from a week ago and blocks closed at $1.6400, up $.0875.
FOREIGN European Union (EU) cheese sales slowed down a little bit right after the holiday. However, they are showing signs of revival. In Germany, exports to Southern Europe and other countries continue to be solid. EU cheese supplies in storage are younger and still limited in quanti-ties. Additional cheese requests can hardly be filled in the German dairy market. EU cheese production is active, supported by higher milk production trends. In the United States, the prices for wholesale blue, gorgonzola, parmesan, and Romano increased $.0200, but Swiss cuts Switzerland decreased $.1600. All other prices remained the same com-pared to the previous week.
WHOLESALE SELLING PRICES: FOB DISTRIBUTORS DOCK DOLLARS PER POUND (1000 - 5000 POUNDS, MIXED LOTS)
: NEW YORK VARIETY : IMPORTED : DOMESTIC : : Blue : 2.6400-5.2300 : 2.0650-3.5525* Gorgonzola : 3.6900-5.7400 : 2.5725-3.2900* Parmesan (Italy) : -0- : 3.4550-5.5450* Romano (Cows Milk) : -0- : 3.2550-5.4050* Sardo Romano (Argentine) : 2.8500-4.7800 : -0- Reggianito (Argentine) : 3.2900-4.7800 : -0- Jarlsberg-(Brand) : 2.9500-6.4500 : -0- Swiss Cuts Switzerland : -0- : 3.0400-3.3625* Swiss Cuts Finnish : 2.6700-2.9300 : -0- * = Price change.
-3A-
COLD STORAGE
WEEKLY COLD STORAGE HOLDINGS - SELECTED STORAGE CENTERS IN THOUSAND POUNDS - INCLUDING GOVERNMENT STOCKS
BUTTER CHEESE 04/09/2018 24930 87697 04/01/2018 23515 86587 CHANGE 1415 1110 % CHANGE 6 1

DAIRY MARKET NEWS, APRIL 9 - 13, 2018 VOLUME 85, REPORT 15
FLUID MILK AND CREAM
Northeast milk production is picking up as the spr ing flush is
starting in parts of the region. Moreover, milk loads are aplenty for processors’ needs. Class I sales are fairly soft this week and Class II
sales are lower. Many manufacturers are running on full production
schedules. There are some reports of tolling taking place in parts of
the Northeast. Mid-Atlantic milk production is flat to seeing some
upward movement. Currently there is some milk clearing into the area
from other parts of the U.S. Balancing operations are working near to
full capacity as milk volumes are adequate for production needs.
Southeast milk production is steady to flat as hotter temperatures
are lingering around the area. Class I sales are down slightly. Extra
milk volumes are being transported to other areas. Cream is being
offered by some manufacturers willing to sell their cream in lieu of processing. Many buyers report the demand is somewhat lackluster as
the majority of cream trades are around 1.20-1.26. Condensed skim
markets are unchanged as there are heavy supplies available at a
discount. With last Wednesday’s announcement of the Class and
Component Prices, the Class III Skim Milk price increased $0.56,
compared to the previous month. According to the DMN National
Retail Report-Dairy, for the period of April 6-12, 2018, the U.S.
weighted average advertised price for the half gallon pack size milk
was $2.39, down 13 cents compared to last week, but up 49 cents
from last year. The Northeast region's weighted average advertised
price for the gallon pack size milk was $3.53, 86 cents above the U.S. average, with prices ranging $2.99-$3.99.
NORTHEASTERN U.S., F.O.B. CONDENSED SKIM Price Range - Class II; $/LB Solids: 0.50 - 0.80
Price Range - Class III; $/LB Solids: 0.55 - 0.86
NORTHEASTERN U.S., F.O.B. CREAM
Multiples Range - All Classes: 1.1700 - 1.2600
Price Range - Class II; $/LB Butterfat: 2.6606 - 2.8652
Secondary Sourced Information:
According to NASS Dairy Products report, February 2018 U.S. hard
ice cream production totaled 55.5 million gallons, 1.5 percent more
than last month, but 5.8 percent less than a year ago. Cumulative 2018 U.S. production through February translated to 110.2 million
gallons, 5.0 percent less than the previous year total through
February. Meanwhile, the Atlantic region’s February hard ice cream
production totaled 12.3 million gallons, 1.4 percent above a year ago
and 1.0 percent higher than the last month. U.S. yogurt production
(plain and flavored) for February 2018 totaled 367.8 million pounds,
up 1.3 percent from last year and up 0.7 percent from the previous
month.
MIDWEST
This week there were more reports of dairy farmers opting to auction
their herds and exit the business. Notably, a number of farms closing
this month in the north central region are more sizeable than the
average Midwestern farm. Farmers also note that lenders have been
more cautious ahead of planting season in the Midwest, which some
contacts suggest could lead to more closures and potentially less milk
production. Bottling has picked up somewhat due to schools
reopening. Reported Class III spot milk loads remain wholly
discounted for cheesemakers, as the lowest reported prices were
$3.50 under Class. Cream is available for all uses, and prices slipped
a little this week. Reported cream multiples ranged from 1.20 to 1.25.
Cream contacts are pointing to the continued cold weather as a factor
in delaying Class II production, particularly regarding the soft serve
variety. The DMN National Retail Report-Dairy for April 6-12 noted
the national weighted average advertised price for one gallon of milk
was $2.67, down $.82 from last week, but $.22 above one year ago. The weighted average regional prices in the Midwest and South
Central were $2.00 and $2.33, respectively.
MIDWESTERN U.S., F.O.B. CREAM
Multiples Range - All Classes: 1.1600 - 1.2500
Multiples Range - Class II: 1.2000 - 1.2500
Price Range - Class II; $/LB Butterfat: 2.7288 - 2.8425
WEST
California milk production has star ted its downfall in that many manufacturers have reached their peak production levels in the past
weeks. Nonetheless, milk supplies are still more than enough to meet
all processing requirements. In the quest for additional processing
capacities, some milk continues to move out-of-state. Milk intakes
from bottlers have not changed much from the previous week.
Arizona milk output is in line with normal seasonal output levels
for this time of the year. With the state being in the peak of the spring
flush, milk loads available for processing are abundant.
Manufacturers are working at full schedules and managing well the
milk supplies. Some loads of milk continue to move to other regions
for processing. Milk intakes from the retail sector, as well as restaurants, are steady. In Arizona, alfalfa conditions are eighty-one
percent good to excellent this week compared to seventy-nine percent
last week. New Mexico milk market undertone seems steady.
Although production is slightly down, loads of milk are readily
available to fulfill all processing obligations. Most plants are working
at or near to full capacities. Class I sales are steady to slightly lower,
but Class II demand is slightly up. Milk going into cheese production
is up. Alfalfa hay conditions are currently thirty nine percent good to
excellent compared to thirty eight percent last week. New Mexico is
defined as ninety-nine percent abnormally dry or worse. Pacific
Northwest milk volumes are hitting expected levels. Milk production is following seasonal patterns with a steady climb into
spring flush. However, cool weather has dampened heavy milk usage
for ice cream manufacturing and delayed the grilling season. Some
milk is pushing into the region from surrounding states. Dairy
manufacturers report plenty of milk for most dairy processing. In the
mountain states of Idaho, Utah and Colorado, industry contacts say
milk production is coming on strong. In the southern reaches of the
region, the flush is at hand. And in the north, some contacts feel there
may be an early flush in areas that normally do not see peak
production until early July. Although milk is in oversupply, and some
milk is spilling over into surrounding regions, milk handlers say the loads are finding homes with manufacturers. Area dairy contacts say
water reservoirs have been adequately recharged and, barring any
unforeseen weather events, they expect forage and hay costs will stay
relatively low. Western condensed skim processing is active as milk
loads that need to be cleared remain plentiful. Cream supplies in the
West are adequate to meet all manufacturing obligations. Ice cream
producers are taking more loads of cream. Butter churning is still
strong as well. Cream multiples for all Classes range from 1.00 to
1.24. According to the DMN National Retail Report-Dairy for the
week of April 6-12, the national weighted average advertised price
for one gallon of milk is $2.67, down $0.82 from last week, but up
$0.22 from a year ago. The weighted average regional price in the
-CONTINUED ON PAGE 4A-
-4-
EAST

DAIRY MARKET NEWS, APRIL 9 - 13, 2018 VOLUME 85, REPORT 15
FLUID MILK AND CREAM
-CONTINUED FROM PAGE 4-
Southwest is $2.42 with a price range of $1.99-$2.79. The
weighted average regional price in the Northwest is $1.99 with no
price range.
WESTERN U.S., F.O.B. CREAM
Multiples Range - All Classes: 1.0000 - 1.2400 Secondary Sourced Information:
According to California Department of Food and Agriculture, May
2018 Class 1 prices in California are $16.09 in the North and $16.36
in the South. The statewide average Class 1 price based on
production is $16.10. This price is up $0.11 from the previous
month, but $.57 lower than a year ago.
-4A-

DAIRY MARKET NEWS, APRIL 9 - 13, 2018 VOLUME 85, REPORT 15
NONFAT DRY MILK, BUTTERMILK & WHOLE MILK
Prices represent carlot/trucklot quantities for domestic and export sales packaged in 25 kg. or 50 lb. bags, or totes, spray process, dollars per pound.
NONFAT DRY MILK - CENTRAL AND EAST
CENTRAL: Pr ices of low/medium heat nonfat dry milk (NDM) slightly dropped on the top of the range, while remaining steady on the mostly price series. NDM spot market activity picked up a little after some quiet trading weeks. Inventories and production are undoubtedly up, as condensed skim is accessible from coast to coast. That said, producers suggest spot buyers are still fairly active and willing to pay $.70+ for NDM. High heat NDM inventories are limited to contract necessities. High heat prices are unchanged. The NDM market tone is somewhat resilient, as market prices are slowly edging northerly. EAST: Low/medium heat nonfat dry milk (NDM) pr ices in the East region are mainly steady, yet the top of the range dropped a tad. Production is active as milk volumes are plentiful and inventories are able to suit immediate needs. Many market participants purchase regular spot loads, however before buying, some are willing to wait to see where prices go. High heat NDM prices are unchanged due to a quiet trading week. Spot offers are few as many manufacturers do not have available supplies. A few operations are drying high heat for contracted obligations, still many manufacturers are drying low/medium heat on full schedules. Prices for: Eastern and Central U.S., All First Sales, F.O.B., Extra Grade & Grade A, Conventional, and Edible Nonfat Dry Milk Price Range - Low & Medium Heat; $/LB: .6800 - .7500 Mostly Range - Low & Medium Heat; $/LB: .7000 - .7400 Prices for: Eastern and Central U.S., All First Sales, F.O.B., Extra Grade & Grade A, Conventional, and Edible Nonfat Dry Milk Price Range - High Heat; $/LB: .8200 - .9800
NONFAT DRY MILK - WEST
In the West, low/medium heat nonfat dry milk f.o.b. prices are showing an upsurge on both ends of the range and at the bottom of the mostly price series. The market undertone seems to be strengthening little by little as shown by upward moving prices. Nonetheless, many manufacturers and sellers are not too confident about the sustainability of the prices, as they believe that the prices are not echoing current market conditions. Low/medium heat nonfat dry milk inventories are copious. With most of the West being in the spring flush, production is also strong. Demand is steady. Interest from Mexico is active with sales occurring at prices at the bottom of the price range. Some reports suggest that higher bids are starting to come from Mexico. High heat nonfat dry milk prices are mixed on the range. Spot trading activities remain light, but contract sales are steady. Production of high heat nonfat dry milk is sporadic and mostly based on the near term needs of buyers.
Prices for: Western U.S., All First Sales, F.O.B., Extra Grade & Grade A, Conventional, and Edible Nonfat Dry Milk Price Range - Low & Medium Heat; $/LB: .6800 - .7700 Mostly Range - Low & Medium Heat; $/LB: .7000 - .7300 Prices for: Western U.S., All First Sales, F.O.B., Extra Grade & Grade A, Conventional, and Edible Nonfat Dry Milk Price Range - High Heat; $/LB: .8500 - .9400
CALIFORNIA MANUFACTURING PLANTS - NONFAT DRY MILK
WEEK ENDING PRICE TOTAL SALES April 6 $.6894 16,491,606 March 30 $.7103 13,104,302 Prices are weighted averages for Extra Grade and Grade A Nonfat Dry Milk, f.o.b. California manufacturing plants. Prices for both periods were influenced by effects of long-term contract sales. Compiled by Dairy Marketing Branch, California Department of Food and Agriculture.
DRY BUTTERMILK - CENTRAL AND EAST
CENTRAL: Pr ices for Central dry buttermilk remained steady for the second week. The spot market was mixed, as prices fell either at the low end or upper end of the range, with fewer in the middle. Some producers cleared some large volumes at the low end of the range, in order to free up some warehouse space. Buttermilk powder production is limited, as condensed skim is abundant and sidelining the drying process for anything else. Dry buttermilk market tones are relatively steady. EAST: Dry buttermilk pr ices are unchanged in the East this week based on light trading. Interest is fairly flat. Although some traders are searching to find loads, many inventories are short on spot supplies. Current production is steady to limited, as other products are taking up the majority of drying time. Market conditions are fairly steady, as spot supplies and demand are light, however some interest has occurred.
Prices for: Eastern and Central U.S., All First Sales, F.O.B., Conventional, and Edible Buttermilk Price Range ; $/LB: .6800 - .7650
DRY BUTTERMILK - WEST
F.O.B. prices for western dry buttermilk are steady on both the range and the mostly price series. This week, market activities seem to be limited outside of contractual needs. Due to limited dryer capacities, nonfat dry milk production is privileged over dry buttermilk. As the result, dry buttermilk stocks haven't grown that much, but remain adequate to meet all needs. Some market participants report not finding specific brands of dry buttermilk that they are looking for.
Prices for: Western U.S., All First Sales, F.O.B., Conventional, and Edible Buttermilk Price Range ; $/LB: .6800 - .7800 Mostly Range - ; $/LB: .6800 - .7300
DRY WHOLE MILK - NATIONAL
Free on board (f.o.b.) spot prices for national dry whole milk are steady to higher, in line with international WMP values. In general, the national dry whole milk supply is in balance with demands from buyers/end users. Nevertheless, a few processors think that the market is firming due to a strong demand, especially from the confectionary industry. Production is mostly dictated by contractual needs while inventories are adequate for spot needs. Prices for: U.S., All First Sales, F.O.B., Conventional, and Edible Dry Whole Milk Price Range - 26% Butterfat; $/LB: 1.4400 - 1.5500
-5-
Angelo
Evidenziato
Angelo
Evidenziato
Angelo
Evidenziato
Angelo
Evidenziato
Angelo
Evidenziato
Angelo
Evidenziato

DAIRY MARKET NEWS, APRIL 9 –13, 2018 VOLUME 85, REPORT 15
WHEY, WPC 34%, LACTOSE & CASEIN Prices represent carlot/trucklot quantities for domestic and export sales packaged in 25 kg. or 50 lb. bags, or totes, spray process, dollars per pound.
DRY WHEY - CENTRAL
Central whey spot prices were mixed as they edged up on the bottom of the range, but ebbed on the top of the mostly price series. Some producers suggest inventories are building and that buyers are buying on a day to day basis. Production is increasing, as discounted milk loads continue to make their way into Class III processing, and most contacts do not anticipate a near term slowdown. Animal feed whey prices are unchanged, and it has been a very slow early spring season for feed whey trading. With the amount of WPC 80% to be found at marked discounts, a lot of feed whey users are opting for the higher protein option whenever possible. The whey markets are quiet. Undoubtedly, export sales have been crucial for whey producers in order to free up warehouse space, thus a number of contacts are apprehensive regarding any trade revisions. Others suggest that overproduction has put the market in an uncomfortable position. Prices for: Central U.S., All First Sales, F.O.B., Extra Grade & Grade A, Conventional, and Edible Dry Whey Price Range - Animal Feed; $/LB: .1500 - .2200 Prices for: Central U.S., All First Sales, F.O.B., Extra Grade & Grade A, Conventional, and Edible Dry Whey Price Range - Non-Hygroscopic; $/LB: .2100 - .3100 Mostly Range - Non-Hygroscopic; $/LB: .2150 - .2600
DRY WHEY - NORTHEAST Dry whey prices are a bit lower this week in the East. The majority of spot sales are trading around the mid to higher $0.20s, however there have been reports of offers at premiums. Production is steady, but inventories are mixed as some manufacturers’ regular contracts are keeping supplies low. The market tone is generally steady. Prices for: Eastern U.S., All First Sales, F.O.B., Extra Grade & Grade A, Conventional, and Edible Dry Whey Price Range - Non-Hygroscopic; $/LB: .2500 - .2900
DRY WHEY - WEST
The Western whey price moved slightly higher at the top of the range and bottom of the mostly price series. Dry whey production is steady and in line with strong milk volumes and cheese making. Manufacturers note an uptick in demand for dry whey and export sales have been strong. In addition, a few dairy contacts suggest inventories have seemingly tightened over the last few weeks. While these fundamentals lend some feeling of optimism to the whey market, they do not reify the sense that dairy markets have turned bullish. There is still the spring flush to work through and heavy stocks and lower prices could quickly return. Prices for: Western U.S., All First Sales, F.O.B., Extra Grade & Grade A, Conventional, and Edible Dry Whey Price Range - Non-Hygroscopic; $/LB: .2200 - .3225 Mostly Range - Non-Hygroscopic; $/LB: .2400 - .2875
U.S. Dry Whey Exports. H.S. Code 0404104000(FAS) 2018 Exports % Change From (Million Lb.) 1 Year Ago February Total 42.4 + 29 TOTAL, JAN - FEB 86.5 + 29 1 China 32.8 + 16 2 Japan 7.4 + 90 3 Mexico 6.9 - 2 4 Canada 6.1 - 19 5 Philippines 5.6 + 61
WHEY PROTEIN CONCENTRATE 34% - CENTRAL AND WEST Whey protein concentrate 34% prices moved up at the bottom of both the range and mostly price series. A few industry contacts suggest stronger nonfat dry milk prices on the CME have provided a little lift to WPC34% prices as well. However, prices for higher whey protein concentrates also cast a shadow over the WPC34% market. While the market tone for WPC34% remains weak, WPC34% that meets infant formula requirements remains the bastion of stability for the whey protein market. Demand is lackluster for WPC34% that can be interchanged with other protein sources, but is strong for infant formula WPC34%. End users report it is very difficult to locate infant formula grade WPC34%, even while WPC34% supplies are generally adequate for most other uses. Production of WPC34% remains steady. Prices for: Central and Western U.S., All First Sales, F.O.B., Extra Grade, Conventional, and Edible Whey Protein Concentrate Price Range - 34% Protein; $/LB: .6200 - .9400 Mostly Range - 34% Protein; $/LB: .6400 - .7500 Secondary Sourced Information: F.O.B. EXTRA GRADE 34% PROTEIN: .6200 - .9400 MOSTLY: .6400 - .7500
U.S. WPC < 80% Exports, H.S. Code 0404100500(FAS)
2018 Exports % Change From (Million Lb.) 1 Year Ago February Total 26.2 + 1 TOTAL, JAN - FEB 60.2 + 9 1 China 28.0 + 3 2 Mexico 8.7 + 30 3 Canada 5.8 + 1 4 Philippines 2.7 - 4 5 Indonesia 2.3 + 10
LACTOSE—CENTRAL AND WEST Lactose prices stepped higher at the bottom of the price range, but held steady on the mostly price series. Industry contacts say demand has been solid and lactose is moving well. A few blocks of lactose moved into international markets at prices near the bottom of the price range. Production is steady. Inventories are relatively tight or committed, especially for favored brands. A few manufacturers report they do not have any spare loads for the next couple months. Prices for: Central and Western U.S., Spot Sales And Up 3 Month Contracts, F.O.B., Conventional, and Edible Lactose Price Range - Non Pharmaceutical; $/LB: .1750 - .3900 Mostly Range - Non Pharmaceutical; $/LB: .2000 - .2600
U.S. Lactose Exports, H.S. Code 1702110000(FAS) 2018 Exports % Change From (Million Lb.) 1 Year Ago February Total 57.1 + 39 TOTAL, JAN - FEB 106.8 + 21 1 China 23.8 + 78 2 Mexico 17.3 - 1 3 New Zealand 14.2 + 30 4 Japan 11.0 + 32 5 Indonesia 6.3 - 8
-CONTINUED ON PAGE 6A-
-6-
Angelo
Evidenziato
Angelo
Evidenziato
Angelo
Evidenziato
Angelo
Evidenziato
Angelo
Evidenziato
Angelo
Evidenziato
Angelo
Evidenziato
Angelo
Evidenziato
Angelo
Evidenziato

DAIRY MARKET NEWS, APRIL 9 –13, 2018 VOLUME 85, REPORT 15
WHEY, WPC 34%, LACTOSE & CASEIN Prices represent carlot/trucklot quantities for domestic and export sales packaged in 25 kg. or 50 lb. bags, or totes, spray process, dollars per pound.
-CONTINUED FROM PAGE 6-
CASEIN - NATIONAL Prices of acid and rennet casein firmed. Production in the EU is constrained by capacity factors. In the EU, more casein is reported as being traded. Acid casein demand is higher for future deliveries. Demand from Asia for acid casein is good. January-February casein exports from New Zealand increased 2.2 percent from one year earlier. Prices for: Spot Sales And Up 3 Month Contracts, Free on Board - Warehouse, Non-Restricted, All Mesh Sizes, Conventional, and Edible Casein Acid; Price Range - $/LB: 2.9800-3.2200 Rennet; Price Range - $/LB: 2.5000-2.7500
-6A-
Angelo
Evidenziato
Angelo
Evidenziato
Angelo
Evidenziato

DAIRY MARKET NEWS, APRIL 9 - 13, 2018 -7- VOLUME 85, REPORT 15
U.S. Dairy Cow Slaughter (1000 head) under Federal Inspection
2018 WEEKLY 2018 2017 WEEKLY 2017 WEEK ENDING DAIRY COWS CUMULATIVE DAIRY COWS DAIRY COWS CUMULATIVE DAIRY COWS 03/24/2018 62.7 777.9 59.8 740.2 WEBSITE: http://www.ams.usda.gov/mnreports/sj_ls714.txt SOURCE: The slaughter data are gathered and tabulated in a cooperative effort by the Agricultural Marketing Service, The Food Safety and Inspection Service, and the National Agricultural Statistics Service, all of USDA.
CLASS III MILK PRICES (3.5% Butterfat)
YEAR JAN FEB MAR APR MAY JUN JUL AUG SEP OCT NOV DEC 2013 18.14 17.25 16.93 17.59 18.52 18.02 17.38 17.91 18.14 18.22 18.83 18.95 2014 21.15 23.35 23.33 24.31 22.57 21.36 21.60 22.25 24.60 23.82 21.94 17.82 2015 16.18 15.46 15.56 15.81 16.19 16.72 16.33 16.27 15.82 15.46 15.30 14.44 2016 13.72 13.80 13.74 13.63 12.76 13.22 15.24 16.91 16.39 14.82 16.76 17.40 2017 16.77 16.88 15.81 15.22 15.57 16.44 15.45 16.57 16.36 16.69 16.88 15.44
CLASS IV MILK PRCES (3.5% Butterfat)
YEAR JAN FEB MAR APR MAY JUN JUL AUG SEP OCT NOV DEC 2013 17.63 17.75 17.75 18.10 18.89 18.88 18.90 19.07 19.43 20.17 20.52 21.54 2014 22.29 23.46 23.66 23.34 22.65 23.13 23.78 23.89 22.58 21.35 18.21 16.70 2015 13.23 13.82 13.80 13.51 13.91 13.90 13.15 12.90 15.08 16.43 16.89 15.52 2016 13.31 13.49 12.74 12.68 13.09 13.77 14.84 14.65 14.25 13.66 13.76 14.97 2017 16.19 15.59 14.32 14.01 14.49 15.89 16.60 16.61 15.86 14.85 13.99 13.51
FEDERAL MILK ORDER CLASS PRICES FOR 2018 (3.5% Butterfat)
CLASS JAN FEB MAR APR MAY JUN JUL AUG SEP OCT NOV DEC I 1/ 15.44 14.25 13.36 14.10 II 14.11 13.44 13.88 III 14.00 13.40 14.22 IV 13.13 12.87 13.04
1/ S3p03ific order differentials to be added to this base price can be found by going to: www.ams.usda.gov/DairyMarketingStatistics; then select “Prices”; and then select “Principal Pricing Points.”
$12.00
$13.00
$14.00
$15.00
$16.00
$17.00
$18.00
Jan Feb Mar Apr May Jun Jul Aug Sep Oct Nov Dec
Class I 201620172018
$12.00
$13.00
$14.00
$15.00
$16.00
$17.00
$18.00
Jan Feb Mar Apr May Jun Jul Aug Sep Oct Nov Dec
Class II 201620172018
$12.00
$13.00
$14.00
$15.00
$16.00
$17.00
$18.00
Jan Feb Mar Apr May Jun Jul Aug Sep Oct Nov Dec
Class III201620172018
$12.00$12.50$13.00$13.50$14.00$14.50$15.00$15.50$16.00$16.50$17.00
Jan Feb Mar Apr May Jun Jul Aug Sep Oct Nov Dec
Class IV 201620172018

DAIRY MARKET NEWS, APRIL 9 - 13, 2018 VOLUME 85, REPORT 15
INTERNATIONAL DAIRY MARKET NEWS - EUROPE Information gathered April 2 - 13, 2018
Prices are U.S. $/MT, F.O.B. port. Information gathered for this report is from trades, offers to sell, and secondary data. This bi-weekly report may not always contain the same products and/or regions. Future reports may be included or withdrawn depending on availability of information. MT = metric ton = 2,204.6 pounds.
-8-
WESTERN OVERVIEW: Observers in Western Europe believe that late March milk production, while increasing seasonally, is also slightly higher than last year at the same time. At least this is an in-crease, following recent set backs due to weather factors. The strength of milk prices is noted as a factor resulting in fewer cows in Germany being slaughtered. Milk prices in Germany increased in 2017 to a three year high, according to AMI Markt Woche Milch. This is ex-pected to continue to help keep milk production moving up in Western Europe, recognizing Germany as a major producing country. Cheese manufacturers are pleased with firmer prices. They struggle to try and stay ahead of lower stocks to fill orders. Manufacturers are taking all of the milk they can procure. Demand is brisk, both within Western Europe, as well as for export. Cheese is being made with confidence that there are eager customers. Cheese exports from the EU during January 2018, compared with January 2017, increased 2 percent, according to Eurostat. The top three export destinations, percentage change from January 2017, and January 2018 exports in metric tons are: USA, -8.0 percent, 8,952 MT; Japan, -17.0 percent, 6,414 MT; and Switzerland, +16.0 percent, 4,711 MT. Current export activity is strong. BUTTER/BUTTEROIL: Butter pr ices in Western Europe firmed, as did butteroil prices. Butter prices tend to be highest in France and Germany, lower in Netherlands, then slightly lower in Italy and the Slovak Republic. Butter price strength has trended up during 2018 and now is the highest level of the year. Butter prices are higher than this time last year. Higher prices do not seem to be crimping sales. Buyer demand remains active, both wholesale and retail. Butter available for near term delivery is tight. Availability is fur-ther affected by strong export sales, and increased internal EU season-al demand. This may continue for a while. Signing longer term con-tracts is slow because many sellers now expect higher prices, but many buyers are wary of committing to prices at levels sellers quote. Butter exports from the EU during January 2018, compared with January 2017, increased 36 percent, according to Eurostat. The top three export destinations, percentage change from January 2017, and January 2018 exports in metric tons are: USA, increased 19.0 percent, 2,212 MT; Saudi Arabia, increased 152.0 percent, 1,459 MT; Turkey, increased over 14 times, 889 MT. The top three import origins, percentage change from January 2017, and January 2018 imports in metric tons are: New Zealand, de-creased 40.6 percent, 761 MT; Ukraine, increased 140 times, 280 MT; Serbia, decreased 2.5 percent, 11 MT, according to CLAL. Western Europe, 82% Butterfat, Free on Board - Port Butter Price Range - $/MT: 5,925 - 6,850 Western Europe, 99% Butterfat, Free on Board - Port Butteroil Price Range - $/MT: 6,900 - 7,250 SKIM MILK POWDER (SMP): Skim milk powder pr ices in Western Europe are steady. The current price range is the lowest level of 2018. Current production is in good demand for internal EU use. Much current production is readily finding buyers. There is little im-petus to longer term contracting with EU customers. Most buyers are well covered. It is a wait and see strategy paradigm. Export efforts continue and a number of exporters report favorable interest in current price levels. SMP exports from the EU during January 2018, compared with January 2017, increased 7 percent, according to Eurostat. The top three export destinations, percentage change from January 2017, and January 2018 exports in metric tons are: Algeria, increased 74.0 per-cent, 14,203 MT; Egypt, increased 25.0 percent, 4,265 MT; China, decreased 38.0 percent, 3,409 MT.
Prices for: Europe, All First Sales, Free on Board - Port, Conventional, and Edible Skim Milk Powder Price Range - 1.25% Butterfat; $/MT: 1,525 - 1,675
WHOLE MILK POWDER (WMP): Western Europe whole milk powder prices slightly firmed. Prices are now the highest of 2018 in Western Europe. Bottom of range pricing lags Oceania, but each re-gion is even at the top of the price range. Internal EU demand is very good. Manufacturers are attuned to internal EU demand. An observer characterized demand as continuous. While export efforts are ongoing, other manufactured dairy products represent Western Europe’s stronger hand globally. WMP exports into the EU during January 2018, compared with January 2017, decreased 16 percent, according to Eurostat. The top three export destinations, percentage change from January 2017, and January 2018 exports in metric tons are: Oman, increased 4.0 percent, 6,226 MT; Algeria, decreased 62.0 percent, 2,360 MT; China, de-creased 8 percent, 2,316 MT. Prices for: Europe, All First Sales, Free on Board - Port, Conventional, and Edible Whole Milk Powder Price Range - 26% Butterfat; $/MT: 3,175 - 3,350 SWEET WHEY POWDER: Sweet whey pr ices in Western Europe are slightly higher at the bottom of the price range, but steady at the top. Whey prices have trended higher during 2018. Strong whey ex-ports have contributed to this price trend. Markets are generally calm this reporting period. Demand and sales are varied within the EU, as to timing and volumes needed. Overall, the supplies available are suffi-cient to keep the range of pricing only slightly changed. EU whey exports during January 2018, compared with January 2017, increased 22.2 percent, according to CLAL. The top three export destinations, percentage change from January 2017, and January 2018 exports in metric tons are: China, increased 22.1 percent, 15,853 MT; Indonesia, increased 34.9 percent, 10,146 MT; and Malaysia, increased 60.5 percent, 6,216 MT. The top three EU whey import origins, percentage change from January 2017, and January 2018 imports in metric tons are: Switzer-land, decreased 10.86 percent, 4,800 MT; Norway, increased 16.0 per-cent, 643 MT; USA, increased 124.0 percent, 228 MT, according to CLAL. Prices for: Western Europe, All First Sales, Free on Board - Port, Con-ventional, and Edible Dry Whey Price Range - Non-Hygroscopic; $/MT: 925 - 975 EASTERN OVERVIEW: Poland is actively cultivating new dairy export markets in China. A milk promotion program funded by EU funds is backing the effort. With Poland being among the top milk producing countries in the EU, and with production increasing, export activity is viewed as important. Products featured include flavored milk, yogurt, milk powders and cheese. The efforts have two aspects. First, help Polish dairy processors with export activities. Second, in-crease awareness of Poland as a milk and milk product source within China through trade shows, events, exhibits, and trade missions.
Angelo
Evidenziato
Angelo
Evidenziato
Angelo
Evidenziato
Angelo
Evidenziato
Angelo
Evidenziato
Angelo
Evidenziato
Angelo
Evidenziato
Angelo
Evidenziato
Angelo
Evidenziato
Angelo
Evidenziato
Angelo
Evidenziato
Angelo
Evidenziato

DAIRY MARKET NEWS, APRIL 9 - 13, 2018 VOLUME 85, REPORT 15
INTERNATIONAL DAIRY MARKET NEWS - OCEANIA Information gathered April 2 - 13, 2018
Prices are U.S. $/MT, F.O.B. port. Information gathered for this report is from trades, offers to sell, and secondary data. This bi-weekly report may not always contain the same products and/or regions. Future reports may be included or withdrawn depending on availability of information. MT = metric ton = 2,204.6 pounds.
-8A-
AUSTRALIA: Producers and manufacturers have some uncer tain-ty as to what milk production outcome is expected for the coming milk season. A variable is decisions yet to be made by producers as to herds and how feed supplies and pastures end the current season. Last week shareholders of an Australian dairy cooperative formally voted to approve the sale of the business and assets to a Canadian dairy firm. However, announcement by the acquiring firm of plans to divest ownership of a separate processing plant has allayed some concerns as to undue concentration which could lessen prices paid to producers. When governmental approval becomes final, that will end an unsettled period for many producers who had contracted to sell milk to the coop-erative. NEW ZEALAND: Cyclones with winds exceeding 85 miles per hour battered parts of New Zealand early this week, downing some trees, causing significant power outages, and closing some roads. The impact on milk production and shipment has yet to be determined with any precision. Dairy producers and agricultural lenders have already begun to as-sess budgets for the next New Zealand milk season. The first official milk price forecast by a major New Zealand dairy cooperative is not expected until later in May. Other observers have already begun pro-jecting expectations. With some observers believing that whole milk powder prices might realistically remain in a range between $2,900 and $3,300/MT next season, a number of observers feel milk prices could be decent for producers. At the April 3 GDT event #209, all contracts prices ranged from 7.0 percent lower to 12.1 percent higher than the prior event across catego-ries. The all contracts price averages (US$ per MT) and percent chang-es from the previous averages are: anhydrous milk fat, $5,806, -7.0 percent; butter, $5,494, 4.1 percent; buttermilk powder $1,988, 1.0 percent ; cheddar cheese, $3,679, -2.2 percent; lactose, $549, 1.1 per-cent; rennet casein, $5,668, 12.1 percent; skim milk powder, $1,849, -1.8 percent; and whole milk powder, $3,278, 1.6 percent. BUTTER: Butter pr ices in Oceania are stronger , reaching the highest range of 2018. Prices are higher than one year ago. However, Oceania prices are lower than in Western Europe. Butter demand in Australia for domestic consumption has been challenging for manufac-turers there to satisfy. This is a current factor exerting upward pressure on regional prices. Many observers look to pricing to remain strong in coming weeks, especially with milk production in a declining part of the season. Butter export volumes from Australia during January-February 2018, compared with January-February 2017, decreased 5.8 percent, according to CLAL. Import volumes during January-February in-creased 12.3 percent. The value of July 2017-February 2018 Australia butter exports decreased 3.3 percent, according to Dairy Australia. Butter export volumes from New Zealand during January-February 2018, compared with January-February 2017, decreased 14.0 percent, according to CLAL. At GDT Event 209 on April 3, the butter all contracts price, $5,494, increased 4.1 percent. The May contract, $5,530, increased 4.8 percent. Oceania, 82% Butterfat, Free on Board - Port Butter Price Range - $/MT: 5,475 - 5,550 SKIM MILK POWDER (SMP): Oceania low-medium heat skim milk powder prices are slightly weaker, but still above prices in West-ern Europe. Current Oceania SMP prices are very close to the Oceania price range one year ago. Production is not taxing capacity, which is acceptable with manufacturers, as profitability is higher in other prod-ucts. SMP export volumes from Australia during January-February 2018, compared with January-February 2017, decreased 13.6 percent, accord-ing to CLAL. Import volumes during January-February increased 41.4 percent. The value of July 2017-February 2018 Australia SMP exports increased 3.2 percent, according to Dairy Australia.
SMP export volumes from New Zealand during January-February 2018, compared with January-February 2017, decreased 4.8 percent, according to CLAL. At GDT Event 209 on April 3, the SMP all contracts price, $1,849, decreased 1.8 percent. The May contract, $1,911, increased 0.1 percent. Prices for: Oceania, All First Sales, Free on Board - Port, Conventional, and Edible Skim Milk Powder Price Range - 1.25% Butterfat; $/MT 1,875 - 1,950 CHEDDAR CHEESE: Cheddar pr ices in Oceania are stronger . The price range is not the highest level of 2018, but close. Prices are higher than one year ago. Manufacturers would like to make more cheese, but, particularly in New Zealand, are limited by milk supplies and the pull of milk toward whole milk powder. Prices are generally expected to remain in a narrow trading range in the immediate future. Cheese export volumes from Australia during January-February 2018, compared with January-February 2017, decreased 6.9 percent, according to CLAL. Import volumes during January-February de-creased 0.1 percent. The value of July 2017-February 2018 Australia cheddar exports increased 11.6 percent, according to Dairy Australia. Other cheese exports increased 15.5 percent in value. Cheese export volumes from New Zealand during January-February 2018, compared with January-February 2017, decreased 10.4 percent, according to CLAL. This is an outcome of less milk availability for cheese production. Import volumes during January-February increased 35.0 percent At GDT Event 209 on April 3, the cheddar all contracts price, $3,679, increased 2.2 percent. The May contract, $3,830, increased 7.7 percent. Prices for: Oceania Cheese, Cheddar, Free on Board - Port, Price Range - 39% Maximum Moisture; $/MT: 3,600 - 3,850 WHOLE MILK POWDER (WMP): Whole milk powder pr ices in Oceania are higher reaching the highest level of 2018. Current pricing is very comfortable for manufacturers in terms of profitability. Prices are above prices one year ago. Manufacturers are benefitting from re-cent market apprehension about less New Zealand milk availability, which has helped to move prices up. A challenging summer with re-duced milk production in New Zealand has led to a rally in WMP pric-es. Particularly strong early year export interest has been welcome. WMP exports volumes from Australia during January-February 2018, compared with January-February 2017, increased 14.5 percent, according to CLAL. Import volumes during January-February in-creased 26.6 percent. The value of July 2017-February 2018 Australia WMP exports increased 20.9 percent, according to Dairy Australia. WMP export volumes from New Zealand during January-February 2018, compared with January-February 2017, increased 14.0 percent, according to CLAL. Some New Zealand observers were surprised by the magnitude of this export strength. At GDT Event 209 on April 3, the WMP all contracts price, $3,278, increased 1.6 percent. The May contract, $3,289, increased 1.4 percent. Prices for: Oceania, All First Sales, Free on Board - Port, Conventional, and Edible Whole Milk Powder Price Range - 26% Butterfat; $/MT: 3,250 - 3,350
Exchange rates for selected foreign currencies: April 9, 2018
.0495 Argentina Peso .0154 India Rupe .7696 Australian Dollar .0094 Japan yen .2922 Brazil Real .0545 Mexican Peso .7875 Canadian Dollar .7305 New Zealand Dollar .0017 Chile Peso .2938 Poland Zloty 1.2323 Euro .0355 Uruguay Peso Conversion example: To compare the value of 1 US Dollar to Mexican Pesos: (1/.0545) = 18.3486 Mexican Pesos. Source: "Wall Street Journal"
Angelo
Evidenziato
Angelo
Evidenziato
Angelo
Evidenziato
Angelo
Evidenziato
Angelo
Evidenziato
Angelo
Evidenziato
Angelo
Evidenziato
Angelo
Evidenziato
Angelo
Evidenziato
Angelo
Evidenziato
Angelo
Evidenziato
Angelo
Evidenziato
Angelo
Evidenziato
Angelo
Evidenziato
Angelo
Evidenziato
Angelo
Evidenziato
Angelo
Evidenziato

DAIRY MARKET NEWS, APRIL 9 - 13, 2018 -8B- VOLUME 85, REPORT 15
INTERNATIONAL DAIRY MARKET NEWS - SOUTH AMERICA
Information gathered April 2 - 13, 2018 Prices are U.S. $/MT, F.O.B. port. Information gathered for this report is from trades, offers to sell, and secondary data. This bi-weekly report may not always contain the same products and/or regions. Future reports may be included or withdrawn depending on availability of information. MT = metric ton = 2,204.6 pounds.
SOUTH AMERICA OVERVIEW: During the last two weeks in Argentina, heavy rains saturated sections of the central region, arriving too late for summer crops but increasing moisture reserves for winter grains. Meanwhile, farm milk production is generally steady to slightly up, following autumn season patterns. Minor hauling issues were reported due to the rains. Overall, milk intakes are enough for most processing needs, but cream supplies are still tight. Premiums for milk fat remain high, inflating manufacturing costs of several cream based processors. Fluid milk demands from several grocery stores and restaurants are fair to good. Cow milk production is stable in Uruguay, in line with seasonal trends. The supply of milk is sufficient for most processing needs. The race for cream among several processors, including butter churners and cheese makers, is strong as supplies are scarce. Dairy exports from Uruguay to China are active and increased considerably in the first quarter of the year. However, in the same period, exports to Brazil have decreased substantially. In Brazil, unseasonable rain showers improved conditions for sec-ond-crop corn and cotton in key dairy states of northeastern Brazil. These relieved several weeks of dryness in some dairy basins of the country. According to several industry contacts, milk production at the farm level has stagnated during the last two weeks, which is character-istic at this time of year. SKIM MILK POWDER (SMP): Milk fat availability is very tight/committed in the Southern Cone of South America. Thus, in order to increase cream volumes, several processors are diverting farm milk intakes into low fat/ skim bottled (fluid) milk, resulting in higher rates of skim milk powder (SMP) outputs. As a result, SMP stocks are be-coming more accessible in the market, albeit at a slow pace. Regional SMP free on board (f.o.b.)export prices are mixed as some export transactions pushed up the top of the range. According to the Brazilian government, SMP imports from January to March 2018 totaled 4.5 million tons, down 37 percent from the same period in 2017. From this total, imports from Argentina, Uru-guay, and the United States represented 60, 27, and 13 percent, respec-tively. At the GDT Event 209 on April 3, skim milk powder (SMP) prices across all contract periods averaged $1,849 per metric ton, down 1.8 percent from the last event. Prices for: South America, All First Sales, Free on Board - Port, Con-ventional, and Edible Skim Milk Powder Price Range - 1.25% Butterfat; $/MT: 2,200 - 2,500 WHOLE MILK POWDER (WMP): In the Southern Cone region, WMP f.o.b. export prices are mixed as some exports pulled slightly down the bottom of the range. With tight cream volumes and milk butterfat values firming, WMP manufacturing has been unsteady in several balancing facilities. However, WMP inventories are sufficient for most regional manufacturing needs, but are limited for export. In fact, lower WMP imports are boosting WMP prices in Brazil. In this way, the Brazilian market is still paying higher premiums for imported WMP, reflected at the top of the range. The bottom of the range is mirroring moderate export transactions from Mercosur to Russia and Algeria According to the Brazilian government, WMP imports from January to March 2018 totaled 9.6 million tons, down 63 percent from the same period in 2017. From this total, imports from Argentina, Uru-guay, and Chile represented 56, 33, and 5 percent, respectively.
At the GDT Event 209 on April 3, whole milk powder (WMP) prices across all contract periods averaged $3,278 per metric ton, up 1.6 per-cent from the last event. Prices for: South America, All First Sales, Free on Board - Port, Con-ventional, and Edible Whole Milk Powder Price Range - 26% Butterfat; $/MT: 3,050 - 3,350
Angelo
Evidenziato
Angelo
Evidenziato
Angelo
Evidenziato
Angelo
Evidenziato

DAIRY MARKET NEWS, APRIL 9 - 13, 2018 -8C VOLUME 85, REPORT 15
INTERNATIONAL DAIRY MARKET NEWS
Global/Dairy Trading (gDT) Event 209 Recap - April 3, 2018
US$/MT Contract 1 Contract 2 Contract 3 Contract 4 Contract 5 Contract 6 All Contracts
May-18 Jun-18 Jul-18 Aug-18 Sep-18 Oct-18
Anhydrous Milk Fat $5,948 -2.8% $5,706 -8.9% $5,785 -6.9% $6,096 -3.2% $6,084 -5.2% n.a. $5,806 -7.0%
Butter $5,530 4.8% $5,550 5.4% $5,495 4.1% $5,450 2.8% $5,425 2.4% n.a. $5,494 4.1%
Buttermilk Powder $2,015 -0.5% $1,981 1.9% $2,000 0.8% $1,985 n.a. $1,960 0.5% n.a. $1,988 1.0%
Cheddar $3,830 7.7% $3,705 1.0% $3,615 1.4% n.a. $3,614 n.a. n.a. $3,679 2.2%
Lactose n.a. $549 n.a n.a n.a. n.a. n.a. $549 1.1%
Rennet Casein $5,750 13.5% $5,578 9.6% $5,743 16.4% $5,740 8.9% $5,635 12.0% n.a. $5,668 12.1%
Skim Milk Powder $1,911 0.1% $1,792 -1.2% $1,892 -3.4% $1,898 -4.3% $1,919 0.5% n.a. $1,849 -1.8%
Whole Milk Powder $3,289 1.4% $3,272 1.0% $3,284 2.8% $3,281 2.3% $3,273 0.4% $3,261 n.a. $3,278 1.6%
Average price US$/MT and % change in indices from previous event.
Global/Dairy Trading (gDT) Event 209 Recap - April 3, 2018
US$/Pound Contract 1 Contract 2 Contract 3 Contract 4 Contract 5 Contract 6 All Contracts
May-18 Jun-18 Jul-18 Aug-18 Sep-18 Oct-18
Anhydrous Milk Fat $2.6980 -2.8% $2.5882 -8.9% $2.6241 -6.9% $2.7651 -3.2% $2.7597 -5.2% n.a. $2.6336 -7.0%
Butter $2.5084 4.8% $2.5175 5.4% $2.4925 4.1% $2.4721 2.8% $2.4608 2.4% n.a. $2.4921 4.1%
Buttermilk Powder $0.9140 -0.5% $0.8986 1.9% $0.9072 0.8% $0.9004 n.a. $0.8891 0.5% n.a. $0.9018 1.0%
Cheddar $1.7373 7.7% $1.6806 1.0% $1.6398 1.4% n.a. $1.6393 n.a. n.a. $1.6688 2.2%
Lactose n.a. $0.2490 n.a n.a n.a. n.a. n.a. $0.2490 1.1%
Rennet Casein $2.6082 13.5% $2.5302 9.6% $2.6050 16.4% $2.6036 8.9% $2.5560 12.0% n.a. $2.5710 12.1%
Skim Milk Powder $0.8668 0.1% $0.8128 -1.2% $0.8582 -3.4% $0.8609 -4.3% $0.8705 0.5% n.a. $0.8387 -1.8%
Whole Milk Powder $1.4919 1.4% $1.4842 1.0% $1.4896 2.8% $1.4883 2.3% $1.4846 0.4% $1.4792 n.a. $1.4869 1.6%
Average price US$/pound and % change from previous event.

DAIRY MARKET NEWS, APRIL 9 - 13, 2018 -9- VOLUME 85, REPORT 15 CME GROUP, INC FUTURES
Selected settling prices Month 3/30 4/02 4/03 4/04 4/05 4/06 4/09 4/10 4/11 4/12 III MILK FUTURES (Pit-Traded) ($/cwt) MAR 18 NO TRADING 14.22 14.22 14.22 APR 18 14.29 14.44 14.46 14.38 14.41 14.46 14.43 14.40 14.41 MAY 18 14.30 14.46 14.64 14.58 14.70 14.87 14.85 14.67 14.63 JUN 18 14.72 14.83 15.00 14.92 15.05 15.19 15.23 15.06 15.02 JUL 18 15.30 15.43 15.52 15.49 15.57 15.67 15.69 15.57 15.55 AUG 18 15.65 15.75 15.82 15.84 15.84 15.93 15.93 15.85 15.86 SEP 18 15.96 16.05 16.08 16.07 16.09 16.16 16.16 16.12 16.12 OCT 18 15.97 16.05 16.10 16.09 16.09 16.15 16.15 16.09 16.11 NOV 18 15.88 15.96 16.03 16.00 16.00 16.08 16.07 16.00 16.02 DEC 18 15.84 15.90 15.97 15.93 15.96 16.00 16.00 15.95 15.95 CLASS IV MILK FUTURES (Pit-Traded) ($/cwt) MAR 18 NO TRADING 13.08 13.10 13.04 APR 18 13.37 13.44 13.61 13.61 13.61 13.64 13.64 13.64 13.60 MAY 18 13.67 13.80 13.93 13.97 14.00 14.12 14.27 14.27 14.18 JUN 18 13.91 14.11 14.27 14.27 14.27 14.28 14.47 14.47 14.43 CASH SETTLED BUTTER FUTURES (Electronic-Traded) (¢/lb) MAR 18 NO TRADING 217.05 217.38 217.59 APR 18 223.00 224.08 229.00 228.00 228.00 229.95 228.75 228.25 227.48 MAY 18 225.88 227.70 233.00 230.75 232.45 237.35 236.05 236.00 235.00 JUN 18 227.85 231.00 236.00 232.50 234.18 238.98 237.03 238.03 237.00 NONFAT DRY MILK FUTURES (Pit-Traded) (¢/lb) MAR 18 NO TRADING 69.80 69.80 69.63 APR 18 71.13 71.23 71.23 71.50 71.13 71.90 71.75 71.08 71.00 MAY 18 73.00 73.53 73.35 74.75 74.03 76.00 75.28 74.25 74.10 JUN 18 74.90 75.98 75.50 76.80 75.90 78.00 77.03 76.40 76.60 WHEY (Electronic-Traded) (¢/lb) MAR 18 NO TRADING 25.45 25.45 25.31 APR 18 26.40 26.43 27.00 26.63 27.00 26.95 26.50 26.50 25.90 MAY 18 27.50 27.50 28.00 28.00 28.25 28.25 28.25 28.00 27.75 JUN 18 28.25 28.25 28.60 28.55 28.55 28.55 28.55 28.55 28.75 CHEESE CSC (Electronic-Traded) ($/lb) MAR 18 NO TRADING 1.55 1.55 1.55 APR 18 1.55 1.56 1.57 1.56 1.56 1.57 1.57 1.56 1.56 MAY 18 1.55 1.56 1.58 1.57 1.58 1.60 1.59 1.58 1.57 JUN 18 1.58 1.59 1.61 1.60 1.61 1.63 1.63 1.61 1.61 JUL 18 1.64 1.65 1.66 1.66 1.66 1.67 1.67 1.66 1.66 Source: http://www.cmegroup.com/market-data/daily-bulletin.html
Angelo
Evidenziato
Angelo
Evidenziato
Angelo
Evidenziato
Angelo
Evidenziato
Angelo
Evidenziato
Angelo
Evidenziato

DAIRY MARKET NEWS, APRIL 9 - 13, 2018 -10- VOLUME 85, REPORT 15
April Supply and Demand Estimates The milk production forecast for 2018 is unchanged from last month. The 2018 import forecast is reduced slightly on a fat basis, but is unchanged on a skim-solids basis. Exports on fat basis are unchanged from last month, but skim-solids-basis exports are raised on stronger sales of nonfat dry milk and skim milk powder, and lactose. The annual product price forecast for cheese is unchanged at the midpoint although the range is narrowed. Butter prices are expected to increase more slowly in the second half of the year and the price forecast is reduced. The nonfat dry milk (NDM) price is reduced slightly on current prices. The annual whey price forecast is lowered on larger supplies and weaker demand. The Class III price is lowered on the lower whey price forecast while the Class IV price is down on lower NDM and butter price forecasts. The all milk price forecast is lowered to $15.60 to $16.10 per cwt.
U.S. Milk Supply and Use
Commodity 2016 2017 Estimated 2018 Projected
Mar Apr Mar Apr (billion pounds) Milk Production 212.4 215.5 215.5 219.0 219.0 Farm Use 1.0 1.0 1.0 1.0 1.0 Fat Basis Supply Beginning Commercial Stocks 12.3 12.7 12.7 13.5 13.5 Marketings 211.4 214.5 214.5 218.0 218.0 Imports 7.0 6.0 6.0 5.7 5.6 Total Commercial Supply 230.8 233.2 233.2 237.2 237.1 Fat Basis Use Commercial Exports 8.4 9.3 9.3 9.6 9.6 Ending Commercial Stocks 12.7 13.5 13.5 12.8 12.9 CCC Donations 0.0 0.0 0.0 0.0 0.0 Domestic Commercial Use 209.6 210.4 210.4 214.8 214.7 Skim-Solid Basis Supply Beginning Commercial Stocks 9.2 9.5 9.5 11.8 11.8 Marketings 211.4 214.5 214.5 218.0 218.0 Imports 6.5 6.1 6.1 5.9 5.9 Total Commercial Supply 227.1 230.0 230.0 235.7 235.7 Skim-Solids Basis Use Commercial Exports 39.0 40.8 40.8 42.8 43.4 Ending Commercial Stocks 9.5 11.8 11.8 11.3 11.5 CCC Donations 0.0 0.0 0.0 0.0 0.0 Domestic Commercial Use 178.5 177.5 177.5 181.6 180.9
NOTE: Totals may not add due to rounding. Continued on page 11

DAIRY MARKET NEWS, APRIL 9 - 13, 2018 -11- VOLUME 85, REPORT 15
April Milk Supply and Demand Estimates-cont’d
1 Simple average of monthly prices calculated from AMS weekly average dairy product prices for class price computations. Details may be found by going to http://www.ams.usda.gov/rules-regulations/mmr/dmr; scroll down to Publications, National Dairy Products Sales Reports, and select Current Release & Archives.” 2 Annual and quarterly Class III and Class IV prices are the simple average of monthly minimum Federal order milk prices paid by regulated plants for milk used in the respective classes. All milk price is the simple average of monthly prices received by farmers for milk at average test. 3 Does not reflect any deductions from producers as authorized by legislation. 4 Projection. Source: U.S. Department of Agriculture. World Agricultural Outlook Board. World Agricultural Supply and Demand Estimates, WASDE-576, April 10, 2018. Approved by the Interagency Commodity Estimates Committee [members for Dairy are: Shayle Shagam, Chairperson, WAOB; Carolyn Liebrand, AMS; Paul Kiendl, FAS; Jerry Cessna, ERS; and Milton Madison, FSA].
U.S. Dairy Prices
Commodity 2016 2017 Estimated 2018 Projected
Mar Apr Mar Apr (dollars per pound) Product Prices 1 Cheese 1.6050 1.6344 1.6344 1.545-1.605 1.550-1.600 Butter 2.0777 2.3303 2.3303 2.210-2.300 2.210-2.290 Nonfat Dry Milk 0.8292 0.8666 0.8666 0.700-0.750 0.700-0.740 Dry Whey 0.2875 0.4437 0.4437 0.265-0.295 0.240-0.270 (dollars per cwt) Milk Prices 2 Class III 14.87 16.17 16.17 14.30-14.90 14.20-14.70 Class IV 13.77 15.16 15.16 13.25-13.95 13.25-13.85 All Milk 3 16.30 17.63 17.63 15.75-16.35 15.60-16.10 Quarterly 2017 IV 2018 I 4 2018 II 4 2018 III 4 2018 IV 4 (billion pounds) Milk Production 53.1 54.4 56.2 54.2 54.2 (dollars per cwt) All Milk Price 2, 3 17.73 15.50-15.60 15.25-15.65 15.35-16.05 16.25-17.25 Class III Price 2 16.34 13.80-13.90 14.00-14.40 14.30-15.00 14.55-15.55 Class IV Price 2 14.12 12.90-13.10 13.30-13.80 13.25-14.05 13.55-14.65

DAIRY MARKET NEWS, APRIL 9 - 13, 2018 -12- VOLUME 84, REPORT 15
Consumer Price Index and Average Retail Prices for Selected Products, U.S. City Average 1
Consumer Price Index
Month
All Food Dairy Products Fresh Whole Milk Cheese Butter Meat, Poultry, Fish, and Eggs
CPI 2 Pct.
Chg 3 CPI 2
Pct. Chg 3
CPI 2 Pct.
Chg 3 CPI 2
Pct. Chg 3
CPI 2 Pct.
Chg 3 CPI 2
Pct. Chg 3
Jan 2018 252.4 1.7 217.9 -0.9 198.0 -4.4 230.8 1.1 246.7 4.4 247.3 1.9
Feb 2018 252.3 1.4 216.4 -1.9 196.7 -4.4 228.5 -0.8 243.2
3.9 247.1 1.7 Mar 2018 252.4 1.3 216.5 -0.9 194.2 -5.1 229.7 0.8 239.1
0.6 249.5 2.1
U.S. City Average Retail Prices
Month Whole Milk 4 Butter 5 Process Cheese 6 Natural Cheese 7 Ice Cream 8
2018 2017 2018 2017 2018 2017 2018 2017 2018 2017
(dollars) Jan 2.961 3.318 N/A N/A 4.015 4.322 5.021 4.933 4.786 4.834
Feb 2.923 3.300 N/A N/A 4.064 4.293 5.082
4.967 4.670 4.870
Mar 2.903 3.315 N/A N/A 4.105 4.271 5.064 4.799 4.825 4.751
N/A = Not available. 1 "CPI Detailed Report," "Consumer Prices: Energy and Food," BLS, U.S. Department of Labor. According to BLS, average prices are best used to measure the price level in a particular month. To measure price change over time, the CPI is more appropriate. 2 The standard reference base period for these indexes is 1982-1984 = 100. 3 Percent change over previous year. 4 Per gallon. 5 Per pound. Grade AA, salted, stick butter. 6 Per pound, any size and type of package. 7 Per pound, cheddar cheese in any size and type of package and variety (sharp, mild, smoked, etc.). 8 Per 1/2 gallon prepackaged regular.

DAIRY MARKET NEWS, APRIL 9 - 13, 2018 -13- VOLUME 85, REPORT 15
February Milk Sales
During February 2018, 3.7 billion pounds of packaged fluid milk products are estimated to have been sold in the United States. This was 1.6 percent lower than February 2017. Estimated sales of total conventional fluid milk products decreased 1.7 percent from February 2017 and estimated sales of total organic fluid milk products increased 1.0 percent from a year earlier.
Estimated Total U.S. Sales of Fluid Milk Products, February 2018, with Comparisons 1
Product Name Sales 4 Change from: 2
February Year to Date Previous Year Year to Date (million pounds) (percent) Conventional Production Practice
Whole Milk 1,145 2,461 2.2 3.3 Flavored Whole Milk 50 103 -0.2 0.5 Reduced Fat Milk (2%) 1,151 2,485 -2.4 -1.1 Low Fat Milk (1%) 492 1,041 -4.1 -4.8 Fat-Free Milk (Skim) 304 647 -10.0 -9.9 Flavored Fat-Reduced Milk 346 704 -0.1 -2.1 Buttermilk 38 79 -1.4 -1.6 Other Fluid Milk Products 3 6 -41.2 -36.9 Total Fat-Reduced Milk 3 2,293 4,878 -3.5 -3.3 Total Conventional Milk Products 3,528 7,527 -1.7 -1.2 Organic Production Practice Whole Milk 85 181 10.9 10.9 Reduced Fat Milk (2%) 63 134 1.8 1.2 Low Fat Milk (1%) 29 65 -8.3 -2.8 Fat-Free Milk (Skim) 20 42 -13.4 -12.8 Flavored Fat-Reduced Milk 8 16 -17.5 -19.7 Other Fluid Milk Products 0 0 -94.5 -93.9 Total Fat-Reduced Milk 3 120 258 -4.9 -3.9 Total Organic Milk Products 205 438 1.0 1.7 Total Fluid Milk Products 3,732 7,965 -1.6 -1.1
1 These figures are representative of the consumption of fluid milk products in Federal milk order marketing areas and California, which account for approximately 92 percent of total fluid milk sales in the United States. An estimate of total U.S. fluid milk sales is derived by interpolating the remaining 8 percent of sales from the Federal milk order and California data. 2 Percent changes, as well as sales volumes, unless otherwise noted, are shown on an unadjusted basis. 3 Both conventional and organic fat-reduced milk categories are the total of reduced fat, lowfat, skim and flavored fat-reduced milk. 4 Data may not add due to rounding. Report contact: Daniel Manzoni, [email protected] or 202-720-2352.
Packaged Sales of Total Fluid Milk Products in Federal Milk Orders and California, February 2018, with Comparisons 1
Marketing Area Order Number Sales 3 Change from: 2
February Year to Date Previous Year Year to Date (million pounds) (percent) Northeast 001 623 1,324 -1.5 -1.0 Appalachian 005 252 549 0.8 2.4 Florida 006 216 463 -3.5 -1.4 Southeast 007 341 736 -3.2 -1.8 Upper Midwest 030 278 591 -2.6 -2.2 Central 032 323 688 -1.1 -1.4 Mideast 033 411 876 -2.0 -1.4 Pacific Northwest 124 148 314 -3.5 -3.8 Southwest 126 349 753 0.0 0.8 Arizona 131 83 177 1.7 2.3 California --- 410 857 -1.1 -2.4 All Orders (Total) 3,024 6,470 -1.6 -0.9 All Areas (Total) 3,434 7,328 -1.6 -1.1
1 These figures are representative of the consumption of total fluid milk products in the respective area; see footnote 3 above for the products included. 2 Percent changes, as well as sales volumes, are shown on an unadjusted basis. 3 Data may not add due to rounding. Source: U.S. Department of Agriculture; California Department of Food and Agriculture.

DAIRY MARKET NEWS, APRIL 9 - 13, 2018 -G1- VOLUME 85, REPORT 15
30
40
50
60
70
80
90
JAN FEB MAR APR MAY JUN JUL AUG SEP OCT NOV DEC
Cheese Exports (various H.S. Codes)
2014 2015 2016 2017 2018
Million Pounds
GRAPH USDA, DMN; SOURCE USDA,FAS
0
5
10
15
20
25
30
JAN FEB MAR APR MAY JUN JUL AUG SEP OCT NOV DEC
U.S. Butter and Milkfat Exports (various H.S. Codes)
2013 2016 2015 2017 2018
Million Pounds
GRAPH, USDA, DMN; SOURCE, USDA,FAS

DAIRY MARKET NEWS, APRIL 9 - 13, 2018 -G2- VOLUME 85, REPORT 15
50
70
90
110
130
150
170
JAN FEB MAR APR MAY JUN JUL AUG SEP OCT NOV DEC
Monthly Nonfat Dry Milk Exports: H.S. Code 0402100000(FAS)
2014 2015 2016 2017 2018
Million Pounds
GRAPH USDA, DMN; SOURCE USDA,FAS
25
30
35
40
45
50
55
60
JAN FEB MAR APR MAY JUN JUL AUG SEP OCT NOV DEC
Monthly Lactose Exports: H.S. Code 1702110000(FAS)
2014 2015 2016 2017 2018
Million Pounds
GRAPH USDA, DMN; SOURCE USDA,FAS

DAIRY MARKET NEWS, APRIL 9 - 13, 2018 -G3- VOLUME 85, REPORT 15
20
25
30
35
40
45
50
55
JAN FEB MAR APR MAY JUN JUL AUG SEP OCT NOV DEC
Monthly Dry Whey Exports: H.S. Code 0404104000(FAS)
2014 2015 2016 2017 2018
Million Pounds
GRAPH USDA, DMN; SOURCE USDA,FAS
10
15
20
25
30
35
40
JAN FEB MAR APR MAY JUN JUL AUG SEP OCT NOV DEC
Monthly WPC <80% Exports: H.S. Code 0404100500(FAS)
2014 2015 2016 2017 2018
Million Pounds
GRAPH USDA, DMN; SOURCE USDA,FAS
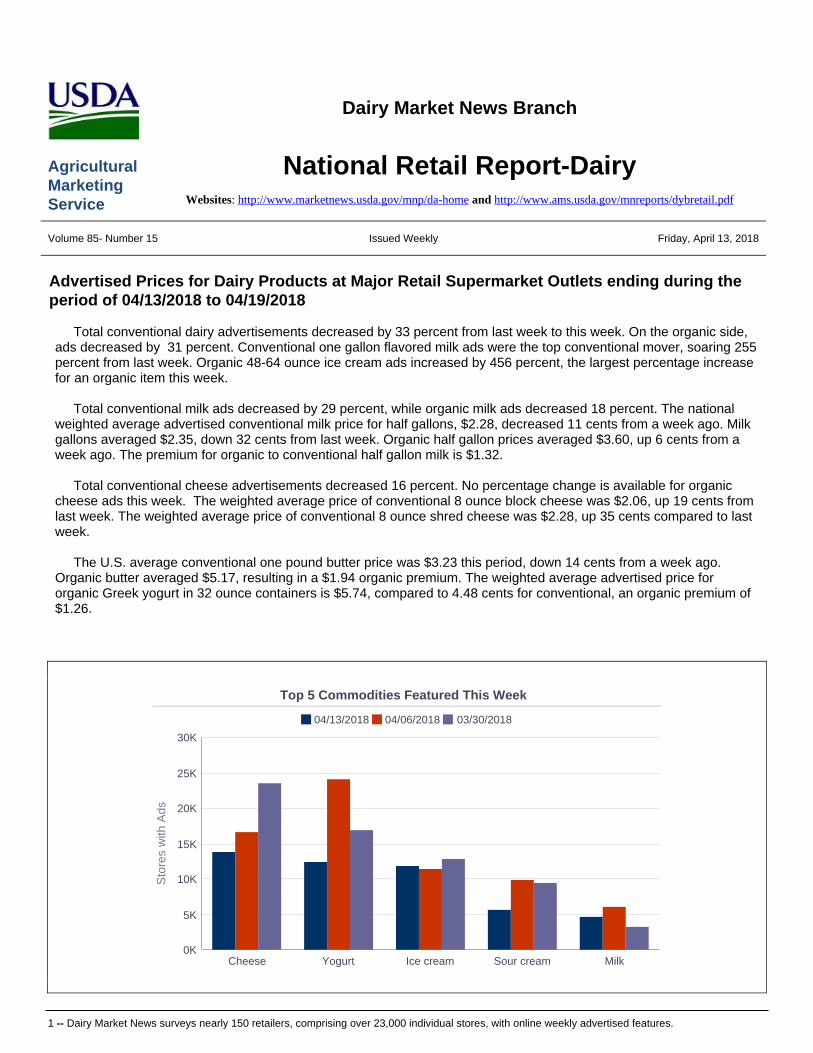
1 -- Dairy Market News surveys nearly 150 retailers, comprising over 23,000 individual stores, with online weekly advertised features.
Dairy Market News Branch
AgriculturalMarketingService
National Retail Report-DairyWebsites: http://www.marketnews.usda.gov/mnp/da-home and http://www.ams.usda.gov/mnreports/dybretail.pdf
Volume 85- Number 15 Issued Weekly Friday, April 13, 2018
Advertised Prices for Dairy Products at Major Retail Supermarket Outlets ending during the period of 04/13/2018 to 04/19/2018
Total conventional dairy advertisements decreased by 33 percent from last week to this week. On the organic side, ads decreased by 31 percent. Conventional one gallon flavored milk ads were the top conventional mover, soaring 255percent from last week. Organic 48-64 ounce ice cream ads increased by 456 percent, the largest percentage increase for an organic item this week.
Total conventional milk ads decreased by 29 percent, while organic milk ads decreased 18 percent. The national weighted average advertised conventional milk price for half gallons, $2.28, decreased 11 cents from a week ago. Milk gallons averaged $2.35, down 32 cents from last week. Organic half gallon prices averaged $3.60, up 6 cents from a week ago. The premium for organic to conventional half gallon milk is $1.32.
Total conventional cheese advertisements decreased 16 percent. No percentage change is available for organic cheese ads this week. The weighted average price of conventional 8 ounce block cheese was $2.06, up 19 cents from last week. The weighted average price of conventional 8 ounce shred cheese was $2.28, up 35 cents compared to last week.
The U.S. average conventional one pound butter price was $3.23 this period, down 14 cents from a week ago. Organic butter averaged $5.17, resulting in a $1.94 organic premium. The weighted average advertised price for organic Greek yogurt in 32 ounce containers is $5.74, compared to 4.48 cents for conventional, an organic premium of $1.26.
Cheese Yogurt Ice cream Sour cream Milk
Sto
res
with
Ads
0K
5K
10K
15K
20K
25K
30K
04/13/2018 04/06/2018 03/30/2018
Top 5 Commodities Featured This Week

National Retail Report - Dairy Vol 85 - No. 15Friday, April 13, 2018 - Page 2
Wtd Avg - Simple weighted average
Butter, 4%
Cheese, 24%
Cottage cheese, 3%
Cream cheese, 2%
Flavored milk, 2%
Ice cream, 19%
Milk, 4%
Sour cream, 10%
Yogurt, 21%
Percentage of Total Conventional Ads by Commodity
Butter, 10%
Cottage cheese, 5%
Cream cheese, 2%
Ice cream, 22%
Milk, 47%
Yogurt, 14%
Percentage of Total Organic Ads by Commodity

National Retail Report - Dairy Vol 85 - No. 15Friday, April 13, 2018 - Page 3
Wtd Avg - Simple weighted average
NATIONAL -- CONVENTIONAL DAIRY PRODUCTS
Commodity Type Pack Size
THIS PERIOD LAST WEEK LAST YEAR
StoresWith Ads
Wtd AvgPrice
StoresWith Ads
Wtd AvgPrice
StoresWith Ads
Wtd AvgPrice
Butter 1 # 2046 3.23 3588 3.37 15001 2.71
Cheese Natural Varieties 8 oz block 4500 2.06 5955 1.87 7455 2.32
Cheese Natural Varieties 1 # block 812 3.62 1762 3.73 2922 3.18
Cheese Natural Varieties 2 # block 1573 5.22 1472 5.47 656 5.99
Cheese Natural Varieties 8 oz shred 6173 2.28 6264 1.93 9973 2.31
Cheese Natural Varieties 1 # shred 726 3.91 1024 4.16 2401 3.39
Cottage cheese 16 oz 1486 2.06 3091 1.89 5665 1.89
Cream cheese 8 oz 1090 1.78 5114 1.94 15210 1.69
Flavored milk All fat tests half gallon 414 2.02 803 2.16 769 2.09
Flavored milk All fat tests gallon 487 2.99 137 2.22 408 2.77
Ice cream 48-64oz 10551 2.83 11148 3.19 14379 2.97
Milk All fat tests half gallon 836 2.28 1165 2.39 544 2.33
Milk All fat tests gallon 1219 2.35 1724 2.67 1671 3.78
Sour cream 16 oz 5506 1.85 9908 1.74 11685 1.71
Yogurt Greek 4-6 oz 7189 .91 10276 .96 9341 .98
Yogurt Greek 32 oz 809 4.48 3309 4.34 2318 4.69
Yogurt Yogurt 4-6 oz 3288 .48 5296 .48 6047 .53
Yogurt Yogurt 32 oz 391 1.94 1632 2.06 371 2.29
REGIONAL -- CONVENTIONAL DAIRY PRODUCTS
Commodity Type Pack Size
NORTHEAST U.S. SOUTHEAST U.S. MIDWEST U.S.
Price Range
Stores with Ads
Wtd AvgPrice
Price Range
Stores with Ads
Wtd AvgPrice
Price Range
Stores with Ads
Wtd AvgPrice
Butter 1 # 2.89-4.49 811 3.82 3.49 61 3.49 3.00-3.50 335 3.15
Cheese Natural Varieties 8 oz block 1.99-3.00 1299 2.57 1.67-2.50 583 2.04 0.99-2.50 740 1.49
Cheese Natural Varieties 1 # block 3.00-3.99 378 3.53 2.49 84 2.49 3.99 213 3.99
Cheese Natural Varieties 2 # block 5.99 108 5.99 4.99 210 4.99
Cheese Natural Varieties 8 oz shred 1.99-3.00 908 2.59 1.67-3.00 1744 2.63 0.99-2.50 1202 1.83
Cheese Natural Varieties 1 # shred 3.49-4.79 368 4.01 2.49 84 2.49 3.99 213 3.99
Cottage cheese 16 oz 1.69-2.99 744 2.24 0.99-1.50 279 1.35 1.29-1.89 226 1.57
Cream cheese 8 oz 1.89-2.09 389 2.02 1.50-2.39 167 1.80
Flavored milk All fat tests half gallon 1.50 114 1.50
Flavored milk All fat tests gallon 1.99-3.49 266 3.19
Ice cream 48-64oz 1.99-3.87 2188 2.63 2.39-3.99 1911 2.76 1.99-3.99 1452 2.82
Milk All fat tests half gallon 2.99 147 2.99 1.50 114 1.50
Milk All fat tests gallon 2.77 60 2.77 1.49-2.50 339 1.91
Sour cream 16 oz 1.49-1.99 1497 1.74 0.99-1.98 1284 1.87 1.89-1.99 1036 1.97
Yogurt Greek 4-6 oz 0.59-1.25 2166 .95 0.88-1.00 633 .94 0.75-1.00 948 .93
Yogurt Greek 32 oz 3.99-5.49 366 4.59 3.48-5.49 256 3.96

National Retail Report - Dairy Vol 85 - No. 15Friday, April 13, 2018 - Page 4
Wtd Avg - Simple weighted average
Commodity Type Pack Size
NORTHEAST U.S. SOUTHEAST U.S. MIDWEST U.S.
Price Range
Stores with Ads
Wtd AvgPrice
Price Range
Stores with Ads
Wtd AvgPrice
Price Range
Stores with Ads
Wtd AvgPrice
Yogurt Yogurt 4-6 oz 0.40-0.60 939 .49 0.40-0.50 178 .44 0.40-0.50 787 .44
Yogurt Yogurt 32 oz 1.89-1.99 388 1.93
Commodity Type Pack Size
SOUTH CENTRAL U.S. SOUTHWEST U.S. NORTHWEST U.S.
Price Range
Stores with Ads
Wtd AvgPrice
Price Range
Stores with Ads
Wtd AvgPrice
Price Range
Stores with Ads
Wtd AvgPrice
Butter 1 # 1.99-3.00 462 2.47 1.99 114 1.99 2.99-3.34 235 3.08
Cheese Natural Varieties 8 oz block 1.99-2.50 343 2.19 1.50-2.50 1145 1.87 1.49-2.99 356 1.92
Cheese Natural Varieties 1 # block 3.99 137 3.99
Cheese Natural Varieties 2 # block 3.99-4.99 552 4.85 4.99-6.99 266 6.13 4.99 410 4.99
Cheese Natural Varieties 8 oz shred 1.99-2.50 614 2.20 1.50-2.50 1051 2.00 1.49-2.49 568 2.09
Cheese Natural Varieties 1 # shred 4.99 61 4.99
Cottage cheese 16 oz 2.78 72 2.78 2.72 117 2.72
Cream cheese 8 oz 1.50 221 1.50 1.50 120 1.50 1.67 166 1.67
Flavored milk All fat tests half gallon 1.99 246 1.99
Flavored milk All fat tests gallon 2.50-2.99 210 2.75
Ice cream 48-64oz 1.99-4.99 1818 2.97 1.99-3.77 2506 2.92 1.99-3.34 560 2.84
Milk All fat tests half gallon 1.89-2.44 247 2.14 1.99 246 1.99
Milk All fat tests gallon 2.29-2.49 538 2.45 1.99-2.99 271 2.58
Sour cream 16 oz 1.50-1.98 1450 1.84 1.99 137 1.99 1.50 61 1.50
Yogurt Greek 4-6 oz 0.69-1.00 920 .84 0.69-1.00 1807 .89 0.79-1.00 629 .88
Yogurt Greek 32 oz 4.99-5.29 160 5.14
Yogurt Yogurt 4-6 oz 0.49-0.50 327 .50 0.39-0.50 514 .46 0.50 455 .50
Commodity Type Pack Size
ALASKA U.S. HAWAII U.S.
Price Range
Stores with Ads
Wtd AvgPrice
Price Range
Stores with Ads
Wtd AvgPrice
Butter 1 # 5.29 28 5.29
Cheese Natural Varieties 8 oz block 2.50 34 2.50
Cheese Natural Varieties 2 # block 5.99 27 5.99
Cheese Natural Varieties 8 oz shred 3.28-4.99 52 4.41 2.50 34 2.50
Cottage cheese 16 oz 2.48-2.50 14 2.50 3.00 34 3.00
Cream cheese 8 oz 2.49 27 2.49
Flavored milk All fat tests half gallon 2.99-3.50 54 3.25
Flavored milk All fat tests gallon 2.99 11 2.99
Ice cream 48-64oz 3.49-4.98 35 3.62 2.98-4.49 81 3.82
Milk All fat tests half gallon 2.79 21 2.79 2.99-3.99 61 3.55
Milk All fat tests gallon 2.99 11 2.99
Sour cream 16 oz 2.48-2.50 14 2.50 2.50 27 2.50
Yogurt Greek 4-6 oz 0.88-1.25 32 1.12 0.89-1.25 54 1.07
Yogurt Greek 32 oz 3.99 27 3.99
Yogurt Yogurt 4-6 oz 0.60-0.99 88 .72
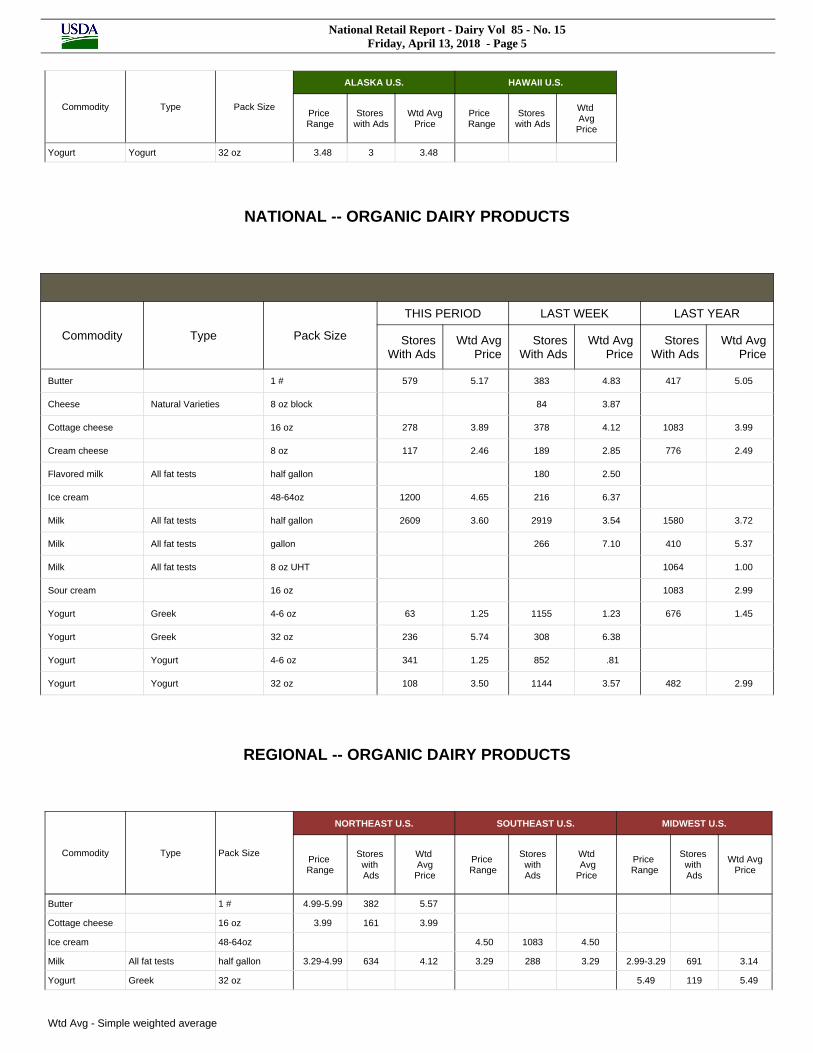
National Retail Report - Dairy Vol 85 - No. 15Friday, April 13, 2018 - Page 5
Wtd Avg - Simple weighted average
Commodity Type Pack Size
ALASKA U.S. HAWAII U.S.
Price Range
Stores with Ads
Wtd AvgPrice
Price Range
Stores with Ads
Wtd AvgPrice
Yogurt Yogurt 32 oz 3.48 3 3.48
NATIONAL -- ORGANIC DAIRY PRODUCTS
Commodity Type Pack Size
THIS PERIOD LAST WEEK LAST YEAR
StoresWith Ads
Wtd AvgPrice
StoresWith Ads
Wtd AvgPrice
StoresWith Ads
Wtd AvgPrice
Butter 1 # 579 5.17 383 4.83 417 5.05
Cheese Natural Varieties 8 oz block 84 3.87
Cottage cheese 16 oz 278 3.89 378 4.12 1083 3.99
Cream cheese 8 oz 117 2.46 189 2.85 776 2.49
Flavored milk All fat tests half gallon 180 2.50
Ice cream 48-64oz 1200 4.65 216 6.37
Milk All fat tests half gallon 2609 3.60 2919 3.54 1580 3.72
Milk All fat tests gallon 266 7.10 410 5.37
Milk All fat tests 8 oz UHT 1064 1.00
Sour cream 16 oz 1083 2.99
Yogurt Greek 4-6 oz 63 1.25 1155 1.23 676 1.45
Yogurt Greek 32 oz 236 5.74 308 6.38
Yogurt Yogurt 4-6 oz 341 1.25 852 .81
Yogurt Yogurt 32 oz 108 3.50 1144 3.57 482 2.99
REGIONAL -- ORGANIC DAIRY PRODUCTS
Commodity Type Pack Size
NORTHEAST U.S. SOUTHEAST U.S. MIDWEST U.S.
Price Range
Stores with Ads
Wtd AvgPrice
Price Range
Stores with Ads
Wtd AvgPrice
Price Range
Stores with Ads
Wtd AvgPrice
Butter 1 # 4.99-5.99 382 5.57
Cottage cheese 16 oz 3.99 161 3.99
Ice cream 48-64oz 4.50 1083 4.50
Milk All fat tests half gallon 3.29-4.99 634 4.12 3.29 288 3.29 2.99-3.29 691 3.14
Yogurt Greek 32 oz 5.49 119 5.49

National Retail Report - Dairy Vol 85 - No. 15Friday, April 13, 2018 - Page 6
Wtd Avg - Simple weighted average
Commodity Type Pack Size
NORTHEAST U.S. SOUTHEAST U.S. MIDWEST U.S.
Price Range
Stores with Ads
Wtd AvgPrice
Price Range
Stores with Ads
Wtd AvgPrice
Price Range
Stores with Ads
Wtd AvgPrice
Yogurt Yogurt 4-6 oz 1.25 161 1.25 1.25 180 1.25
Yogurt Yogurt 32 oz 3.50 108 3.50
Commodity Type Pack Size
SOUTH CENTRAL U.S. SOUTHWEST U.S. NORTHWEST U.S.
Price Range
Stores with Ads
Wtd AvgPrice
Price Range
Stores with Ads
Wtd AvgPrice
Price Range
Stores with Ads
Wtd AvgPrice
Butter 1 # 4.99 80 4.99 3.99 117 3.99
Cottage cheese 16 oz 3.76 117 3.76
Cream cheese 8 oz 2.46 117 2.46
Ice cream 48-64oz 5.99 117 5.99
Milk All fat tests half gallon 3.50-4.29 304 3.97 3.29-4.49 458 3.91 2.50-3.29 234 2.85
Yogurt Greek 4-6 oz 1.25 63 1.25
Yogurt Greek 32 oz 5.99 117 5.99
Commodity Type Pack Size
ALASKA U.S. HAWAII U.S.
Price Range
Stores with Ads
Wtd AvgPrice
Price Range
Stores with Ads
Wtd AvgPrice
REGIONAL DEFINITIONS
As used in this report, regions include the following states:
NORTHEAST U.S. Connecticut, Delaware, Massachusetts, Maryland, Maine, New Hampshire, New jersey, New York, Pennsylvania, Rhode Island and Vermont
SOUTHEAST U.S. Alabama, Florida, Georgia, Mississippi, North Carolina, South Carolina, Tennessee, Virginia and West VirginiaMIDWEST U.S. Iowa, Illinois, Indiana, Kentucky, Michigan, Minnesota, North Dakota, Nebraska, Ohio, South Dakota and WisconsinSOUTH CENTRAL U.S. Arkansas, Colorado, Kansas, Louisiana, Missouri, New Mexico, Oklahoma, and TexasSOUTHWEST U.S. Arizona, California, Nevada and UtahNORTHWEST U.S. Idaho, Montana, Oregon, Washington, and WyomingALASKA AlaskaHAWAII HawaiiNATIONAL Continental United States

USDA is an equal opportunity provider and employer
Dairy Market News United States Department of Agriculture
Agricultural Marketing Service Dairy Programs Market Information Branch
Volume 85, Report 15 April 13, 2018
GENERAL NUMBER (608) 422-8587 Elizabeth Frederick (608) 422-8587 [email protected] INTERNS Al Yang (608) 422-8598 [email protected] Jennifer Hernandez (608) 422-8597 [email protected]
ORGANIC/ EAST Daniel Johnson (608) 422-8605 [email protected]
EAST Jessica Mueller (608) 422-8589 [email protected]
CENTRAL Israel Weber (608) 422-8601 [email protected]
SOUTHWEST/SOUTH AMERICA AJ (Angel José) Terán (608) 422-8593 Angel.Terá[email protected]
SOUTHWEST Florence Kone-Gonzalez (608) 422-8594 [email protected]
NORTHWEST/MOUNTAIN Mike Bandli (608) 422-8592 [email protected]
EUROPE & OCEANIA/ ORGANIC
Eric Graf (608) 422-8590 [email protected]
NATIONAL SUPERVISOR
Janet Linder (608) 422-8588 [email protected]
BRANCH CHIEF
Butch Speth (608) 422-8586 [email protected]
INTERNET ADDRESS
www.ams.usda.gov/market-news/dairy
MARKET NEWS PORTAL www.marketnews.usda.gov/mnp/da-home
RECORDED INFORMATION SYSTEM (608) 422-8602
FAX (608) 240-6689 ________________________ USDA, Dairy Market News 4600 American Parkway, STE 106 Madison, WI 53718-8334