Dairy Australia
91
Dairy Australia Anaerobic Digestion as a Treatment and Energy Recovery Technology for Dairy Processing Waste Streams Report June 2017
Transcript of Dairy Australia
Dairy Australia Anaerobic Digestion as a Treatment and Energy Recovery
Technology for Dairy Processing Waste Streams Report
June 2017
GHD | Report for Dairy Australia - Anaerobic Digestion as a Treatment and Energy Recovery Technology for Dairy
Processing Waste Streams, 31/34091 | i
Executive Summary Anaerobic digestion is a key treatment method for high strength wastes and presents an
opportunity to generate a useful by-product (biogas), providing the potential for waste to energy.
This report provides information on anaerobic digestion technologies for engineering and
technical staff at dairy processing plants who wish to conduct an initial feasibility of anaerobic
treatment technologies for their plant. The topics covered in this report are:
Wastewater Characteristics and Disposal Routes
An overview of the dairy processing wastewater characteristics in Australia is provided together
with a discussion of key wastewater characteristics that are important for successful operation
of anaerobic treatment. Disposal routes (sewer, surface water, agricultural land and on-site
reuse) guidelines governing the discharge, and examples of trade waste charges at different
sites are explored.
Anaerobic Digestion Technology Review
A brief description of various anaerobic digestion technologies is presented and the advantages
and disadvantages of each system are summarised. Comparison of anaerobic digestion
technologies are captured in Section 0. The technologies reviewed are;
Uncovered anaerobic lagoons
Covered anaerobic lagoons (CAL)
Constructed digestion tank reactors
Proprietary high rate anaerobic digestion systems [Anaerobic flotation reactor (AFR),
Upflow Anaerobic Sludge Blanket (UASB) and Anaerobic Membrane Bioreactor (AnMBR)
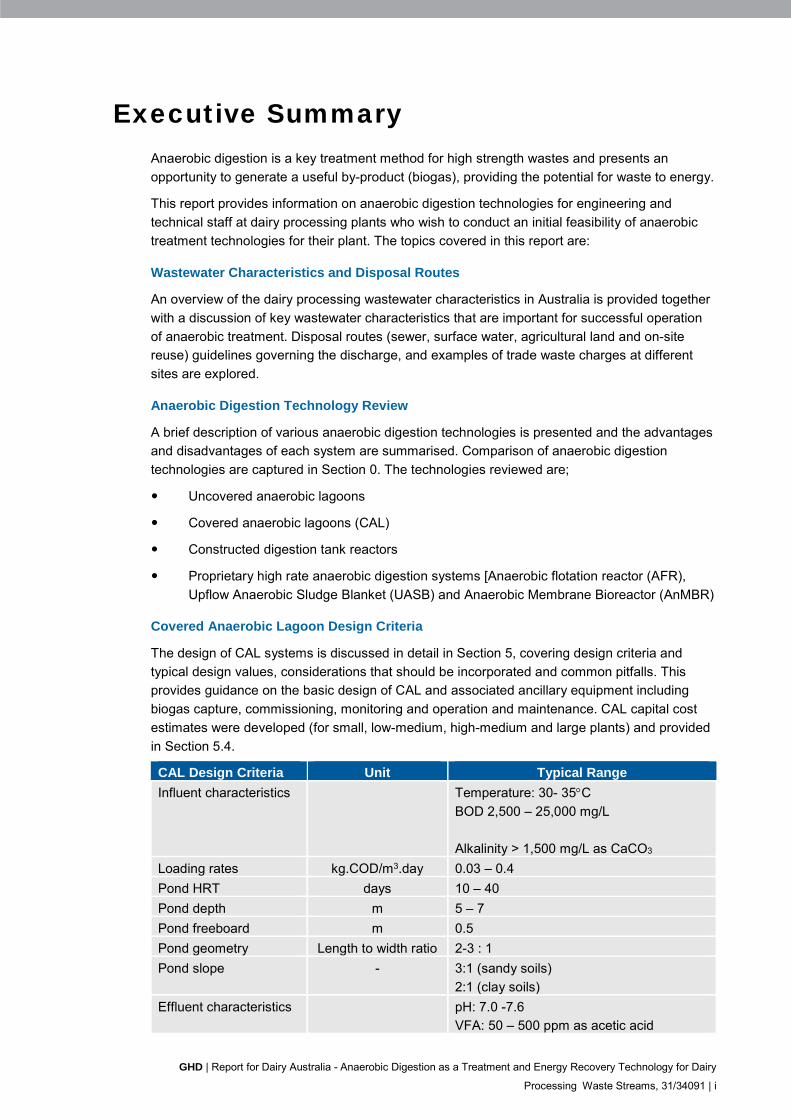
Covered Anaerobic Lagoon Design Criteria
The design of CAL systems is discussed in detail in Section 5, covering design criteria and
typical design values, considerations that should be incorporated and common pitfalls. This
provides guidance on the basic design of CAL and associated ancillary equipment including
biogas capture, commissioning, monitoring and operation and maintenance. CAL capital cost
estimates were developed (for small, low-medium, high-medium and large plants) and provided
in Section 5.4.
CAL Design Criteria Unit Typical Range
Influent characteristics Temperature: 30- 35C
BOD 2,500 – 25,000 mg/L
Alkalinity > 1,500 mg/L as CaCO3
Loading rates kg.COD/m3.day 0.03 – 0.4
Pond HRT days 10 – 40
Pond depth m 5 – 7
Pond freeboard m 0.5
Pond geometry Length to width ratio 2-3 : 1
Pond slope - 3:1 (sandy soils)
2:1 (clay soils)
Effluent characteristics pH: 7.0 -7.6
VFA: 50 – 500 ppm as acetic acid

ii | GHD | Report for Dairy Australia - Anaerobic Digestion as a Treatment and Energy Recovery Technology for Dairy
Processing Waste Streams, 31/34091
CAL Design Criteria Unit Typical Range
Alkalinity: 2,000 – 3,000 ppm as CaCO3
Ratio of VFA / Alk: 0.1 – 0.5
Ratio of VFA / Alkalinity is an important
factor.
Biogas generation m3 biogas produced
per kg COD removed
0.5
m3 CH4 produced per
kg COD removed
0.25 - 0.35
Biogas Conditioning and Conversion
Biogas conditioning requirements and conversion technologies are discussed in Sections 6 and
7 and associated capital and operating costs (small, low-medium, high-medium and large
plants) are summarised. Biogas conditioning and conversion technologies considered are:
Biogas conditioning
H2S removal (Dry, wet scrubbing, biological tricking filter, adsoprtion)
Moisture removal (Condensate and sediment trap, U-trap and refrigeration)
Biogas conversion
Gas flaring
Boiler
Internal combustion engines
Cogeneration
Microturbines
Case Study
A case study is presented for Goulburn Valley Water’s Tatura wastewater treatment plant. The
design aspects and biogas generation are outlined to provide an understanding of the success
factors and lessons learnt for the wider audience, but especially those considering installation of
a CAL.
Business Case Evaluation
Lastly, the application and feasibility of covered anaerobic lagoons were considered from the
points of view of:
The water authority
The dairy company
The electricity generator / provider.
Risks and opportunities for treatment scenarios are also discussed.
GHD | Report for Dairy Australia - Anaerobic Digestion as a Treatment and Energy Recovery Technology for Dairy
Processing Waste Streams, 31/34091 | iii
Abbreviations AD Anaerobic Digestion
AFR Anaerobic Flotation Reactor
AL Anaerobic Lagoon
AnMBR Anaerobic Membrane Bioreactor
BOD Biochemical Oxygen Demand
ASP Activated Sludge Process
CAL Covered Anaerobic Lagoon
CH4 Methane
CO2 Carbon Dioxide
COD Chemical Oxygen Demand
CSTR Continuous Stirred-Tank Reactor
FOG Fats, Oils and Grease
GVW Goulburn Valley Water
HDPE High Density Polyethylene
HRAL High Rate Anaerobic Lagoon
HRT Hydraulic Retention Time
H2S Hydrogen Sulphide
IC Internal Combustion
LDPE Low Density Polyethylene
LLDPE Low Linear Density Polyethylene
PE Polyethylene
RO Reverse Osmosis
SAR Sodium Absorption Ratio
SBR Sequencing Batch Reactor
SRT Solids Retention Time
TKN Total Kjeldahl Nitrogen
TSS Total Suspended Solids
TDS Total Dissolved Solids
UASB Upflow Anaerobic Sludge Blanket
VFA Volatile Fatty Acids
WWTP Wastewater Treatment Plant
iv | GHD | Report for Dairy Australia - Anaerobic Digestion as a Treatment and Energy Recovery Technology for Dairy
Processing Waste Streams, 31/34091
Table of contents 1. Introduction..................................................................................................................................... 1
1.1 General ................................................................................................................................ 1
1.2 Purpose of this report........................................................................................................... 1
1.3 Scope and limitations ........................................................................................................... 1
1.4 This report ............................................................................................................................ 2
2. Characteristics of Dairy Processing Effluents ................................................................................ 3
2.1 Overview .............................................................................................................................. 3
2.2 Dairy Processing Wastewater Characteristics ..................................................................... 3
3. Review of Wastewater Disposal Routes and Discharge Requirements ........................................ 5
3.1 Overview .............................................................................................................................. 5
3.2 Disposal routes .................................................................................................................... 5
4. Anaerobic Digestion Technology Review .................................................................................... 11
4.1 Overview ............................................................................................................................ 11
4.2 Background Digestion Theory ........................................................................................... 11
4.3 Key Considerations for Successful Operation ................................................................... 11
4.4 Drivers for Anaerobic Treatment ........................................................................................ 12
4.5 Review of Anaerobic Digestion Options ............................................................................ 12
4.6 Summary of Comparison ................................................................................................... 20
4.7 Installed Anaerobic Digestion Technology in Dairy Processing Industry .......................... 22
5. Covered Anaerobic Lagoon Design Criteria ................................................................................ 29
5.1 Outline ................................................................................................................................ 29
5.2 Waste Characterisation and Monitoring............................................................................. 29
5.3 Summary of Criteria ........................................................................................................... 30
5.4 Cost Estimates ................................................................................................................... 31
6. Biogas Conditioning Review ........................................................................................................ 33
6.1 Overview ............................................................................................................................ 33
6.2 Biogas Characterisation ..................................................................................................... 33
6.3 Biogas Conditioning Requirements ................................................................................... 34
6.4 H2S Removal Technologies ............................................................................................... 34
6.5 Moisture Removal Technologies ....................................................................................... 35
6.6 Summary of Contaminant Removal Technologies for Biogas ........................................... 36
6.7 Summary of Design Criteria ............................................................................................... 37
6.8 Cost Estimates ................................................................................................................... 38
7. Biogas Conversion and Usage Review ........................................................................................ 40
7.1 Overview ............................................................................................................................ 40
7.2 Electricity Market ................................................................................................................ 40
7.3 Technology Description ..................................................................................................... 41
7.4 Summary of Comparison of Biogas Usage / Applications ................................................. 43
GHD | Report for Dairy Australia - Anaerobic Digestion as a Treatment and Energy Recovery Technology for Dairy
Processing Waste Streams, 31/34091 | v
7.5 Summary of Design Criteria ............................................................................................... 45
7.6 Cost Estimates ................................................................................................................... 45
8. Case Study: Goulburn Valley Water’s Tatura WWTP (and CAL) ................................................ 47
8.1 Description of System ........................................................................................................ 47
8.2 Design Criteria ................................................................................................................... 48
8.3 Equipment Specifications .................................................................................................. 51
8.4 Capital Cost ....................................................................................................................... 53
8.5 Data and Performance Evaluation ..................................................................................... 54
8.6 Equipment Maintenance .................................................................................................... 55
9. Business Case Evaluation ........................................................................................................... 56
9.1 Overview ............................................................................................................................ 56
9.2 Risks and Opportunities ..................................................................................................... 56
9.3 Check List to Review Viability for CAL ............................................................................... 58
D.1 Current dairy wastewater treatment practices ................................................................... 66
D.2 Emerging Trends in Dairy Wastewater Treatment Practices............................................. 69
E.1 Key Operating Parameters ................................................................................................ 73
E.2 Pre-Treatment .................................................................................................................... 73
D.3 Pond Design ...................................................................................................................... 73
E.4 Inflow Distribution ............................................................................................................... 74
E.5 Effluent Collection .............................................................................................................. 74
E.6 Sludge ................................................................................................................................ 74
E.7 Covers ................................................................................................................................ 75
E.8 Biogas Collection ............................................................................................................... 76
E.9 Instrumentation .................................................................................................................. 78
E.10 Operation and Maintenance .............................................................................................. 78
Table index Table 1 Dairy Processing Wastewater Quality ................................................................................. 4
Table 2 Typical Trade Waste Quality Targets .................................................................................. 6
Table 3 Typical Trade Waste Charges ............................................................................................. 7
Table 4 Typical Effluent Quality Standards ..................................................................................... 10
Table 5 Anaerobic Digestion Operating Range .............................................................................. 12
Table 6 Known Anaerobic Digestion Categories Applied to Dairy Processing ............................... 13
Table 7 Comparison of Anaerobic Digestion Systems – Potentially Applicable to Dairy
Industry .............................................................................................................................. 20
Table 8 Identified Australian Installations ....................................................................................... 22
Table 9 International Installations of Anaerobic Digestion Technologies ....................................... 24
Table 10 Wastewater Analysis (Raw and Treated) .......................................................................... 29
vi | GHD | Report for Dairy Australia - Anaerobic Digestion as a Treatment and Energy Recovery Technology for Dairy
Processing Waste Streams, 31/34091
Table 11 CAL Design Criteria ........................................................................................................... 30
Table 12 CAL Key Considerations .................................................................................................... 31
Table 13 CAL Cost Estimate ............................................................................................................. 32
Table 14 Biogas Characteristics (General and not specific to dairy industry) .................................. 33
Table 15 Biogas Conditioning and Impacts ...................................................................................... 34
Table 16 Comparison of H2S Removal Technologies ...................................................................... 36
Table 17 Comparison of Moisture Removal Systems....................................................................... 37
Table 18 Biogas Converters Conditioning Requirements ................................................................. 37
Table 19 Key Concerns and Mitigation Strategies for Biogas Contaminants ................................... 37
Table 20 H2S Removal Technologies Cost Estimate ....................................................................... 38
Table 21 Biogas Conditioning Cost per Biogas Production .............................................................. 39
Table 22 Comparison of Biogas Conversion Systems ..................................................................... 43
Table 23 Assumptions for Biogas Conversion Cost Estimate .......................................................... 45
Table 24 Biogas Conversion Cost Estimates ................................................................................... 45
Table 25 Biogas Conversion Cost per kW Facility............................................................................ 46
Table 26 Influent Wastewater Characteristics .................................................................................. 48
Table 27 Tatura WWTP Anaerobic System ...................................................................................... 52
Table 28 Tatura WWTP Biogas Conversion System ........................................................................ 53
Table 29 Risks and Opportunities from Different Stakeholder Perspectives .................................... 56
Table 30 Characteristics of Untreated Wastewater from Dairy Plants ............................................. 63
Table 31 Example of Trade Waste Charges With and Without AD Treatment (Goulburn
Valley Water) ..................................................................................................................... 65
Table 32 Typical Dairy Processing Treatment Processes ................................................................ 66
Table 33 Typical Lagoon Parameters ............................................................................................... 69
Table 34 Summary of Leading Practice Technologies and Approaches .......................................... 70
Table 35 Comparison of Cover Materials ......................................................................................... 76
Figure index
Figure 1 Anaerobic Digestion Pathway ............................................................................................ 11
Figure 2 Uncovered Anaerobic Lagoon (Juice factory) ................................................................... 14
Figure 3 Covered Lagoon (Biodiesel Plant) ..................................................................................... 15
Figure 4 Constructed Reactor (USA) ............................................................................................... 15
Figure 5 Constructed Reactor (Valbio) ............................................................................................ 16
Figure 6 Above Ground Constructed Digester (sourced from ADI®) .............................................. 16
Figure 7 Hydrothan Digestion and Recirculation Vessel System .................................................... 17
GHD | Report for Dairy Australia - Anaerobic Digestion as a Treatment and Energy Recovery Technology for Dairy
Processing Waste Streams, 31/34091 | vii
Figure 8 Paques BIOPAQ® AFR Reactor ....................................................................................... 18
Figure 9 Paques BIOPAQ® IC Reactor ........................................................................................... 19
Figure 10 UASB Process and Installation [7] ..................................................................................... 19
Figure 11 Large scale Generation Certificate Spot Price .................................................................. 40
Figure 12 Gas Flaring ........................................................................................................................ 41
Figure 13 Aerial View of Anaerobic Systems ..................................................................................... 48
Figure 14 Covered Lagoons ............................................................................................................... 49
Figure 15 Waste Characteristics ........................................................................................................ 54
Figure 16 COD Removed and Biogas Generated ............................................................................. 54
Figure 17 Flow Chart for Viability for Anaerobic Digestion ............................................................... 60
Figure 18 Positive Pressure Covers for Anaerobic Lagoons (King Island Meat Processing
CAL) ................................................................................................................................... 77
Figure 19 Negative Pressure Covers for Anaerobic Lagoons (Poultry Processing CAL) .................. 77
Appendices Appendix A – Dairy Wastewater Characteristics (Data collated by Dairy Australia)
Appendix B – Installed Anaerobic Digestion Technology in Other Industries
Appendix C – Trade Waste
Appendix D Current and Leading Practices in Dairy Wastewater Treatment
Appendix E – Covered Anaerobic Lagoon Design Criteria
Appendix F – References

GHD | Report for Dairy Australia - Anaerobic Digestion as a Treatment and Energy Recovery Technology for Dairy
Processing Waste Streams, 31/34091 | 1
1. Introduction 1.1 General
The dairy processing industry generates a wastewater which contains high concentrations of
organic matter (expressed as biochemical or chemical oxygen demand, BOD or COD
respectively), nutrients (nitrogen and phosphorous), fats, oils and grease (FOG) and total
dissolved solids (TDS) or salinity. Treatment and disposal of this wastewater in a cost effective
and environmentally sustainable manner is a significant challenge for the dairy industry.
Depending upon site location and available wastewater disposal routes, trade waste charges for
sewer disposal can vary considerably. As most sewer charges are load based, high organic
loads if untreated or inadequately treated will incur a substantial fee to the overall plant
operation. Reduction of trade waste charge is only possible by implementing an effective pre-
treatment, which would remove contaminants ideally to a level low enough to avoid significant
charges.
A selection of current trade waste charges from around Australia is provided for reference in
Section 2. A comparison is also provided of annual trade waste charges which would be
incurred for a fictitious plant located if it was located in different regions. The results, show that
the majority of the charges are related to wastewater flowrate and BOD. The analyse also
highlights potential savings to the business that could be realised by employing an effective
organic removal process, such as anaerobic digestion. While there are numerous treatment
technologies, anaerobic digestion is a key treatment method for high strength wastes and
presents an opportunity to generate a useful by-product – biogas, providing the potential for
waste to energy.
This report provides information and focusses on anaerobic digestion technologies, and aims to
assist engineering and technical staff at dairy processing plants when conducting an initial
feasibility of anaerobic treatment technologies for their plant, as well as providing key insights
for plant engineers operating existing anaerobic digestion facilities.
1.2 Purpose of this report
This report presents a review of anaerobic digestion technologies for wastewater streams
produced by the Australian dairy processing industry together with a case study involving a
dairy processor, water corporation and power generator.
The purpose of the report is to provide a reference document for the Australian dairy processing
industry that provides engineering and technical staff with credible information to assist with
decision making when considering an anaerobic digestion project and key insights into
understanding an operational system. The intent is to encourage implementation of successful
anaerobic digestion projects within the Australian dairy industry where it makes sense and to
discourage projects where it does not. The report therefore also outlines conditions where local
factory, wastewater and environmental conditions are poorly suited to the technology.
1.3 Scope and limitations
1.3.1 Work scope
The scope of work involved in developing this manual included:
A review of typical wastewater characteristics of dairy processing industry
A review of Australian dairy wastewater treatment requirements
2 | GHD | Report for Dairy Australia - Anaerobic Digestion as a Treatment and Energy Recovery Technology for Dairy
Processing Waste Streams, 31/34091
A review of available anaerobic digestion technology
A review of biogas utilisation technologies
A review of biogas conditioning technologies
Presentation of a dairy digestion case study
1.4 This report
Section 2 outlines the characteristics of dairy wastewater.
Section 3 discusses the disposal routes available to the dairy wastewater, discharge
requirements and comparison of trade waste charges with and without the AD process.
Section 4 discusses anaerobic digestion technologies to treat dairy processing wastewater.
Section 5 discusses design criteria for covered anaerobic lagoon systems, ancillary equipment
and associated capital and operating cost.
Section 6 discusses biogas conditioning technologies to remove pollutants and identifies
associated capital and operating costs.
Section 7 discusses biogas conversion technologies and associated capital and operating cost.
Section 8 presents a case study of anaerobic digestion in the dairy industry.
Section 9 presents key risk and opportunities when considering anaerobic digestion in the dairy
processing industry.
GHD | Report for Dairy Australia - Anaerobic Digestion as a Treatment and Energy Recovery Technology for Dairy
Processing Waste Streams, 31/34091 | 3
2. Characteristics of Dairy Processing Effluents 2.1 Overview
This section gives an overview of the dairy processing wastewater characteristics in Australia.
The typical ranges of wastewater pollutants generated by the dairy processing industry are
presented and the wastewater characteristics that are important for successful operation of
anaerobic treatment systems are explained.
2.2 Dairy Processing Wastewater Characteristics
Dairy processing wastewater characteristics are highly variable based on the products produced
at the site. Such products could include:
Milk
Colostrum
Liquid milk products
Cream and thickened cream
Butter, butter concentrate, buttermilk, concentrated buttermilk, dairy blend, ghee, and
anhydrous milk fat (butter oil)
Casein, caseinate, and cheese
Whey, whey cream and concentrated whey cream
Cultured milk and yoghurt
Ice-cream and ice-cream mix
Buttermilk powder, lactose powder, milk sugar, powdered milk, skim milk powder, whey
powder, milk protein
Powder and other milk concentrates
Typical characteristics of wastewaters from various types of dairy facilities (product based)
adapted from Watkins & Nash (2010) [1] is shown in Appendix A.
It is quite common for dairy processing facilities to produce a combination of dairy products
resulting in a combined waste stream with unique characteristics. Despite this inherent
variability in wastewater characteristics, dairy wastewater streams typically comprise high
concentrations of organic matter (expressed as biochemical or chemical oxygen demand, BOD
or COD respectively), nutrients (nitrogen and phosphorous), fats, oils and grease (FOG) and
total dissolved solids (TDS) or salinity.
Acknowledging that there will be significant variability, typical waste values derived from data
from a range of Australian dairy processing plants are presented in Table 1.
The waste characteristics presented were compiled from survey results provided by Dairy
Australia. A total of 10 dairy manufacturer sites participated in the survey. The complete data
set and further information are included in Appendix A.
4 | GHD | Report for Dairy Australia - Anaerobic Digestion as a Treatment and Energy Recovery Technology for Dairy
Processing Waste Streams, 31/34091
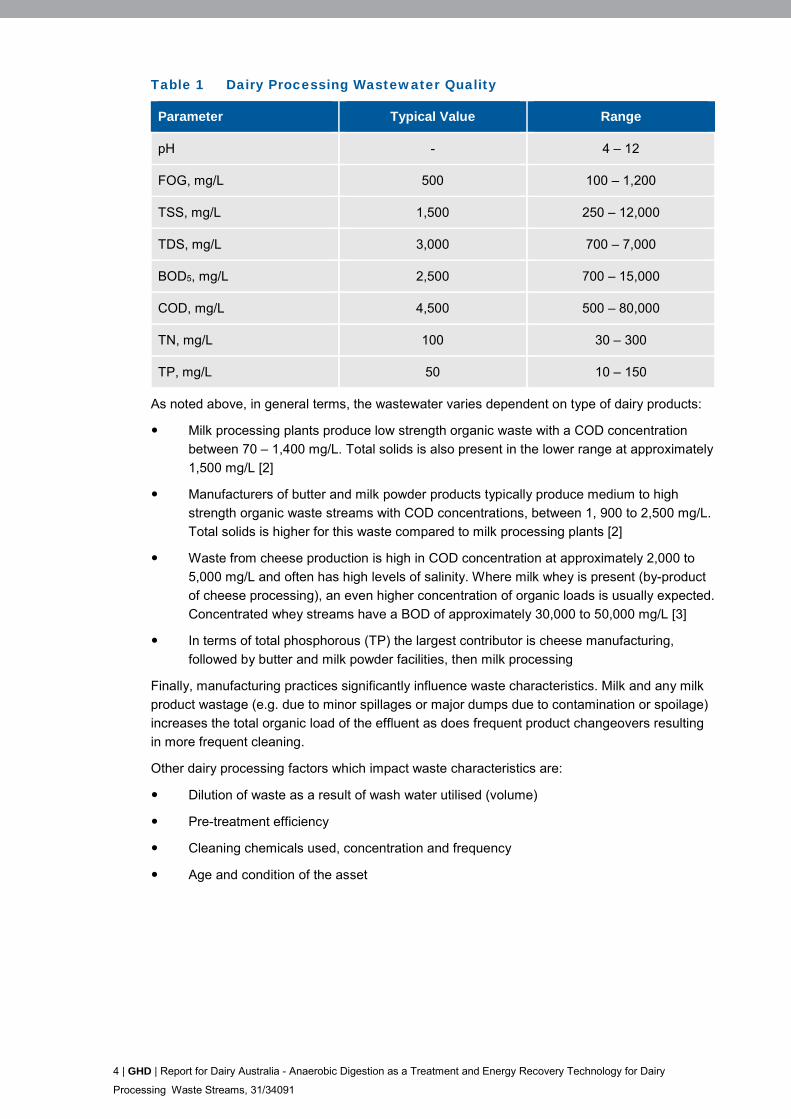
Table 1 Dairy Processing Wastewater Quality
Parameter Typical Value Range
pH - 4 – 12
FOG, mg/L 500 100 – 1,200
TSS, mg/L 1,500 250 – 12,000
TDS, mg/L 3,000 700 – 7,000
BOD5, mg/L 2,500 700 – 15,000
COD, mg/L 4,500 500 – 80,000
TN, mg/L 100 30 – 300
TP, mg/L 50 10 – 150
As noted above, in general terms, the wastewater varies dependent on type of dairy products:
Milk processing plants produce low strength organic waste with a COD concentration
between 70 – 1,400 mg/L. Total solids is also present in the lower range at approximately
1,500 mg/L [2]
Manufacturers of butter and milk powder products typically produce medium to high
strength organic waste streams with COD concentrations, between 1, 900 to 2,500 mg/L.
Total solids is higher for this waste compared to milk processing plants [2]
Waste from cheese production is high in COD concentration at approximately 2,000 to
5,000 mg/L and often has high levels of salinity. Where milk whey is present (by-product
of cheese processing), an even higher concentration of organic loads is usually expected.
Concentrated whey streams have a BOD of approximately 30,000 to 50,000 mg/L [3]
In terms of total phosphorous (TP) the largest contributor is cheese manufacturing,
followed by butter and milk powder facilities, then milk processing
Finally, manufacturing practices significantly influence waste characteristics. Milk and any milk
product wastage (e.g. due to minor spillages or major dumps due to contamination or spoilage)
increases the total organic load of the effluent as does frequent product changeovers resulting
in more frequent cleaning.
Other dairy processing factors which impact waste characteristics are:
Dilution of waste as a result of wash water utilised (volume)
Pre-treatment efficiency
Cleaning chemicals used, concentration and frequency
Age and condition of the asset
GHD | Report for Dairy Australia - Anaerobic Digestion as a Treatment and Energy Recovery Technology for Dairy
Processing Waste Streams, 31/34091 | 5
3. Review of Wastewater Disposal Routes and Discharge Requirements 3.1 Overview
This section outlines dairy wastewater / effluent disposal routes and guidelines governing the
discharge. Trade waste charges in various regions are summarised, and for comparison,
examples of trade waste charges incurred at two sites calculated.
3.2 Disposal routes
3.2.1 General
The treatment requirements of dairy processing wastewater will be determined by the ultimate
disposal route or end use of the used water. Disposal routes include:
Discharge to sewer
Discharge to surface water
Irrigation to agricultural land
On-site reuse (non-process, e.g., hosing down purposes, truck washing, process water
cooling and toilet flushing)
The most sustainable disposal route and associated level of treatment will, to a large extent, be
governed by the location of the facility. Location of the facility will dictate; a) the space available
for treatment infrastructure, b) availability of discharge options, c) discharge-related costs and d)
state based environmental regulations.
National and State based guideline documents should be consulted as they provide useful
guidance on effluent discharge targets as well as effluent management requirements such as
monitoring and reporting.
National Water Quality Management Strategy paper 16b, Wastewater Management
Guidelines for Dairy Processing Plants, 1999
Victoria EPA Environmental Guidelines for the Dairy Processing Industry, June 1997
New South Wales EPA Environmental Guidelines for the Use of Effluent by Irrigation,
2004
South Australian Reclaimed Effluent Reuse Guidelines (Department of Human Services
and Environmental Protection Agency, Government of South Australia), April 1999
Water Quality Protection Note 12, Dairy Processing Plants (Government of Western
Australia, Department of Water), November 2012
Guide to the Environmental Impact Assessment Process in the Northern Territory, March
2014
Farm Dairy Premises Effluent Management Code of Practice (Tasmanian Dairy Industry
Authority), May 2010
A brief discussion of the various disposal routes and typical quality and treatment requirements
is presented below.
6 | GHD | Report for Dairy Australia - Anaerobic Digestion as a Treatment and Energy Recovery Technology for Dairy
Processing Waste Streams, 31/34091
3.2.2 Discharge to sewer
Where feasible, discharge of wastewater to sewer is often considered an attractive option as it
principally reduces the business risks associated with wastewater management and disposal.
Disposal of wastewater to sewer is regulated by local councils or local water authorities (who
operate and maintain the sewerage system) and requires a permit for discharge.
The feasibility of the sewer disposal option is dependent on the following:
Location and availability of sewer connection to accept discharge
Wastewater characteristics permitted for discharge, which informs the level of treatment
required
The benefits to industry when discharging to sewer is to remove a regulatory and operational
load, whilst outsourcing the treatment and disposal to the local water authority who are
specialists in operating treatment plants.
Trade waste discharge does, however, involve costs to an industry – the extent of which
depends on the need for the water authority to upgrade facilities and extra operating costs they
might incur in accepting the waste stream. Typically, there will be a “headworks charge” (capital
contribution) if the systems require augmentation due to industry connection. There will also be
an on-going charge for volume and load (usually COD/ BOD, TSS, FOG). Many authorities may
also charge a fee based on the nutrient, sulphate and TDS loads of the wastewater.
The requirements for discharge to sewer are set out in a trade waste agreement between the
facility and the operating authority. The requirements will be determined by available or planned
systems’ capacity for the receiving sewers and treatment plant.
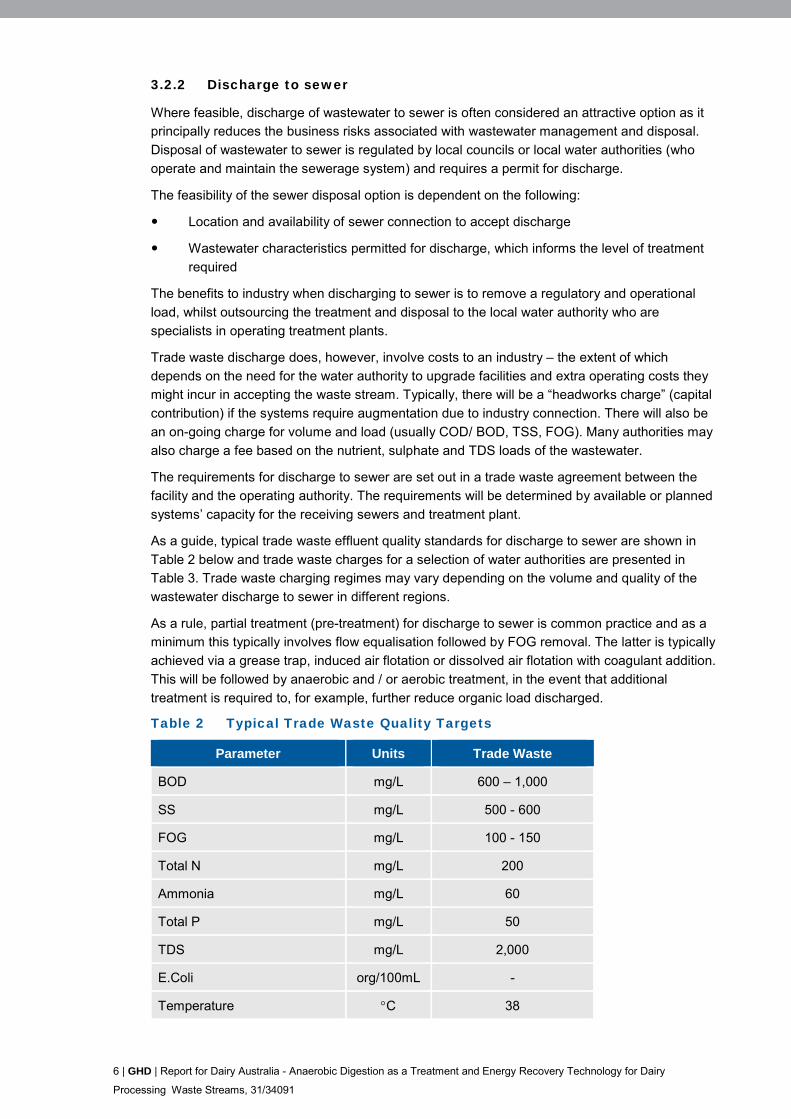
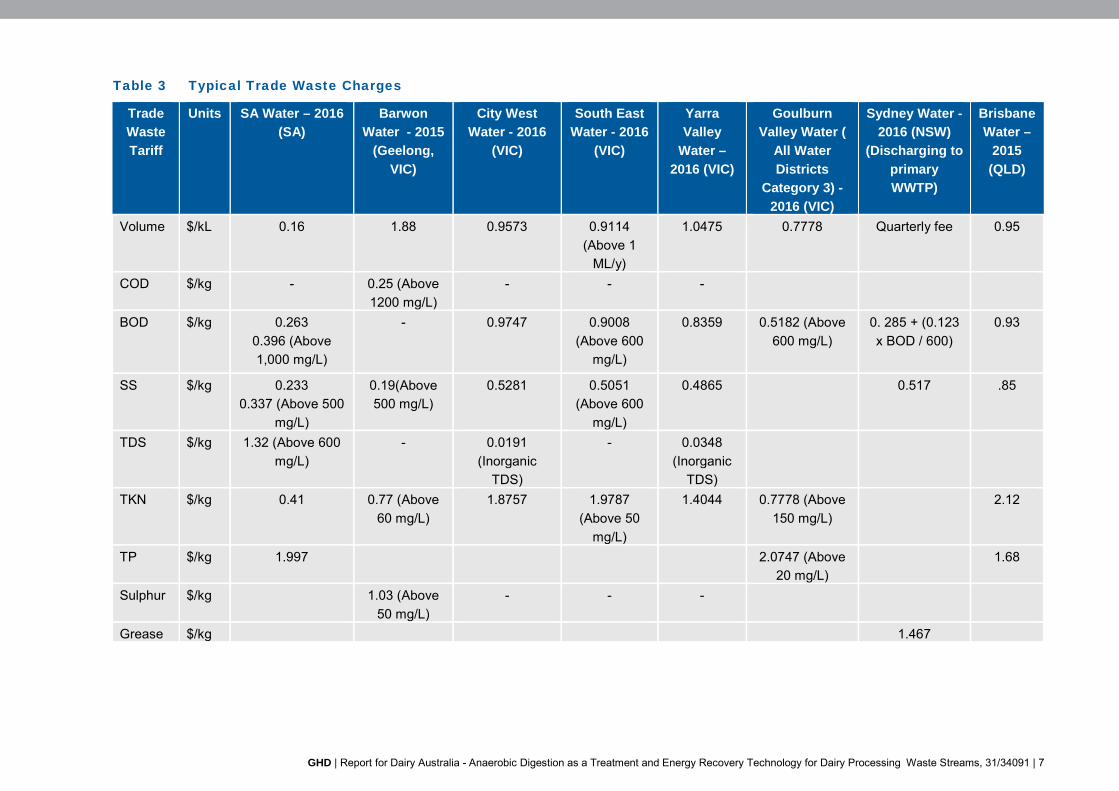
As a guide, typical trade waste effluent quality standards for discharge to sewer are shown in
Table 2 below and trade waste charges for a selection of water authorities are presented in
Table 3. Trade waste charging regimes may vary depending on the volume and quality of the
wastewater discharge to sewer in different regions.
As a rule, partial treatment (pre-treatment) for discharge to sewer is common practice and as a
minimum this typically involves flow equalisation followed by FOG removal. The latter is typically
achieved via a grease trap, induced air flotation or dissolved air flotation with coagulant addition.
This will be followed by anaerobic and / or aerobic treatment, in the event that additional
treatment is required to, for example, further reduce organic load discharged.
Table 2 Typical Trade Waste Quality Targets
Parameter Units Trade Waste
BOD mg/L 600 – 1,000
SS mg/L 500 - 600
FOG mg/L 100 - 150
Total N mg/L 200
Ammonia mg/L 60
Total P mg/L 50
TDS mg/L 2,000
E.Coli org/100mL -
Temperature C 38
GHD | Report for Dairy Australia - Anaerobic Digestion as a Treatment and Energy Recovery Technology for Dairy Processing Waste Streams, 31/34091 | 7
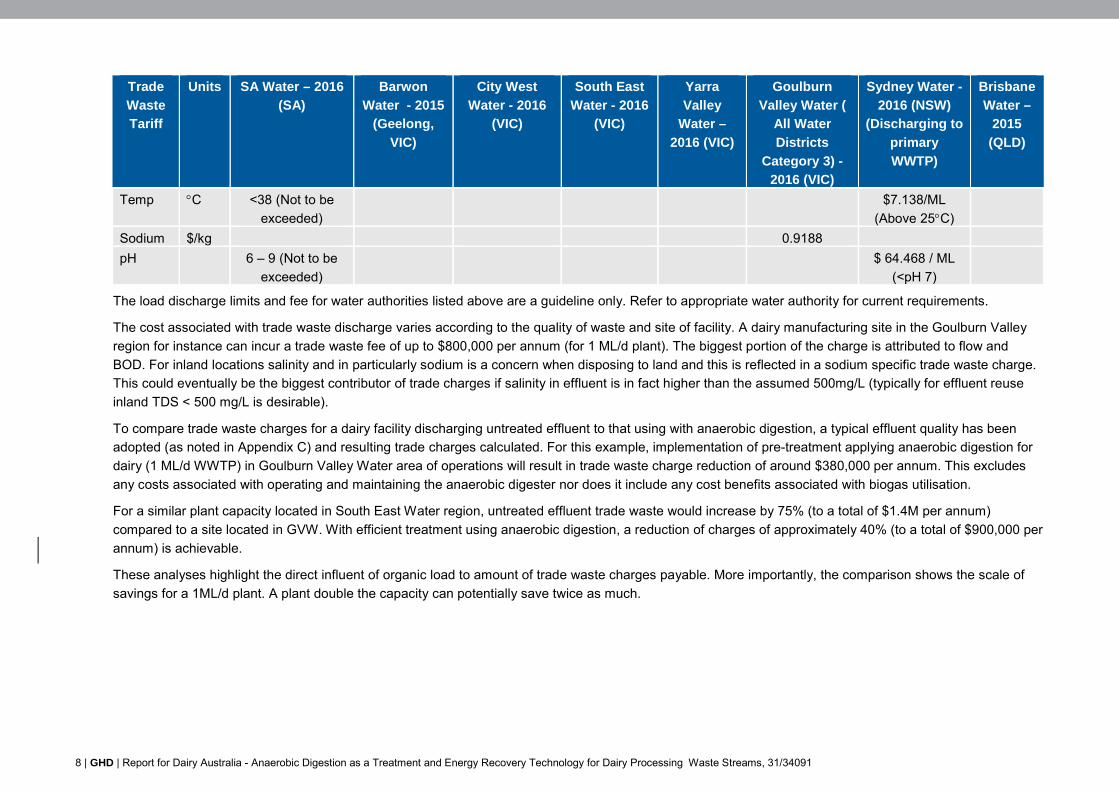
Table 3 Typical Trade Waste Charges
Trade
Waste
Tariff
Units SA Water – 2016
(SA)
Barwon
Water - 2015
(Geelong,
VIC)
City West
Water - 2016
(VIC)
South East
Water - 2016
(VIC)
Yarra
Valley
Water –
2016 (VIC)
Goulburn
Valley Water (
All Water
Districts
Category 3) -
2016 (VIC)
Sydney Water -
2016 (NSW)
(Discharging to
primary
WWTP)
Brisbane
Water –
2015
(QLD)
Volume $/kL 0.16 1.88 0.9573 0.9114
(Above 1
ML/y)
1.0475 0.7778 Quarterly fee 0.95
COD $/kg - 0.25 (Above
1200 mg/L)
- - -
BOD $/kg 0.263
0.396 (Above
1,000 mg/L)
- 0.9747 0.9008
(Above 600
mg/L)
0.8359 0.5182 (Above
600 mg/L)
0. 285 + (0.123
x BOD / 600)
0.93
SS $/kg 0.233
0.337 (Above 500
mg/L)
0.19(Above
500 mg/L)
0.5281 0.5051
(Above 600
mg/L)
0.4865 0.517 .85
TDS $/kg 1.32 (Above 600
mg/L)
- 0.0191
(Inorganic
TDS)
- 0.0348
(Inorganic
TDS)
TKN $/kg 0.41 0.77 (Above
60 mg/L)
1.8757 1.9787
(Above 50
mg/L)
1.4044 0.7778 (Above
150 mg/L)
2.12
TP $/kg 1.997 2.0747 (Above
20 mg/L)
1.68
Sulphur $/kg 1.03 (Above
50 mg/L)
- - -
Grease $/kg 1.467
8 | GHD | Report for Dairy Australia - Anaerobic Digestion as a Treatment and Energy Recovery Technology for Dairy Processing Waste Streams, 31/34091
Trade
Waste
Tariff
Units SA Water – 2016
(SA)
Barwon
Water - 2015
(Geelong,
VIC)
City West
Water - 2016
(VIC)
South East
Water - 2016
(VIC)
Yarra
Valley
Water –
2016 (VIC)
Goulburn
Valley Water (
All Water
Districts
Category 3) -
2016 (VIC)
Sydney Water -
2016 (NSW)
(Discharging to
primary
WWTP)
Brisbane
Water –
2015
(QLD)
Temp C <38 (Not to be
exceeded)
$7.138/ML
(Above 25C)
Sodium $/kg 0.9188
pH 6 – 9 (Not to be
exceeded)
$ 64.468 / ML
(<pH 7)
The load discharge limits and fee for water authorities listed above are a guideline only. Refer to appropriate water authority for current requirements.
The cost associated with trade waste discharge varies according to the quality of waste and site of facility. A dairy manufacturing site in the Goulburn Valley
region for instance can incur a trade waste fee of up to $800,000 per annum (for 1 ML/d plant). The biggest portion of the charge is attributed to flow and
BOD. For inland locations salinity and in particularly sodium is a concern when disposing to land and this is reflected in a sodium specific trade waste charge.
This could eventually be the biggest contributor of trade charges if salinity in effluent is in fact higher than the assumed 500mg/L (typically for effluent reuse
inland TDS < 500 mg/L is desirable).
To compare trade waste charges for a dairy facility discharging untreated effluent to that using with anaerobic digestion, a typical effluent quality has been
adopted (as noted in Appendix C) and resulting trade charges calculated. For this example, implementation of pre-treatment applying anaerobic digestion for
dairy (1 ML/d WWTP) in Goulburn Valley Water area of operations will result in trade waste charge reduction of around $380,000 per annum. This excludes
any costs associated with operating and maintaining the anaerobic digester nor does it include any cost benefits associated with biogas utilisation.
For a similar plant capacity located in South East Water region, untreated effluent trade waste would increase by 75% (to a total of $1.4M per annum)
compared to a site located in GVW. With efficient treatment using anaerobic digestion, a reduction of charges of approximately 40% (to a total of $900,000 per
annum) is achievable.
These analyses highlight the direct influent of organic load to amount of trade waste charges payable. More importantly, the comparison shows the scale of
savings for a 1ML/d plant. A plant double the capacity can potentially save twice as much.
GHD | Report for Dairy Australia - Anaerobic Digestion as a Treatment and Energy Recovery Technology for Dairy
Processing Waste Streams, 31/34091 | 9
3.2.3 Discharge to surface water
Discharge of treated water from dairy processing plants in Australia direct to surface water
bodies is not common. Treatment requirements for discharge to surface water will be
determined by local regulations and would typically involve a high level of treatment with
nitrogen and phosphorous removal and salt reduction. As a guide for inland water ways, nutrient
targets in treated wastewater are typically around TN of 5-10 mg/L and TP of less than 0.2
mg/L.
To achieve these targets extensive pre-treatment followed by biological nutrient removal and
tertiary filtration will be required. The pre-treatment stage could include anaerobic treatment to
reduce the aeration/energy requirements in the subsequent treatment steps.
Biological nutrient removal processes are designed to reduce nitrogen and phosphorous
concentrations. Phosphorus can also be reduced by chemical addition. However, biological
phosphorus reduction is often preferable as it saves on chemical cost and sludge disposal.
Chemical addition can be used successfully as a polishing step in conjunction or following
biological treatment.
Where required, salt reduction will add significant cost and generates a brine disposal problem.
3.2.4 Irrigation to agricultural land
Given that the majority of dairy processing plants are located in rural regions, a large proportion
(estimated to be >50%) of dairy processing effluent in Australia is applied to agricultural land.
However, there has been a growing concern within the dairy industry and regulators about the
sustainability of this practice. A key risk associated with the irrigation of agricultural land with
dairy wastewater is the build-up of nutrients particularly phosphorous and sodium. The latter can
severely impact crop growth and soil permeability. Where possible, a common practice to
manage salinity issues is to shandy the high salinity treated dairy wastewater with low salinity
water supplied by local district irrigation channels or pipes.
Dairy processing facilities which irrigate to agricultural land typically utilise a series of lagoon
treatment systems comprising mechanically aerated, facultative and winter storage lagoons.
Lagoon systems however are not effective in reducing nutrient and salt levels and an irrigation
management plan is required to ensure that sustainable irrigation is achieved. This includes
selection of appropriate crops to take up nutrients, crop rotation, application of gypsum,
shandying of saline water with low salinity irrigation water and other measures.
As a guide, typical industry irrigation effluent targets are:
BOD < 150 mg/L
BOD < 30 kg/ha.day
TN < 250 kg/yr (soil and crop dependent)
TP < 50 kg/yr (soil and crop dependent)
Salinity - preferably < 600 mg/L TDS (soil and crop dependent)
Heavy metals should not exceed a certain criteria (Australian and New Zealand
guidelines for fresh and marine water quality Appendix A, Reference 1)
The above are based on general criteria adopted by EPA’s for recycled effluent (municipal).
However, it should be noted that in some jurisdictions the EPA is accepting higher BOD values
e.g., 200 mg/L for dairy wastewaters subject to suitable local soil conditions and provided this
does not result in anaerobic conditions and odours. There are many other factors and

10 | GHD | Report for Dairy Australia - Anaerobic Digestion as a Treatment and Energy Recovery Technology for Dairy
Processing Waste Streams, 31/34091
parameters at play and a discussion of these is outside the scope of this report. For further
information, please refer to the appropriate guidelines and reference resources available in your
State or Territory.
3.2.5 On-site reuse
On-site reuse is typically limited to condensate recovery for use as boiler feedwater, CIP make
up water and wash down water (similar or better water quality to surface water discharge).
Although it is technically feasible to treat dairy wastewater to potable quality suitable for
unrestricted use, this is not practiced anywhere and is not considered as part of this study.
Table 4 presents waste quality standards for various discharge methods.
Table 4 Typical Effluent Quality Standards
Parameters Units Trade Waste Irrigation
(Standard
effluent reuse
guidelines)
Surface Water
Discharge
BOD mg/L 600 <150 10
SS mg/L 600 30 10
Total N mg/L 200 30 10
Ammonia mg/L 60 1
Total P mg/L 50 15 0.5
TDS mg/L 2,000 600 600
3.2.6 Treatment Requirements, Current and Leading practices
The treatment of dairy processing wastewater will largely be governed by the water quality
requirements stipulated by its end use.
In general terms, current dairy processing wastewater treatment practices will include a
combination of treatment units and steps, depending on the discharge route for the final treated
effluent. Current and leading practices are further discussed in Appendix C.
Anaerobic digestion is often one of the first stages of treatment for high BOD wastewaters
(which includes dairy) and is discussed in Section 4 below.
GHD | Report for Dairy Australia - Anaerobic Digestion as a Treatment and Energy Recovery Technology for Dairy
Processing Waste Streams, 31/34091 | 11
4. Anaerobic Digestion Technology Review 4.1 Overview
This section describes anaerobic digestion technologies to treat dairy processing wastewater
and presents advantages and disadvantages of each system. Some examples of commercial
installations of anaerobic systems in Australia and globally are also provided.
4.2 Background Digestion Theory
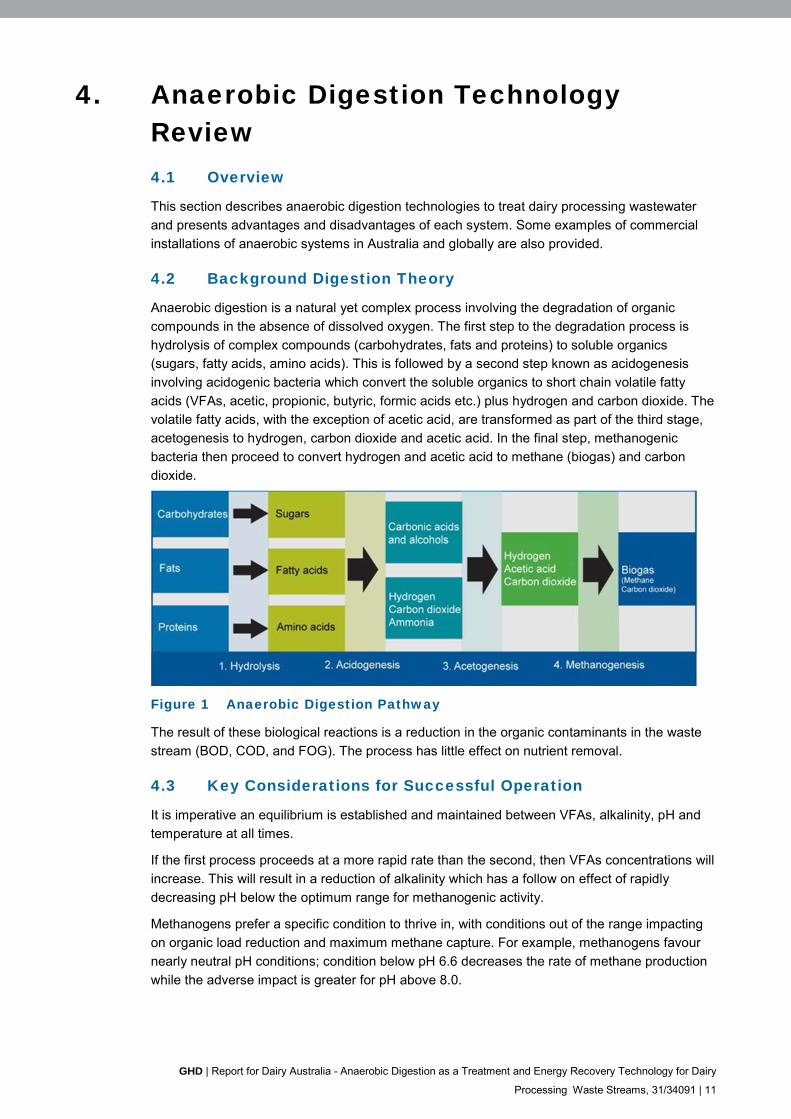
Anaerobic digestion is a natural yet complex process involving the degradation of organic
compounds in the absence of dissolved oxygen. The first step to the degradation process is
hydrolysis of complex compounds (carbohydrates, fats and proteins) to soluble organics
(sugars, fatty acids, amino acids). This is followed by a second step known as acidogenesis
involving acidogenic bacteria which convert the soluble organics to short chain volatile fatty
acids (VFAs, acetic, propionic, butyric, formic acids etc.) plus hydrogen and carbon dioxide. The
volatile fatty acids, with the exception of acetic acid, are transformed as part of the third stage,
acetogenesis to hydrogen, carbon dioxide and acetic acid. In the final step, methanogenic
bacteria then proceed to convert hydrogen and acetic acid to methane (biogas) and carbon
dioxide.
Figure 1 Anaerobic Digestion Pathway
The result of these biological reactions is a reduction in the organic contaminants in the waste
stream (BOD, COD, and FOG). The process has little effect on nutrient removal.
4.3 Key Considerations for Successful Operation
It is imperative an equilibrium is established and maintained between VFAs, alkalinity, pH and
temperature at all times.
If the first process proceeds at a more rapid rate than the second, then VFAs concentrations will
increase. This will result in a reduction of alkalinity which has a follow on effect of rapidly
decreasing pH below the optimum range for methanogenic activity.
Methanogens prefer a specific condition to thrive in, with conditions out of the range impacting
on organic load reduction and maximum methane capture. For example, methanogens favour
nearly neutral pH conditions; condition below pH 6.6 decreases the rate of methane production
while the adverse impact is greater for pH above 8.0.

12 | GHD | Report for Dairy Australia - Anaerobic Digestion as a Treatment and Energy Recovery Technology for Dairy
Processing Waste Streams, 31/34091
Alkalinity of the wastewater functions to provide buffering capacity and narrows down the range
of pH instability. This is particularly important during cleaning regimes at the dairy where acidic
solutions are introduced into the wastewater in batches.
Temperature also plays an important role by enhancing the rate of formation of methane.
Anaerobic digestion can occur in three temperature ranges, psychrophilic (ambient - 20C),
mesophilic (24C - 45C) and thermophilic (45C - 60C). Anaerobic digestion in the
psychrophilic range is not commonly used for the treatment of industrial wastewater (including
dairy)
As a general rule, anaerobic digestion in the mesophilic temperature range is the most common.
(optimum of 45C). The higher temperature promotes bacterial activity and increases the
reaction kinetics and the conversion of organics to methane, thus effectively reducing the
reactor volume required. Digester temperature beyond optimum values decrease bacteria
growth rapidly and ultimately causes bacteria die-off (50C for mesophilic and 70C for
thermophilic).
Dairy processing wastewater streams are typically warm (around 40°C) which lends itself for
anaerobic treatment in the ideal temperature range.
Feed lower than 10C should be avoided as it inhibits bacteria activity and digestion ceases to
function below about 15oC (mesophilic) and 20oC (thermophilic).
Typical rate limiting characteristics of anaerobic microorganisms are provided in Table 5.
Table 5 Anaerobic Digestion Operating Range
Parameter Units Optimum Range [4] Extreme Range [4]
Temperature C 30 – 35 25 – 40
pH - 6.6 – 7.6 6.2 – 8.0
Alkalinity mg/L as CaCO3 2,000 – 3,000 1,000 – 5,000
Volatile Fatty Acids (VFA) mg/L as acetic acid 50 – 500 2,000
4.4 Drivers for Anaerobic Treatment
The drivers for implementing anaerobic treatment are often a combination of several factors. In
reviewing some of the case studies, it is apparent that selection of anaerobic treatment may be
driven by the following factors:
High trade waste discharge fees
High electricity/gas costs
High waste strength (and associated odour)
Potential carbon credits from capturing methane
High renewable energy production incentives
Government co-funding.
4.5 Review of Anaerobic Digestion Options
4.5.1 Overview
Anaerobic digestion systems can be categorised on the basis of hydraulic retention time (HRT),
solids retention time (SRT) and/or organic loading rate. Typically, a minimum SRT of 10-15 days
is required. For low rate systems the HRT= SRT but high rate systems decouple the SRT from
HRT by maintaining anaerobic bacteria in the treatment tank. This is typically achieved through,
GHD | Report for Dairy Australia - Anaerobic Digestion as a Treatment and Energy Recovery Technology for Dairy
Processing Waste Streams, 31/34091 | 13
Growing bacteria in a rapid settling granule
Growing them on a fixed film media or
Using baffles or membranes or recycling to retain them in the reactor.
As a broad guide anaerobic digestion systems fall into the following categories (shown with
indicative hydraulic retention times):
Anaerobic lagoon systems (20-40 HRT);
Conventional constructed reactor systems (15–20 HRT);
High rate anaerobic systems (1-2 HRT).
Anaerobic lagoons involve long detention time and high volumetric requirements. High rate
systems were developed to try to overcome these disadvantages for locations with limited
space. By increasing the rate at which digestion of the organic material occurs, the detention
time required within the digestion system decreases, thereby reducing digester volume
requirements and overall footprint. Higher rate systems are therefore significantly more
compact than lagoons although it should be noted that installations may be up to 15m tall, so
have a high visual impact.
Unfortunately, many high rates systems, despite their smaller footprint, are not suitable to dairy
processing wastewater without prior removal of high solids and / or FOG content. High rate
systems rely on easy passage of highly soluble waste compounds through the granular medium
to enable appropriate contact with the biomass. High fats and solids, if not removed, will
interfere with that operation and lead to a highly unstable operating regime (high VFA’s and
potentially ultimate failure of the anaerobic process).
There is a wide range of proprietary anaerobic systems available on the market, which can be
confusing as to the capability and process limitations of the system. While some new systems
may have been trialed at pilot scale, actual operating conditions and effluent targets are not
representative of results for every dairy waste stream.
Given that there is always a process risk when adopting any treatment, system for
implementation, it is recommended that only technologies that are currently installed (and
operating successfully) be further explored. The list of these proven systems and short
description of each technology is provided in the following section.
Table 6 Known Anaerobic Digestion Categories Applied to Dairy Processing
Systems Anaerobic Digestion
Technology
Location Applied
Anaerobic Lagoon Systems Uncovered Anaerobic Lagoons
(AL)
Asia
Covered Anaerobic Lagoons
(CAL)
Australia/USA/China
Conventional Systems Constructed above ground
digestion tanks (mixed or plug
flow)
World wide
High Rate Systems
(Engineered)
Anaerobic Flotation Reactor
(AFR)
US, Europe
Upflow Anaerobic Sludge
Blanket (UASB)
Limited

14 | GHD | Report for Dairy Australia - Anaerobic Digestion as a Treatment and Energy Recovery Technology for Dairy
Processing Waste Streams, 31/34091
Systems Anaerobic Digestion
Technology
Location Applied
Emerging Systems Anaerobic Membrane
Bioreactor (AnMBR)
NA
4.5.2 Uncovered Anaerobic Lagoons (AL)
Traditional uncovered anaerobic lagoons are more common than covered lagoons in a number
of industries (which is really a reflection of the age of the facility and costs associated with
covers - the advent of HDPE covers only being a relatively recent application). Generally, the
FOG which are present in the dairy processing wastewater accumulate to form a layer, creating
a natural cover, which controls odour to some extent. This method is cheaper, requires less
maintenance than CALs and is a well-established and widely used method. However, no gas
recovery potential is realised. Dependent on the concentration of fats and the industry type, a
fat layer cover can take months to form and initial odours can be an issue, until crust formation.
It should be noted that modern practice for dairy wastewater does not generally include
uncovered lagoons for the above reasons.
Figure 2 Uncovered Anaerobic Lagoon (Juice factory)
4.5.3 Covered Anaerobic Lagoon (CAL)
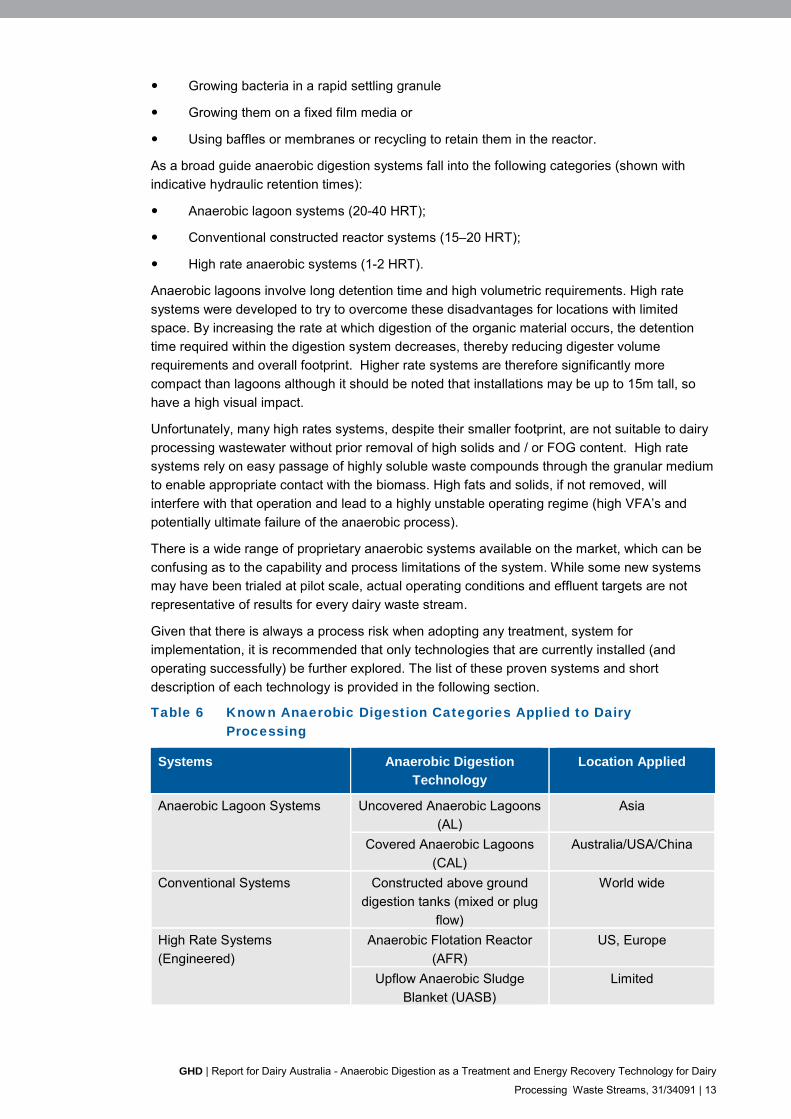
The Covered Anaerobic Lagoon (CAL) comprises a lagoon system with a purpose built cover
over the entire surface area which captures the biogas, eliminates odours and assists
somewhat in reducing heat loss. The term CAL is often interchangeable with the term HRAL
which stands for a High Rate Anaerobic lagoon. The term HRAL was first coined in the mid 90’s
and specifically referred to a compact two compartment covered anaerobic lagoon, often
containing recycle streams and sludge extraction systems. The aim was to introduce better
contact between biomass and waste to reduce the retention time. The first compartment would
be designed to contain a sludge layer up to several metres thick. The feed would be introduced
at various locations at the bottom of the lagoon to maximize contact between the incoming feed
and the active anaerobic biomass. Biomass carried over into the second compartment would
settle out and some systems where designed to extract the settled sludge in situ and return this
to the first compartment. This system was typically designed around a hydraulic retention time
of 6 to 10 days as distinct from systems which were designed to achieve 12-20 days’ retention.
To avoid confusion for the reader, given the subtle differences, in this document the more
generic term CAL will be used to mean also a HRAL or other similarly covered anaerobic
lagoons.
GHD | Report for Dairy Australia - Anaerobic Digestion as a Treatment and Energy Recovery Technology for Dairy
Processing Waste Streams, 31/34091 | 15
Figure 3 Covered Lagoon (Biodiesel Plant)
4.5.4 Constructed Digestion Tank Reactors
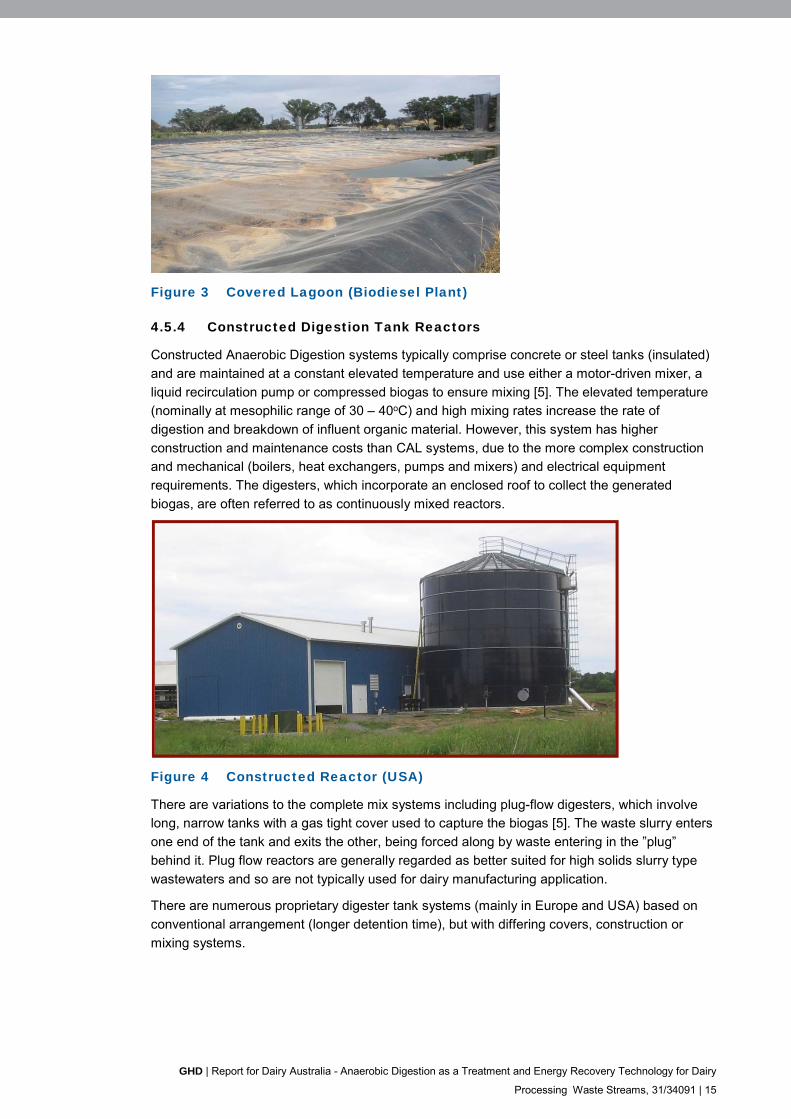
Constructed Anaerobic Digestion systems typically comprise concrete or steel tanks (insulated)
and are maintained at a constant elevated temperature and use either a motor-driven mixer, a
liquid recirculation pump or compressed biogas to ensure mixing [5]. The elevated temperature
(nominally at mesophilic range of 30 – 40oC) and high mixing rates increase the rate of
digestion and breakdown of influent organic material. However, this system has higher
construction and maintenance costs than CAL systems, due to the more complex construction
and mechanical (boilers, heat exchangers, pumps and mixers) and electrical equipment
requirements. The digesters, which incorporate an enclosed roof to collect the generated
biogas, are often referred to as continuously mixed reactors.
Figure 4 Constructed Reactor (USA)
There are variations to the complete mix systems including plug-flow digesters, which involve
long, narrow tanks with a gas tight cover used to capture the biogas [5]. The waste slurry enters
one end of the tank and exits the other, being forced along by waste entering in the ”plug”
behind it. Plug flow reactors are generally regarded as better suited for high solids slurry type
wastewaters and so are not typically used for dairy manufacturing application.
There are numerous proprietary digester tank systems (mainly in Europe and USA) based on
conventional arrangement (longer detention time), but with differing covers, construction or
mixing systems.
16 | GHD | Report for Dairy Australia - Anaerobic Digestion as a Treatment and Energy Recovery Technology for Dairy
Processing Waste Streams, 31/34091
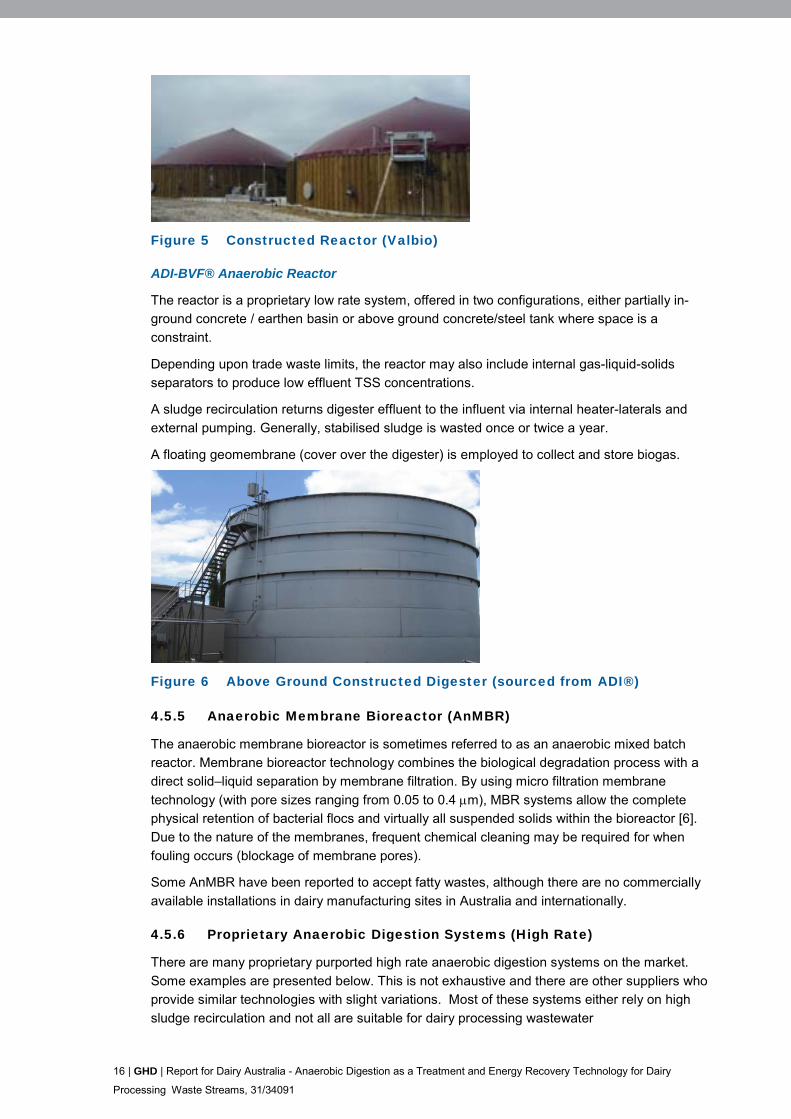
Figure 5 Constructed Reactor (Valbio)
ADI-BVF® Anaerobic Reactor
The reactor is a proprietary low rate system, offered in two configurations, either partially in-
ground concrete / earthen basin or above ground concrete/steel tank where space is a
constraint.
Depending upon trade waste limits, the reactor may also include internal gas-liquid-solids
separators to produce low effluent TSS concentrations.
A sludge recirculation returns digester effluent to the influent via internal heater-laterals and
external pumping. Generally, stabilised sludge is wasted once or twice a year.
A floating geomembrane (cover over the digester) is employed to collect and store biogas.
Figure 6 Above Ground Constructed Digester (sourced from ADI®)
4.5.5 Anaerobic Membrane Bioreactor (AnMBR)
The anaerobic membrane bioreactor is sometimes referred to as an anaerobic mixed batch
reactor. Membrane bioreactor technology combines the biological degradation process with a
direct solid–liquid separation by membrane filtration. By using micro filtration membrane
technology (with pore sizes ranging from 0.05 to 0.4 m), MBR systems allow the complete
physical retention of bacterial flocs and virtually all suspended solids within the bioreactor [6].
Due to the nature of the membranes, frequent chemical cleaning may be required for when
fouling occurs (blockage of membrane pores).
Some AnMBR have been reported to accept fatty wastes, although there are no commercially
available installations in dairy manufacturing sites in Australia and internationally.
4.5.6 Proprietary Anaerobic Digestion Systems (High Rate)
There are many proprietary purported high rate anaerobic digestion systems on the market.
Some examples are presented below. This is not exhaustive and there are other suppliers who
provide similar technologies with slight variations. Most of these systems either rely on high
sludge recirculation and not all are suitable for dairy processing wastewater
GHD | Report for Dairy Australia - Anaerobic Digestion as a Treatment and Energy Recovery Technology for Dairy
Processing Waste Streams, 31/34091 | 17
While several suppliers have apparently implemented systems at dairy wastewater sites, it
should be noted that details of pre-treatment and operational performance are somewhat scant.
As noted above, high rate systems are regarded as having limited application to typical dairy
wastewaters due to the grease content, although may be applicable if the grease has been
removed upstream.
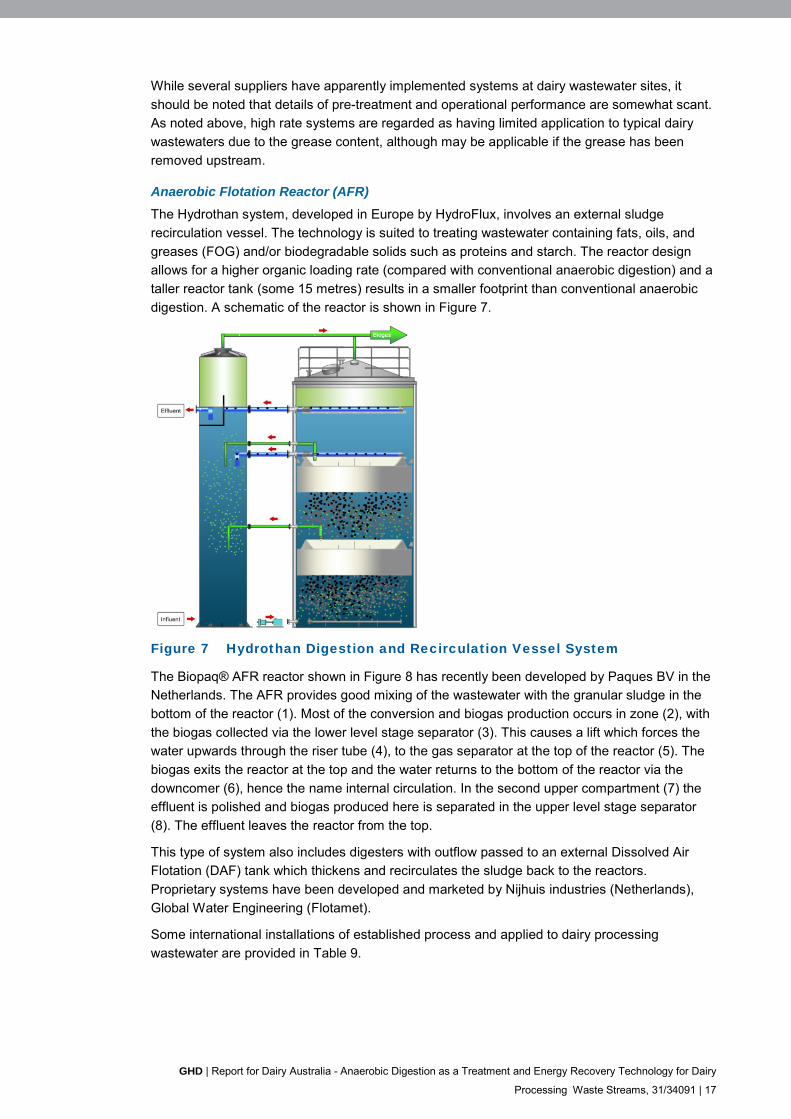
Anaerobic Flotation Reactor (AFR)
The Hydrothan system, developed in Europe by HydroFlux, involves an external sludge
recirculation vessel. The technology is suited to treating wastewater containing fats, oils, and
greases (FOG) and/or biodegradable solids such as proteins and starch. The reactor design
allows for a higher organic loading rate (compared with conventional anaerobic digestion) and a
taller reactor tank (some 15 metres) results in a smaller footprint than conventional anaerobic
digestion. A schematic of the reactor is shown in Figure 7.
Figure 7 Hydrothan Digestion and Recirculation Vessel System
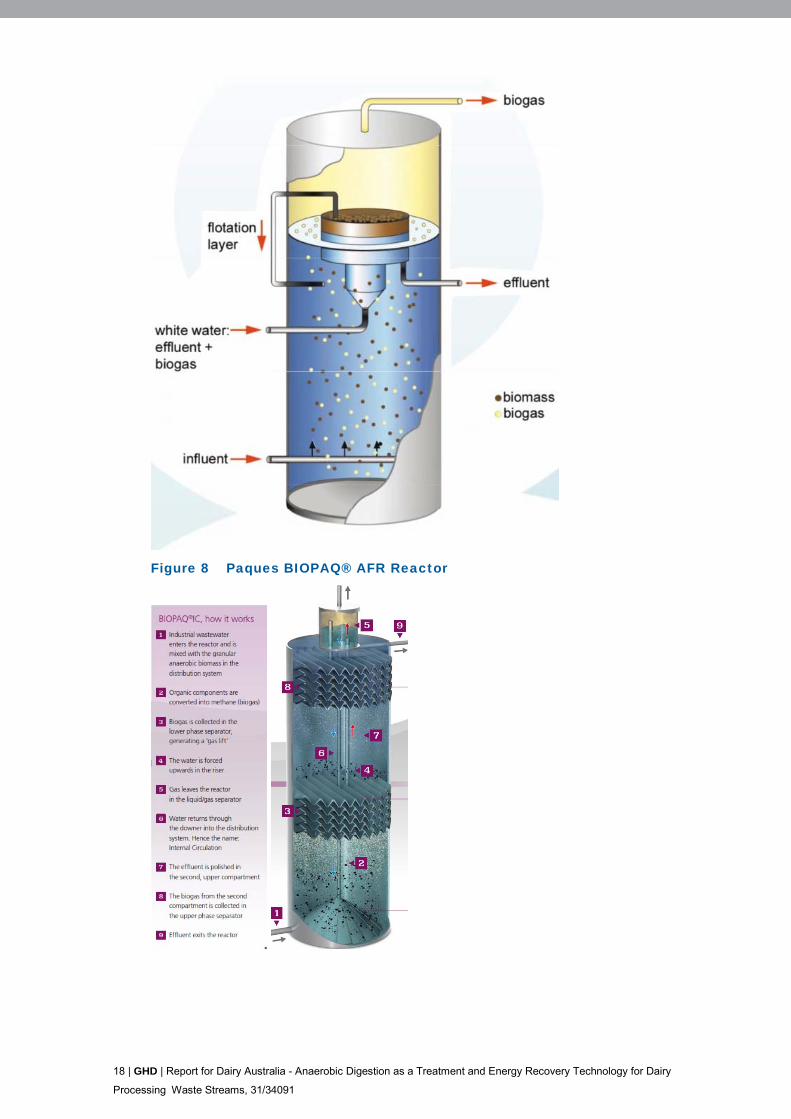
The Biopaq® AFR reactor shown in Figure 8 has recently been developed by Paques BV in the
Netherlands. The AFR provides good mixing of the wastewater with the granular sludge in the
bottom of the reactor (1). Most of the conversion and biogas production occurs in zone (2), with
the biogas collected via the lower level stage separator (3). This causes a lift which forces the
water upwards through the riser tube (4), to the gas separator at the top of the reactor (5). The
biogas exits the reactor at the top and the water returns to the bottom of the reactor via the
downcomer (6), hence the name internal circulation. In the second upper compartment (7) the
effluent is polished and biogas produced here is separated in the upper level stage separator
(8). The effluent leaves the reactor from the top.
This type of system also includes digesters with outflow passed to an external Dissolved Air
Flotation (DAF) tank which thickens and recirculates the sludge back to the reactors.
Proprietary systems have been developed and marketed by Nijhuis industries (Netherlands),
Global Water Engineering (Flotamet).
Some international installations of established process and applied to dairy processing
wastewater are provided in Table 9.
18 | GHD | Report for Dairy Australia - Anaerobic Digestion as a Treatment and Energy Recovery Technology for Dairy
Processing Waste Streams, 31/34091
Figure 8 Paques BIOPAQ® AFR Reactor
GHD | Report for Dairy Australia - Anaerobic Digestion as a Treatment and Energy Recovery Technology for Dairy
Processing Waste Streams, 31/34091 | 19
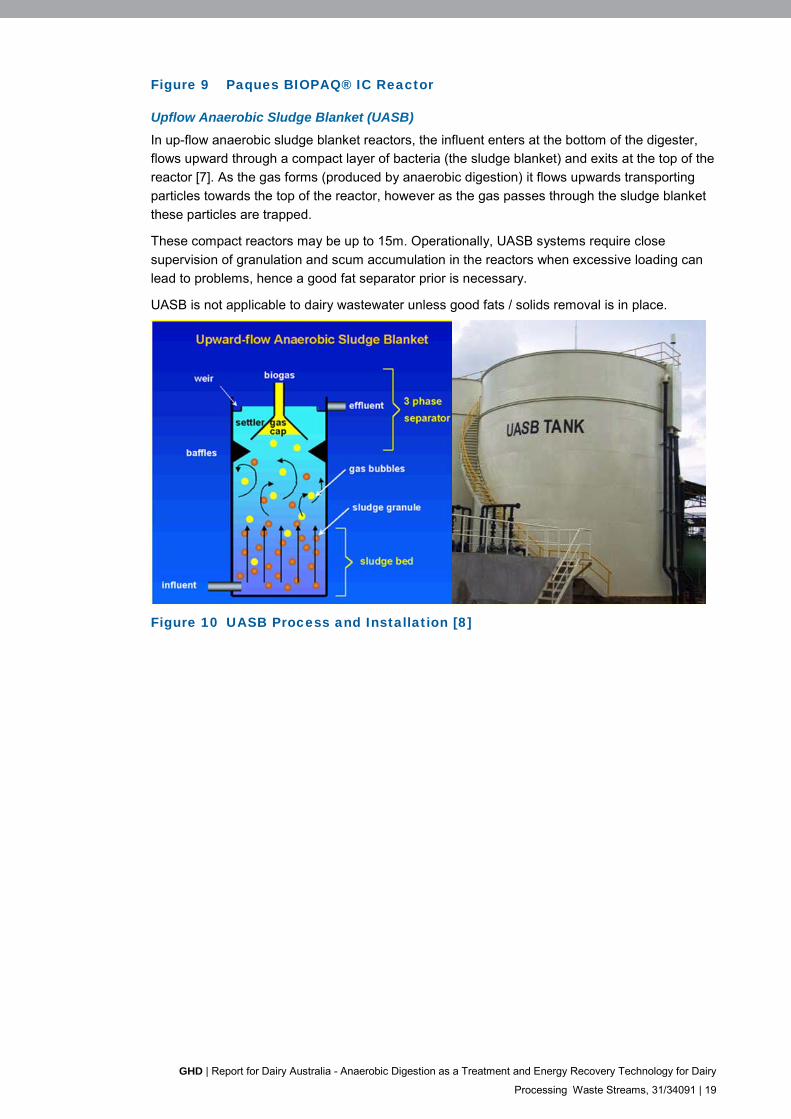
Figure 9 Paques BIOPAQ® IC Reactor
Upflow Anaerobic Sludge Blanket (UASB)
In up-flow anaerobic sludge blanket reactors, the influent enters at the bottom of the digester,
flows upward through a compact layer of bacteria (the sludge blanket) and exits at the top of the
reactor [7]. As the gas forms (produced by anaerobic digestion) it flows upwards transporting
particles towards the top of the reactor, however as the gas passes through the sludge blanket
these particles are trapped.
These compact reactors may be up to 15m. Operationally, UASB systems require close
supervision of granulation and scum accumulation in the reactors when excessive loading can
lead to problems, hence a good fat separator prior is necessary.
UASB is not applicable to dairy wastewater unless good fats / solids removal is in place.
Figure 10 UASB Process and Installation [8]
20 | GHD | Report for Dairy Australia - Anaerobic Digestion as a Treatment and Energy Recovery Technology for Dairy Processing Waste Streams, 31/34091
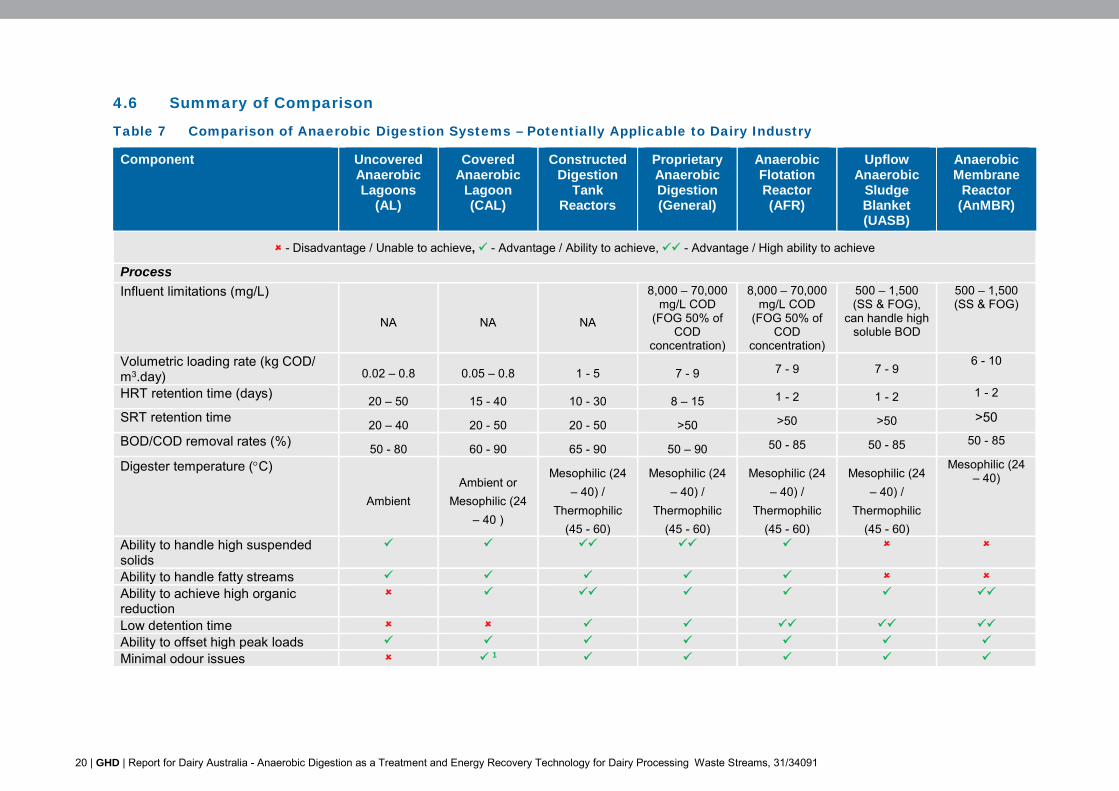
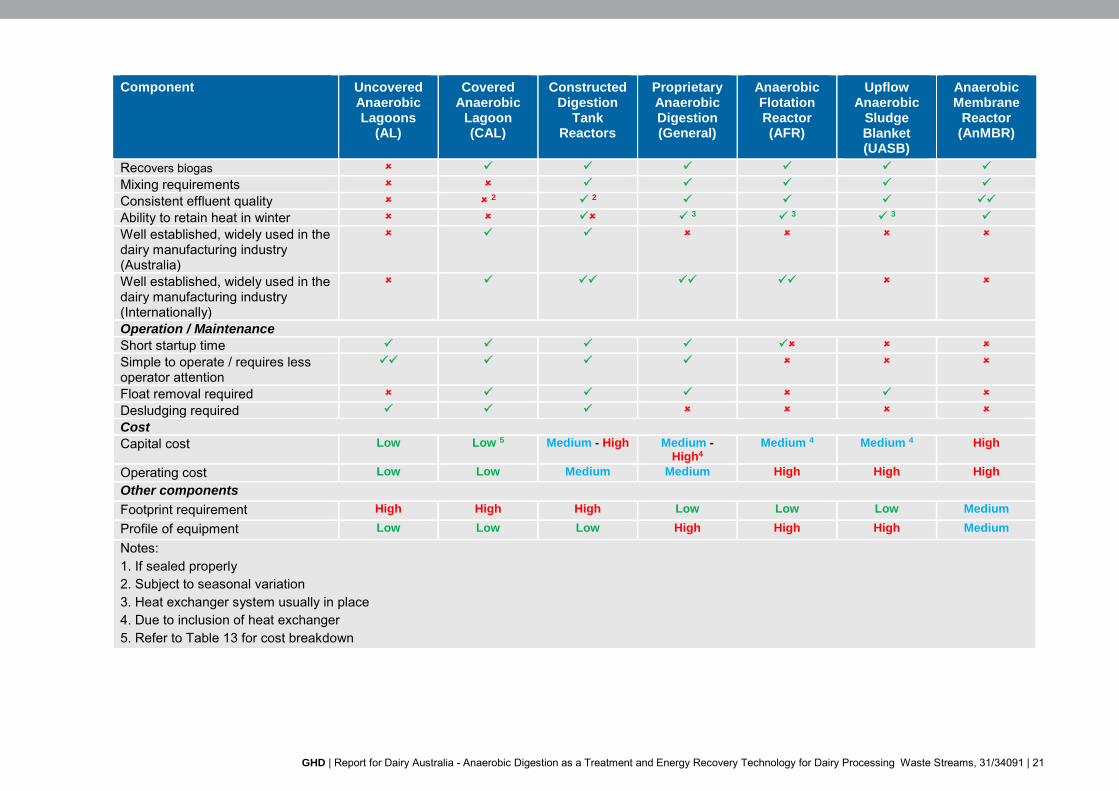
4.6 Summary of Comparison
Table 7 Comparison of Anaerobic Digestion Systems – Potentially Applicable to Dairy Industry
Component Uncovered Anaerobic Lagoons
(AL)
Covered Anaerobic
Lagoon (CAL)
Constructed Digestion
Tank Reactors
Proprietary Anaerobic Digestion (General)
Anaerobic Flotation Reactor (AFR)
Upflow Anaerobic
Sludge Blanket (UASB)
Anaerobic Membrane
Reactor (AnMBR)
- Disadvantage / Unable to achieve, - Advantage / Ability to achieve, - Advantage / High ability to achieve
Process
Influent limitations (mg/L)
NA NA NA
8,000 – 70,000 mg/L COD
(FOG 50% of COD
concentration)
8,000 – 70,000 mg/L COD
(FOG 50% of COD
concentration)
500 – 1,500 (SS & FOG),
can handle high soluble BOD
500 – 1,500 (SS & FOG)
Volumetric loading rate (kg COD/ m3.day) 0.02 – 0.8 0.05 – 0.8 1 - 5 7 - 9 7 - 9 7 - 9
6 - 10
HRT retention time (days) 20 – 50 15 - 40 10 - 30 8 – 15 1 - 2 1 - 2 1 - 2
SRT retention time 20 – 40 20 - 50 20 - 50 >50 >50 >50 >50
BOD/COD removal rates (%) 50 - 80 60 - 90 65 - 90 50 – 90 50 - 85 50 - 85 50 - 85
Digester temperature (C)
Ambient
Ambient or
Mesophilic (24
– 40 )
Mesophilic (24
– 40) /
Thermophilic
(45 - 60)
Mesophilic (24
– 40) /
Thermophilic
(45 - 60)
Mesophilic (24
– 40) /
Thermophilic
(45 - 60)
Mesophilic (24
– 40) /
Thermophilic
(45 - 60)
Mesophilic (24 – 40)
Ability to handle high suspended solids
Ability to handle fatty streams
Ability to achieve high organic reduction
Low detention time Ability to offset high peak loads Minimal odour issues 1
GHD | Report for Dairy Australia - Anaerobic Digestion as a Treatment and Energy Recovery Technology for Dairy Processing Waste Streams, 31/34091 | 21
Component Uncovered Anaerobic Lagoons
(AL)
Covered Anaerobic
Lagoon (CAL)
Constructed Digestion
Tank Reactors
Proprietary Anaerobic Digestion (General)
Anaerobic Flotation Reactor (AFR)
Upflow Anaerobic
Sludge Blanket (UASB)
Anaerobic Membrane
Reactor (AnMBR)
Recovers biogas
Mixing requirements
Consistent effluent quality 2 2
Ability to retain heat in winter 3 3 3
Well established, widely used in the dairy manufacturing industry (Australia)
Well established, widely used in the dairy manufacturing industry (Internationally)
Operation / Maintenance Short startup time
Simple to operate / requires less operator attention
Float removal required
Desludging required Cost Capital cost Low Low 5 Medium - High Medium -
High4 Medium 4 Medium 4 High
Operating cost Low Low Medium Medium High High High
Other components
Footprint requirement High High High Low Low Low Medium
Profile of equipment Low Low Low High High High Medium
Notes: 1. If sealed properly 2. Subject to seasonal variation 3. Heat exchanger system usually in place 4. Due to inclusion of heat exchanger 5. Refer to Table 13 for cost breakdown
22 | GHD | Report for Dairy Australia - Anaerobic Digestion as a Treatment and Energy Recovery Technology for Dairy Processing Waste Streams, 31/34091
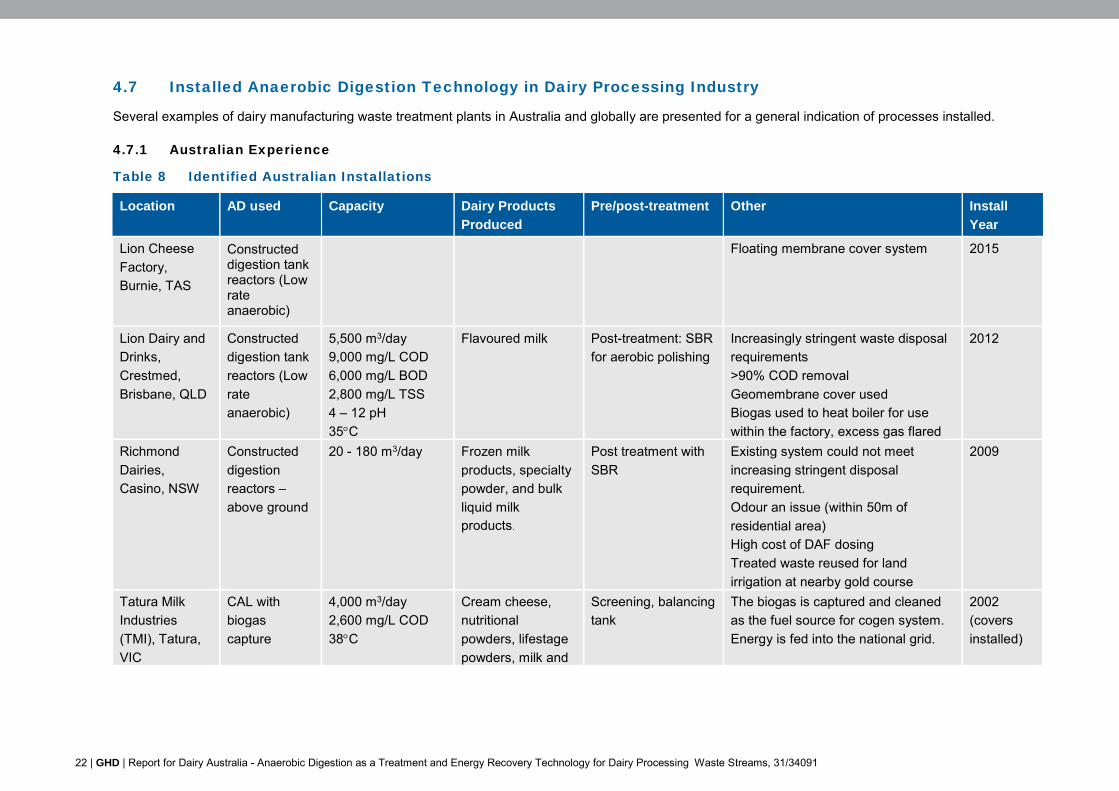
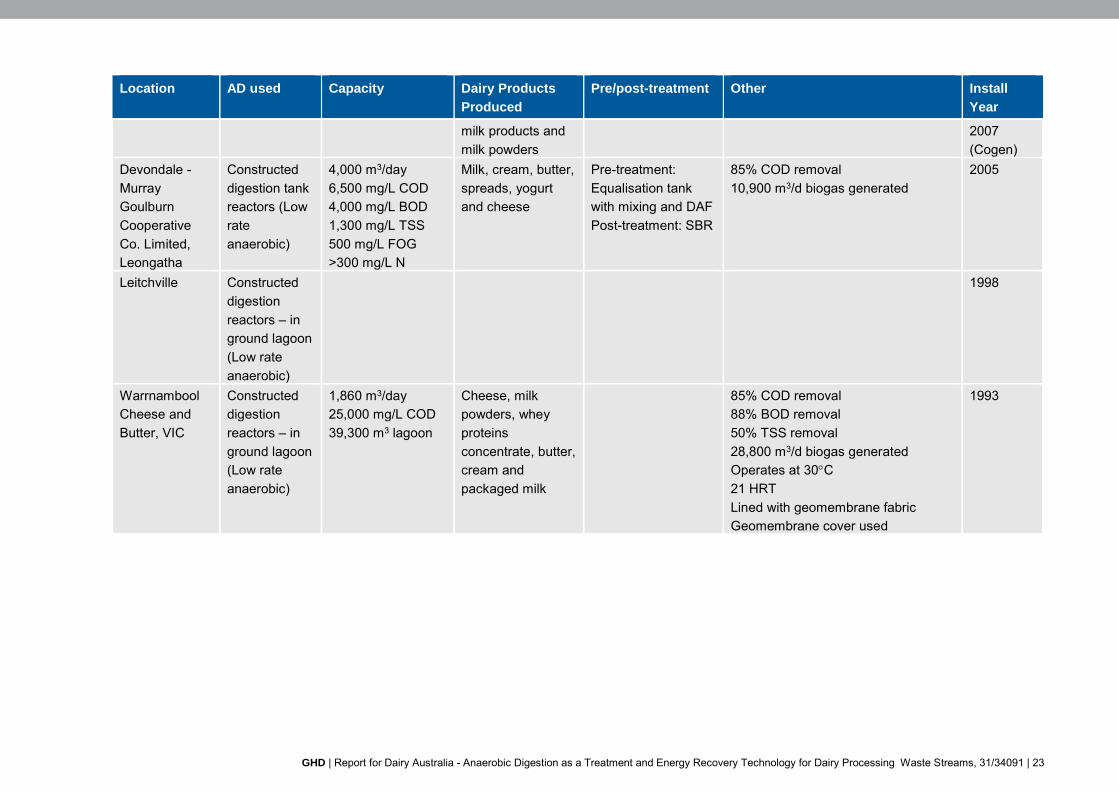
4.7 Installed Anaerobic Digestion Technology in Dairy Processing Industry
Several examples of dairy manufacturing waste treatment plants in Australia and globally are presented for a general indication of processes installed.
4.7.1 Australian Experience
Table 8 Identified Australian Installations
Location AD used Capacity Dairy Products
Produced
Pre/post-treatment Other Install
Year
Lion Cheese
Factory,
Burnie, TAS
Constructed digestion tank reactors (Low rate anaerobic)
Floating membrane cover system 2015
Lion Dairy and
Drinks,
Crestmed,
Brisbane, QLD
Constructed
digestion tank
reactors (Low
rate
anaerobic)
5,500 m3/day
9,000 mg/L COD
6,000 mg/L BOD
2,800 mg/L TSS
4 – 12 pH
35C
Flavoured milk Post-treatment: SBR
for aerobic polishing
Increasingly stringent waste disposal
requirements
>90% COD removal
Geomembrane cover used
Biogas used to heat boiler for use
within the factory, excess gas flared
2012
Richmond
Dairies,
Casino, NSW
Constructed
digestion
reactors –
above ground
20 - 180 m3/day Frozen milk
products, specialty
powder, and bulk
liquid milk products.
Post treatment with
SBR
Existing system could not meet
increasing stringent disposal
requirement.
Odour an issue (within 50m of
residential area)
High cost of DAF dosing
Treated waste reused for land
irrigation at nearby gold course
2009
Tatura Milk
Industries
(TMI), Tatura,
VIC
CAL with
biogas
capture
4,000 m3/day
2,600 mg/L COD
38C
Cream cheese,
nutritional
powders, lifestage
powders, milk and
Screening, balancing
tank
The biogas is captured and cleaned
as the fuel source for cogen system.
Energy is fed into the national grid.
2002
(covers
installed)
GHD | Report for Dairy Australia - Anaerobic Digestion as a Treatment and Energy Recovery Technology for Dairy Processing Waste Streams, 31/34091 | 23
Location AD used Capacity Dairy Products
Produced
Pre/post-treatment Other Install
Year
milk products and
milk powders
2007
(Cogen)
Devondale -
Murray
Goulburn
Cooperative
Co. Limited,
Leongatha
Constructed
digestion tank
reactors (Low
rate
anaerobic)
4,000 m3/day
6,500 mg/L COD
4,000 mg/L BOD
1,300 mg/L TSS
500 mg/L FOG
>300 mg/L N
Milk, cream, butter,
spreads, yogurt
and cheese
Pre-treatment:
Equalisation tank
with mixing and DAF
Post-treatment: SBR
85% COD removal
10,900 m3/d biogas generated
2005
Leitchville Constructed
digestion
reactors – in
ground lagoon
(Low rate
anaerobic)
1998
Warrnambool
Cheese and
Butter, VIC
Constructed
digestion
reactors – in
ground lagoon
(Low rate
anaerobic)
1,860 m3/day
25,000 mg/L COD
39,300 m3 lagoon
Cheese, milk
powders, whey
proteins
concentrate, butter,
cream and
packaged milk
85% COD removal
88% BOD removal
50% TSS removal
28,800 m3/d biogas generated
Operates at 30C
21 HRT
Lined with geomembrane fabric
Geomembrane cover used
1993
24 | GHD | Report for Dairy Australia - Anaerobic Digestion as a Treatment and Energy Recovery Technology for Dairy Processing Waste Streams, 31/34091
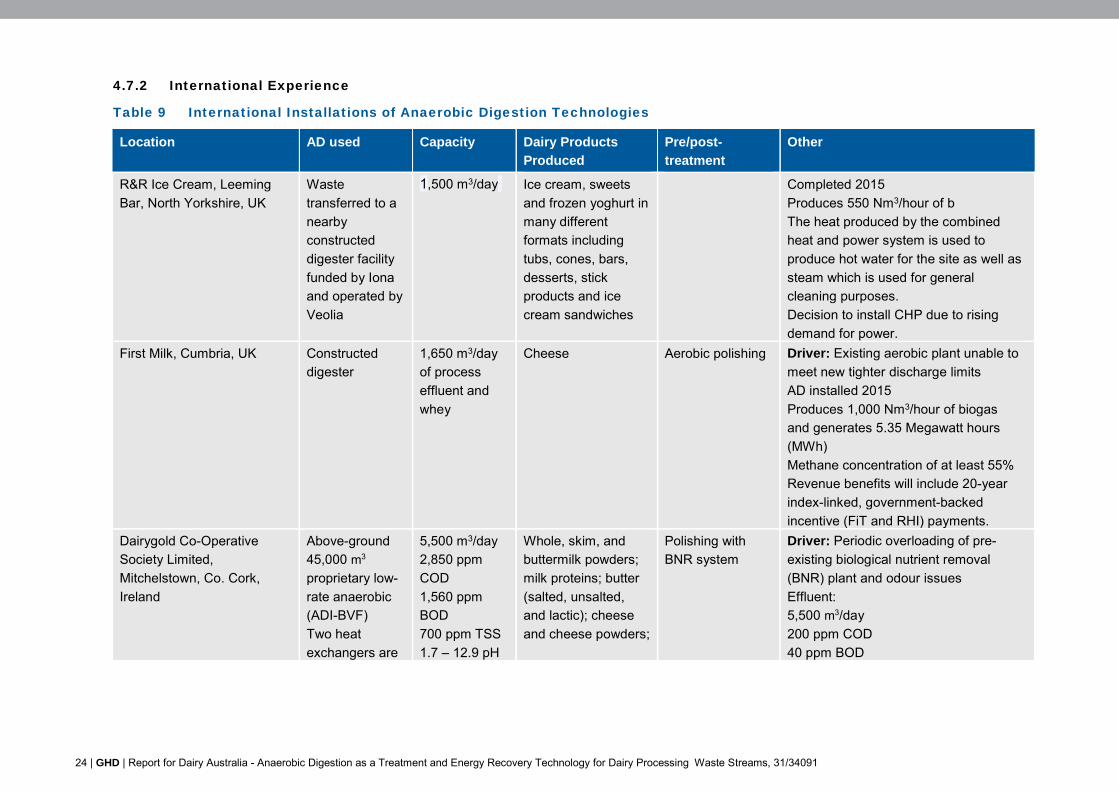
4.7.2 International Experience
Table 9 International Installations of Anaerobic Digestion Technologies
Location AD used Capacity Dairy Products
Produced
Pre/post-
treatment
Other
R&R Ice Cream, Leeming
Bar, North Yorkshire, UK
Waste
transferred to a
nearby
constructed
digester facility
funded by Iona
and operated by
Veolia
1,500 m3/day Ice cream, sweets
and frozen yoghurt in
many different
formats including
tubs, cones, bars,
desserts, stick
products and ice
cream sandwiches
Completed 2015
Produces 550 Nm3/hour of b
The heat produced by the combined
heat and power system is used to
produce hot water for the site as well as
steam which is used for general
cleaning purposes.
Decision to install CHP due to rising
demand for power.
First Milk, Cumbria, UK Constructed
digester
1,650 m3/day
of process
effluent and
whey
Cheese Aerobic polishing Driver: Existing aerobic plant unable to
meet new tighter discharge limits
AD installed 2015
Produces 1,000 Nm3/hour of biogas
and generates 5.35 Megawatt hours
(MWh)
Methane concentration of at least 55%
Revenue benefits will include 20-year
index-linked, government-backed
incentive (FiT and RHI) payments.
Dairygold Co-Operative
Society Limited,
Mitchelstown, Co. Cork,
Ireland
Above-ground
45,000 m3
proprietary low-
rate anaerobic
(ADI-BVF)
Two heat
exchangers are
5,500 m3/day
2,850 ppm
COD
1,560 ppm
BOD
700 ppm TSS
1.7 – 12.9 pH
Whole, skim, and
buttermilk powders;
milk proteins; butter
(salted, unsalted,
and lactic); cheese
and cheese powders;
Polishing with
BNR system
Driver: Periodic overloading of pre-
existing biological nutrient removal
(BNR) plant and odour issues
Effluent:
5,500 m3/day
200 ppm COD
40 ppm BOD
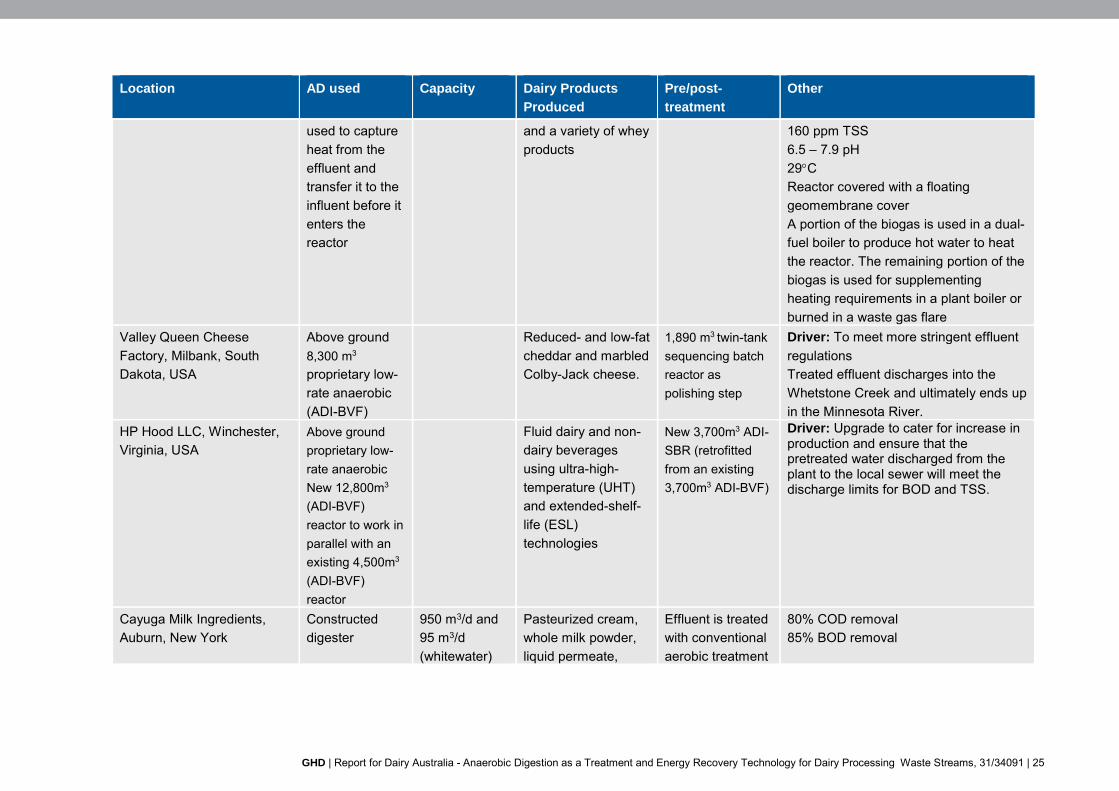
GHD | Report for Dairy Australia - Anaerobic Digestion as a Treatment and Energy Recovery Technology for Dairy Processing Waste Streams, 31/34091 | 25
Location AD used Capacity Dairy Products
Produced
Pre/post-
treatment
Other
used to capture
heat from the
effluent and
transfer it to the
influent before it
enters the
reactor
and a variety of whey
products
160 ppm TSS
6.5 – 7.9 pH
29C
Reactor covered with a floating
geomembrane cover
A portion of the biogas is used in a dual-
fuel boiler to produce hot water to heat
the reactor. The remaining portion of the
biogas is used for supplementing
heating requirements in a plant boiler or
burned in a waste gas flare
Valley Queen Cheese
Factory, Milbank, South
Dakota, USA
Above ground
8,300 m3
proprietary low-
rate anaerobic
(ADI-BVF)
Reduced- and low-fat
cheddar and marbled
Colby-Jack cheese.
1,890 m3 twin-tank
sequencing batch
reactor as
polishing step
Driver: To meet more stringent effluent
regulations
Treated effluent discharges into the
Whetstone Creek and ultimately ends up
in the Minnesota River.
HP Hood LLC, Winchester,
Virginia, USA Above ground
proprietary low-
rate anaerobic
New 12,800m3
(ADI-BVF)
reactor to work in
parallel with an
existing 4,500m3
(ADI-BVF)
reactor
Fluid dairy and non-
dairy beverages
using ultra-high-
temperature (UHT)
and extended-shelf-
life (ESL)
technologies
New 3,700m3 ADI-
SBR (retrofitted
from an existing
3,700m3 ADI-BVF)
Driver: Upgrade to cater for increase in production and ensure that the pretreated water discharged from the plant to the local sewer will meet the discharge limits for BOD and TSS.
Cayuga Milk Ingredients,
Auburn, New York
Constructed
digester
950 m3/d and
95 m3/d
(whitewater)
Pasteurized cream,
whole milk powder,
liquid permeate,
Effluent is treated
with conventional
aerobic treatment
80% COD removal
85% BOD removal
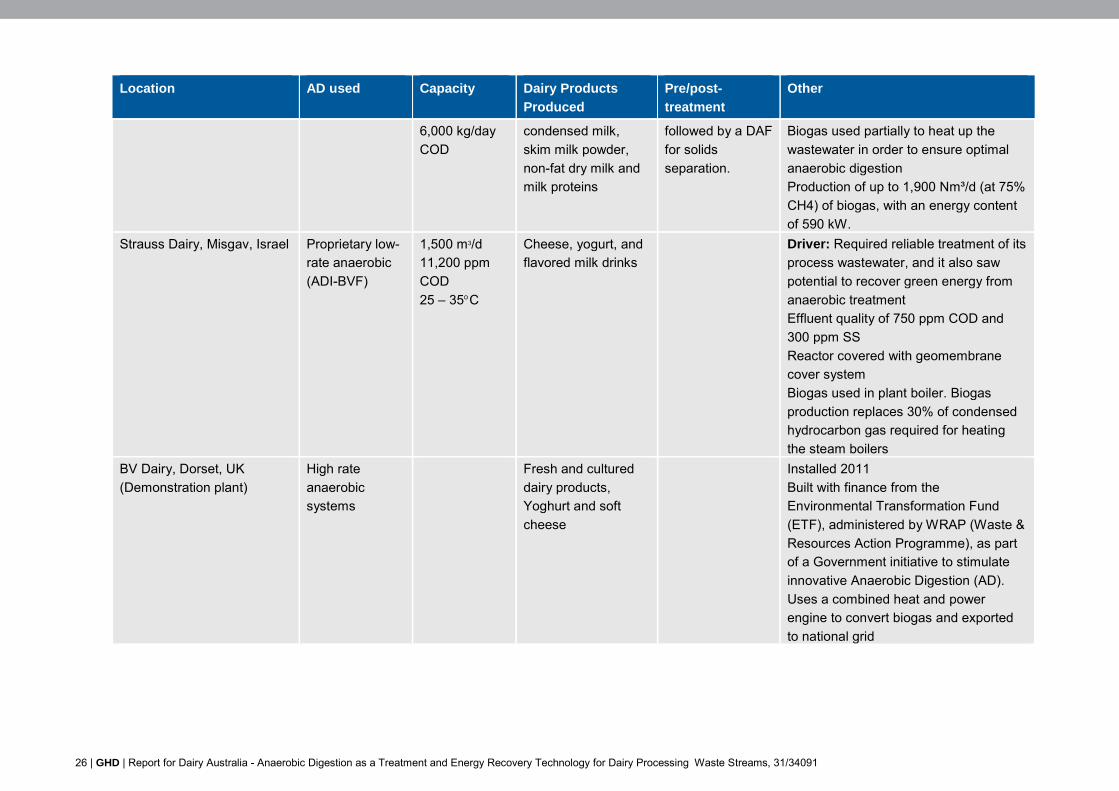
26 | GHD | Report for Dairy Australia - Anaerobic Digestion as a Treatment and Energy Recovery Technology for Dairy Processing Waste Streams, 31/34091
Location AD used Capacity Dairy Products
Produced
Pre/post-
treatment
Other
6,000 kg/day
COD
condensed milk,
skim milk powder,
non-fat dry milk and
milk proteins
followed by a DAF
for solids
separation.
Biogas used partially to heat up the
wastewater in order to ensure optimal
anaerobic digestion
Production of up to 1,900 Nm³/d (at 75%
CH4) of biogas, with an energy content
of 590 kW.
Strauss Dairy, Misgav, Israel Proprietary low-
rate anaerobic
(ADI-BVF)
1,500 m3/d
11,200 ppm
COD
25 – 35C
Cheese, yogurt, and
flavored milk drinks
Driver: Required reliable treatment of its
process wastewater, and it also saw
potential to recover green energy from
anaerobic treatment
Effluent quality of 750 ppm COD and
300 ppm SS
Reactor covered with geomembrane
cover system
Biogas used in plant boiler. Biogas
production replaces 30% of condensed
hydrocarbon gas required for heating
the steam boilers
BV Dairy, Dorset, UK
(Demonstration plant)
High rate
anaerobic
systems
Fresh and cultured
dairy products,
Yoghurt and soft
cheese
Installed 2011
Built with finance from the
Environmental Transformation Fund
(ETF), administered by WRAP (Waste &
Resources Action Programme), as part
of a Government initiative to stimulate
innovative Anaerobic Digestion (AD).
Uses a combined heat and power
engine to convert biogas and exported
to national grid
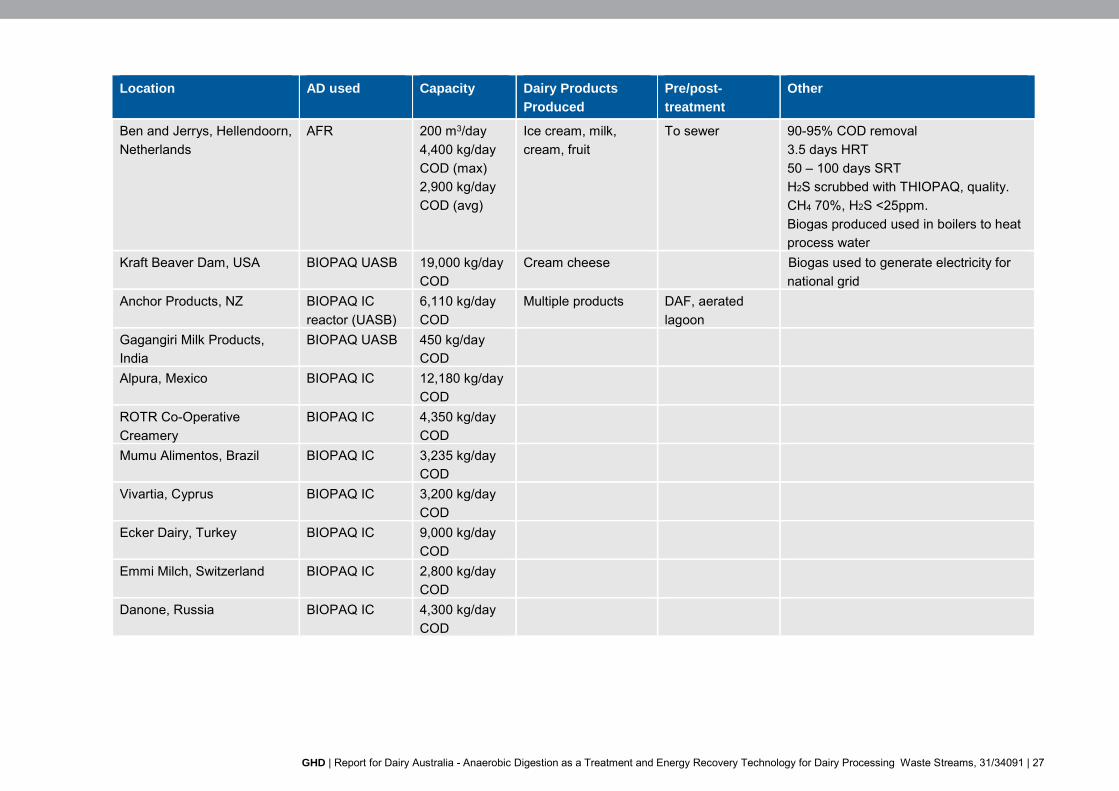
GHD | Report for Dairy Australia - Anaerobic Digestion as a Treatment and Energy Recovery Technology for Dairy Processing Waste Streams, 31/34091 | 27
Location AD used Capacity Dairy Products
Produced
Pre/post-
treatment
Other
Ben and Jerrys, Hellendoorn,
Netherlands
AFR 200 m3/day
4,400 kg/day
COD (max)
2,900 kg/day
COD (avg)
Ice cream, milk,
cream, fruit
To sewer 90-95% COD removal
3.5 days HRT
50 – 100 days SRT
H2S scrubbed with THIOPAQ, quality.
CH4 70%, H2S <25ppm.
Biogas produced used in boilers to heat
process water
Kraft Beaver Dam, USA BIOPAQ UASB 19,000 kg/day
COD
Cream cheese Biogas used to generate electricity for
national grid
Anchor Products, NZ BIOPAQ IC
reactor (UASB)
6,110 kg/day
COD
Multiple products DAF, aerated
lagoon
Gagangiri Milk Products,
India
BIOPAQ UASB 450 kg/day
COD
Alpura, Mexico BIOPAQ IC 12,180 kg/day
COD
ROTR Co-Operative
Creamery
BIOPAQ IC 4,350 kg/day
COD
Mumu Alimentos, Brazil BIOPAQ IC 3,235 kg/day
COD
Vivartia, Cyprus BIOPAQ IC 3,200 kg/day
COD
Ecker Dairy, Turkey BIOPAQ IC 9,000 kg/day
COD
Emmi Milch, Switzerland BIOPAQ IC 2,800 kg/day
COD
Danone, Russia BIOPAQ IC 4,300 kg/day
COD

28 | GHD | Report for Dairy Australia - Anaerobic Digestion as a Treatment and Energy Recovery Technology for Dairy
Processing Waste Streams, 31/34091
It is evident from available information, that numerous overseas dairy processing sites employ
high rate anaerobic treatment systems whereas in Australia low rate systems are more
prevalent. The key reason for this is that the majority of dairy processing facilities in Australia
are in rural areas and have space to employ lagoon treatment or conventional constructed
systems and land irrigation of treated effluent. For a few overseas examples, high rates
systems (although not typical) have been installed. While information is scant on pre-treatment
and performance, it can only be surmised that significant fats / grease have been removed prior
to treatment in the high rate digester.
Other examples of anaerobic digestion technologies used in other industries are provided in
Appendix B.
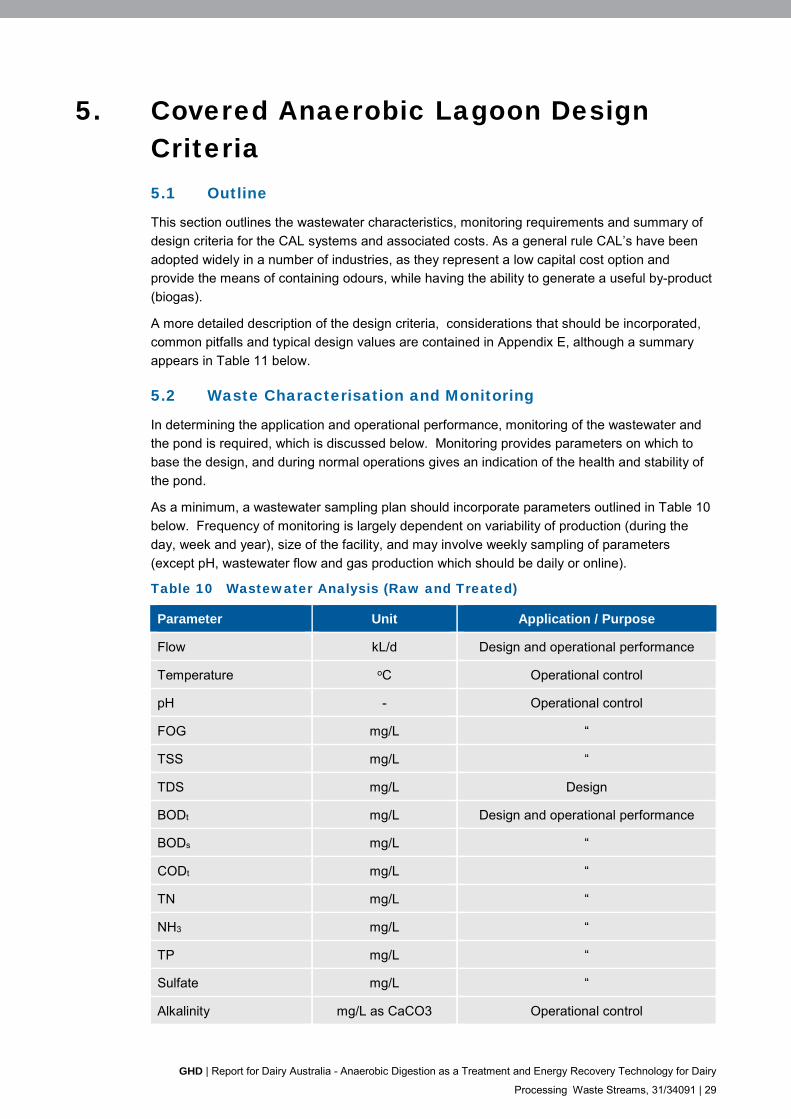
GHD | Report for Dairy Australia - Anaerobic Digestion as a Treatment and Energy Recovery Technology for Dairy
Processing Waste Streams, 31/34091 | 29
5. Covered Anaerobic Lagoon Design Criteria 5.1 Outline
This section outlines the wastewater characteristics, monitoring requirements and summary of
design criteria for the CAL systems and associated costs. As a general rule CAL’s have been
adopted widely in a number of industries, as they represent a low capital cost option and
provide the means of containing odours, while having the ability to generate a useful by-product
(biogas).
A more detailed description of the design criteria, considerations that should be incorporated,
common pitfalls and typical design values are contained in Appendix E, although a summary
appears in Table 11 below.
5.2 Waste Characterisation and Monitoring
In determining the application and operational performance, monitoring of the wastewater and
the pond is required, which is discussed below. Monitoring provides parameters on which to
base the design, and during normal operations gives an indication of the health and stability of
the pond.
As a minimum, a wastewater sampling plan should incorporate parameters outlined in Table 10
below. Frequency of monitoring is largely dependent on variability of production (during the
day, week and year), size of the facility, and may involve weekly sampling of parameters
(except pH, wastewater flow and gas production which should be daily or online).
Table 10 Wastewater Analysis (Raw and Treated)
Parameter Unit Application / Purpose
Flow kL/d Design and operational performance
Temperature oC Operational control
pH - Operational control
FOG mg/L “
TSS mg/L “
TDS mg/L Design
BODt mg/L Design and operational performance
BODs mg/L “
CODt mg/L “
TN mg/L “
NH3 mg/L “
TP mg/L “
Sulfate mg/L “
Alkalinity mg/L as CaCO3 Operational control
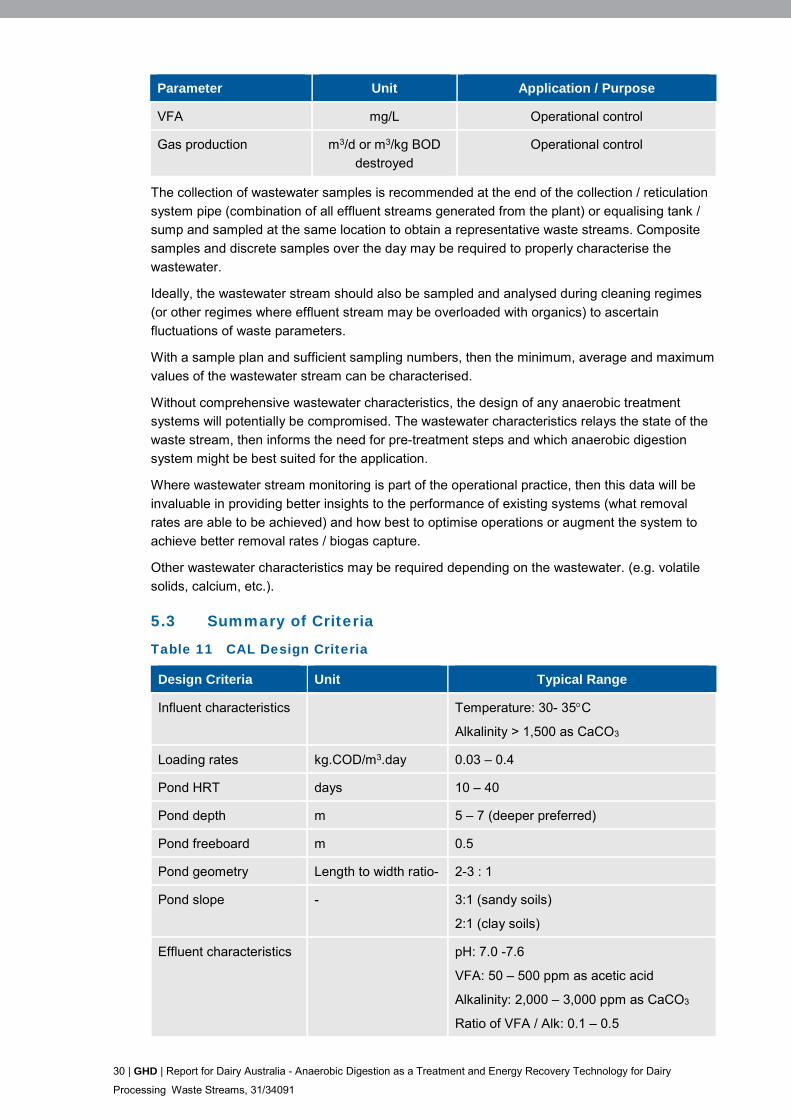
30 | GHD | Report for Dairy Australia - Anaerobic Digestion as a Treatment and Energy Recovery Technology for Dairy
Processing Waste Streams, 31/34091
Parameter Unit Application / Purpose
VFA mg/L Operational control
Gas production m3/d or m3/kg BOD
destroyed
Operational control
The collection of wastewater samples is recommended at the end of the collection / reticulation
system pipe (combination of all effluent streams generated from the plant) or equalising tank /
sump and sampled at the same location to obtain a representative waste streams. Composite
samples and discrete samples over the day may be required to properly characterise the
wastewater.
Ideally, the wastewater stream should also be sampled and analysed during cleaning regimes
(or other regimes where effluent stream may be overloaded with organics) to ascertain
fluctuations of waste parameters.
With a sample plan and sufficient sampling numbers, then the minimum, average and maximum
values of the wastewater stream can be characterised.
Without comprehensive wastewater characteristics, the design of any anaerobic treatment
systems will potentially be compromised. The wastewater characteristics relays the state of the
waste stream, then informs the need for pre-treatment steps and which anaerobic digestion
system might be best suited for the application.
Where wastewater stream monitoring is part of the operational practice, then this data will be
invaluable in providing better insights to the performance of existing systems (what removal
rates are able to be achieved) and how best to optimise operations or augment the system to
achieve better removal rates / biogas capture.
Other wastewater characteristics may be required depending on the wastewater. (e.g. volatile
solids, calcium, etc.).
5.3 Summary of Criteria
Table 11 CAL Design Criteria
Design Criteria Unit Typical Range
Influent characteristics Temperature: 30- 35C
Alkalinity > 1,500 as CaCO3
Loading rates kg.COD/m3.day 0.03 – 0.4
Pond HRT days 10 – 40
Pond depth m 5 – 7 (deeper preferred)
Pond freeboard m 0.5
Pond geometry Length to width ratio- 2-3 : 1
Pond slope - 3:1 (sandy soils)
2:1 (clay soils)
Effluent characteristics pH: 7.0 -7.6
VFA: 50 – 500 ppm as acetic acid
Alkalinity: 2,000 – 3,000 ppm as CaCO3
Ratio of VFA / Alk: 0.1 – 0.5
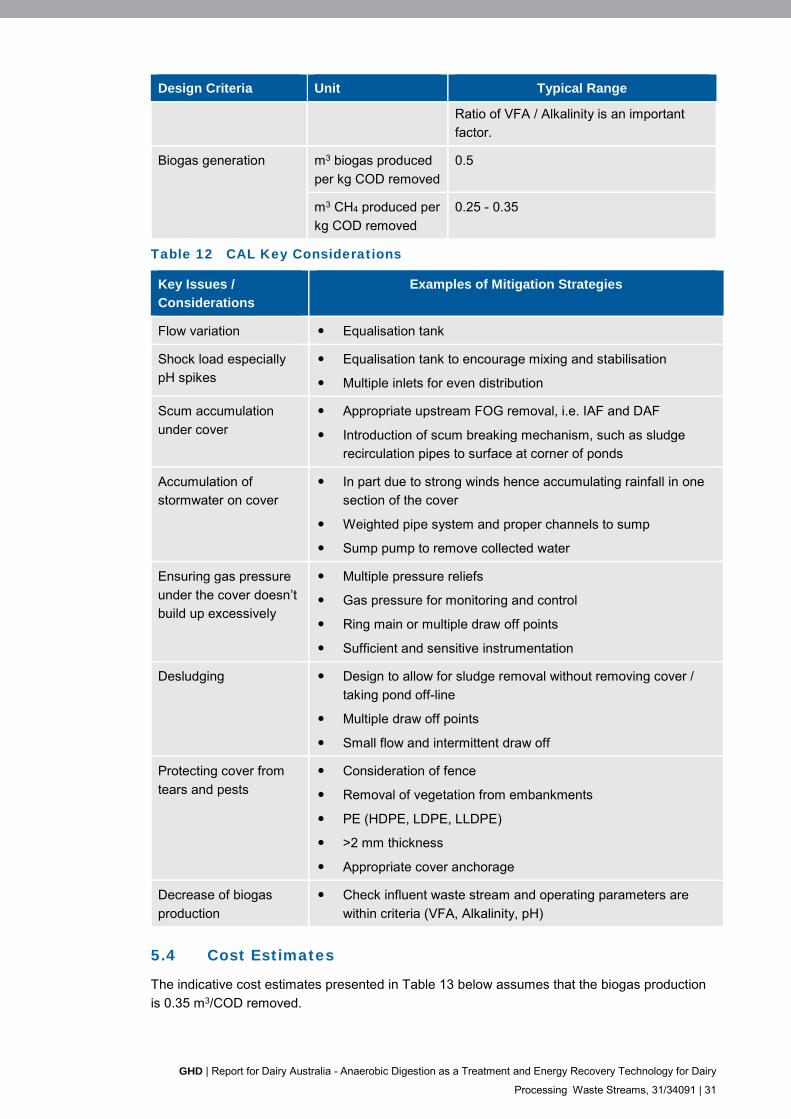
GHD | Report for Dairy Australia - Anaerobic Digestion as a Treatment and Energy Recovery Technology for Dairy
Processing Waste Streams, 31/34091 | 31
Design Criteria Unit Typical Range
Ratio of VFA / Alkalinity is an important
factor.
Biogas generation m3 biogas produced
per kg COD removed
0.5
m3 CH4 produced per
kg COD removed
0.25 - 0.35
Table 12 CAL Key Considerations
Key Issues /
Considerations
Examples of Mitigation Strategies
Flow variation Equalisation tank
Shock load especially
pH spikes
Equalisation tank to encourage mixing and stabilisation
Multiple inlets for even distribution
Scum accumulation
under cover
Appropriate upstream FOG removal, i.e. IAF and DAF
Introduction of scum breaking mechanism, such as sludge
recirculation pipes to surface at corner of ponds
Accumulation of
stormwater on cover
In part due to strong winds hence accumulating rainfall in one
section of the cover
Weighted pipe system and proper channels to sump
Sump pump to remove collected water
Ensuring gas pressure
under the cover doesn’t
build up excessively
Multiple pressure reliefs
Gas pressure for monitoring and control
Ring main or multiple draw off points
Sufficient and sensitive instrumentation
Desludging Design to allow for sludge removal without removing cover /
taking pond off-line
Multiple draw off points
Small flow and intermittent draw off
Protecting cover from
tears and pests
Consideration of fence
Removal of vegetation from embankments
PE (HDPE, LDPE, LLDPE)
>2 mm thickness
Appropriate cover anchorage
Decrease of biogas
production
Check influent waste stream and operating parameters are
within criteria (VFA, Alkalinity, pH)
5.4 Cost Estimates
The indicative cost estimates presented in Table 13 below assumes that the biogas production
is 0.35 m3/COD removed.

32 | GHD | Report for Dairy Australia - Anaerobic Digestion as a Treatment and Energy Recovery Technology for Dairy
Processing Waste Streams, 31/34091
Table 13 CAL Cost Estimate
CAL Cost Component Small Facility Low -
Medium
Facility
High –
Medium
Facility
Large Facility
Nominal Wastewater Flow
(kL/d)
500 1,500 4,000 7,000
COD load kg/day 2,000 6,000 16,000 28,000
CAL size, ML 7.5 22.5 60 91
Biogas production, m3/d 500 1,500 4,200 7,300
Generic cost
AL excavation, cut and fill $200,000 $600,000 $1,500,000 $2,300,000
Lagoon liner $50,000 $150,000 $400,000 $600,000
Inlet and outlet structures $20,000 $20,000 $35,000 $40,000
CAL cover $150,000 $350,000 $900,000 $1,400,000
Electrical generator,
biogas flare
$250,000 $500,000 $950,000 $1,350,000
Sulphide scrubber $25,000 $30,000 $40,000 $50,000
Ancillaries, pipework and
installation
$400,000 $800,000 $1,400,000 $1,950,000
Sub-total $1,095,000 $2,450,000 $5,225,000 $7,690,000
Contingencies, design,
engineering (30%)
$400,000 $800,000 $1,600,000 $2,400,000
Total $1,495,000 $3,250,000 $6,825,000 $10,090,000
TOTAL SAY $1.5M $3.3M $6.8M $10.1M
The cost estimates above have been based on industry standard cost for items outlined below:
$25/m3 for AL excavation, cut and fill
$25/m2 for lagoon liner
$60/m2 for CAL cover.
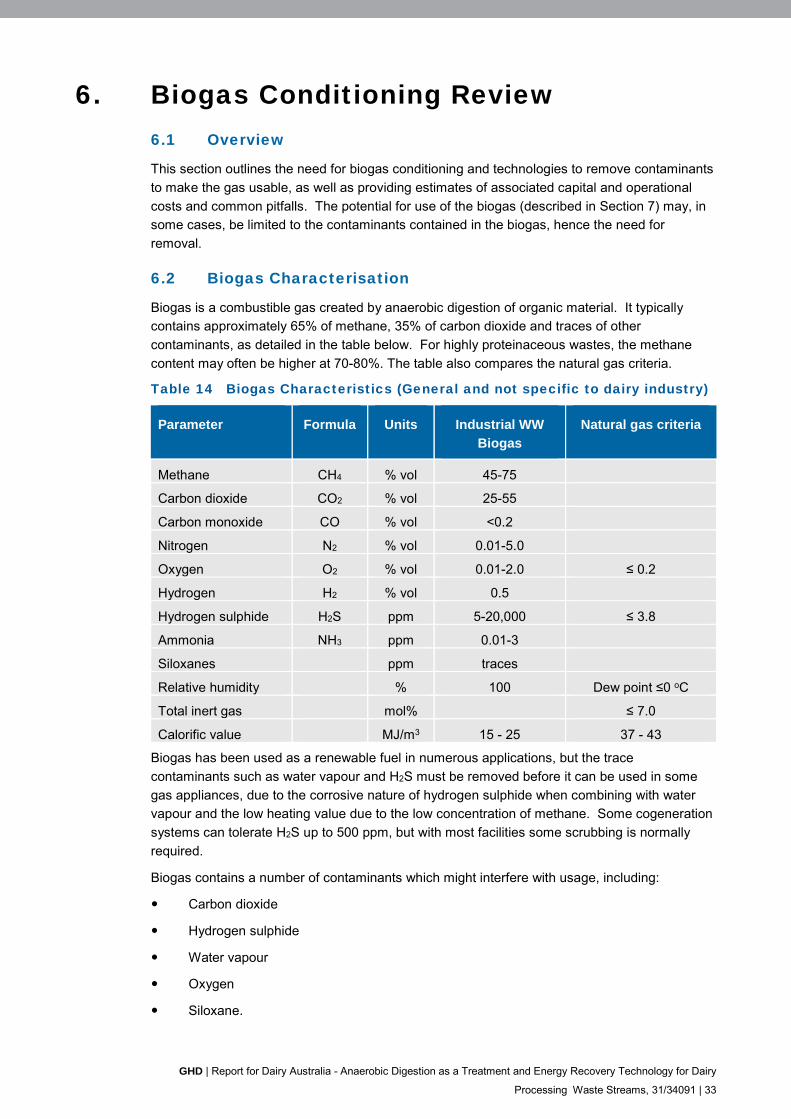
GHD | Report for Dairy Australia - Anaerobic Digestion as a Treatment and Energy Recovery Technology for Dairy
Processing Waste Streams, 31/34091 | 33
6. Biogas Conditioning Review 6.1 Overview
This section outlines the need for biogas conditioning and technologies to remove contaminants
to make the gas usable, as well as providing estimates of associated capital and operational
costs and common pitfalls. The potential for use of the biogas (described in Section 7) may, in
some cases, be limited to the contaminants contained in the biogas, hence the need for
removal.
6.2 Biogas Characterisation
Biogas is a combustible gas created by anaerobic digestion of organic material. It typically
contains approximately 65% of methane, 35% of carbon dioxide and traces of other
contaminants, as detailed in the table below. For highly proteinaceous wastes, the methane
content may often be higher at 70-80%. The table also compares the natural gas criteria.
Table 14 Biogas Characteristics (General and not specific to dairy industry)
Parameter Formula Units Industrial WW
Biogas
Natural gas criteria
Methane CH4 % vol 45-75
Carbon dioxide CO2 % vol 25-55
Carbon monoxide CO % vol <0.2
Nitrogen N2 % vol 0.01-5.0
Oxygen O2 % vol 0.01-2.0 ≤ 0.2
Hydrogen H2 % vol 0.5
Hydrogen sulphide H2S ppm 5-20,000 ≤ 3.8
Ammonia NH3 ppm 0.01-3
Siloxanes ppm traces
Relative humidity % 100 Dew point ≤0 oC
Total inert gas mol% ≤ 7.0
Calorific value MJ/m3 15 - 25 37 - 43
Biogas has been used as a renewable fuel in numerous applications, but the trace
contaminants such as water vapour and H2S must be removed before it can be used in some
gas appliances, due to the corrosive nature of hydrogen sulphide when combining with water
vapour and the low heating value due to the low concentration of methane. Some cogeneration
systems can tolerate H2S up to 500 ppm, but with most facilities some scrubbing is normally
required.
Biogas contains a number of contaminants which might interfere with usage, including:
Carbon dioxide
Hydrogen sulphide
Water vapour
Oxygen
Siloxane.
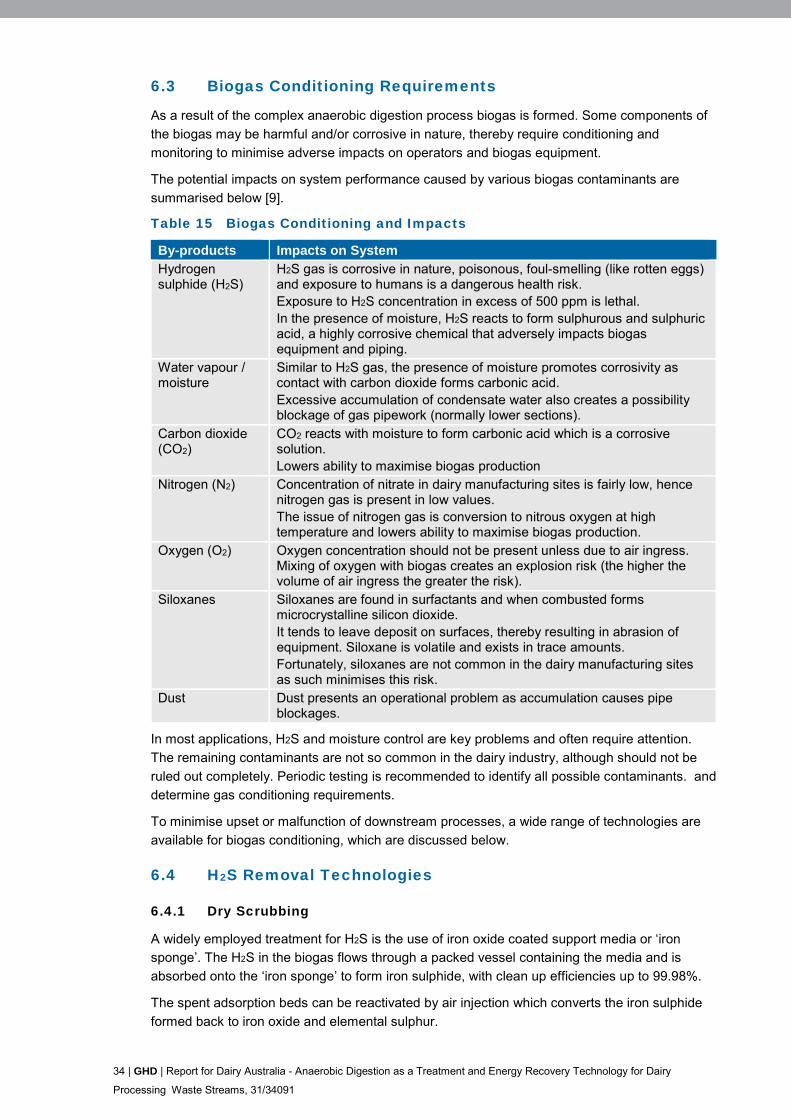
34 | GHD | Report for Dairy Australia - Anaerobic Digestion as a Treatment and Energy Recovery Technology for Dairy
Processing Waste Streams, 31/34091
6.3 Biogas Conditioning Requirements
As a result of the complex anaerobic digestion process biogas is formed. Some components of
the biogas may be harmful and/or corrosive in nature, thereby require conditioning and
monitoring to minimise adverse impacts on operators and biogas equipment.
The potential impacts on system performance caused by various biogas contaminants are
summarised below [9].
Table 15 Biogas Conditioning and Impacts
By-products Impacts on System
Hydrogen sulphide (H2S)
H2S gas is corrosive in nature, poisonous, foul-smelling (like rotten eggs) and exposure to humans is a dangerous health risk. Exposure to H2S concentration in excess of 500 ppm is lethal. In the presence of moisture, H2S reacts to form sulphurous and sulphuric acid, a highly corrosive chemical that adversely impacts biogas equipment and piping.
Water vapour / moisture
Similar to H2S gas, the presence of moisture promotes corrosivity as contact with carbon dioxide forms carbonic acid. Excessive accumulation of condensate water also creates a possibility blockage of gas pipework (normally lower sections).
Carbon dioxide (CO2)
CO2 reacts with moisture to form carbonic acid which is a corrosive solution. Lowers ability to maximise biogas production
Nitrogen (N2) Concentration of nitrate in dairy manufacturing sites is fairly low, hence nitrogen gas is present in low values. The issue of nitrogen gas is conversion to nitrous oxygen at high temperature and lowers ability to maximise biogas production.
Oxygen (O2) Oxygen concentration should not be present unless due to air ingress. Mixing of oxygen with biogas creates an explosion risk (the higher the volume of air ingress the greater the risk).
Siloxanes Siloxanes are found in surfactants and when combusted forms microcrystalline silicon dioxide. It tends to leave deposit on surfaces, thereby resulting in abrasion of equipment. Siloxane is volatile and exists in trace amounts. Fortunately, siloxanes are not common in the dairy manufacturing sites as such minimises this risk.
Dust Dust presents an operational problem as accumulation causes pipe blockages.
In most applications, H2S and moisture control are key problems and often require attention.
The remaining contaminants are not so common in the dairy industry, although should not be
ruled out completely. Periodic testing is recommended to identify all possible contaminants. and
determine gas conditioning requirements.
To minimise upset or malfunction of downstream processes, a wide range of technologies are
available for biogas conditioning, which are discussed below.
6.4 H2S Removal Technologies
6.4.1 Dry Scrubbing
A widely employed treatment for H2S is the use of iron oxide coated support media or ‘iron
sponge’. The H2S in the biogas flows through a packed vessel containing the media and is
absorbed onto the ‘iron sponge’ to form iron sulphide, with clean up efficiencies up to 99.98%.
The spent adsorption beds can be reactivated by air injection which converts the iron sulphide
formed back to iron oxide and elemental sulphur.
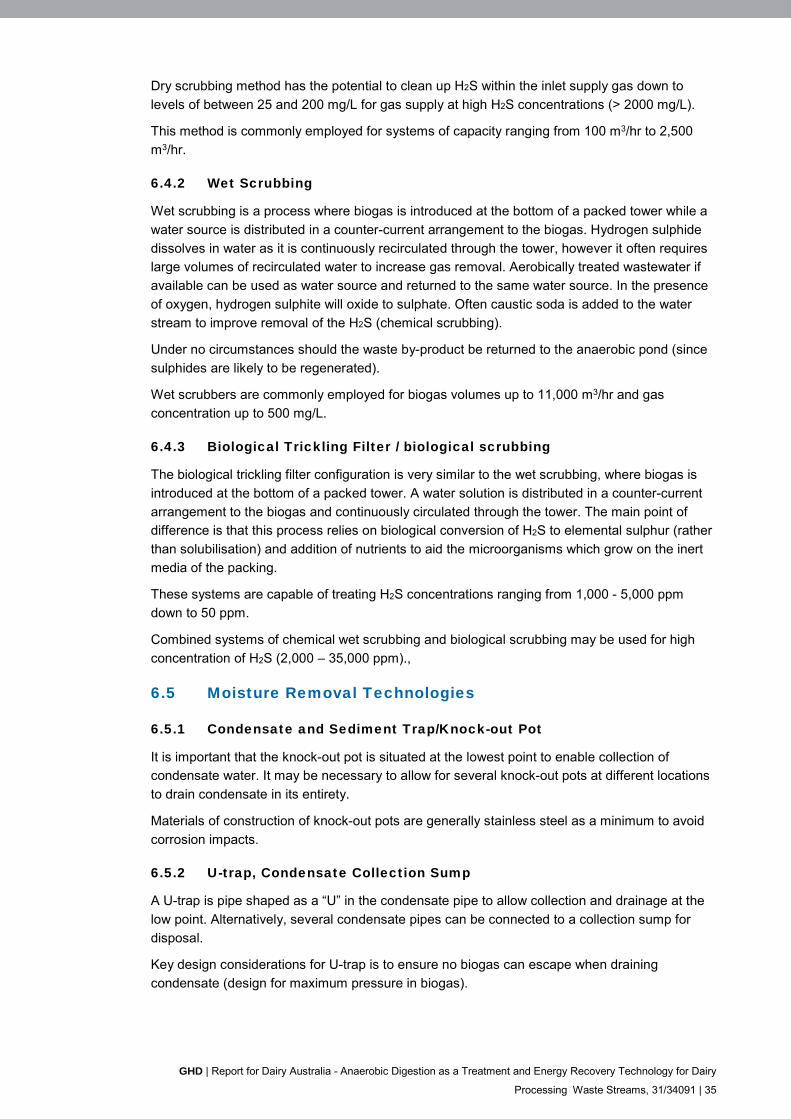
GHD | Report for Dairy Australia - Anaerobic Digestion as a Treatment and Energy Recovery Technology for Dairy
Processing Waste Streams, 31/34091 | 35
Dry scrubbing method has the potential to clean up H2S within the inlet supply gas down to
levels of between 25 and 200 mg/L for gas supply at high H2S concentrations (> 2000 mg/L).
This method is commonly employed for systems of capacity ranging from 100 m3/hr to 2,500
m3/hr.
6.4.2 Wet Scrubbing
Wet scrubbing is a process where biogas is introduced at the bottom of a packed tower while a
water source is distributed in a counter-current arrangement to the biogas. Hydrogen sulphide
dissolves in water as it is continuously recirculated through the tower, however it often requires
large volumes of recirculated water to increase gas removal. Aerobically treated wastewater if
available can be used as water source and returned to the same water source. In the presence
of oxygen, hydrogen sulphite will oxide to sulphate. Often caustic soda is added to the water
stream to improve removal of the H2S (chemical scrubbing).
Under no circumstances should the waste by-product be returned to the anaerobic pond (since
sulphides are likely to be regenerated).
Wet scrubbers are commonly employed for biogas volumes up to 11,000 m3/hr and gas
concentration up to 500 mg/L.
6.4.3 Biological Trickling Filter / biological scrubbing
The biological trickling filter configuration is very similar to the wet scrubbing, where biogas is
introduced at the bottom of a packed tower. A water solution is distributed in a counter-current
arrangement to the biogas and continuously circulated through the tower. The main point of
difference is that this process relies on biological conversion of H2S to elemental sulphur (rather
than solubilisation) and addition of nutrients to aid the microorganisms which grow on the inert
media of the packing.
These systems are capable of treating H2S concentrations ranging from 1,000 - 5,000 ppm
down to 50 ppm.
Combined systems of chemical wet scrubbing and biological scrubbing may be used for high
concentration of H2S (2,000 – 35,000 ppm).,
6.5 Moisture Removal Technologies
6.5.1 Condensate and Sediment Trap/Knock-out Pot
It is important that the knock-out pot is situated at the lowest point to enable collection of
condensate water. It may be necessary to allow for several knock-out pots at different locations
to drain condensate in its entirety.
Materials of construction of knock-out pots are generally stainless steel as a minimum to avoid
corrosion impacts.
6.5.2 U-trap, Condensate Collection Sump
A U-trap is pipe shaped as a “U” in the condensate pipe to allow collection and drainage at the
low point. Alternatively, several condensate pipes can be connected to a collection sump for
disposal.
Key design considerations for U-trap is to ensure no biogas can escape when draining
condensate (design for maximum pressure in biogas).
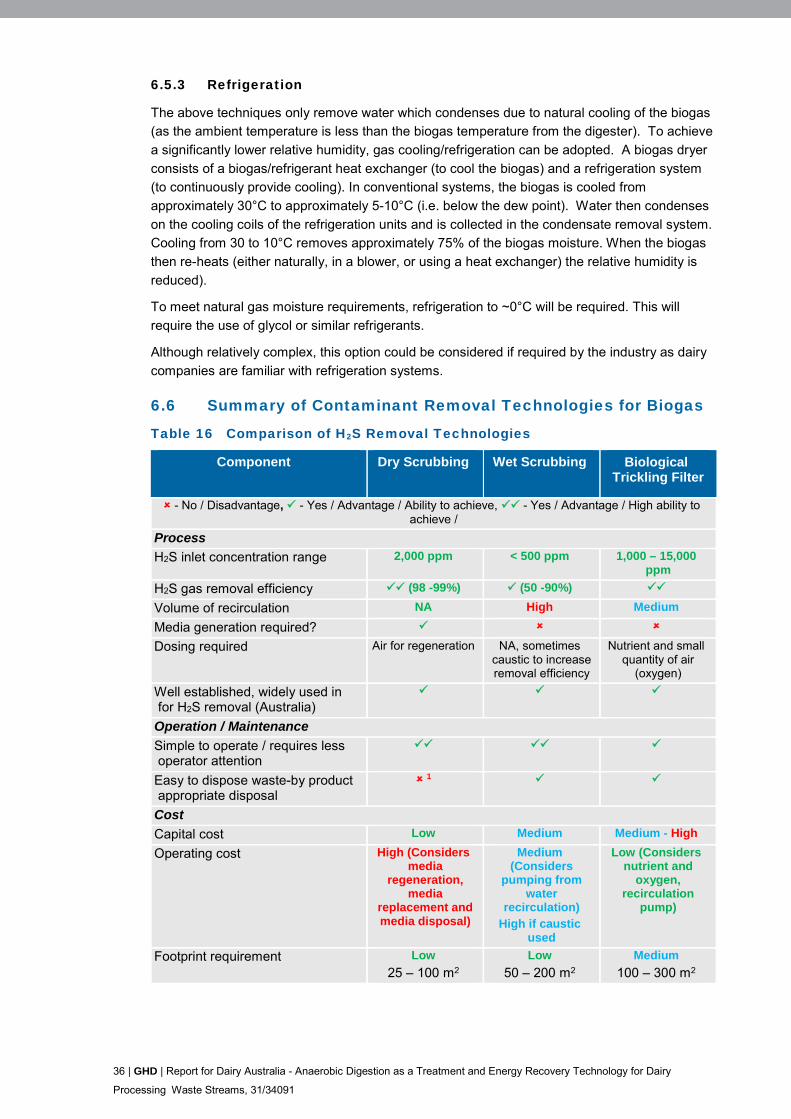
36 | GHD | Report for Dairy Australia - Anaerobic Digestion as a Treatment and Energy Recovery Technology for Dairy
Processing Waste Streams, 31/34091
6.5.3 Refrigeration
The above techniques only remove water which condenses due to natural cooling of the biogas
(as the ambient temperature is less than the biogas temperature from the digester). To achieve
a significantly lower relative humidity, gas cooling/refrigeration can be adopted. A biogas dryer
consists of a biogas/refrigerant heat exchanger (to cool the biogas) and a refrigeration system
(to continuously provide cooling). In conventional systems, the biogas is cooled from
approximately 30°C to approximately 5-10°C (i.e. below the dew point). Water then condenses
on the cooling coils of the refrigeration units and is collected in the condensate removal system.
Cooling from 30 to 10°C removes approximately 75% of the biogas moisture. When the biogas
then re-heats (either naturally, in a blower, or using a heat exchanger) the relative humidity is
reduced).
To meet natural gas moisture requirements, refrigeration to ~0°C will be required. This will
require the use of glycol or similar refrigerants.
Although relatively complex, this option could be considered if required by the industry as dairy
companies are familiar with refrigeration systems.
6.6 Summary of Contaminant Removal Technologies for Biogas
Table 16 Comparison of H2S Removal Technologies
Component Dry Scrubbing Wet Scrubbing Biological Trickling Filter
- No / Disadvantage, - Yes / Advantage / Ability to achieve, - Yes / Advantage / High ability to achieve /
Process
H2S inlet concentration range 2,000 ppm < 500 ppm 1,000 – 15,000 ppm
H2S gas removal efficiency (98 -99%) (50 -90%)
Volume of recirculation NA High Medium
Media generation required?
Dosing required Air for regeneration NA, sometimes caustic to increase removal efficiency
Nutrient and small quantity of air
(oxygen)
Well established, widely used in for H2S removal (Australia)
Operation / Maintenance
Simple to operate / requires less operator attention
Easy to dispose waste-by product appropriate disposal
1
Cost
Capital cost Low Medium Medium - High
Operating cost High (Considers media
regeneration, media
replacement and media disposal)
Medium (Considers
pumping from water
recirculation) High if caustic
used
Low (Considers nutrient and
oxygen, recirculation
pump)
Footprint requirement Low
25 – 100 m2
Low
50 – 200 m2
Medium
100 – 300 m2
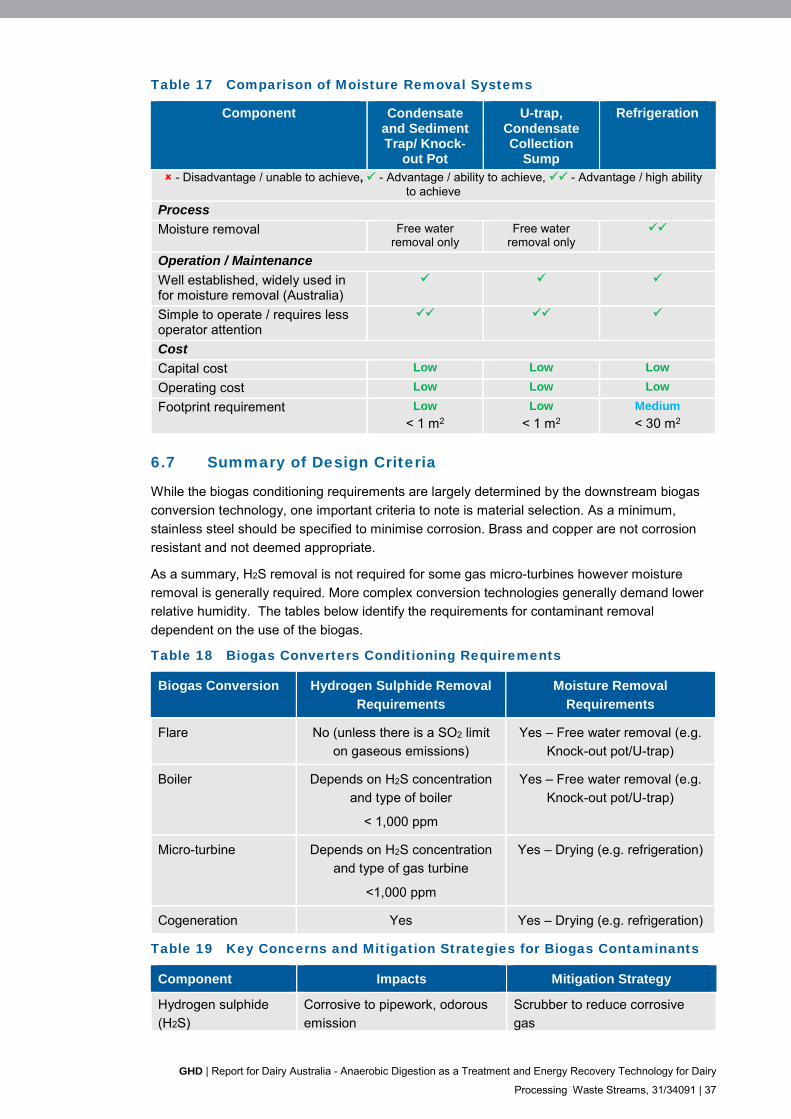
GHD | Report for Dairy Australia - Anaerobic Digestion as a Treatment and Energy Recovery Technology for Dairy
Processing Waste Streams, 31/34091 | 37
Table 17 Comparison of Moisture Removal Systems
Component Condensate and Sediment Trap/ Knock-
out Pot
U-trap, Condensate Collection
Sump
Refrigeration
- Disadvantage / unable to achieve, - Advantage / ability to achieve, - Advantage / high ability to achieve
Process
Moisture removal Free water removal only
Free water removal only
Operation / Maintenance
Well established, widely used in for moisture removal (Australia)
Simple to operate / requires less operator attention
Cost
Capital cost Low Low Low
Operating cost Low Low Low
Footprint requirement Low
< 1 m2
Low
< 1 m2
Medium
< 30 m2
6.7 Summary of Design Criteria
While the biogas conditioning requirements are largely determined by the downstream biogas
conversion technology, one important criteria to note is material selection. As a minimum,
stainless steel should be specified to minimise corrosion. Brass and copper are not corrosion
resistant and not deemed appropriate.
As a summary, H2S removal is not required for some gas micro-turbines however moisture
removal is generally required. More complex conversion technologies generally demand lower
relative humidity. The tables below identify the requirements for contaminant removal
dependent on the use of the biogas.
Table 18 Biogas Converters Conditioning Requirements
Biogas Conversion Hydrogen Sulphide Removal
Requirements
Moisture Removal
Requirements
Flare No (unless there is a SO2 limit
on gaseous emissions)
Yes – Free water removal (e.g.
Knock-out pot/U-trap)
Boiler Depends on H2S concentration
and type of boiler
< 1,000 ppm
Yes – Free water removal (e.g.
Knock-out pot/U-trap)
Micro-turbine Depends on H2S concentration
and type of gas turbine
<1,000 ppm
Yes – Drying (e.g. refrigeration)
Cogeneration Yes Yes – Drying (e.g. refrigeration)
Table 19 Key Concerns and Mitigation Strategies for Biogas Contaminants
Component Impacts Mitigation Strategy
Hydrogen sulphide
(H2S)
Corrosive to pipework, odorous
emission
Scrubber to reduce corrosive
gas
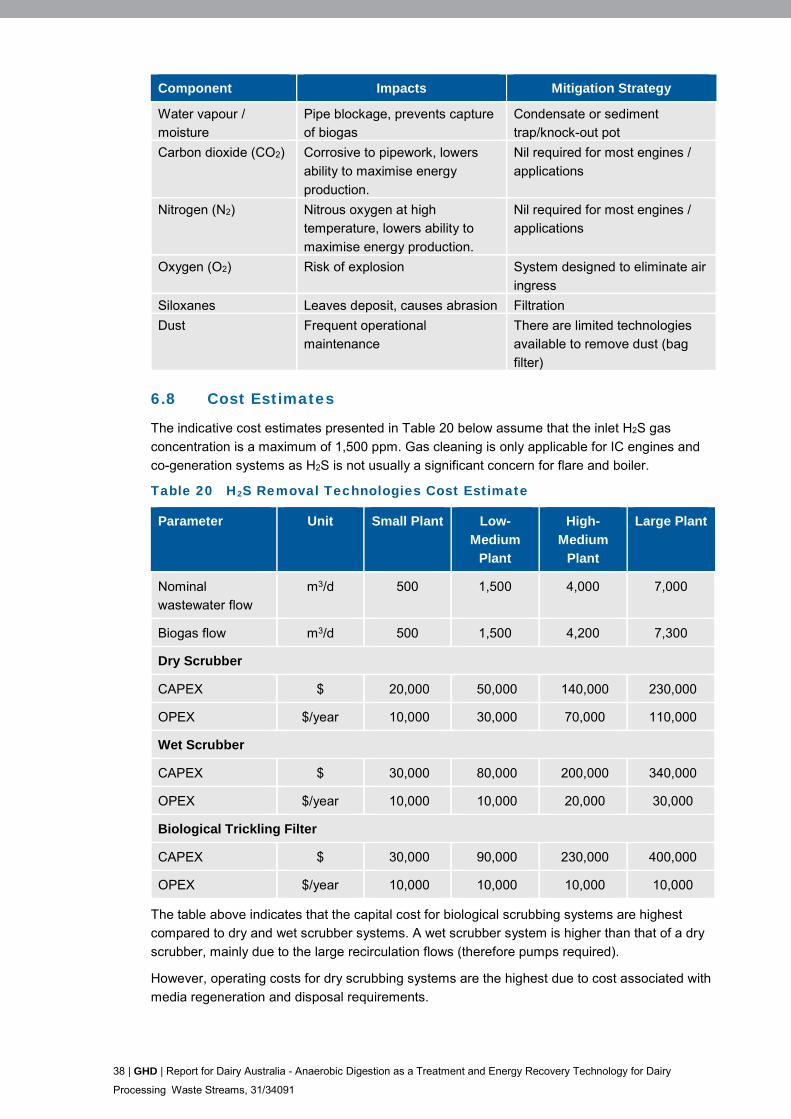
38 | GHD | Report for Dairy Australia - Anaerobic Digestion as a Treatment and Energy Recovery Technology for Dairy
Processing Waste Streams, 31/34091
Component Impacts Mitigation Strategy
Water vapour /
moisture
Pipe blockage, prevents capture
of biogas
Condensate or sediment
trap/knock-out pot
Carbon dioxide (CO2) Corrosive to pipework, lowers
ability to maximise energy
production.
Nil required for most engines /
applications
Nitrogen (N2) Nitrous oxygen at high
temperature, lowers ability to
maximise energy production.
Nil required for most engines /
applications
Oxygen (O2) Risk of explosion System designed to eliminate air
ingress
Siloxanes Leaves deposit, causes abrasion Filtration
Dust Frequent operational
maintenance
There are limited technologies
available to remove dust (bag
filter)
6.8 Cost Estimates
The indicative cost estimates presented in Table 20 below assume that the inlet H2S gas
concentration is a maximum of 1,500 ppm. Gas cleaning is only applicable for IC engines and
co-generation systems as H2S is not usually a significant concern for flare and boiler.
Table 20 H2S Removal Technologies Cost Estimate
Parameter Unit Small Plant Low-
Medium
Plant
High-
Medium
Plant
Large Plant
Nominal
wastewater flow
m3/d 500 1,500 4,000 7,000
Biogas flow m3/d 500 1,500 4,200 7,300
Dry Scrubber
CAPEX $ 20,000 50,000 140,000 230,000
OPEX $/year 10,000 30,000 70,000 110,000
Wet Scrubber
CAPEX $ 30,000 80,000 200,000 340,000
OPEX $/year 10,000 10,000 20,000 30,000
Biological Trickling Filter
CAPEX $ 30,000 90,000 230,000 400,000
OPEX $/year 10,000 10,000 10,000 10,000
The table above indicates that the capital cost for biological scrubbing systems are highest
compared to dry and wet scrubber systems. A wet scrubber system is higher than that of a dry
scrubber, mainly due to the large recirculation flows (therefore pumps required).
However, operating costs for dry scrubbing systems are the highest due to cost associated with
media regeneration and disposal requirements.

GHD | Report for Dairy Australia - Anaerobic Digestion as a Treatment and Energy Recovery Technology for Dairy
Processing Waste Streams, 31/34091 | 39
Table 21 Biogas Conditioning Cost per Biogas Production
Component Capital Cost Operating Cost
Dry scrubber $500 to $1,000 per m3/hr of gas $10 to $15 per m3 of treated gas.
Wet scrubber $500 to 1,500 per m3/hr of gas $3 to $15 per m3 of treated gas
Biological trickling
filter
$1000 to 1,500 per m3/hr of gas $3 to $10 per m3 of treated gas
Knock-out pot/
Sedimentation trap
Minimal No foreseen operating cost
however regular maintenance is
required
U trap Minimal No foreseen operating cost
however regular maintenance is
required
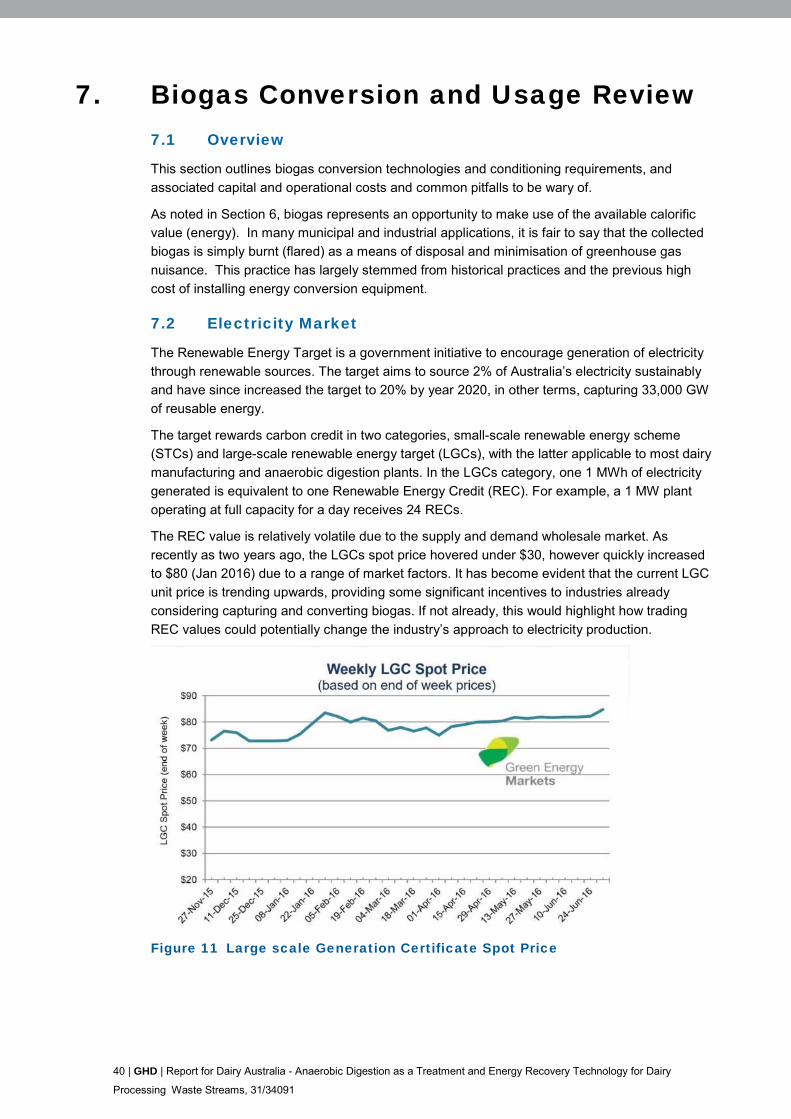
40 | GHD | Report for Dairy Australia - Anaerobic Digestion as a Treatment and Energy Recovery Technology for Dairy
Processing Waste Streams, 31/34091
7. Biogas Conversion and Usage Review 7.1 Overview
This section outlines biogas conversion technologies and conditioning requirements, and
associated capital and operational costs and common pitfalls to be wary of.
As noted in Section 6, biogas represents an opportunity to make use of the available calorific
value (energy). In many municipal and industrial applications, it is fair to say that the collected
biogas is simply burnt (flared) as a means of disposal and minimisation of greenhouse gas
nuisance. This practice has largely stemmed from historical practices and the previous high
cost of installing energy conversion equipment.
7.2 Electricity Market
The Renewable Energy Target is a government initiative to encourage generation of electricity
through renewable sources. The target aims to source 2% of Australia’s electricity sustainably
and have since increased the target to 20% by year 2020, in other terms, capturing 33,000 GW
of reusable energy.
The target rewards carbon credit in two categories, small-scale renewable energy scheme
(STCs) and large-scale renewable energy target (LGCs), with the latter applicable to most dairy
manufacturing and anaerobic digestion plants. In the LGCs category, one 1 MWh of electricity
generated is equivalent to one Renewable Energy Credit (REC). For example, a 1 MW plant
operating at full capacity for a day receives 24 RECs.
The REC value is relatively volatile due to the supply and demand wholesale market. As
recently as two years ago, the LGCs spot price hovered under $30, however quickly increased
to $80 (Jan 2016) due to a range of market factors. It has become evident that the current LGC
unit price is trending upwards, providing some significant incentives to industries already
considering capturing and converting biogas. If not already, this would highlight how trading
REC values could potentially change the industry’s approach to electricity production.
Figure 11 Large scale Generation Certificate Spot Price

GHD | Report for Dairy Australia - Anaerobic Digestion as a Treatment and Energy Recovery Technology for Dairy
Processing Waste Streams, 31/34091 | 41
7.3 Technology Description
7.3.1 Gas Flaring
A flare system involves a tower column where biogas is burnt off to reduce methane emissions.
A range of flare types are used including open and enclosed flares. A schematic of flare types is
shown below.
Figure 12 Gas Flaring
In general, closed flares combust at a higher temperature than open flares. The destruction
efficiency of a flare is dependent on the temperature of combustion and time that the exhaust
gases are maintained at this temperature. Closed flares typically combust at approximately
1,000°C and attain a destruction efficiency of 98-99.9% whereas open flares burn with a low
intensity and the ambient temperature quickly cools the exhaust gases. Typical destruction
efficiencies are 90-95%.
A flare requires all free water from the biogas to be removed using a well-designed condensate
removal system. Specific design and control requirements may vary between states in Australia.
7.3.2 Boiler
Biogas can also be used as a boiler fuel, directly or co-fired with existing gas feed to provide hot
water for site use. Another option is to draw sludge from the lagoon, use boiler fuel to heat
sludge and return it to the lagoon to maintain or increase temperature of the lagoon system.
The outcome of an increase lagoon temperature is favourable, that is generation of higher
biogas flow and reduction in sludge. However, adequacy of downstream biogas pipework and
conditioning units must be checked to allow for increase of potential flows.
One common concern is corrosion in boilers due to hydrogen sulphide and moisture. Although
control of corrosion is possible by specifying robust material selection.
Boiler suppliers do not typically stipulate strict concentration limits for hydrogen sulphide. It is up
to the boiler owner and operator to assess the risk due to hydrogen sulphide in the biogas and
decide whether hydrogen sulphide removal is necessary. In general, boilers using biogas with a
hydrogen sulphide concentration of <1500-2,000 ppm, do not require hydrogen sulphide
removal before use (based on supplier specifications).
42 | GHD | Report for Dairy Australia - Anaerobic Digestion as a Treatment and Energy Recovery Technology for Dairy
Processing Waste Streams, 31/34091
7.3.3 Internal Combustion (IC) Engines
Biogas fuel for IC engines may be used to generate electricity, and is a long established and
extremely reliable technology. The engines for biogas applications are generally 25-30%
efficiency in converting fuel into electrical energy. The IC engines are modular in nature and
provides flexibility for incremental expansion.
IC engines usually require attention from trained personnel to ensure continued efficient
operation and they have relatively high maintenance costs due to more frequent regular
maintenance.
Newer gas engines have higher conversion to electricity up to 40%, but do require stricter gas
quality with H2S < 150ppm.
7.3.4 Cogeneration (IC Engine Generator with Waste Heat Recovery)
Cogeneration (and often termed combined heat and power (CHP)) is similar to IC engines with
the added ability to produce useful heat from the engine cooling system and the engine exhaust
heat recovery system. IC engine generators, as stated, operate around 25-30% efficiency in
converting fuel into electrical energy, but cogeneration can convert about 40% of the fuel energy
to heat, meaning the overall efficiency is around 60 to 70%.
The significant increase in overall efficiency as a result of recovery and reuse of the waste heat
from the engines reduces the volume of biogas that would be required for other heating
processes.
The drawback is the cogeneration has relatively higher initial capital cost and operation and
maintenance (O&M) costs than the engines without heat recovery. In many cases, it may be
offset by higher energy conversion efficiency.
7.3.5 Micro-Turbines
Microturbines are a new type of combustion turbine being used for stationary energy generation
applications. They are small combustion turbines, approximately the size of a refrigerator and
can be located on sites with space limitations for power production.
Microturbines comprise a compressor, combustor, turbine, alternator, recuperator, and
generator. Conversion to electricity is typically only 25%. Waste heat recovery can be used in
cogeneration to achieve energy efficiency levels greater than 80%. These small power plants
generally operate on low-CV fuels such as landfill gas and biogas. However, long term reliability
and operating costs of micro-turbines have yet to be confirmed. Also microturbines are sensitive
to siloxane contamination, and biogas supplied to microturbines is generally expected to require
more gas conditioning than IC engines. As a general rule risk of high siloxane concentrations in
the dairy industry is considered low.
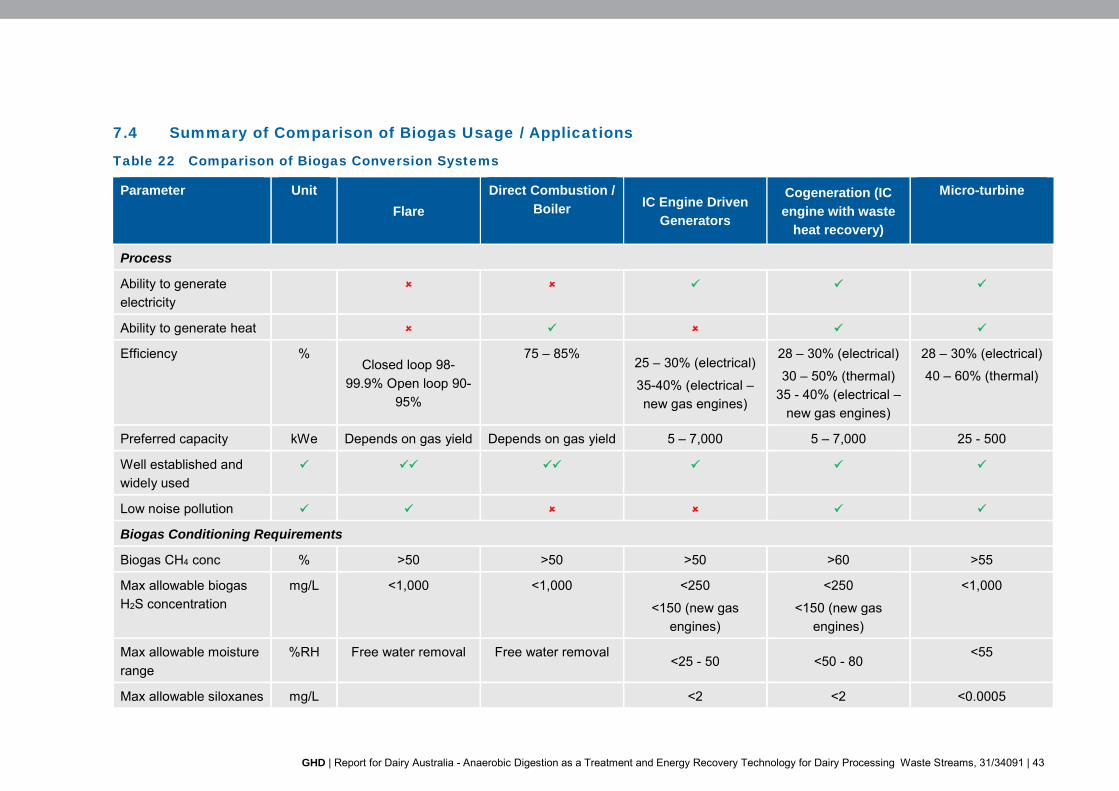
GHD | Report for Dairy Australia - Anaerobic Digestion as a Treatment and Energy Recovery Technology for Dairy Processing Waste Streams, 31/34091 | 43
7.4 Summary of Comparison of Biogas Usage / Applications
Table 22 Comparison of Biogas Conversion Systems
Parameter Unit
Flare
Direct Combustion /
Boiler IC Engine Driven
Generators
Cogeneration (IC
engine with waste
heat recovery)
Micro-turbine
Process
Ability to generate
electricity
Ability to generate heat
Efficiency % Closed loop 98-
99.9% Open loop 90-
95%
75 – 85% 25 – 30% (electrical)
35-40% (electrical –
new gas engines)
28 – 30% (electrical)
30 – 50% (thermal)
35 - 40% (electrical –
new gas engines)
28 – 30% (electrical)
40 – 60% (thermal)
Preferred capacity kWe Depends on gas yield Depends on gas yield 5 – 7,000 5 – 7,000 25 - 500
Well established and
widely used
Low noise pollution
Biogas Conditioning Requirements
Biogas CH4 conc % >50 >50 >50 >60 >55
Max allowable biogas
H2S concentration
mg/L <1,000 <1,000 <250
<150 (new gas
engines)
<250
<150 (new gas
engines)
<1,000
Max allowable moisture
range
%RH Free water removal Free water removal <25 - 50 <50 - 80
<55
Max allowable siloxanes mg/L <2 <2 <0.0005
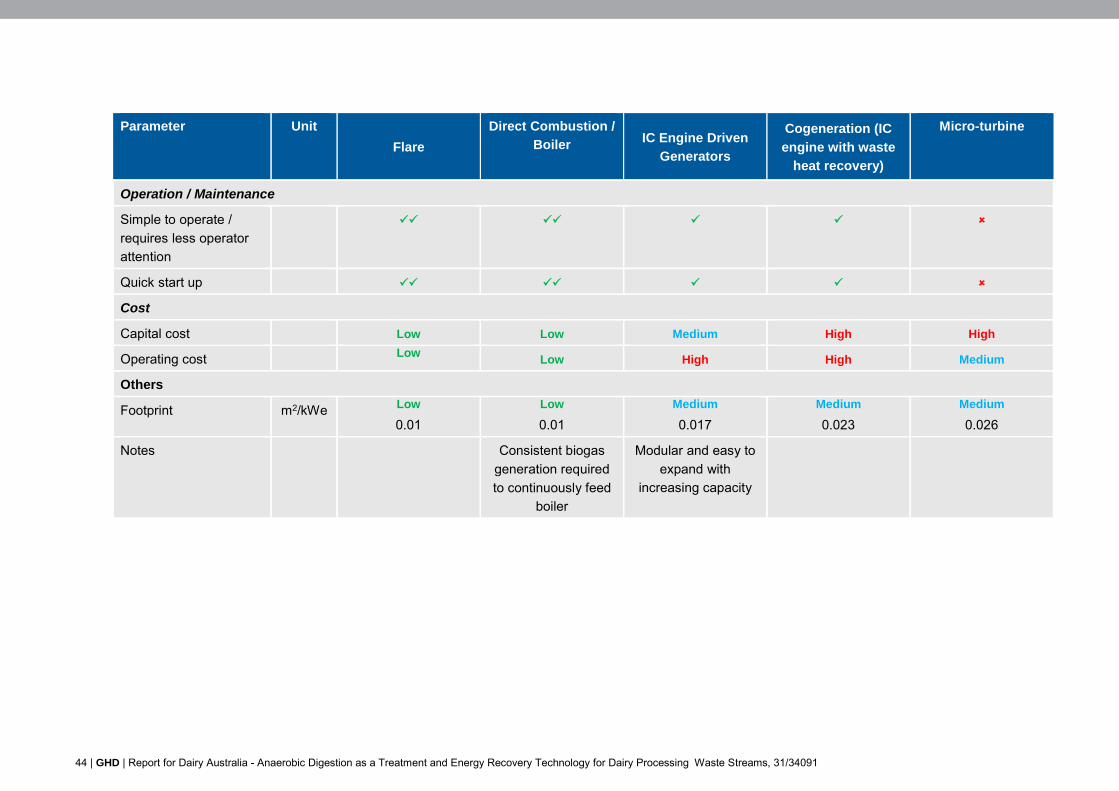
44 | GHD | Report for Dairy Australia - Anaerobic Digestion as a Treatment and Energy Recovery Technology for Dairy Processing Waste Streams, 31/34091
Parameter Unit
Flare
Direct Combustion /
Boiler IC Engine Driven
Generators
Cogeneration (IC
engine with waste
heat recovery)
Micro-turbine
Operation / Maintenance
Simple to operate /
requires less operator
attention
Quick start up
Cost
Capital cost Low Low Medium High High
Operating cost Low Low High High Medium
Others
Footprint m2/kWe Low
0.01
Low
0.01
Medium
0.017
Medium
0.023
Medium
0.026
Notes
Consistent biogas
generation required
to continuously feed
boiler
Modular and easy to
expand with
increasing capacity
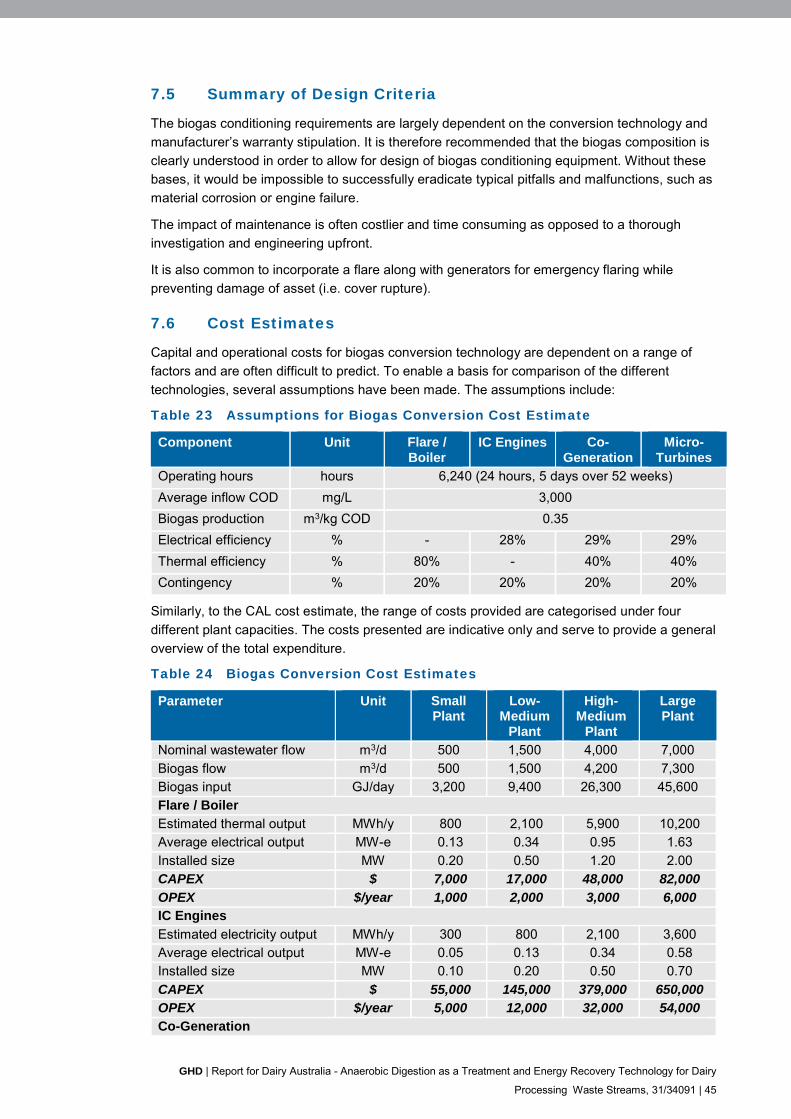
GHD | Report for Dairy Australia - Anaerobic Digestion as a Treatment and Energy Recovery Technology for Dairy
Processing Waste Streams, 31/34091 | 45
7.5 Summary of Design Criteria
The biogas conditioning requirements are largely dependent on the conversion technology and
manufacturer’s warranty stipulation. It is therefore recommended that the biogas composition is
clearly understood in order to allow for design of biogas conditioning equipment. Without these
bases, it would be impossible to successfully eradicate typical pitfalls and malfunctions, such as
material corrosion or engine failure.
The impact of maintenance is often costlier and time consuming as opposed to a thorough
investigation and engineering upfront.
It is also common to incorporate a flare along with generators for emergency flaring while
preventing damage of asset (i.e. cover rupture).
7.6 Cost Estimates
Capital and operational costs for biogas conversion technology are dependent on a range of
factors and are often difficult to predict. To enable a basis for comparison of the different
technologies, several assumptions have been made. The assumptions include:
Table 23 Assumptions for Biogas Conversion Cost Estimate
Component Unit Flare / Boiler
IC Engines Co-Generation
Micro-Turbines
Operating hours hours 6,240 (24 hours, 5 days over 52 weeks)
Average inflow COD mg/L 3,000
Biogas production m3/kg COD 0.35
Electrical efficiency % - 28% 29% 29%
Thermal efficiency % 80% - 40% 40%
Contingency % 20% 20% 20% 20%
Similarly, to the CAL cost estimate, the range of costs provided are categorised under four
different plant capacities. The costs presented are indicative only and serve to provide a general
overview of the total expenditure.
Table 24 Biogas Conversion Cost Estimates
Parameter Unit Small Plant
Low-Medium
Plant
High-Medium
Plant
Large Plant
Nominal wastewater flow m3/d 500 1,500 4,000 7,000
Biogas flow m3/d 500 1,500 4,200 7,300 Biogas input GJ/day 3,200 9,400 26,300 45,600 Flare / Boiler
Estimated thermal output MWh/y 800 2,100 5,900 10,200 Average electrical output MW-e 0.13 0.34 0.95 1.63
Installed size MW 0.20 0.50 1.20 2.00 CAPEX $ 7,000 17,000 48,000 82,000
OPEX $/year 1,000 2,000 3,000 6,000 IC Engines
Estimated electricity output MWh/y 300 800 2,100 3,600 Average electrical output MW-e 0.05 0.13 0.34 0.58 Installed size MW 0.10 0.20 0.50 0.70
CAPEX $ 55,000 145,000 379,000 650,000 OPEX $/year 5,000 12,000 32,000 54,000 Co-Generation
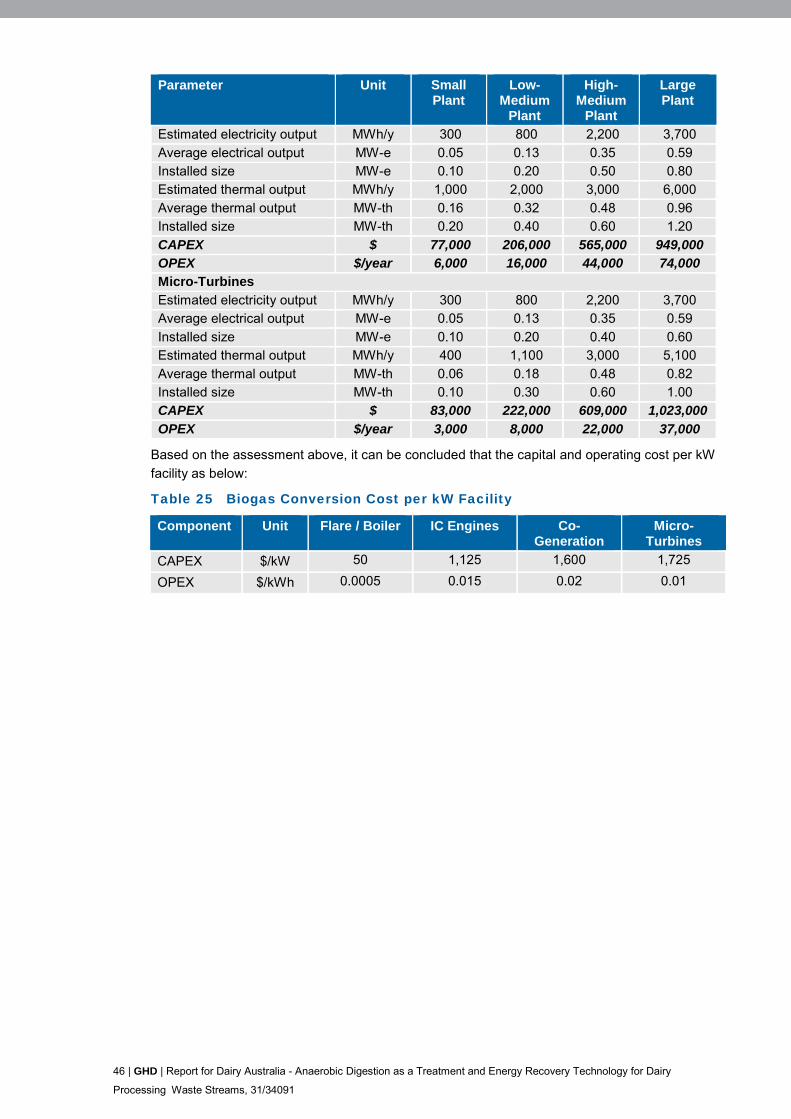
46 | GHD | Report for Dairy Australia - Anaerobic Digestion as a Treatment and Energy Recovery Technology for Dairy
Processing Waste Streams, 31/34091
Parameter Unit Small Plant
Low-Medium
Plant
High-Medium
Plant
Large Plant
Estimated electricity output MWh/y 300 800 2,200 3,700
Average electrical output MW-e 0.05 0.13 0.35 0.59 Installed size MW-e 0.10 0.20 0.50 0.80 Estimated thermal output MWh/y 1,000 2,000 3,000 6,000
Average thermal output MW-th 0.16 0.32 0.48 0.96 Installed size MW-th 0.20 0.40 0.60 1.20
CAPEX $ 77,000 206,000 565,000 949,000 OPEX $/year 6,000 16,000 44,000 74,000 Micro-Turbines
Estimated electricity output MWh/y 300 800 2,200 3,700 Average electrical output MW-e 0.05 0.13 0.35 0.59
Installed size MW-e 0.10 0.20 0.40 0.60 Estimated thermal output MWh/y 400 1,100 3,000 5,100
Average thermal output MW-th 0.06 0.18 0.48 0.82 Installed size MW-th 0.10 0.30 0.60 1.00 CAPEX $ 83,000 222,000 609,000 1,023,000
OPEX $/year 3,000 8,000 22,000 37,000
Based on the assessment above, it can be concluded that the capital and operating cost per kW
facility as below:
Table 25 Biogas Conversion Cost per kW Facility
Component Unit Flare / Boiler IC Engines Co-Generation
Micro-Turbines
CAPEX $/kW 50 1,125 1,600 1,725
OPEX $/kWh 0.0005 0.015 0.02 0.01
GHD | Report for Dairy Australia - Anaerobic Digestion as a Treatment and Energy Recovery Technology for Dairy
Processing Waste Streams, 31/34091 | 47
8. Case Study: Goulburn Valley Water’s Tatura WWTP (and CAL) This section provides an overview of Goulburn Valley Water’s Tatura wastewater treatment
plant design and biogas generation, performance metrics of the plant, success factors and
lessons learnt for the wider audience, but especially those considering introduction of a CAL.
8.1 Description of System
Tatura Milk Industries (TMI) is located in Goulburn Valley in northern Victoria and has been
manufacturing dairy products since 1907. The facility produces a combined 80,000 annual
tonnes of dairy products, including cream cheese, nutritional powders, lifestage powders, milk
and milk products and milk powders.
The Tatura manufacturing plant typically produces a daily wastewater flow of 4 ML/d, with
instantaneous flows ranging from zero to 300 kL/hr (peak). Pre-treatment of the waste includes
screening (coarse solids), flow equalisation in storage tanks and neutralisation. There is no
provision for FOG removal.
Neutralisation of pH waste is either performed by mixing high pH and low pH waste, thereby
minimising use of chemicals. If required, sodium hydroxide and CO2 are used for pH
adjustment. As a final pre-treatment step, waste stream is cooled from 42C to approximately
38C. The warm waste water is discharged to sewer where it mixes with town sewage and is
pumped to Goulburn Valley Water’s Tatura wastewater treatment plant (WWTP), located about
4 km south of the township, for treatment, storage, irrigation reuse and wetland discharge.
The Tatura WWTP comprises an inlet works with screening, three covered anaerobic lagoons
operating in parallel, aeration lagoons and maturation lagoons. Biogas is collected and can be
flared but is preferentially used to generate electricity. The power plant is owned and operated
by Diamond energy.
A brief wastewater management history follows. The anaerobic lagoons were initially aerobic
lagoons which, under increased loading (from factories) and odour complaints, drove GVW to
seek improvements to the process. A covered anaerobic lagoon was identified as the preferred
solution, being a robust, relatively simple and a low cost option. Hence, covers were installed in
2002 to convert the ponds to an anaerobic system, and have since mitigated odour issues and
improved overall plant efficiency.
Shortly after GVW investigated the feasibility of utilising the biogas for power generation.
Following a two GVW went to market via a tender process to convert captured biogas.
By 2006, a cogeneration system was built and commissioned by Diamond Energy. Diamond
Energy was contracted by GVW to install the facility on a leased parcel of land within the
existing WWTP. In turn, Diamond Energy receives revenue from electricity generated. The other
option available at that time was the offset option, where heat waste or electricity was to be sold
back to GVW for use within the WWTP. This was not taken up and eventually the cogeneration
unit was configured to only generate electricity for supply to offsite grid.
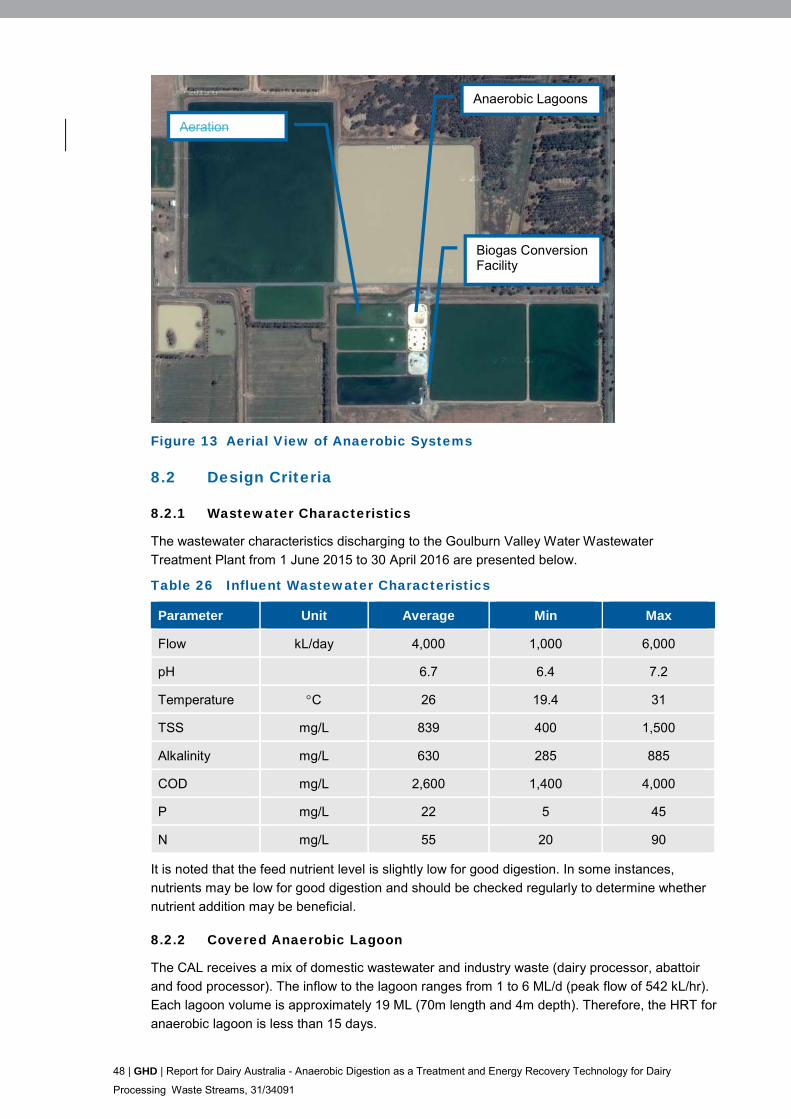
48 | GHD | Report for Dairy Australia - Anaerobic Digestion as a Treatment and Energy Recovery Technology for Dairy
Processing Waste Streams, 31/34091
Figure 13 Aerial View of Anaerobic Systems
8.2 Design Criteria
8.2.1 Wastewater Characteristics
The wastewater characteristics discharging to the Goulburn Valley Water Wastewater
Treatment Plant from 1 June 2015 to 30 April 2016 are presented below.
Table 26 Influent Wastewater Characteristics
Parameter Unit Average Min Max
Flow kL/day 4,000 1,000 6,000
pH 6.7 6.4 7.2
Temperature C 26 19.4 31
TSS mg/L 839 400 1,500
Alkalinity mg/L 630 285 885
COD mg/L 2,600 1,400 4,000
P mg/L 22 5 45
N mg/L 55 20 90
It is noted that the feed nutrient level is slightly low for good digestion. In some instances,
nutrients may be low for good digestion and should be checked regularly to determine whether
nutrient addition may be beneficial.
8.2.2 Covered Anaerobic Lagoon
The CAL receives a mix of domestic wastewater and industry waste (dairy processor, abattoir
and food processor). The inflow to the lagoon ranges from 1 to 6 ML/d (peak flow of 542 kL/hr).
Each lagoon volume is approximately 19 ML (70m length and 4m depth). Therefore, the HRT for
anaerobic lagoon is less than 15 days.
Anaerobic Lagoons
Biogas Conversion Facility
Aeration
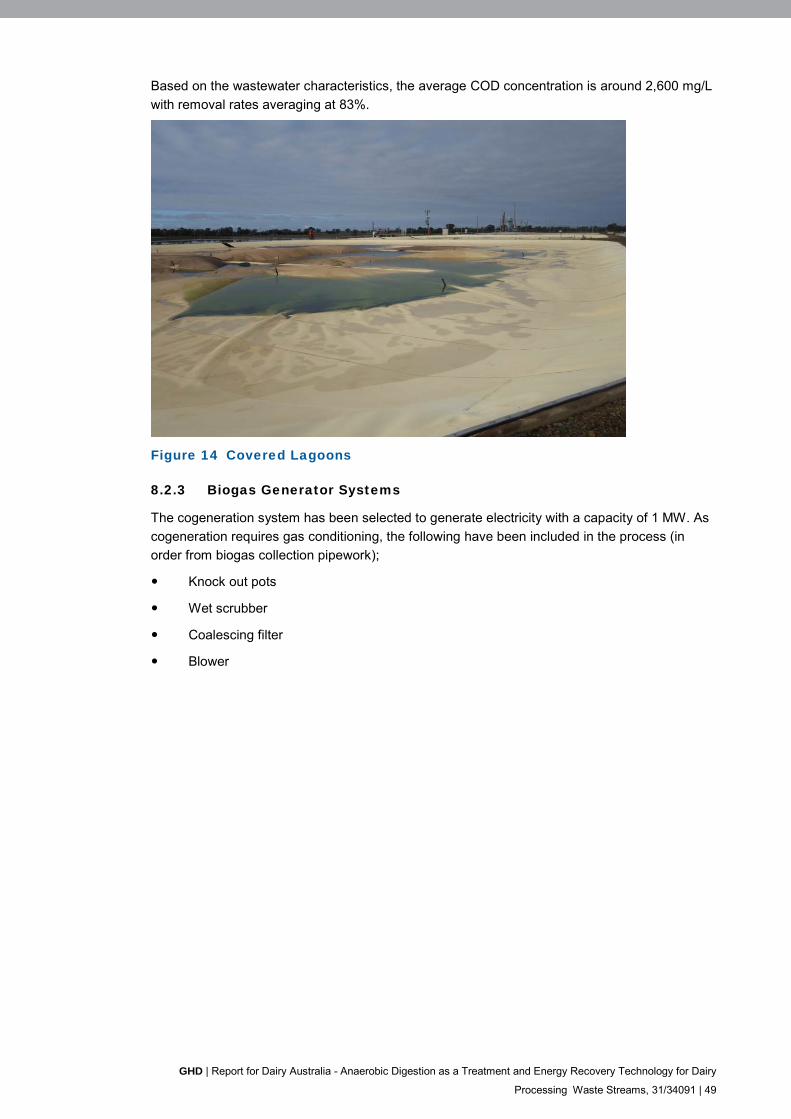
GHD | Report for Dairy Australia - Anaerobic Digestion as a Treatment and Energy Recovery Technology for Dairy
Processing Waste Streams, 31/34091 | 49
Based on the wastewater characteristics, the average COD concentration is around 2,600 mg/L
with removal rates averaging at 83%.
Figure 14 Covered Lagoons
8.2.3 Biogas Generator Systems
The cogeneration system has been selected to generate electricity with a capacity of 1 MW. As
cogeneration requires gas conditioning, the following have been included in the process (in
order from biogas collection pipework);
Knock out pots
Wet scrubber
Coalescing filter
Blower
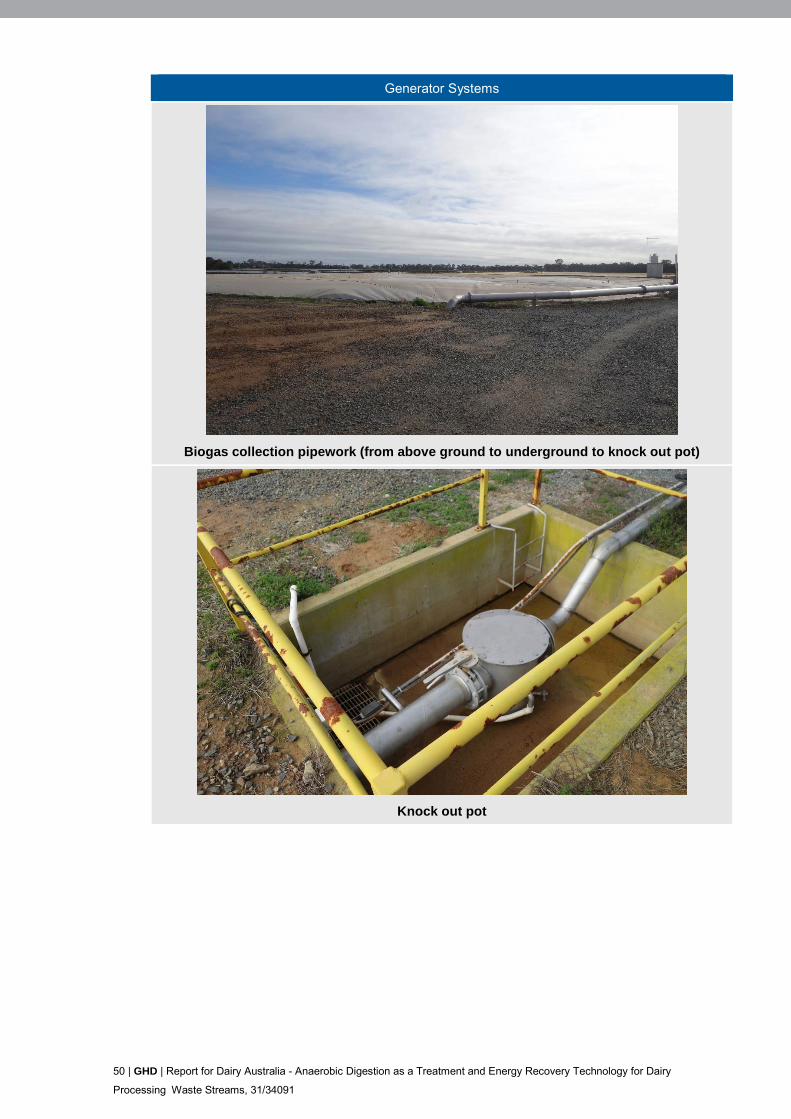
50 | GHD | Report for Dairy Australia - Anaerobic Digestion as a Treatment and Energy Recovery Technology for Dairy
Processing Waste Streams, 31/34091
Generator Systems
Biogas collection pipework (from above ground to underground to knock out pot)
Knock out pot
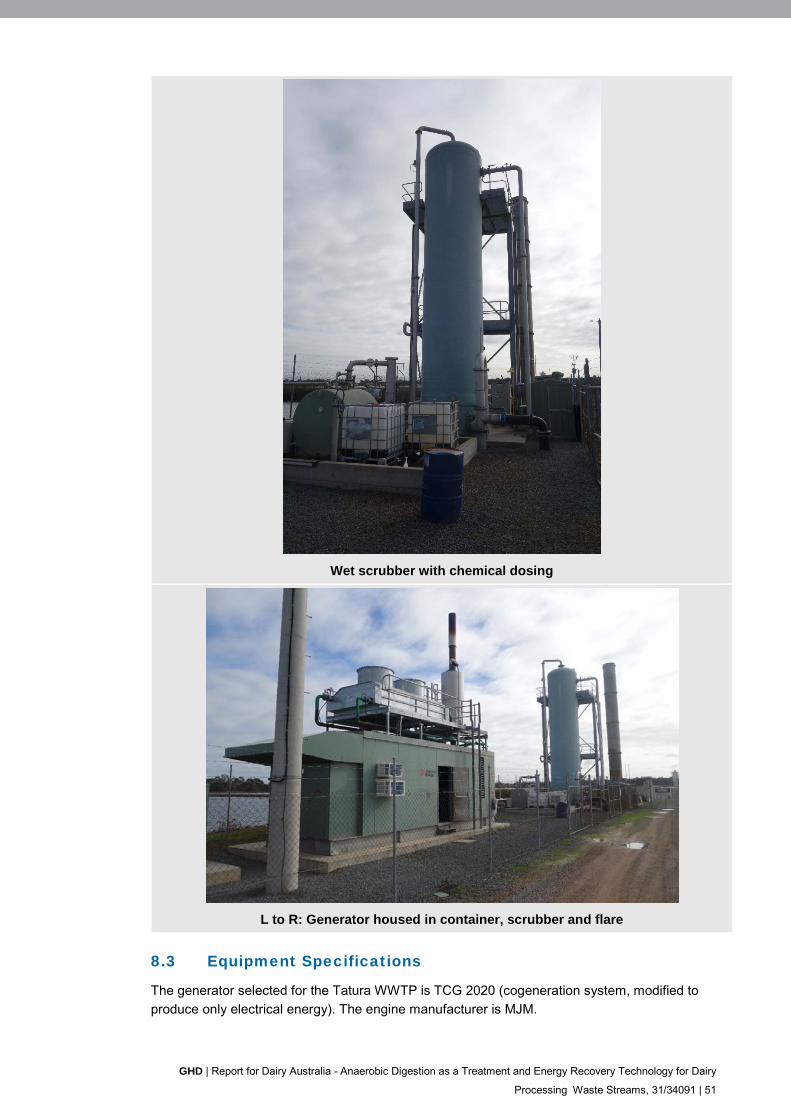
GHD | Report for Dairy Australia - Anaerobic Digestion as a Treatment and Energy Recovery Technology for Dairy
Processing Waste Streams, 31/34091 | 51
Wet scrubber with chemical dosing
L to R: Generator housed in container, scrubber and flare
8.3 Equipment Specifications
The generator selected for the Tatura WWTP is TCG 2020 (cogeneration system, modified to
produce only electrical energy). The engine manufacturer is MJM.
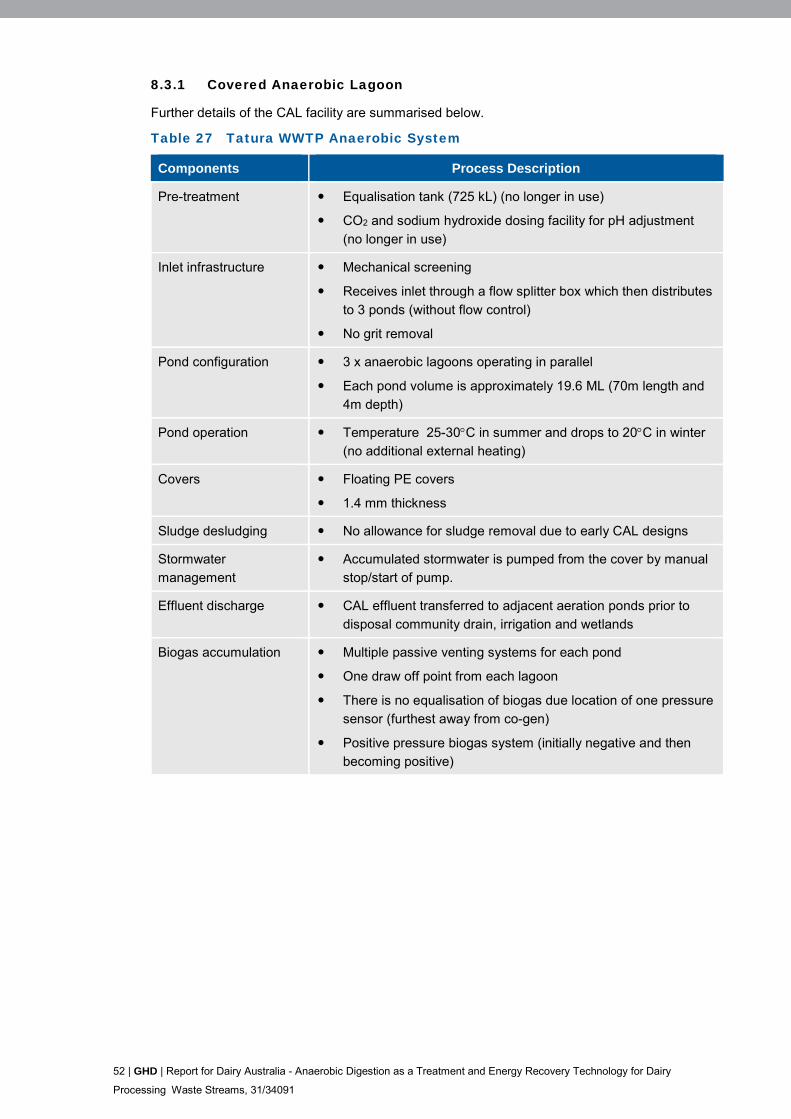
52 | GHD | Report for Dairy Australia - Anaerobic Digestion as a Treatment and Energy Recovery Technology for Dairy
Processing Waste Streams, 31/34091
8.3.1 Covered Anaerobic Lagoon
Further details of the CAL facility are summarised below.
Table 27 Tatura WWTP Anaerobic System
Components Process Description
Pre-treatment Equalisation tank (725 kL) (no longer in use)
CO2 and sodium hydroxide dosing facility for pH adjustment
(no longer in use)
Inlet infrastructure Mechanical screening
Receives inlet through a flow splitter box which then distributes
to 3 ponds (without flow control)
No grit removal
Pond configuration 3 x anaerobic lagoons operating in parallel
Each pond volume is approximately 19.6 ML (70m length and
4m depth)
Pond operation Temperature 25-30C in summer and drops to 20C in winter
(no additional external heating)
Covers Floating PE covers
1.4 mm thickness
Sludge desludging No allowance for sludge removal due to early CAL designs
Stormwater
management
Accumulated stormwater is pumped from the cover by manual
stop/start of pump.
Effluent discharge CAL effluent transferred to adjacent aeration ponds prior to
disposal community drain, irrigation and wetlands
Biogas accumulation Multiple passive venting systems for each pond
One draw off point from each lagoon
There is no equalisation of biogas due location of one pressure
sensor (furthest away from co-gen)
Positive pressure biogas system (initially negative and then
becoming positive)
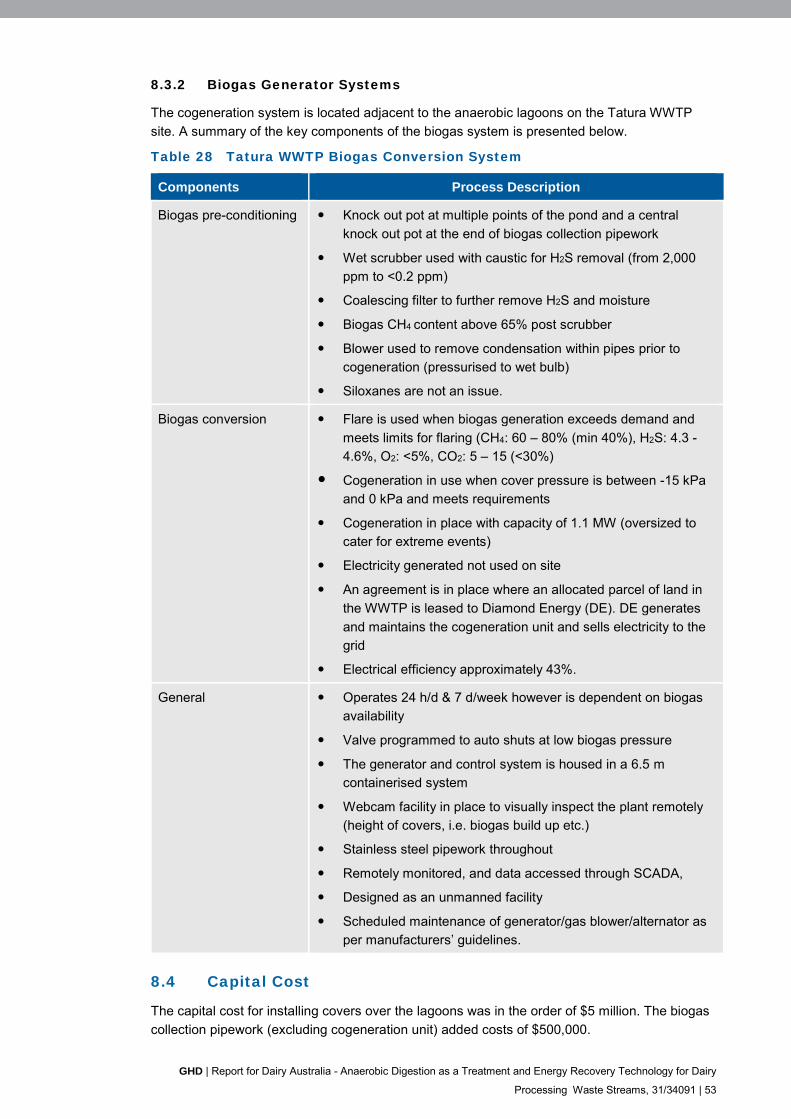
GHD | Report for Dairy Australia - Anaerobic Digestion as a Treatment and Energy Recovery Technology for Dairy
Processing Waste Streams, 31/34091 | 53
8.3.2 Biogas Generator Systems
The cogeneration system is located adjacent to the anaerobic lagoons on the Tatura WWTP
site. A summary of the key components of the biogas system is presented below.
Table 28 Tatura WWTP Biogas Conversion System
Components Process Description
Biogas pre-conditioning Knock out pot at multiple points of the pond and a central
knock out pot at the end of biogas collection pipework
Wet scrubber used with caustic for H2S removal (from 2,000
ppm to <0.2 ppm)
Coalescing filter to further remove H2S and moisture
Biogas CH4 content above 65% post scrubber
Blower used to remove condensation within pipes prior to
cogeneration (pressurised to wet bulb)
Siloxanes are not an issue.
Biogas conversion Flare is used when biogas generation exceeds demand and
meets limits for flaring (CH4: 60 – 80% (min 40%), H2S: 4.3 -
4.6%, O2: <5%, CO2: 5 – 15 (<30%)
Cogeneration in use when cover pressure is between -15 kPa
and 0 kPa and meets requirements
Cogeneration in place with capacity of 1.1 MW (oversized to
cater for extreme events)
Electricity generated not used on site
An agreement is in place where an allocated parcel of land in
the WWTP is leased to Diamond Energy (DE). DE generates
and maintains the cogeneration unit and sells electricity to the
grid
Electrical efficiency approximately 43%.
General Operates 24 h/d & 7 d/week however is dependent on biogas
availability
Valve programmed to auto shuts at low biogas pressure
The generator and control system is housed in a 6.5 m
containerised system
Webcam facility in place to visually inspect the plant remotely
(height of covers, i.e. biogas build up etc.)
Stainless steel pipework throughout
Remotely monitored, and data accessed through SCADA,
Designed as an unmanned facility
Scheduled maintenance of generator/gas blower/alternator as
per manufacturers’ guidelines.
8.4 Capital Cost
The capital cost for installing covers over the lagoons was in the order of $5 million. The biogas
collection pipework (excluding cogeneration unit) added costs of $500,000.
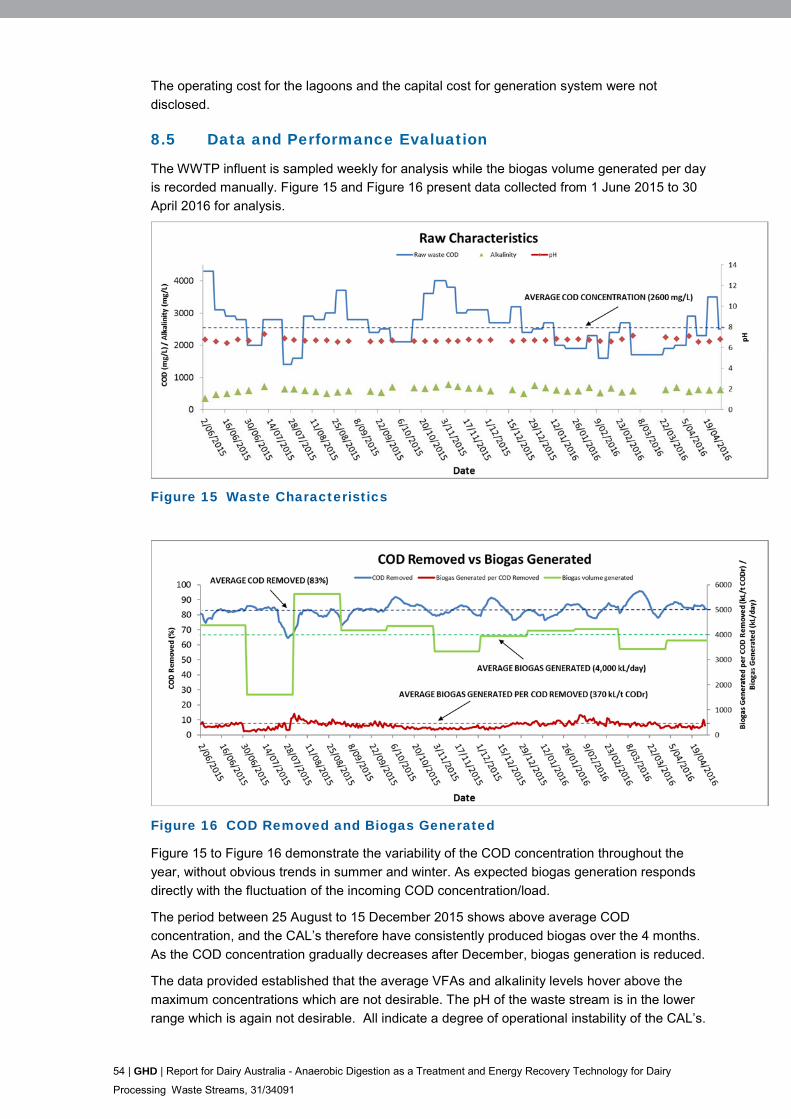
54 | GHD | Report for Dairy Australia - Anaerobic Digestion as a Treatment and Energy Recovery Technology for Dairy
Processing Waste Streams, 31/34091
The operating cost for the lagoons and the capital cost for generation system were not
disclosed.
8.5 Data and Performance Evaluation
The WWTP influent is sampled weekly for analysis while the biogas volume generated per day
is recorded manually. Figure 15 and Figure 16 present data collected from 1 June 2015 to 30
April 2016 for analysis.
Figure 15 Waste Characteristics
Figure 16 COD Removed and Biogas Generated
Figure 15 to Figure 16 demonstrate the variability of the COD concentration throughout the
year, without obvious trends in summer and winter. As expected biogas generation responds
directly with the fluctuation of the incoming COD concentration/load.
The period between 25 August to 15 December 2015 shows above average COD
concentration, and the CAL’s therefore have consistently produced biogas over the 4 months.
As the COD concentration gradually decreases after December, biogas generation is reduced.
The data provided established that the average VFAs and alkalinity levels hover above the
maximum concentrations which are not desirable. The pH of the waste stream is in the lower
range which is again not desirable. All indicate a degree of operational instability of the CAL’s.
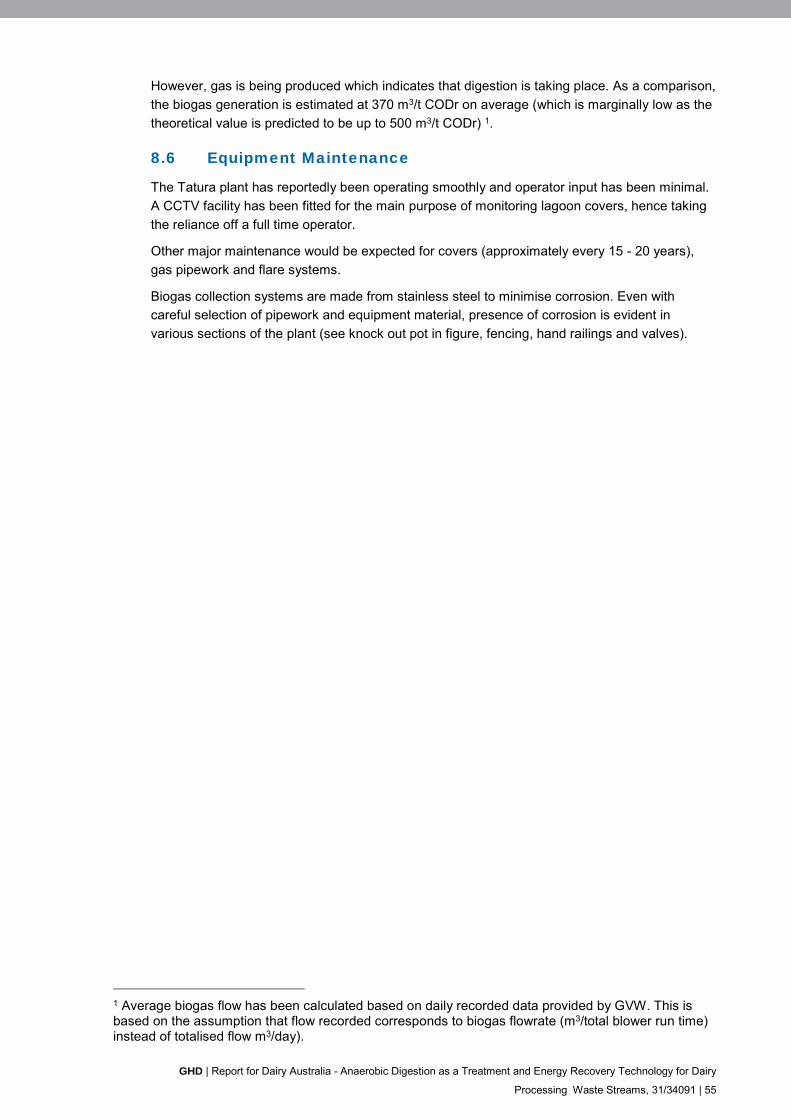
GHD | Report for Dairy Australia - Anaerobic Digestion as a Treatment and Energy Recovery Technology for Dairy
Processing Waste Streams, 31/34091 | 55
However, gas is being produced which indicates that digestion is taking place. As a comparison,
the biogas generation is estimated at 370 m3/t CODr on average (which is marginally low as the
theoretical value is predicted to be up to 500 m3/t CODr) 1.
8.6 Equipment Maintenance
The Tatura plant has reportedly been operating smoothly and operator input has been minimal.
A CCTV facility has been fitted for the main purpose of monitoring lagoon covers, hence taking
the reliance off a full time operator.
Other major maintenance would be expected for covers (approximately every 15 - 20 years),
gas pipework and flare systems.
Biogas collection systems are made from stainless steel to minimise corrosion. Even with
careful selection of pipework and equipment material, presence of corrosion is evident in
various sections of the plant (see knock out pot in figure, fencing, hand railings and valves).
1 Average biogas flow has been calculated based on daily recorded data provided by GVW. This is based on the assumption that flow recorded corresponds to biogas flowrate (m3/total blower run time) instead of totalised flow m3/day).
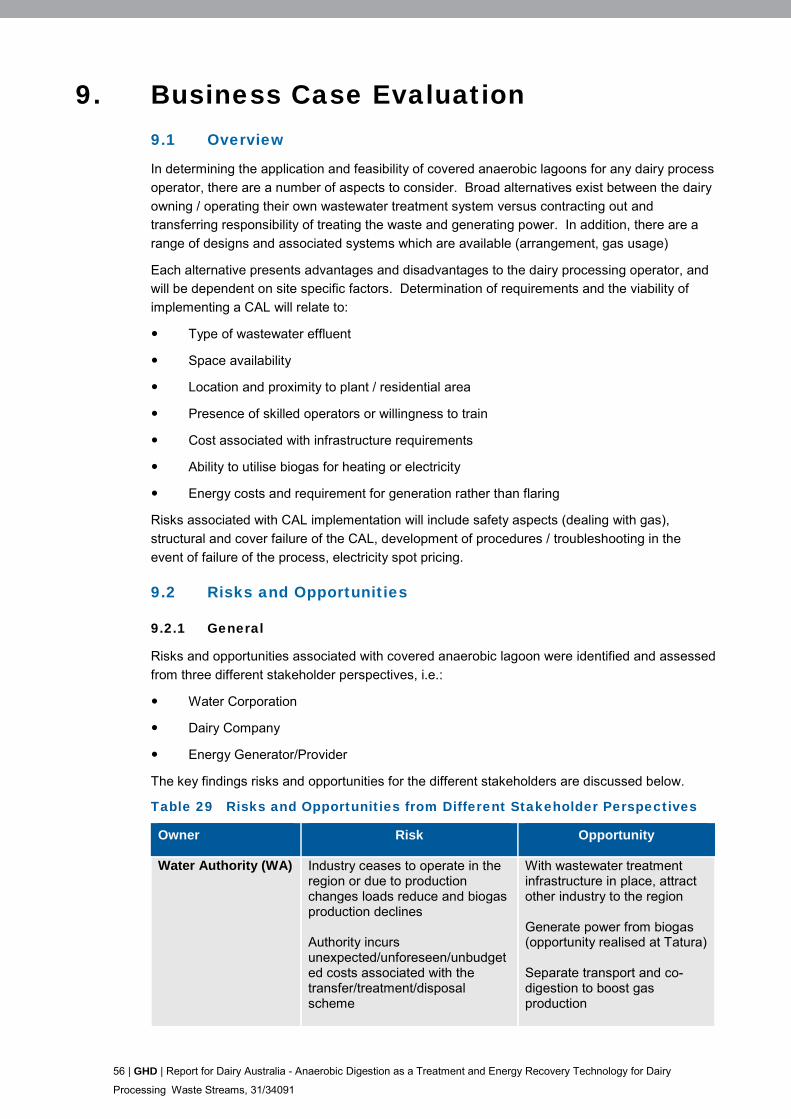
56 | GHD | Report for Dairy Australia - Anaerobic Digestion as a Treatment and Energy Recovery Technology for Dairy
Processing Waste Streams, 31/34091
9. Business Case Evaluation 9.1 Overview
In determining the application and feasibility of covered anaerobic lagoons for any dairy process
operator, there are a number of aspects to consider. Broad alternatives exist between the dairy
owning / operating their own wastewater treatment system versus contracting out and
transferring responsibility of treating the waste and generating power. In addition, there are a
range of designs and associated systems which are available (arrangement, gas usage)
Each alternative presents advantages and disadvantages to the dairy processing operator, and
will be dependent on site specific factors. Determination of requirements and the viability of
implementing a CAL will relate to:
Type of wastewater effluent
Space availability
Location and proximity to plant / residential area
Presence of skilled operators or willingness to train
Cost associated with infrastructure requirements
Ability to utilise biogas for heating or electricity
Energy costs and requirement for generation rather than flaring
Risks associated with CAL implementation will include safety aspects (dealing with gas),
structural and cover failure of the CAL, development of procedures / troubleshooting in the
event of failure of the process, electricity spot pricing.
9.2 Risks and Opportunities
9.2.1 General
Risks and opportunities associated with covered anaerobic lagoon were identified and assessed
from three different stakeholder perspectives, i.e.:
Water Corporation
Dairy Company
Energy Generator/Provider
The key findings risks and opportunities for the different stakeholders are discussed below.
Table 29 Risks and Opportunities from Different Stakeholder Perspectives
Owner Risk Opportunity
Water Authority (WA) Industry ceases to operate in the region or due to production changes loads reduce and biogas production declines Authority incurs unexpected/unforeseen/unbudgeted costs associated with the transfer/treatment/disposal scheme
With wastewater treatment infrastructure in place, attract other industry to the region Generate power from biogas (opportunity realised at Tatura) Separate transport and co-digestion to boost gas production

GHD | Report for Dairy Australia - Anaerobic Digestion as a Treatment and Energy Recovery Technology for Dairy
Processing Waste Streams, 31/34091 | 57
Owner Risk Opportunity
Odour generation and septicity concerns with handling high strength waste
Dairy Company Needs to comply with TWA discharge conditions and risks fines for non-compliance Exposure to annual trade waste charge increases
Outsource operational responsibility for specialist wastewater treatment and disposal to others Provides alternative funding and commercial arrangements, freeing up capital for dairy processing investment Transfers EPA regulatory requirements for treatment and disposal to WA
Energy Generator Lack of control on biogas availability and composition Industry ceases to operate in the region or due to production changes loads reduce and biogas production declines Regulatory changes which affect ability to supply/sell electricity to the market or otherwise affect commercial model
Maximise profitability by preferentially operate the facility when electricity spot price on market is high
Dairy Owns and Operates Plant and Biogas System
Risk of project delays and high costs due to lengthy and costly approvals process Underestimate staff training requirements to run and operate the facility, resulting in additional cost Odour generation and septicity concerns with handling high strength waste Upset of process due to dumps or wastewater characteristics variability, and either expensive tankering or slow management of loading to fix the process
Biogas can be utilised onsite as boiler fuel for steam generation and or in cogeneration facility offsetting off-site natural gas and power requirements. Opportunity for government grants
Where sewers are available, discharging of wastewater into the authority sewer presents a risk
to the operating authority. If a local sewer is not available, then the onus is on the dairy operator
to ensure appropriate treatment and disposal of effluent (by irrigation or other avenues). In a
number of cases, recognising that wastewater management is not the core business of the
dairy, treatment and / or energy generation, might be contracted out. These aspects are
inherent in determining the way forward for the dairy processor in terms of management of
wastewater.
A check list is provided in Section 9.3 below, to guide the user in assessing the viability of
implementing a CAL.
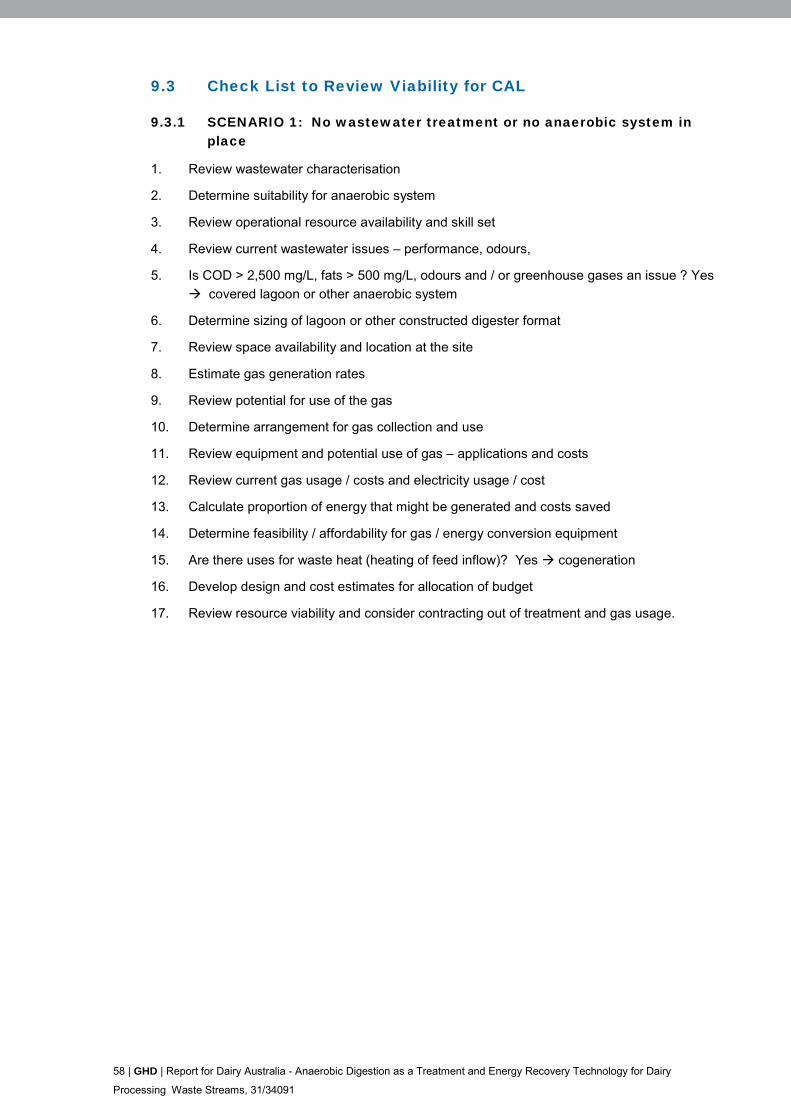
58 | GHD | Report for Dairy Australia - Anaerobic Digestion as a Treatment and Energy Recovery Technology for Dairy
Processing Waste Streams, 31/34091
9.3 Check List to Review Viability for CAL
9.3.1 SCENARIO 1: No wastewater treatment or no anaerobic system in place
1. Review wastewater characterisation
2. Determine suitability for anaerobic system
3. Review operational resource availability and skill set
4. Review current wastewater issues – performance, odours,
5. Is COD > 2,500 mg/L, fats > 500 mg/L, odours and / or greenhouse gases an issue ? Yes
covered lagoon or other anaerobic system
6. Determine sizing of lagoon or other constructed digester format
7. Review space availability and location at the site
8. Estimate gas generation rates
9. Review potential for use of the gas
10. Determine arrangement for gas collection and use
11. Review equipment and potential use of gas – applications and costs
12. Review current gas usage / costs and electricity usage / cost
13. Calculate proportion of energy that might be generated and costs saved
14. Determine feasibility / affordability for gas / energy conversion equipment
15. Are there uses for waste heat (heating of feed inflow)? Yes cogeneration
16. Develop design and cost estimates for allocation of budget
17. Review resource viability and consider contracting out of treatment and gas usage.
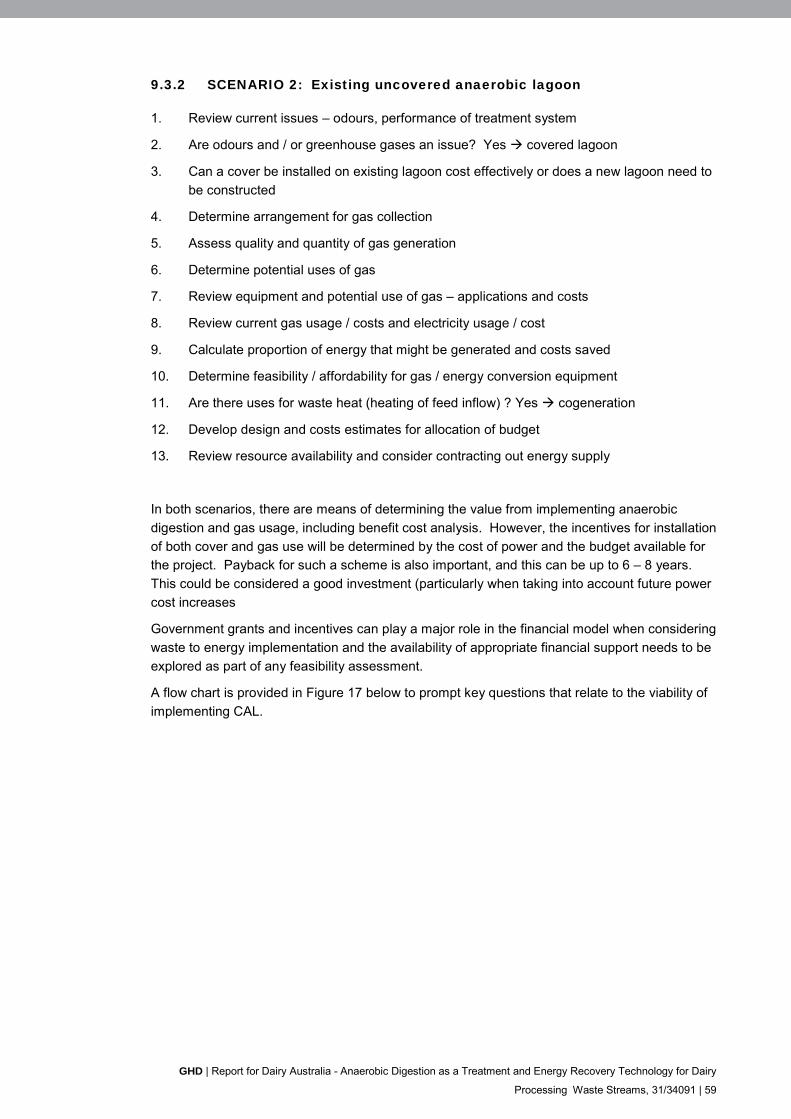
GHD | Report for Dairy Australia - Anaerobic Digestion as a Treatment and Energy Recovery Technology for Dairy
Processing Waste Streams, 31/34091 | 59
9.3.2 SCENARIO 2: Existing uncovered anaerobic lagoon
1. Review current issues – odours, performance of treatment system
2. Are odours and / or greenhouse gases an issue? Yes covered lagoon
3. Can a cover be installed on existing lagoon cost effectively or does a new lagoon need to
be constructed
4. Determine arrangement for gas collection
5. Assess quality and quantity of gas generation
6. Determine potential uses of gas
7. Review equipment and potential use of gas – applications and costs
8. Review current gas usage / costs and electricity usage / cost
9. Calculate proportion of energy that might be generated and costs saved
10. Determine feasibility / affordability for gas / energy conversion equipment
11. Are there uses for waste heat (heating of feed inflow) ? Yes cogeneration
12. Develop design and costs estimates for allocation of budget
13. Review resource availability and consider contracting out energy supply
In both scenarios, there are means of determining the value from implementing anaerobic
digestion and gas usage, including benefit cost analysis. However, the incentives for installation
of both cover and gas use will be determined by the cost of power and the budget available for
the project. Payback for such a scheme is also important, and this can be up to 6 – 8 years.
This could be considered a good investment (particularly when taking into account future power
cost increases
Government grants and incentives can play a major role in the financial model when considering
waste to energy implementation and the availability of appropriate financial support needs to be
explored as part of any feasibility assessment.
A flow chart is provided in Figure 17 below to prompt key questions that relate to the viability of
implementing CAL.
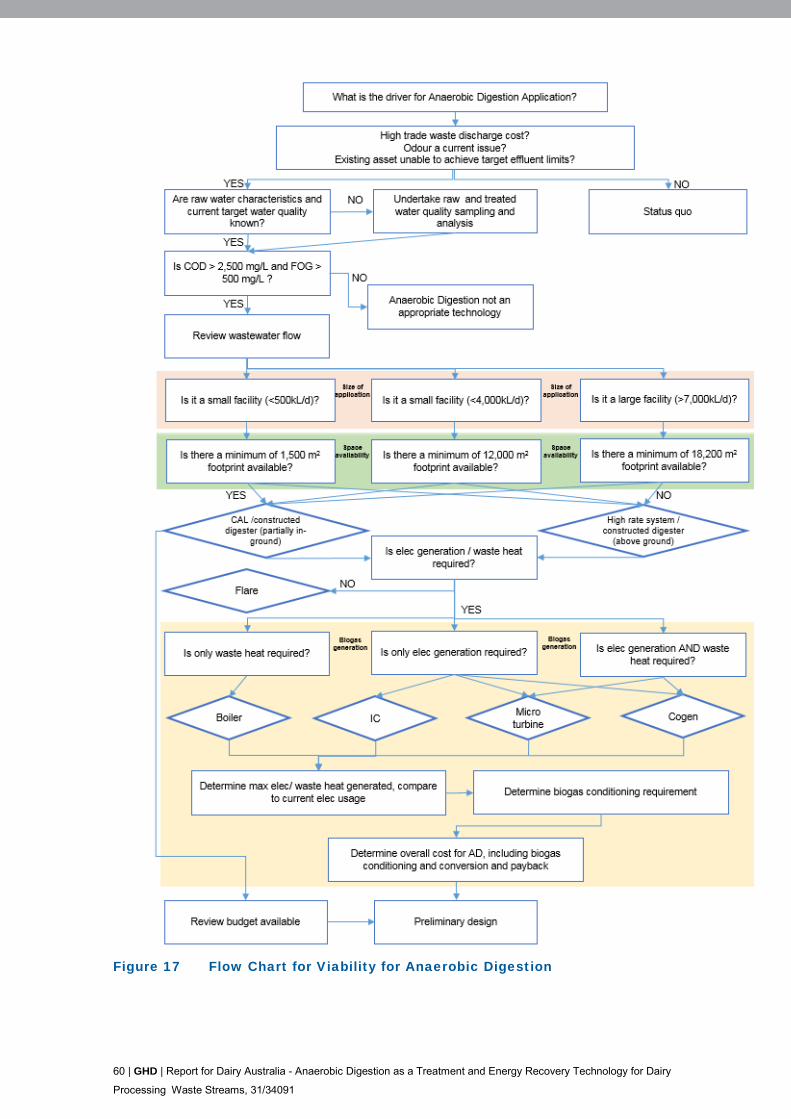
60 | GHD | Report for Dairy Australia - Anaerobic Digestion as a Treatment and Energy Recovery Technology for Dairy
Processing Waste Streams, 31/34091
Figure 17 Flow Chart for Viability for Anaerobic Digestion
GHD | Report for Dairy Australia - Anaerobic Digestion as a Treatment and Energy Recovery Technology for Dairy
Processing Waste Streams, 31/34091 | 61
Disclaimer This report “Anaerobic Digestion as a Treatment and Energy Recovery Technology for Dairy Processing Waste Streams”:
has been prepared by GHD Pty Ltd (“GHD”) for Dairy Australia (“DA”);
may only be used and relied on by DA for the purpose agreed between GHD and Dairy Australia as
set out in section 1.3 of this report;
must not be copied to, used by, or relied on by any person other than DA without the prior written
consent of GHD;
may only be used for the purpose of overview and guidelines of issues and constraints associated
with application of anaerobic digestion technologies for dairy manufacturing industries (and must
not be used for any other purpose).
GHD otherwise disclaims responsibility to any person other than Dairy Australia arising in connection with this report. GHD also excludes implied warranties and conditions, to the extent legally permissible.
The services undertaken by GHD in connection with preparing this report were limited to those specifically detailed in the report and are subject to the scope limitations set out in the report.
The opinions, conclusions and any recommendations in this report are based on conditions encountered and information reviewed at the date of preparation of the report. GHD has no responsibility or obligation to update this report to account for events or changes occurring subsequent to the date that the report was prepared.
The opinions, conclusions and any recommendations in this report are based on assumptions made by GHD described in this report. GHD disclaims liability arising from any of the assumptions being incorrect.
GHD has prepared this report on the basis of information provided by Dairy Australia and others who provided information to GHD, which GHD has not independently verified or checked beyond the agreed scope of work. GHD does not accept liability in connection with such unverified information, including errors and omissions in the report which were caused by errors or omissions in that information.
GHD has prepared the preliminary cost estimate for covered anaerobic lagoons set out in sections 5.4, 6.8, 7.6 of this report (“Cost Estimate”) using information reasonably available to the GHD employee(s) who prepared this report; and based on assumptions and judgments made by GHD.
The Cost Estimate has been prepared for the purpose of indicating cost for a range of dairy manufacturing industries of various capacity and must not be used for any other purpose.
The Cost Estimate is a preliminary estimate only. Actual prices, costs and other variables may be different to those used to prepare the Cost Estimate and may change. Unless as otherwise specified in this report, no detailed quotation has been obtained for actions identified in this report. GHD does not represent, warrant or guarantee that the works can or will be undertaken at a cost which is the same or less than the Cost Estimate. GHD has prepared this report as an independent consultant for DA. GHD is not involved directly in project procurement work, significant shareholding or vested interest in a third party company (i.e. proprietors of technology presented in the report) seeking contracts for projects over which GHD has influence.

GHD | Report for Dairy Australia - Anaerobic Digestion as a Treatment and Energy Recovery Technology for Dairy Processing
Waste Streams, 31/34091
Appendices
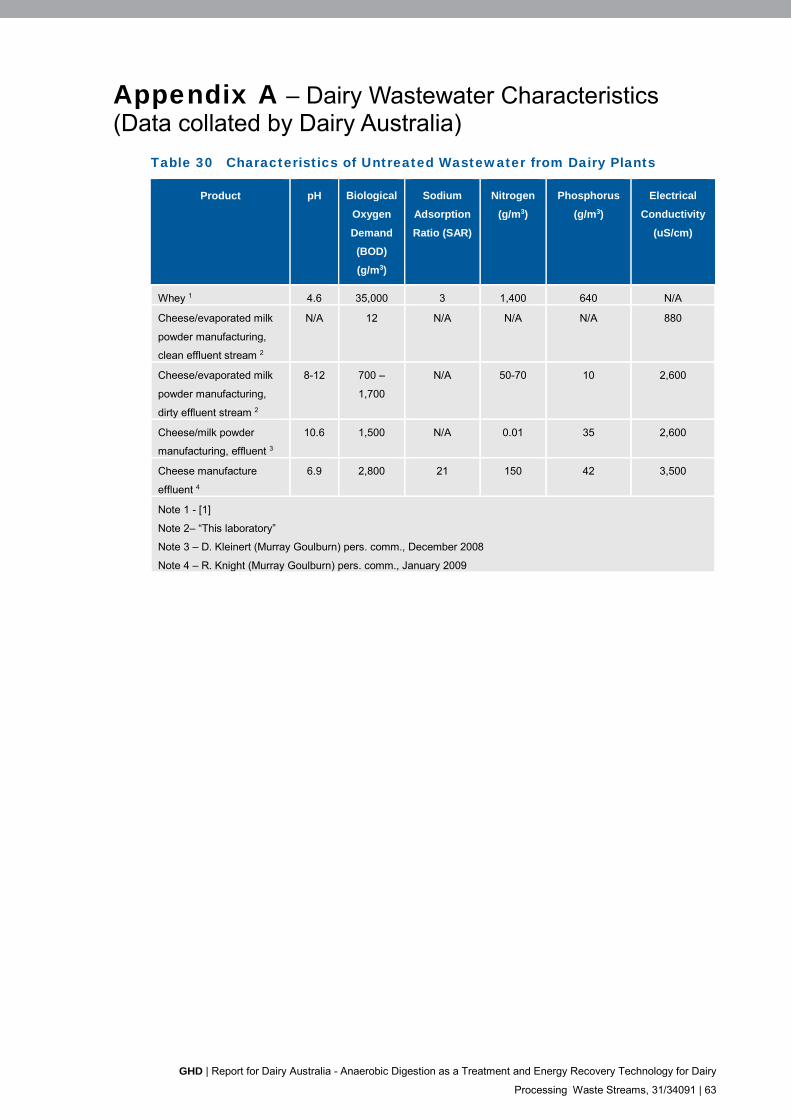
GHD | Report for Dairy Australia - Anaerobic Digestion as a Treatment and Energy Recovery Technology for Dairy
Processing Waste Streams, 31/34091 | 63
Appendix A – Dairy Wastewater Characteristics (Data collated by Dairy Australia)
Table 30 Characteristics of Untreated Wastewater from Dairy Plants
Product pH Biological
Oxygen
Demand
(BOD)
(g/m3)
Sodium
Adsorption
Ratio (SAR)
Nitrogen
(g/m3)
Phosphorus
(g/m3)
Electrical
Conductivity
(uS/cm)
Whey 1 4.6 35,000 3 1,400 640 N/A
Cheese/evaporated milk
powder manufacturing,
clean effluent stream 2
N/A 12 N/A N/A N/A 880
Cheese/evaporated milk
powder manufacturing,
dirty effluent stream 2
8-12 700 –
1,700
N/A 50-70 10 2,600
Cheese/milk powder
manufacturing, effluent 3
10.6 1,500 N/A 0.01 35 2,600
Cheese manufacture
effluent 4
6.9 2,800 21 150 42 3,500
Note 1 - [1]
Note 2– “This laboratory”
Note 3 – D. Kleinert (Murray Goulburn) pers. comm., December 2008
Note 4 – R. Knight (Murray Goulburn) pers. comm., January 2009
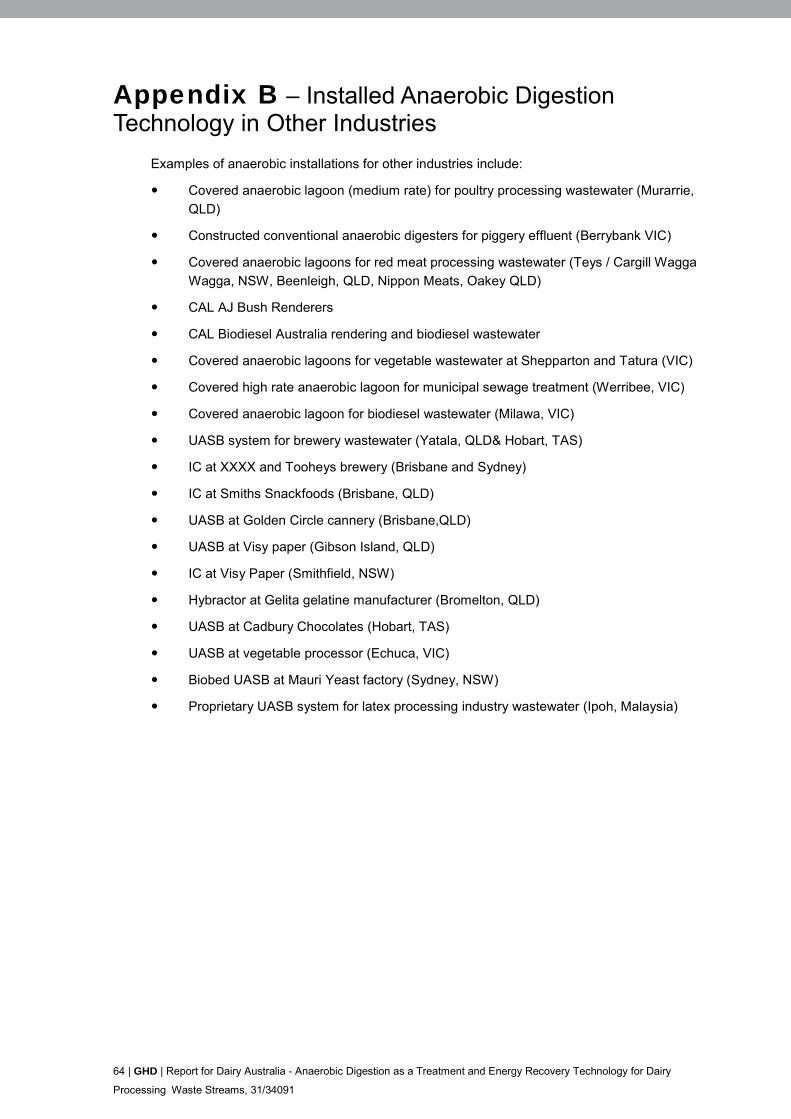
64 | GHD | Report for Dairy Australia - Anaerobic Digestion as a Treatment and Energy Recovery Technology for Dairy
Processing Waste Streams, 31/34091
Appendix B – Installed Anaerobic Digestion Technology in Other Industries
Examples of anaerobic installations for other industries include:
Covered anaerobic lagoon (medium rate) for poultry processing wastewater (Murarrie,
QLD)
Constructed conventional anaerobic digesters for piggery effluent (Berrybank VIC)
Covered anaerobic lagoons for red meat processing wastewater (Teys / Cargill Wagga
Wagga, NSW, Beenleigh, QLD, Nippon Meats, Oakey QLD)
CAL AJ Bush Renderers
CAL Biodiesel Australia rendering and biodiesel wastewater
Covered anaerobic lagoons for vegetable wastewater at Shepparton and Tatura (VIC)
Covered high rate anaerobic lagoon for municipal sewage treatment (Werribee, VIC)
Covered anaerobic lagoon for biodiesel wastewater (Milawa, VIC)
UASB system for brewery wastewater (Yatala, QLD& Hobart, TAS)
IC at XXXX and Tooheys brewery (Brisbane and Sydney)
IC at Smiths Snackfoods (Brisbane, QLD)
UASB at Golden Circle cannery (Brisbane,QLD)
UASB at Visy paper (Gibson Island, QLD)
IC at Visy Paper (Smithfield, NSW)
Hybractor at Gelita gelatine manufacturer (Bromelton, QLD)
UASB at Cadbury Chocolates (Hobart, TAS)
UASB at vegetable processor (Echuca, VIC)
Biobed UASB at Mauri Yeast factory (Sydney, NSW)
Proprietary UASB system for latex processing industry wastewater (Ipoh, Malaysia)

GHD | Report for Dairy Australia - Anaerobic Digestion as a Treatment and Energy Recovery Technology for Dairy Processing Waste Streams, 31/34091
Appendix C – Trade Waste
Table 31 Example of Trade Waste Charges With and Without AD Treatment (Goulburn Valley Water)
Parameters Units Typical Raw
Dairy Effluent
Typical Treated
Dairy Effluent
(Trade Waste
Limit)
Unit Charges
($/kg or $/kL)
Goulburn Valley
Water -
Category 3
Trade Waste
(No Treatment)
Percentage of
Waste Charges
(No Treatment)
Goulburn Valley
Water -
Category 3
Trade Waste
(With
Treatment)
Percentage of
Waste Charges
(No Treatment)
Flow kL/d 1000 1000 $0.7778 $777.80 34% $777.80 63%
BOD mg/L 2500 500 (600) $0.5182 $984.58 43% $- 0%
Total N mg/L 100 50 (150) $0.7778 $- 0% $- 0%
Total P mg/L 50 20 (20) $2.0747 $62.24 3% $- 0%
Sodium mg/L 500 500 $0.9188 $459.40 20% $459.40 37%
Trade Waste
Charge
ML/day $2,284.02 100% $1,237.20 100%
ML/year $833,667.67 $451,578.00
Trade Waste
Savings
$/year $382,089.67
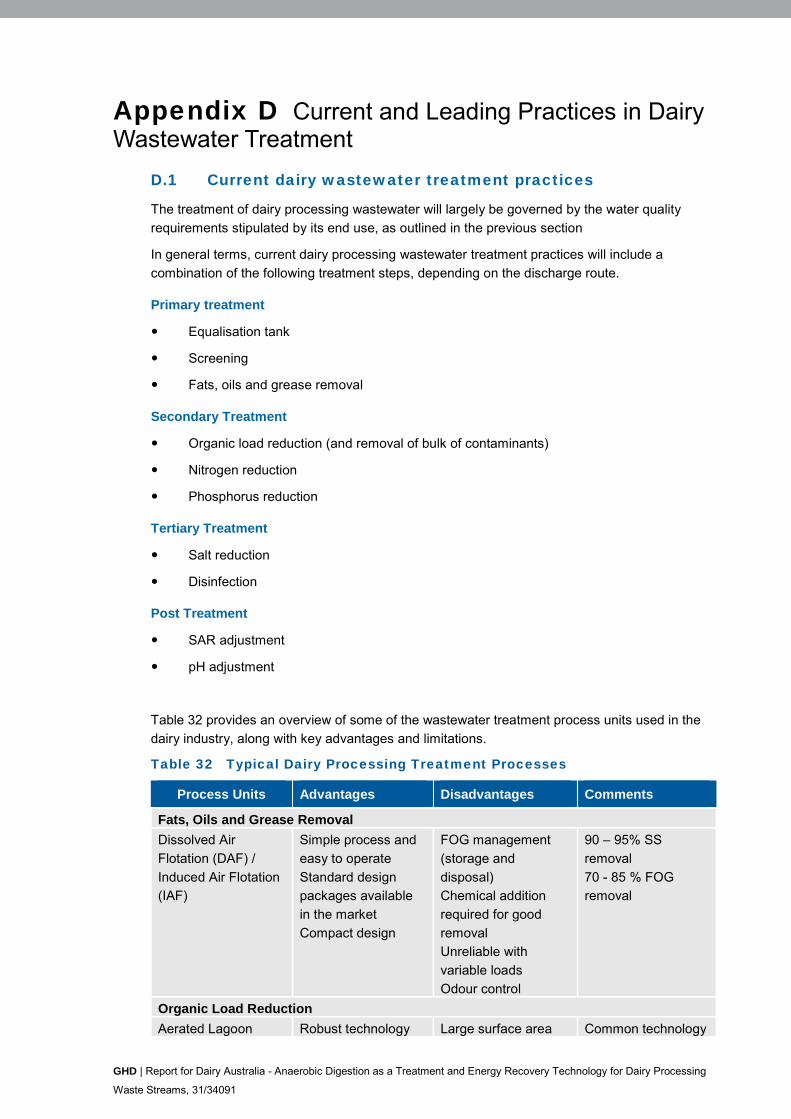
GHD | Report for Dairy Australia - Anaerobic Digestion as a Treatment and Energy Recovery Technology for Dairy Processing
Waste Streams, 31/34091
Appendix D Current and Leading Practices in Dairy Wastewater Treatment
D.1 Current dairy wastewater treatment practices
The treatment of dairy processing wastewater will largely be governed by the water quality
requirements stipulated by its end use, as outlined in the previous section
In general terms, current dairy processing wastewater treatment practices will include a
combination of the following treatment steps, depending on the discharge route.
Primary treatment
Equalisation tank
Screening
Fats, oils and grease removal
Secondary Treatment
Organic load reduction (and removal of bulk of contaminants)
Nitrogen reduction
Phosphorus reduction
Tertiary Treatment
Salt reduction
Disinfection
Post Treatment
SAR adjustment
pH adjustment
Table 32 provides an overview of some of the wastewater treatment process units used in the
dairy industry, along with key advantages and limitations.
Table 32 Typical Dairy Processing Treatment Processes
Process Units Advantages Disadvantages Comments
Fats, Oils and Grease Removal
Dissolved Air
Flotation (DAF) /
Induced Air Flotation
(IAF)
Simple process and
easy to operate
Standard design
packages available
in the market
Compact design
FOG management
(storage and
disposal)
Chemical addition
required for good
removal
Unreliable with
variable loads
Odour control
90 – 95% SS
removal
70 - 85 % FOG
removal
Organic Load Reduction
Aerated Lagoon Robust technology Large surface area Common technology
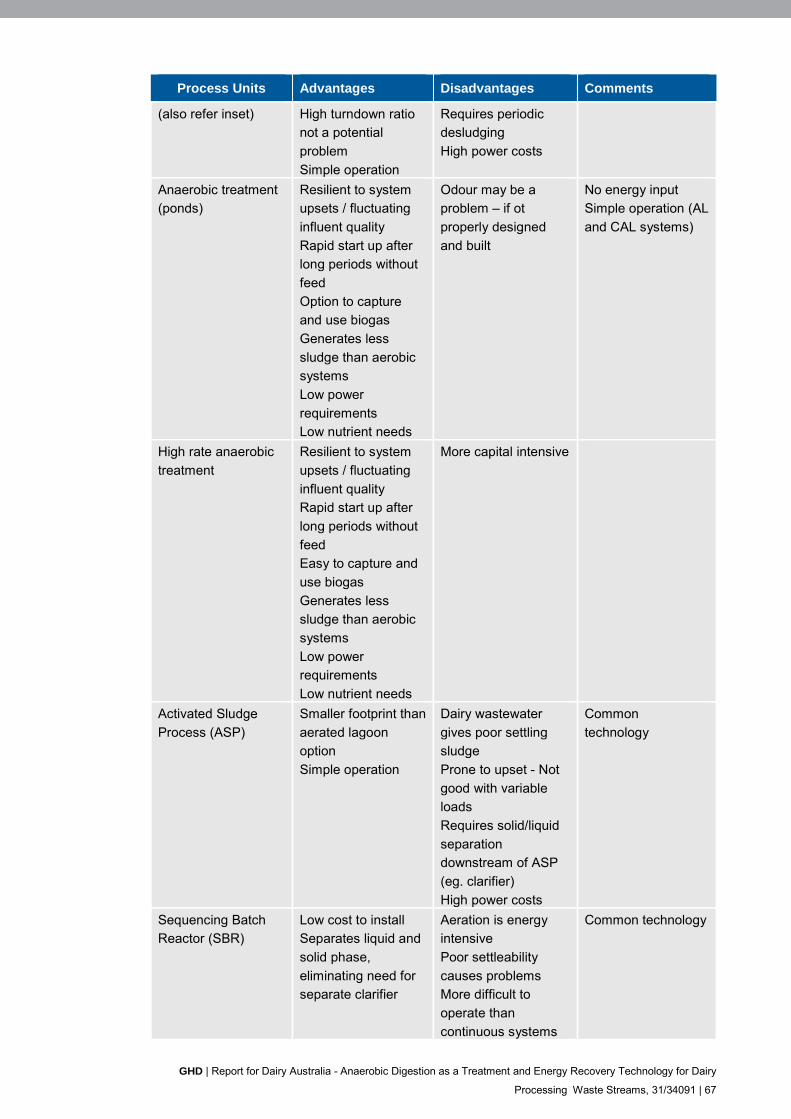
GHD | Report for Dairy Australia - Anaerobic Digestion as a Treatment and Energy Recovery Technology for Dairy
Processing Waste Streams, 31/34091 | 67
Process Units Advantages Disadvantages Comments
(also refer inset) High turndown ratio
not a potential
problem
Simple operation
Requires periodic
desludging
High power costs
Anaerobic treatment
(ponds)
Resilient to system
upsets / fluctuating
influent quality
Rapid start up after
long periods without
feed
Option to capture
and use biogas
Generates less
sludge than aerobic
systems
Low power
requirements
Low nutrient needs
Odour may be a
problem – if ot
properly designed
and built
No energy input
Simple operation (AL
and CAL systems)
High rate anaerobic
treatment
Resilient to system
upsets / fluctuating
influent quality
Rapid start up after
long periods without
feed
Easy to capture and
use biogas
Generates less
sludge than aerobic
systems
Low power
requirements
Low nutrient needs
More capital intensive
Activated Sludge
Process (ASP)
Smaller footprint than
aerated lagoon
option
Simple operation
Dairy wastewater
gives poor settling
sludge
Prone to upset - Not
good with variable
loads
Requires solid/liquid
separation
downstream of ASP
(eg. clarifier)
High power costs
Common
technology
Sequencing Batch
Reactor (SBR)
Low cost to install
Separates liquid and
solid phase,
eliminating need for
separate clarifier
Aeration is energy
intensive
Poor settleability
causes problems
More difficult to
operate than
continuous systems
Common technology
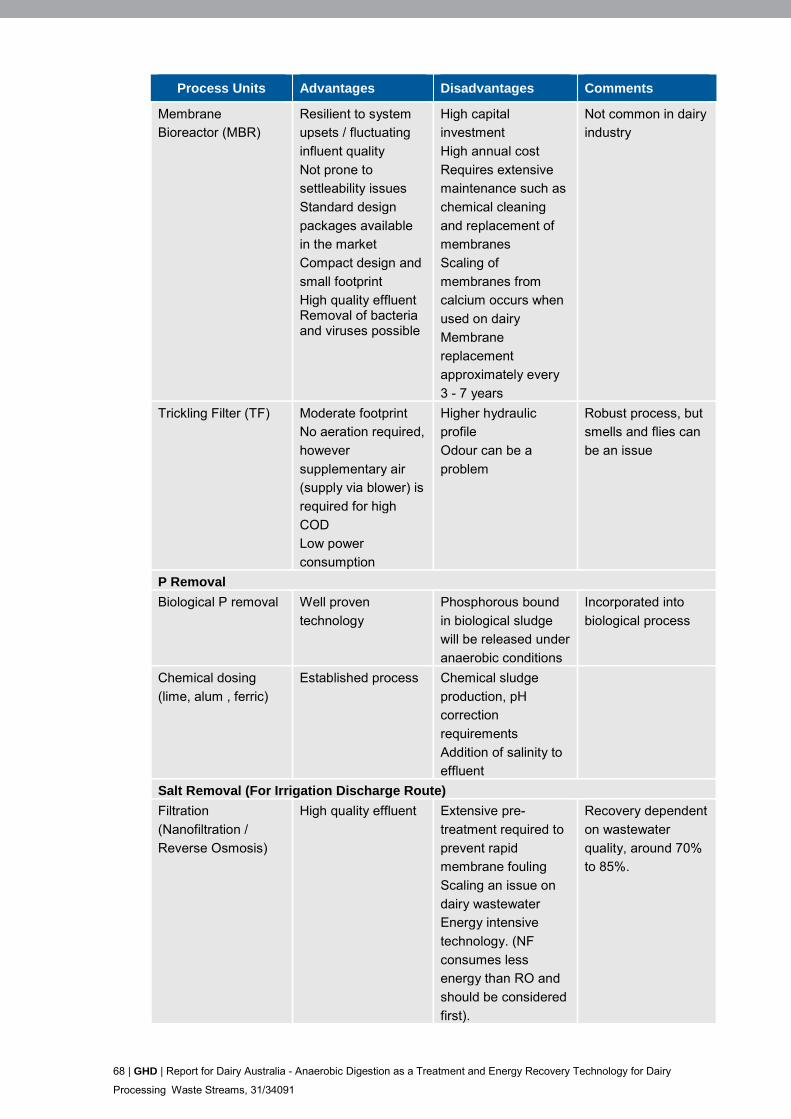
68 | GHD | Report for Dairy Australia - Anaerobic Digestion as a Treatment and Energy Recovery Technology for Dairy
Processing Waste Streams, 31/34091
Process Units Advantages Disadvantages Comments
Membrane
Bioreactor (MBR)
Resilient to system
upsets / fluctuating
influent quality
Not prone to
settleability issues
Standard design
packages available
in the market
Compact design and
small footprint
High quality effluent Removal of bacteria and viruses possible
High capital
investment
High annual cost
Requires extensive
maintenance such as
chemical cleaning
and replacement of
membranes
Scaling of
membranes from
calcium occurs when
used on dairy
Membrane
replacement
approximately every
3 - 7 years
Not common in dairy
industry
Trickling Filter (TF) Moderate footprint
No aeration required,
however
supplementary air
(supply via blower) is
required for high
COD
Low power
consumption
Higher hydraulic
profile
Odour can be a
problem
Robust process, but
smells and flies can
be an issue
P Removal
Biological P removal Well proven
technology
Phosphorous bound
in biological sludge
will be released under
anaerobic conditions
Incorporated into
biological process
Chemical dosing
(lime, alum , ferric)
Established process Chemical sludge
production, pH
correction
requirements
Addition of salinity to
effluent
Salt Removal (For Irrigation Discharge Route)
Filtration
(Nanofiltration /
Reverse Osmosis)
High quality effluent Extensive pre-
treatment required to
prevent rapid
membrane fouling
Scaling an issue on
dairy wastewater
Energy intensive
technology. (NF
consumes less
energy than RO and
should be considered
first).
Recovery dependent
on wastewater
quality, around 70%
to 85%.

GHD | Report for Dairy Australia - Anaerobic Digestion as a Treatment and Energy Recovery Technology for Dairy
Processing Waste Streams, 31/34091 | 69
Process Units Advantages Disadvantages Comments
Disposal of brine as
by-product of filtration
(brine) needs to be in
considered.
Evaporation ponds
are common.
SAR Adjustment (For Irrigation Discharge Route)
Calcium addition
(e.g., Lime dosing,
calcite filter, gypsum)
Aglime is applied
directly to land as is
common farming
practice
In rural areas, lagoon treatment systems are very common, with cheap construction costs, low
sludge yield and space availability. In addition, irrigation of treated effluent often does not
require nutrient removal (rather relying on BOD, SS and FOG removal).
Comparison of lagoon design criteria are presented below.
Table 33 Typical Lagoon Parameters
Lagoon Type Detentio
n (day)
Area
(ha per
ML/d)
Typical
Effluent
BOD/SS
(mg/L)
Sludge Yield
(kg DS/kg
BOD)
Energy
Use
(kWh/kg
BOD)
Aerobic 250 – 500 25 – 50 20/30 0.2 0
Facultative 100 – 200 8 – 11 40/60 0.1 0
Anaerobic 15 – 50 0.4 – 2 100/100 0.2 0
Fully-mixed aerated 3 – 10 0.2 – 0.4 50/100 0.6 1 – 2
Partially-mixed
aerated
5 – 25 0.3 – 1 50/50 0.3 1
Covered anaerobic 10 - 20 0.2 – 0.5 200/300 0.2 -6
D.2 Emerging Trends in Dairy Wastewater Treatment Practices
While typically treatment systems involve lagoons (assuming land is available), the need for pre-
treatment or potential cost savings is driving some changes. Emerging trends in dairy and other
industry waste water treatment include:
Use of hydro-cyclones, fine sieving and screening as alternatives to IAF or DAF. The
experience to date in the dairy industry, however, has been mixed.
Increased interest in medium and high rate (small footprint) anaerobic treatment.
Technologies range from the mature and well developed such as covered anaerobic
lagoons (to collect gas), and constructed upflow anaerobic sludge blanket (UASB)
systems to newer innovations including anaerobic flotation reactors (AFR) and anaerobic
membrane bioreactors (AnMBR). AFR and AnMBR systems are well suited to
wastewaters that contain elevated fats and oil concentrations, such as dairy
manufacturing wastewaters.
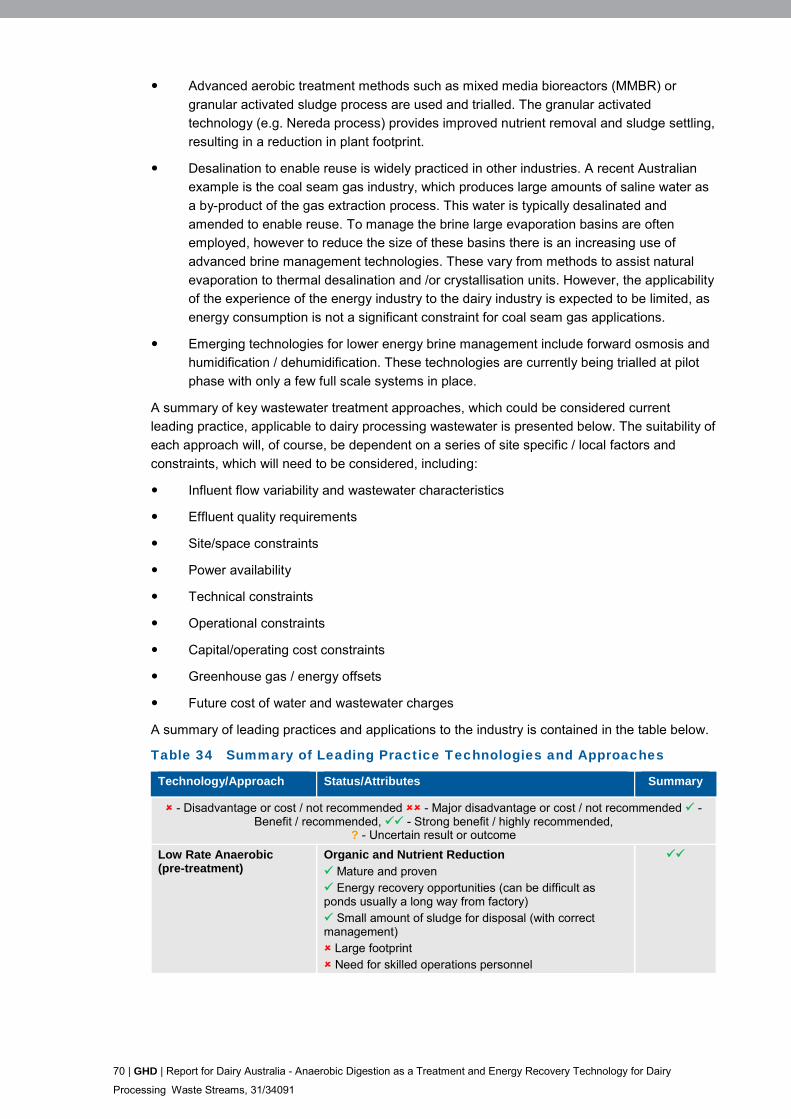
70 | GHD | Report for Dairy Australia - Anaerobic Digestion as a Treatment and Energy Recovery Technology for Dairy
Processing Waste Streams, 31/34091
Advanced aerobic treatment methods such as mixed media bioreactors (MMBR) or
granular activated sludge process are used and trialled. The granular activated
technology (e.g. Nereda process) provides improved nutrient removal and sludge settling,
resulting in a reduction in plant footprint.
Desalination to enable reuse is widely practiced in other industries. A recent Australian
example is the coal seam gas industry, which produces large amounts of saline water as
a by-product of the gas extraction process. This water is typically desalinated and
amended to enable reuse. To manage the brine large evaporation basins are often
employed, however to reduce the size of these basins there is an increasing use of
advanced brine management technologies. These vary from methods to assist natural
evaporation to thermal desalination and /or crystallisation units. However, the applicability
of the experience of the energy industry to the dairy industry is expected to be limited, as
energy consumption is not a significant constraint for coal seam gas applications.
Emerging technologies for lower energy brine management include forward osmosis and
humidification / dehumidification. These technologies are currently being trialled at pilot
phase with only a few full scale systems in place.
A summary of key wastewater treatment approaches, which could be considered current
leading practice, applicable to dairy processing wastewater is presented below. The suitability of
each approach will, of course, be dependent on a series of site specific / local factors and
constraints, which will need to be considered, including:
Influent flow variability and wastewater characteristics
Effluent quality requirements
Site/space constraints
Power availability
Technical constraints
Operational constraints
Capital/operating cost constraints
Greenhouse gas / energy offsets
Future cost of water and wastewater charges
A summary of leading practices and applications to the industry is contained in the table below.
Table 34 Summary of Leading Practice Technologies and Approaches
Technology/Approach Status/Attributes Summary
- Disadvantage or cost / not recommended - Major disadvantage or cost / not recommended - Benefit / recommended, - Strong benefit / highly recommended,
? - Uncertain result or outcome
Low Rate Anaerobic (pre-treatment)
Organic and Nutrient Reduction
Mature and proven Energy recovery opportunities (can be difficult as ponds usually a long way from factory) Small amount of sludge for disposal (with correct management) Large footprint Need for skilled operations personnel

GHD | Report for Dairy Australia - Anaerobic Digestion as a Treatment and Energy Recovery Technology for Dairy
Processing Waste Streams, 31/34091 | 71
Technology/Approach Status/Attributes Summary
Medium Rate Anaerobic (pre-treatment)
Organic and Nutrient Reduction
Leading Practice Proven on a small number of facilities Energy recovery opportunities Small footprint Very small amount of sludge for disposal (with correct management) Need for skilled operations personnel
High Rate Anaerobic (pre-treatment)
Organic and Nutrient Reduction
Leading Practice ? Proven (provided right variant selected)
Energy recovery opportunities Small footprint Very small amount of sludge for disposal (with correct management) Need for skilled operations personnel
Floatation (pre-treatment)
Solids and Organic Reduction
Mature and proven Small footprint High chemical consumption Increases wastewater salinity Moderate amount of sludge for disposal Odour potential
Aerated Lagoons Organic and Nutrient Reduction
Mature and proven Low energy for aerobic treatment Large area required Some sludge requiring disposal (large amount periodically – i.e. every 10 years) Odour
Activated Sludge Organic and Nutrient Reduction
Mature and proven Good final water quality Can have problems with poor settleability on milk wastewater Moderate to high sludge production and high energy use Need for skilled operations personnel
Membranes – Filtration Solids Removal
Mature and proven Very good final water quality Energy intensive Chemicals required for CIP Small amount of sludge requiring disposal
?
Membrane – Desalination Salt Removal
Mature and proven Energy intensive Brine and CIP waste requiring disposal/management
?
Cleaner Production Waste Reduction
Cost savings opportunities Reduced waste to manage COD, TSS, O&G, TDS
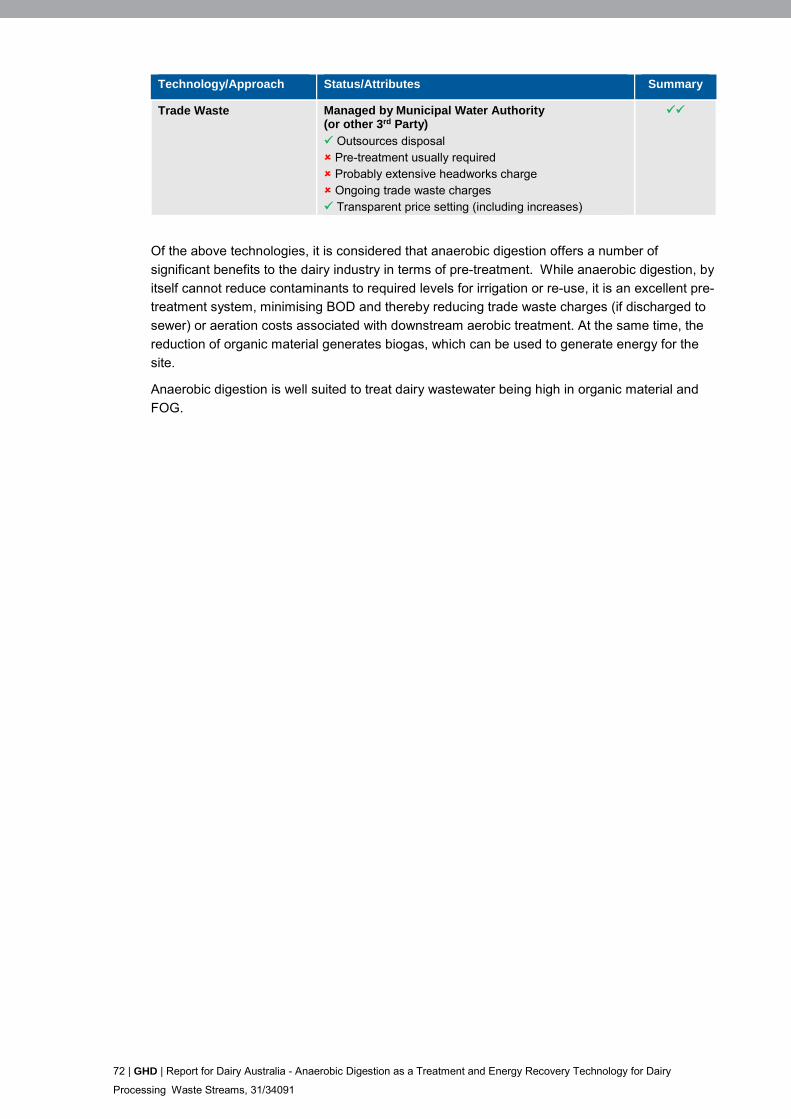
72 | GHD | Report for Dairy Australia - Anaerobic Digestion as a Treatment and Energy Recovery Technology for Dairy
Processing Waste Streams, 31/34091
Technology/Approach Status/Attributes Summary
Trade Waste Managed by Municipal Water Authority (or other 3rd Party)
Outsources disposal Pre-treatment usually required Probably extensive headworks charge Ongoing trade waste charges Transparent price setting (including increases)
Of the above technologies, it is considered that anaerobic digestion offers a number of
significant benefits to the dairy industry in terms of pre-treatment. While anaerobic digestion, by
itself cannot reduce contaminants to required levels for irrigation or re-use, it is an excellent pre-
treatment system, minimising BOD and thereby reducing trade waste charges (if discharged to
sewer) or aeration costs associated with downstream aerobic treatment. At the same time, the
reduction of organic material generates biogas, which can be used to generate energy for the
site.
Anaerobic digestion is well suited to treat dairy wastewater being high in organic material and
FOG.
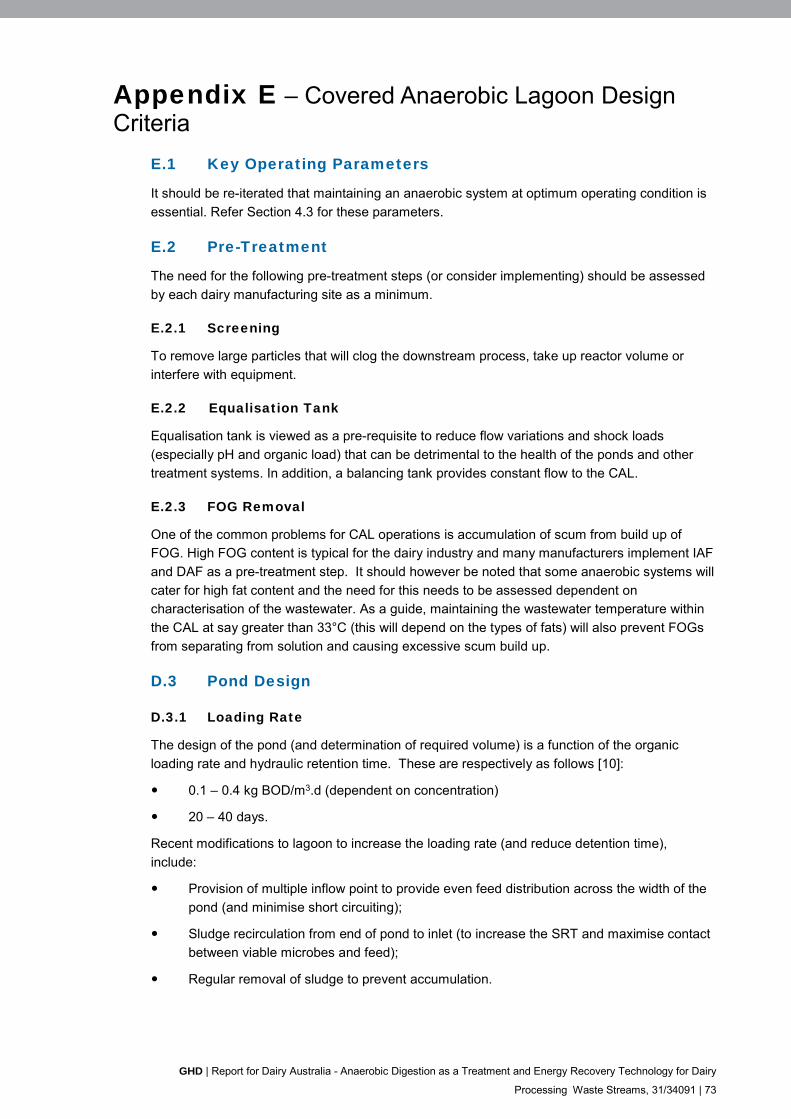
GHD | Report for Dairy Australia - Anaerobic Digestion as a Treatment and Energy Recovery Technology for Dairy
Processing Waste Streams, 31/34091 | 73
Appendix E – Covered Anaerobic Lagoon Design Criteria
E.1 Key Operating Parameters
It should be re-iterated that maintaining an anaerobic system at optimum operating condition is
essential. Refer Section 4.3 for these parameters.
E.2 Pre-Treatment
The need for the following pre-treatment steps (or consider implementing) should be assessed
by each dairy manufacturing site as a minimum.
E.2.1 Screening
To remove large particles that will clog the downstream process, take up reactor volume or
interfere with equipment.
E.2.2 Equalisation Tank
Equalisation tank is viewed as a pre-requisite to reduce flow variations and shock loads
(especially pH and organic load) that can be detrimental to the health of the ponds and other
treatment systems. In addition, a balancing tank provides constant flow to the CAL.
E.2.3 FOG Removal
One of the common problems for CAL operations is accumulation of scum from build up of
FOG. High FOG content is typical for the dairy industry and many manufacturers implement IAF
and DAF as a pre-treatment step. It should however be noted that some anaerobic systems will
cater for high fat content and the need for this needs to be assessed dependent on
characterisation of the wastewater. As a guide, maintaining the wastewater temperature within
the CAL at say greater than 33°C (this will depend on the types of fats) will also prevent FOGs
from separating from solution and causing excessive scum build up.
D.3 Pond Design
D.3.1 Loading Rate
The design of the pond (and determination of required volume) is a function of the organic
loading rate and hydraulic retention time. These are respectively as follows [10]:
0.1 – 0.4 kg BOD/m3.d (dependent on concentration)
20 – 40 days.
Recent modifications to lagoon to increase the loading rate (and reduce detention time),
include:
Provision of multiple inflow point to provide even feed distribution across the width of the
pond (and minimise short circuiting);
Sludge recirculation from end of pond to inlet (to increase the SRT and maximise contact
between viable microbes and feed);
Regular removal of sludge to prevent accumulation.
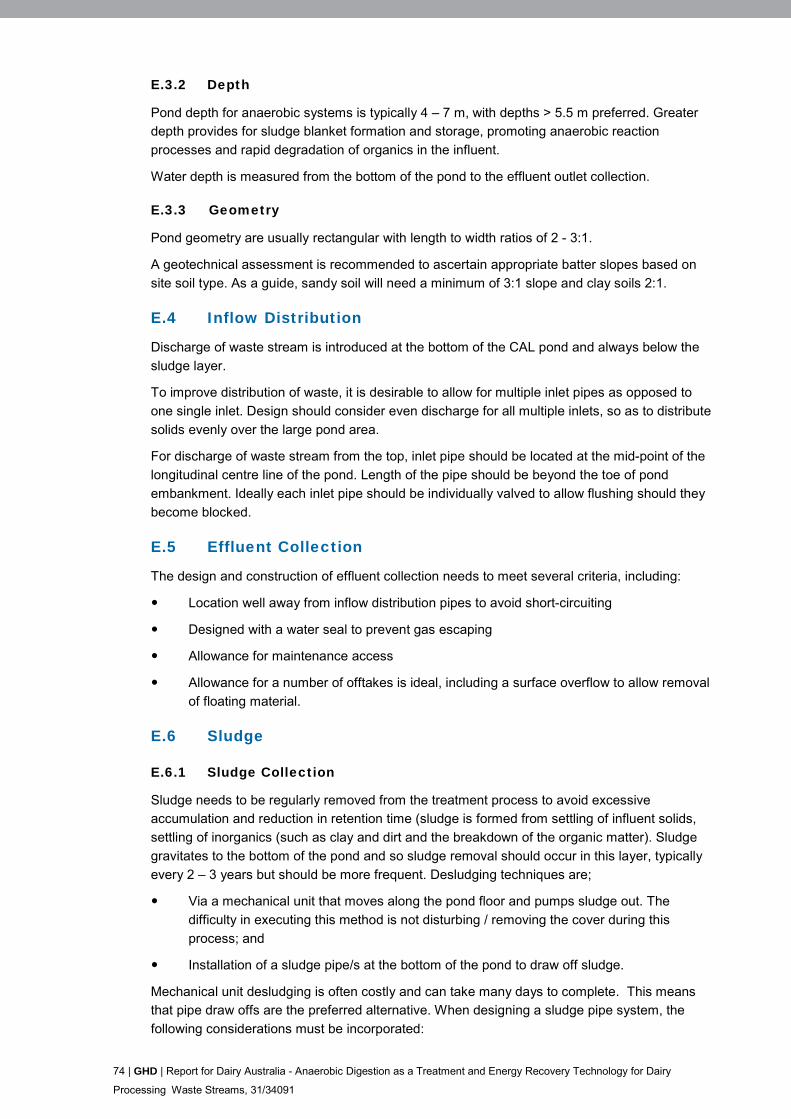
74 | GHD | Report for Dairy Australia - Anaerobic Digestion as a Treatment and Energy Recovery Technology for Dairy
Processing Waste Streams, 31/34091
E.3.2 Depth
Pond depth for anaerobic systems is typically 4 – 7 m, with depths > 5.5 m preferred. Greater
depth provides for sludge blanket formation and storage, promoting anaerobic reaction
processes and rapid degradation of organics in the influent.
Water depth is measured from the bottom of the pond to the effluent outlet collection.
E.3.3 Geometry
Pond geometry are usually rectangular with length to width ratios of 2 - 3:1.
A geotechnical assessment is recommended to ascertain appropriate batter slopes based on
site soil type. As a guide, sandy soil will need a minimum of 3:1 slope and clay soils 2:1.
E.4 Inflow Distribution
Discharge of waste stream is introduced at the bottom of the CAL pond and always below the
sludge layer.
To improve distribution of waste, it is desirable to allow for multiple inlet pipes as opposed to
one single inlet. Design should consider even discharge for all multiple inlets, so as to distribute
solids evenly over the large pond area.
For discharge of waste stream from the top, inlet pipe should be located at the mid-point of the
longitudinal centre line of the pond. Length of the pipe should be beyond the toe of pond
embankment. Ideally each inlet pipe should be individually valved to allow flushing should they
become blocked.
E.5 Effluent Collection
The design and construction of effluent collection needs to meet several criteria, including:
Location well away from inflow distribution pipes to avoid short-circuiting
Designed with a water seal to prevent gas escaping
Allowance for maintenance access
Allowance for a number of offtakes is ideal, including a surface overflow to allow removal
of floating material.
E.6 Sludge
E.6.1 Sludge Collection
Sludge needs to be regularly removed from the treatment process to avoid excessive
accumulation and reduction in retention time (sludge is formed from settling of influent solids,
settling of inorganics (such as clay and dirt and the breakdown of the organic matter). Sludge
gravitates to the bottom of the pond and so sludge removal should occur in this layer, typically
every 2 – 3 years but should be more frequent. Desludging techniques are;
Via a mechanical unit that moves along the pond floor and pumps sludge out. The
difficulty in executing this method is not disturbing / removing the cover during this
process; and
Installation of a sludge pipe/s at the bottom of the pond to draw off sludge.
Mechanical unit desludging is often costly and can take many days to complete. This means
that pipe draw offs are the preferred alternative. When designing a sludge pipe system, the
following considerations must be incorporated:
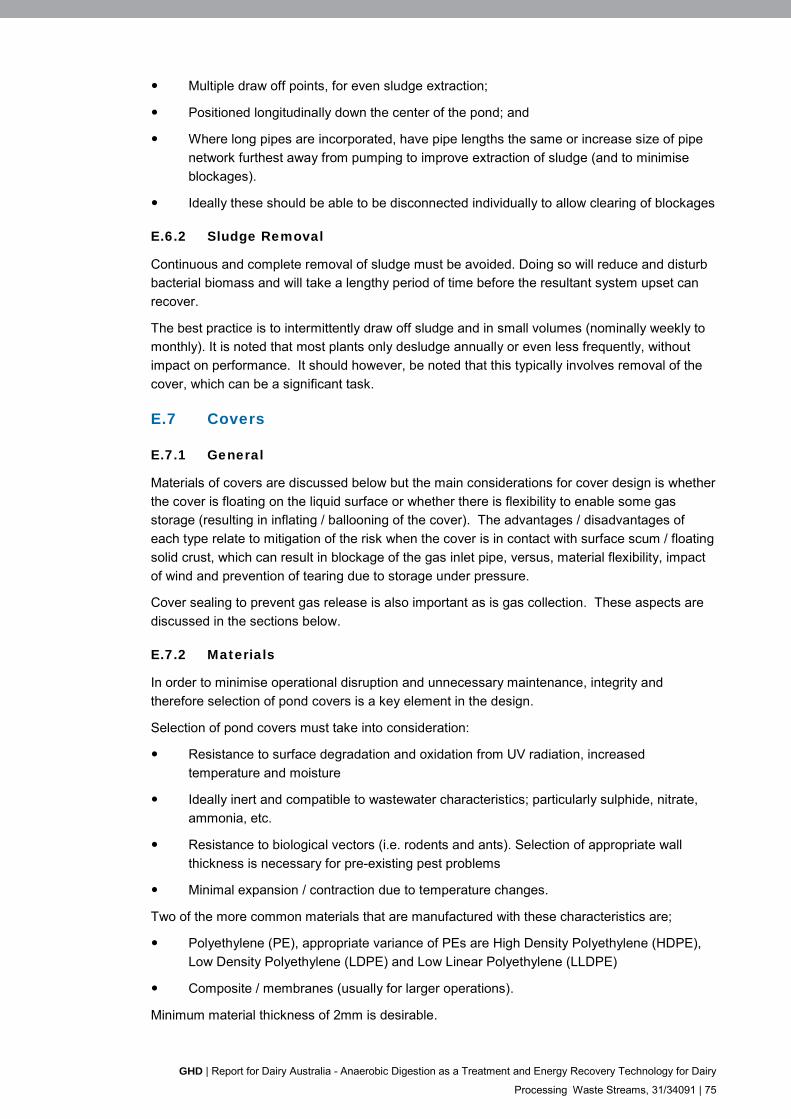
GHD | Report for Dairy Australia - Anaerobic Digestion as a Treatment and Energy Recovery Technology for Dairy
Processing Waste Streams, 31/34091 | 75
Multiple draw off points, for even sludge extraction;
Positioned longitudinally down the center of the pond; and
Where long pipes are incorporated, have pipe lengths the same or increase size of pipe
network furthest away from pumping to improve extraction of sludge (and to minimise
blockages).
Ideally these should be able to be disconnected individually to allow clearing of blockages
E.6.2 Sludge Removal
Continuous and complete removal of sludge must be avoided. Doing so will reduce and disturb
bacterial biomass and will take a lengthy period of time before the resultant system upset can
recover.
The best practice is to intermittently draw off sludge and in small volumes (nominally weekly to
monthly). It is noted that most plants only desludge annually or even less frequently, without
impact on performance. It should however, be noted that this typically involves removal of the
cover, which can be a significant task.
E.7 Covers
E.7.1 General
Materials of covers are discussed below but the main considerations for cover design is whether
the cover is floating on the liquid surface or whether there is flexibility to enable some gas
storage (resulting in inflating / ballooning of the cover). The advantages / disadvantages of
each type relate to mitigation of the risk when the cover is in contact with surface scum / floating
solid crust, which can result in blockage of the gas inlet pipe, versus, material flexibility, impact
of wind and prevention of tearing due to storage under pressure.
Cover sealing to prevent gas release is also important as is gas collection. These aspects are
discussed in the sections below.
E.7.2 Materials
In order to minimise operational disruption and unnecessary maintenance, integrity and
therefore selection of pond covers is a key element in the design.
Selection of pond covers must take into consideration:
Resistance to surface degradation and oxidation from UV radiation, increased
temperature and moisture
Ideally inert and compatible to wastewater characteristics; particularly sulphide, nitrate,
ammonia, etc.
Resistance to biological vectors (i.e. rodents and ants). Selection of appropriate wall
thickness is necessary for pre-existing pest problems
Minimal expansion / contraction due to temperature changes.
Two of the more common materials that are manufactured with these characteristics are;
Polyethylene (PE), appropriate variance of PEs are High Density Polyethylene (HDPE),
Low Density Polyethylene (LDPE) and Low Linear Polyethylene (LLDPE)
Composite / membranes (usually for larger operations).
Minimum material thickness of 2mm is desirable.
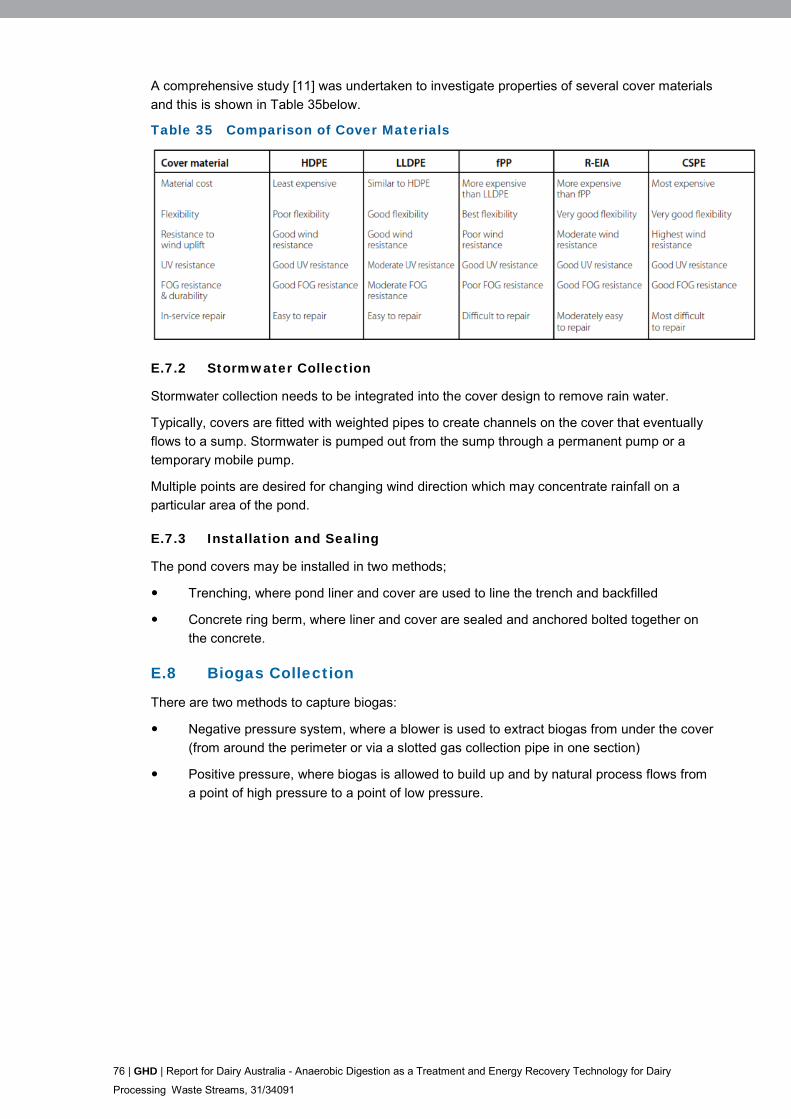
76 | GHD | Report for Dairy Australia - Anaerobic Digestion as a Treatment and Energy Recovery Technology for Dairy
Processing Waste Streams, 31/34091
A comprehensive study [11] was undertaken to investigate properties of several cover materials
and this is shown in Table 35below.
Table 35 Comparison of Cover Materials
E.7.2 Stormwater Collection
Stormwater collection needs to be integrated into the cover design to remove rain water.
Typically, covers are fitted with weighted pipes to create channels on the cover that eventually
flows to a sump. Stormwater is pumped out from the sump through a permanent pump or a
temporary mobile pump.
Multiple points are desired for changing wind direction which may concentrate rainfall on a
particular area of the pond.
E.7.3 Installation and Sealing
The pond covers may be installed in two methods;
Trenching, where pond liner and cover are used to line the trench and backfilled
Concrete ring berm, where liner and cover are sealed and anchored bolted together on
the concrete.
E.8 Biogas Collection
There are two methods to capture biogas:
Negative pressure system, where a blower is used to extract biogas from under the cover
(from around the perimeter or via a slotted gas collection pipe in one section)
Positive pressure, where biogas is allowed to build up and by natural process flows from
a point of high pressure to a point of low pressure.
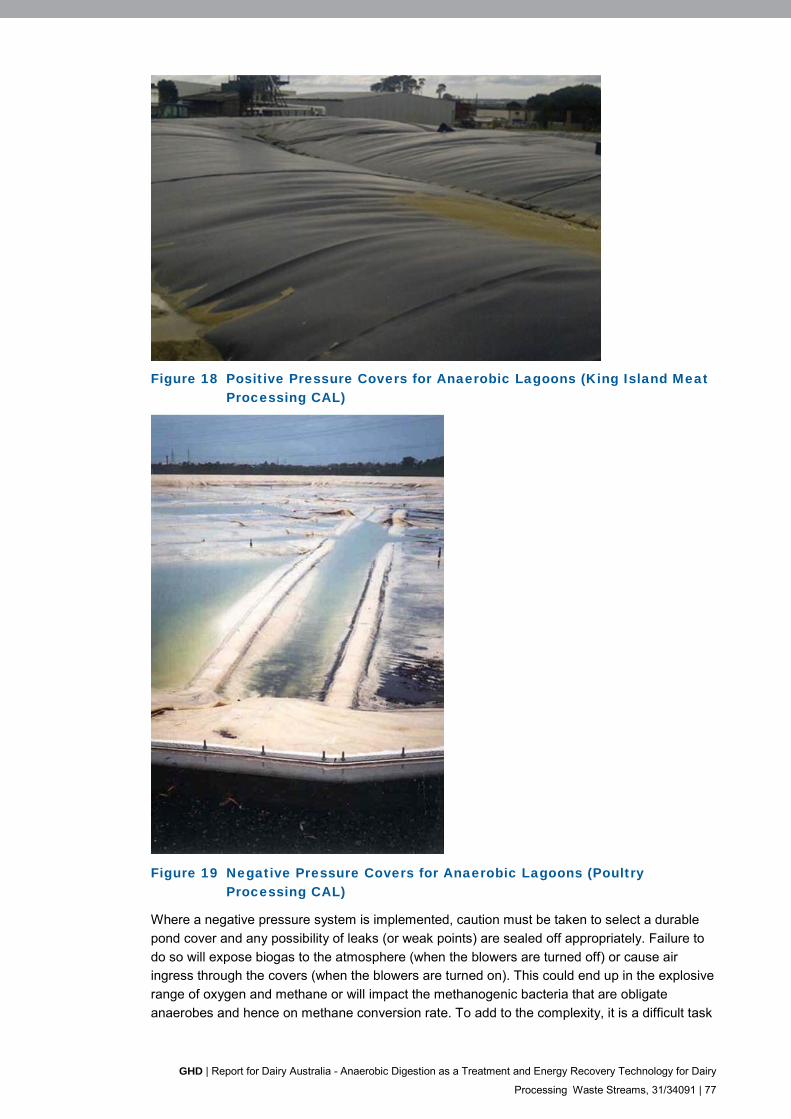
GHD | Report for Dairy Australia - Anaerobic Digestion as a Treatment and Energy Recovery Technology for Dairy
Processing Waste Streams, 31/34091 | 77
Figure 18 Positive Pressure Covers for Anaerobic Lagoons (King Island Meat Processing CAL)
Figure 19 Negative Pressure Covers for Anaerobic Lagoons (Poultry Processing CAL)
Where a negative pressure system is implemented, caution must be taken to select a durable
pond cover and any possibility of leaks (or weak points) are sealed off appropriately. Failure to
do so will expose biogas to the atmosphere (when the blowers are turned off) or cause air
ingress through the covers (when the blowers are turned on). This could end up in the explosive
range of oxygen and methane or will impact the methanogenic bacteria that are obligate
anaerobes and hence on methane conversion rate. To add to the complexity, it is a difficult task
78 | GHD | Report for Dairy Australia - Anaerobic Digestion as a Treatment and Energy Recovery Technology for Dairy
Processing Waste Streams, 31/34091
to locate the leak(s). The presence of hydrogen sulphide gas in the biogas presents a serious
risk of exposure during testing and times of leakage.
Alternatively, when implementing a positive pressure system, caution must be taken to ensure
excessive biogas accumulation is avoided. Expansion of covers beyond allowable limit may
impact on integrity of the cover (a flexible cover is more appropriate).
Biogas extraction needs to be monitored and controlled through a PLC system to mitigate this
potential problem.
As a general rule, each kg COD removed has the potential to generate around 0.5 m3 of biogas
(theoretically). Gas collection and associated infrastructure should use this value as a guide if
actual production is unknown.
Safety and integrity of the cover needs to be incorporated into the design. Multiple and
accessible pressure relief valves are also necessary as an overpressure safety control. For
floating covers this may simply involve a series of pipes welded into the cover extending below
the liquid surface.
E.9 Instrumentation
System control of CAL, especially biogas capture is best performed automatically by the PLC
although some manual procedures may be possible.
As a minimum, CAL system would require on-line instrumentation for continuous monitoring and
analysis, as follows.
Biogas flow meter (instantaneous and totalised capability)
Multiple pressure relief valves (at high points and accessible) or flare
Biogas pressure meter (high accuracy and sensitivity) – in cover and downstream of
extraction fan
Biogas methane composition
Oxygen concentration in gas line downstream of fan
Sludge outlet flow meter
Flow (outlet)
Temperature (outlet)
pH (outlet)
If upstream instrumentation is not in place (after equalisation tank) then these need to be added
to the list:
Effluent inflow
pH (optional)
E.10 Operation and Maintenance
Design of the ponds should allow for the following,
Scum breakup mechanism (such recirculation of sludge to corners)
Sampling points - gas
Inspection ports – check scum accumulation and blockages
Sampling points – effluent collection
GHD | Report for Dairy Australia - Anaerobic Digestion as a Treatment and Energy Recovery Technology for Dairy
Processing Waste Streams, 31/34091 | 79
It should also be noted that vegetation around the inner walls / embankments of a pond will
need regular control to protect cover integrity and minimise sanctuary of vectors.
80 | GHD | Report for Dairy Australia - Anaerobic Digestion as a Treatment and Energy Recovery Technology for Dairy
Processing Waste Streams, 31/34091
Appendix F – References
[1] M. N. D. Watkins, “Dairy factory wastewaters their use on land and possible environmental impacts - a mini review,” The Open Agricultural Journal, vol. 4, pp. 1-9.
[2] Britz, “Treatment of Dairy Processing Wastewaters,” in Waste Treatment in the Food Processing Industry, 2006.
[3] Environmental Protection Authority State Government of Victoria, “Environmental Guidelines for the Dairy Processing Industry,” June 1997.
[4] Municipal Technology Branch US EPA, “Wastewater Technology Fact Sheet,” Anaerobic Lagoons, 2002.
[5] S. &. P. P. Singh, “Review of Recent Advancements in Anaerobic Packed-Bed Biogas,” Renewable Sustainable Energy Rev, vol. 13, pp. 1569-75, 2009.
[6] L.-C. e. al, “Membrane Fouling in Membrane Bioreactors for Wastewater Treatment,” Journal of Environmental Engineering, November 2002.
[7] G. Mittal, “Treatment of Wastewater from Abattoirs Before Land Application – a Review,” Bioresource Technology, vol. 97, p. 1119 – 1135, 2006.
[8] T. Davies, “Water Industries Operators Association of Australia,” [Online]. Available: http://www.wioa.org.au/conference_papers/05/paper18.htm. [Accessed 21 September 2016].
[9] GHD, “Cradle Mountain Water - Report for Biogas Prefeasibility Study Treatment of Industrial Wastewater,” 2011.
[10] M. Lagisnestra, “Covered Anaerobic Lagoons,” Meat and Livestock Australia Limited, 2012.
[11] G. A. P. Ltd, “Aanerobic Cover Material Vulnerability Assessment of Available Cover Materials,” 2009.
[12] D. Australia, “Eco-efficiency for the Dairy Processing Industry,” 2004.
[13] E. P. H. C. a. A. H. M. C. (. E. A. Natural Resource Management Ministrial Council, “Australian Guidelines for Water Recycling: Managing Healt and Environmental Risks (Phase 1),” 2006.
[14] D. o. E. a. C. (NSW), “Environmental Guidelines Use of Effluent by Irrigation,” 2003.
[15] T. White, M. Dr Johns and B. Butler, “Methane Recovery and Use at a Meat Processing Facility,” Rural Industries Research and Development Corporation, 2013.
[16] N. Cicek, “A Review of Membrane Bioreactors and Their Potential Application in the Treatment of Agricultural Wastewater,” Canadian Biosystems Engineering , 2003.
GHD
180 Lonsdale Street Melbourne, Victoria 3000 T: (03) 8687 8000 F: (03) 8687 8111 E: [email protected]
© GHD 2017
This document is and shall remain the property of GHD. The document may only be used for the purpose for which it was commissioned and in accordance with the Terms of Engagement for the commission. Unauthorised use of this document in any form whatsoever is prohibited. G:\31\34091\WP\257281.docx
Document Status
Revision Author Reviewer Approved for Issue Name Signature Name Signature Date
A M Chen M Laginestra ML* R van Oorschot
RvO* 8/8/16
0 M Chen M Laginestra ML* R van Oorschot
RvO 23/9/16
1 M Chen M Laginestra R van Oorschot
28/6/17

www.ghd.com