Daimler Q2 and Half-Year 2019 Capital Market Presentation · Daimler AG Financial performance in Q2...
68
Capital Market Presentation Q2 and Half-Year 2019 July 24, 2019
Transcript of Daimler Q2 and Half-Year 2019 Capital Market Presentation · Daimler AG Financial performance in Q2...
Capital Market PresentationQ2 and Half-Year 2019
July 24, 2019

Daimler AG
Contents
Capital Market Presentation Q2 and Half-Year 2019 / July 24, 2019 / Page 2
Presentation charts on Q2 and H1 2019 results
Additional financial details
Strategy and technology

Daimler AG
• Strong product portfolio, defending global market leadership
• Earnings impacted by exceptional items reported on June 23 and July 12, 2019
• Free Cash Flow of the industrial business reflecting high level of investments for
future products and working capital
• Portfolio review and efficiency programs intensified in all areas
• Full-year guidance adjusted taking into account exceptional items disclosed in Q2
and reflecting updated commercial and industrial outlook
Highlights of Q2 2019
Capital Market Presentation Q2 and Half-Year 2019 / July 24, 2019 / Page 3
Daimler AG
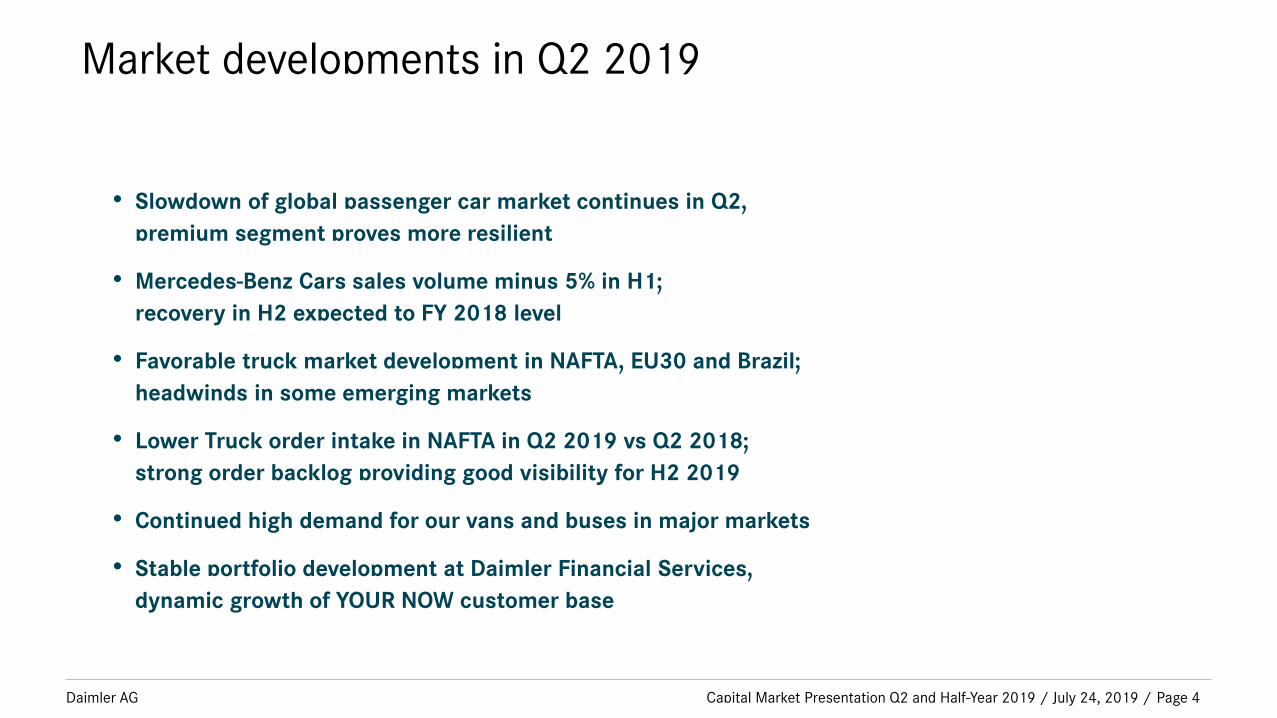
Market developments in Q2 2019
Capital Market Presentation Q2 and Half-Year 2019 / July 24, 2019 / Page 4
• Slowdown of global passenger car market continues in Q2,
premium segment proves more resilient
• Mercedes-Benz Cars sales volume minus 5% in H1;
recovery in H2 expected to FY 2018 level
• Favorable truck market development in NAFTA, EU30 and Brazil;
headwinds in some emerging markets
• Lower Truck order intake in NAFTA in Q2 2019 vs Q2 2018;
strong order backlog providing good visibility for H2 2019
• Continued high demand for our vans and buses in major markets
• Stable portfolio development at Daimler Financial Services,
dynamic growth of YOUR NOW customer base
Daimler AG
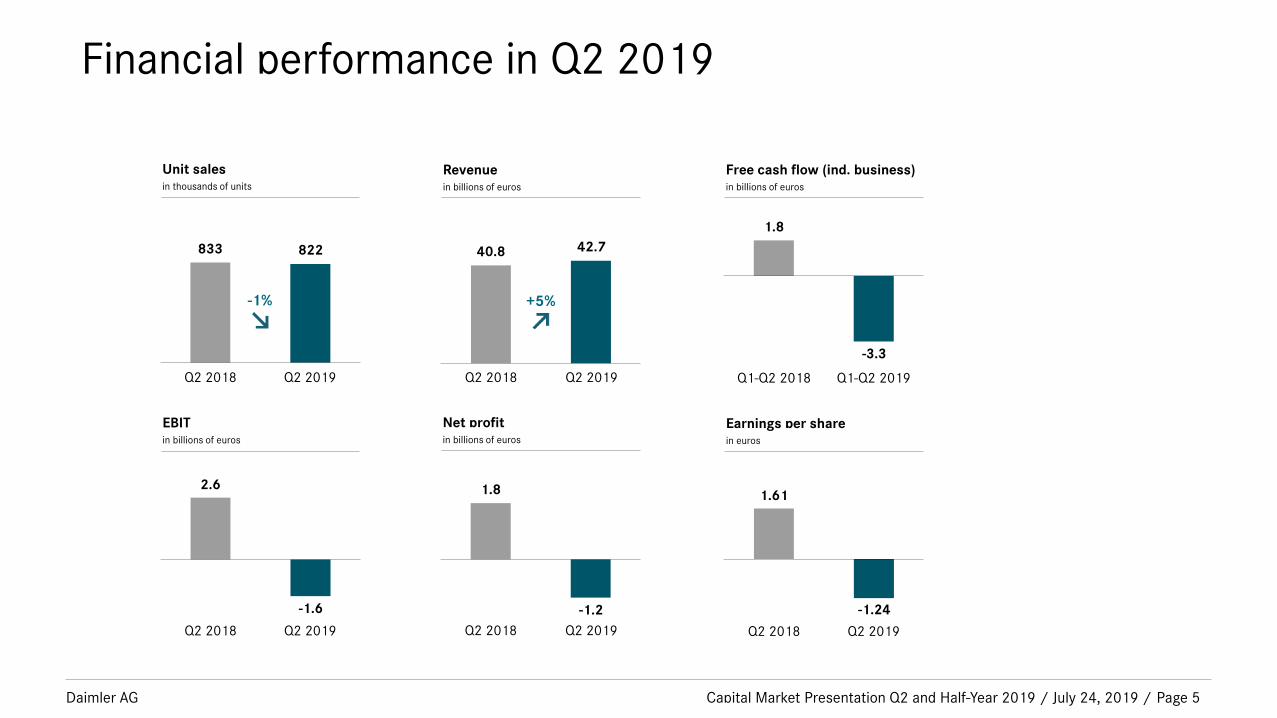
Financial performance in Q2 2019
Capital Market Presentation Q2 and Half-Year 2019 / July 24, 2019 / Page 5
Unit salesin thousands of units
Q2 2018 Q2 2019
833 822
-1%
Net profitin billions of euros
Q2 2018 Q2 2019
1.8
-1.2
Revenuein billions of euros
Q2 2018 Q2 2019
40.8 42.7
+5%
EBITin billions of euros
Q2 2018 Q2 2019
2.6
-1.6
Free cash flow (ind. business)in billions of euros
Q1-Q2 2018 Q1-Q2 2019
1.8
-3.3
Earnings per sharein euros
Q2 2018 Q2 2019
1.61
-1.24

Daimler AG
Group EBIT in Q2 2019in millions of euros
Capital Market Presentation Q2 and Half-Year 2019 / July 24, 2019 / Page 6
-351
-1,555
+110
2,640 -213+60
• Cars -170• Vans -62• Trucks +232• Buses +60
• Cars -235• Vans -30• Trucks +56• Buses -4
• Cars -334• Vans +61• Trucks -62• Buses -16
ActualQ2 2018
Volume/Structure/Net pricing
Foreignexchange
rates
Other costchangesexcept
disclosed items
ActualQ2 2019
ReconciliationFinancial Services
-53
-4,166+418
Discloseditems inQ2 2019
• Diesel -2,553
• Takata -987
• Productportfolio -459
• Vehicle recall -167
Discloseditem in
Q2 2018
• DFS:Toll collectarbitrationproceedingsin Q2 2018 +418
2,611
EBIT Q2 2019 before disclosed
items
Daimler AG
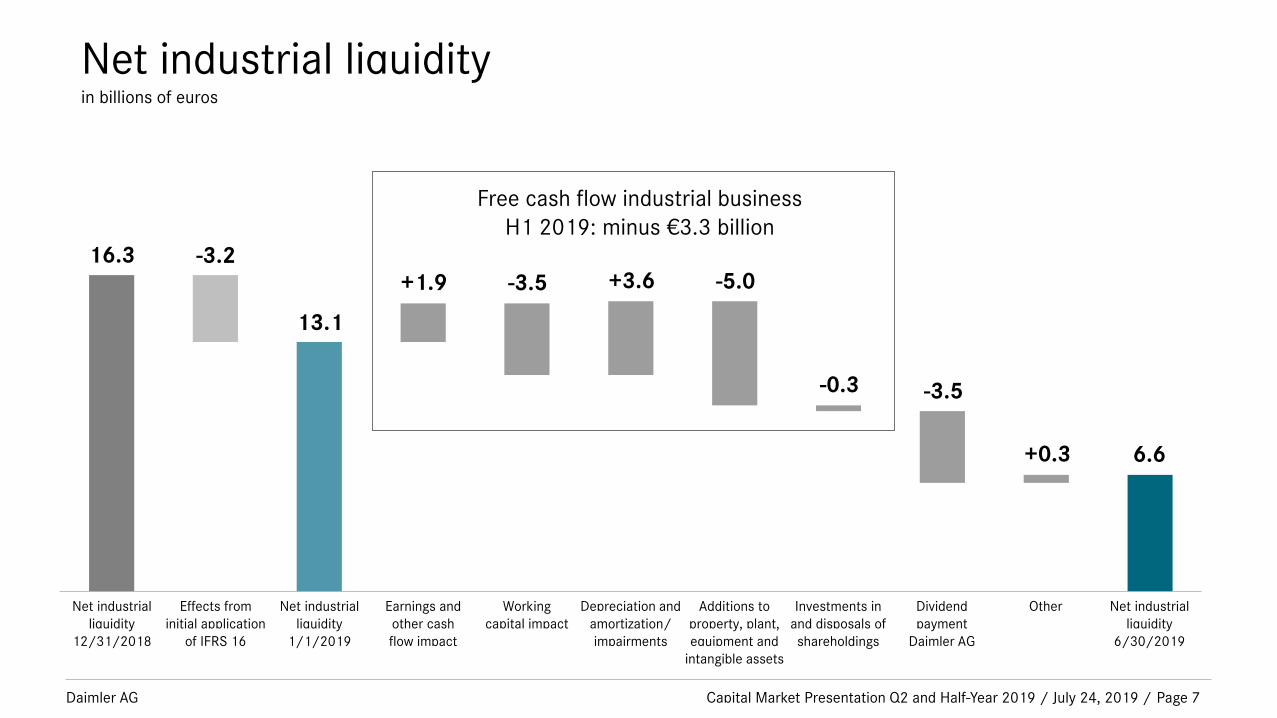
Net industrial liquidityin billions of euros
Capital Market Presentation Q2 and Half-Year 2019 / July 24, 2019 / Page 7
Free cash flow industrial businessH1 2019: minus €3.3 billion
Net industrialliquidity
12/31/2018
Workingcapital impact
Other Net industrialliquidity
6/30/2019
-3.5
6.6+0.3
16.3+1.9
-0.3
Investments in and disposals of shareholdings
-3.2
13.1
Net industrialliquidity
1/1/2019
Effects frominitial application
of IFRS 16
-3.5
Dividendpayment
Daimler AG
-5.0
Additions to property, plant, equipment and
intangible assets
+3.6
Depreciation and amortization/ impairments
Earnings and other cashflow impact
Daimler AG Capital Market Presentation Q2 and Half-Year 2019 / July 24, 2019 / Page 8
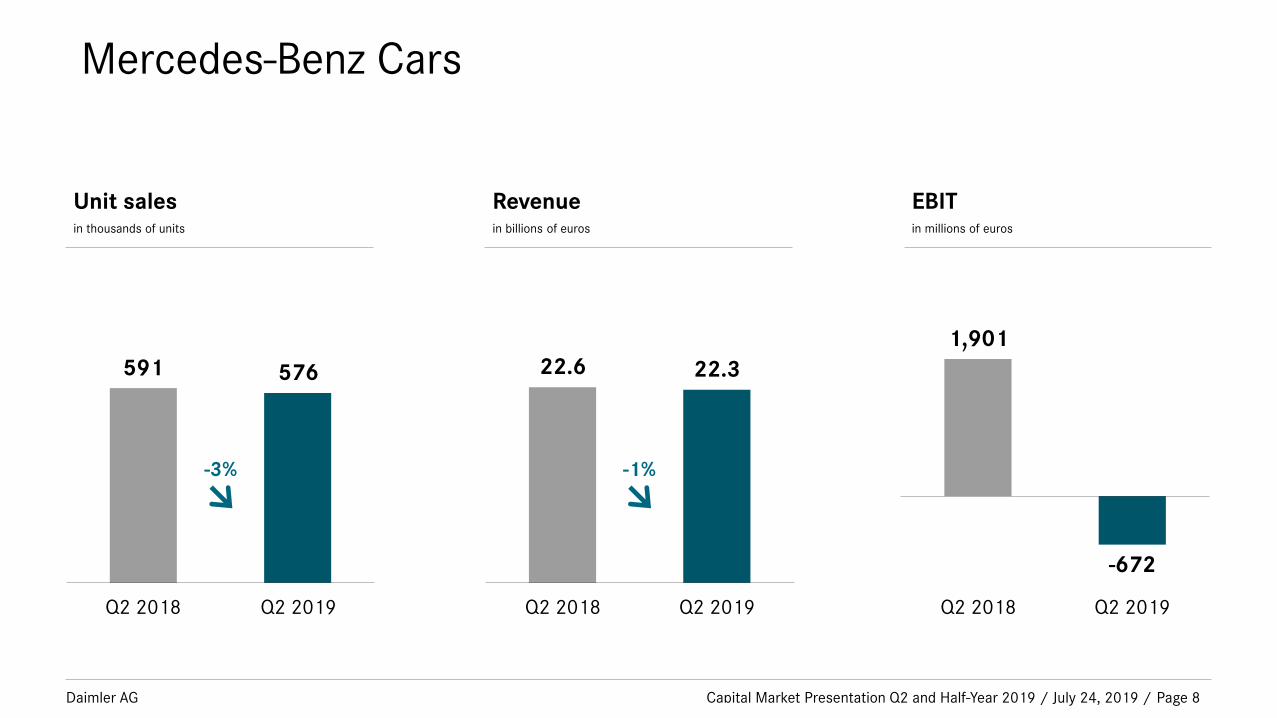
Mercedes-Benz Cars
Unit sales in thousands of units
Q2 2018 Q2 2019
Revenuein billions of euros
EBITin millions of euros
591 576
Q2 2018 Q2 2019
22.6 22.3
Q2 2018 Q2 2019
1,901
-672
-3% -1%
Daimler AG
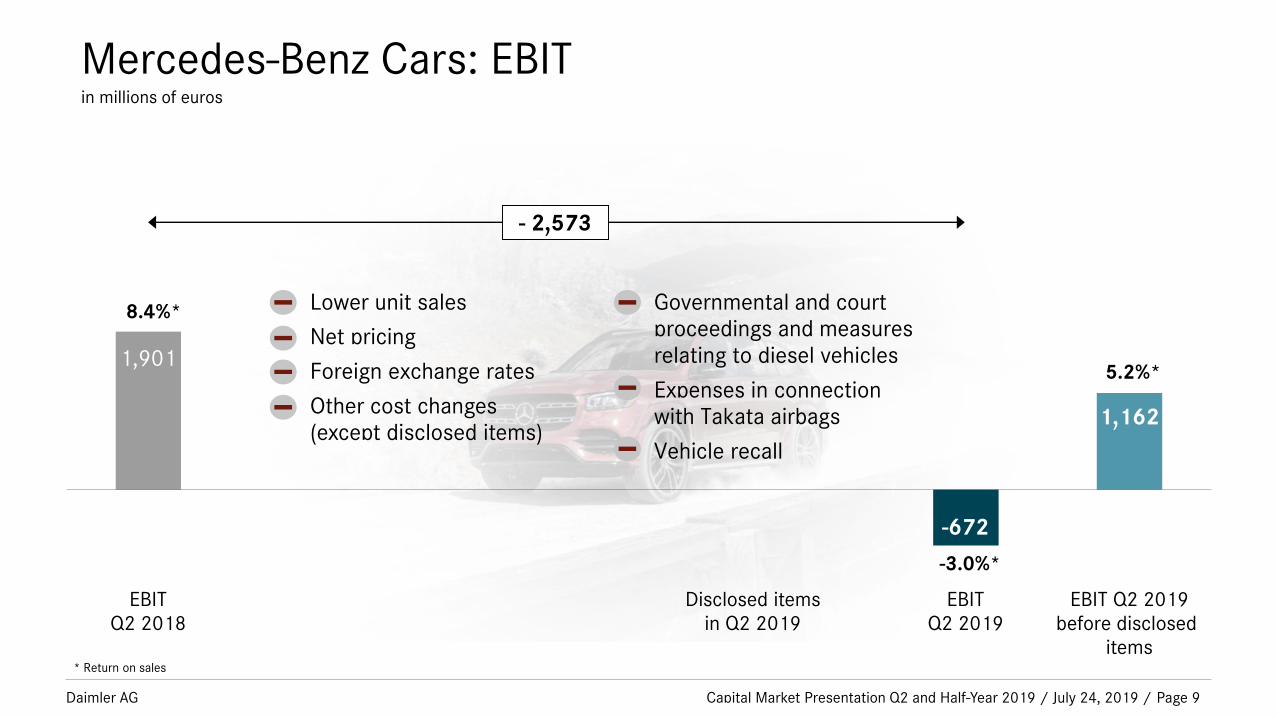
Mercedes-Benz Cars: EBITin millions of euros
Capital Market Presentation Q2 and Half-Year 2019 / July 24, 2019 / Page 9
* Return on sales
1,901
-672
- 2,573
8.4%*
-3.0%*
Lower unit sales
Net pricing
Foreign exchange rates
Other cost changes(except disclosed items)
Governmental and court proceedings and measures relating to diesel vehicles
Expenses in connection with Takata airbags
Vehicle recall
1,162
5.2%*
EBITQ2 2018
EBITQ2 2019
Disclosed itemsin Q2 2019
EBIT Q2 2019before disclosed
items

Daimler AG Capital Market Presentation Q2 and Half-Year 2019 / July 24, 2019 / Page 10
Mercedes-Benz Vans
Unit sales in thousands of units
Q2 2018 Q2 2019
Revenuein billions of euros
EBITin millions of euros
110.9 111.1
Q2 2018 Q2 2019
3.5 3.7
+4%
Q2 2018 Q2 2019
152
-2,050
Daimler AG
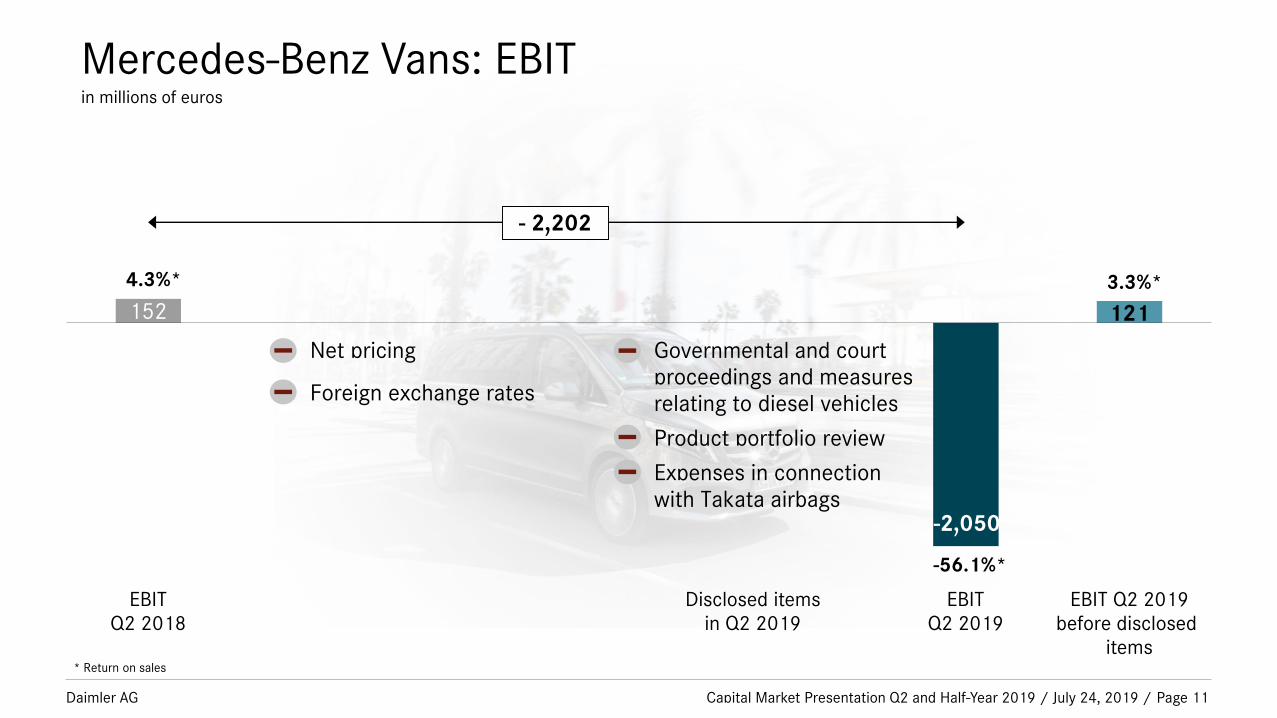
Mercedes-Benz Vans: EBITin millions of euros
Capital Market Presentation Q2 and Half-Year 2019 / July 24, 2019 / Page 11
152
4.3%*
* Return on sales
-2,050
-56.1%*
Net pricing
Foreign exchange rates
Governmental and court proceedings and measures relating to diesel vehicles
Product portfolio review
Expenses in connection with Takata airbags
121
3.3%*
EBITQ2 2018
EBITQ2 2019
Disclosed itemsin Q2 2019
EBIT Q2 2019before disclosed
items
- 2,202
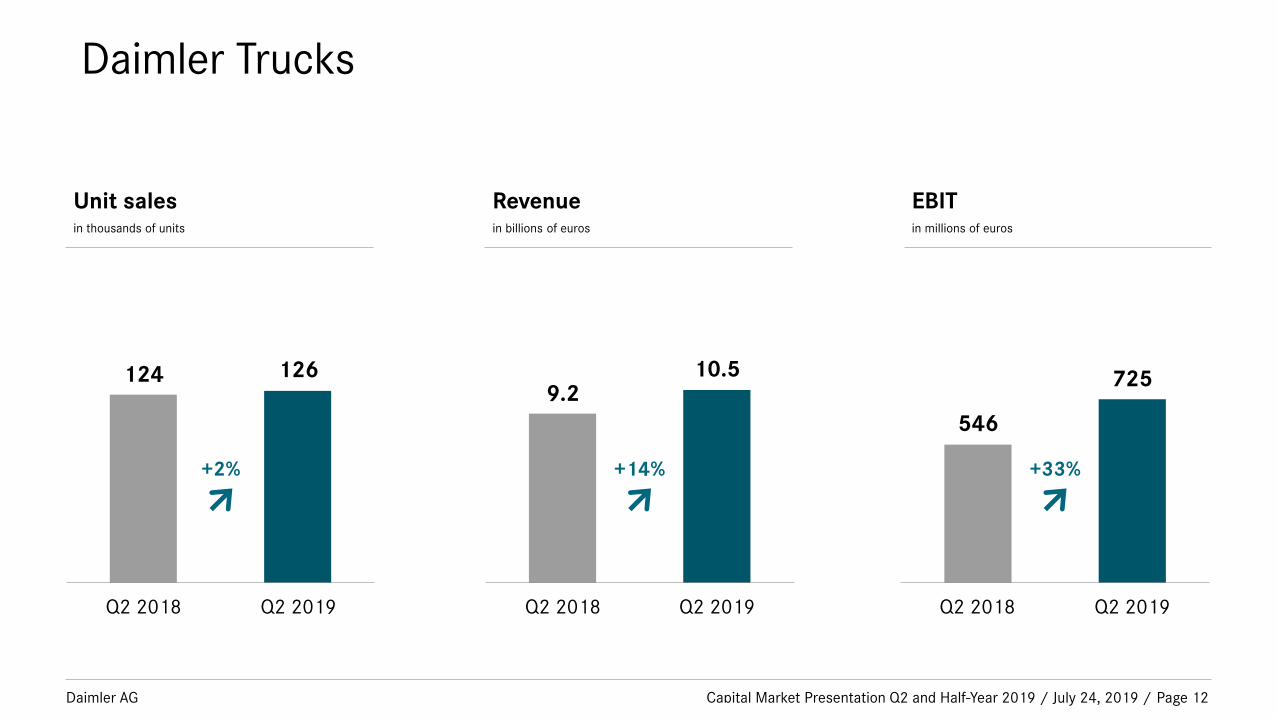
Daimler AG Capital Market Presentation Q2 and Half-Year 2019 / July 24, 2019 / Page 12
Daimler Trucks
Unit sales in thousands of units
Q2 2018 Q2 2019
Revenuein billions of euros
EBITin millions of euros
124 126
Q2 2018 Q2 2019
9.210.5
Q2 2018 Q2 2019
546
725
+2% +14% +33%

Daimler AG
Daimler Trucks: EBITin millions of euros
Capital Market Presentation Q2 and Half-Year 2019 / July 24, 2019 / Page 13
546
7255.9%*
6.9%*
* Return on sales
772
7.4%*
Higher unit sales, especially in the NAFTA region
Net pricing
Foreign exchange rates
Other cost changes(except disclosed items)
Expenses in connection with Takata airbags
EBITQ2 2018
EBITQ2 2019
Disclosed itemsin Q2 2019
EBIT Q2 2019before disclosed
items
+ 179

Daimler AG Capital Market Presentation Q2 and Half-Year 2019 / July 24, 2019 / Page 14
Daimler Trucks: Incoming Ordersin thousands of units
* European Union, Switzerland and Norway
Q2 2018
144
96
Q2 2019
18
28
10
33
21
63
8
41
Rest of world
Latin America
NAFTA region
EU30*
Asia
11
7
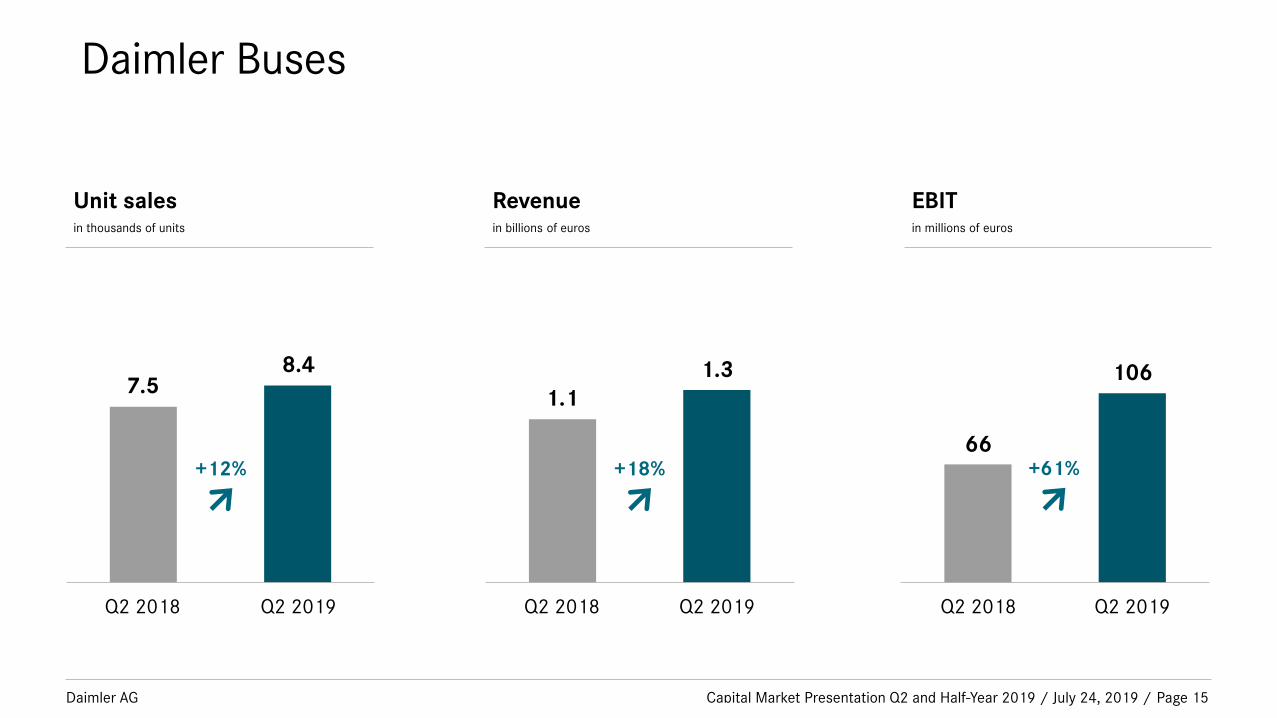
Daimler AG Capital Market Presentation Q2 and Half-Year 2019 / July 24, 2019 / Page 15
Daimler Buses
Unit sales in thousands of units
Q2 2018 Q2 2019
Revenuein billions of euros
EBITin millions of euros
7.58.4
Q2 2018 Q2 2019
1.11.3
Q2 2018 Q2 2019
66
106
+12% +18% +61%
Daimler AG
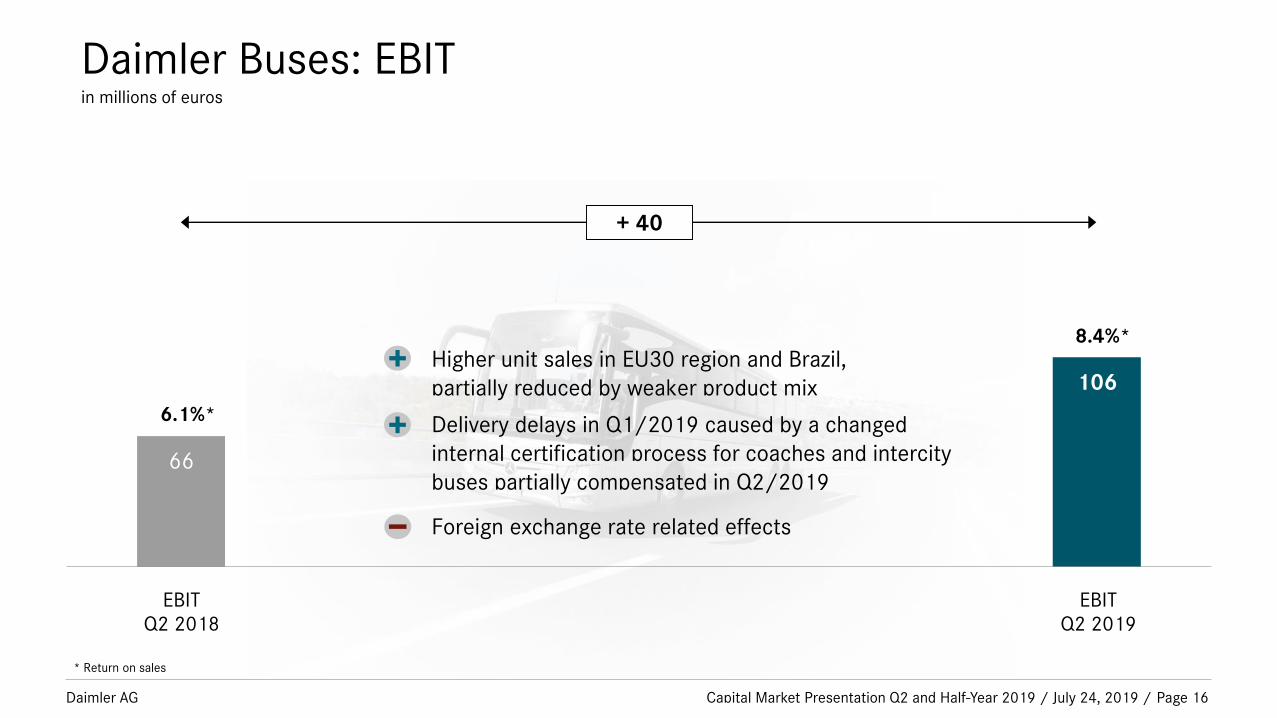
Daimler Buses: EBITin millions of euros
Capital Market Presentation Q2 and Half-Year 2019 / July 24, 2019 / Page 16
EBITQ2 2018
EBITQ2 2019
66
106
+ 40
6.1%*
8.4%*
* Return on sales
Higher unit sales in EU30 region and Brazil, partially reduced by weaker product mix
Delivery delays in Q1/2019 caused by a changed internal certification process for coaches and intercity buses partially compensated in Q2/2019
Foreign exchange rate related effects
Daimler AG Capital Market Presentation Q2 and Half-Year 2019 / July 24, 2019 / Page 17
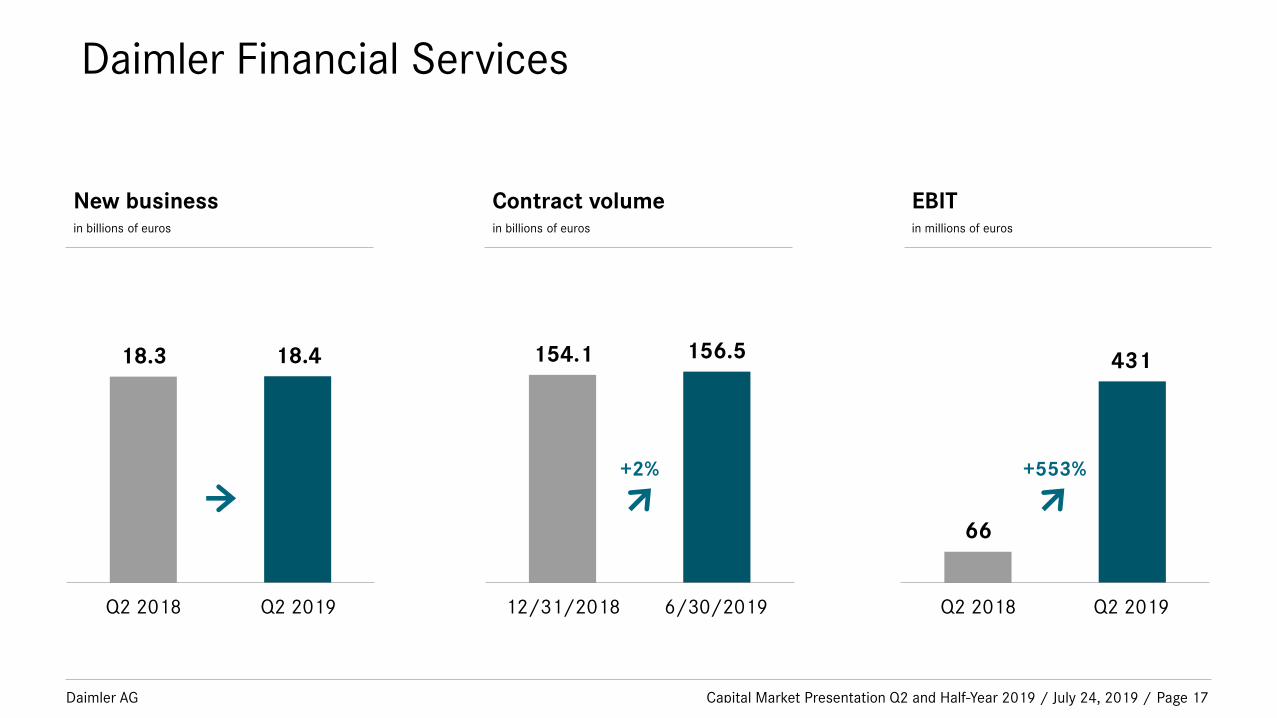
Daimler Financial Services
New business in billions of euros
Q2 2018 Q2 2019
Contract volumein billions of euros
EBITin millions of euros
18.3 18.4
12/31/2018 6/30/2019
154.1 156.5
Q2 2018 Q2 2019
66
431
+2% +553%

Daimler AG
Daimler Financial Services: EBITin millions of euros
Capital Market Presentation Q2 and Half-Year 2019 / July 24, 2019 / Page 18
* Return on equity
EBITQ2 2018
EBITQ2 2019
66
431
2.1%*
12.5%*484
15.5%*
Settlement of the Toll Collect arbitration proceedings
Higher contract volume
Normalization of cost of risk
Higher expenses for new mobility solutions
EBIT Q2 2018before disclosed
items
Disclosed itemsin Q2 2018
+ 365
Daimler AG
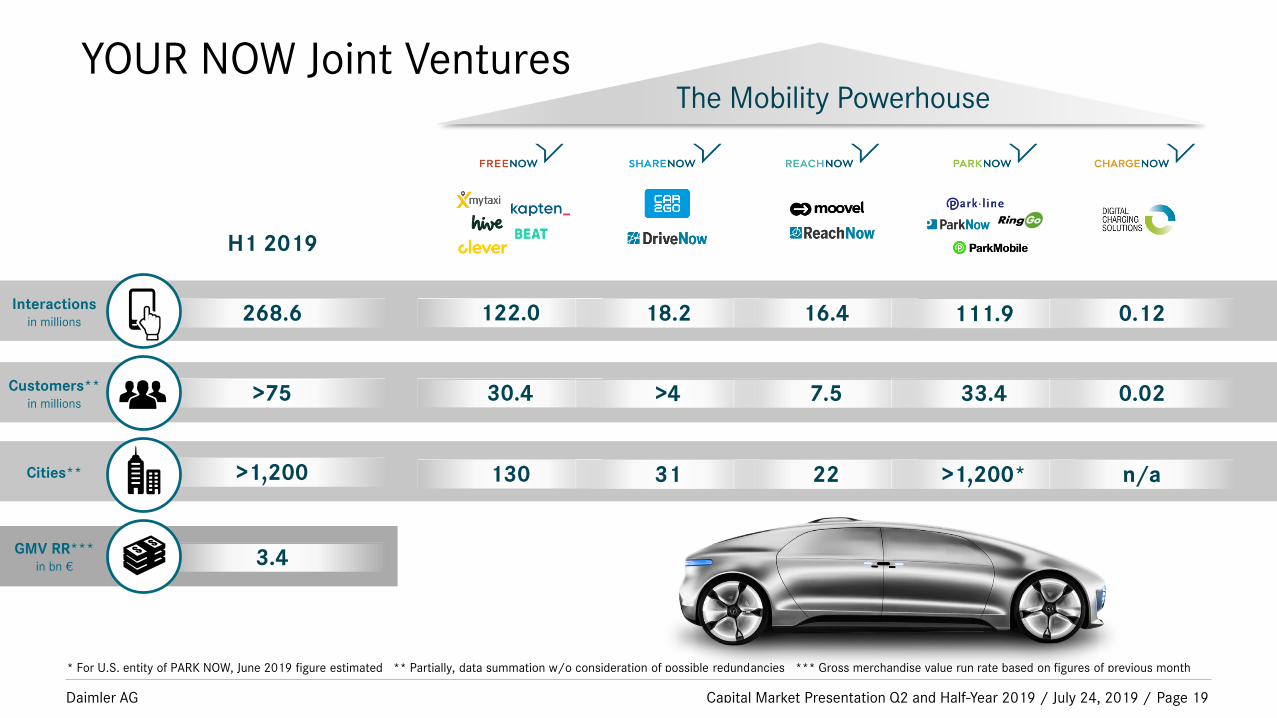
YOUR NOW Joint Ventures
Capital Market Presentation Q2 and Half-Year 2019 / July 24, 2019 / Page 19
3.4
>75
268.6
Customers**in millions
>1,200
GMV RR***in bn €
H1 2019
* For U.S. entity of PARK NOW, June 2019 figure estimated ** Partially, data summation w/o consideration of possible redundancies *** Gross merchandise value run rate based on figures of previous month
Cities**
0.1216.4 111.9
0.027.5 33.4
n/a22 >1,200*
Interactionsin millions 122.0
30.4
130
18.2
>4
31
The Mobility Powerhouse

Daimler AG
Assumptions for automotive markets in 2019
Capital Market Presentation Q2 and Half-Year 2019 / July 24, 2019 / Page 20
* including light-duty trucks
Car markets
Global
Europe
Bus marketsEU30
Brazil
USA
China
slight decrease
slight decrease
slight growth
significant growth
slight decrease
slight decrease
Heavy- and
medium-duty
truck markets
NAFTA region
EU30
Japan*
Brazil
Indonesia*
slight growth
around the prior-year level
around the prior-year level
significant growth
declining development
EU30Van markets
USA around the prior-year level
slight growth in the midsize and large segment
Daimler AG
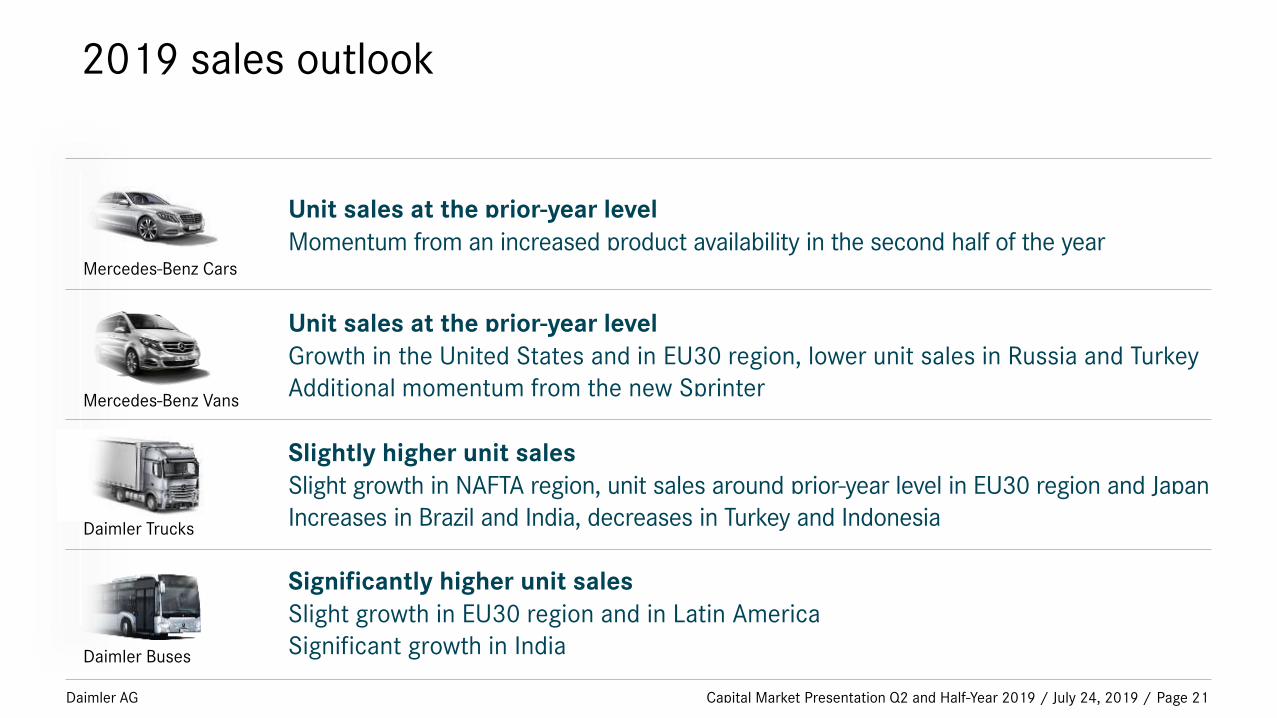
Significantly higher unit salesSlight growth in EU30 region and in Latin AmericaSignificant growth in India
Slightly higher unit salesSlight growth in NAFTA region, unit sales around prior-year level in EU30 region and Japan Increases in Brazil and India, decreases in Turkey and Indonesia
Unit sales at the prior-year level Momentum from an increased product availability in the second half of the year
Unit sales at the prior-year level Growth in the United States and in EU30 region, lower unit sales in Russia and TurkeyAdditional momentum from the new Sprinter
2019 sales outlook
Capital Market Presentation Q2 and Half-Year 2019 / July 24, 2019 / Page 21
Mercedes-Benz Cars
Daimler Buses
Daimler Trucks
Mercedes-Benz Vans

Daimler AG
2019 outlook for Group EBIT and divisional RoS/RoE
Capital Market Presentation Q2 and Half-Year 2019 / July 24, 2019 / Page 22
Return on sales in the range of 3 to 5%
Return on sales in the range of 5 to 7%
Return on equity in the range of 17 to 19%*
We expect Group EBIT for FY 2019 to be significantly belowthe prior-year level
Mercedes-Benz Cars
Return on sales in the range of 7 to 9%Daimler Trucks
Return on sales in the range of minus 15 to minus 17%Mercedes-Benz Vans
Daimler Buses
Daimler Financial Services
* Including significant one-time valuation and earnings effects from the merger of the mobility services of Daimler and BMW.
Daimler AG
Measures and priorities for H2
Capital Market Presentation Q2 and Half-Year 2019 / July 24, 2019 / Page 23
• Focus on 2019 operational challenges and financial targets
• Improve Daimler efficiency in the short and medium term
• Enhance free cash flow focus and prioritize capital allocation
• Continue company transformation and establish sustainable business strategy
Daimler AG
Contents
Capital Market Presentation Q2 and Half-Year 2019 / July 24, 2019 / Page 24
Presentation charts on Q2 and H1 2019 results
Additional financial details
Strategy and technology

Daimler AG
Unit sales by divisionin thousands of units
Capital Market Presentation Q2 and Half-Year 2019 / July 24, 2019 / Page 25
Q2 2018 Q2 2019 % change
Daimler Group 833.0 821.7 -1
of which
Mercedes-Benz Cars 590.7 575.6 -3
Mercedes-Benz Vans 110.9 111.1 +0
Daimler Trucks 123.9 126.5 +2
Daimler Buses 7.5 8.4 +12

Daimler AG
Revenue by divisionin billions of euros
Capital Market Presentation Q2 and Half-Year 2019 / July 24, 2019 / Page 26
Q2 2018 Q2 2019 % change
Daimler Group 40.8 42.7 +5
of which
Mercedes-Benz Cars 22.6 22.3 -1
Mercedes-Benz Vans 3.5 3.7 +4
Daimler Trucks 9.2 10.5 +14
Daimler Buses 1.1 1.3 +18
Daimler Financial Services 6.6 7.1 +9
Daimler AG
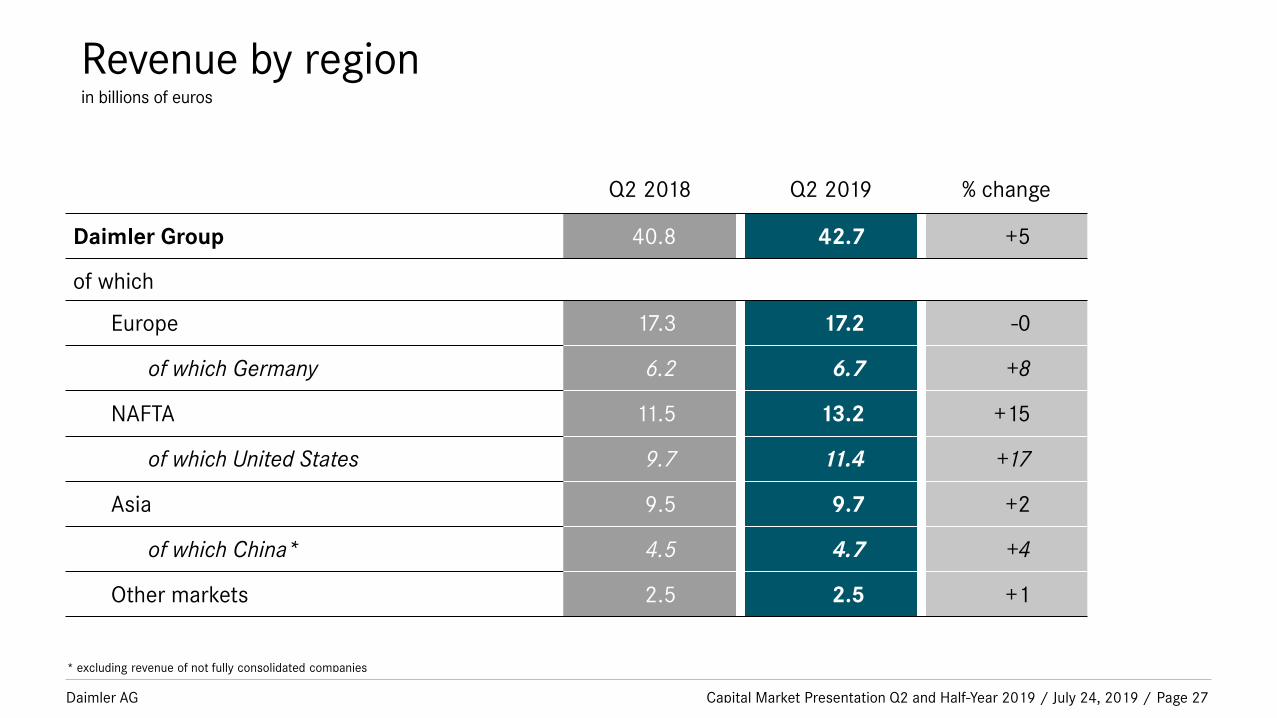
Revenue by regionin billions of euros
Capital Market Presentation Q2 and Half-Year 2019 / July 24, 2019 / Page 27
Q2 2018 Q2 2019 % change
Daimler Group 40.8 42.7 +5
of which
Europe 17.3 17.2 -0
of which Germany 6.2 6.7 +8
NAFTA 11.5 13.2 +15
of which United States 9.7 11.4 +17
Asia 9.5 9.7 +2
of which China* 4.5 4.7 +4
Other markets 2.5 2.5 +1
* excluding revenue of not fully consolidated companies

Daimler AG
EBIT by divisionEBIT in millions of euros; RoS/RoE in %
Capital Market Presentation Q2 and Half-Year 2019 / July 24, 2019 / Page 28
Q2 2018 Q2 2019
EBIT RoS/RoE* EBIT RoS/RoE*
Daimler Group 2,640 7.5 -1,555 -5.6
of which
Mercedes-Benz Cars 1,901 8.4 -672 -3.0
Mercedes-Benz Vans 152 4.3 -2,050 -56.1
Daimler Trucks 546 5.9 725 6.9
Daimler Buses 66 6.1 106 8.4
Daimler Financial Services 66 2.1 431 12.5
Reconciliation -91 – -95 –
* Return on sales for automotive business, return on equity for Daimler Financial Services; Daimler Group excluding Daimler Financial Services
Daimler AG
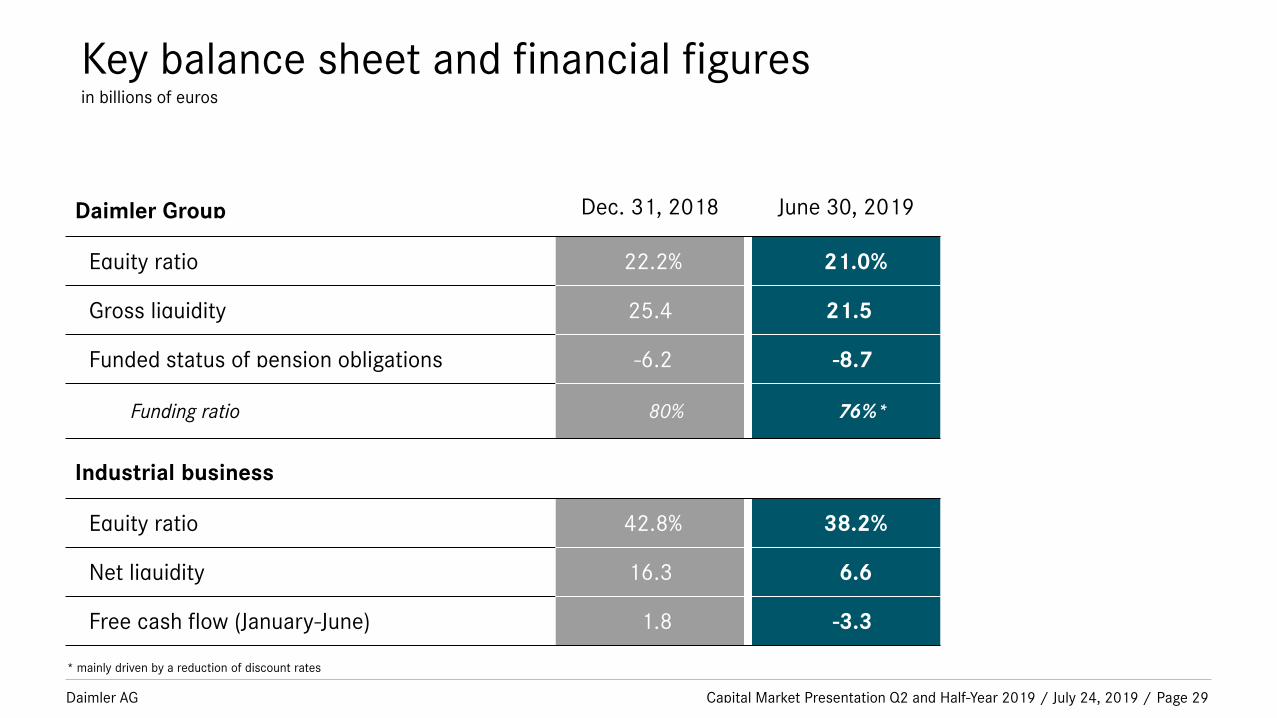
Key balance sheet and financial figuresin billions of euros
Capital Market Presentation Q2 and Half-Year 2019 / July 24, 2019 / Page 29
Daimler Group Dec. 31, 2018 June 30, 2019
Equity ratio 22.2% 21.0%
Gross liquidity 25.4 21.5
Funded status of pension obligations -6.2 -8.7
Funding ratio 80% 76%*
Industrial business
Equity ratio 42.8% 38.2%
Net liquidity 16.3 6.6
Free cash flow (January-June) 1.8 -3.3
* mainly driven by a reduction of discount rates

Daimler AG
Consolidated statement of income (condensed)in millions of euros
Capital Market Presentation Q2 and Half-Year 2019 / July 24, 2019 / Page 30
Daimler Group Industrial Business
Q2 2018 Q2 2019 Q2 2018 Q2 2019
Revenue 40,756 42,650 34,186 35,505
Cost of sales -32,506 -37,104 -26,853 -30,878
Gross profit 8,250 5,546 7,333 4,627
Selling expenses -3,253 -3,072 -3,045 -2,875
General administrative expenses -965 -975 -700 -760
Research and non-capitalized development costs -1,620 -1,569 -1,620 -1,569
Other operating income/expense 264 -1,611 210 -1,660
Profit/loss on equity-method investments -14 210 410 335
Other financial income -26 -87 -18 -87
Interest income/expense -106 -114 -105 -112
Profit before income taxes 2,530 -1,672 2,465 -2,101
Income taxes -705 430 -723 577
Net profit 1,825 -1,242 1,742 -1,524
Earnings per share (in euros) 1.61 -1.24 – –
Daimler AG
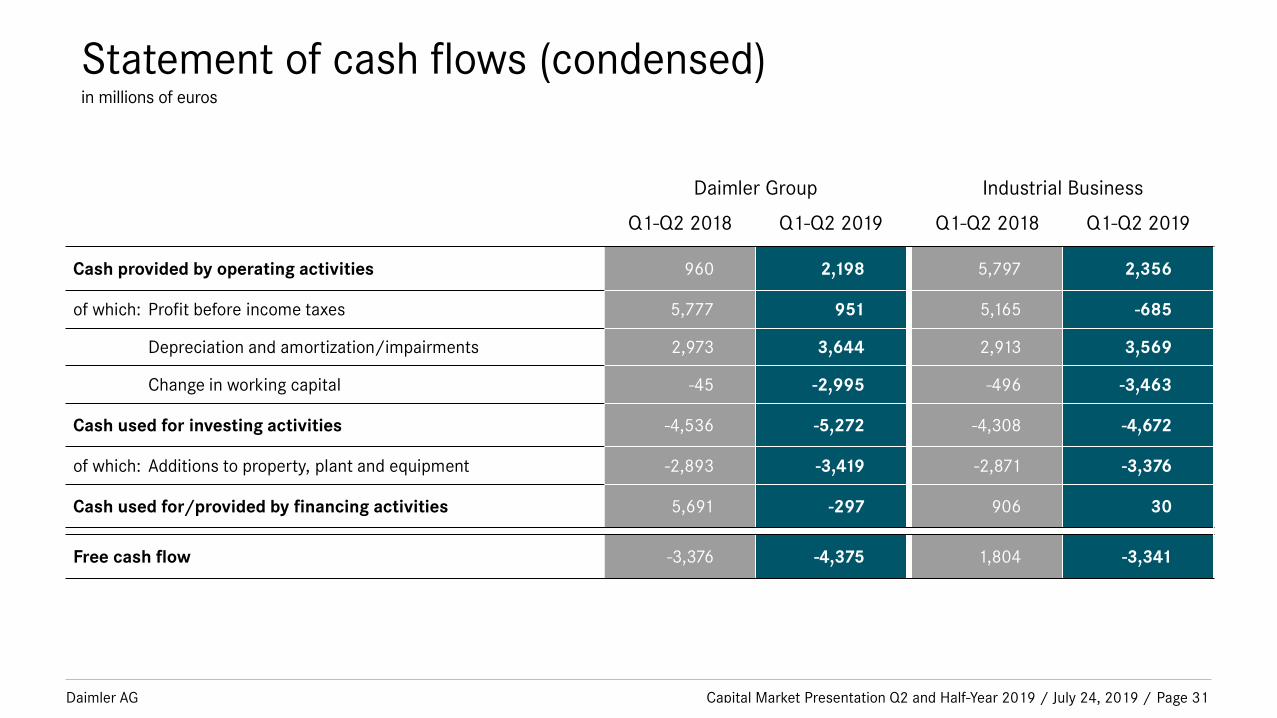
Statement of cash flows (condensed)in millions of euros
Capital Market Presentation Q2 and Half-Year 2019 / July 24, 2019 / Page 31
Daimler Group Industrial Business
Q1-Q2 2018 Q1-Q2 2019 Q1-Q2 2018 Q1-Q2 2019
Cash provided by operating activities 960 2,198 5,797 2,356
of which: Profit before income taxes 5,777 951 5,165 -685
Depreciation and amortization/impairments 2,973 3,644 2,913 3,569
Change in working capital -45 -2,995 -496 -3,463
Cash used for investing activities -4,536 -5,272 -4,308 -4,672
of which: Additions to property, plant and equipment -2,893 -3,419 -2,871 -3,376
Cash used for/provided by financing activities 5,691 -297 906 30
Free cash flow -3,376 -4,375 1,804 -3,341

Daimler AG
Statement of financial position (condensed)in millions of euros
Capital Market Presentation Q2 and Half-Year 2019 / July 24, 2019 / Page 32
Daimler Group Industrial Business
Dec. 31, 2018 June 30, 2019 Dec. 31, 2018 June 30, 2019
Intangible assets 14,801 15,383 13,913 14,504
Property, plant and equipment 30,948 35,794 30,859 35,445
Receivables from financial services & equipment on operating leases 146,216 149,037 18,419 18,783
Equity-method investments 4,860 6,020 4,651 4,184
Inventories 29,489 33,459 28,096 32,267
Trade receivables 12,586 12,743 10,545 10,909
Liquidity 25,430 21,464 21,163 18,371
Other assets 17,289 20,282 -11,343 -7,882
Total assets 281,619 294,182 116,303 126,581
Equity 66,053 61,780 53,243 48,386
Provisions 24,406 30,569 23,269 29,373
Financing liabilities 144,902 154,103 4,771 12,609
Trade payables 14,185 15,194 13,395 14,321
Other liabilities 32,073 32,536 21,625 21,892
Total equity and liabilities 281,619 294,182 116,303 126,581
Daimler AG
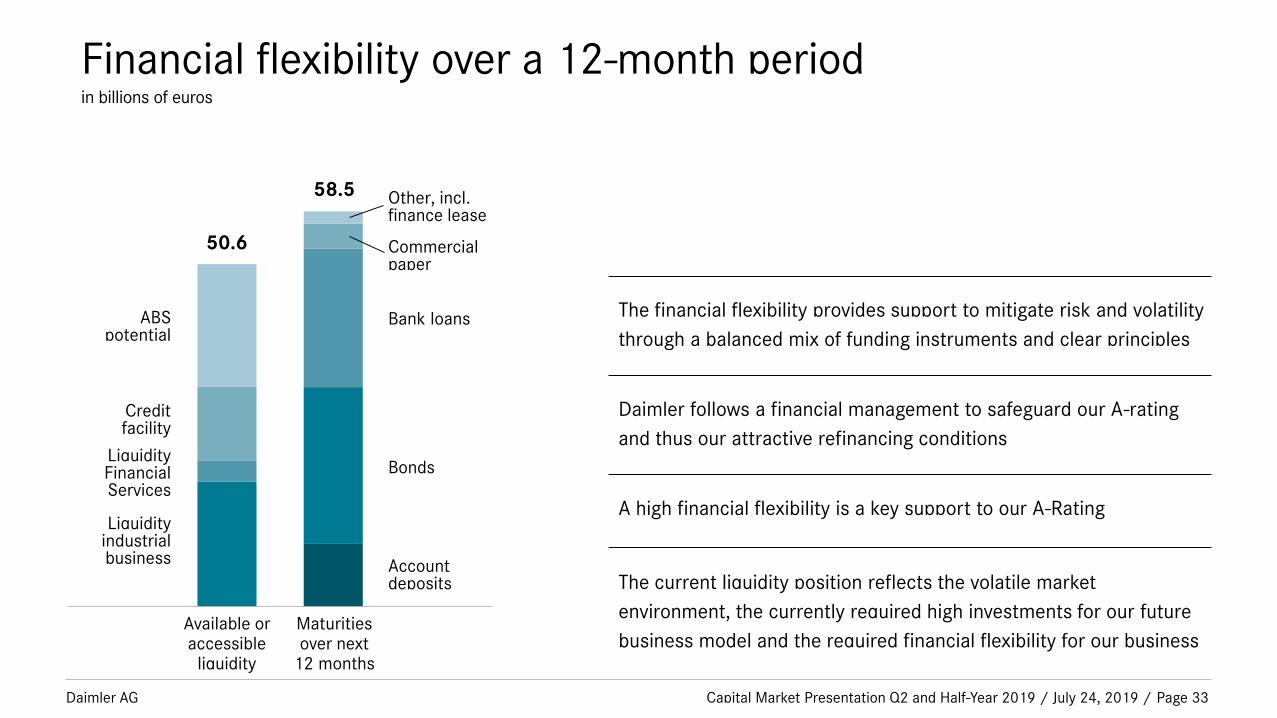
Financial flexibility over a 12-month periodin billions of euros
Capital Market Presentation Q2 and Half-Year 2019 / July 24, 2019 / Page 33
The financial flexibility provides support to mitigate risk and volatility
through a balanced mix of funding instruments and clear principles
Daimler follows a financial management to safeguard our A-rating
and thus our attractive refinancing conditions
A high financial flexibility is a key support to our A-Rating
The current liquidity position reflects the volatile market
environment, the currently required high investments for our future
business model and the required financial flexibility for our businessAvailable oraccessible
liquidity
50.6
58.5
Maturitiesover next
12 months
Other, incl.finance lease
Bank loans
Bonds
Accountdeposits
Commercialpaper
Creditfacility
LiquidityFinancialServices
Liquidityindustrialbusiness
ABSpotential

Daimler AG Capital Market Presentation Q2 and Half-Year 2019 / July 24, 2019 / Page 34
Mercedes-Benz Cars: unit sales by segmentsin thousands of units
Q2 2018
591 576
Q2 2019
124
113
102
18
7
97
118
107
19
5smart
E-Class
C-Class
A-/B-Class
S-Class
Sports Cars3236
SUVs208 181
Daimler AG Capital Market Presentation Q2 and Half-Year 2019 / July 24, 2019 / Page 35
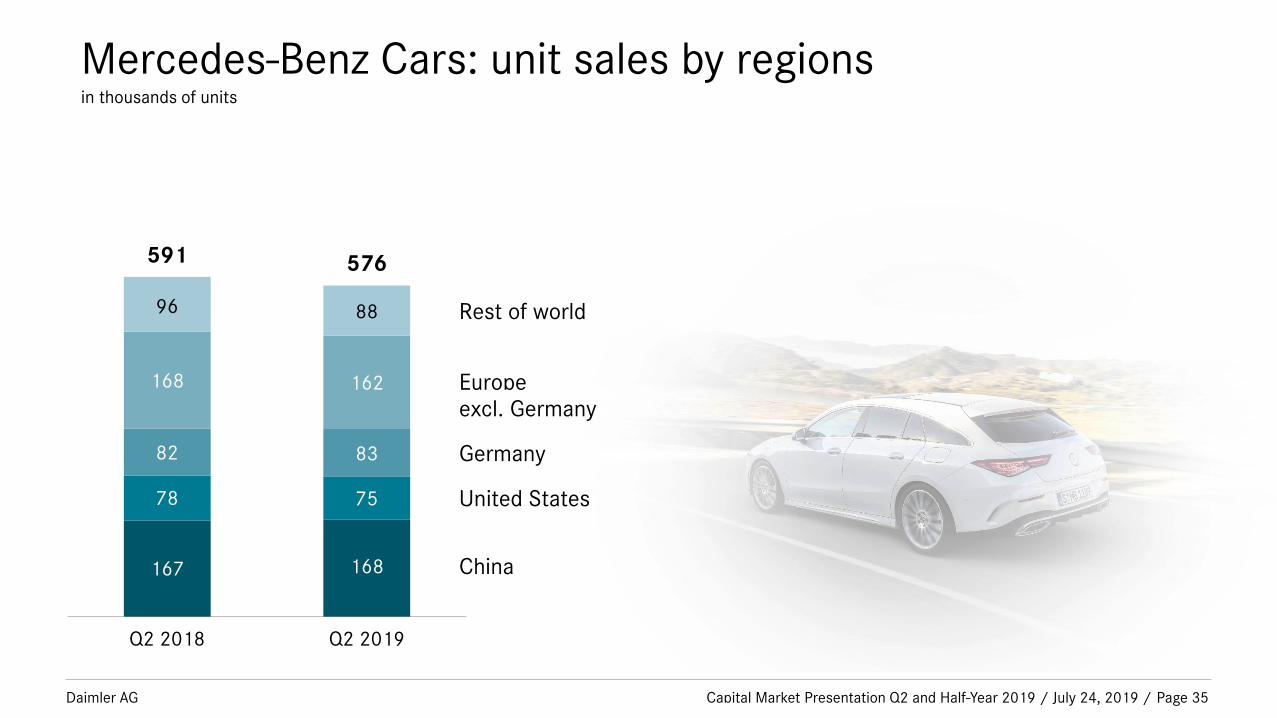
Mercedes-Benz Cars: unit sales by regionsin thousands of units
Q2 2018
591 576
Q2 2019
168
75
83
162
167
78
82
168
Rest of world
Germany
United States
China
Europeexcl. Germany
96 88
Daimler AG Capital Market Presentation Q2 and Half-Year 2019 / July 24, 2019 / Page 36
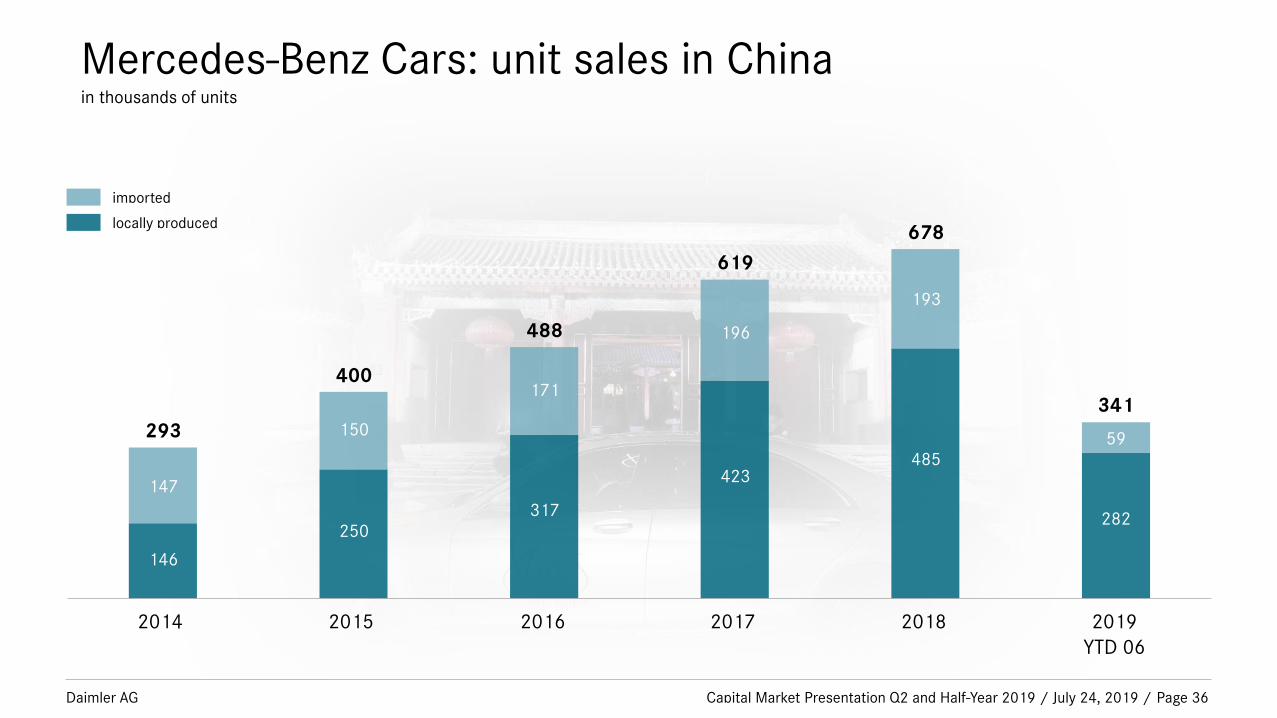
Mercedes-Benz Cars: unit sales in Chinain thousands of units
293
400
488
678locally produced
imported
2019YTD 06
201620152014 2017
147
146
150
250
171
317
193
485
619
2018
196
423
341
59
282

Daimler AG Capital Market Presentation Q2 and Half-Year 2019 / July 24, 2019 / Page 37
Mercedes-Benz Vans: unit sales by segmentsin thousands of units
Q2 2018
110.9 111.1
Q2 2019
6.4
15.4
27.0
59.1
7.7
18.7
27.5
51.7
Vito
V-Class
Citan
Sprinter
X-Class3.15.2
Daimler AG Capital Market Presentation Q2 and Half-Year 2019 / July 24, 2019 / Page 38
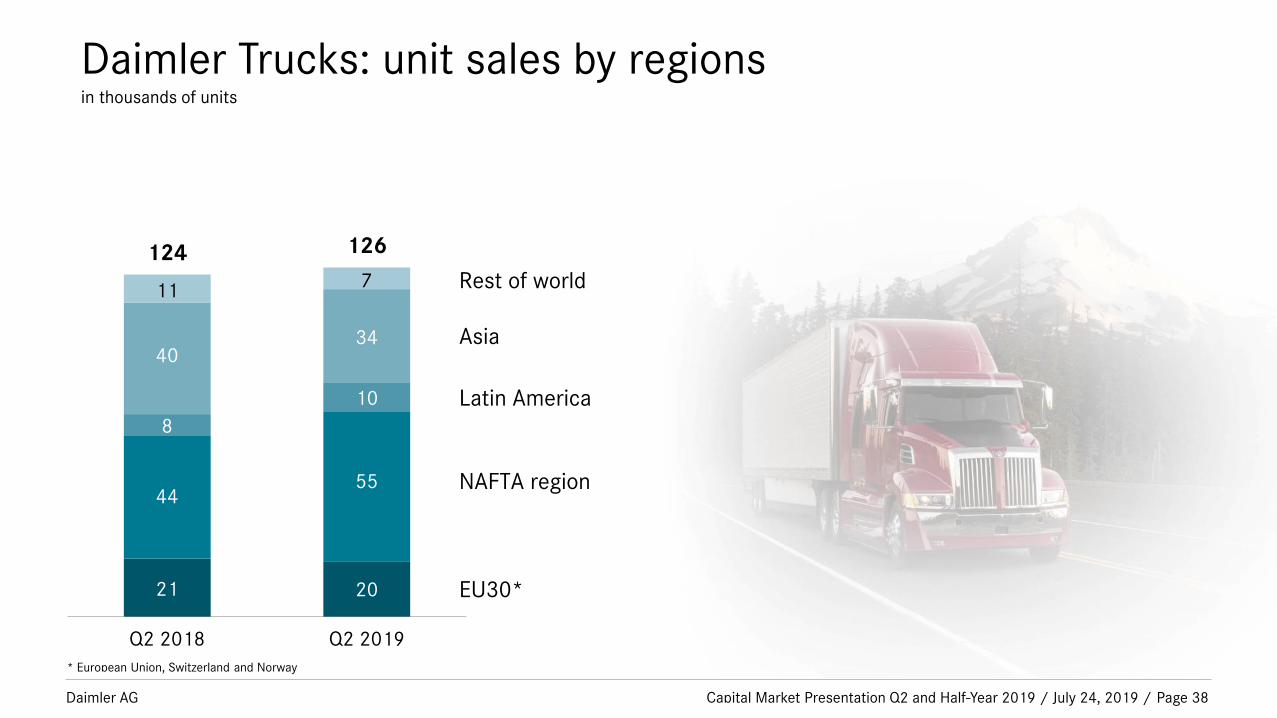
Daimler Trucks: unit sales by regionsin thousands of units
* European Union, Switzerland and Norway
Q2 2018
124 126
Q2 2019
20
55
10
34
21
44
8
40
Rest of world
Latin America
NAFTA region
EU30*
Asia
11 7
Daimler AG Capital Market Presentation Q2 and Half-Year 2019 / July 24, 2019 / Page 39
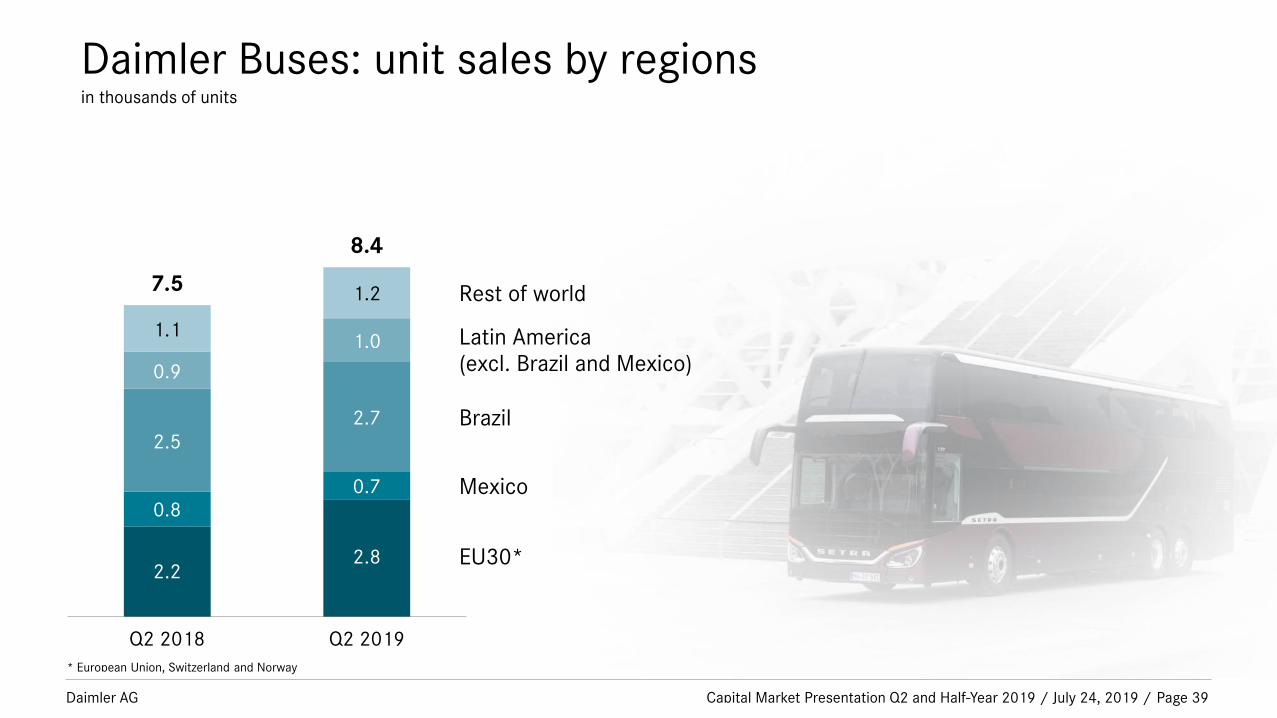
Daimler Buses: unit sales by regionsin thousands of units
Q2 2018
7.5
8.4
Q2 2019
2.8
0.7
2.7
1.0
2.2
0.8
2.5
0.9
Rest of world
Brazil
Mexico
EU30*
Latin America(excl. Brazil and Mexico)
1.1
1.2
* European Union, Switzerland and Norway
Daimler AG Capital Market Presentation Q2 and Half-Year 2019 / July 24, 2019 / Page 40
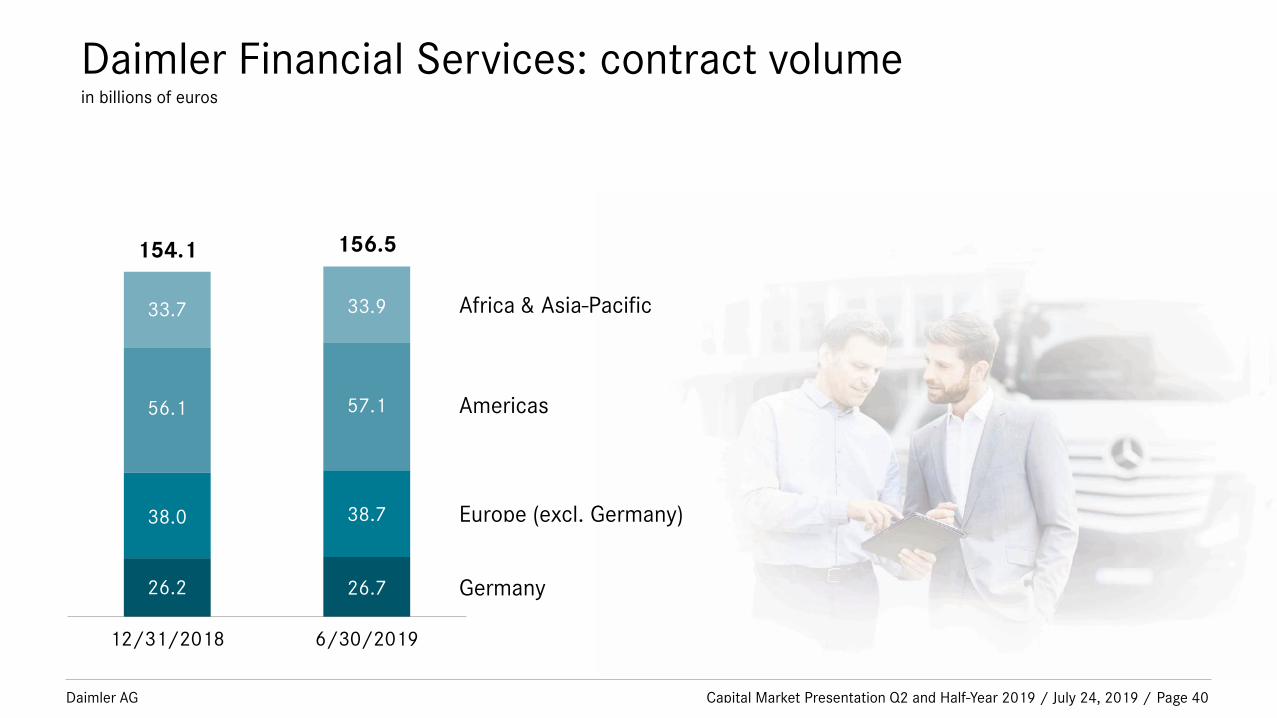
Daimler Financial Services: contract volumein billions of euros
12/31/2018
154.1 156.5
6/30/2019
26.7
38.7
57.1
33.9
26.2
38.0
56.1
33.7
Americas
Europe (excl. Germany)
Germany
Africa & Asia-Pacific
Daimler AG Capital Market Presentation Q2 and Half-Year 2019 / July 24, 2019 / Page 41
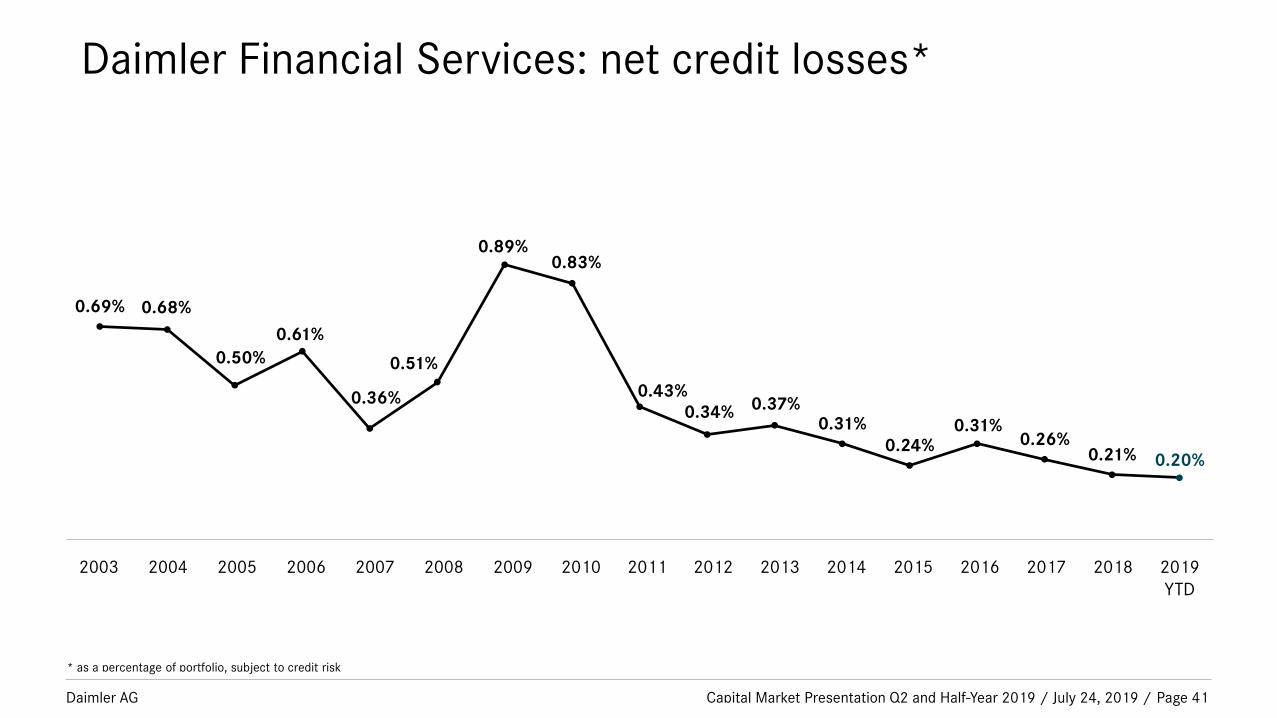
Daimler Financial Services: net credit losses*
* as a percentage of portfolio, subject to credit risk
0.69% 0.68%
0.50%
0.61%
0.36%
0.51%
0.89%0.83%
0.43%
0.34% 0.37%0.31%
0.24%0.31%
0.26%0.21% 0.20%
2003 2004 2005 2006 2007 2008 2009 2010 2011 2012 2013 2014 2019YTD
2015 2016 2017 2018

Daimler AG
Contents
Capital Market Presentation Q2 and Half-Year 2019 / July 24, 2019 / Page 42
Presentation charts on Q2 and H1 2019 results
Additional financial details
Strategy and technology

Daimler AG
Daimler’s investments go beyond the actual vehicle
Capital Market Presentation Q2 and Half-Year 2019 / July 24, 2019 / Page 43
* Not all investments have
been disclosed.
** Subject to approval by
authorities.
We focus on future-oriented technologies and invest in
innovative companies and startups.*
**
C A S E
Daimler AG
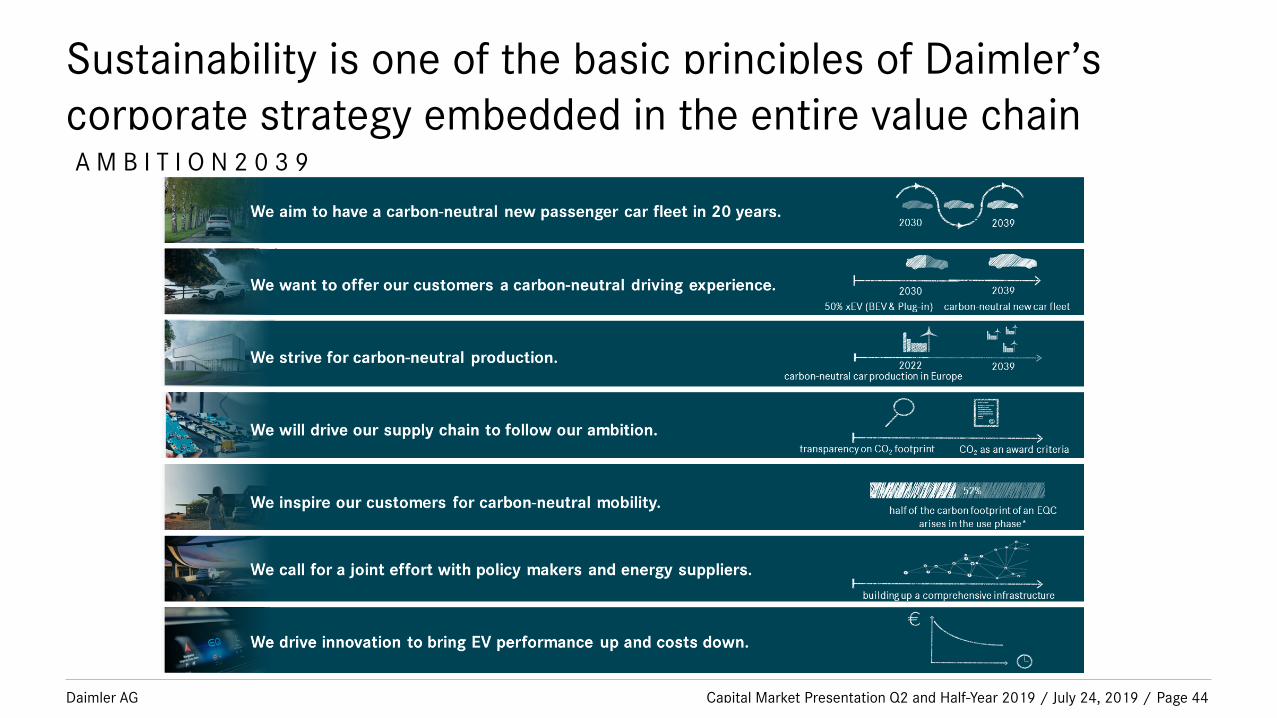
Sustainability is one of the basic principles of Daimler’s corporate strategy embedded in the entire value chain
Capital Market Presentation Q2 and Half-Year 2019 / July 24, 2019 / Page 44
A M B I T I O N 2 0 3 9

Daimler AG
Mercedes-Benz: Leading premium car and van brand
Capital Market Presentation Q2 and Half-Year 2019 / July 24, 2019 / Page 45
Connected Autonomous
Electric CORE

Daimler AG
With our unique products we are well positioned for growth
Capital Market Presentation Q2 and Half-Year 2019 / July 24, 2019 / Page 46
R o a d m a p t o G r o w t h

Daimler AG
Mercedes-Benz brand experience – we are transferring technology into a luxury experience
Capital Market Presentation Q2 and Half-Year 2019 / July 24, 2019 / Page 47
Daimler AG
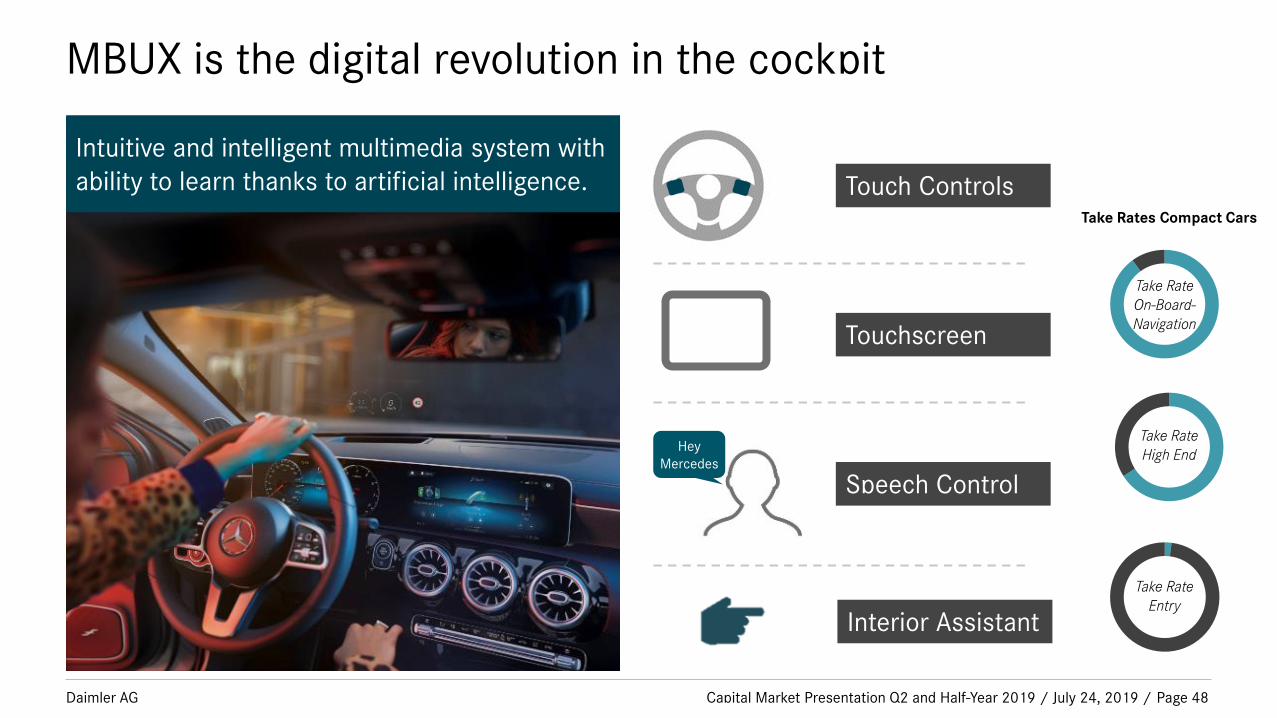
MBUX is the digital revolution in the cockpit
Capital Market Presentation Q2 and Half-Year 2019 / July 24, 2019 / Page 48
Take Rate
High End
Take Rate
Entry
Touch Controls
Touchscreen
Speech Control
Hey Mercedes
Intuitive and intelligent multimedia system with
ability to learn thanks to artificial intelligence.
Interior Assistant
Take Rates Compact Cars
Take Rate
On-Board-
Navigation

Daimler AG
Mercedes-Benz is developing DRIVE PILOT, an SAE Level 3 conditional automated driving system feature
Capital Market Presentation Q2 and Half-Year 2019 / July 24, 2019 / Page 49
DRIVE PILOT has the potential to
transform the way people live and
work.
The possibilities offered by
automated driving have captured
the public’s imagination in a way
that few new vehicle technologies
have.
At Mercedes-Benz we live
innovation and embrace the
opportunities it will bring to our
industry and the world.
Daimler AG
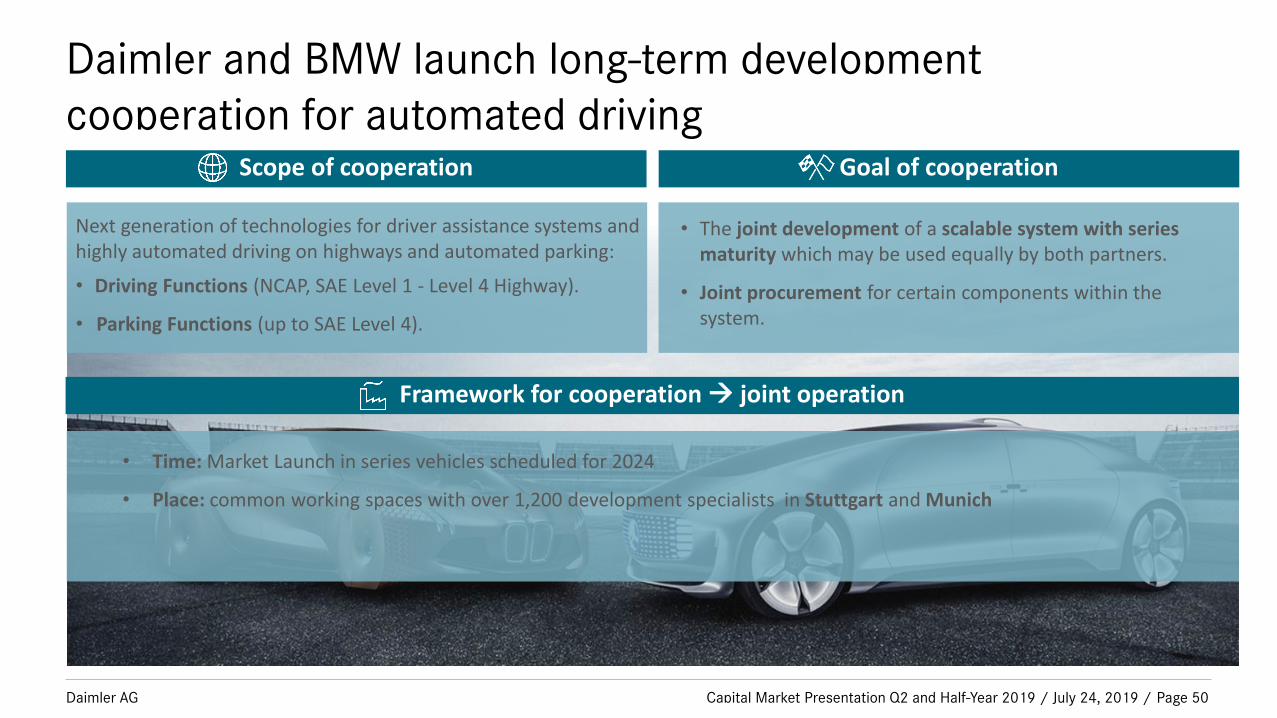
Daimler and BMW launch long-term developmentcooperation for automated driving
Capital Market Presentation Q2 and Half-Year 2019 / July 24, 2019 / Page 50
Scope of cooperation Goal of cooperation
Framework for cooperation joint operation
Next generation of technologies for driver assistance systems and highly automated driving on highways and automated parking:
• Driving Functions (NCAP, SAE Level 1 - Level 4 Highway).
• Parking Functions (up to SAE Level 4).
• The joint development of a scalable system with series maturity which may be used equally by both partners.
• Joint procurement for certain components within the system.
• Time: Market Launch in series vehicles scheduled for 2024
• Place: common working spaces with over 1,200 development specialists in Stuttgart and Munich

Daimler AG
Daimler and Bosch are pilot testing on-demand ride-hailing service in San José in H-2 2019
Capital Market Presentation Q2 and Half-Year 2019 / July 24, 2019 / Page 51
• Vehicles
• Integration of
system into the
vehicle line
Project House with locations in Germany and USA
Joint development of AD system Software
Goal: complete AD-Kit for Self Driving Car
• Hardware
(Sensors,
Actuators, ECUs)
• Software for HW
components
Daimler AG
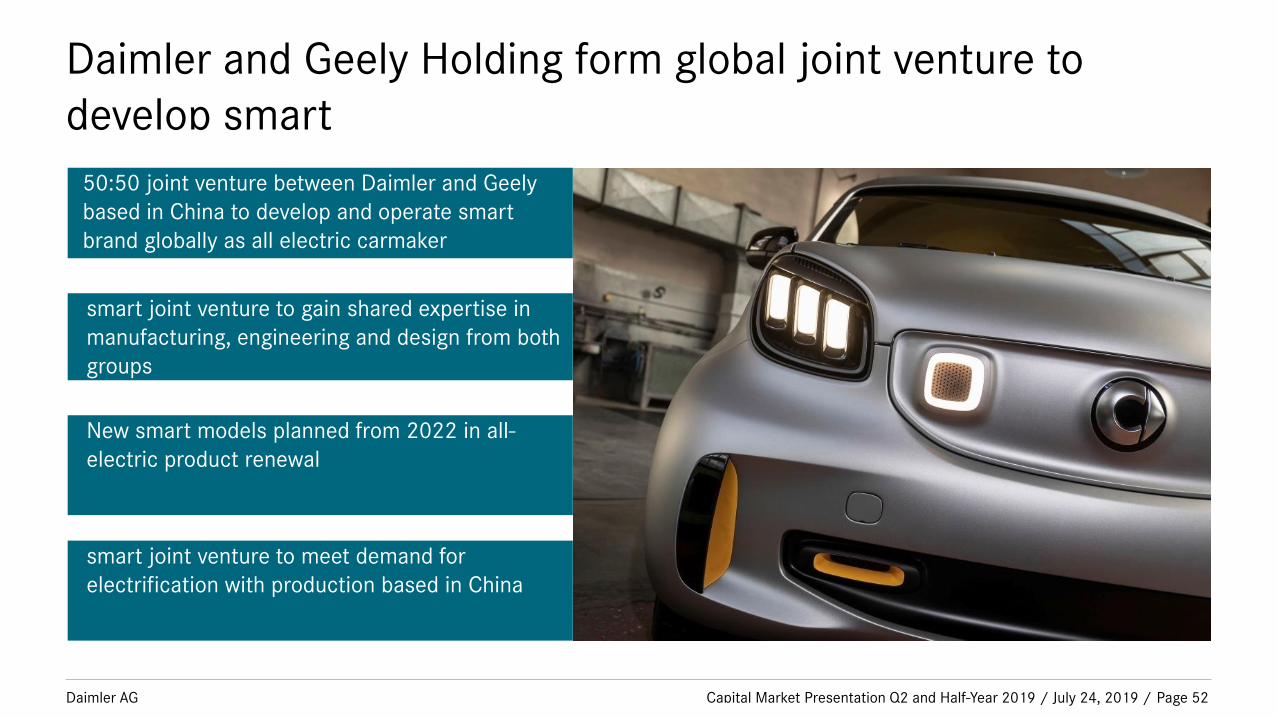
Daimler and Geely Holding form global joint venture to develop smart
Capital Market Presentation Q2 and Half-Year 2019 / July 24, 2019 / Page 52
50:50 joint venture between Daimler and Geely
based in China to develop and operate smart
brand globally as all electric carmaker
smart joint venture to gain shared expertise in
manufacturing, engineering and design from both
groups
smart joint venture to meet demand for
electrification with production based in China
New smart models planned from 2022 in all-
electric product renewal
Daimler AG Page 53
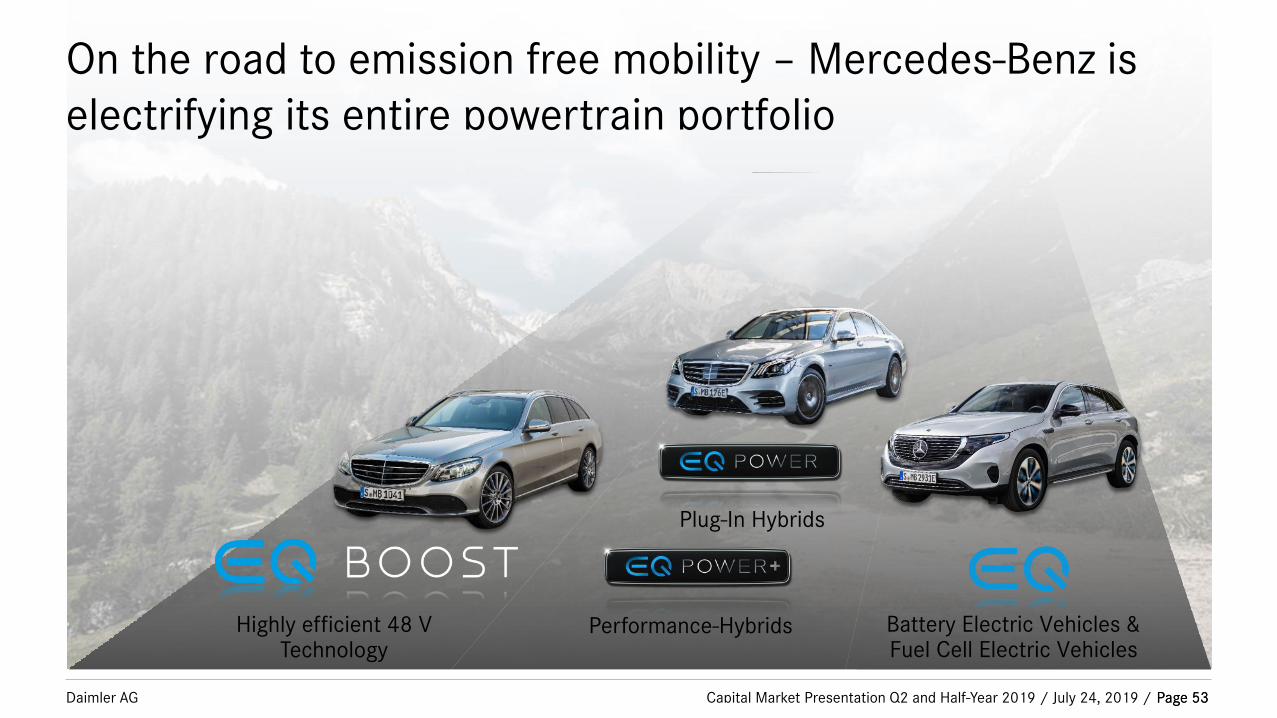
Performance-HybridsHighly efficient 48 V Technology
Battery Electric Vehicles &Fuel Cell Electric Vehicles
Plug-In Hybrids
On the road to emission free mobility – Mercedes-Benz is electrifying its entire powertrain portfolio
Page 53Capital Market Presentation Q2 and Half-Year 2019 / July 24, 2019 /
Daimler AG
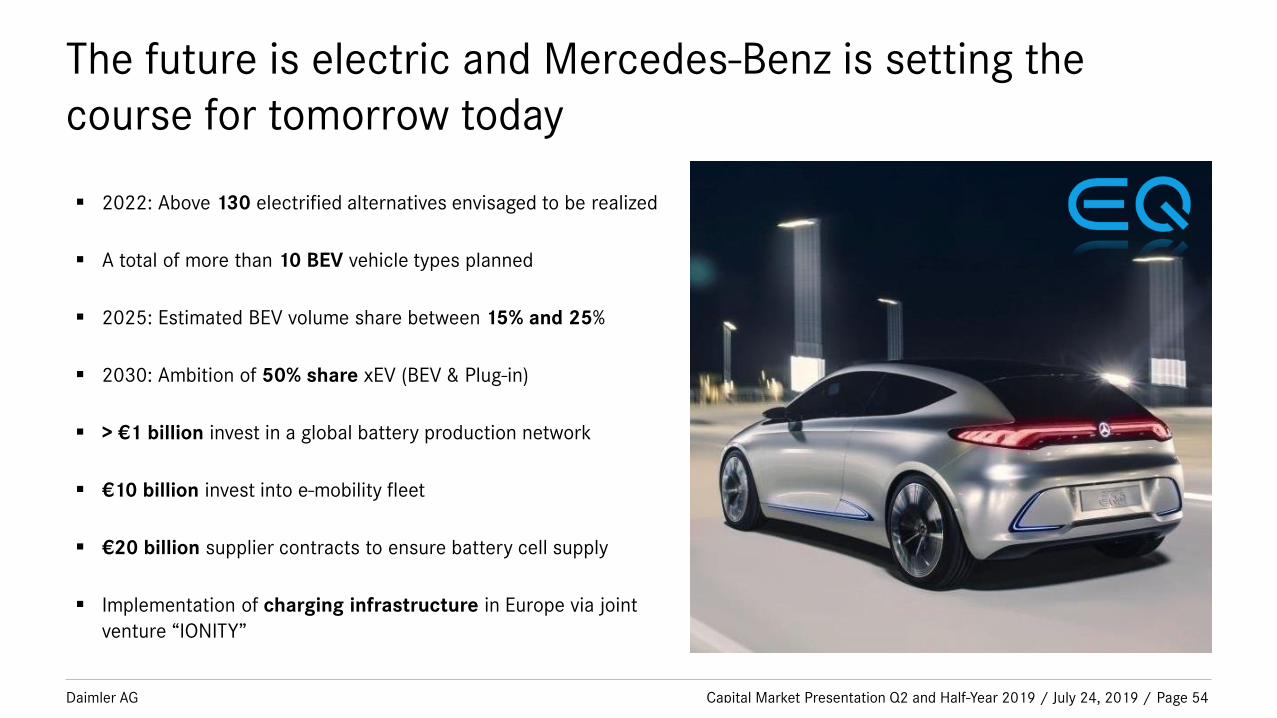
The future is electric and Mercedes-Benz is setting the course for tomorrow today
Capital Market Presentation Q2 and Half-Year 2019 / July 24, 2019 / Page 54
2022: Above 130 electrified alternatives envisaged to be realized
A total of more than 10 BEV vehicle types planned
2025: Estimated BEV volume share between 15% and 25%
2030: Ambition of 50% share xEV (BEV & Plug-in)
> €1 billion invest in a global battery production network
€10 billion invest into e-mobility fleet
€20 billion supplier contracts to ensure battery cell supply
Implementation of charging infrastructure in Europe via joint
venture “IONITY”
Daimler AG
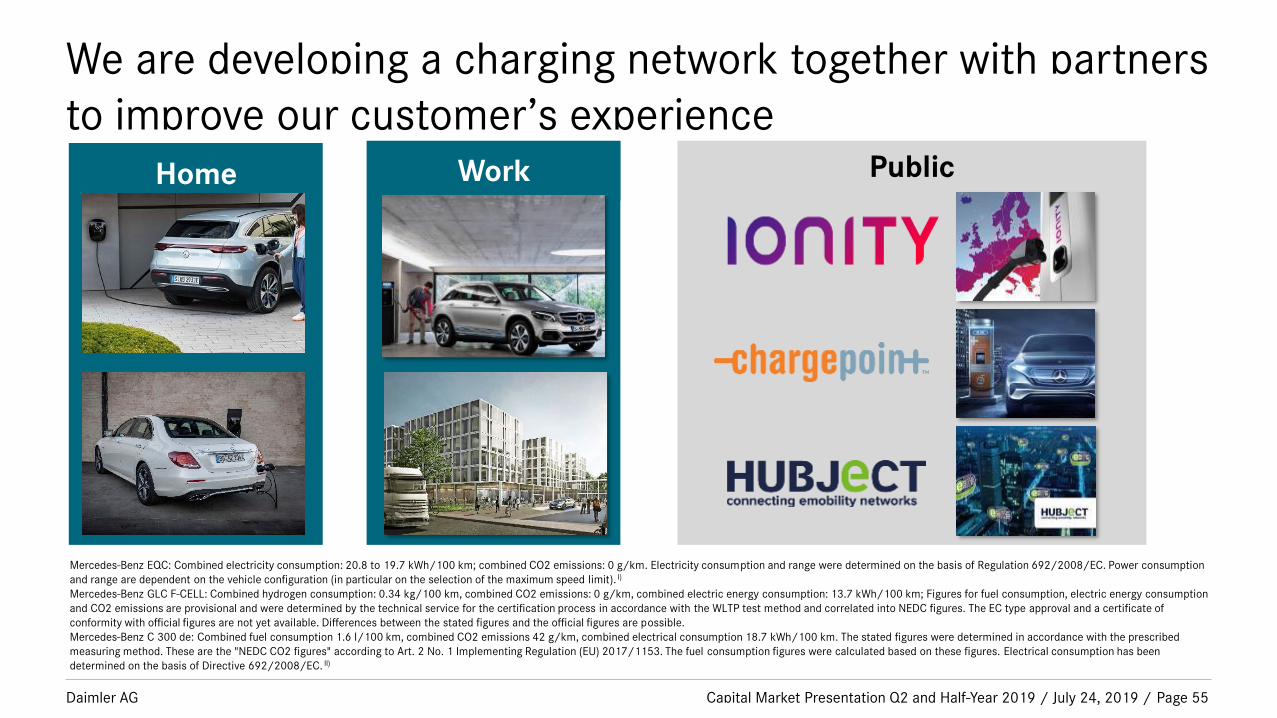
We are developing a charging network together with partners to improve our customer’s experience
Capital Market Presentation Q2 and Half-Year 2019 / July 24, 2019 / Page 55
WorkHome
Mercedes-Benz EQC: Combined electricity consumption: 20.8 to 19.7 kWh/100 km; combined CO2 emissions: 0 g/km. Electricity consumption and range were determined on the basis of Regulation 692/2008/EC. Power consumption
and range are dependent on the vehicle configuration (in particular on the selection of the maximum speed limit). I)
Mercedes-Benz GLC F-CELL: Combined hydrogen consumption: 0.34 kg/100 km, combined CO2 emissions: 0 g/km, combined electric energy consumption: 13.7 kWh/100 km; Figures for fuel consumption, electric energy consumption
and CO2 emissions are provisional and were determined by the technical service for the certification process in accordance with the WLTP test method and correlated into NEDC figures. The EC type approval and a certificate of
conformity with official figures are not yet available. Differences between the stated figures and the official figures are possible.
Mercedes-Benz C 300 de: Combined fuel consumption 1.6 l/100 km, combined CO2 emissions 42 g/km, combined electrical consumption 18.7 kWh/100 km. The stated figures were determined in accordance with the prescribed
measuring method. These are the "NEDC CO2 figures" according to Art. 2 No. 1 Implementing Regulation (EU) 2017/1153. The fuel consumption figures were calculated based on these figures. Electrical consumption has been
determined on the basis of Directive 692/2008/EC. II)
Public

Daimler AG
Daimler Trucks: Leader in the world of truck and bus market
Capital Market Presentation Q2 and Half-Year 2019 / July 24, 2019 / Page 56
AutomatedConnected
CORE Electric

Daimler AG
Daimler Trucks mission is to make customers more successful
Capital Market Presentation Q2 and Half-Year 2019 / July 24, 2019 / Page 57
Daimler AG
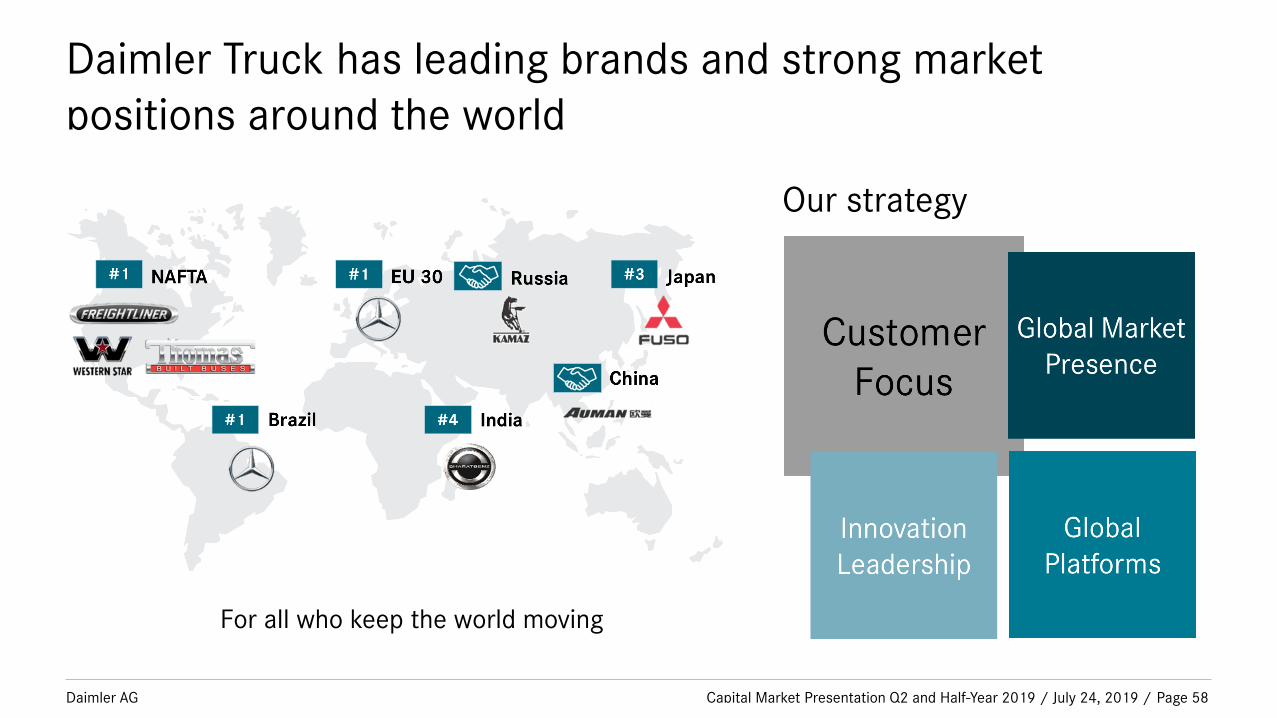
Daimler Truck has leading brands and strong market positions around the world
Capital Market Presentation Q2 and Half-Year 2019 / July 24, 2019 / Page 58
For all who keep the world moving
Our strategy

Daimler AG
China: we are well prepared to tap into the biggest market
Capital Market Presentation Q2 and Half-Year 2019 / July 24, 2019 / Page 59
Daimler AG
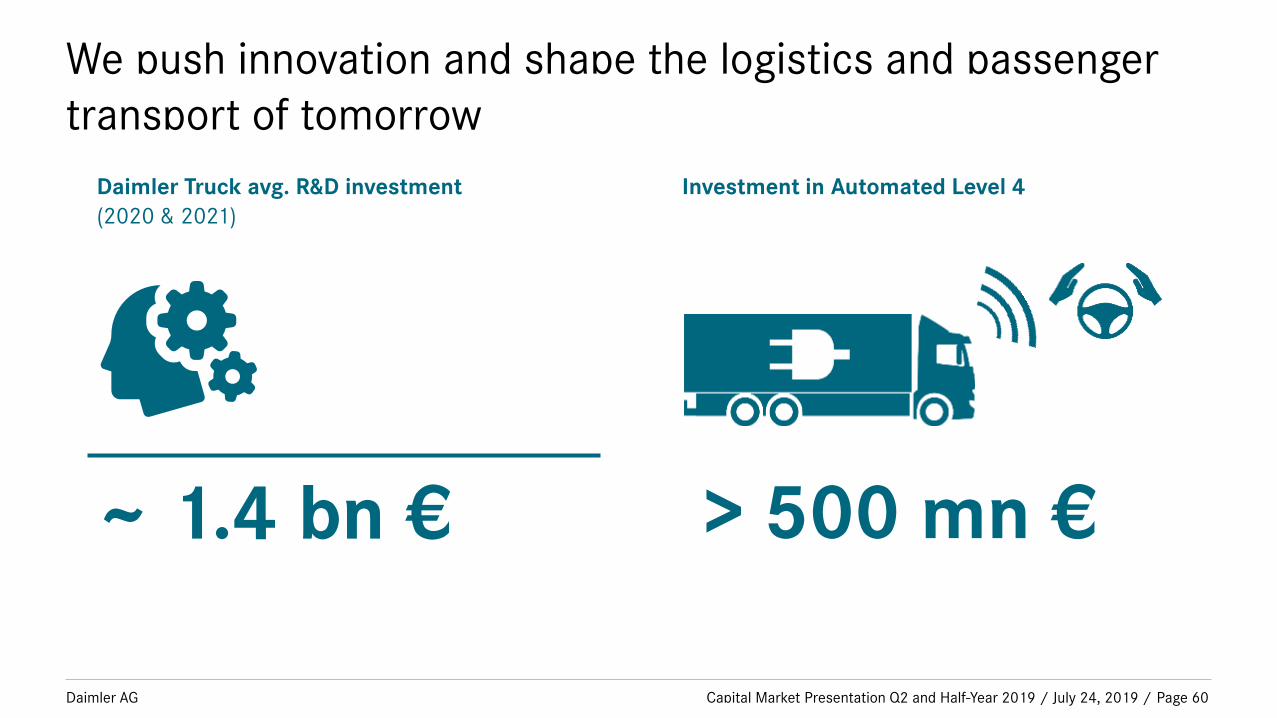
We push innovation and shape the logistics and passenger transport of tomorrow
Capital Market Presentation Q2 and Half-Year 2019 / July 24, 2019 / Page 60
~ 1.4 bn € > 500 mn €
Daimler Truck avg. R&D investment
(2020 & 2021)
Investment in Automated Level 4
Daimler AG
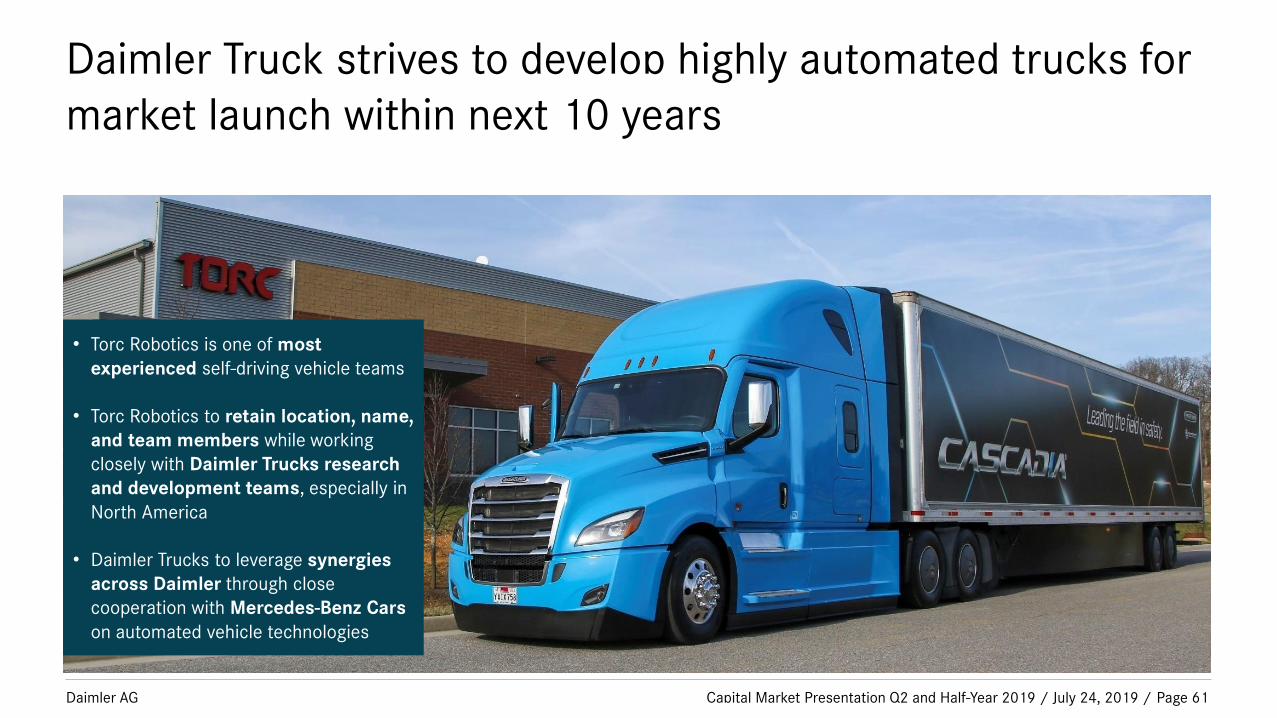
Daimler Truck strives to develop highly automated trucks for market launch within next 10 years
Capital Market Presentation Q2 and Half-Year 2019 / July 24, 2019 / Page 61
• Torc Robotics is one of most
experienced self-driving vehicle teams
• Torc Robotics to retain location, name,
and team members while working
closely with Daimler Trucks research
and development teams, especially in
North America
• Daimler Trucks to leverage synergies
across Daimler through close
cooperation with Mercedes-Benz Cars
on automated vehicle technologies
Daimler AG
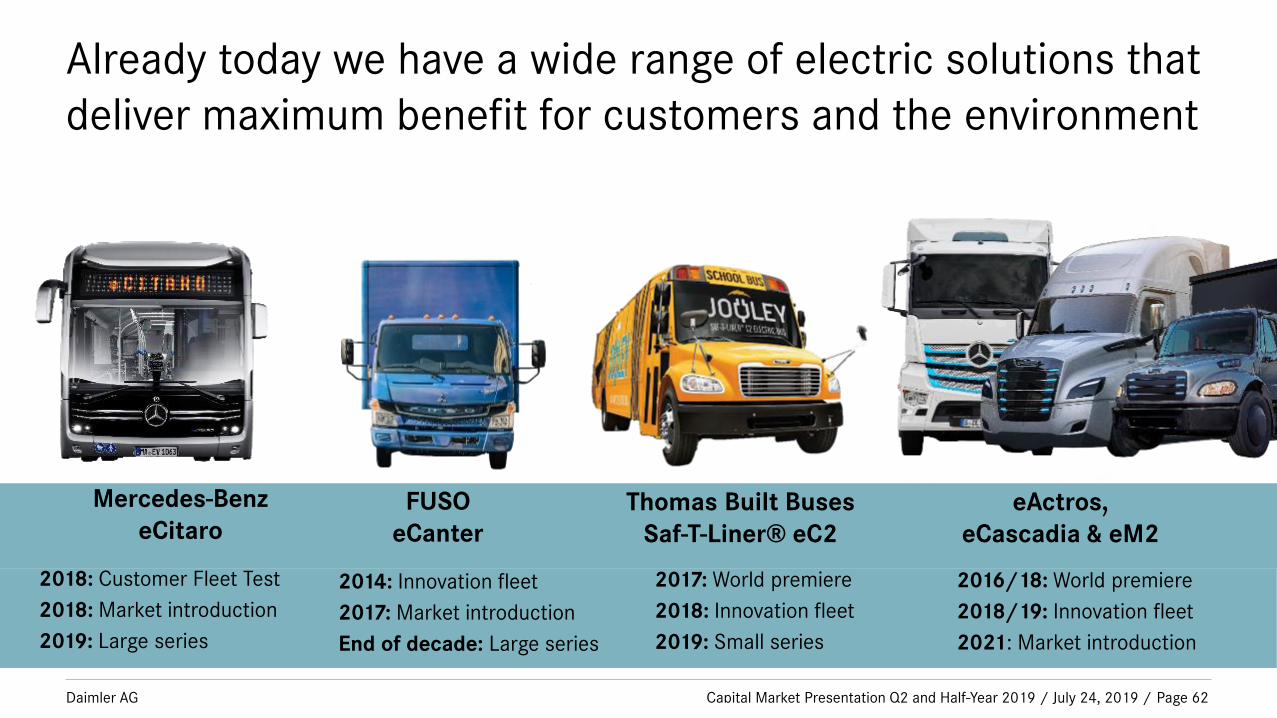
Already today we have a wide range of electric solutions that deliver maximum benefit for customers and the environment
Capital Market Presentation Q2 and Half-Year 2019 / July 24, 2019 / Page 62
Thomas Built Buses
Saf-T-Liner® eC2
2017: World premiere
2018: Innovation fleet
2019: Small series
FUSO
eCanter
2016/18: World premiere
2018/19: Innovation fleet
2021: Market introduction
eActros,
eCascadia & eM2
Mercedes-Benz
eCitaro
2014: Innovation fleet
2017: Market introduction
End of decade: Large series
2018: Customer Fleet Test
2018: Market introduction
2019: Large series

Daimler AG
Hundreds of thousands of trucks are online worldwide*
Capital Market Presentation Q2 and Half-Year 2019 / July 24, 2019 / Page 63
* Provided internet availability.
Mercedes-Benz
Uptime
Using one common
piece of hardware:
Truck Data Center
Enabling flash over the air,
starting with our
new Freightliner Cascadia
New Tech & Data Hub
in Lisbon
Daimler AG
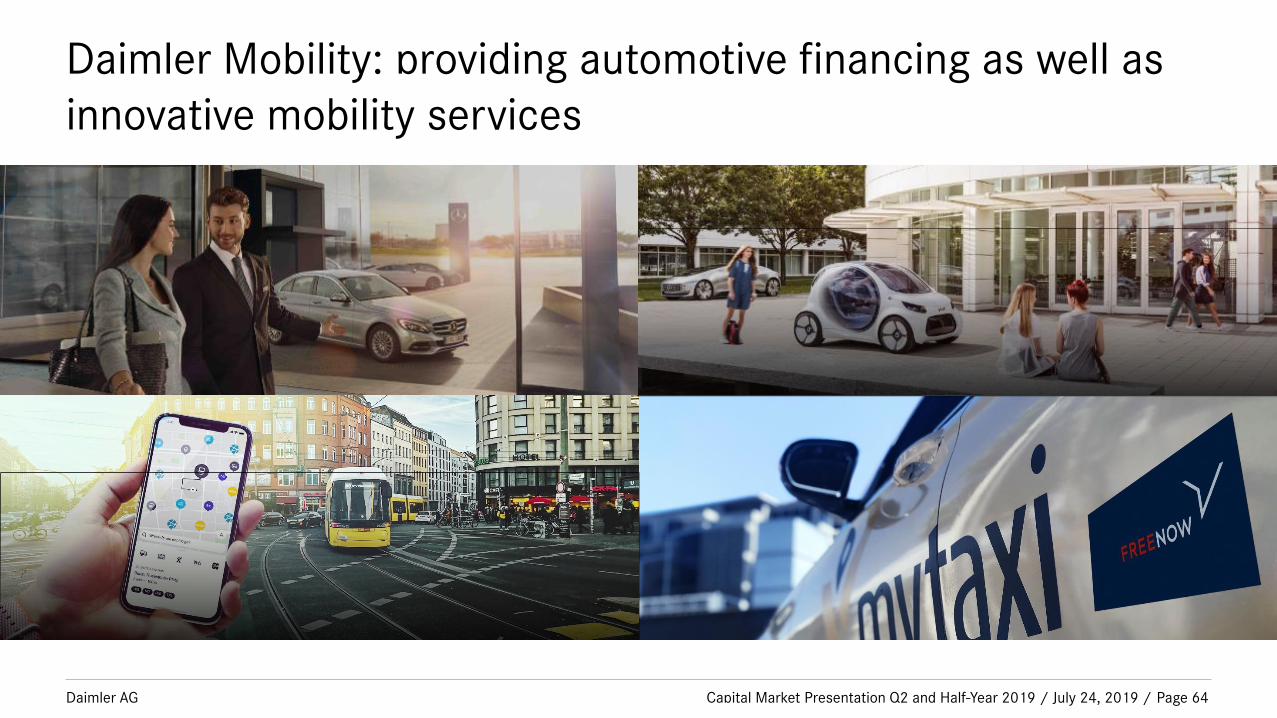
Daimler Mobility: providing automotive financing as well as innovative mobility services
Capital Market Presentation Q2 and Half-Year 2019 / July 24, 2019 / Page 64
Daimler AG
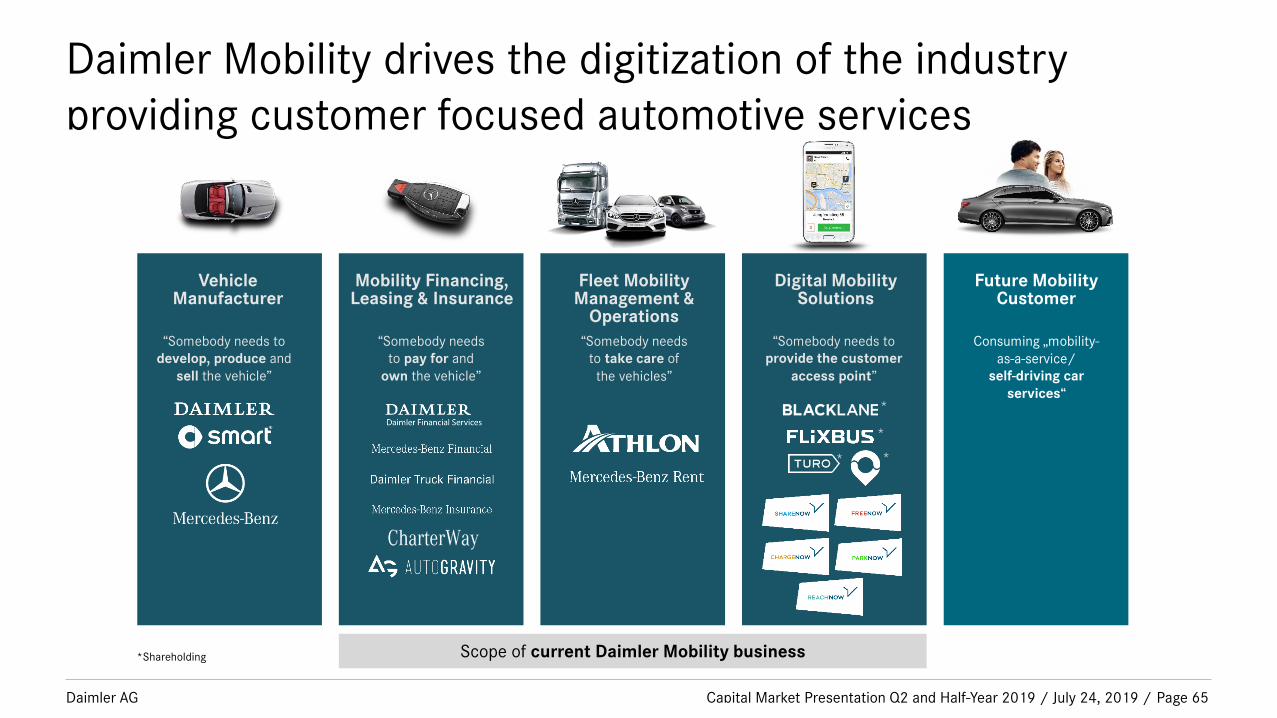
Daimler Mobility drives the digitization of the industry providing customer focused automotive services
Capital Market Presentation Q2 and Half-Year 2019 / July 24, 2019 / Page 65
Future Mobility Customer
“Somebody needs to
provide the customer
access point”
Digital Mobility Solutions
“Somebody needs
to take care of
the vehicles”
Fleet Mobility Management &
Operations
“Somebody needs
to pay for and
own the vehicle”
Mobility Financing, Leasing & Insurance
“Somebody needs to
develop, produce and
sell the vehicle”
Vehicle Manufacturer
Consuming „mobility-
as-a-service/
self-driving car
services“
Scope of current Daimler Mobility business*Shareholding

Daimler AG
With our growing core financial services business we generate brand retention and loyalty in over 40 countries
Capital Market Presentation Q2 and Half-Year 2019 / July 24, 2019 / Page 66
Portfolio(in bn €)
Acquisitions(in bn €)
11.7 % CAGR
6472
8084
99
117
133140
154
2934
38 4148
5862
71 72
201720162015201420132010 20122011 2018 1st HY2019
156
Mobility
Financing, Leasing &
Insurance
Fleet Mobility
Management &
Operations
Digital
Mobility
Solutions
5.4mnFinanced or
leased vehicles
5.1 mn
Insurance policies
2018: >40%Daimler shareof acquisitions
0.4 mnVehicles in fleet
management
3.4 bnGross merchandise
value run rate* YOUR NOW
joint ventures
* Gross merchandise value run rate based on figures of previous month
Daimler AG
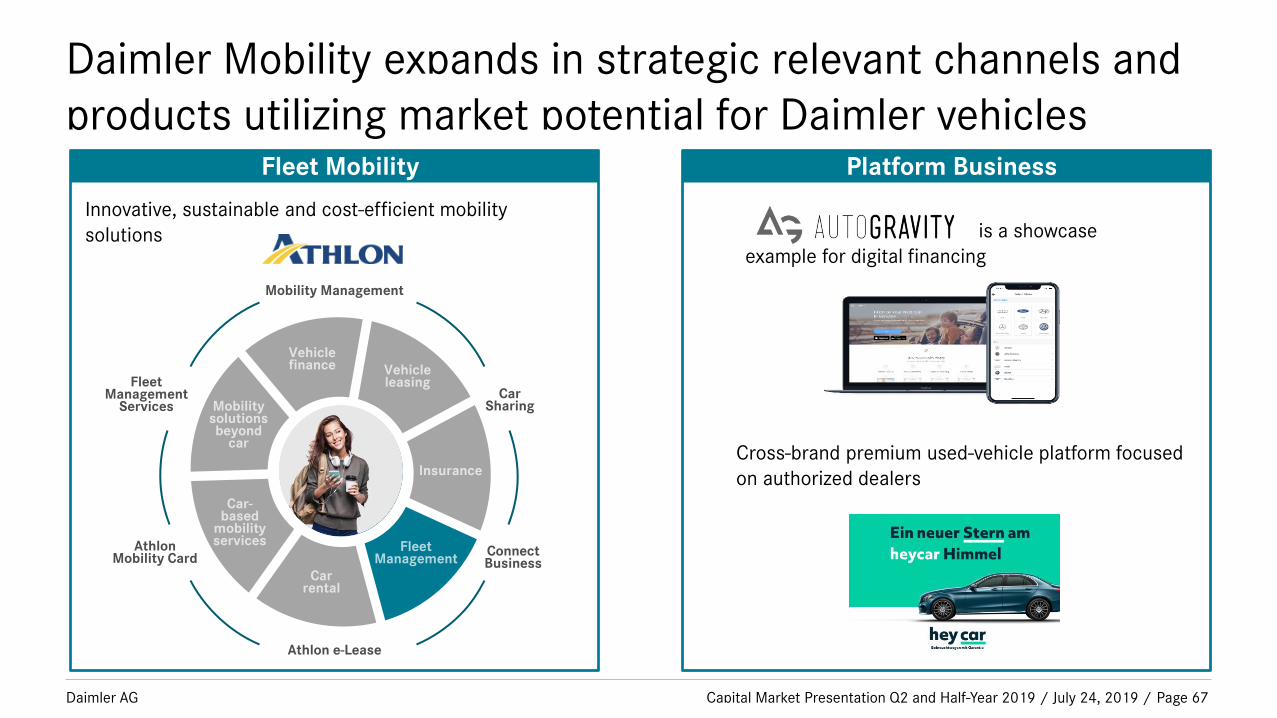
Daimler Mobility expands in strategic relevant channels and products utilizing market potential for Daimler vehicles
Capital Market Presentation Q2 and Half-Year 2019 / July 24, 2019 / Page 67
is a showcase
example for digital financing
Cross-brand premium used-vehicle platform focused
on authorized dealers
Fleet Mobility Platform Business
Innovative, sustainable and cost-efficient mobility
solutions

Daimler AG
Disclaimer
Capital Market Presentation Q2 and Half-Year 2019 / July 24, 2019 / Page 68
This document contains forward-looking statements that reflect our current views about future events. The words “anticipate,” “assume,” “believe,” “estimate,”
“expect,” “intend,” “may,” ”can,” “could,” “plan,” “project,” “should” and similar expressions are used to identify forward-looking statements. These statements are
subject to many risks and uncertainties, including an adverse development of global economic conditions, in particular a decline of demand in our most important
markets; a deterioration of our refinancing possibilities on the credit and financial markets; events of force majeure including natural disasters, acts of terrorism,
political unrest, armed conflicts, industrial accidents and their effects on our sales, purchasing, production or financial services activities; changes in currency
exchange rates and tariff regulations; a shift in consumer preferences towards smaller, lower-margin vehicles; a possible lack of acceptance of our products or
services which limits our ability to achieve prices and adequately utilize our production capacities; price increases for fuel or raw materials; disruption of production
due to shortages of materials, labor strikes or supplier insolvencies; a decline in resale prices of used vehicles; the effective implementation of cost-reduction and
efficiency-optimization measures; the business outlook for companies in which we hold a significant equity interest; the successful implementation of strategic
cooperations and joint ventures; changes in laws, regulations and government policies, particularly those relating to vehicle emissions, fuel economy and safety; the
resolution of pending government investigations or of investigations requested by governments and the conclusion of pending or threatened future legal
proceedings; and other risks and uncertainties, some of which we describe under the heading “Risk and Opportunity Report” in the current Annual Report. If any of
these risks and uncertainties materializes or if the assumptions underlying any of our forward-looking statements prove to be incorrect, the actual results may be
materially different from those we express or imply by such statements. We do not intend or assume any obligation to update these forward-looking statements
since they are based solely on the circumstances at the date of publication.
Directed at German costumers:
Weitere Informationen zum offiziellen Kraftstoffverbrauch und den offiziellen spezifischen CO2-Emissionen neuer Personenkraftwagen können dem „Leitfaden über den Kraftstoffverbrauch und die CO₂-Emissionen neuer Personenkraftwagen“ entnommen werden, der an allen Verkaufsstellen und bei der Deutschen Automobil Treuhand GmbH unter www.dat.de unentgeltlich erhältlich ist.
I) Stromverbrauch und Reichweite wurden auf der Grundlage der VO 692/2008/EG ermittelt. Stromverbrauch und Reichweite sind abhängig von der Fahrzeugkonfiguration[, insb. von der Auswahl der Höchstgeschwindigkeitsbegrenzung].
II) Die angegebenen Werte sind die ermittelten „NEFZ-CO2-Werte“ i.S.v. Art. 2 Nr. 1 Durchführungsverordnung (EU) 2017/1153. Die Kraftstoffverbrauchswerte wurden auf Basis dieser Werte errechnet. Der Stromverbrauch wurde auf der Grundlage der VO 692/2008/EG ermittelt. Als Bemessungsgrundlage für die Kraftfahrzeugsteuer kann ein höherer Wert maßgeblich sein. [Die Reichweite wurde auf der Grundlage der VO 692/2008/EG ermittelt. Als Bemessungsgrundlage nach dem EmoG ist ein anderer Wert maßgeblich.]