Daily monitoring is the first line of defense
49
Daily monitoring is the first line of defense Audun Faaberg Den Norske Bank, Norway [email protected] Arne Nilsen Posten, Norway [email protected] Carsten Rasmussen SMT Data, Denmark [email protected] November 3 rd 2020 Session 3AA
Transcript of Daily monitoring is the first line of defense

Daily monitoring is the first line of defenseAudun Faaberg Den Norske Bank, Norway [email protected]
Arne Nilsen Posten, Norway [email protected]
Carsten Rasmussen SMT Data, Denmark [email protected]
November 3rd 2020
Session 3AA


Your Favorite Measurement Unit ?
Think of Million of Instructions Per Second(MIPS) as driving speed
measured as kilometer per hour.
MIPS is a calculateted value depending on amount of used CPU seconds
per hour and processor speed.
Think of CPU seconds as the total distance from start to end measured
in kilometer too.
CPU seconds is a value derived from IBM System Management Facility (SMF)records, there are no calculations made to CPU seconds.

DNBPerformance & Capacity Management
Hunting high and lowAudun Faaberg APO (Application & Platform Optimisation)03.11.2020

2 000 000 private customers
210 000 corporate customers
Market share Norway:
▪ Private: 25% loan30% deposits 28% mortgages
▪ Corporate: 22% loan 37% deposits
Around 9 500 employees, 8 100 of which are based in Norway.
• 48,5% women
• 51,5% men
Around 830 employees in the IT department.
Systems development and maintenance is outsourced to two providers.
%DNB – Den norske bank

Performance specialist
Audun Faaberg
Performance specialist DNB
Part of the exclusive 5 member group APO -
Application & Platform Optimisation.
Master of Science from the Norwegian Institute of Technology.
The last 20 years I have focused on performance problems in large, heterogeneous IT environments.

System landscapeLike many banks, we have a plethora of legacy systems over a score of partitions.
And – even if we know the general trend for each of them, in a problem situation we do not know which one is the problem.
DEV
Most
applications
DB2
CICS
IMS
TEST
Most
applications
DB2
CICS
IMS
A-TEST
Most
applications
DB2
CICS
IMS
PRDA
Integration
IIB
PRDE
BackOffice
CICS
DB2
PRDB
Core Syst
CICS
DB2
IMS
DL/1
PRD6
Integration
IIB
PRDC
BackOffice
CICS
DB2
PRD9
Core Syst
CICS
DB2
IMS
DL/1

Monitoring toolsHow does one efficiently monitor such a broad landscape?
For detailed analyses, I naturally turn to TMON, SDSF & especially Detector (DB2)
But these do not provide a starting point, and you miss the forest for the trees.

A day in lifeWoke up, got out of bed
Dragged a comb across my head…Paul McCartney
Well, that is the start. In the days of home office, the next thing I do, is to log into ITBI Business Intelligence.

Last week plus a day… business hours
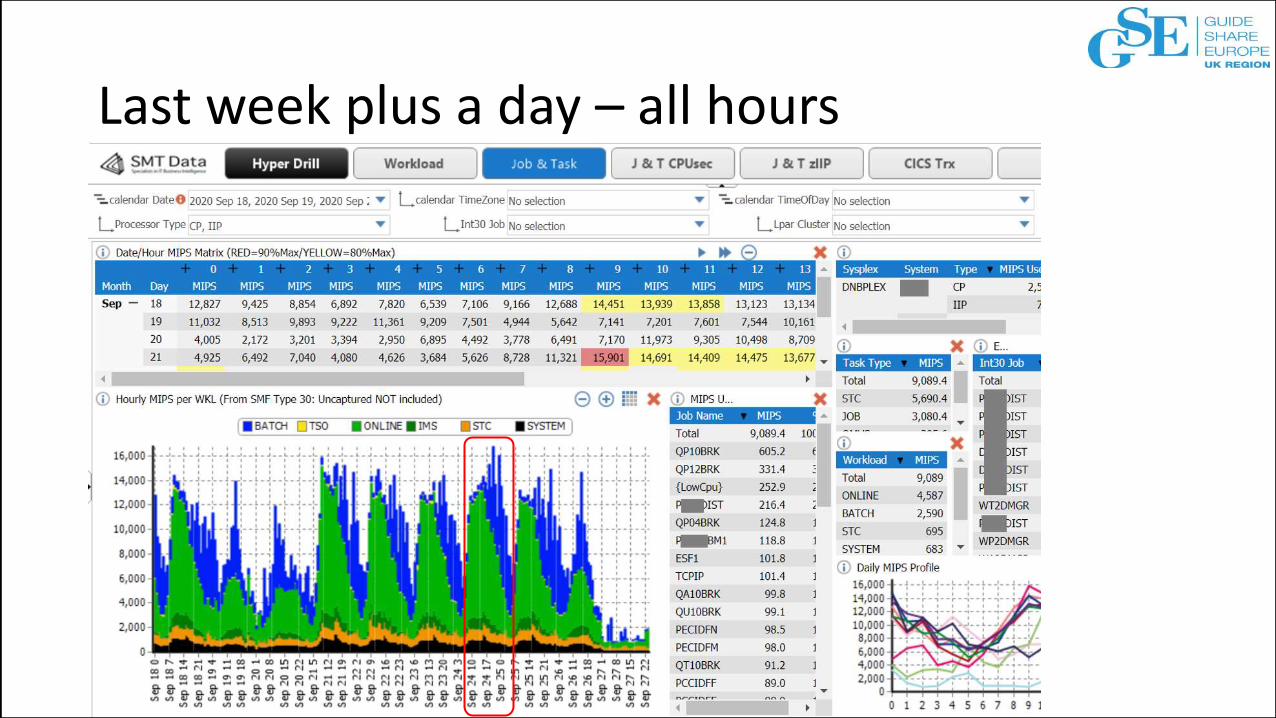
Last week plus a day – all hours

A closer look – last week

A closer look – last week peak
These I recognise as some batch jobs.So, let us look in Detector 24. Sept at the time interval 20-21.

A closer look – last week

Another case for ITBIWe see unusual peaks in MIPS our integration servers.
Then we send the requests around, and pursues one business unit especially.
Concludes that some data checks run twice.
All is fine functionally, and testing never saw this increase (tested on fairly low volumes).
Errors like this you only find in the ITBI dialog.

The big pictureReport – increasing MIPS, though not a corresponding increase in business traffic.
About 50% MIPS increase in less than 2 years, our group is kindly asked if we could focus some of our attention on this phenomena.
PartitionsPRODand TEST

The big picture – where to put in an effortTotal: 17 063 MIPS (CP + ziip)
∑QPxxBRK = 5465 MIPS
= 32%
Average working days 08-16. 1. December – 23. January, including Xmas low season
Job Name MIPS %
Total 17 063,6 100,0
QP10BRK 2 105,7 12,3
QP12BRK 1 060,2 6,2
PNNNDIST 983,1 5,5
QA10BRK 685,3 4,0
QT10BRK 519,5 3,0
QA12BRK 437,0 2,6
PECIDFN 279,3 1,6
PECIDFM 277,8 1,6
{LowCpu} 257,0 1,5
PCCIDFF 191,0 1,1
PCCIDFE 189,0 1,1
TCPIP 178,9 1,0
QU10BRK 172,2 1,0
QP04BRK 167,7 1,0
Job Name MIPS %
Total 17 063,6 100,0
QP10BRK 2 105,7 12,3
QP12BRK 1 060,2 6,2
QA10BRK 685,3 4,0
QT10BRK 519,5 3,0
QA12BRK 437,0 2,6
QU10BRK 172,2 1,0
QP04BRK 167,7 1,0
QP03BRK 131,4 1,0
QA04BRK 49,4 0,4
QA03BRK 41,3 0,3
QT04BRK 37,0 0,3
QU04BRK 17,0 0,1
QP10BRK2 15,0 0,1
QP10BRK3 14,0 0,1
QP10BRK6 8,0 0,0
QP10BRK1 4,0 0,0
Exported to Excell
Filtered in Excell

Monitoring the progress
We did several changes, and could monitor as each of them went into production.
That is important, in order to maintain the willingness from management to invest in the changes.
0
1.000
2.000
3.000
4.000
5.000
6.000
7.000
Sep
Oct
No
v
De
c
2019
Done
- Optimization of high-volume Payment REST API
- Removal of Info logging from high-volume APIs
- Restart after long uptime period (June 2019)
- Global Cache (isolation and removal)
Pipeline
- Offloading of REST APIs to ShaSL and Z/OS
Connect
- Optimization of high-volume flows
Broker restart (18.11.19)
Disabled INFO logging
(v2.0)(22.10.19)
Peak due to IPL”
(17.10)PendingPayments 2.0
(03.10.19)
End of Month September
MIPS usage pattern
Message Broker for z/OS (IIB)

Result after one year of work
Slowly, we turn the MIPS consumption around – all the time with an increasing functional load.
There is no single fix, just a long list of changes, of varying types. Some examples:
▪ Remove double format conversion
▪ Remove 90% of info logging
▪ Restart brookers regularly
▪ Remove some broker traffic (unix to unix)
▪ Optimising a set of batch jobs (to avoid runs into online-time at peak days)
▪ Optimising 2-3 top SQLs
▪ Adjust partition sizes and priorities.

Result after one year of systematic effort
If we compare August 2019 to August 2020, we are about 25% down. This is total MIPS used by the bank! Of course, that gives quite an impact on the MIPS bill.

ROI with one year of systematic effort
The September numbers confirm the trend.
ITBI has been a key contributor to achieve these results.
Total MIPS usage - September 2019and 2020 comparison.Significant CPU savings resulted in lower IT cost.

Posten Who Are We ?Posten Norge AS is a Nordic postal and logistics group that develop and delivers integrated solutions in postal services, communication and logistics, with the Nordic region as its home market.
We meet the market with two brands, Posten and Bring.

Arne Nilsen From Posten Norway
• Working as Application Analyst on LM system• LM = “Logistic Motor”
• Former Posten employee (27 years)
• Former EVRY employee (18 years)
• Back in Posten from 2014

Highlight Logistic Motor (1)• Support for production of parcels in the
Nordic Area • Posten Norge and Bring Companies• Sorting Centers (see map) • Handheld devices (14.000)• Delivery points (4.200)
• post offices, shops, parcel lockers
• Comprehensive integration solutions• both asynchronous and synchronous
• approx. 400 active integrations• internal systems like Invoicing, Accounting, Quality, DWH • TMS systems• Customs• Postal companies around the world• Customer
• Track and Trace• Parcels
• 115 million items• 850 million events
• Vendors• Application Operations
• TietoEVRY• Application Maintenance and Development
• TCS (Tata Consultancy Services in TATAgroup) – India

Highlight Logistic Motor (2)• IBM z13 machines• 4 environments
• DEV-SIT-UAT-PROD
• Programs• 200 SQL PL procedures • 100 COBOL procedures• 400 COBOL batch, socket and CICS program
• DB2• 700 tables/900 views• Both Q- and SQL-replication
• MQ• 300 queues
• CICS-environment• 9 instances
• Volume (peak)• 20.000 batch runs per day• 250 online lookups per second• 200 MQ messages received per second• 50 MQ messages sent per second• 5.000 files received per day (FTP)• 20.000 files distributed per day (FTP)

Pricing of Mainframe Usage• MIPS based
• 95 percentile (of all hours in a month)
Hourly pattern for both CP- and zIIP-MIPS

720 hours a month(24 hours*30 days)
Skip 5% peak hours, ie. 36 occurencies
Invoiced based on peak hourfor the remaining 95%
CP and zIIP MIPS calculatedindividually
Invoicing Based on «95 Percentile» MIPS Billing

How We Work With ITBI
• Internal Follow-up’s with focus on changes (read: increase in MIPS)• Daily
• ITBI updated with last days SMF-data before 08:00 each day
• After deployments (using Change Detector)• main deployments every second week
• Historical
• Identify candicates for improvement and tuning
• Monthly technical healthcheck report• supported by SMT-data

Daily Monitoring (1) - DDF
Total workload DDF workload
DDF details
Consumption per hour

Daily Monitoring (2) – TSO Users

Monitoring with Change Detector (1)

Monitoring with Change Detector (2)

Historical Monitoring (1)

Historical Monitoring (2-1)
2019 2020
CP MIPS in production for all workload from Jan-19 – Febr-20.
Regression line for the period
shows an increase on approx
400 MIPS.
NB: Nov. and Dec. peaks represents Black Friday and XMAS trafic

Historical Monitoring (2-2)
All load except batch shows appr 50 MIPS increase
2019 2020 2019 2020
but Batch load shows 350 MIPS increase
The batch increase was essentially causedby 2 «groups of jobs»
1) 2 jobs was jobs with a REXX step2) 5 jobs executed only a IKJEFT01 – SUBMIT step

Historical Monitoring (2-3)
2019 20202018
CP MIPS in production for all workload.
I produced documentation using ITBI on excessive CPU usage for the batchjobs in order to convince our outsourcer that simple batchjobs that haven’t changed are using more and more CPU.
TietoEVRY took it to IBM and after sooooome time IBM came with software maintenance that solved the problem and brought the batchjobs back to the CPU consumption before the raise, for short back to normal CPU usage.
Regression line shows we are back on track.

Conclusion
Without the detailed IT Business Intelligence tool documentationwe wouldn’t be able to document the batchjob CPU usage change,
neither when the CPU usage went up nor when it went down.
Our claim for reimbursement of overpaid was substantiated with convincing ITBI documentation details.

CICS Data From Techical Analyses
presented in the following slides using …


Summary: With ITBI We Got in Control (1) 48
Before After

Summary: With ITBI We Got in Controll (2)Pa
rcel
sM
IPS

Management / Business Managers
IT Finance / Procurement
Application Development (OpsDev)
IT Operations
TransparencyFact based decision making
Control and reduce the
IT cost baseline
Baseline now
Baseline Excellence
~20%
€
Time
IT and Business alignment
BusinessIT
Daily Monitoring is the first line of defense

Please submit your session feedback!
• Do it online at http://conferences.gse.org.uk/2020/feedback/3AA
• This session is 3AA

GSE UK Conference 2020 Charity
• The GSE UK Region team hope that you find this presentation and others that follow useful and help to expand your knowledge of z Systems.
• Please consider showing your appreciation by kindly donating a small sum to our charity this year, NHS Charities Together. Follow the link below or scan the QR Code:
http://uk.virginmoneygiving.com/GuideShareEuropeUKRegion