Daily Equity Report
-
Upload
money-capitalheight-research-pvt-ltd -
Category
Documents
-
view
213 -
download
0
description
Transcript of Daily Equity Report

Daily Newsletter26/07/2011
Daily Newsletter-Equity
www.capitalheight.com
ww.capitalheight.com

www.capitalheight.com
capitalheight.wordpress.com
Phone- (0731)4295950
MARKET WRAP
Indian market ended up 0.8%; Nifty was up 46 pts & Sensex was up 149 pts.
RBI to announce credit policy tomorrow; expects to hike base rates by 25 bps.
European markets were flat with CAC worst and Dow future was down 85 pts.
Indian equity markets gained momentum in the last two hours of trade and closed with
significant gains. Nifty was up 46 pts to end at 5680 and Sensex was up 149 pts to
settle at 18871. Euro markets were flat today with FTSE down 11 pts at 5923,
DAX down 1 pts at 7325 and CAC down 8 pts at 3835. Dow future was down 85 pts.
MARKET PERFORMANCE
NIFTY GAINERS COMPANY NAME CURRENT PREV. CLOSE(RS) CHANG.(RS) CHAG.(%)
R COM 107.75 93.60 14.15 15.12
Bharti Airtel 432.65 411.15 21.50 5.23
M&M 748.30 724.35 23.95 3.31
Axis Bank 1337.25 1296.90 40.35 3.11
Sun Pharma 525.65 512.25 13.40 2.62
NIFTY LOSERS COMPANY NAME CURRENT PREV. CLOSE(RS) CANG.(RS) CHAG.(%)
Cipla 316.95 321.45 -4.50 -1.40
Sesa Goa 281.25 284.75 -3.50 -1.23
ITC 205.40 207.40 -2.00 -0.96
Power Grid 108.50 109.55 -1.05 -0.96
HUL 331.20 333.70 -2.50 -0.75

www.capitalheight.com
capitalheight.wordpress.com
Phone- (0731)4295950
SECTORIAL INDICES
INDEX P. CLOSE OPEN HIGH LOW LAST % CHANGE
S&P CNX NIFTY 5,633.95 5,633.80 5,700.55 5,616.70 5,680.30 0.82
CNX NIFTY JUNIOR
11,278.45 11,278.55 11,343.05 11,247.70 11,333.55 0.49
INDIA VIX 17.91 17.91 19.23 16.55 19.20 7.20
CNX 100 5,546.05 5,545.95 5,605.30 5,529.75 5,588.60 0.77
S&P CNX DEFTY 4,397.45 4,396.15 4,448.75 4,382.40 4,433.25 0.81
S&P CNX 500 4,544.30 4,544.20 4,589.55 4,534.85 4,577.75 0.74
CNX MIDCAP 8,153.90 8,153.50 8,221.20 8,149.95 8,214.90 0.75
NIFTY MIDCAP 50 2,484.05 2,483.95 2,501.45 2,480.80 2,495.95 0.48
BANK NIFTY 11,291.95 11,286.25 11,433.10 11,233.35 11,391.80 0.88
CNX ENERGY 8,543.75 8,627.25 8,644.95 8,566.70 8,600.75 0.67
CNX FMCG 10,473.05 10,459.35 10,459.35 10,340.90 10,405.85 -0.64
CNX INFRA 3,119.55 3,112.25 3,191.00 3,112.25 3,180.90 1.97
CNX MNC 5,090.10 5,079.35 5,099.15 5,064.20 5,094.15 0.08
CNX PHARMA 4,850.00 4,843.35 4,914.15 4,823.50 4,905.45 1.14
CNX PSE 3,432.70 3,430.95 3,453.75 3,427.55 3,446.95 0.42
CNX PSU BANK 4,066.20 4,062.25 4,109.00 4,037.45 4,096.75 0.75
CNX REALTY 294.35 293.70 298.20 291.60 296.55 0.75
CNX SERVICE 6,892.95 6,881.55 6,977.15 6,870.20 6,954.95 0.90
CNX IT 6,438.50 6,426.30 6,451.75 6,381.25 6,434.45 -0.06

www.capitalheight.com
capitalheight.wordpress.com
Phone- (0731)4295950
NSE STATS
ADVANCES 39
DECLINES 11
UNCHANGED 0
INDEX MOVERS (PULLING IT UP)
COMPANY NAME CONTRIBUTION
Bharti Airtel 36.57
RIL 19.22
L&T 18.43
M&M 15.50
R COM 12.56
INDEX MOVERS (PULLING IT DOWN)
COMPANY NAME CONTRIBUTION
Bajaj Auto -0.91
Cipla -2.61
HUL -3.04
Infosys -11.43
ITC -13.53
CORPORATE ACTIONS (26-July-2011)
COMPANY NAME
Alstom Projects India JSW Steel Bharat Gears
Asian Paints Maruti Suzuki India Glenmark Pharmaceuticals
Bharat Heavy Electricals Opto Circuits India Shoppers Stop
Binani Industries SKS Microfinance Tata Investment Corporation
Cairn India Titan Industries Thomas Cook
Havells India Greaves Cotton United Phosphorus
www.capitalheight.com
capitalheight.wordpress.com
Phone- (0731)4295950
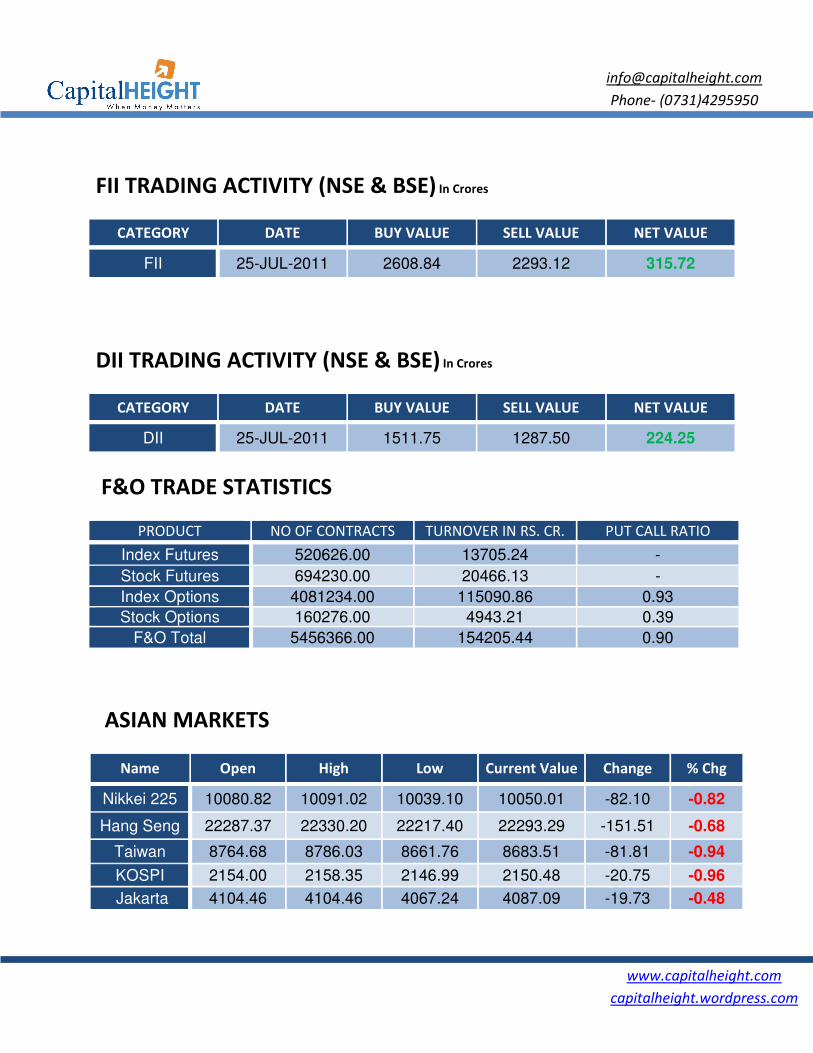
FII TRADING ACTIVITY (NSE & BSE) In Crores
CATEGORY DATE BUY VALUE SELL VALUE NET VALUE
FII 25-JUL-2011 2608.84 2293.12 315.72
DII TRADING ACTIVITY (NSE & BSE) In Crores
CATEGORY DATE BUY VALUE SELL VALUE NET VALUE
DII 25-JUL-2011 1511.75 1287.50 224.25
F&O TRADE STATISTICS
PRODUCT NO OF CONTRACTS TURNOVER IN RS. CR. PUT CALL RATIO
Index Futures 520626.00 13705.24 -
Stock Futures 694230.00 20466.13 -
Index Options 4081234.00 115090.86 0.93
Stock Options 160276.00 4943.21 0.39
F&O Total 5456366.00 154205.44 0.90
ASIAN MARKETS
Name Open High Low Current Value Change % Chg
Nikkei 225 10080.82 10091.02 10039.10 10050.01 -82.10 -0.82
Hang Seng 22287.37 22330.20 22217.40 22293.29 -151.51 -0.68
Taiwan 8764.68 8786.03 8661.76 8683.51 -81.81 -0.94
KOSPI 2154.00 2158.35 2146.99 2150.48 -20.75 -0.96
Jakarta 4104.46 4104.46 4067.24 4087.09 -19.73 -0.48

TECHNICAL
DAILY PIVOT
SCRIPT R4 R3
NIFTY 5917 5833
OUTLOOK
Trend: - Consolidate
Resistance: - 5740
Support: - 5640, 5
Strategy: - Sell on
ECHNICAL VIEW
NIFTY
R2 R1 P S1 S2
5749 5715 5665 5631 5581
Consolidate
0, 5800
, 5590
Sell on high
NIFTY DAILY
www.capitalheight.com
capitalheight.wordpress.com
Phone- (0731)4295950
S2 S3 S4
5581 5497 5413
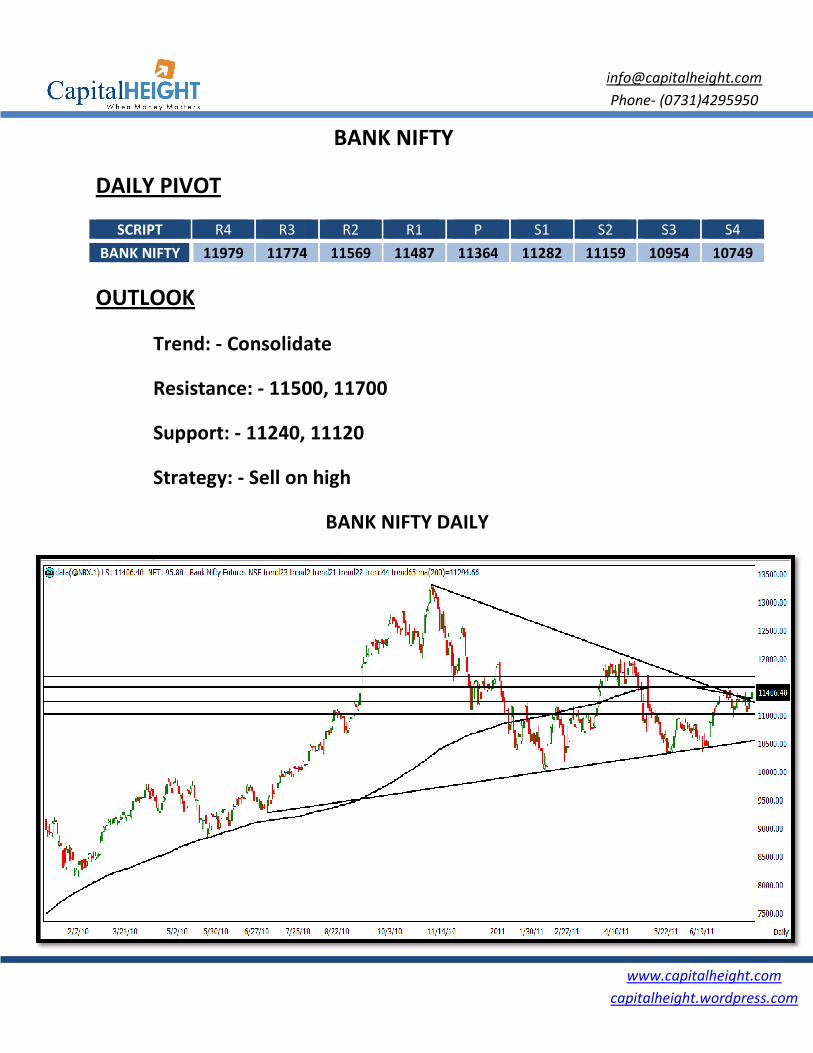
DAILY PIVOT
SCRIPT R4 R3
BANK NIFTY 11979 11774
OUTLOOK
Trend: - Consolidate
Resistance: - 1150
Support: - 11240,
Strategy: - Sell on
BANK NIFTY
R2 R1 P S1 S2
11774 11569 11487 11364 11282 11159
Consolidate
500, 11700
, 11120
Sell on high
BANK NIFTY DAILY
www.capitalheight.com
capitalheight.wordpress.com
Phone- (0731)4295950
S2 S3 S4
11159 10954 10749

Stock
CapitalHeight’s stock recommendation for
Gravita India has broken channel
witnessed higher volumes and
since April 2011, given its breakout
the level of 400 and then test all time high of 430
Our recommendation on Gravita India
tock Recommendation
stock recommendation for 26/07/2011 is
channel pattern ending 10.52% up at 386.25.
witnessed higher volumes and has broken the trend range of 332-384 which was traded
given its breakout we expect Gravita India to continue its uptrend
400 and then test all time high of 430 in the near term.
Gravita India is BUY above 389 for the TG 393
www.capitalheight.com
capitalheight.wordpress.com
Phone- (0731)4295950
ecommendation
is Gravita India.
. The stock has
384 which was traded
continue its uptrend to
393 and 398.

www.capitalheight.com
capitalheight.wordpress.com
Phone- (0731)4295950
Disclaimer
The information and views in this report, our website & all the service we provide are believed to be reliable, but we do not
accept any responsibility (or liability) for errors of fact or opinion. Users have the right to choose the product/s that suits
them the most.
Sincere efforts have been made to present the right investment perspective. The information contained herein is based on
analysis and up on sources that we consider reliable.
This material is for personal information and based upon it & takes no responsibility
The information given herein should be treated as only factor, while making investment decision. The report does not
provide individually tailor-made investment advice. Money CapitalHeight Research Pvt. Ltd. recommends that investors
independently evaluate particular investments and strategies, and encourages investors to
seek the advice of a financial adviser. Money CapitalHeight Research Pvt. Ltd. shall not be responsible for any transaction
conducted based on the information given in this report, which is in violation of rules and regulations of NSE and BSE.
The share price projections shown are not necessarily indicative of future price performance. The information herein,
together with all estimates and forecasts, can change without notice. Analyst or any person related to Money CapitalHeight
Research Pvt. Ltd. might be holding positions in the stocks recommended. It is understood that anyone who is browsing
through the site has done so at his free will and does not read any views expressed as a recommendation for which either
the site or its owners or anyone can be held responsible for . Any surfing and reading of the information is the acceptance
of this disclaimer.
All Rights Reserved.
Investment in Commodity and equity market has its own risks.
We, however, do not vouch for the accuracy or the completeness thereof. we are not responsible for any loss incurred
whatsoever for any financial profits or loss which may arise from the recommendations above. Money CapitalHeight
Research Pvt. Ltd. does not purport to be an invitation or an offer to buy or sell any financial instrument. Our Clients (Paid
Or Unpaid), Any third party or anyone else have no rights to forward or share our calls or SMS or Report or Any Information
Provided by us to/with anyone which is received directly or indirectly by them. If found so then Serious Legal Actions can be
taken.