DAILY CHART OF S&P 500 INDEX - Simpler Trading
15
THIS WEEK’S HIGHLIGHTS • Biden Lays Out Fiscal Support Plans • December Industrial Production Rises 1.6% • Retail Sales In December Fall More Than Expected • Weekly Jobless Claims Come In Well Above Estimates • January Consumer Sentiment Falls • Housing Starts and Existing Home Sales Next Week DAILY CHART OF S&P 500 INDEX The S&P 500 fell 1.5% for the week where it found support at its upward trending 21-day moving average. With the RSI and Stochastics in positive territory, the near-term uptrend for the markets remains in place. The Nasdaq also lost 1.5% with a pullback to its 10-day simple moving average. Both Indices were negatively impacted by sharp drops in each of the mega-cap FAANMG stocks with Internet Content stocks such as Facebook (FB) and Alphabet (GOOGL) getting hit the hardest amid banning Trump on their platforms. Despite the decline, there were clear cut pockets of strength last week as the bullish Bank, Energy and Semiconductor themes we’ve been promoting, continued to outperform. Each of these areas are cyclical, as historically they do well during periods of an economic recovery. Biotechnology and Small Cap stocks also far outpaced the markets in a positive signal that underscores investor’s appetite for riskier assets. This in turn, points to confidence in the markets and is bullish for a continuation rally. There were crosscurrents outside of these groups however, as weak consumer and employment data highlighted the negative impact of a record number of new Covid-19 cases taking place. support@thememgroup meminvestmentresearch.com JANUARY 18, 2021
Transcript of DAILY CHART OF S&P 500 INDEX - Simpler Trading
THIS WEEK’S HIGHLIGHTS
• Biden Lays Out Fiscal Support Plans• December Industrial Production Rises 1.6%• Retail Sales In December Fall More Than Expected
• Weekly Jobless Claims Come In Well Above Estimates• January Consumer Sentiment Falls• Housing Starts and Existing Home Sales Next Week
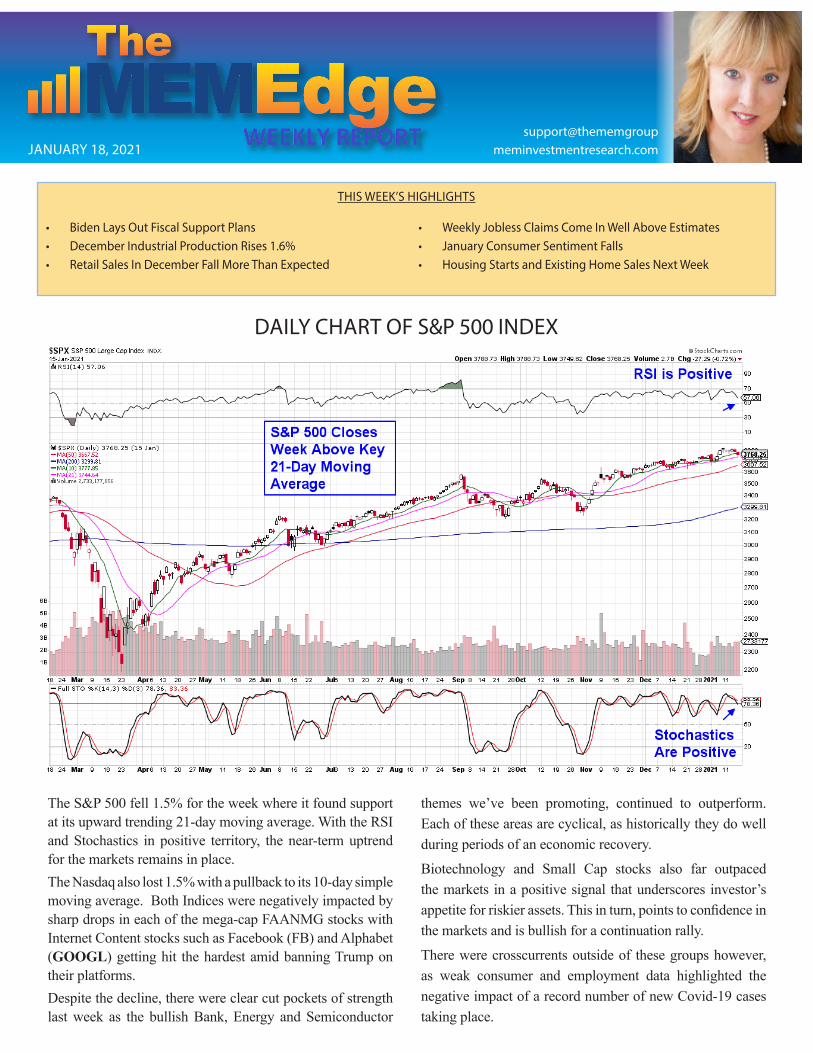
DAILY CHART OF S&P 500 INDEX
The S&P 500 fell 1.5% for the week where it found support at its upward trending 21-day moving average. With the RSI and Stochastics in positive territory, the near-term uptrend for the markets remains in place.The Nasdaq also lost 1.5% with a pullback to its 10-day simple moving average. Both Indices were negatively impacted by sharp drops in each of the mega-cap FAANMG stocks with Internet Content stocks such as Facebook (FB) and Alphabet (GOOGL) getting hit the hardest amid banning Trump on their platforms.Despite the decline, there were clear cut pockets of strength last week as the bullish Bank, Energy and Semiconductor
themes we’ve been promoting, continued to outperform. Each of these areas are cyclical, as historically they do well during periods of an economic recovery.
Biotechnology and Small Cap stocks also far outpaced the markets in a positive signal that underscores investor’s appetite for riskier assets. This in turn, points to confidence in the markets and is bullish for a continuation rally.
There were crosscurrents outside of these groups however, as weak consumer and employment data highlighted the negative impact of a record number of new Covid-19 cases taking place.
[email protected] 18, 2021
In addition, Biden’s anticipated support plan was expected to boost the markets on Friday however, many of the proposed measures were met with a mixed response as the potential impact on taxation and interest rates is unclear.Uncertainties surrounding Biden’s stimulus plan as well as
upcoming earnings.In the end, last week’s pullback pushed the S&P 500 down from a potentially overbought position for the RSI which is a near-term positive. Next week, earnings season will pick up.
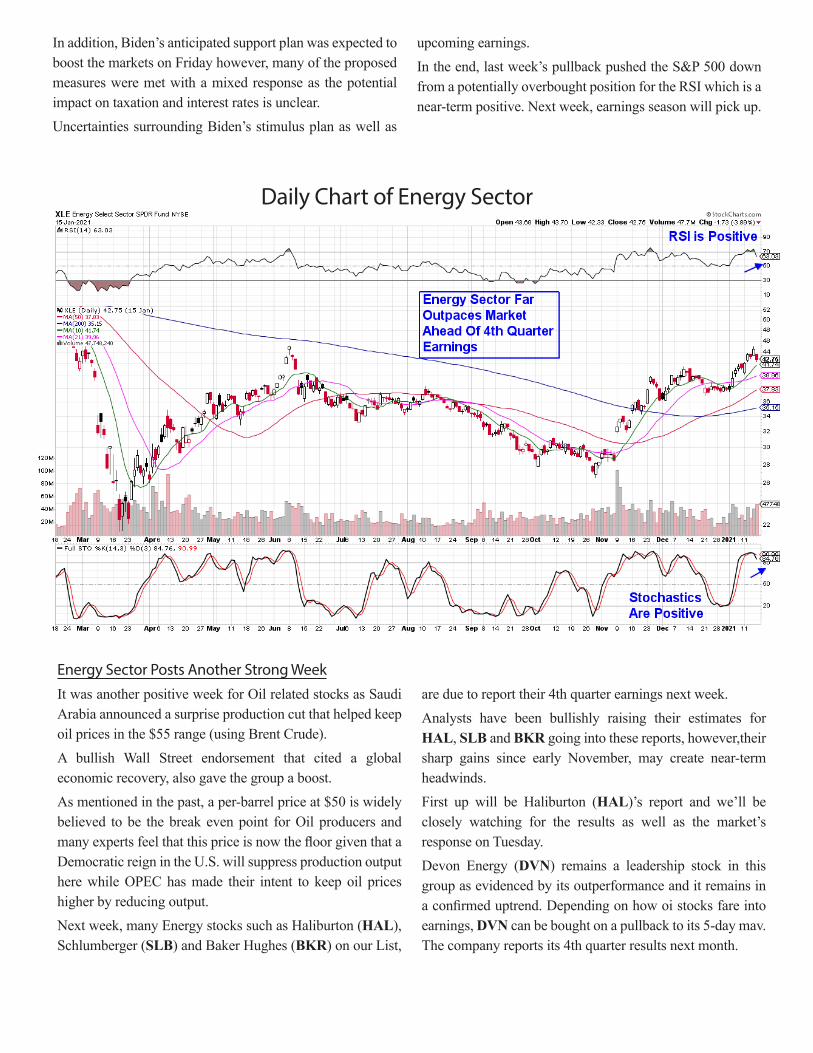
Daily Chart of Energy Sector
Energy Sector Posts Another Strong WeekIt was another positive week for Oil related stocks as Saudi Arabia announced a surprise production cut that helped keep oil prices in the $55 range (using Brent Crude).A bullish Wall Street endorsement that cited a global economic recovery, also gave the group a boost.As mentioned in the past, a per-barrel price at $50 is widely believed to be the break even point for Oil producers and many experts feel that this price is now the floor given that a Democratic reign in the U.S. will suppress production output here while OPEC has made their intent to keep oil prices higher by reducing output.Next week, many Energy stocks such as Haliburton (HAL), Schlumberger (SLB) and Baker Hughes (BKR) on our List,
are due to report their 4th quarter earnings next week. Analysts have been bullishly raising their estimates for HAL, SLB and BKR going into these reports, however,their sharp gains since early November, may create near-term headwinds. First up will be Haliburton (HAL)’s report and we’ll be closely watching for the results as well as the market’s response on Tuesday.Devon Energy (DVN) remains a leadership stock in this group as evidenced by its outperformance and it remains in a confirmed uptrend. Depending on how oi stocks fare into earnings, DVN can be bought on a pullback to its 5-day mav. The company reports its 4th quarter results next month.

Daily Chart of Financial Sector
Financial Stocks Gain As Markets LagBank stocks added to last week’s sharp gain as stimulus plans and the vaccine rollout helped push loan default fears away.Banks stocks are also being boosted by a steepening yield curve as short term rates are dropping while the yield on the 10 and 20-year Treasuries has increased by 13% over the past 2 weeks.Banks lend at the higher, longer-term rate while borrowing at the lower, shorter-term rate, which positively impacts their profitability.Bank stocks began reporting their earnings results last week and so far, they’ve pulled back sharply if results were poor (Wells Fargo and Citigroup) or dropped modestly despite strong results (JPM)Next week, each of the Bank stocks on our List are due to report results beginning with Comerica (CMA) on Tuesday. Of note is that Fifth Third (FITB), Comerica (CMA), Regions Financial (RF) and SVB (SIVB) have rallied an average of 17% this month which puts them in a position of being “priced for perfection” and susceptible to a pullback. Should we see a pullback amid positive results we’d be a buyer ,as longer term we’re bullish on this group.
Artisan Partners (APAM) pulled back from a Thursday base breakout and is now in a strong buy zone after closing the week back above its 10-day moving average. This 5.3% yielder continues to see its earnings estimates revised higher going into their 4th quarter report later this month.Payment Processing stocks had a tough week with names such as Visa (V) falling 6% despite several Wall Street upgrades ahead of the release of their earnings later this month. While we anticipate a recovery in V, its break below its 50-day moving average on volume points to further near-term downside.Square (SQ) had a similarly sharp decline last week, however since its drop was from a recent high its 50-day moving average was not compromised. We’re on the lookout for a downtrend reversal of SQ’s MACD on a daily chart which would be bullish for the stock.Paypal (PYPL) is in a strong buy zone after pulling back to its 10-day moving average following a midweek base breakout. PYPL was upgraded last week with a price target now at $350. The company is expected to gain $2 Billion in revenues over the next 2 years from its cryptocurrency app alone.

Daily Chart of Healthcare Sector
Healthcare Stocks Outperform With Boosts From Biotech and Big PharmaThe Healthcare sector kept most of last week’s gains which pushed the sector out of a 2-month base.Covid-19 related stocks that provide supplies to administer the vaccine or medicine to treat the virus, continued their advance while select Pharmaceutical stocks rallied. As mentioned in last week’s report, the J.P. Morgan Healthcare conference created a stage for many of these companies to announce positive developments.Eli Lilly (LLY) is an example as the stock gapped up on news surrounding an encouraging update to their clinical trials for their Alzheimer’s disease drug. Johnson & Johnson (JNJ) also reported positive news surrounding its one-dose Covid-19 vaccine which boosted its shares. Cutting edge medicines are receiving approval much faster as the government’s removal of red tape as well as technological advances are creating a supportive backdrop for new drug development.These same dynamics apply to Biotech companies as well where great strides are being made with Covid-19 as well as Cancer and other treatments. Last week, Biotech etf Ark Genomic Revolution (ARKG) hit another new high in price as it invests in leading Biotech stocks that are using Crispr and other genetic transformative technologies to develop new ways to combat disease.
ARKG is in a confirmed uptrend with a pullback to its 5-day moving average being an ideal buy point.Repligen (RGEN) announced they’ll be focused on supplying needed substances for the gene therapy industry at last week’s Healthcare conference. We’re adding the stock to our Suggested Holdings List after its base breakout on volume.Recently removed Exact Sciences (EXAS) also popped last week after pre-announcing strong sales ahead of their early February earnings release. The stock had a similar late September pop prior to their strong earnings results in October. We’re adding EXAS back to our List and would use last Fall’s action as possible precedence going into February.Becton Dickinson (BDX) gained 2% for the week after pre-announcing their quarterly results that are at the high end of estimates. The stock is in a strong buy zone following a late week pullback and BDX is due to report 3rd quarter earnings early next month.West Pharmaceutical (WST) is also in a strong buy zone after pulling back from a Monday base breakout as analysts raise earnings estimates. Both BDX and WST have seen demand for their products remain strong as they provide injection device products that have been instrumental in distributing the vaccine.
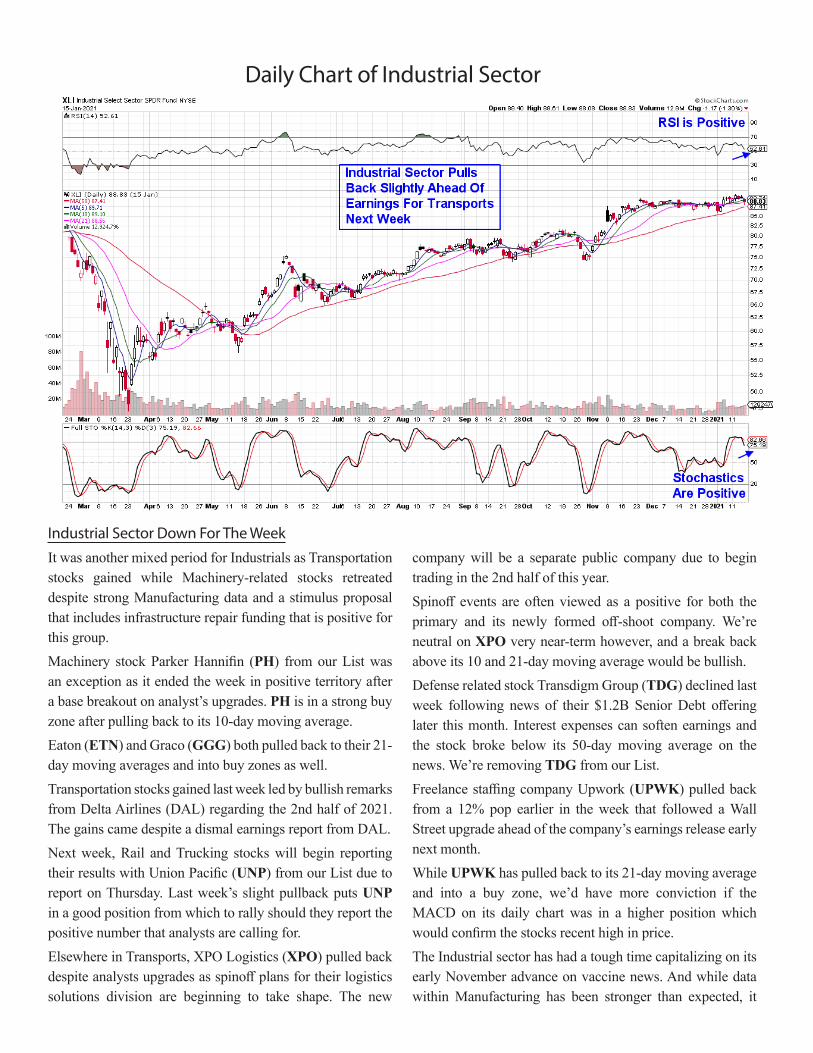
Daily Chart of Industrial Sector
Industrial Sector Down For The WeekIt was another mixed period for Industrials as Transportation stocks gained while Machinery-related stocks retreated despite strong Manufacturing data and a stimulus proposal that includes infrastructure repair funding that is positive for this group.Machinery stock Parker Hannifin (PH) from our List was an exception as it ended the week in positive territory after a base breakout on analyst’s upgrades. PH is in a strong buy zone after pulling back to its 10-day moving average.Eaton (ETN) and Graco (GGG) both pulled back to their 21-day moving averages and into buy zones as well. Transportation stocks gained last week led by bullish remarks from Delta Airlines (DAL) regarding the 2nd half of 2021. The gains came despite a dismal earnings report from DAL.Next week, Rail and Trucking stocks will begin reporting their results with Union Pacific (UNP) from our List due to report on Thursday. Last week’s slight pullback puts UNP in a good position from which to rally should they report the positive number that analysts are calling for.Elsewhere in Transports, XPO Logistics (XPO) pulled back despite analysts upgrades as spinoff plans for their logistics solutions division are beginning to take shape. The new
company will be a separate public company due to begin trading in the 2nd half of this year.Spinoff events are often viewed as a positive for both the primary and its newly formed off-shoot company. We’re neutral on XPO very near-term however, and a break back above its 10 and 21-day moving average would be bullish.Defense related stock Transdigm Group (TDG) declined last week following news of their $1.2B Senior Debt offering later this month. Interest expenses can soften earnings and the stock broke below its 50-day moving average on the news. We’re removing TDG from our List.Freelance staffing company Upwork (UPWK) pulled back from a 12% pop earlier in the week that followed a Wall Street upgrade ahead of the company’s earnings release early next month. While UPWK has pulled back to its 21-day moving average and into a buy zone, we’d have more conviction if the MACD on its daily chart was in a higher position which would confirm the stocks recent high in price.The Industrial sector has had a tough time capitalizing on its early November advance on vaccine news. And while data within Manufacturing has been stronger than expected, it

Daily Chart of Technology Sector
Technology Sector Among Worst PerformersThe Tech sector suffered last week as heavyweight stocks Apple (AAPL) and Microsoft (MSFT) fell an average of 3.5% for the week. Other areas also contributed to Tech’s underperformance with Software stocks declining 2% (using etf IGV).Not every Software stock fell however, with Twilio (TWLO) from our List hitting a new high following a base breakout and 8% gain. The move puts TWLO in a confirmed uptrend similar to late December where the stock can be bought at its 5-day simple moving average.While Intuit (INTU) pulled back slightly, it ended the week poised to bullishly break back above its 21-day moving average while Cadence Design (CDNS) continues to find support as it’s 21-day and remains in a tight trading range as it bullishly outperforms its group.While Crowdstrike (CRWD) and Cloudflare (NET) each had similar 1.8% pullbacks, CRWD is in a more positive
position on its daily chart with its RSI and MACD in positive territory. An upward crossover of the MACD for NET would have us bullish on its near-term prospects.Back office Software company Bill.com (BILL) from our List failed to reverse its downtrend and continued lower last week. The stock has a history of sharp advances followed by lengthy pullbacks that even include a break below its 50-day moving average. If you own BILL, we would stay with the stock with an eye toward a downtrend reversal following strong 4th quarter results in early February. This would put the stock in a position that’s similar to early November.Coupa (COUP) also pulled back despite a Wall Street upgrade that put a price target of $352 on the stock. COUP is another Software name that’s had short spurts to the upside followed by a pullback. We will be closely monitoring the MACD on its daily chart and would not be a buyer at this
appears that investors are struggling with just how damaging the pandemic has been, given supply-chain and other disruptions.We believe this Sector will get a boost as more clarity regarding growth prospects are provided with 4th quarter earnings and management’s guidance going forward.
Next week’s earnings reports from Transportation companies will help shed light on the current state of the economic recovery. Among other stocks in this sector, we have Federal Express (FDX) on our Watch List as the stock is poised to reverse a lengthy downtrend.
time.It’s been a tricky period for Software stocks over the past few weeks as the group’s post-election rally has stalled (using IGV). While we’ve highlighted stocks from our List as being in buy zones, we’re on the alert for volatility over the near-term as investor’s digest Biden’s fiscal plan and its impact on corporate America.Should there be a consensus that corporate taxes will be raised this year, Software stocks may suffer due to spend cutbacks among companies to offset higher taxes. Semiconductor stocks on the other hand, remain a leadership group after closing the week at another new high (using SOXX). Leading Chip stock Taiwan Semi (TSM) gained 6% for the week after reporting mixed results for their recent quarter but guided higher for the current quarter. According to management of TSM, the expected increase in global chip demand will likely power revenue growth for at least the next five years. TSM is in a confirmed uptrend and is in a strong buy zone.Other leading Semi companies are echoing this bullish sentiment as pandemic-related changes that require people to stay connected are expected to continue. New developments
with autonomous vehicles and mobile devices will also keep chip demand high.Applied Materials (AMAT), Lam research (LRCX) and Entegris (ENTG) averaged 8.5% gains that put each of these stocks at a new high in price. As highlighted in last week’s report, each of these companies assists in the manufacturing of DRAM (memory) chips which are in high demand. We also highlighted AMAT, LRCX and ENTG as being in strong buy zones and buyable on any pullback to their 5-day moving average. The same dynamic is in place this week. Qualcomm (QCOM) is also in a less dynamic, but strong uptrend. The company rallied on news of its acquisition of Nuva which designs cloud computing chips and is viewed as a positive addition to QCOM. The stock can be bought on a pullback to its 5-day moving average.While heavyweight stock Apple (AAPL) appears to be in a pullback phase similar to its pre-election October period, we fully expect a downtrend reversal and recovery rally as iPhone 12 sales data continues to be positive while the company reportedly has design upgrades to their Macbook Pro which will spur demand.Look for a break back above its shorter term moving average with bullish RSI and MACD characteristics as confirmation of a new uptrend for AAPL.
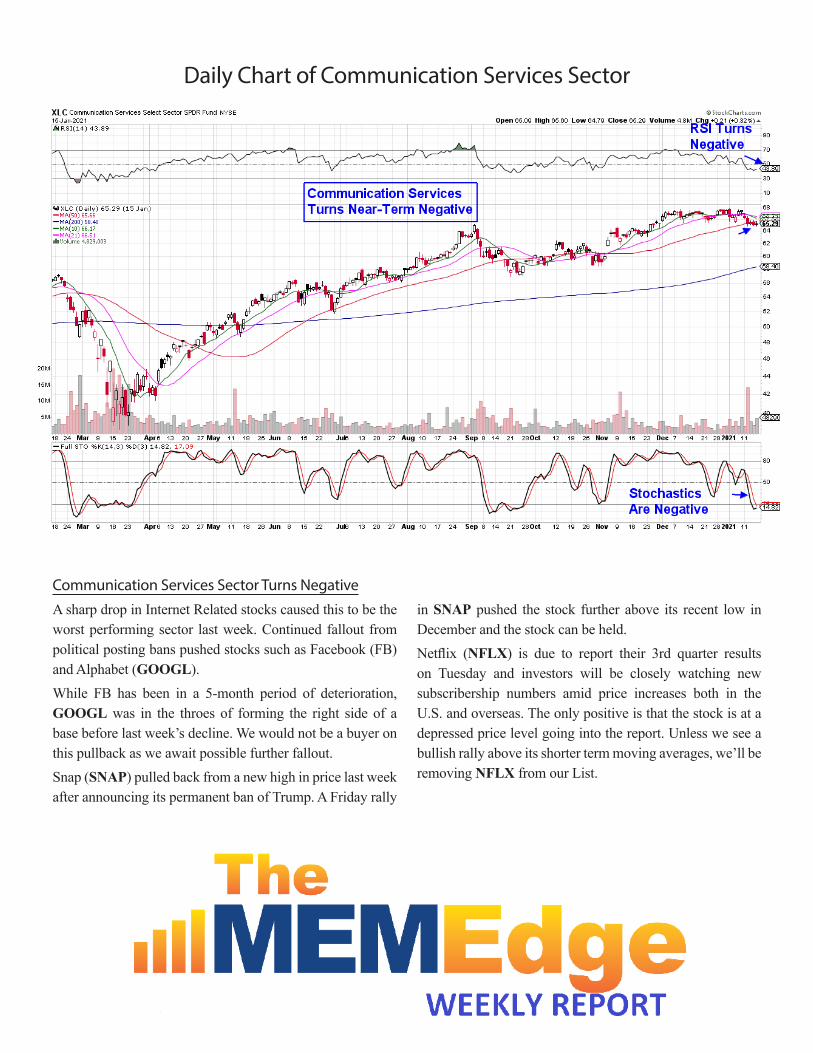
Daily Chart of Communication Services Sector
Communication Services Sector Turns NegativeA sharp drop in Internet Related stocks caused this to be the worst performing sector last week. Continued fallout from political posting bans pushed stocks such as Facebook (FB) and Alphabet (GOOGL).While FB has been in a 5-month period of deterioration, GOOGL was in the throes of forming the right side of a base before last week’s decline. We would not be a buyer on this pullback as we await possible further fallout.Snap (SNAP) pulled back from a new high in price last week after announcing its permanent ban of Trump. A Friday rally
in SNAP pushed the stock further above its recent low in December and the stock can be held.Netflix (NFLX) is due to report their 3rd quarter results on Tuesday and investors will be closely watching new subscribership numbers amid price increases both in the U.S. and overseas. The only positive is that the stock is at a depressed price level going into the report. Unless we see a bullish rally above its shorter term moving averages, we’ll be removing NFLX from our List.
Daily Chart of Consumer Discretionary Sector
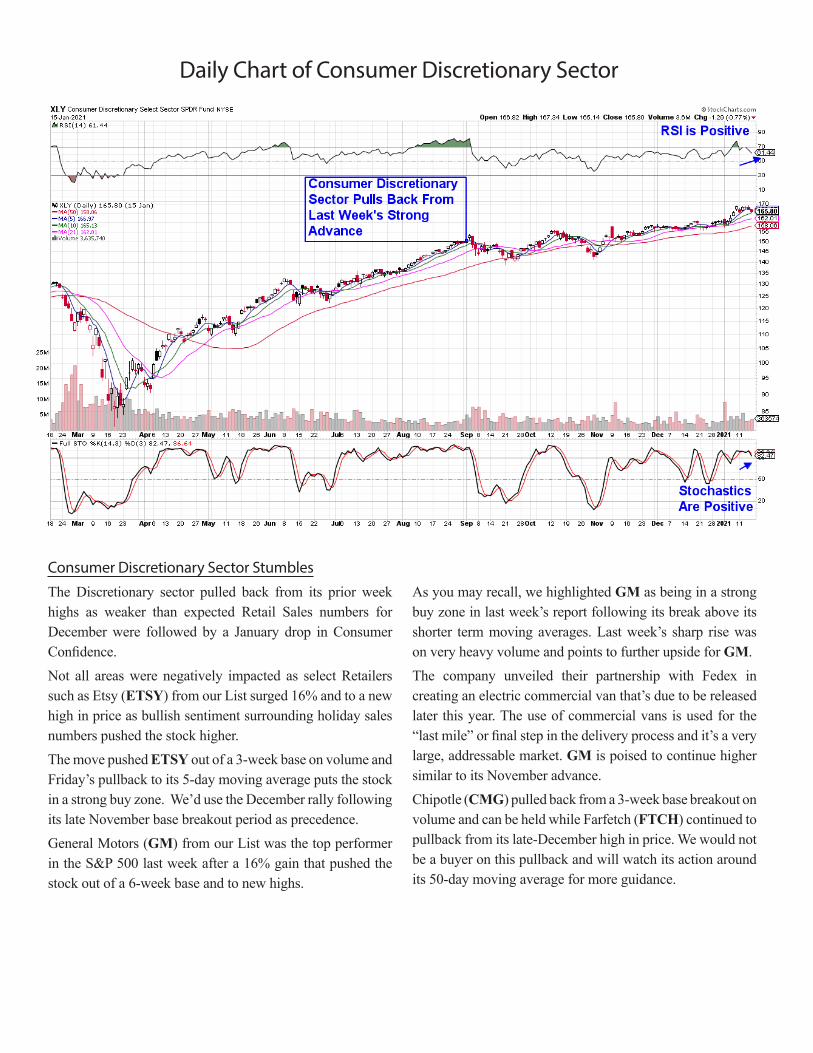
Consumer Discretionary Sector StumblesThe Discretionary sector pulled back from its prior week highs as weaker than expected Retail Sales numbers for December were followed by a January drop in Consumer Confidence.Not all areas were negatively impacted as select Retailers such as Etsy (ETSY) from our List surged 16% and to a new high in price as bullish sentiment surrounding holiday sales numbers pushed the stock higher. The move pushed ETSY out of a 3-week base on volume and Friday’s pullback to its 5-day moving average puts the stock in a strong buy zone. We’d use the December rally following its late November base breakout period as precedence.General Motors (GM) from our List was the top performer in the S&P 500 last week after a 16% gain that pushed the stock out of a 6-week base and to new highs.
As you may recall, we highlighted GM as being in a strong buy zone in last week’s report following its break above its shorter term moving averages. Last week’s sharp rise was on very heavy volume and points to further upside for GM. The company unveiled their partnership with Fedex in creating an electric commercial van that’s due to be released later this year. The use of commercial vans is used for the “last mile” or final step in the delivery process and it’s a very large, addressable market. GM is poised to continue higher similar to its November advance.Chipotle (CMG) pulled back from a 3-week base breakout on volume and can be held while Farfetch (FTCH) continued to pullback from its late-December high in price. We would not be a buyer on this pullback and will watch its action around its 50-day moving average for more guidance.
SUMMARY: While the S&P 500 remains in an uptrend, relative weakness in the Nasdaq over the past week is pointing to weakness among select Technology stocks as Biden’s stimulus plan is further reviewed. Many of these heavyweights would be most negatively impacted from an increase in corporate taxes.Also weighing on the markets is potential violence in DC on Wednesday’s inauguration day which would be unsettling.And lastly, we’re heading into the beginning of what’s anticipated to be an important earnings season.
Based on the few companies that have reported last week, management’s sentiment going forward is getting the most attention as Wells Fargo and Citigroup dropped on negative sentiment while Taiwan Semi rallied due to bullish comments regarding future growth. And while near-term uncertainty may cause a pickup in volatility and even a potential pullback, longer-term the markets have a tailwind in the form of fiscal stimulus and vaccine rollouts that will keep the slow but steady economic recovery in place.

BUY: REPLIGEN CORPORATION
SYMBOL COMPANY PRICE MARKET CAP INDUSTRY
RGEN Repligen Corporation $215.47 $11.66 Billion Medical Products
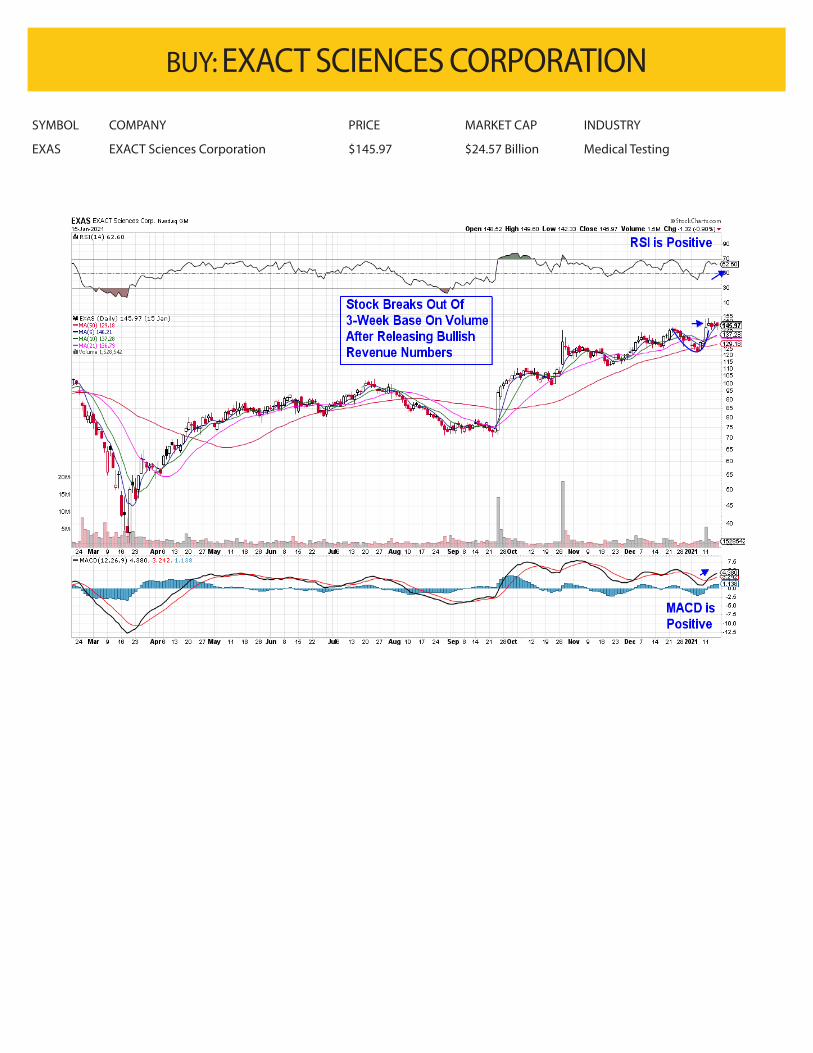
BUY: EXACT SCIENCES CORPORATION
SYMBOL COMPANY PRICE MARKET CAP INDUSTRY
EXAS EXACT Sciences Corporation $145.97 $24.57 Billion Medical Testing
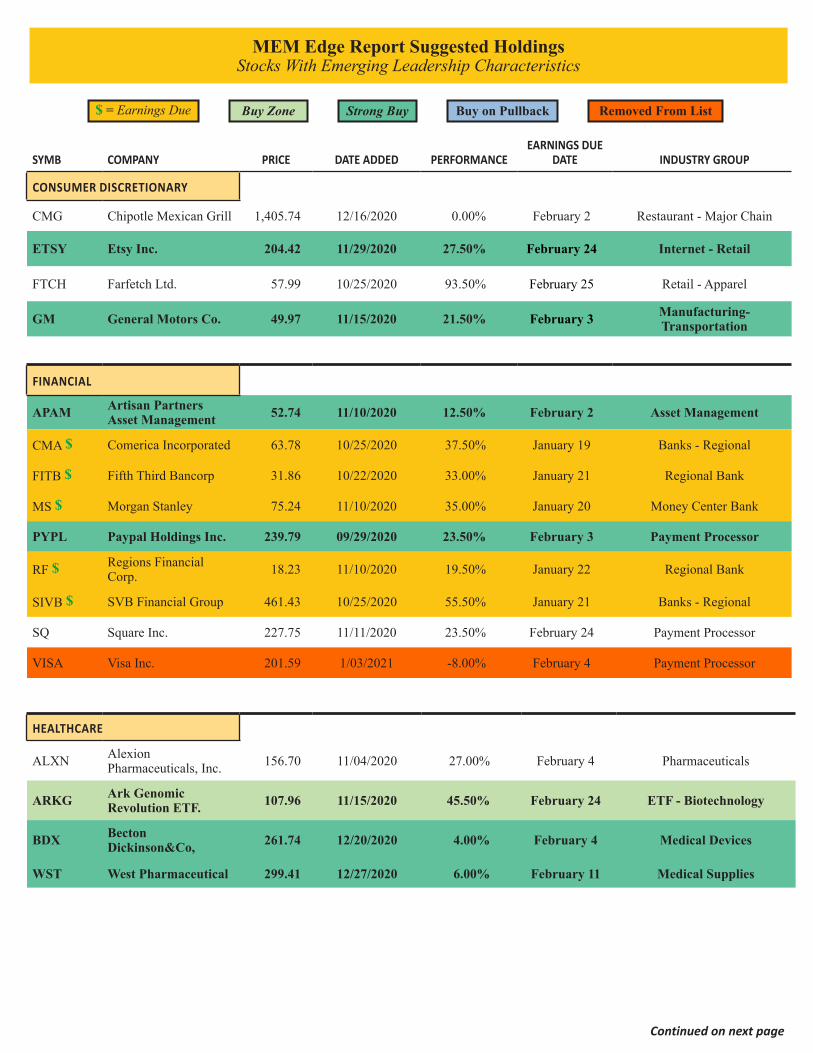
$ = Earnings Due Buy Zone Strong Buy Buy on Pullback Removed From List
SYMB COMPANY PRICE DATE ADDED PERFORMANCEEARNINGS DUE
DATE INDUSTRY GROUP
CONSUMER DISCRETIONARY
CMG Chipotle Mexican Grill 1,405.74 12/16/2020 0.00% February 2 Restaurant - Major Chain
ETSY Etsy Inc. 204.42 11/29/2020 27.50% February 24 Internet - Retail
FTCH Farfetch Ltd. 57.99 10/25/2020 93.50% February 25 Retail - Apparel
GM General Motors Co. 49.97 11/15/2020 21.50% February 3 Manufacturing-Transportation
FINANCIAL
APAM Artisan Partners Asset Management 52.74 11/10/2020 12.50% February 2 Asset Management
CMA $ Comerica Incorporated 63.78 10/25/2020 37.50% January 19 Banks - Regional
FITB $ Fifth Third Bancorp 31.86 10/22/2020 33.00% January 21 Regional Bank
MS $ Morgan Stanley 75.24 11/10/2020 35.00% January 20 Money Center Bank
PYPL Paypal Holdings Inc. 239.79 09/29/2020 23.50% February 3 Payment Processor
RF $ Regions Financial Corp. 18.23 11/10/2020 19.50% January 22 Regional Bank
SIVB $ SVB Financial Group 461.43 10/25/2020 55.50% January 21 Banks - Regional
SQ Square Inc. 227.75 11/11/2020 23.50% February 24 Payment Processor
VISA Visa Inc. 201.59 1/03/2021 -8.00% February 4 Payment Processor
HEALTHCARE
ALXN Alexion Pharmaceuticals, Inc. 156.70 11/04/2020 27.00% February 4 Pharmaceuticals
ARKG Ark Genomic Revolution ETF. 107.96 11/15/2020 45.50% February 24 ETF - Biotechnology
BDX Becton Dickinson&Co, 261.74 12/20/2020 4.00% February 4 Medical Devices
WST West Pharmaceutical 299.41 12/27/2020 6.00% February 11 Medical Supplies
MEM Edge Report Suggested Holdings Stocks With Emerging Leadership Characteristics
Continued on next page
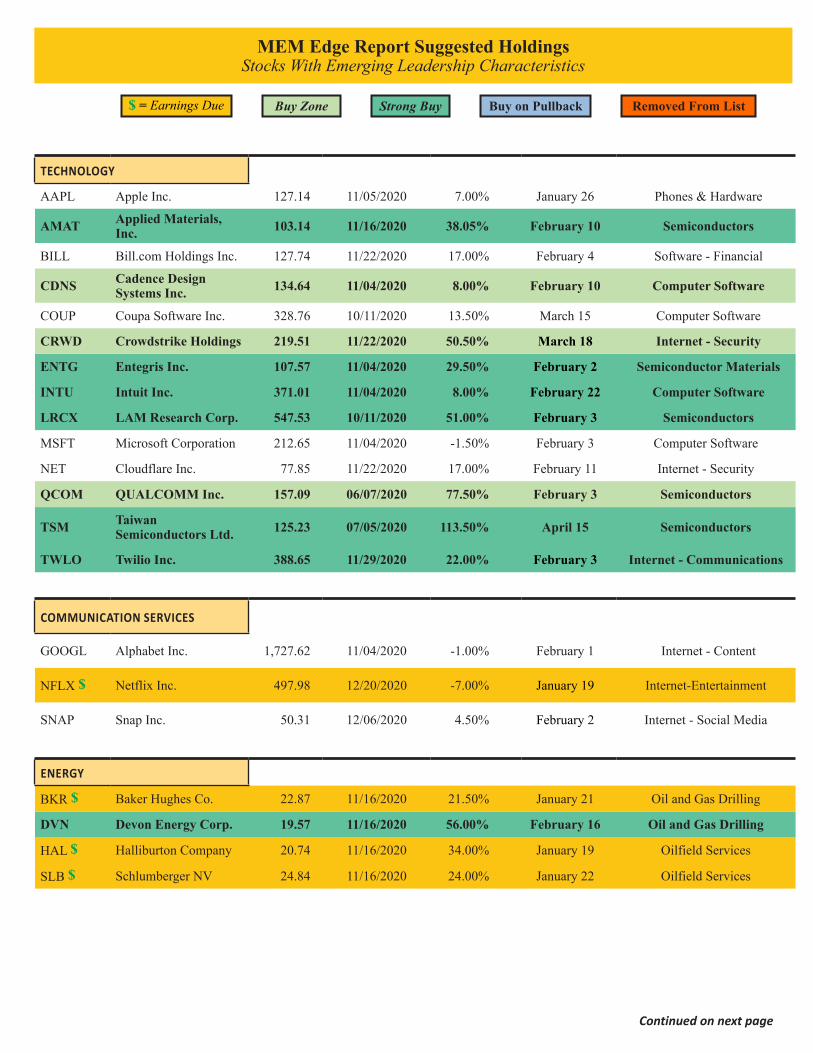
TECHNOLOGY
AAPL Apple Inc. 127.14 11/05/2020 7.00% January 26 Phones & Hardware
AMAT Applied Materials, Inc. 103.14 11/16/2020 38.05% February 10 Semiconductors
BILL Bill.com Holdings Inc. 127.74 11/22/2020 17.00% February 4 Software - Financial
CDNS Cadence Design Systems Inc. 134.64 11/04/2020 8.00% February 10 Computer Software
COUP Coupa Software Inc. 328.76 10/11/2020 13.50% March 15 Computer Software
CRWD Crowdstrike Holdings 219.51 11/22/2020 50.50% March 18 Internet - Security
ENTG Entegris Inc. 107.57 11/04/2020 29.50% February 2 Semiconductor Materials
INTU Intuit Inc. 371.01 11/04/2020 8.00% February 22 Computer Software
LRCX LAM Research Corp. 547.53 10/11/2020 51.00% February 3 Semiconductors
MSFT Microsoft Corporation 212.65 11/04/2020 -1.50% February 3 Computer Software
NET Cloudflare Inc. 77.85 11/22/2020 17.00% February 11 Internet - Security
QCOM QUALCOMM Inc. 157.09 06/07/2020 77.50% February 3 Semiconductors
TSM Taiwan Semiconductors Ltd. 125.23 07/05/2020 113.50% April 15 Semiconductors
TWLO Twilio Inc. 388.65 11/29/2020 22.00% February 3 Internet - Communications
COMMUNICATION SERVICES
GOOGL Alphabet Inc. 1,727.62 11/04/2020 -1.00% February 1 Internet - Content
NFLX $ Netflix Inc. 497.98 12/20/2020 -7.00% January 19 Internet-Entertainment
SNAP Snap Inc. 50.31 12/06/2020 4.50% February 2 Internet - Social Media
ENERGY
BKR $ Baker Hughes Co. 22.87 11/16/2020 21.50% January 21 Oil and Gas Drilling
DVN Devon Energy Corp. 19.57 11/16/2020 56.00% February 16 Oil and Gas Drilling
HAL $ Halliburton Company 20.74 11/16/2020 34.00% January 19 Oilfield Services
SLB $ Schlumberger NV 24.84 11/16/2020 24.00% January 22 Oilfield Services
MEM Edge Report Suggested Holdings Stocks With Emerging Leadership Characteristics
$ = Earnings Due Buy Zone Strong Buy Buy on Pullback Removed From List
Continued on next page
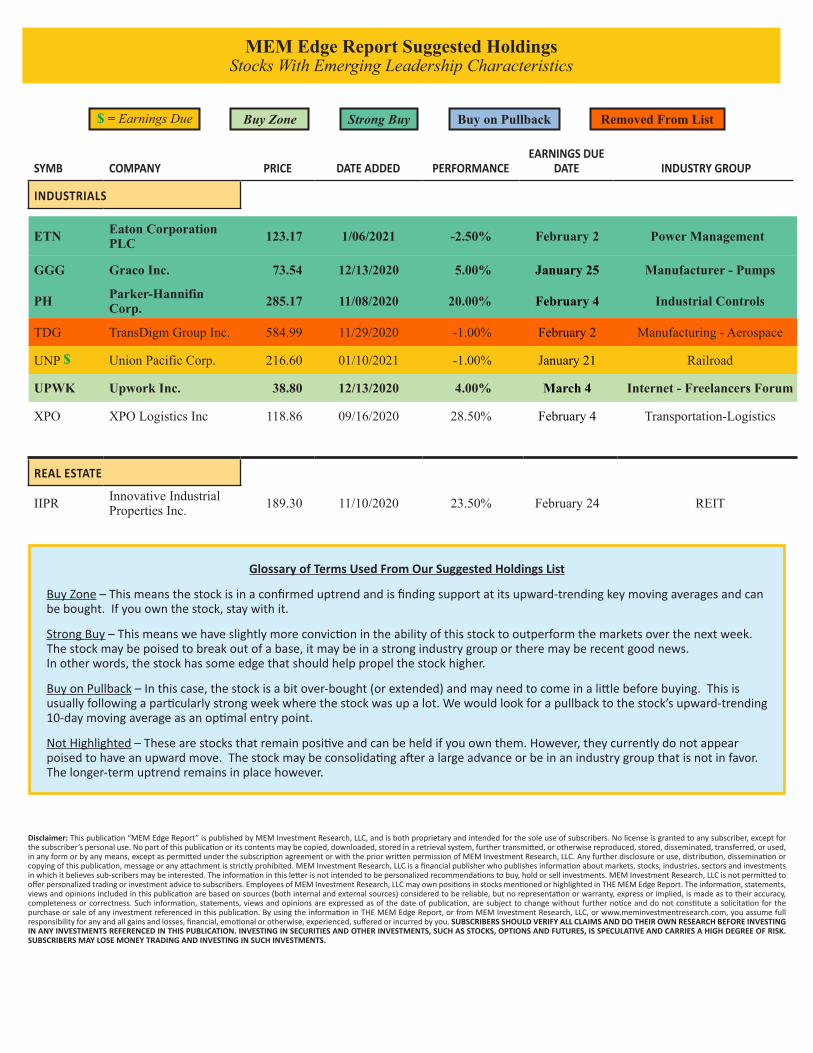
Glossary of Terms Used From Our Suggested Holdings List
Buy Zone – This means the stock is in a confirmed uptrend and is finding support at its upward-trending key moving averages and can be bought. If you own the stock, stay with it.
Strong Buy – This means we have slightly more conviction in the ability of this stock to outperform the markets over the next week. The stock may be poised to break out of a base, it may be in a strong industry group or there may be recent good news. In other words, the stock has some edge that should help propel the stock higher.
Buy on Pullback – In this case, the stock is a bit over-bought (or extended) and may need to come in a little before buying. This is usually following a particularly strong week where the stock was up a lot. We would look for a pullback to the stock’s upward-trending 10-day moving average as an optimal entry point.
Not Highlighted – These are stocks that remain positive and can be held if you own them. However, they currently do not appear poised to have an upward move. The stock may be consolidating after a large advance or be in an industry group that is not in favor. The longer-term uptrend remains in place however.
Disclaimer: This publication “MEM Edge Report” is published by MEM Investment Research, LLC, and is both proprietary and intended for the sole use of subscribers. No license is granted to any subscriber, except for the subscriber’s personal use. No part of this publication or its contents may be copied, downloaded, stored in a retrieval system, further transmitted, or otherwise reproduced, stored, disseminated, transferred, or used, in any form or by any means, except as permitted under the subscription agreement or with the prior written permission of MEM Investment Research, LLC. Any further disclosure or use, distribution, dissemination or copying of this publication, message or any attachment is strictly prohibited. MEM Investment Research, LLC is a financial publisher who publishes information about markets, stocks, industries, sectors and investments in which it believes sub-scribers may be interested. The information in this letter is not intended to be personalized recommendations to buy, hold or sell investments. MEM Investment Research, LLC is not permitted to offer personalized trading or investment advice to subscribers. Employees of MEM Investment Research, LLC may own positions in stocks mentioned or highlighted in THE MEM Edge Report. The information, statements, views and opinions included in this publication are based on sources (both internal and external sources) considered to be reliable, but no representation or warranty, express or implied, is made as to their accuracy, completeness or correctness. Such information, statements, views and opinions are expressed as of the date of publication, are subject to change without further notice and do not constitute a solicitation for the purchase or sale of any investment referenced in this publication. By using the information in THE MEM Edge Report, or from MEM Investment Research, LLC, or www.meminvestmentresearch.com, you assume full responsibility for any and all gains and losses, financial, emotional or otherwise, experienced, suffered or incurred by you. SUBSCRIBERS SHOULD VERIFY ALL CLAIMS AND DO THEIR OWN RESEARCH BEFORE INVESTING IN ANY INVESTMENTS REFERENCED IN THIS PUBLICATION. INVESTING IN SECURITIES AND OTHER INVESTMENTS, SUCH AS STOCKS, OPTIONS AND FUTURES, IS SPECULATIVE AND CARRIES A HIGH DEGREE OF RISK. SUBSCRIBERS MAY LOSE MONEY TRADING AND INVESTING IN SUCH INVESTMENTS.
$ = Earnings Due Buy Zone Strong Buy Buy on Pullback Removed From List
SYMB COMPANY PRICE DATE ADDED PERFORMANCEEARNINGS DUE
DATE INDUSTRY GROUP
INDUSTRIALS
ETN Eaton Corporation PLC 123.17 1/06/2021 -2.50% February 2 Power Management
GGG Graco Inc. 73.54 12/13/2020 5.00% January 25 Manufacturer - Pumps
PH Parker-Hannifin Corp. 285.17 11/08/2020 20.00% February 4 Industrial Controls
TDG TransDigm Group Inc. 584.99 11/29/2020 -1.00% February 2 Manufacturing - Aerospace
UNP $ Union Pacific Corp. 216.60 01/10/2021 -1.00% January 21 Railroad
UPWK Upwork Inc. 38.80 12/13/2020 4.00% March 4 Internet - Freelancers Forum
XPO XPO Logistics Inc 118.86 09/16/2020 28.50% February 4 Transportation-Logistics
REAL ESTATE
IIPR Innovative Industrial Properties Inc. 189.30 11/10/2020 23.50% February 24 REIT
MEM Edge Report Suggested Holdings Stocks With Emerging Leadership Characteristics