DAFTAR PUSTAKA - Diponegoro University | Institutional...
30
32 DAFTAR PUSTAKA 1. Departemen Ilmu Penyakit Dalam Indonesia.Buku ajar ilmu penyakit dalam. Jilid 3.Jakarta: Balai Penerbit FKUI, 2006 2. Soegondo, Sidartawan. 2006. Jumlah Diabetes Melitus. (online). www. Medicastore.com 3. Suyono S. Patofisiologi Diabetes Melitus dalam Penatalaksanaan Diabetes Melitus Terpadu; 1999. 4. Khasiat buah manggis sebagai obat herbal diabetes, Available from URL : http://kiathidupsehat.com/tag/diabetes-melitus/ 5. Mengenal Beberapa Tanaman yang Digunakan sebagai Antidiabetika ,AvailablefromURL:HYPERLINKhttp://www.pom.go.id/public/berita_aktual/ detail.asp?id=74&qs_menuid=2 6. Sudewo, Bambang.Tanaman obat populer penggempur aneka penyakit. Jakarta : AgroMedia Pustaka.2006 7. Utami, Prapti. Tanaman obat untuk mengatasi diabetes melitus. Jakarta : AgroMedia Pustaka. 2004 8. Wijayakusuma, Hembing. Ramuan lengkap herbal taklukkan penyakit. Jakarta : Pustaka Bunda.2008 9. Tjahjaningtyas. Manggis Ratu Buah Kaya Manfaat. Surabaya: Stomata.2011 10. Xamthone Sebagai Antidiabetes, Available from URL : http://dokterherbal.biz/xamthone-sebagai-antidiabetes
Transcript of DAFTAR PUSTAKA - Diponegoro University | Institutional...

32
DAFTAR PUSTAKA
1. Departemen Ilmu Penyakit Dalam Indonesia.Buku ajar ilmu penyakit dalam.
Jilid 3.Jakarta: Balai Penerbit FKUI, 2006
2. Soegondo, Sidartawan. 2006. Jumlah Diabetes Melitus. (online). www.
Medicastore.com
3. Suyono S. Patofisiologi Diabetes Melitus dalam Penatalaksanaan Diabetes
Melitus Terpadu; 1999.
4. Khasiat buah manggis sebagai obat herbal diabetes, Available from URL :
http://kiathidupsehat.com/tag/diabetes-melitus/
5. Mengenal Beberapa Tanaman yang Digunakan sebagai Antidiabetika
,AvailablefromURL:HYPERLINKhttp://www.pom.go.id/public/berita_aktual/
detail.asp?id=74&qs_menuid=2
6. Sudewo, Bambang.Tanaman obat populer penggempur aneka penyakit.
Jakarta : AgroMedia Pustaka.2006
7. Utami, Prapti. Tanaman obat untuk mengatasi diabetes melitus. Jakarta :
AgroMedia Pustaka. 2004
8. Wijayakusuma, Hembing. Ramuan lengkap herbal taklukkan penyakit. Jakarta
: Pustaka Bunda.2008
9. Tjahjaningtyas. Manggis Ratu Buah Kaya Manfaat. Surabaya: Stomata.2011
10. Xamthone Sebagai Antidiabetes, Available from URL :
http://dokterherbal.biz/xamthone-sebagai-antidiabetes

33
11. Ivorra, M. D. 2008. A Review of Natural Product and Plants as Potential
Antidiabetic. http://www.ncbi.nlm.nih.gov/pubmed/2693840 (10 Oktober
2009)
12. Leslie,R.D.G. Diabetes. Penerbit: Arcan,1991
13. Maulana M. Mengenal Diabetes: Panduan Praktis Menangani penyakit
kencing manis. Yogyakarta: Katahati, 2008
14. Bagian PK FK UI. Pendidikan berkesinambungan Patologi Klinik. Jakarta:
FK UI, 2003
15. Greenspan FS, Baster JD. Editor.Endokrinologi dasar dan klinik. Edisi 4.
Jakarta: EGC, 1998
16. .Prise SA,Wilson L.Patofisiologi: Konsep Klinis prose-proses penyakit. Edisi
4. Jilid 2. Jakarta: EGC, 1995
17. Abuaqila. Diabetes Melitus. 2008. [Cited Desember 2010]. Available from :
http://abuqilainteractive.blogspot.com/2008/02/diabetesmelitus.html
18. Soegondo. Jumlah Penderita Diabetes Indonesia Rangking ke-4 di Dunia.
2005. [Cited Desember 2010]. Available from : http://www.depkesRI.com
19. Soegondo, et al Penatalaksanaan Diabetes Melitus Terpadu. Jakarta: Balai
Penerbit FKUI; 2007
20. Baron DM.Kapita selekta patologi klinik.Edisi 4. Jakarta: EGC, 1995
21. Guyton AC,Hall JE.Buku Ajar Fisiologi Kedokteran.Edisi 9. Jakarta: EGC,
1997

34
22. Moongkarndi P. Kosem N. Kaslungka N. 2004. Antipoliferation,
antioxidation and induction of apoptosis by Garcinia mangostana
(mangosteen) on SKBR3 human breast cancer line. J Ethnopharmacol. 90(1)
23. Weecharangsan W. Opanasopit P. Sukma M. Ngawhirunpat T. Sotanaphun U.
Siripong P. 2006. Antioxidative and neuroprotective activities of extracts
from the fruit hull pf mangosteen (Garcinia mangostana Linn). Med Princ
Pract. 15(4)
24. World Health Organitation. Research guidelines for evaluating the safety and
efficacy of herbal medicines. Manila : WHO, 1993
25. Kurniawan A. Pengaruh pemberian ekstrak jambu biji (psidium guajava L)
terhadap penurunan kadar glukosa darah pada tikus wistar jantan yang diberi
beban glukosa. Semarang. FK Undip. 2011
26. Kelompok Kerja Ilmiah Yayasan Pengembangan Obat Alam Phytomedica.
Penapisan Farmakologi, Pengujian Fitokimia dan dan Pengujian Klinik.
Jakarta : Yayasan Pengembangan Obat Bahan Alam Phytomedica, 1991 : p.
19-20
27. Dahlan S. Seri statistik : Statistika untuk kedokteran dan kesehatan uji
hipotesis dengan menggunakan SPSS program 12 jam. Jakarta: Arkans; 2004
28. Dosis Aman Ratu Buah-Xamslimer. Available from:
http://www.waralabaxamslimer.com/?p=202#more-202
29. Neal J. Michael. At a Glance. Farmakologi Medis. Jakarta : Penerbit
Erlangga, 2006

35
Lampiran I
TABEL KONVERSI PERHITUNGAN DOSIS
(LAURENCE & BACHARACH, 1964)
Mencit
20 gr
Tikus
200 gr
Marmot
400 gr
Kelinci
1,5 kg
Kucing
2 kg
Kera
4 kg
Anjing
12 kg
Manusia
70 kg
Mencit
20 gr
1.0 7.0 12.25 27.8 29.7 64.1 124.2 387.9
Tikus
200 gr
0.14 1.0 1.74 3.9 4.2 9.2 17.8 56.0
Marmot
400 gr
0.08 0.57 1.0 2.25 2.4 5.2 10.2 31.5
Kelinci
1,5 kg
0.04 0.25 0.44 1.0 1.08 2.4 4.5 14.2
Kucing
2 kg
0.03 0.23 0.41 0.92 1.0 2.2 4.1 13.0
Kera 4
kg
0.016 0.11 0.19 0.42 0.45 1.0 1.9 6.1
Anjing
12 kg
0.008 0.06 0.1 0.22 0.24 0.52 1.0 3.1
Manusia
70 kg
0.0026 0.018 0.031 0.07 0.076 0.16 0.32 1.0

36
Lampiran II
DOSIS KONVERSI
1. Ekstrak kulit manggis (Garcinia mangostana L)
Dihitung dengan menggunakan rumus berdasarkan konversi perhitungan
dosis antara jenis hewan (LAURENCE & BACHARACH, 1964)
1. Konversi dosis manusia (70 kg) ke tikus (200 gram ) = 0,018
2. Dosis kulit manggis pada manusia (70 kg) = 350 gram28
3. Dosis kulit manggis-tikus (200 gram) = 70/70 x 0,018 x 350
= 6,3 gram / 200grBB
4. Kemudian diturunkan dan dinaikan sesuai deret ukur menjadi :
1. 6,3 gr / 2 = 3,15 gram / 200grBB
2. 6,3 gr x 2 = 12,6 gram / 200grBB

37
2. Dosis Glukosa yang dipakai
Dihitung dengan menggunakan rumus berdasarkan konversi perhitungan
dosis antara jenis hewan (LAURENCE & BACHARACH, 1964)
1. Konversi dosis manusia (70 kg) ke tikus (200 gram) = 0,018
2. Dosis glukosa pada manusia = 75 gram
3. Dosis glukosa manusia-tikus (200 gram) = 0,018 x 75
= 1,35 gram / 200grBB
3. Dosis Glibenklamid
Dihitung dengan menggunakan rumus berdasarkan konversi perhitungan
dosis antara jenis hewan (LAURENCE & BACHARACH, 1964)
1. Konversi dosis manusia (70 kg) ke tikus (200 gram) = 0,018
2. Dosis glibenklamid pada manusia (70 kg) = 5 gram
3. Dosis glibenklamid manusia-tikus (200 gram) = 70/70 x 0,018 x 5
=0,09gram/200grBB

38
Explore
Kelompok
Report
5 5 5 5 5 5
83.00 148.60 148.60 143.20 130.60 119.00
9.874 8.735 6.465 6.760 4.393 2.449
86.00 149.00 150.00 145.00 129.00 120.00
69 135 142 135 127 116
95 158 158 152 138 122
5 5 5 5 5 5
102.80 155.00 147.80 139.20 122.80 100.60
11.476 10.296 9.094 8.167 6.140 2.702
105.00 156.00 146.00 137.00 120.00 101.00
87 144 137 130 118 97
116 166 159 150 133 104
5 5 5 5 5 5
96.80 157.60 150.00 138.20 115.80 96.20
14.957 10.164 13.435 9.731 7.328 4.438
94.00 158.00 156.00 140.00 117.00 97.00
79 147 131 128 107 89
117 170 162 151 125 101
5 5 5 5 5 5
92.20 151.40 142.40 127.80 106.20 86.20
8.497 3.286 5.030 7.855 7.050 7.259
92.00 153.00 140.00 127.00 107.00 87.00
82 147 138 117 98 79
105 155 150 138 116 97
5 5 5 5 5 5
79.40 156.00 144.60 125.20 99.60 73.20
5.771 9.381 3.975 3.633 3.362 5.541
77.00 157.00 144.00 124.00 100.00 75.00
73 146 140 122 95 67
88 167 150 130 104 80
25 25 25 25 25 25
90.84 153.72 146.68 134.72 115.00 95.04
13.066 8.672 8.107 9.876 12.557 16.167
88.00 153.00 145.00 134.00 117.00 97.00
69 135 131 117 95 67
117 170 162 152 138 122
N
Mean
Std. Deviation
Median
Minimum
Maximum
N
Mean
Std. Deviation
Median
Minimum
Maximum
N
Mean
Std. Deviation
Median
Minimum
Maximum
N
Mean
Std. Deviation
Median
Minimum
Maximum
N
Mean
Std. Deviation
Median
Minimum
Maximum
N
Mean
Std. Deviation
Median
Minimum
Maximum
Kelompok
K-
M1
M2
M3
Gliben
Total
GD normal GD pre GD post 1 GD post 2 GD post 3 GD post 4

39
Tests of Normality
.219 5 .200* .970 5 .877
.176 5 .200* .974 5 .901
.174 5 .200* .979 5 .930
.216 5 .200* .970 5 .873
.261 5 .200* .938 5 .650
.227 5 .200* .944 5 .696
.234 5 .200* .870 5 .267
.228 5 .200* .910 5 .467
.287 5 .200* .914 5 .490
.231 5 .200* .902 5 .421
.214 5 .200* .908 5 .458
.186 5 .200* .953 5 .762
.272 5 .200* .879 5 .304
.283 5 .200* .878 5 .298
.160 5 .200* .976 5 .911
.205 5 .200* .957 5 .790
.206 5 .200* .953 5 .760
.228 5 .200* .920 5 .528
.161 5 .200* .992 5 .986
.229 5 .200* .867 5 .254
.264 5 .200* .836 5 .155
.276 5 .200* .828 5 .135
.186 5 .200* .962 5 .824
.170 5 .200* .971 5 .882
.147 5 .200* .995 5 .994
.258 5 .200* .925 5 .563
.159 5 .200* .990 5 .980
.282 5 .200* .908 5 .455
.203 5 .200* .916 5 .503
.227 5 .200* .910 5 .468
Kelompok
K-
M1
M2
M3
Gliben
K-
M1
M2
M3
Gliben
K-
M1
M2
M3
Gliben
K-
M1
M2
M3
Gliben
K-
M1
M2
M3
Gliben
K-
M1
M2
M3
Gliben
GD normal
GD pre
GD post 1
GD post 2
GD post 3
GD post 4
Statistic df Sig. Statistic df Sig.
Kolmogorov-Smirnova
Shapiro-Wilk
This is a lower bound of the true significance.*.
Lilliefors Significance Correctiona.

40
Report
5 5 5 5 5 5
65.60 .00 -5.40 -12.60 -11.60 -29.60
3.847 7.906 1.673 4.278 3.912 7.301
66.00 -4.00 -5.00 -14.00 -11.00 -31.00
61 -8 -8 -17 -18 -38
71 9 -4 -6 -8 -18
5 5 5 5 5 5
52.20 -7.20 -8.60 -16.40 -22.20 -54.40
6.797 3.114 2.702 3.507 5.630 8.620
48.00 -8.00 -9.00 -17.00 -22.00 -52.00
46 -10 -12 -21 -31 -64
61 -2 -5 -12 -16 -46
5 5 5 5 5 5
60.80 -7.60 -11.80 -22.40 -19.60 -61.40
19.460 6.427 7.259 3.578 4.278 8.792
60.00 -8.00 -13.00 -22.00 -21.00 -58.00
30 -16 -22 -26 -24 -72
79 2 -2 -18 -13 -51
5 5 5 5 5 5
59.20 -9.00 -14.60 -21.60 -20.00 -65.20
9.706 3.536 3.782 3.050 1.871 4.324
61.00 -8.00 -13.00 -22.00 -19.00 -66.00
44 -14 -21 -25 -22 -69
71 -5 -12 -18 -18 -58
5 5 5 5 5 5
76.60 -11.40 -19.40 -25.60 -26.40 -82.80
9.990 7.301 2.793 4.393 6.465 4.438
79.00 -10.00 -20.00 -27.00 -25.00 -81.00
64 -23 -22 -30 -37 -88
90 -4 -16 -20 -20 -78
25 25 25 25 25 25
62.88 -7.04 -11.96 -19.72 -19.96 -58.68
13.186 6.711 6.201 5.856 6.535 18.765
61.00 -8.00 -12.00 -20.00 -20.00 -63.00
30 -23 -22 -30 -37 -88
90 9 -2 -6 -8 -18
N
Mean
Std. Deviation
Median
Minimum
Maximum
N
Mean
Std. Deviation
Median
Minimum
Maximum
N
Mean
Std. Deviation
Median
Minimum
Maximum
N
Mean
Std. Deviation
Median
Minimum
Maximum
N
Mean
Std. Deviation
Median
Minimum
Maximum
N
Mean
Std. Deviation
Median
Minimum
Maximum
Kelompok
K-
M1
M2
M3
Gliben
Total
Selisih GD
post pre -
normal
Selisih GD
post 1 -
pre
Selisih GD
post 2 -
post 1
Selisih GD
post 3 -
post 2
Selisih GD
post 4 -
post 3
Selisih GD
post 4 -
pre

41
Tests of Normality
.158 5 .200* .979 5 .928
.332 5 .076 .830 5 .139
.263 5 .200* .888 5 .346
.292 5 .190 .901 5 .417
.195 5 .200* .972 5 .885
.294 5 .184 .834 5 .148
.274 5 .200* .867 5 .254
.263 5 .200* .938 5 .650
.211 5 .200* .965 5 .844
.213 5 .200* .929 5 .592
.201 5 .200* .881 5 .314
.159 5 .200* .990 5 .980
.234 5 .200* .964 5 .838
.264 5 .200* .786 5 .062
.224 5 .200* .865 5 .246
.228 5 .200* .936 5 .636
.168 5 .200* .981 5 .940
.243 5 .200* .894 5 .377
.203 5 .200* .923 5 .549
.225 5 .200* .900 5 .410
.259 5 .200* .888 5 .345
.244 5 .200* .943 5 .687
.228 5 .200* .936 5 .636
.304 5 .149 .817 5 .111
.263 5 .200* .900 5 .408
.267 5 .200* .922 5 .540
.241 5 .200* .843 5 .172
.251 5 .200* .919 5 .521
.282 5 .200* .863 5 .240
.257 5 .200* .882 5 .318
Kelompok
K-
M1
M2
M3
Gliben
K-
M1
M2
M3
Gliben
K-
M1
M2
M3
Gliben
K-
M1
M2
M3
Gliben
K-
M1
M2
M3
Gliben
K-
M1
M2
M3
Gliben
Selisih GD post pre -
normal
Selisih GD post 1 - pre
Selisih GD post 2 - post 1
Selisih GD post 3 - post 2
Selisih GD post 4 - post 3
Selisih GD post 4 - pre
Statistic df Sig. Statistic df Sig.
Kolmogorov-Smirnova
Shapiro-Wilk
This is a lower bound of the true significance.*.
Lilliefors Significance Correctiona.

42
Test of Homogeneity of Variance
1.580 4 20 .218
1.269 4 20 .315
1.269 4 11.254 .339
1.651 4 20 .201
1.750 4 20 .179
.724 4 20 .586
.724 4 14.075 .590
1.706 4 20 .188
1.687 4 20 .192
1.093 4 20 .387
1.093 4 9.013 .416
1.678 4 20 .194
.394 4 20 .810
.139 4 20 .966
.139 4 15.940 .965
.373 4 20 .825
.735 4 20 .579
.545 4 20 .704
.545 4 14.590 .705
.692 4 20 .606
1.889 4 20 .152
.757 4 20 .566
.757 4 15.971 .568
1.867 4 20 .156
Based on Mean
Based on Median
Based on Median and
with adjusted df
Based on trimmed mean
Based on Mean
Based on Median
Based on Median and
with adjusted df
Based on trimmed mean
Based on Mean
Based on Median
Based on Median and
with adjusted df
Based on trimmed mean
Based on Mean
Based on Median
Based on Median and
with adjusted df
Based on trimmed mean
Based on Mean
Based on Median
Based on Median and
with adjusted df
Based on trimmed mean
Based on Mean
Based on Median
Based on Median and
with adjusted df
Based on trimmed mean
Selisih GD post pre -
normal
Selisih GD post 1 - pre
Selisih GD post 2 - post 1
Selisih GD post 3 - post 2
Selisih GD post 4 - post 3
Selisih GD post 4 - pre
Levene
Statistic df1 df2 Sig.

43
Selisih GD post pre - normal
Selisih GD post 1 - pre
Kelompok
GlibenM3M2M1K-
Selisih
GD
po
st
pre
- n
orm
al
90
80
70
60
50
40
30
17
18
11

44
Selisih GD post 2 - post 1
Kelompok
GlibenM3M2M1K-
Se
lisih
GD
po
st
1 -
pre
10
0
-10
-20
-30
14
11
9
22

45
Selisih GD post 3 - post 2
Kelompok
GlibenM3M2M1K-
Se
lisih
GD
po
st
2 -
po
st
10
-5
-10
-15
-20
-25
18
11
13

46
Selisih GD post 4 - post 3
Kelompok
GlibenM3M2M1K-
Se
lisih
GD
po
st
3 -
po
st
2-5
-10
-15
-20
-25
-30

47
Selisih GD post 4 - pre
Kelompok
GlibenM3M2M1K-
Se
lisih
GD
po
st
4 -
po
st
30
-10
-20
-30
-40
10
3
25

48
Oneway
Post Hoc Tests
Kelompok
GlibenM3M2M1K-
Se
lisih
GD
po
st
4 -
pre
0
-20
-40
-60
-80
-100
4
1
16
ANOVA
Selisih GD post pre - normal
1637.840 4 409.460 3.231 .034
2534.800 20 126.740
4172.640 24
Between Groups
Within Groups
Total
Sum of
Squares df Mean Square F Sig.
49
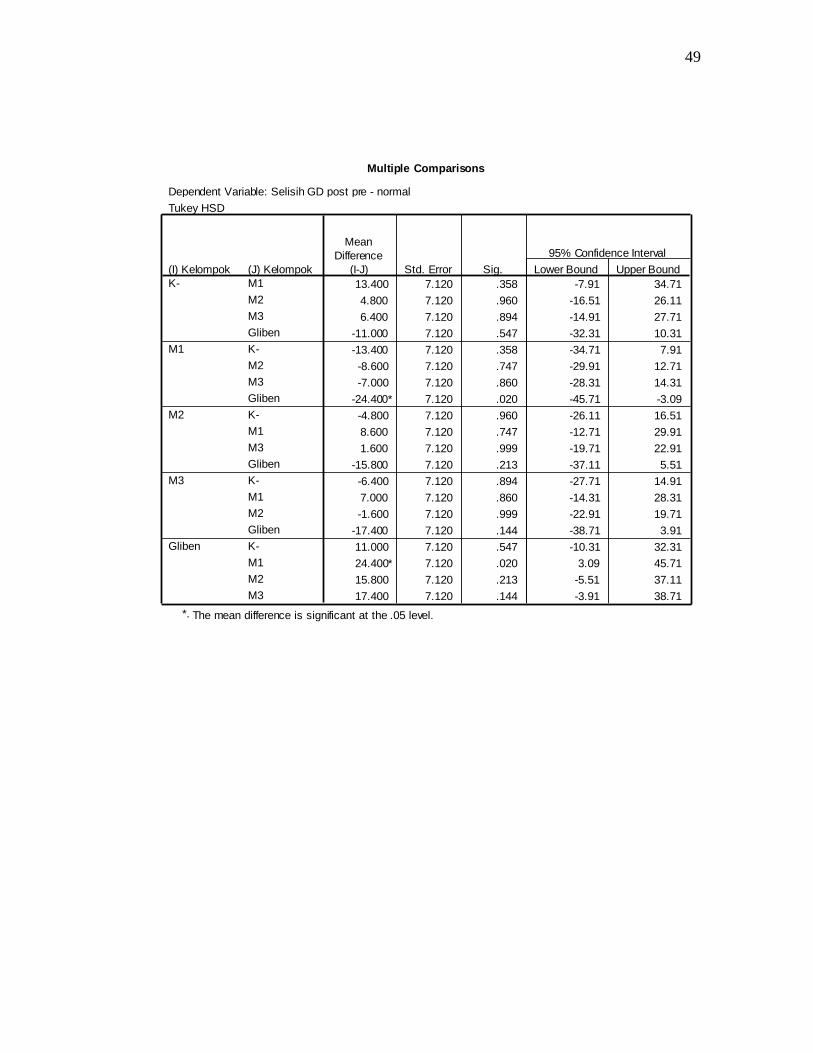
Multiple Comparisons
Dependent Variable: Selisih GD post pre - normal
Tukey HSD
13.400 7.120 .358 -7.91 34.71
4.800 7.120 .960 -16.51 26.11
6.400 7.120 .894 -14.91 27.71
-11.000 7.120 .547 -32.31 10.31
-13.400 7.120 .358 -34.71 7.91
-8.600 7.120 .747 -29.91 12.71
-7.000 7.120 .860 -28.31 14.31
-24.400* 7.120 .020 -45.71 -3.09
-4.800 7.120 .960 -26.11 16.51
8.600 7.120 .747 -12.71 29.91
1.600 7.120 .999 -19.71 22.91
-15.800 7.120 .213 -37.11 5.51
-6.400 7.120 .894 -27.71 14.91
7.000 7.120 .860 -14.31 28.31
-1.600 7.120 .999 -22.91 19.71
-17.400 7.120 .144 -38.71 3.91
11.000 7.120 .547 -10.31 32.31
24.400* 7.120 .020 3.09 45.71
15.800 7.120 .213 -5.51 37.11
17.400 7.120 .144 -3.91 38.71
(J) Kelompok
M1
M2
M3
Gliben
K-
M2
M3
Gliben
K-
M1
M3
Gliben
K-
M1
M2
Gliben
K-
M1
M2
M3
(I) Kelompok
K-
M1
M2
M3
Gliben
Mean
Difference
(I-J) Std. Error Sig. Lower Bound Upper Bound
95% Confidence Interval
The mean difference is significant at the .05 level.*.
50
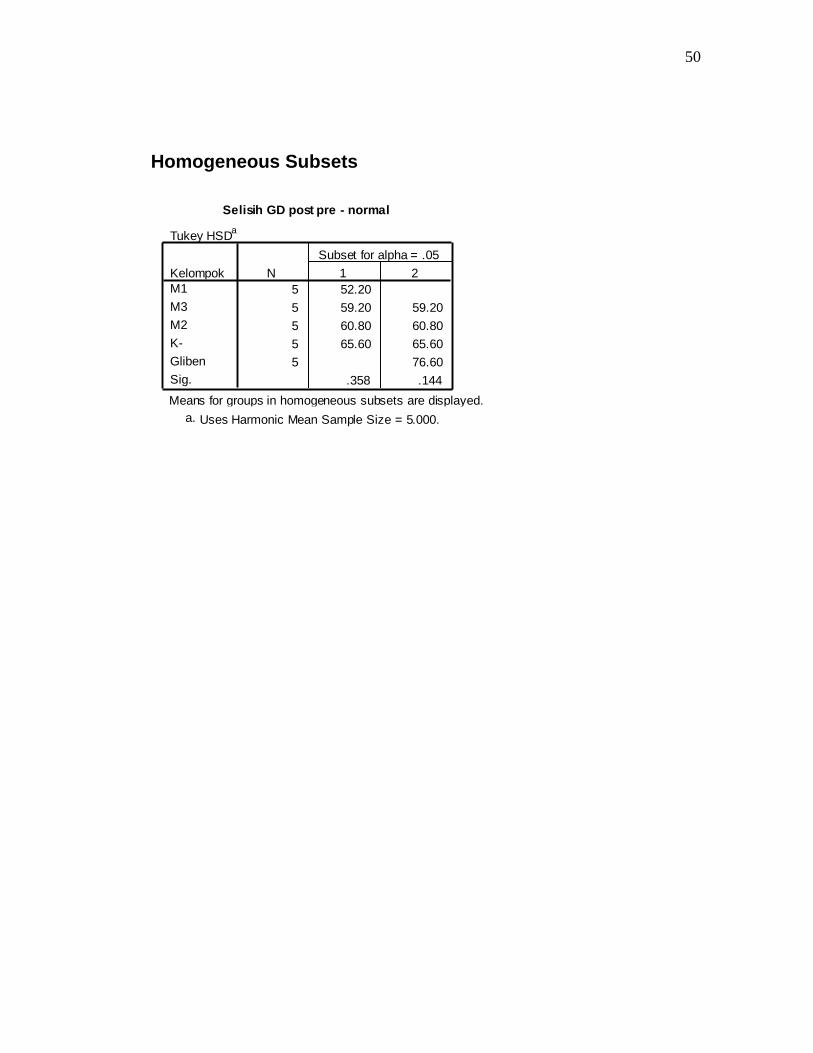
Homogeneous Subsets
Selisih GD post pre - normal
Tukey HSDa
5 52.20
5 59.20 59.20
5 60.80 60.80
5 65.60 65.60
5 76.60
.358 .144
Kelompok
M1
M3
M2
K-
Gliben
Sig.
N 1 2
Subset for alpha = .05
Means for groups in homogeneous subsets are displayed.
Uses Harmonic Mean Sample Size = 5.000.a.

51
Oneway
Post Hoc Tests
ANOVA
Selisih GD post 1 - pre
363.760 4 90.940 2.536 .072
717.200 20 35.860
1080.960 24
Between Groups
Within Groups
Total
Sum of
Squares df Mean Square F Sig.
Multiple Comparisons
Dependent Variable: Selisih GD post 1 - pre
Tukey HSD
7.200 3.787 .349 -4.13 18.53
7.600 3.787 .299 -3.73 18.93
9.000 3.787 .163 -2.33 20.33
11.400* 3.787 .048 .07 22.73
-7.200 3.787 .349 -18.53 4.13
.400 3.787 1.000 -10.93 11.73
1.800 3.787 .989 -9.53 13.13
4.200 3.787 .800 -7.13 15.53
-7.600 3.787 .299 -18.93 3.73
-.400 3.787 1.000 -11.73 10.93
1.400 3.787 .996 -9.93 12.73
3.800 3.787 .851 -7.53 15.13
-9.000 3.787 .163 -20.33 2.33
-1.800 3.787 .989 -13.13 9.53
-1.400 3.787 .996 -12.73 9.93
2.400 3.787 .968 -8.93 13.73
-11.400* 3.787 .048 -22.73 -.07
-4.200 3.787 .800 -15.53 7.13
-3.800 3.787 .851 -15.13 7.53
-2.400 3.787 .968 -13.73 8.93
(J) Kelompok
M1
M2
M3
Gliben
K-
M2
M3
Gliben
K-
M1
M3
Gliben
K-
M1
M2
Gliben
K-
M1
M2
M3
(I) Kelompok
K-
M1
M2
M3
Gliben
Mean
Difference
(I-J) Std. Error Sig. Lower Bound Upper Bound
95% Confidence Interval
The mean difference is significant at the .05 level.*.

52
Homogeneous Subsets
Selisih GD post 1 - pre
Tukey HSDa
5 -11.40
5 -9.00 -9.00
5 -7.60 -7.60
5 -7.20 -7.20
5 .00
.800 .163
KelompokGliben
M3
M2
M1
K-
Sig.
N 1 2
Subset for alpha = .05
Means for groups in homogeneous subsets are displayed.
Uses Harmonic Mean Sample Size = 5.000.a.

53
Oneway
Post Hoc Tests
ANOVA
Selisih GD post 2 - post 1
583.360 4 145.840 8.589 .000
339.600 20 16.980
922.960 24
Between Groups
Within Groups
Total
Sum of
Squares df Mean Square F Sig.
Multiple Comparisons
Dependent Variable: Selisih GD post 2 - post 1
Tukey HSD
3.200 2.606 .736 -4.60 11.00
6.400 2.606 .141 -1.40 14.20
9.200* 2.606 .016 1.40 17.00
14.000* 2.606 .000 6.20 21.80
-3.200 2.606 .736 -11.00 4.60
3.200 2.606 .736 -4.60 11.00
6.000 2.606 .185 -1.80 13.80
10.800* 2.606 .004 3.00 18.60
-6.400 2.606 .141 -14.20 1.40
-3.200 2.606 .736 -11.00 4.60
2.800 2.606 .817 -5.00 10.60
7.600 2.606 .058 -.20 15.40
-9.200* 2.606 .016 -17.00 -1.40
-6.000 2.606 .185 -13.80 1.80
-2.800 2.606 .817 -10.60 5.00
4.800 2.606 .379 -3.00 12.60
-14.000* 2.606 .000 -21.80 -6.20
-10.800* 2.606 .004 -18.60 -3.00
-7.600 2.606 .058 -15.40 .20
-4.800 2.606 .379 -12.60 3.00
(J) Kelompok
M1
M2
M3
Gliben
K-
M2
M3
Gliben
K-
M1
M3
Gliben
K-
M1
M2
Gliben
K-
M1
M2
M3
(I) Kelompok
K-
M1
M2
M3
Gliben
Mean
Difference
(I-J) Std. Error Sig. Lower Bound Upper Bound
95% Confidence Interval
The mean difference is significant at the .05 level.*.

54
Homogeneous Subsets
Selisih GD post 2 - post 1
Tukey HSDa
5 -19.40
5 -14.60 -14.60
5 -11.80 -11.80 -11.80
5 -8.60 -8.60
5 -5.40
.058 .185 .141
Kelompok
Gliben
M3
M2
M1
K-
Sig.
N 1 2 3
Subset for alpha = .05
Means for groups in homogeneous subsets are displayed.
Uses Harmonic Mean Sample Size = 5.000.a.

55
Oneway
Post Hoc Tests
ANOVA
Selisih GD post 3 - post 2
535.040 4 133.760 9.289 .000
288.000 20 14.400
823.040 24
Between Groups
Within Groups
Total
Sum of
Squares df Mean Square F Sig.
Multiple Comparisons
Dependent Variable: Selisih GD post 3 - post 2
Tukey HSD
3.800 2.400 .524 -3.38 10.98
9.800* 2.400 .005 2.62 16.98
9.000* 2.400 .010 1.82 16.18
13.000* 2.400 .000 5.82 20.18
-3.800 2.400 .524 -10.98 3.38
6.000 2.400 .130 -1.18 13.18
5.200 2.400 .232 -1.98 12.38
9.200* 2.400 .008 2.02 16.38
-9.800* 2.400 .005 -16.98 -2.62
-6.000 2.400 .130 -13.18 1.18
-.800 2.400 .997 -7.98 6.38
3.200 2.400 .675 -3.98 10.38
-9.000* 2.400 .010 -16.18 -1.82
-5.200 2.400 .232 -12.38 1.98
.800 2.400 .997 -6.38 7.98
4.000 2.400 .475 -3.18 11.18
-13.000* 2.400 .000 -20.18 -5.82
-9.200* 2.400 .008 -16.38 -2.02
-3.200 2.400 .675 -10.38 3.98
-4.000 2.400 .475 -11.18 3.18
(J) Kelompok
M1
M2
M3
Gliben
K-
M2
M3
Gliben
K-
M1
M3
Gliben
K-
M1
M2
Gliben
K-
M1
M2
M3
(I) Kelompok
K-
M1
M2
M3
Gliben
Mean
Difference
(I-J) Std. Error Sig. Lower Bound Upper Bound
95% Confidence Interval
The mean difference is significant at the .05 level.*.

56
Homogeneous Subsets
Selisih GD post 3 - post 2
Tukey HSDa
5 -25.60
5 -22.40 -22.40
5 -21.60 -21.60
5 -16.40 -16.40
5 -12.60
.475 .130 .524
Kelompok
Gliben
M2
M3
M1
K-
Sig.
N 1 2 3
Subset for alpha = .05
Means for groups in homogeneous subsets are displayed.
Uses Harmonic Mean Sample Size = 5.000.a.

57
Oneway
Post Hoc Tests
ANOVA
Selisih GD post 4 - post 3
582.560 4 145.640 6.584 .002
442.400 20 22.120
1024.960 24
Between Groups
Within Groups
Total
Sum of
Squares df Mean Square F Sig.
Multiple Comparisons
Dependent Variable: Selisih GD post 4 - post 3
Tukey HSD
10.600* 2.975 .015 1.70 19.50
8.000 2.975 .091 -.90 16.90
8.400 2.975 .070 -.50 17.30
14.800* 2.975 .001 5.90 23.70
-10.600* 2.975 .015 -19.50 -1.70
-2.600 2.975 .903 -11.50 6.30
-2.200 2.975 .944 -11.10 6.70
4.200 2.975 .627 -4.70 13.10
-8.000 2.975 .091 -16.90 .90
2.600 2.975 .903 -6.30 11.50
.400 2.975 1.000 -8.50 9.30
6.800 2.975 .190 -2.10 15.70
-8.400 2.975 .070 -17.30 .50
2.200 2.975 .944 -6.70 11.10
-.400 2.975 1.000 -9.30 8.50
6.400 2.975 .238 -2.50 15.30
-14.800* 2.975 .001 -23.70 -5.90
-4.200 2.975 .627 -13.10 4.70
-6.800 2.975 .190 -15.70 2.10
-6.400 2.975 .238 -15.30 2.50
(J) Kelompok
M1
M2
M3
Gliben
K-
M2
M3
Gliben
K-
M1
M3
Gliben
K-
M1
M2
Gliben
K-
M1
M2
M3
(I) Kelompok
K-
M1
M2
M3
Gliben
Mean
Difference
(I-J) Std. Error Sig. Lower Bound Upper Bound
95% Confidence Interval
The mean difference is significant at the .05 level.*.

58
Homogeneous Subsets
Selisih GD post 4 - post 3
Tukey HSDa
5 -26.40
5 -22.20
5 -20.00 -20.00
5 -19.60 -19.60
5 -11.60
.190 .070
Kelompok
Gliben
M1
M3
M2
K-
Sig.
N 1 2
Subset for alpha = .05
Means for groups in homogeneous subsets are displayed.
Uses Harmonic Mean Sample Size = 5.000.a.

59
Oneway
Post Hoc Tests
ANOVA
Selisih GD post 4 - pre
7478.240 4 1869.560 38.421 .000
973.200 20 48.660
8451.440 24
Between Groups
Within Groups
Total
Sum of
Squares df Mean Square F Sig.
Multiple Comparisons
Dependent Variable: Selisih GD post 4 - pre
Tukey HSD
24.800* 4.412 .000 11.60 38.00
31.800* 4.412 .000 18.60 45.00
35.600* 4.412 .000 22.40 48.80
53.200* 4.412 .000 40.00 66.40
-24.800* 4.412 .000 -38.00 -11.60
7.000 4.412 .522 -6.20 20.20
10.800 4.412 .143 -2.40 24.00
28.400* 4.412 .000 15.20 41.60
-31.800* 4.412 .000 -45.00 -18.60
-7.000 4.412 .522 -20.20 6.20
3.800 4.412 .908 -9.40 17.00
21.400* 4.412 .001 8.20 34.60
-35.600* 4.412 .000 -48.80 -22.40
-10.800 4.412 .143 -24.00 2.40
-3.800 4.412 .908 -17.00 9.40
17.600* 4.412 .006 4.40 30.80
-53.200* 4.412 .000 -66.40 -40.00
-28.400* 4.412 .000 -41.60 -15.20
-21.400* 4.412 .001 -34.60 -8.20
-17.600* 4.412 .006 -30.80 -4.40
(J) KelompokM1
M2
M3
Gliben
K-
M2
M3
Gliben
K-
M1
M3
Gliben
K-
M1
M2
Gliben
K-
M1
M2
M3
(I) KelompokK-
M1
M2
M3
Gliben
Mean
Difference
(I-J) Std. Error Sig. Lower Bound Upper Bound
95% Confidence Interval
The mean difference is significant at the .05 level.*.

60
Homogeneous Subsets
Selisih GD post 4 - pre
Tukey HSDa
5 -82.80
5 -65.20
5 -61.40
5 -54.40
5 -29.60
1.000 .143 1.000
KelompokGliben
M3
M2
M1
K-
Sig.
N 1 2 3
Subset for alpha = .05
Means for groups in homogeneous subsets are displayed.
Uses Harmonic Mean Sample Size = 5.000.a.

61
BIODATA MAHASISWA
Identitas
Nama : Ahmad Agus Salim
NIM : G2A007015
TTL : Pekanbaru, 10 Desember 1988
Jenis Kelamin : Laki-laki
Alamat : Taman Kradenan Asri B4A, Semarang
Nomor HP : 085640212372
E-mail : [email protected]
Riwayat Pendidikan Formal
1. SD N 08 Salatiga : Lulus tahun 2001
2. SMP N 04 Salatiga : Lulus tahun 2004
3. SMA N 02 Salatiga : Lulus tahun 2007
4. FK Undip : Masuk tahun : 2007