D6.13 Assessment planning - Manutelligence€¦ · 4.1.2 ECOGRAI ..... 15 4.1.3 Business benefit...
40
Copyright Manutelligence Consortium 2015-2018 Manutelligence N°636951 Horizon 2020 Acronym: Manutelligence Project No: 636951 Call: H2020-FoF-2014 Topic: FoF-05 - Innovative product-service design using manufacturing intelligence Type of action: RIA Duration: 01.02.2015 - 31.01.2018 D6.13 – Assessment planning Type Deliverable Document ID: D6.13 – Assessment planning Workpackage: WP6 Leading partner: VTT Author(s): Iris Karvonen, Kim Jansson, Tapani Ryynänen – VTT + all use cases & supporting partners Dissemination level: Public Status: Released Date: 24.1.2017 Version: 2.0
Transcript of D6.13 Assessment planning - Manutelligence€¦ · 4.1.2 ECOGRAI ..... 15 4.1.3 Business benefit...

Copyright Manutelligence Consortium 2015-2018 Manutelligence N°636951
Horizon 2020
Acronym: Manutelligence
Project No: 636951
Call: H2020-FoF-2014
Topic: FoF-05- Innovative product-service design using manufacturing intelligence
Type of action: RIA
Duration: 01.02.2015 - 31.01.2018
D6.13 – Assessment planning
Type Deliverable
Document ID: D6.13 – Assessment planning
Workpackage: WP6
Leading partner: VTT
Author(s): Iris Karvonen, Kim Jansson, Tapani Ryynänen –
VTT + all use cases & supporting partners
Dissemination level: Public
Status: Released
Date: 24.1.2017
Version: 2.0
Public
Copyright Manutelligence Consortium 2015-2018 Page 2 / 40
Versioning and contribution history
Version Description Contributors
0.1 28.11.16 Table of Content, draft section 4. IK, KJ
0.2 15.12.16 Results of Lugano workshop added + other
contributions
IK, all use cases and supporting
partners
0.3 22.12.16 new chapters added TR, KJ, IK
1.0 12.1.17 completed and modified version for peer review IK, KJ
2.0 Final version; peer review comments handled IK, KJ
Reviewers
Name Affiliation
Laura Cattaneo, Daniele Cerri Polimi
Deliverable Peer Review Summary
ID Comments Addressed ()
Answered (A)
1 Some minor comments
addressed
The comment about deliverable number: The number
D6.13 is correct according to Research Participant
Portal.
2
3
4
5

Public
Copyright Manutelligence Consortium 2015-2018 Page 3 / 40
Table of Contents
Executive summary ........................................................................................................... 5
Abbreviations ................................................................................................................... 6
1 Introduction and scope of this deliverable ................................................................. 7
1.1 Objectives .................................................................................................................... 7
1.2 Relation to other work packages ................................................................................... 8
2 Use case Assessment scope in Manutelligence ........................................................... 9
3 Requirement validation ........................................................................................... 10
3.1 Scope of Requirement validation in Task 6.5 ............................................................... 10
3.2 Validation workshop planning .................................................................................... 10
4 Assessment of Use case Business Benefits ............................................................... 13
4.1 Experience on business benefit assessment in previous projects .................................. 13
4.1.1 Balanced Scorecard ......................................................................................................... 14
4.1.2 ECOGRAI .......................................................................................................................... 15
4.1.3 Business benefit measurement based on process improvements .................................. 17
4.2 Simplified approach for indicator definition in Manutelligence .................................... 20
4.3 Lugano workshop for BPI definition ............................................................................ 22
4.4 First Definition of Business Benefit Indicators ............................................................. 22
4.4.1 Automotive use case ....................................................................................................... 22
4.4.2 Ship use case .................................................................................................................... 23
4.4.3 Fablab use case ................................................................................................................ 23
4.4.4 Smart house use case ...................................................................................................... 24
4.4.5 Summary of indicators ..................................................................................................... 24
4.4.6 Measurement method & process .................................................................................... 25
5 Use case experience – lessons learnt ....................................................................... 26
5.1 Objectives .................................................................................................................. 26
Public
Copyright Manutelligence Consortium 2015-2018 Page 4 / 40
5.2 Experience collection .................................................................................................. 26
6 Defining success of use cases ................................................................................... 27
7 Next steps: Plan for use case assessment activities .................................................. 28
References ...................................................................................................................... 29
Appendix 1: Draft Business Performance Indicators for Use cases .................................... 30
Automotive Case (Ferrari): ...................................................................................................... 30
Ship use case (Meyer) ............................................................................................................. 32
Fablab case (FCIM) ................................................................................................................. 34
Smart House case (Lindbäcks) ................................................................................................. 37
Public
Copyright Manutelligence Consortium 2015-2018 Page 5 / 40
Executive summary
This document describes the plan for the assessment of the 4 use case trials in Manutelligence
project (automotive, ship, fablab, smart house). The deliverable is related to Task T6.5 –
Assessment. The results of the assessment will be later reported in D6.14 Manutelligence
Assessment reporting (M36).
The use case trial assessment includes the following aspects:
- Requirement validation: the solution implementations, the pilots, are checked
against the aggregated requirements formulated in WP1. This validation is different
from that performed in WP1 where the aggregated requirements were validated
against the trial scenarios and original unstructured requirements. In the trial
assessment two dimensions will be used: matching of requirements and assessment
of their importance. The validation will use a workshop approach.
- Assessing business benefits of the use case trials: This is performed using Business
Performance Indicators. As the different trials have different objectives they all need
to define their own indicators. The document represents some approaches for the
business benefit indicator definition used in previous R&D projects. A simplified
version based on trial business objectives is selected to be used in Manutelligence.
The preliminary indicators for each trial are reported, based on a definition in a
specific workshop.
- Accumulation of use case experience, lessons learned and best practice. This will be
collected through questionnaires and/or workshops in the final phase of the project.
The success of the use case trials is assessed as a combination of these three aspects. Finally,
the schedule for the assessment tasks is presented.
Public
Copyright Manutelligence Consortium 2015-2018 Page 6 / 40
Abbreviations
AV Action Variable
BPI Business Performance Indicator
DoA Description of Action
DV Decision Variable
EU FP7 European Commission Framework Program 7
EU H2020 European Commission Horizont 2020-program
LCA Life Cycle Analysis
LCC Life Cycle Cost
PLM Product Lifecycle Management
SLM Service Lifecycle Management
P-S Product-Service
VRM Value Reference Model
WP Work package

Public
Copyright Manutelligence Consortium 2015-2018 Page 7 / 40
1 Introduction and scope of this deliverable
1.1 Objectives
According to the DoA (Manutelligence Description of Actions) the objectives of Task T6.5 –
Assessment are the evaluation and assessment of the Use Case Trials, regarding the following
aspects:
- Harmonising the experimentations, share experiences.
- Assessment - To ensure that the solutions actually meet the user’s needs, the
requirements and specifications were correct in the first place and that the solution
fulfils its intended use when placed in its intended business environment.
- Usage of Business Performance Indicators for assessing business benefits.
- Harmonized accumulation of use case experience, lessons learned and best practice.
In the first phase, the assessment methodology is developed and finally it is used to assess the
success of the use cases.
The first deliverable from this task is the public report D6.13 Manutelligence Assessment
planning, due at month 24 (this report). This deliverable presents the harmonized assessment
and performance measuring system for the use cases and a plan for its implementation in the
next phase.
The second and final deliverable from this task is the confidential report D6.14
Manutelligence Assessment reporting, due at the end of the project, at month 36. The
deliverable D6.14 reports on achievements in the use cases based on the requirement
validation, business benefit indicators and accumulation of use case experience and lessons
learned.
The task 6.5 is part of WP6 Use cases and thus the assessment is focused on the use cases and
how they see the solutions. The first objective of the assessment is to ensure that the solutions
actually meet the users’ needs. This means that the use case pilot implementations are
compared with the requirements identified and processed in WP1 Requirements. The second
objective is to assess the business benefits of the use cases using indicators. The third
objective is to cumulate experience and lessons learnt. The assessment activities should be
harmonized among the use cases, that is: the assessment should be performed with common
processes. This does not, however, mean that all the use cases have the same indicators.
The first results of this task, reported here in this deliverable D6.13, are;
- Methods for validation of requirements in use case implementation (chapter 3).
- Method for the assessment of use case business benefits, using business
performance indicators and first definition of business performance indicators for
each trial (chapter 4).

Public
Copyright Manutelligence Consortium 2015-2018 Page 8 / 40
- Method for use case experience accumulation (chapter 5).
- Next steps and planning till the end of the Task 6.5 (chapter 6).
1.2 Relation to other work packages
The task is highly dependent on the previous deliverables within the same work package WP6
(D6.1, D6.4, D6.7 & D6.10 - Use Case Scenario + Pilot stories and D6.2, D6.5, D6.8 & D6.11
Use case Pilots). The previous reports form the main input for the assessment work. The final
deliverable from WP6 is the D6.14 Manutelligence Assessment, reporting the assessment
results.
The Manutelligence Work Package WP1 “Engineering and business requirements for holistic
P-S development processes in the targeted application sectors”, performed requirement
elicitation based on the use case needs. As a result of this more than 200 unstructured and
heterogeneous requirements were identified. In the next phase the requirements were
processed through structuring and analysis into 20 aggregated requirements. As the final task
of WP1 the aggregated requirements were validated by the use cases against the pilot stories
and use case scenarios. This ended up to 21 aggregated requirements.
The requirements have been used in the technical work packages developing the platform
(WP4), simulation of PLM and SLM interaction (WP2), cross-section collaborative design
(WP3) and decision support for LCA & LCC issues (WP5). As described in D1.1, the
approach of requirement engineering in Manutelligence follows an iterative approach, and
thus the requirements are subject to modification during the development phase. The use case
scenario definition and the requirement elicitation were performed with a wide focus: it was
not the idea to implement all the defined use scenarios but make the selection later in the
project, and also to give space for new ideas coming during the project. In some use cases
new scenarios have emerged during the development.

Public
Copyright Manutelligence Consortium 2015-2018 Page 9 / 40
2 Use case Assessment scope in Manutelligence
As described in DoA the objective of Task 6.5 has three main tasks:
Requirement validation: To ensure that the solutions actually meet the user’s needs,
the requirements and specifications were correct in the first place and that the solution
fulfils its intended use when placed in its intended business environment.
Usage of Business Performance Indicators for assessing business benefits.
Harmonized accumulation of use case experience, lessons learned and best practice.
Requirement validation here is the process of checking that the use case solutions and
Manutelligence platform implementation fulfill the needs identified in WP1 Requirements.
WP1 also included a validation task but in WP1 the aggregated requirements were compared
against the pilot stories and use case scenarios. Even if the task is thus different here, the
main actors performing this validation are again the use case owners. The validation method
is described in Chapter 3.
Manutelligence platform and the pilot solutions are expected to offer the use case companies
business benefits. To assess these, Business Performance Indicators (BPI) will be defined.
The benefits may be linked to increased efficiency in Product-Service (PS) design, bringing
along savings in costs and time. They may mean increased quality and customer satisfaction,
new services and new business income. However, the indicators should be defined at a level
which is closely related to the pilot scenario and not too high at the company level. Probably
the indicator values cannot be derived directly from any system in the piloting phase but they
are more based on the assessment of use case experts. As the different use cases have
different objectives and aim for different business benefits, it is not possible to define BPIs
which are relevant for all the use cases. The method and process for BPI definition as well as
the first indicators are described in chapter 4.
In BPI measurement, the aim is to generate quantitative or semi-quantitative values for the
indicators while in the collection of use case experience the aim is to collect qualitative
information: the experience of the use cases, lessons learned and best practices, if they can be
identified. This information may be partly subjective, opinions and feelings. The approach for
experience collection is described in chapter 5.
Finally the DoA sets up the objective to assess the success of the use cases. The success is
demonstrated as the combination of the three areas: if the requirements are fulfilled, business
benefits good enough and there are positive experiences about the solutions.
Public
Copyright Manutelligence Consortium 2015-2018 Page 10 / 40
3 Requirement validation
3.1 Scope of Requirement validation in Task 6.5
The validation as a concept has been reviewed in Manutelligence D1.3 Requirements
validation. The objective of validation in general is “to ensure that the product actually meets
the user’s needs, the specifications are correct in the first place and the product fulfils its
intended use when placed in the intended environment” [IEEE 2012]. Validation can be
directed towards the final product / software or its preceding specifications. In Manutelligence
task T1.4 the validation was focused on the structured and aggregated requirements against
the needs of the involved use cases. In this task 6.5 the aim is to validate the implemented
solution/ platform using the use case pilots, against the aggregated requirements. These two
tasks constitute the validation “chain”:
T1.4 (D1.3): Validation of aggregated requirements against the original pilot stories and
scenarios.
T6.5 (D6.13-14): Validation of pilot solutions and the platform against the 21 aggregated
requirements.
Thus, with some restrictions it can be assumed that the validation chain leads to the validation
of the final solutions against the original pilot stories. The restrictions include that on one
hand not all scenarios described are implemented and on the other hand new scenarios have
been emerged during the development, both related to the changes in company needs and also
new identified potential of the platform.
In WP1 validation, basically two parallel methods were used: a research partner walk-through
and a workshop of all Manutelligence use case representatives. In the workshop, the end user
groups checked the sufficiency of the requirements using a common methodology, supported
by nominated research partners. Also some new needs of end users were identified.
In Task 6.5 Requirement validation, the solutions or the pilots, are checked against the
requirements. Here the use case partners are in the main role, but to follow a common
process, again support from technology and research partners is needed. The plan is to
perform the validation as a workshop. The workshop method is described in the next chapter.
3.2 Validation workshop planning
In a software development process both the provider and the user have their own opinions
about how the needs should be met with the implemented functionalities of the package.
Sometimes these opinions can be very close to each other, but often, especially in the
beginning of the process, they can differ significantly.
Public
Copyright Manutelligence Consortium 2015-2018 Page 11 / 40
This is often due to real differences but also different terminology and ways to pose a
question or a need makes communication challenging. Thus iterative discussion helps the
negotiating parties to better understand the real meaning behind the words and to understand
the quintessential differences. This iterative discussion has been initiated already in the earlier
requirements validation phases of the Manutelligence project and will continue in Task 6.5.
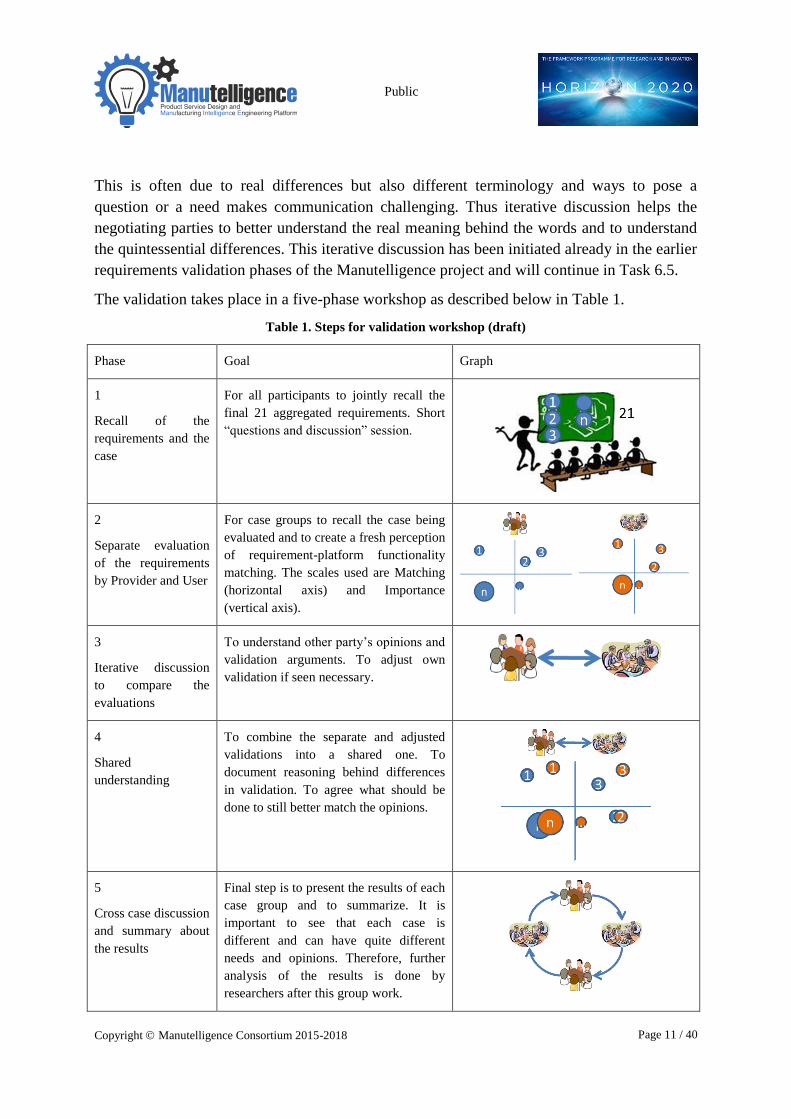
The validation takes place in a five-phase workshop as described below in Table 1.
Table 1. Steps for validation workshop (draft)
Phase Goal Graph
1
Recall of the
requirements and the
case
For all participants to jointly recall the
final 21 aggregated requirements. Short
“questions and discussion” session.
2
Separate evaluation
of the requirements
by Provider and User
For case groups to recall the case being
evaluated and to create a fresh perception
of requirement-platform functionality
matching. The scales used are Matching
(horizontal axis) and Importance
(vertical axis).
3
Iterative discussion
to compare the
evaluations
To understand other party’s opinions and
validation arguments. To adjust own
validation if seen necessary.
4
Shared
understanding
To combine the separate and adjusted
validations into a shared one. To
document reasoning behind differences
in validation. To agree what should be
done to still better match the opinions.
5
Cross case discussion
and summary about
the results
Final step is to present the results of each
case group and to summarize. It is
important to see that each case is
different and can have quite different
needs and opinions. Therefore, further
analysis of the results is done by
researchers after this group work.
Public
Copyright Manutelligence Consortium 2015-2018 Page 12 / 40
The validation is carried out for each use case by a group of people representing the case
owner (e.g. Meyer), platform providers (e.g. Dassault), and support partner. The assessment
is made from the use case viewpoint. Careful documentation is important especially for
tracking and understanding the changes made in validation as well as the reasoning behind.
Two assessment criteria are used. These are Matching (“Is the requirement fulfilled by the
functionalities of the platform?”) and Importance (“How important it is that this requirement
is fulfilled by the platform?”). In the following cross-case discussion, more emphasis is given
to those requirements having high importance.

Public
Copyright Manutelligence Consortium 2015-2018 Page 13 / 40
4 Assessment of Use case Business Benefits
4.1 Experience on business benefit assessment in
previous projects
Performance Indicators (PIs) are used to measure the progress or success of e.g. an
organization, a company, a part of a company or an activity or project. Often PIs are used and
measured several times, at certain interval to detect changes and trends in the development.
Key Performance Indicators (KPIs) are often used to measure the main or top indicators of a
company. KPI can be e.g. ROI (Return on Investment), overall sales, turnover, profit margins
etc. KPIs can be used to evaluate the Key Success Factors.
In a project like Manutelligence the development activities will have a hopefully positive
impact on the performance of the use case company. However the performance of the
company as a whole is influenced also by other internal decisions and activities as well as
factors coming from the outside world, partly out of the control of the company.
Consequently, it is not possible to assess the impact of the Manutelligence alone using high
level KPIs. The impact of Manutelligence development activities cannot simply be isolated
from other events and activities. Instead in Manutelligence there is a need for PIs that are
“closer” to the development activities and the development activities influence the selected PI,
in a more direct way. When PIs are used to assess the business performance they are called
business performance indicators (BPIs). Business performance indicators can be either
quantitative or qualitative. Quantitative indicators can be deployed using numbers while
qualitative indicators are often assessed using textual opinions. In Manutelligence, depending
on availability of data, qualitative, semi-quantitative or quantitative indicators will be used to
assess the business benefits of Manutelligence development activities.
There are several well-known approaches for assessing and measuring business benefits. It
has also been a task in several European projects. In FP7 project FITMAN [FITMAN] a
comprehensive methodology was developed, for verification and validation of the solutions,
in various aspects, coming from the adoption of new software in a number of use case trials.
One of the aspects was business performance using BPIs. In order to find the most suitable
approach, the project analysed in all the 37 most current business performance indicator
methods. It is out of the scope of this deliverable to give a comprehensive state-of-the-art
report on performance indicator methods; instead some of the results of FITMAN analysis are
used here [FITMAN D2.2 2012].
The following sections include short descriptions of three methods that are well known and
have been successfully used in previous projects. They are: Balanced Score Card, ECOGRAI
method, and Value Reference Model (VRM).
These methods were chosen because:
Public
Copyright Manutelligence Consortium 2015-2018 Page 14 / 40
- Balanced Score Card (BSC) is the most known and used by many organizations.
- ECOGRAI method has a specific approach and is based on the model of the
organization. ECOGRAI has some links with BSC.
- Experience of using: VRM used in two projects COIN and MSEE.
4.1.1 Balanced Score Card
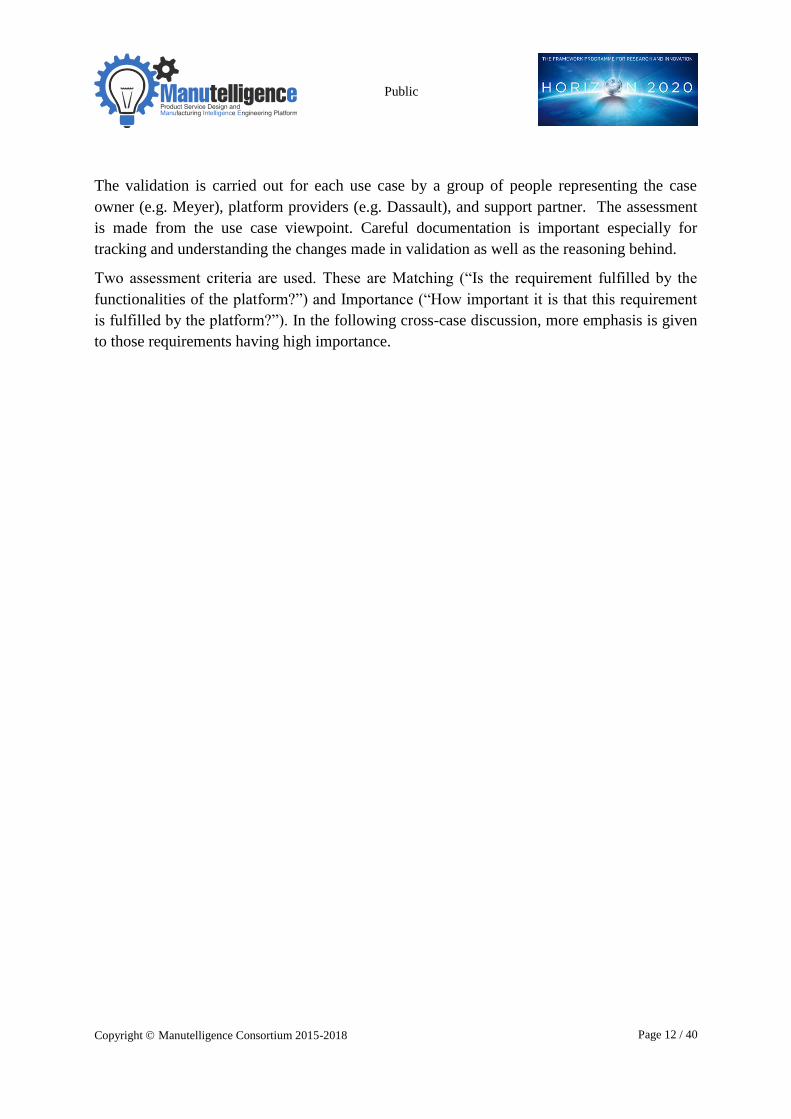
The concept of the Balanced Score Card (BSC) was introduced by Kaplan and Norton in 1992
[Kaplan and Norton 1992]. It focuses on the strategy and the vision rather than on the control.
It provides the means to translate the vision into a list of objectives. For that, the strategy is
translated into a system of performance measures according to four perspectives (Figure 1):
- Financial (relating to the shareholders).
- Customers (to generate the turnover for the fulfilment of the financial objectives).
- Internal Processes (to satisfy the customers and to guarantee the financial output).
- Innovation and Learning (to develop the enterprise capacities to improve for its
viability).
If we succeed, how will we
look to our shareholders?
Financial Perspective
Objectives Measures Targets Initiatives
Customer Perspective
Objectives Measures Targets Initiatives
Internal Perspective
Objectives Measures Targets Initiatives
Learning/Growth Perspective
Objectives Measures Targets Initiatives
To achieve financial objectives, how
must I look to my customers?
To satisfy my customers, at
which processes must I excel?
To excel in processes, how must
my organization learn and improve?
Vision and Strategy
Ca
use
and E
ffe
ct
Vis
ion
Figure 1. The Balanced Score Card [Kaplan and Norton 1992]
The process to reach the performance measurement consists of:
- The development of performance indicators into line with the strategy.
- The communication of the strategy by the deployment of the performance
indicators.
- The strategic objectives measurement.
- The focusing on the key success factors.
- The consideration of the causal relationship between the four perspectives and the
performance indicators (the real keys of the BSC).
The BSC contains a mix of lag and lead indicators. Performance measures that represent the
consequences of actions previously taken are referred to as lag indicators or as key results
Public
Copyright Manutelligence Consortium 2015-2018 Page 15 / 40
indicators. They may focus on results at the end of a time period and characterize historical
performance. Leading Indicators are considered the "drivers" of lagging indicators. There is
an assumed relationship between the two which suggests that improved performance in a
leading indicator will drive better performance in the lagging indicator. For example:
Leading PI: Number of adjusted or changed parts in the products
Lagging PI: % of drop of customer’s complaints or decrease of the Numbers of products
returns.
As mentioned above, Balanced Scorecard has a wide strategic view, maybe too wide to assess
the business benefits of specific scenarios in the platform development. However, the
principles, like measuring the objectives, are suitable also for platform business benefit
assessment: what you assess, is dependent on what you are striving for.
4.1.2 ECOGRAI
ECOGRAI [Doumeingts G., Clave F., Ducq Y. 1995, Bitton M., Doumeingts G. 1990] is a
method to design and to implement Performances Indicator Systems in any kind of
application domains and it is applied with the implication of the decision makers of the
production management systems. ECOGRAI seeks to find a number of customized and
limited indicators in agreement with the objectives of decision makers.
Main characteristics:
- A logical process of analysis / design using a top-down approach, and allowing to
decompose the objectives of the strategic levels into objectives for tactical and
operational levels.
- A concrete participative process for the design and the implementation, creating a
dialogue between the various levels of the hierarchy, and favouring the
identification of indicators by the future users involved in the study: it is a bottom-
up implementation.
- The use of a number of tools and graphic supports: GRAI grids [G. Doumeingts, F.
Marcotte, H. Rojas. 1995], GRAI nets, splitting up diagrams, coherence panels,
specification sheets.
- A coherent distribution of Performances Indicators covering the various functions
and the various decision levels (strategic / tactical / operational).
The logical structured approach of the method consists of six phases (Figure 2) and described
shortly below.

Public
Copyright Manutelligence Consortium 2015-2018 Page 16 / 40
Figure 2: The six phases of the structured approach of ECOGRAI
The first phase: The modelling of the control system and the physical system (controlled
part) of the Enterprise (or a part of the enterprise). The determination of the decision centres
in which the PIs will be defined. It is also necessary to model the physical system by the
processes to define performance indicators at operational level.
The second phase: The identification of the Decision Centre objectives and coherence
analysis by a top-down approach:
- Identifying the Enterprise System objectives.
- Identifying the global objectives of each function belonging to the enterprise.
- Defining the objectives of each Decision Centre inside the functions.
These identifications are based on the notion of contribution: each objective must contribute
to the achievement of the objectives identified at an upper level.
The third phase: The identification of the DC Drivers (Decision Variable (DV) or Action
Variable (AV)) and analysis of the conflicts. This identification must be interpreted as one of
the steps leading to the building of the triplets {Objectives / Drivers / PIs}. This notion of
triplet expresses the controllability principle.
The fourth phase: Identification of the DC Performances Indicators and internal coherence
analysis: it consists in the identification of the PIs which is validated only by an internal

Public
Copyright Manutelligence Consortium 2015-2018 Page 17 / 40
coherence analysis inside each Decision Centre in terms of triplet {Objectives / Drivers / PIs
}. A triplet is coherent if:
- It is composed of one objective, one or several drivers and one or several
performances indicators.
- The performance indicators allow to measure the efficiency of an activity or a set of
activities of the considered function in the process to reach the objective, and they
are influenced by actions on the drivers.
The fifth phase: Design of Performances Indicators information system: it consists in the
specification of each PI. It means to define clearly each indicator with fundamental
parameters. The tool which guides these definitions is the specification sheet for each
indicator which contains:
- The identification of the indicator (name, decision centre, horizon, period).
- The objectives and the drivers related to the indicator.
- The perverse effects which have been identified,
- The identification of the data required for the implementation of the indicator,
- The definition of the associated processing,
- The way of representing the indicators, determined by the future users (using
graphics for most of the time).
The sixth phase: Integration of the PI information system inside the production information
system.
The whole ECOGRAI process with the above steps seems quite complex for assessing the
business benefits of platform developments. In the generic method, the approach is to support
decision making between different actions. However, in Manutelligence the actions are
predefined and the aim is not to select between platform adoption or something else. Thus the
six-step approach should be simplified. This was also done in FP7-FITMAN-project in which
“Simplified ECOGRAI”-method was used to assess business benefits of use case solutions [
FITMAN, Project ID: 604674]
4.1.3 Business benefit measurement based on process
improvements
In EU FP7 project COIN [COIN] the assessment of business benefits of the use cases was
performed in two phases:
In the first phase, the business benefits of the solutions were assessed in the user requirement
analysis phase using three concepts [COIN D6.1.1b 2009]:
- Changes in process parameters, which can be regarded as some kind of variables
named “Process Xs”.
Public
Copyright Manutelligence Consortium 2015-2018 Page 18 / 40
- Improvements in process results/capabilities, which represent the process
performance in the TO-BE use cases perceived by the end users and which are
based on the previous changes in the process parameters. These improvements can
be regarded as “Process Ys”.
- Expected benefits are representing the economic and environmental effects that
should be of positive nature for the end users and are accompanied by (mostly)
measurable performance indicators, which can be regarded as “Business Ys”.
These three concepts underlie the following logic: “Y is a function of X”. Thus the focus was
on process improvements.
In the use case testing phase, a common approach for defining the business benefit indicators
for the process improvements was taken. The approach Value Reference Model (VRM) was
selected; including a process map, metrics dimensions and key performance indicators (KPIs).
The idea was to compare “as-is” and “to-be” metrics for the processes which are supported by
the developed services. The preliminary metrics were checked to see if they were still valid
and how they could be consolidated with the VRM approach.
Value Reference Model is offered by Value Chain Group [VRM 2016]. The model offers a
framework to identify processes, measure and improve performance. The main processes are
Plan, Govern and Execute. These main processes and sub-processes are identified below in
Figure 3. For each sub-process a group of potential metrics, with different dimensions, has
been identified: Cost, Velocity, Asset, Reliability, Adaptability and Innovation.

Public
Copyright Manutelligence Consortium 2015-2018 Page 19 / 40
Figure 3. VRM process map [VRM 2016].
The VRM approach: going from selection of processes and dimensions to metrics was used
also in EU FP7 project MSEE [MSEE] as described in [Wiesner et al. 2014]. The end users
considered the approach understandable and useful. However, it was not as suitable for all
the cases. The best fit was with partners representing supply chains. Additionally, some
benefits may come more from processes affected by the supported processes (for example: the
main benefits of solutions supporting project management are not coming from lower cost of
project management but from projects carried out with improvements in costs, time, quality
and with lower risks). This, maybe too mechanical and still laborious approach was the
reason why VRM was not selected to be used in Manutelligence BPI definition. In
Manutelligence, it could be challenging to present all the benefits as process improvements.

Public
Copyright Manutelligence Consortium 2015-2018 Page 20 / 40
4.2 Simplified approach for indicator definition in
Manutelligence
In Manutelligence a method is needed to assess the business benefits of the use case scenario
developments when using the platform. It is clear that a harmonized indicator system with the
same indicators for all the use cases is not possible as the use cases have different scopes and
varying objectives. Thus it is essential to link the assessment to the objectives of each use
case. This is one principle behind the ECOGRAI approach presented above. In
Manutelligence consortium there is also experience about the application of ECOGRAI in a
simplified form in previous projects. Thus in Manutelligence it was decided to use a
simplified method based on ECOGRAI and its application in EU FP7 project FITMAN [
FITMAN, Project ID: 604674].
The ECOGRAI method involves a step covering the identification of the improvement actions
(Decision Variable (DV) or Action Variable (AV)). In Manutelligence the improvement
actions are already known, that is: the implementation of the Manutelligence Platform in the
use cases. Thus for the Manutelligence application a simplified version of ECOGRAI can be
used, with only three phases. These steps lead to the building of the triplets Objectives /
Drivers / BPIs, Figure 4.
Set objectives
Define actions (= implementation of Manutelligence Platform)
Measure progress
o Select performance indicators
o Definition of success
o Measure progress using performance indicators
Figure 4. Assessment method to be used in Manutelligence.
Setting Objectives
Each of the use case needs to define the objectives that the use case implementation wants to
reach. Good starting points are the Pilot Stories and the Use Case Descriptions (Deliverables
Objectives
Action Measure
Public
Copyright Manutelligence Consortium 2015-2018 Page 21 / 40
D6.1, D6.4, D6.7 & D6.10) that have been produced earlier in Manutelligence. These
documents include the first definition of objectives in Manutelligence, benefits and
preliminary performance indicators. The use case descriptions were further enhanced and
detailed in the Deliverables D6.2, D6.5, D6.8 & D6.11.
Definition of a Business Performance Indicator
As described above BPIs (Business Performance Indicators) measure the business benefits of
actions. It is not realistic to assess how a specific use case scenario may impact the company
high level objectives (like profitability); thus a proper level for the measurement needs to be
identified. A useful BPI has the following characteristics:
- Easy to be interpreted, to put in work, to use or to exploit
- Easily measurable, quantifiable
- Representative of the objective of which it measures
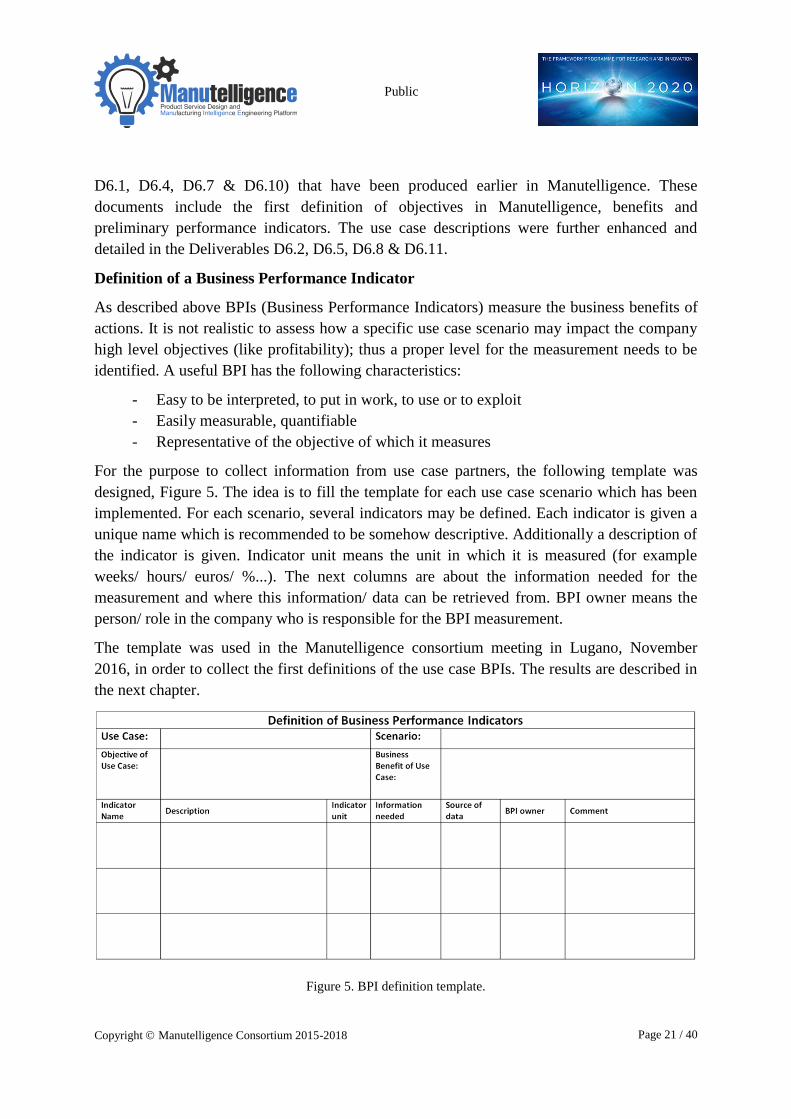
For the purpose to collect information from use case partners, the following template was
designed, Figure 5. The idea is to fill the template for each use case scenario which has been
implemented. For each scenario, several indicators may be defined. Each indicator is given a
unique name which is recommended to be somehow descriptive. Additionally a description of
the indicator is given. Indicator unit means the unit in which it is measured (for example
weeks/ hours/ euros/ %...). The next columns are about the information needed for the
measurement and where this information/ data can be retrieved from. BPI owner means the
person/ role in the company who is responsible for the BPI measurement.
The template was used in the Manutelligence consortium meeting in Lugano, November
2016, in order to collect the first definitions of the use case BPIs. The results are described in
the next chapter.
Figure 5. BPI definition template.
Public
Copyright Manutelligence Consortium 2015-2018 Page 22 / 40
4.3 Lugano workshop for BPI definition
The workshop for Use case Business Performance Indicator definition was organized in a
consortium meeting 30.11.2016 at Supsi in Lugano. The idea was to make the first definition
in this phase and check it later in the project. In the workshop, one group for each use case
was organized: the research and technology partners supported the end users in the task in the
following way:
Meyer + VTT
FabLab + SUPSI & DAPP
Lindbäck + Balance & BIBA
Ferrari + Das & Holonix & Polimi
The template presented above in figure 5 was applied. As all the use cases have more than one
scenario and the scenarios may have different objectives, the BPIs had to be defined
separately for each scenario. To focus on the most important objectives, the goal was to
define max 3 BPIs for the most important scenarios. VTT had prefilled the tables with
objectives and benefits based on the documentation of the Use case scenarios in previous
WP6 deliverables.
Thus the task given for the groups was the following:
- Check the prefilled use cases and scenarios. Are they OK? Is any important use case
missing?
- Check and update the objectives of each scenario.
- Check and update the business benefits of each scenario.
- Define 1-3 BPIs for each scenario.
The results of the workshop are summarized below and the filled templates can be found in
Appendix 1. As it is possible that during the final year the use cases may identify new
important scenarios, the BPIs will be checked again after M30.
4.4 First Definition of Business Benefit Indicators
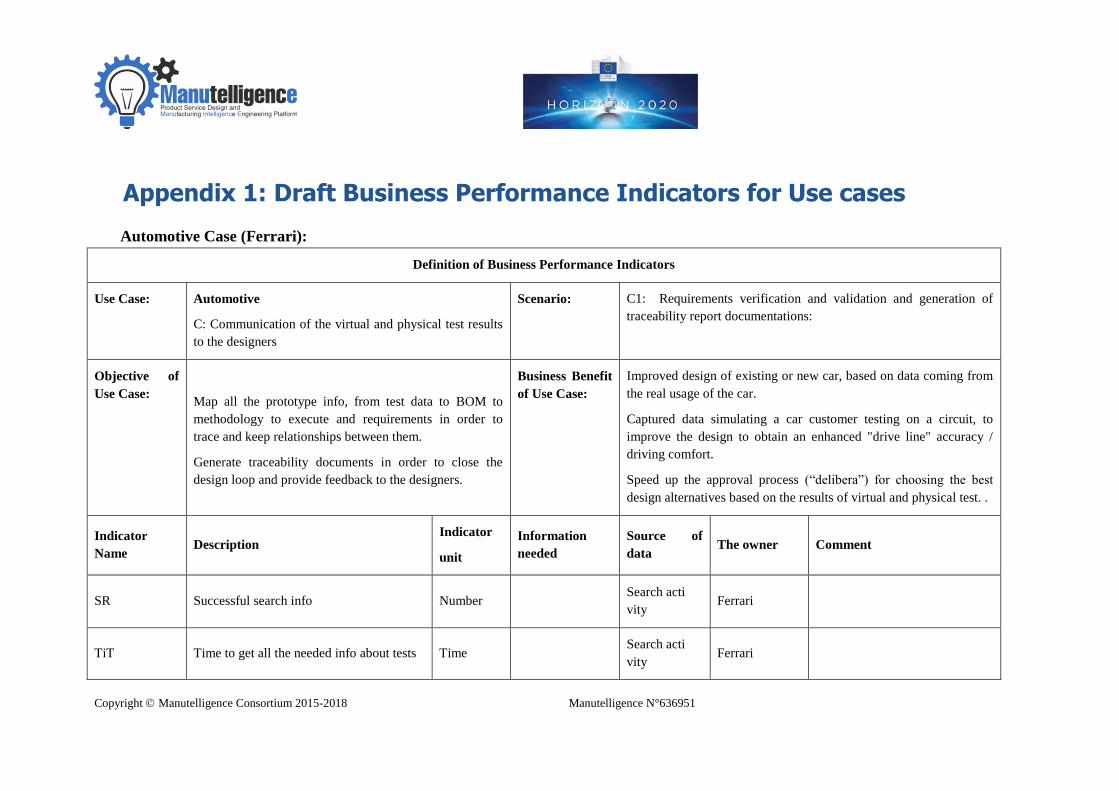
4.4.1 Automotive use case
Two use case scenarios were selected: “Communication of the virtual and physical test results
to the designers” and scenario: “Requirements verification and validation and generation of
traceability report documents”. The main business benefit identified is “Improved design”
(including for example quality and driving comfort) and speed in the design process and data
acquisition. Thus most of the BPIs defined were related to time:
- Time to get all the needed info (in the search activity)
Public
Copyright Manutelligence Consortium 2015-2018 Page 23 / 40
- Time to insert the physical test data into the platform
- Time to find the structured data in the platform
- Time to execute further test using virtual instead of physical test
Other BPIs defined were the following:
- Number of successful search info activities
- Accuracy of the comparison between simulated and physical tests.
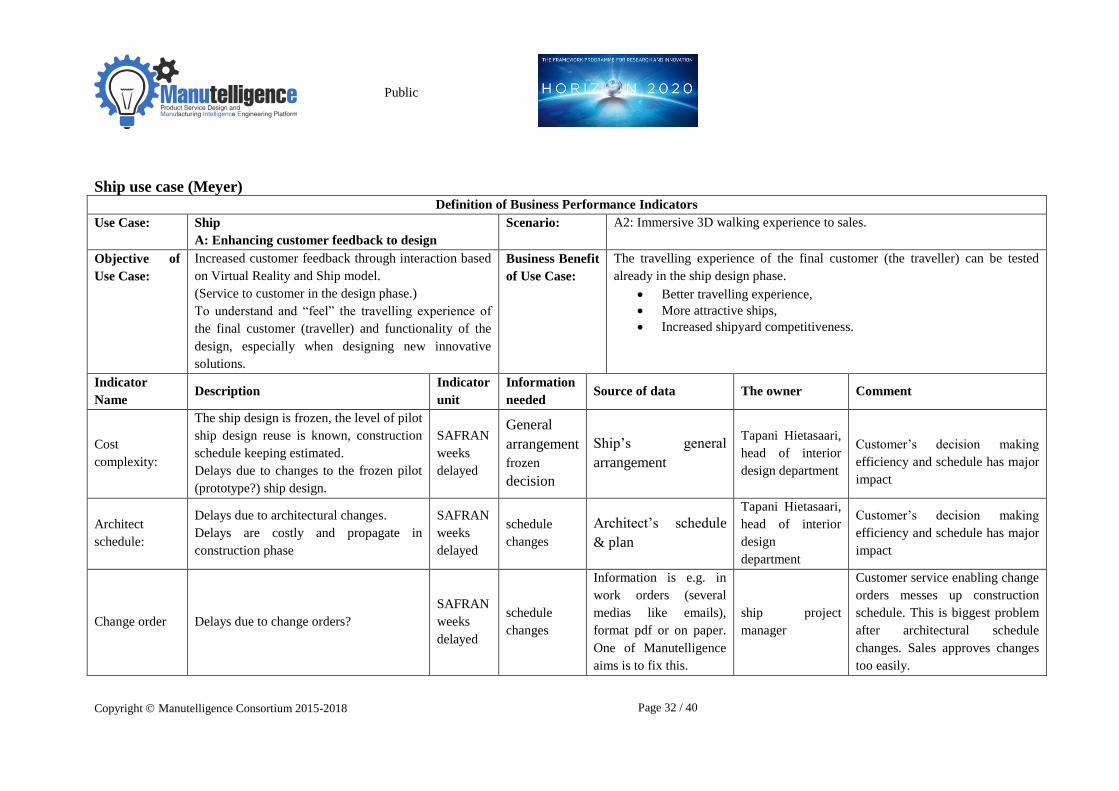
4.4.2 Ship use case
Three use cases and scenarios were selected. Two of them were related to enhancing feedback
to design, one from the customer and another from the production. The third scenario
“Change management” is linked to these two: the aim is to manage the change process based
on the received feedback.
By enhancing the customer feedback during the design the aim is on one hand to design more
attractive ships and on the other hand to prevent delays in the design and manufacturing
phase. The feedback from the production is aimed for identifying collisions or other problems
in the design early enough, from the manufacturing point of view. The change management is
linked to the feedback processes, thus no separate BPIs for it were defined in this phase.
Most of the BPIs defined were related to time delays:
- Cost complexity
- Architectural schedule
- Change order
Additionally BPIs related to design quality were defined:
- Production scores (4-10) to ship model quality
- Number of collisions (errors) in the model
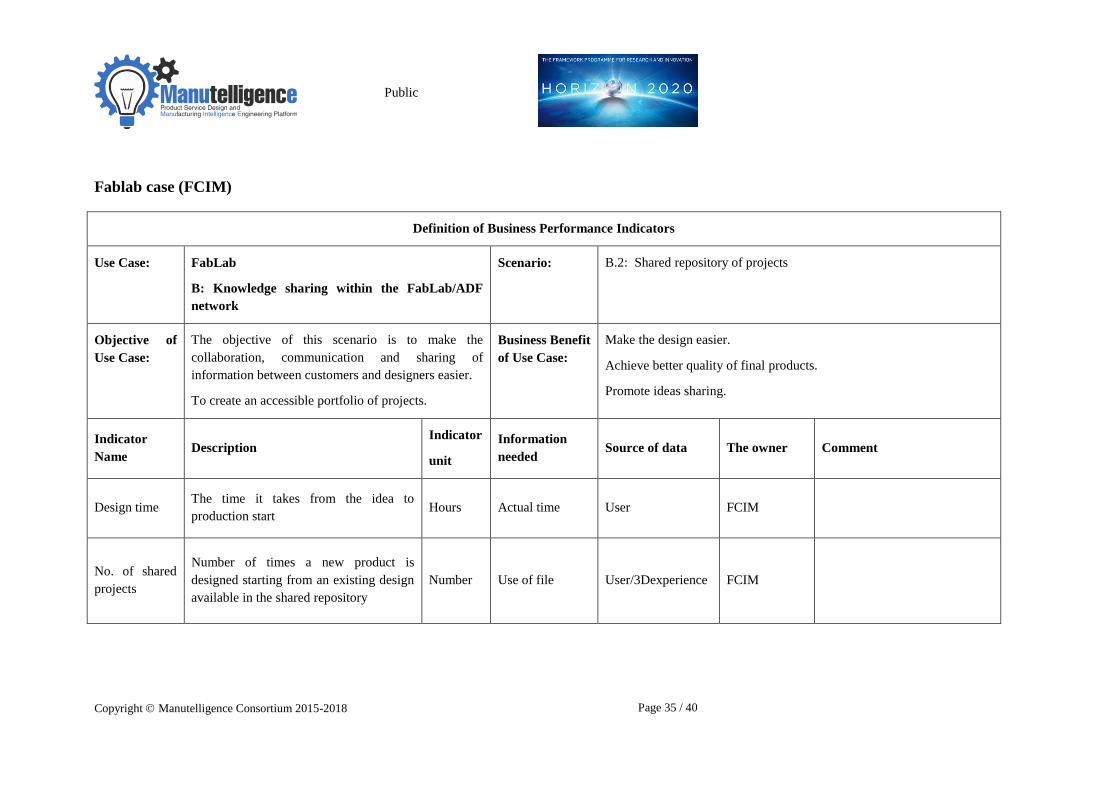
4.4.3 Fablab use case
In Fablab use case the business benefits of three use cases and scenarios were analysed:
“Knowledge sharing within the network” with scenario “Shared repository of projects”, two
scenarios in “Developing the production cycle” and “Sustainability assessment”. The
objectives of the scenarios were quite different from each other, but also here one important
indicator type was time:
- Design time from idea to production start
- Average waiting time of the user for an available machine
- Machine downtime
One BPI is related to Energy consumption and two BPIs to number/ percentage of activities:

Public
Copyright Manutelligence Consortium 2015-2018 Page 24 / 40
- Number of shared projects
- Percentage of projects launching the sustainability assessment
4.4.4 Smart house use case
The smart house use case is focused on two use cases and three scenarios: “Design and
production support” – “Condition monitoring for product feedback and failure management
improvement” and “Service for smart home end users” with two scenarios: “Consumption
data monitoring to optimise energy consumption according to the individual lifestyle” and
“Offer of new services for living as an additional business area”. The BPI types are multiple,
related to time, costs, quality and number of events:
- Number of failure service events
- Costs of damages
- Reaction time for critical events
- Energy delta: difference between design and actual values
- Number of complaints from tenants
- Comfort level, including different physical measurements
- Income per costs of new services
4.4.5 Summary of indicators
The Lugano workshop for BPI definition ended up with 23 BPIs, each use case having its
own indicators, because of different business objectives. The use cases will check the
indicators again after M30, in the final phase of the project as it is assumed that at that time all
the scenarios implemented are known and there are no more any big changes.
The indicators defined were related to different types according to Table 2 where the numbers
of different types of indicators for each use case are given. The most important type is time.
This is understandable since the availability of the platform and ease of information
management in different phases contributes to shortening the time needed for different
phases. It is clear that efficiency and preventing delays also contributes to cost reduction, even
if only two of the defined indicators are directly related to costs.
Another important BPI type is quality. Quality is very important to reach customer
satisfaction and competitiveness in innovative areas and it is also related to costs. The
platform can help to increase the quality through better design and feedback mechanisms.

Public
Copyright Manutelligence Consortium 2015-2018 Page 25 / 40
Table 2. Number of Use case indicators for each indicator type (as defined in November 2016).
Use case Time Costs Quality Number (of
successful
activity)
Physical
measurement
(energy,
comfort)
Sum
Automotive 4 1 1 6
Ship 3 2 5
Fablab 3 2 5
Smart house 1 2 2 2 7
Sum 11 2 5 3 2 23
4.4.6 Measurement method & process
The template for the BPI definition used in Lugano workshop also included columns to define
the information needed, source of data and the owner of the indicator. Partly these were
defined by the use cases, but they will still need check. Some data is expected to be found at
the Manutelligence platform, for some company’s own existing tools were identified.
Sometimes the final user may be the source of information.
As a whole, the availability of the data is always challenging when defining indicators, and as
the use case solutions are at the level of demos and prototypes, the measurements cannot
usually be taken from any systems during the project. Thus assessment based on expected
improvements in the future are probably needed.

Public
Copyright Manutelligence Consortium 2015-2018 Page 26 / 40
5 Use case experience – lessons learnt
5.1 Objectives
In R&D projects, like Manutellligence, from the use case viewpoint, it is important not just to
develop the pilots, but to be able to learn from the pilot implementation and experimentation.
The experience can be used by different stakeholders:
- The technology providers can use it to develop the platform and the tools further
and to bring the new functionalities to market.
- The use cases can learn about the benefits, suitability and challenges of the platform
and what is needed to implement it in full scale in the company.
- Companies outside the project can learn about potential for new practices and
solutions.
- Research partners can use the experience to identify new topics that require
research.
To make full benefit of the experience, it is not enough to report it as a Manutelligence
deliverable D6.14. Also, it should be useful to be disseminated through public use case
success stories, conference presentations and research papers (WP8).
5.2 Experience collection
From the viewpoint of use case assessment different types of experience can be seen. The
experience may be related to the use case solutions provided by Manutelligence platform.
Different dimensions can be used, like suitability for the company, technological
performance, usability, ease of implementation, level of innovation, improvement proposals,
identification of needs in upscaling the solution etc. Another viewpoint is the Manutelligence
process for use case development, from requirements and scenarios to pilots and the
experience gained in the process.
Two methods for experience collection will be used:
- Questionnaires where opinions of the partners are collected for pre-defined
questions in a semi-structured way. The information may be collected either through
interviews or as written. Part of the questionnaires may be anonymous.
- Experience workshop, which may also be an event to discuss the findings from
questionnaires.

Public
Copyright Manutelligence Consortium 2015-2018 Page 27 / 40
6 Defining success of use cases
The task T6.5 description in Manutelligence DoA mentions: “the assessment methodology is
used to assess the success of the use cases”. It is clear that there is no single definition of
“success” but it must be defined for each context. How could the success be interpreted for
Manutelligence use cases:
- Achieving the desired outcomes and results: objectives, benefits, functionalities,
solving problems?
- Finishing the project on time and budget?
- Learning new approaches and solutions, getting experience of the potential and
feasibility of P-S platform?
- Creating and strengthening relationships with other organizations which may
support the use case in further developments?
For a H2020 project, schedule and budget are predefined and fixed and most often the
projects are not prolonged. The monitoring of project performance is part of project
management activities and thus it is left out here. The other criteria mentioned above are
already included in the three scope areas of Manutelligence use case assessment:
- Functionalities/ problem solving: validation of solutions against requirements
(chapter 3)
- Achieving objectives and benefits: Business Benefit Indicators (chapter 4)
- Learning and relationships: use case experience (chapter 5)
Thus assessing success in Manutelligence use cases can be seen as a combination of these
three aspects.

Public
Copyright Manutelligence Consortium 2015-2018 Page 28 / 40
7 Next steps: Plan for use case assessment
activities
Draft plan for the assessment is presented in Table 3. The three main scopes of assessment
are organized to be performed step by step. The current understanding is that the requirement
validation could be the first task and the assessment of the BPI values and experience
collection could take place in parallel. Finally the results are consolidated into D6.14
Manutelligence Assessment reporting, due M36.
The roles of the partners in the assessment continue the same as before in WP6. Thus also in
the assessment phase the use case partners are supported by the technical and research
partners in the following way:
Ferrari + Das & Holonix & Polimi
Meyer + VTT
FabLab + SUPSI & DAPP
Lindbäck + Balance & BIBA
Table 3. Assessment plan
M23
-24
M25
-26
M27
-28
M29
-30
M31
-32
M33
-34
M35
-36
T6.5 Assessment
Assessment planning; D6.13 released
First BPI definition & checking
BPI measurement
Requirements validation (workshop)
Experience collection
Consolidation to D6.14

Public
Copyright Manutelligence Consortium 2015-2018 Page 29 / 40
References
Bitton M., Doumeingts G., (1990), "Conception de systèmes de mesures de performances : la méthode
ECOGRAI", ECOSIP, Gestion industrielle et mesure économique, approches et applications nouvelles,
Economica , pp. 251-274.
COIN D6.1.1b, 2009, COIN Deliverable D6.1.1b, 2nd User Requirements Analysis for EI and EC. Available at:
http://analytics.ijs.si/~mitja/Courses/Coin_deliverables/COIN_D6.1.1b_Final_UR_analysis_for_EI_and_EC.pdf
COIN, Project ID: 216256 Funded under FP7-ICT, COllaboration and INteroperability for networked
enterprises. http://cordis.europa.eu/project/rcn/85550_en.html
Doumeingts G., Clave F. and Ducq Y., (1995), ECOGRAI - A method to design and to implement Performance
Measurement Systems for industrial organizations - Concepts and application to the Maintenance function, in
Benchmarking — Theory and Practice. A. Rolstadås (ed.), Springer Science+Business Media New York 1995
Doumeingts, G., Marcotte F., Rojas, H. GRAI Approach : A Methodology for Re-Engineering the
Manufacturing Enterprise, in Re-engineering the Enterprise, Proceedings of the IFIP TC5/WG5.7 Working
Conference on Re-engineering the Enterprise, Galway, Ireland, 1995, ISBN: 978-1-4757-6387-4
FITMAN, Project ID: 604674, Funded under: FP7-ICT, Future Internet Technologies for MANufacturing.
http://cordis.europa.eu/project/rcn/109803_en.html
FITMAN D2.2, FITMAN Deliverable D2.2, Verification & Validation, Business and Technical Indicators.
Available at: http://www.fitman-fi.eu/resources/deliverables.
IEEE. “1012-2012 - IEEE Standard for System and Software Verification and Validation.” 2012.
Kaplan, R. S., Norton, D. P. The Balanced Scorecard - Measures that drive performance," Harvard Business
Report, January-February 1992.
MSEE Project ID: 284860 Funded under: FP7-ICT , Manufacturing SErvice Ecosystem.
http://cordis.europa.eu/project/rcn/100080_en.html
VRM Model http://www.value-chain.org/vrm, accessed 23.11.2016
Wiesner S., Guglielmina, C., Gusmeroli, S., Doumeingts, G. (Eds.). 2014 Manufacturing Service Ecosystem.
Achievements of the European 7th Framework Programme FoF-ICT Project MSEE: ISBN 978-3-95886-003-2
Copyright Manutelligence Consortium 2015-2018 Manutelligence N°636951
Appendix 1: Draft Business Performance Indicators for Use cases
Automotive Case (Ferrari):
Definition of Business Performance Indicators
Use Case: Automotive
C: Communication of the virtual and physical test results
to the designers
Scenario: C1: Requirements verification and validation and generation of
traceability report documentations:
Objective of
Use Case:
Map all the prototype info, from test data to BOM to
methodology to execute and requirements in order to
trace and keep relationships between them.
Generate traceability documents in order to close the
design loop and provide feedback to the designers.
Business Benefit
of Use Case:
Improved design of existing or new car, based on data coming from
the real usage of the car.
Captured data simulating a car customer testing on a circuit, to
improve the design to obtain an enhanced "drive line" accuracy /
driving comfort.
Speed up the approval process (“delibera”) for choosing the best
design alternatives based on the results of virtual and physical test. .
Indicator
Name Description
Indicator
unit
Information
needed
Source of
data The owner Comment
SR Successful search info Number Search acti
vity Ferrari
TiT Time to get all the needed info about tests Time Search acti
vity Ferrari

Public
Copyright Manutelligence Consortium 2015-2018 Page 31 / 40
Definition of Business Performance Indicators
Use Case: Automotive
C: Communication of the virtual and physical test results
to the designers
Scenario: C1: Requirements verification and validation and generation of
traceability report documentations:
Objective of
Use Case: Physical test data acquisition IoT driven, elaboration and
sharing saving automatically in enterprise platform.
Give feedback to the design process through comparison
between virtual model and experimental tests, leveraging
on the possibility to virtually simulate the mechanism
behaviour in different conditions.
Implementation of a decision support tool for choosing
the best design alternatives based on the results of virtual
and physical test.
Business Benefit
of Use Case:
Improved design of existing or new car, based on data coming from
the real usage of the car.
Captured data simulating a car customer testing on a circuit, to
improve the design to obtain an enhanced "drive line" accuracy /
driving comfort.
.
Indicator
Name Description
Indicator
unit
Information
needed
Source of
data The owner Comment
TtoINS Time to insert the physical test data into the
enterprise platform Time Test execution Ferrari
TtoFND Time to find the structured data into the
platform Time
Search data
into the
Platform
Ferrari
TtoSIM Time to execute further test using virtual
instead of physical object Time
Simulation
analyst Ferrari
ACC Accuracy of the comparison between
simulated and physical test
Standard
deviation Platform
Public
Copyright Manutelligence Consortium 2015-2018 Page 32 / 40
Ship use case (Meyer) Definition of Business Performance Indicators
Use Case: Ship
A: Enhancing customer feedback to design
Scenario: A2: Immersive 3D walking experience to sales.
Objective of
Use Case:
Increased customer feedback through interaction based
on Virtual Reality and Ship model.
(Service to customer in the design phase.)
To understand and “feel” the travelling experience of
the final customer (traveller) and functionality of the
design, especially when designing new innovative
solutions.
Business Benefit
of Use Case:
The travelling experience of the final customer (the traveller) can be tested
already in the ship design phase.
Better travelling experience,
More attractive ships,
Increased shipyard competitiveness.
Indicator
Name Description
Indicator
unit
Information
needed Source of data The owner Comment
Cost
complexity:
The ship design is frozen, the level of pilot
ship design reuse is known, construction
schedule keeping estimated.
Delays due to changes to the frozen pilot
(prototype?) ship design.
SAFRAN
weeks
delayed
General
arrangement
frozen
decision
Ship’s general
arrangement
Tapani Hietasaari,
head of interior
design department
Customer’s decision making
efficiency and schedule has major
impact
Architect
schedule:
Delays due to architectural changes.
Delays are costly and propagate in
construction phase
SAFRAN
weeks
delayed
schedule
changes
Architect’s schedule
& plan
Tapani Hietasaari,
head of interior
design
department
Customer’s decision making
efficiency and schedule has major
impact
Change order Delays due to change orders?
SAFRAN
weeks
delayed
schedule
changes
Information is e.g. in
work orders (several
medias like emails),
format pdf or on paper.
One of Manutelligence
aims is to fix this.
ship project
manager
Customer service enabling change
orders messes up construction
schedule. This is biggest problem
after architectural schedule
changes. Sales approves changes
too easily.

Public
Copyright Manutelligence Consortium 2015-2018 Page 33 / 40
Definition of Business Performance Indicators
Use Case: Ship
B: Intelligent use of ship model for manufacturing
Scenario: B1: Easy-to-use 3D walking experience to floor level
(Linking production feedback to ship model)
Objective of
Use Case:
Ensuring that the feedback from production reaches the
design fast enough and that the feedback is handled
properly.
Business Benefit
of Use Case:
In the manufacturing phase, better management of a change request
from shipyard about a component of current and next ships.
Indicator
Name Description
Indicator
unit
Information
needed
Source of
data The owner Comment
Model Quality Production gives feedback/scores to design
about the quality of ship model. 4-10 Excel data Excel
Ship area
production
planning
coordinators.
This feedback process has been
started as part of Manutelligence
project.
Collision
Number of collision in model (e.g. between
HVAC systems and cable racks at design
area borders)
Collision detection (like between HVAC
models). An existing quality tool finds the
number of errors and wrong material.
quantity Final report,
Excel data
Design
quality tool
Atte Peltola,
design quidance

Public
Copyright Manutelligence Consortium 2015-2018 Page 34 / 40
Definition of Business Performance Indicators
Use Case: Ship
A-B-D: Change management
Scenario: Change management and documents management
Objective of
Use Case:
The use case supports the process of design change when
a need for it has been identified.
Based on a need a change issue is created. In different
life cycle phases the change process may be different. In
the operation phase the change issue may be related to
future “sister” ships.
Business Benefit
of Use Case:
Improved communication
Indicator
Name Description
Indicator
unit
Information
needed
Source of
data The owner Comment
See two previous tables
Public
Copyright Manutelligence Consortium 2015-2018 Page 35 / 40
Fablab case (FCIM)
Definition of Business Performance Indicators
Use Case: FabLab
B: Knowledge sharing within the FabLab/ADF
network
Scenario: B.2: Shared repository of projects
Objective of
Use Case:
The objective of this scenario is to make the
collaboration, communication and sharing of
information between customers and designers easier.
To create an accessible portfolio of projects.
Business Benefit
of Use Case:
Make the design easier.
Achieve better quality of final products.
Promote ideas sharing.
Indicator
Name Description
Indicator
unit
Information
needed Source of data The owner Comment
Design time The time it takes from the idea to
production start Hours Actual time User FCIM
No. of shared
projects
Number of times a new product is
designed starting from an existing design
available in the shared repository
Number Use of file User/3Dexperience FCIM

Public
Copyright Manutelligence Consortium 2015-2018 Page 36 / 40
Definition of Business Performance Indicators
Use Case: FabLab
C: Developing the production cycle
Scenario: C4: Estimation of time and costs of production
C5: Statistics about use of machines
Objective of
Use Case:
The objective of this scenario is to make the
Manutelligence platform capable of supporting
production stages, being capable of gathering real data
of digital manufacturing machinery and to share the
data with the Fablab/ADF operators and/or with the
customers.
When the production cycle is defined, the
customer/user is provided with the estimation of the
production time and production cost.
Data related to the production cycle are stored in the
system so that it is possible to carry out analysis about
the use of machines.
Business Benefit
of Use Case:
Easier development of the production cycle.
Identification of resources to be used and their setting.
With the production data, it is possible to make statistics about the
most used machines, allowing the manager of the Fablab/ADF to
get better comprehension of his/her clients.
With this information, the manager can plan more activities related
to the usage of the most demanded machines.
Indicator
Name Description
Indicator
unit
Information
needed
Source of
data The owner Comment
Average
waiting time
The time the user has to wait for having
the machine available hours
Status of
machines/duration
of tasks
3D experience FCIM
Downtime Number of hours machines are not
available due to failures or stops hours Status of machines Technicians FCIM
Energy
consumption Energy consumed by machines Kwh
Energy
consumption 3D experience FCIM

Public
Copyright Manutelligence Consortium 2015-2018 Page 37 / 40
Definition of Business Performance Indicators
Use Case: FabLab
E: Sustainability assessment
Scenario: E1: Evaluation of environmental impact
E2: Life cycle cost analysis
E3: Comparison of alternative concepts
Objective of
Use Case:
The purpose of this use case is to integrate into the
design process sustainability considerations (LCA and
LCC) aimed at making designers more aware of
environmental and economic issues when designing
and manufacturing products in a Fablab/ADF.
Providing the designers with indicators that reflect the
environmental impact of the product designed.
Providing the designers with economic perspectives.
Provides data in (almost) real time so that it is possible
to compare different concepts of the same product on
the basis of its sustainability impacts.
Business Benefit
of Use Case:
Increasing the level of sustainability of the developed products.
Increase awareness of sustainability impacts of public.
Indicator
Name Description
Indicator
unit
Information
needed
Source of
data The owner Comment
Assessment
usage
Percentage of projects launching the
assessment %
Number of opening
of the assessment
tools
3D experience FCIM

Public
Copyright Manutelligence Consortium 2015-2018 Page 38 / 40
Smart House case (Lindbäcks)
Definition of Business Performance Indicators
Use Case: Smart House
B: Design and production support
Scenario: B‐1: Condition monitoring for product feedback and failure
management improvement
Objective of
Use Case:
Collect use-data throughout the life cycle to improve the
next generation of smart homes based on the real
measurements.
Improve failure management by collecting data from
more sensors at different locations in the apartment.
Monitor tenants attendance in the flat to optimize the
ventilation utilization, which means that the ventilation
can be reduced when the tenants are out of the apartment
for a longer period of time.
Business Benefit
of Use Case:
Improve quality of the houses.
Extend house life-time by faster reaction of technical -problems.
Reduced energy consumption by influencing the end users.
Indicator
Name Description
Indicator
unit
Information
needed
Source of
data The owner Comment
Events Events to be recognised (request for
repair, amounts of service activities, etc.) Number
Amount of event
reports
Service
reports LIND
Insurance costs Costs for repair of damages (e.g. water
leakages) €
Invoices for
damage repairs Invoices LIND
The higher the costs for
damage repairs the higher the
insurance fee
Reaction time Reaction time for critical events (e.g.
water leakage) hours
Time between the
critical event is
recognised and the
damage is repaired
Leakage
Measurements LIND
The faster the reaction the less
is the repair effort

Public
Copyright Manutelligence Consortium 2015-2018 Page 39 / 40
Definition of Business Performance Indicators
Use Case: Smart House
C: Service for smart home end users
Scenario: C-1: Consumption data monitoring to optimise energy
consumption according to the individual lifestyle
Objective of
Use Case:
Integrate energy consumption data into the
Manutelligence database for cross-data analysis
(compare measurement of similar apartment at different
sites).
Easy access to energy consumption monitoring for the
customer including forecast via web user interface.
Collect use-data throughout the life cycle for long term
evaluations.
Business Benefit
of Use Case:
Develop future flats and building designs by using real measured data
instead of assumptions.
Better calculation of e.g. the energy demand of an apartment than
theoretical assumption can do.
Optimise insulations in selected areas of the apartment might be
possible.
Indicator
Name Description
Indicator
unit
Information
needed
Source of
data The owner Comment
Energy delta Delta between design specification and
actual measurement
Energy
data
(temp.
etc.)
Temperature &
energy
calculation
Energy
measurements
LIND &
tenant
Number of
complains Complains from the tenants Number
Complains
reports
Facility
management
reports
LIND
Comfort level Calculate the operative comfort level and
compare it with the measurements
Physical
units
Noise, smell,
draft, vibration,
temperature loss
Energy
measurements
Public
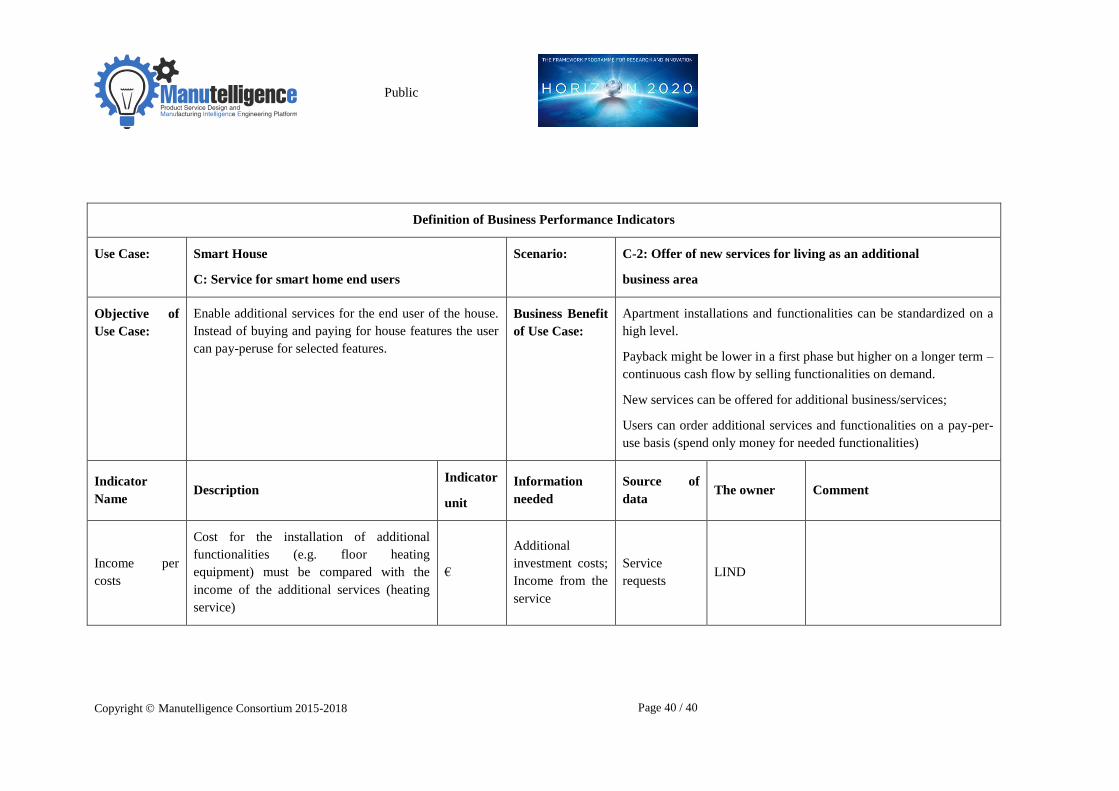
Copyright Manutelligence Consortium 2015-2018 Page 40 / 40
Definition of Business Performance Indicators
Use Case: Smart House
C: Service for smart home end users
Scenario: C-2: Offer of new services for living as an additional
business area
Objective of
Use Case:
Enable additional services for the end user of the house.
Instead of buying and paying for house features the user
can pay-peruse for selected features.
Business Benefit
of Use Case:
Apartment installations and functionalities can be standardized on a
high level.
Payback might be lower in a first phase but higher on a longer term –
continuous cash flow by selling functionalities on demand.
New services can be offered for additional business/services;
Users can order additional services and functionalities on a pay-per-
use basis (spend only money for needed functionalities)
Indicator
Name Description
Indicator
unit
Information
needed
Source of
data The owner Comment
Income per
costs
Cost for the installation of additional
functionalities (e.g. floor heating
equipment) must be compared with the
income of the additional services (heating
service)
€
Additional
investment costs;
Income from the
service
Service
requests LIND
![Service Performance Assessment and Governance - …scss.sk/dvd_kega_037_stu_4_2012/2013/VÝSTUPY Z VLASTNEJ VEDE… · implementation of PIs, such as: ECOGRAI, IPMS and DPMS [2],](https://static.fdocuments.in/doc/165x107/5b98c64509d3f2b16c8c734f/service-performance-assessment-and-governance-scssskdvdkega037stu420122013vystupy.jpg)