Visual Impact Risk Assessment and Mitigation Mapping System for ...

Grant Agreement N°: 642242
Project Acronym: CARISMA
Ref. Ares(2017)1566281 - 23/03/2017
D5.1: Report on climate change mitigation
policy mapping and interaction
Project Coordinator: RU
Work Package 5 Lead Organisation: SEI
February 2017
Authors: Stefan Bößner (SEI), Harro van Asselt (SEI), Gwen-Jiro Clochard (I4CE), Emilie
Alberola (I4CE), Andreas Türk (University of Graz), Niki-Artemis Spyridakis (UPRC), Noriko
Fujiwara (CEPS), Wytze van der Gaast (JIN)
The sole responsibility for the content of this report lies with the authors. It does
not necessarily reflect the opinion of the European Union. Neither the EACI nor the
European Commission are responsible for any use that may be made of the
information contained therein.

Co-funded by the H2020 Programme of the EU
Grant Agreement no.: 642242
PREFACE
The CARISMA project (“Coordination and Assessment of Research and Innovation in
Support of climate Mitigation Options”) intends, through effective stakeholder consultation
and communication leading to improved coordination and assessment of climate change
mitigation options, to benefit research and innovation efficiency, as well as international
cooperation on research and innovation and technology transfer.
Additionally, it aims to assess policy and governance questions that shape the prospects
of climate change mitigation options and discuss the results with representatives from the
target audiences to incorporate what can be learned for the benefit of climate change
mitigation.
Knowledge gaps will be identified for a range priority issues related to climate change
mitigation options and climate policy making in consultation with stakeholders.
PROJECT PARTNERS
No Participant Name Short Name Country Code
CO1 Radboud University RU NL
CB2 University of Piraeus Research Center UPRC EL
CB3 JIN Climate and Sustainability JIN NL
CB4 Institute for Climate Economics I4CE FR
CB5 University of Graz UNI Graz AT
CB6 Stockholm Environment Institute SEI SE
CB7 Centre for European Economic Research ZEW DE
CB8 Center for European Policy Studies CEPS BE
CB9 ENVIROS S.R.O. ENVIROS CZ
CB10 Technical University of Denmark DTU DK
Co-funded by the H2020 Programme of the EU
Grant Agreement no.: 642242
Table of Contents
1 Introduction and overview of this report...................................................... 3
2 Mapping and analysing climate change mitigation policy databases ............ 4
2.1 Introduction ........................................................................................... 4
2.2 Initial database analysis ........................................................................ 5
2.2.1 Methodology....................................................................................... 5
2.2.2 Temporal coverage.............................................................................. 7
2.2.3 Sectoral coverage ............................................................................... 8
2.2.4 Geographical coverage......................................................................... 8
2.2.5 Policy Instruments .............................................................................. 9
2.2.6 Visualisation and level of detail ............................................................10
2.2.7 Assessment and evaluation of policies...................................................10
2.2.8 Interconnections with other databases ..................................................10
2.2.9 Interim findings .................................................................................11
2.3 Survey on climate change policy databases ......................................... 12
2.3.1 About the survey................................................................................12
2.3.2 Overview of survey responses..............................................................12
2.3.3 The use of databases ..........................................................................13
2.3.4 The quality of databases .....................................................................14
2.3.5 The kind of information sought ............................................................15
2.3.6 What is missing: Limitations of databases and options for improvement....15
2.3.7 What makes a database authoritative?..................................................16
2.3.8 The user-friendliness of databases .......................................................16
2.3.9 Interim findings .................................................................................17
2.4 Follow-up interviews ............................................................................ 18
2.4.1 Summary of interviews .......................................................................18
2.4.2 What kind of information is sought?......................................................18
2.4.3 Exploring the lack of certain data .........................................................19
2.4.4 Improving databases ..........................................................................21
2.4.5 Summary of interview findings.............................................................22
2.5 Conclusions and the way forward......................................................... 23
3 Effects of interactions between EU climate and energy policies ................. 26
3.1 Introduction ......................................................................................... 26
3.2 Case study analysis approach............................................................... 30
3.3 Introduction to the EU Directives covered by the case studies ............. 31
3.3.1 The Energy Efficiency Directive (EED) ...................................................31
3.3.2 The EU Emissions Trading System ........................................................31
3.3.3 The Renewable Energy Directive ..........................................................31
3.4 Case study 1: Interactions between climate and energy policies in the
French electricity sector ................................................................................ 32
3.4.1 Introduction ......................................................................................32
3.4.2 Background and policy context ............................................................32
Co-funded by the H2020 Programme of the EU
Grant Agreement no.: 642242
3.4.3 Analysis of policy interactions between French policies and EU ETS...........35
3.4.4 Findings ............................................................................................37
3.5 Case study 2: Interactions between energy efficiency policies in the
household sector in Austria ........................................................................... 38
3.5.1 Introduction ......................................................................................38
3.5.2 Background and policy context ............................................................39
3.5.3 Analysis of energy efficiency policies at different government levels .........40
3.5.4 Findings ............................................................................................42
3.6 Case study: Interactions between the energy efficiency obligation and
the EU ETS in Greece ..................................................................................... 43
3.6.1 Introduction ......................................................................................43
3.6.2 Background and policy context ............................................................44
3.6.3 Analysis of policy interactions between the EEO, EU ETS and RED ............47
3.6.4 Findings ............................................................................................50
3.7 Case Study 4: Interaction between the EU ETS and the Renewable
Energy Directive at the EU level .................................................................... 53
3.7.1 Introduction ......................................................................................53
3.7.2 Background and policy context ............................................................53
3.7.3 Analysis of policy interactions RED and ETS at EU-level...........................54
3.7.4 Findings ............................................................................................58
3.8 Key findings from the case study analysis ............................................ 59
Co-funded by the H2020 Programme of the EU
Grant Agreement no.: 642242
Figures
Figure 1. Country coverage of climate change mitigation policy databases. ................... 9
Figure 2. Professional backgrounds of survey respondents. ........................................13
Figure 3. Policy interaction through the behaviour of directly and indirectly targeted
stakeholders. .......................................................................................................28
Figure 4. Electricity production in France. ................................................................33
Figure 5. Evolution of emissions from the electricity sector in France. .........................33
Figure 6. Final energy consumption in Austria (2005-2020). ......................................38
Figure 7. Energy consumption in households in Austria and the EU as well as disposable
income. ...............................................................................................................40
Figure 8. The impact of an EEO scheme on the Greek wholesale electricity market regulated
by the EU ETS. .....................................................................................................47
Tables
Table 1. Overview of climate change mitigation policy databases analysed. .................. 5
Table 2. Climate change mitigation policy databases mentioned by survey respondents.
..........................................................................................................................14
Table 3. Overview of CARISMA case studies for policy interaction analysis. ..................31
Table 4. Summary of case study results France. .......................................................37
Table 5. Summary of case study results Austria. ......................................................43
Table 6. Summary of the key features of the policy instruments. ................................46
Table 7. Summary of case study results for ETS and EEO scheme interaction impacts. ..52
Table 8. Summary of case study results on interaction renewable energy schemes and ETS
(at EU level). .......................................................................................................58

Co-funded by the H2020 Programme of the EU
Grant Agreement no.: 642242
Report on climate change mitigation policy
mapping and interaction
1
Abbreviations
APRAISE Assessment of Policy Interrelationships and Impacts on Sustainability in
Europe, an EU funded project in the 7th Framework Programme
CEPS Centre for European Policy Studies
CO2 Carbon dioxide
CO2eq Carbon dioxide equivalent
€ Euro
EC European Commission
EEA European Environment Agency
EED Energy Efficiency Directive
EEO Energy Efficiency Obligation scheme (Greece)
EIONET European Environment Information and Observation Network
EPBD Energy Performance of Buildings Directive
ETS EU Emissions Trading Scheme
EU European Union
EUA EU allowance
FiP Feed-in-Premiums
FiT Feed-in Tariff
g Gram
GDP Gross domestic product
GHG Greenhouse gas
Gt Gigatonne
GW Gigawatt
IEA International Energy Agency
INTERACT Interaction in EU Climate Policy 2001-2003, an EU funded project in the
5th Framework Programme
IPCC Intergovernmental Panel on Climate Change
IRENA International Renewable Energy Agency
JIN Joint Implementation Network
Ktoe kilo tonne oil equivalent
kWh Kilowatt hour
kWhel Kilowatt hour electricity production
MMR Monitoring Mechanism Regulation
MSR Market Stability Reserve
Mt Megatonne
Mtoe Million tonne oil equivalent
MWh Megawatt
NAZCA Non-State Actor Zone for Climate Action
NDC Nationally determined contribution
NECP National Energy and Climate Plans
NGO Non-governmental organisation
NLCS National Low-Carbon Strategy (France)
NREAP National Renewable Energy Action Plan (Austria)
Co-funded by the H2020 Programme of the EU
Grant Agreement no.: 642242
Report on climate change mitigation policy
mapping and interaction
2
OECD Organisation for Economic Co-operation and Development
PPC Public Power Corporation (Greece)
RES Renewable energy sources
SEI Stockholm Environment Institute
t Tonne
TWh Terawatt hour
RED Renewable Energy Directive
UNFCCC United Nations Framework Convention on Climate Change
UPRC University of Piraeus Research Centre
Co-funded by the H2020 Programme of the EU
Grant Agreement no.: 642242
Report on climate change mitigation policy
mapping and interaction
3
1 Introduction and overview of this report This report presents the main findings of two tasks under Work Package 5 (“Mapping and
assessing climate change mitigation policies”) of the CARISMA project.
The first task concerns the mapping of climate change mitigation policies. Through various
initiatives undertaken at multiple levels, information about climate change mitigation
policies (including policies on cooperation with emerging economies and developing
countries) has become increasingly available. This includes notably a variety of databases
listing information on such policies. The question is whether this wealth of information is
useful for decision-makers and other relevant stakeholders interested in the performance
of climate change mitigation policies. Do these data sources contain information on the
aspects that matter? And is the level of information such that informed decisions can be
made, or is more (or less) information required? Chapter 2 of this report offers insights
from a study carried out by the Stockholm Environment Institute (SEI) addressing these
questions. The study consisted of (1) an analysis of existing climate change mitigation
policy databases; (2) a survey soliciting the views of climate change mitigation policy
information users on existing databases; and (3) in-depth interviews with database users.
The second task focused on how climate and energy policies interact with each other in the
European Union (EU). Chapter 3 presents the results from four case studies (France,
Austria, Greece and EU-wide). The case studies were coordinated by the Joint
Implementation Network (JIN), and carried out by the Institute for Climate Economics
(I4CE), the University of Graz, the University of Piraeus Research Centre (UPRC) and the
Centre for European Policy Studies (CEPS). The case studies aim to complement the
existing literature on policy interactions by addressing a set of aspects of policy interactions
related to: the policy levels at which interactions may occur (EU, national or regional
levels), inter-temporal interactions (e.g. short term versus long term policy interactions),
and interactions that occur if stakeholders are indirectly affected by a policy instrument
(even if they are explicitly excluded from the policy).
Co-funded by the H2020 Programme of the EU
Grant Agreement no.: 642242
Report on climate change mitigation policy
mapping and interaction
4
2 Mapping and analysing climate change mitigation policy databases
2.1 Introduction
With the Paris Agreement having entered into force on 4 November 2016, international
politics is entering the next phase of tackling climate change. Attention will need to rapidly
shift to implementing the nationally determined contributions (NDCs) of countries, which
form the core of the agreement. Effective implementation of NDCs depends on a variety of
factors, ranging from finding the right economic incentives to questions of social
acceptance and equity. This implies that policy makers need a wide range of information
in order to adopt the best possible policies to act on climate change. At the international
level, robust information and data can help to determine whether the NDCs, taken
together, are sufficient to reach the goal to stay well below 2 degrees Celsius above pre-
industrial levels. At the national or sub-national level, information on other countries’
policies can help policy makers to make competent decisions on climate change mitigation
actions (Aldy and Pizer, 2016). For private sector players, clear and authoritative
information on climate policies is vital to guide investments in low-emission solutions, while
civil society and concerned citizens might use information about climate policies to exercise
pressure on policy makers for more ambitious policies.
Throughout the years, a variety of databases and other data sets have emerged, compiling
information about climate change mitigation policies in a variety of countries. These
databases can help meet the needs of a variety of stakeholders post-Paris. However, it is
unclear whether this large variety of data sources and the available information match the
expectations and needs of stakeholders at these different levels.
To address this gap, we undertook an analysis of existing databases containing information
on climate change mitigation policies. In a first step, we sought to uncover what kind of
information was available and aimed at categorising this information according to
commonly accepted parameters found in literature. After an initial desk-based analysis of
the databases (Section 2.2), we designed a survey to gauge what kind of databases are
already used by stakeholders and whether there were some gaps between user needs and
information available (Section 2.3). We followed up this survey with selected interviews
with database users from a variety of professional backgrounds, again to learn more about
user needs and expectations (Section 2.4).
Co-funded by the H2020 Programme of the EU
Grant Agreement no.: 642242
Report on climate change mitigation policy
mapping and interaction
5
2.2 Initial database analysis
2.2.1 Methodology
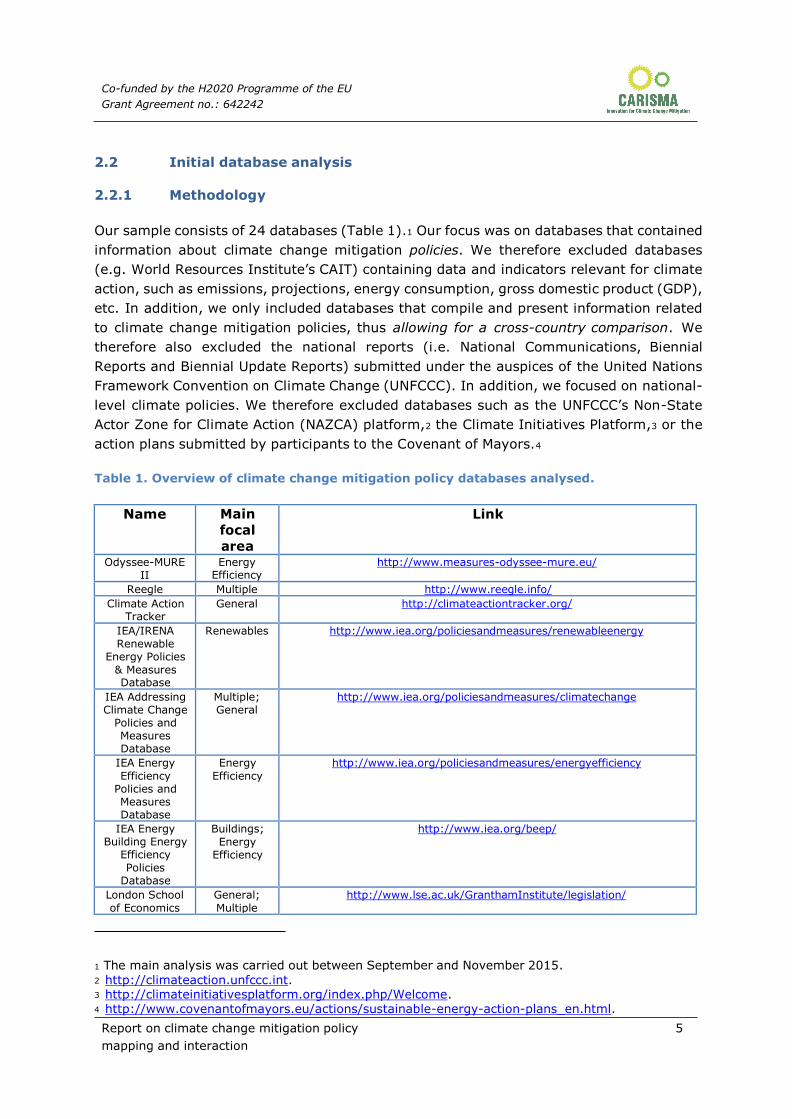
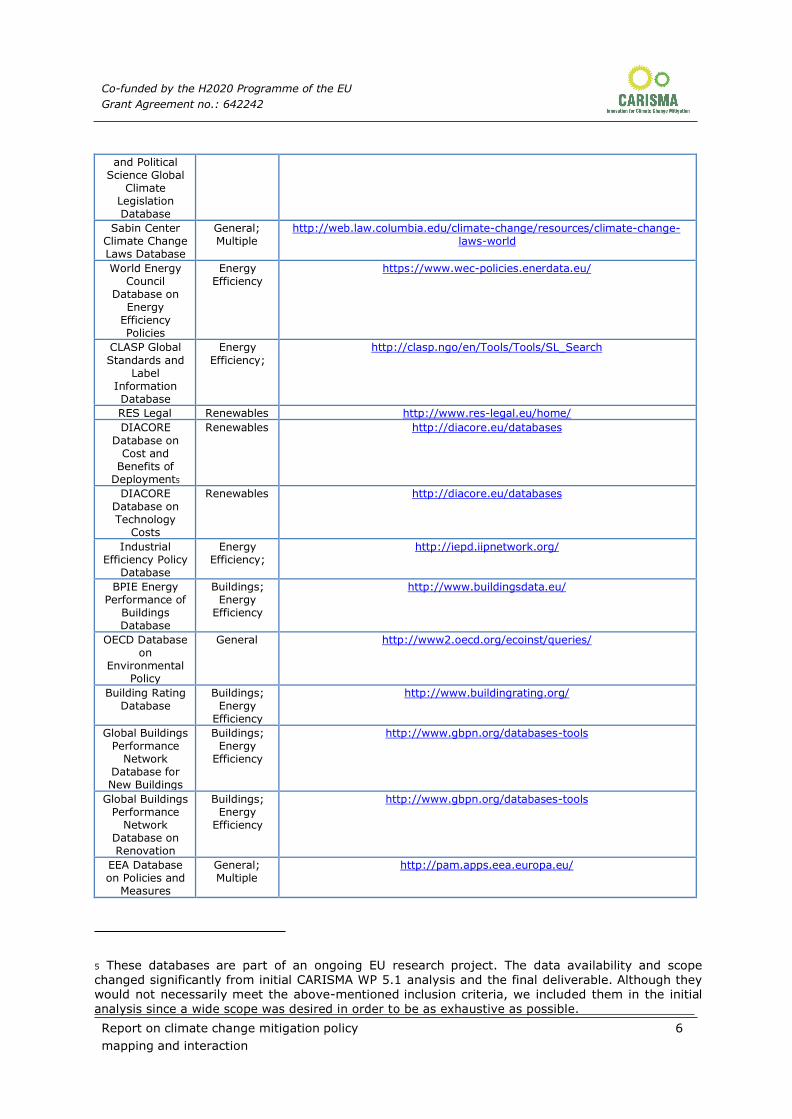
Our sample consists of 24 databases (Table 1).1 Our focus was on databases that contained
information about climate change mitigation policies. We therefore excluded databases
(e.g. World Resources Institute’s CAIT) containing data and indicators relevant for climate
action, such as emissions, projections, energy consumption, gross domestic product (GDP),
etc. In addition, we only included databases that compile and present information related
to climate change mitigation policies, thus allowing for a cross-country comparison. We
therefore also excluded the national reports (i.e. National Communications, Biennial
Reports and Biennial Update Reports) submitted under the auspices of the United Nations
Framework Convention on Climate Change (UNFCCC). In addition, we focused on national-
level climate policies. We therefore excluded databases such as the UNFCCC’s Non-State
Actor Zone for Climate Action (NAZCA) platform,2 the Climate Initiatives Platform,3 or the
action plans submitted by participants to the Covenant of Mayors.4
Table 1. Overview of climate change mitigation policy databases analysed.
Name Main
focal
area
Link
Odyssee-MURE II
Energy Efficiency
http://www.measures-odyssee-mure.eu/
Reegle Multiple http://www.reegle.info/
Climate Action Tracker
General http://climateactiontracker.org/
IEA/IRENA Renewable
Energy Policies
& Measures Database
Renewables http://www.iea.org/policiesandmeasures/renewableenergy
IEA Addressing Climate Change
Policies and Measures Database
Multiple; General
http://www.iea.org/policiesandmeasures/climatechange
IEA Energy
Efficiency Policies and Measures Database
Energy
Efficiency
http://www.iea.org/policiesandmeasures/energyefficiency
IEA Energy Building Energy
Efficiency
Policies Database
Buildings;
Energy Efficiency
http://www.iea.org/beep/
London School
of Economics
General;
Multiple
http://www.lse.ac.uk/GranthamInstitute/legislation/
1 The main analysis was carried out between September and November 2015. 2 http://climateaction.unfccc.int. 3 http://climateinitiativesplatform.org/index.php/Welcome. 4 http://www.covenantofmayors.eu/actions/sustainable-energy-action-plans_en.html.
Co-funded by the H2020 Programme of the EU
Grant Agreement no.: 642242
Report on climate change mitigation policy
mapping and interaction
6
and Political Science Global
Climate Legislation Database
Sabin Center Climate Change Laws Database
General; Multiple
http://web.law.columbia.edu/climate-change/resources/climate-change- laws-world
World Energy Council
Database on Energy
Efficiency Policies
Energy Efficiency
https://www.wec-policies.enerdata.eu/
CLASP Global
Standards and Label
Information Database
Energy
Efficiency;
http://clasp.ngo/en/Tools/Tools/SL_Search
RES Legal Renewables http://www.res-legal.eu/home/
DIACORE
Database on Cost and
Benefits of Deployment5
Renewables http://diacore.eu/databases
DIACORE Database on Technology
Costs
Renewables http://diacore.eu/databases
Industrial Efficiency Policy
Database
Energy Efficiency;
http://iepd.iipnetwork.org/
BPIE Energy Performance of
Buildings Database
Buildings; Energy
Efficiency
http://www.buildingsdata.eu/
OECD Database on
Environmental Policy
General http://www2.oecd.org/ecoinst/queries/
Building Rating Database
Buildings; Energy
Efficiency
http://www.buildingrating.org/
Global Buildings Performance
Network Database for New Buildings
Buildings; Energy
Efficiency
http://www.gbpn.org/databases-tools
Global Buildings Performance
Network Database on Renovation
Buildings; Energy
Efficiency
http://www.gbpn.org/databases-tools
EEA Database on Policies and
Measures
General; Multiple
http://pam.apps.eea.europa.eu/
5 These databases are part of an ongoing EU research project. The data availability and scope changed significantly from initial CARISMA WP 5.1 analysis and the final deliverable. Although they would not necessarily meet the above-mentioned inclusion criteria, we included them in the initial analysis since a wide scope was desired in order to be as exhaustive as possible.

Co-funded by the H2020 Programme of the EU
Grant Agreement no.: 642242
Report on climate change mitigation policy
mapping and interaction
7
PV Grid Database
Renewables http://www.pvgrid.eu/database.html
Southeast Asia Network of
Climate Change Offices
Database
General; Multiple
http://accad.sean-cc.org/
NewClimate Institute’s
Climate Policy Database
General; Multiple
http://climatepolicydatabase.org/index.php?title=Climate_Policy_Database
Each database was analysed using a variety of attributes, including:
temporal coverage (in terms of years covered; as well as coverage of
past/ongoing/planned policies);
sectoral coverage;
geographical coverage (both regional and country-level);
policy instruments;
level of detail and visualisation;
the extent to which the database allows for assessment and evaluation (e.g. by ranking
policies, or allowing for comparison); and
interconnections with other databases.
These attributes will be addressed in detail in the following paragraphs. Moreover, we
collected basic background information, including the year of creation, the lead
organization managing the database (including contact details), and the frequency of
updates. The vastness of available information meant that this initial analysis is unlikely to
cover all the available data sources on climate change mitigation policies, and limitations
of language and available time might have driven the sample towards a Western and
English-speaking bias. Nevertheless, several observations can be made on the basis of our
sample.
2.2.2 Temporal coverage
Most (13) of the databases in our sample were launched after 2008. This could be explained
by a number of factors. While advancement in internet and communication technologies
may be one small factor, another is a growing interest in the performance of policies,
accompanying an increase in the actual number of policies (Dubash et al., 2013). Similarly,
although no data are available on this point, an increase in the allocation of resources to
document and better understand policies may help explain this trend. Finally, another
factor may be the recent shift towards bottom-up climate governance, involving a larger
group of stakeholders on many levels. Businesses, non-governmental organisations and
citizens’ initiatives increasingly act alongside governments on climate change, both globally
and locally, and they generate a wealth of data and information. Moreover, reporting
requirements – including under the UNFCCC and the European Union (e.g. the EU’s

Co-funded by the H2020 Programme of the EU
Grant Agreement no.: 642242
Report on climate change mitigation policy
mapping and interaction
8
Monitoring Mechanism Regulation) – have likely helped to bring more information out in
the open. In addition, increasing awareness of the causes and consequences of climate
change, following several assessment reports by the Intergovernmental Panel on Climate
Change (IPCC), and mounting attention in mainstream media, may have led to further
demand for transparency about the policies implemented to address the problem. In the
wake of the Paris Agreement and given the increasing central importance of NDCs, it is to
be expected that the supply of climate policy information will grow even further, thus
increasing the need for providing systematic and understandable information on climate
change policies.
2.2.3 Sectoral coverage
As far as the policy sector6 is concerned, most (18) databases focus on energy sector
policies,7 while 14 databases cover the buildings sector and 13 the transport sector. Within
the energy sector, half of the databases analysed cover energy efficiency policies, while
seven focus on renewable energy policies. Information on industry policies is in the middle
of the spectrum with eight data sources dealing with this sector. At the lower end, we find
the agricultural and the waste policy sector with only four data sources covering agricultural
and two data sources covering waste policies. Other policy sectors, such as maritime
transport or heavy industry, may be included in the databases analysed; however, no
database specifically stated that it contains information about those sectors. However,
further analysis is needed to discern whether this is due to the fact that policy makers
focus, for example, on the energy sector and eschew the agricultural sector, or because
information on climate change mitigation policies in, for instance, the agricultural sector is
scarce. Shedding light on this question may point to the need for further transparency of
the policies in this sector, which is responsible for roughly 24% of greenhouse gas
emissions worldwide (Smith et al., 2014). Moreover, successful implementation of the
NDCs under the Paris Agreement will require mitigation actions across multiple sectors,
including agriculture.
2.2.4 Geographical coverage
With regard to the geographical coverage, 15 databases cover policies worldwide. Only one
database (the Southeast Asia Network of Climate Change Offices Database) targets the
Asian region specifically, and no database specifically covers sub-Saharan Africa or Latin
America. Seven databases focus exclusively on Europe and/or the European Union. A
country-by-country analysis shows that Germany is the country covered by most
databases: 22 databases provide some information on German climate change mitigation
policies. India, China and the United States feature in 15 databases, Turkey and Canada
6 We used the classification also employed by the IPCC: “energy”, “buildings”, “transport”, “agriculture”, “LULUCF”, “waste”, “industry”, “crosscutting” and “not specified”. 7 Including energy efficiency and renewable energy support. We were concerned with the main focus of each database. Almost every database included some information about energy policies.

Co-funded by the H2020 Programme of the EU
Grant Agreement no.: 642242
Report on climate change mitigation policy
mapping and interaction
9
in 14, and Russia and Brazil in 13.8 Figure 1 illustrates the number of times a specific
country is covered in databases, with darker shades indicating more appearances than
lighter colours.
Figure 1. Country coverage of climate change mitigation policy databases.
Explanations for this uneven geographical coverage were not sought at this stage.
However, further research as well as subsequent interviews suggest that some countries
might be under more stringent reporting requirements. For example, EU member states
have multiple reporting requirements under many policies such the Energy Efficiency
Directive (2012/27), the Renewable Energy Directive (2009/28) or the Monitoring
Mechanism Regulation (MMR, Regulation 525/2013) (Umpfenbach, 2015). Moreover, it
might simply be the case that some countries simply have more policies in place, which
can be expected to lead to more information becoming available.
2.2.5 Policy Instruments
Following existing classifications of policy instruments (Jordan et al., 2011), the databases
can be organised according to the types of policy instruments that are covered, including
“regulatory”, “economic/market”, “informational,” voluntary”, “procedural” and “other”
instruments. An analysis of our sample shows that most (19) databases described some
sort of regulatory instrument such as energy efficiency requirements mandated by specific
laws. Also, 19 databases included information on “economic” and “market instruments”
8 One database focusing only on federal states of the United States was excluded from the sample.
Co-funded by the H2020 Programme of the EU
Grant Agreement no.: 642242
Report on climate change mitigation policy
mapping and interaction
10
such as emissions trading. Data on “informational” instruments, such as appliance
labelling, could be found in 16 databases and 10 data sources also described voluntary
instruments. Only seven databases contained information on procedural instruments, such
as information on how certain national institutions (e.g. ministries) address climate change
or on how educational policies could shape climate change mitigation.
2.2.6 Visualisation and level of detail
Some of the databases use figures, tables or other forms of visual representation.
However, options for interactivity with database users are rather limited. Among the 15
data sources including some sort of visualisation, simple graphs, pie charts and maps
prevail as the types of visual support used.
As far as the level of detail is concerned, 16 out of 24 databases contain relatively detailed
descriptions of policies. Some data sources simply provide the general objective of any
specific policy or just the name of a law or policy, while others offer detailed information
across a wide range of policy aspects. Overall, databases covering Europe or industrialised
countries tend to describe policies more in detail, whereas data sources describing policies
on a global level tend to be less detailed when it comes to policies in developing countries.
2.2.7 Assessment and evaluation of policies
Most of the data sources refrain from assessing and evaluating policies, with only seven
databases in our sample offering some type of evaluation of the policies covered. With one
exception, the Odyssee-Mure II database, those databases also included country
comparisons, but information remains rudimentary and/or aggregated. For example, the
Global Buildings Performance Network database compares countries’ energy efficiency in
buildings according to a rating system based on indicators such as “capacity building” or
“financial instruments”, which is then presented in pie chart form.
Databases furthermore rarely provide information on the costs of mitigation policies or
other indicators of the impacts or effectiveness of policies, such as actual emission
reductions. Only five data sources provide some information about the costs of mitigation
policies but only one provided this information for most policies included. Five databases
include estimates of emissions savings for the policies, but this data is often only found for
some policies, and most of the estimates are made ex ante. While this information might
be hard to obtain, given the challenging nature of assessing the mitigation effects of
individual climate policies, this kind of data can be of great use to policy makers and other
stakeholders. This is particularly the case following the adoption of the Paris Agreement,
where information about the policies put in place to achieve NDCs can provide an indication
of whether a country is on track towards its NDC.
2.2.8 Interconnections with other databases
Databases are mostly disconnected from each other. There are exceptions, such as the IEA
databases, which are linked to one institution. Likewise, the LSE Global Climate Legislation
Co-funded by the H2020 Programme of the EU
Grant Agreement no.: 642242
Report on climate change mitigation policy
mapping and interaction
11
Database and the Sabin Center Climate Change Laws database are in the process of being
integrated. However, other opportunities for harnessing the complementarity of some
databases are forgone.
For example, many data sources focus on policies in the energy sector, thus often
categorising and describing the same set of policies. The International Energy Agency’s
(IEA) Addressing Climate Change database overlaps significantly with the NewClimate
Institute’s Climate Policy Database. While the latter differs from the former in providing a
more systematic approach in the form of a “good policy matrix”, it is not clear whether all
potential synergies (e.g. providing complementary information) between the two
databases have been explored. This also holds true for other database examples in the
analysis.
2.2.9 Interim findings
Our analysis leads to a few interim findings. First, data on climate change mitigation
policies is increasingly available. This is a positive development from the perspective of
transparency of climate policy, and can potentially lead to more informed decision making,
and at the same time can help strengthen the capacity of other stakeholders to act on
climate change.
Second, available information is concentrated largely on the energy sector, with an
emphasis on energy efficiency. Whether this is due to the greater number of energy policies
compared to, for example, agricultural policies needs further investigation particularly
given the importance of simultaneous climate action in multiple sectors. Therefore, a more
comprehensive sectoral coverage of climate policy databases would be a welcome
development.
Third, data availability is unevenly distributed. While the countries in the global North are
well represented, information on policies in developing countries (particularly in Sub-
Saharan Africa) is scarcer. Moreover, to the extent information is available, information in
those regions tends to be less comprehensive when compared to industrialised countries.
Again, further research can help to discern whether this is due to the fact that there are
fewer climate change mitigation policies in these countries or due to the fact that
information is not readily available (or available in accessible languages) because of
transparency or capacity-related issues. In any case, more information about developing
countries’ policies would not only be beneficial to track their efforts to achieve their NDCs,
but may also be useful for the countries themselves, with a view to sharing knowledge and
best practices with each other, gaining access to climate finance, and learn about past
successes and failures.
Fourth, the data sources analysed are insufficiently linked to each other, thus forgoing
potential synergies, and potentially leading to an excess of information. However, some
efforts towards integrating data sources are underway. Still, such efforts may be hampered

Co-funded by the H2020 Programme of the EU
Grant Agreement no.: 642242
Report on climate change mitigation policy
mapping and interaction
12
by inter-institutional political sensitivities, particularly when large international
organisations are involved.
Lastly, data sources generally eschew comparisons of policies and provide little information
about the costs of, and actual emissions savings attributed to, specific policies. While it
may be challenging to provide such information both ex ante and ex post, comparable
estimates of costs and/or emissions savings will become increasingly important after Paris.
However, providing such information may be politically sensitive for international
organisations, whose member governments may wish them to refrain from making
“political” judgments in the form of comparisons.
2.3 Survey on climate change policy databases
2.3.1 About the survey
Following the analysis of databases presented in Section 1.2, we carried out an online
survey in June-July 2016, containing 16 questions about the actual usage of such policy
databases. Overall, three main objectives guided the survey. First, we wanted to
understand what kind of databases were already used by respondents. Second, we wanted
to uncover what kind of information is sought and who was deemed to be particularly
trustworthy in providing this information. The third objective was to learn what information
was sought but not provided and what kind of improvements managers of policy databases
could make. The online tool SurveyMonkey was used to conduct the survey, allowing
respondents approximately four weeks to reply. Survey invitations were sent out to large
mailing lists (e.g. Climate-L), and to the database of CARISMA stakeholders. In total, 85
people took the survey.9
2.3.2 Overview of survey responses
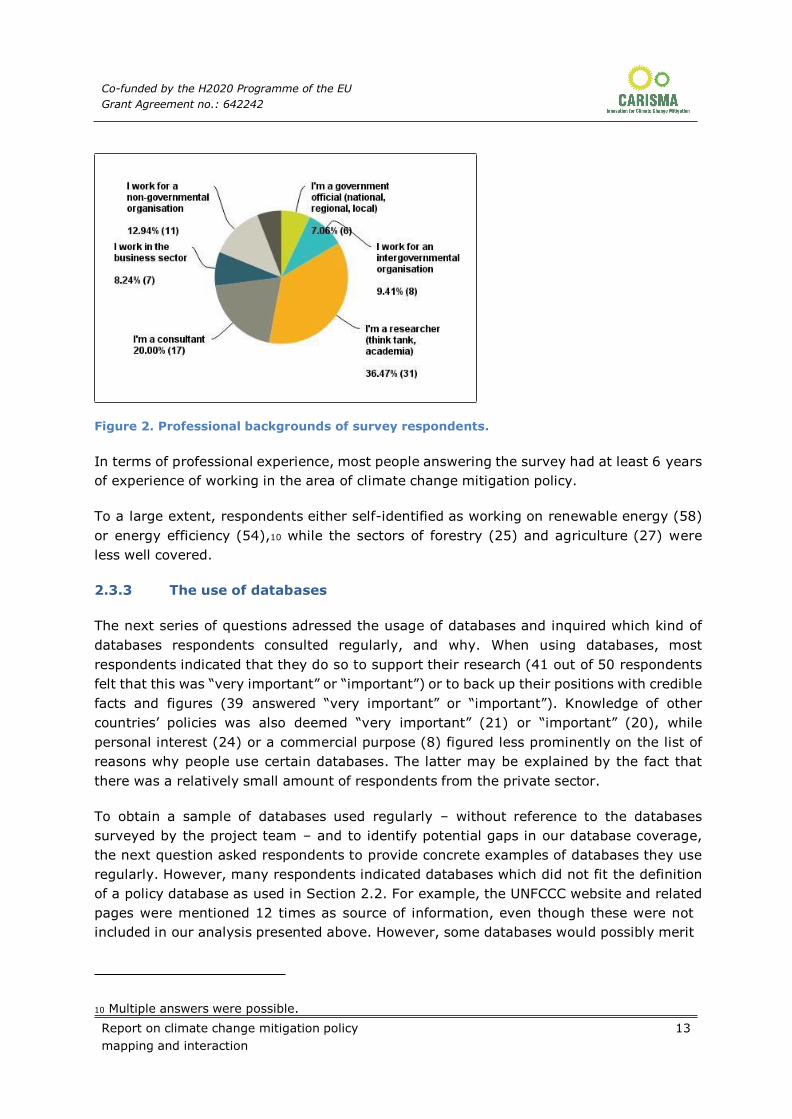
Of the 85 people who took the survey, 31 self-identified as researchers, 17 hailed from the
consulting sector, while 11 identified as working in the non-governmental sector. Figure 2
gives an overview of the professional background of all respondents.
9 Note that not all respondents answered all questions, meaning that the number of respondents for each question varied.
Co-funded by the H2020 Programme of the EU
Grant Agreement no.: 642242
Report on climate change mitigation policy
mapping and interaction
13
Figure 2. Professional backgrounds of survey respondents.
In terms of professional experience, most people answering the survey had at least 6 years
of experience of working in the area of climate change mitigation policy.
To a large extent, respondents either self-identified as working on renewable energy (58)
or energy efficiency (54),10 while the sectors of forestry (25) and agriculture (27) were
less well covered.
2.3.3 The use of databases
The next series of questions adressed the usage of databases and inquired which kind of
databases respondents consulted regularly, and why. When using databases, most
respondents indicated that they do so to support their research (41 out of 50 respondents
felt that this was “very important” or “important”) or to back up their positions with credible
facts and figures (39 answered “very important” or “important”). Knowledge of other
countries’ policies was also deemed “very important” (21) or “important” (20), while
personal interest (24) or a commercial purpose (8) figured less prominently on the list of
reasons why people use certain databases. The latter may be explained by the fact that
there was a relatively small amount of respondents from the private sector.
To obtain a sample of databases used regularly – without reference to the databases
surveyed by the project team – and to identify potential gaps in our database coverage,
the next question asked respondents to provide concrete examples of databases they use
regularly. However, many respondents indicated databases which did not fit the definition
of a policy database as used in Section 2.2. For example, the UNFCCC website and related
pages were mentioned 12 times as source of information, even though these were not
included in our analysis presented above. However, some databases would possibly merit
10 Multiple answers were possible.

Co-funded by the H2020 Programme of the EU
Grant Agreement no.: 642242
Report on climate change mitigation policy
mapping and interaction
14
an inclusion in our sample. Table 2 offers an overview of databases mentioned by
participants and which might warrant an inclusion in our sample for further analysis.
Table 2. Climate change mitigation policy databases mentioned by survey respondents.
Database Link
International
Partnership on
Mitigation and
MRV
https://mitigationpartnership.net/gpa
REN 21 Status of
RES http://www.ren21.net/status-of-renewables/ren21-interactive-map/
REDD Desk
Database http://theredddesk.org/countries
Transport Policy
Database http://transportpolicy.net/index.php?title=Main_Page
ICAP https://icapcarbonaction.com/en/ets-map
Respondents were then invited to choose the one database they would use the most. Forty-
one out of 85 respondents answered this question. Of those examples provided, five
respondents mentioned IEA and OECD-managed databases while another five respondents
indicated that they would use the UNFCCC website for policy information. Other databases
mentioned and included in our initial database review were the Odyssee-MURE database
(one mention), Climate Action Tracker (one mention), the EEA Database on Policies and
Measures (two mentions), New Climate Institute’s Climate Policy Database (two mentions),
the LSE Global Climate Legislation Database, and the Sabin Center Climate Change Laws
Database (one mention).
2.3.4 The quality of databases
Next, respondents were asked to elaborate on why they used the chosen database, with
reference to several pre-defined quality criteria. Forty-five people responded to this
question. The most important quality of those databases was the fact that they provide the
most reliable and trustworthy data. Twenty respondents felt this was “very important,
while another 20 felt that it was “important”.11 Having a wide geographical or sectoral
coverage was rated 19 times as “very important” and 13 times as “important”, while
providing the most detailed information was rated 16 times as “very important” and 22
times as “important”. These three qualities (wide coverage, detail of information, and
reliablity) were therefore the most important attributes sought after in a database. Perhaps
surprisingly, the quality of allowing for an evaluation of countries’ policies was considered
to be relatively less important to respondents: 12 respondents felt it was “very important”,
11 Note that each quality could only be assigned one answer ranging from “not important” to “very important”. It was therefore not possible that one respondent chose one quality, for example “it is user-friendly”, and rated it both “very important” and “important”.

Co-funded by the H2020 Programme of the EU
Grant Agreement no.: 642242
Report on climate change mitigation policy
mapping and interaction
15
13 felt it was “important”, 13 stated “somewhat important”, and five responded “not
important”.
2.3.5 The kind of information sought
Respondents were then asked what kind of information they look for in policy databases,
and were also given the opportunity to indicate whether a specific kind of information was
sought “never”, “sometimes” or “often”. Forty-seven people responded. Top answers
(often) were a detailed description of countries’ mitigation policy instruments (22),
information about the implementation of policies (22), and assessment or evaluation of
policies in terms of their environmental or socio-economic impacts (21). Information about
policy interactions is sought “sometimes” in 27 of the cases, making it the top answer in
that category. Information about the number of policies enacted in one jurisdiction is
“never” sought in 12 cases, giving it the most responses in the “never” category. Here, we
can already identify a gap between available information and knowledge needs. Because
while a significant number of users often look for information on policy assessments (21),
those assessments are rarely provided in the databases analysed in Section 2.2.
This knowledge gap might partly explain why half (22) of the respondents were only
“moderately” satisfied with the data available on migitation policies. A further 11 were “not
satisified” and only another 11 were “satisfied” with the information available online.
2.3.6 What is missing: Limitations of databases and options for improvement
When asked what was missing, the majority (29 out of 44) responded that they felt that
information on the economic impacts of policies was absent from databases. A further 28
respondents were of the opinion that information on environmental impacts were missing,
while 21 respondents indicated that information on social impacts was missing. This
suggests that some sort of evaluation is sought after (but not often provided by the
databases). When given the opportunity to add their own description of what was missing,
respondents indicated that information about the cost-effectiveness was missing, while one
respondent criticised missing information about the standards used in various policies.
To supplement these findings, respondents were asked what kind of information they
ideally would like to see included in databases. There was a quite even distribution among
the options respondents were able to choose and their importance. Twenty-five out of 45
wanted to see information on expected/projected emission reductions from policies and
ranked this missing information as “very important”. Twenty-three out of 44 wanted to see
information concerning the evaluation of policies compared to their objectives and ranked
this answer as “very important”, while 22 wanted to have information about cost-
effectivess and ranked this as “very important”. The only answer which did not score over
20 was overall costs of policies which only 16 respondents (out of 43) ranked as “very
important” with regard to the information they would like to see in a policy database. When
given the opportunity to elaborate on “other” kinds of information they would like to see,

Co-funded by the H2020 Programme of the EU
Grant Agreement no.: 642242
Report on climate change mitigation policy
mapping and interaction
16
respondents added information needs on policies dealing with overseeing markets and
information on the governance and compliance conditions of certain policies.
2.3.7 What makes a database authoritative?
As a next step, respondents were invited to indicate what attribute would make a database
most authoritative. Thirty-two out of 44 suggested that the sources of information are
credible make databases “very authoritative”, while 29 out of 43 chose the methodology
is explained well and sources are referenced make databases “very authoritative”.
Interestingly, that the database is kept up-to-date made a database “very authoritative”
for 27 respondents. One respondent commented that it was important that the most recent
and most “up-to-date” information was shared in a database and suggested some sort of
Wikipedia-inspired page which would let stakeholders update information on different
countries. Interestingly, all respondents who responded with the organisation leading and
managing the database is credible and authoritative (22) when asked about the authority
of databases, all mentioned IEA/OECD databases as the ones they would use. The same
holds true for the category the sources of information are credible. One might infer from
these findings that IEA/OECD databases are considered to be particularly authoritative.
2.3.8 The user-friendliness of databases
The last part of the survey dealt with the design and the user-friendliness of databases.
The responses (21 in total) were relatively heterogeneous, with only the IEA/OECD
databases receiving several (three) mentions. Other databases which were deemed user-
friendly are the Reegle database (because of its easy, step-by-step process to find
information), RES-LEGAL (because of the conciseness of its information), the EEA Database
on Policies and Measures (no explanation given), Climate Action Tracker (quick and easy
to navigate), New Climate Institute’s Climate Policy Database (easy overview, good search
function, detail of information) and the LSE Global Climate Legislation Database (well
organised).
However, when respondents were asked to point out particularly user “unfriendly”
databases, the UNFCCC website came up four out of ten times. Although the website in
itself does not necessarily qualify as a database (and was therefore not included in our
sample), the sheer amount of information as well as its static character were the main
reasons why the UNFCCC webpage was qualified as user “unfriendly”. This suggests that
users might want relatively concise, up-to-date information instead of lengthy, detailed
documents and descriptions. However, it should be remembered that the UNFCCC website
for the most part serves as a repository for submissions from Parties and observers, which
can explain the heterogeneity of the available information and how it is presented. Even
though the UNFCCC offers at times detailed guidance to Parties for reporting on their
actions (e.g. through National Communications or Biennial Reports), there is still significant
leeway for Parties in what exactly they choose to report and what they leave out.

Co-funded by the H2020 Programme of the EU
Grant Agreement no.: 642242
Report on climate change mitigation policy
mapping and interaction
17
The last part, dealing with visualisation, revealed that while 21 out of 43 respondents
wished to have some visual support, 22 replied that visual support was welcome but not
necessary. Static graphs and tables were identified as the main desired visual support
(“very important” for 18 out of 40 respondents), as were infographics explaining complex
information quickly and clearly (13). Interestingly, only 11 out of 39 respondents thought
that interactive graphs and tables were “very important” and audio-visual support like
photos or videos was deemed “not important” by 10 out of 38 and therefore was the least
important category.
2.3.9 Interim findings
As mentioned above, the survey had three main research objectives: To better understand
how databases are used, to gain insights into the kind of information sought, and to survey
suggestions on how to improve the availability of data. Several observations can be made
on the basis of the survey.
Overall, respondents use databases mainly to back up their research and/or their
professional positions with facts and figures. Mostly, users seek detailed information about
countries’ mitigation policies, as well as information about the implementation and the
ultimate effects of those policies. When using databases, respondents deemed the
reliability and trustworthiness of a database as the main desirable feature. This feature is
guaranteed either by a well-explained methodology or when the source is deemed credible.
Well-established and well-known organisations such as the OECD or the IEA are thought
of as the most credible in this regard.
However, the satisfaction with the quality of available data seems to be only moderate.
One explanation might be that while the sectors respondents were active in by and large
matched data availability (most respondents work in the energy sector, and most
databases convey information about mitigation policies in the energy sector), other
information sought is not readily available.
This is particularly the case when it comes to evaluation and impact assessments. While
most of the respondents deem information about environmental effectiveness (emission
reductions) and socio-economic impacts (including costs) as important, only a few
databases actually convey this sort of information.
Concerning the user-friendliness of databases, easy-to-navigate content as well as concise
and easily accessible information seem to be the defining criteria. While more visually
appealing methods of conveying information, such as elaborated graphs and multimedia
support might be welcomed, it was not deemed necessary by half of the respondents.

Co-funded by the H2020 Programme of the EU
Grant Agreement no.: 642242
Report on climate change mitigation policy
mapping and interaction
18
2.4 Follow-up interviews
2.4.1 Summary of interviews
To supplement these findings with additional, qualitative information, we conducted
additional interviews with selected participants and members of the CARISMA Advisory
Boards. Interviewees were selected to ensure a variety of viewpoints. In total, seven
stakeholders agreed to a short (20-30 minutes) interview, which were carried out between
August and October 2016. Four interviewees fell into the “research” category with one
representative each from the “business”, “NGO” and the “consultancy” sector. Policy-
makers were not available for an interview. All interview partners can be considered
experts in their field and have had a strong track record in their specific areas of expertise.
The main purpose of these follow-up interviews was to obtain some tentative explanations
of observations made based on our initial analysis of policy databases and on the survey
described above.
2.4.2 What kind of information is sought?
The first set of questions sought to uncover what kind of databases the interview partners
(and people in the same professional category) used and what kind of information they
sought. By doing so, we wanted to corroborate the trends already observed in our initial
analysis.
Answers varied according to professional backgrounds. While stakeholders from research
often look for more details on specific policies and quantitative data such as costs, emission
savings and other indicators, people closer to the policy making process (consulting and
business representatives) seem to be additionally interested in barriers and obstacles to
certain policies (and how to overcome them), as well as in a long-term perspective on
future potential policies. These answers corroborated information gathered by the survey,
in which evaluations and impact assessments of climate policies related to costs or actual
emission reductions per policy were indicated as desirable information by many
respondents. However, the interviewed stakeholders also pointed to other factors that
would help gain a better understanding of what makes policies “effective”. For example,
the interviewee from the consultancy sector opined that data, facts and figures would often
not be enough to fully get the picture of what can considered to be “effective” policies.
Contextual factors should be taken into account when analysing policies and their
effectiveness. For instance, effective energy efficiency policies in France might be very
different from effective energy efficiency policies in Denmark as they operate in a different
cultural and societal context. Here, the need for more qualitative information became
apparent but also the need for concrete proposals on how to overcome certain barriers to
effective policy making.
But despite the need for some sort of assessment, all interviewees were not fully convinced
that they could find all the necessary information for their professional usage in existing
climate change policy databases. Again, this is in line with survey findings where overall

Co-funded by the H2020 Programme of the EU
Grant Agreement no.: 642242
Report on climate change mitigation policy
mapping and interaction
19
satisfaction with availability of data was only moderate. Researchers were overall more
satisfied with data availability while others seemed to be more sceptical. When asked about
what other sources of information interviewees used, most mentioned either going directly
to the source of policies such as reports by government agencies and legal texts, or
indicated that they would use specialised journalistic and think tank sources. Moreover,
making use of one’s extended professional network was mentioned as an important source
for climate policy information.
2.4.3 Exploring the lack of certain data
Drawing on the interviewees’ expertise, the next questions mainly sought to help explain
the two main findings of the survey and the initial desk review of policy databases (see
Section 1.2): first, the uneven sectoral and geographical coverage of policy databases; and
second, the absence of evaluation and assessment of policies.
Concerning the uneven sectoral and geographical coverage, interviewees were asked
whether they believed that this lack of information was due to the lack of policies enacted
in these sectors and geographical areas or simply because there was an information gap
in these sectors and geographical areas (i.e. policies are enacted, but there is simply no
information available).
Three respondents argued for a mix of both, and three pointed to a perceived information
gap. One respondent further emphasised that this information gap was clearly demand-
driven in the sense that since there were less governmental or private sector obligations
in low-income countries to report on climate policies, less information was available as a
result. Another explanation given was the fact that in some sectors policies might be easier
to evaluate than in others. For example, fuel consumption and ensuing emissions are
relatively straightforward to calculate in the energy sector, whereas one participant pointed
to the methodological difficulties to assess emissions in the agricultural or waste sector.
This lack of knowledge was thought to be particularly pronounced in low-income countries
which, according to one interviewee, might explain the lack of information identified in
Section 1.2. Moreover, some sectors such as the energy sector would have the largest
emissions savings potential, therefore being the target of policy makers and subsequently
researchers. One participant suggested that to fill the knowledge gap in low-income
countries, intensified South-South cooperation on climate policy information should be
envisioned, since, from a structural perspective, methodologies and lessons learnt would
be much more valuable if shared between “like” countries, rather than between
industrialised and emerging countries.
Concerning the lack of policy evaluation and assessment in climate change policy
databases, interview partners pointed to several possible reasons Overall, the feeling
among interviewees was that there was simply a lack of reliable data. Several barriers to
obtaining this data were indicated. Two interviewees stressed the methodological
difficulties, echoing one of the reasons given for the aforementioned sectoral and
geographical information gap. On the one hand it was seen as challenging to link certain
Co-funded by the H2020 Programme of the EU
Grant Agreement no.: 642242
Report on climate change mitigation policy
mapping and interaction
20
emission or energy consumption reductions to specific policies. Also, a lack of
harmonisation of how to report those reductions was mentioned. On the other hand, two
interviewees opined that some of the evaluated and assessed data might prove to be very
sensitive information, and some countries might eschew publishing this information. But
the absence of “push factors” was also mentioned. One interviewee suggested that policy
makers were usually not pushing for evaluation and assessment, thus offering no
incentives to do so. Moreover, the lack of expertise and resources to carry out proper
evaluations were indicated as barriers as well as the shortcomings of traditional
assessment criteria such as costs and efficiency which often overlook other factors that
might make for “good” policies such as social equity or co-benefits.
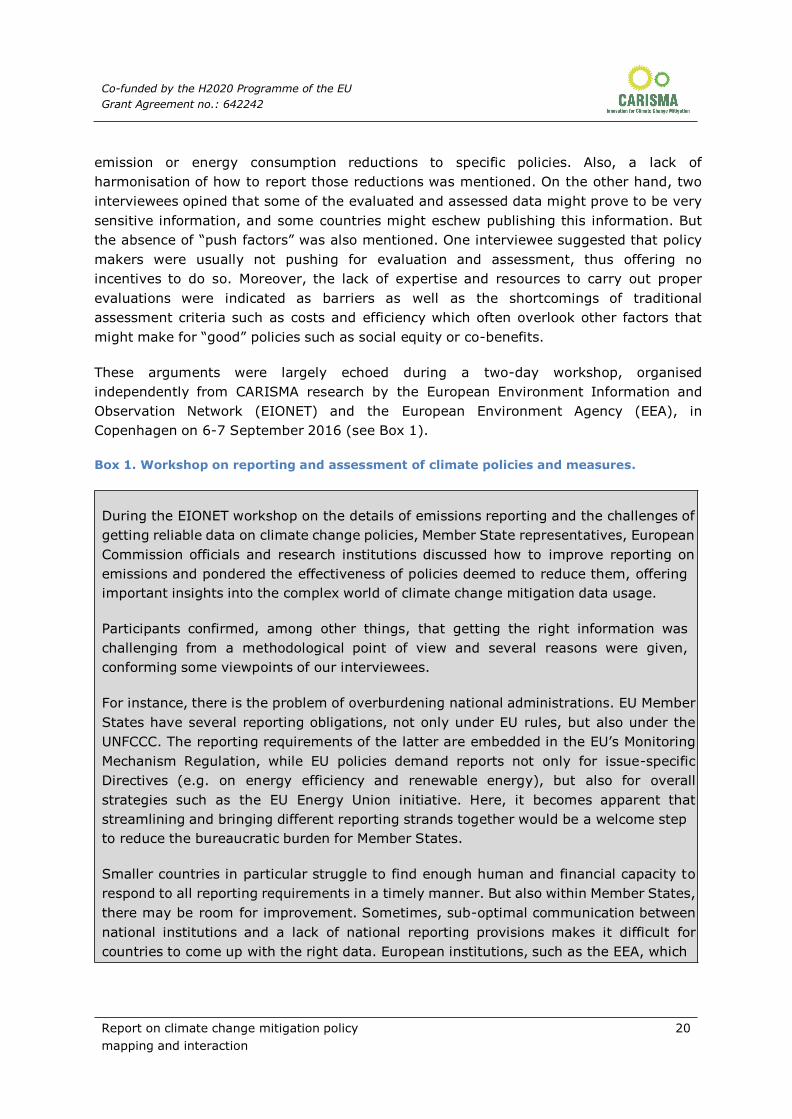
These arguments were largely echoed during a two-day workshop, organised
independently from CARISMA research by the European Environment Information and
Observation Network (EIONET) and the European Environment Agency (EEA), in
Copenhagen on 6-7 September 2016 (see Box 1).
Box 1. Workshop on reporting and assessment of climate policies and measures.
During the EIONET workshop on the details of emissions reporting and the challenges of
getting reliable data on climate change policies, Member State representatives, European
Commission officials and research institutions discussed how to improve reporting on
emissions and pondered the effectiveness of policies deemed to reduce them, offering
important insights into the complex world of climate change mitigation data usage.
Participants confirmed, among other things, that getting the right information was
challenging from a methodological point of view and several reasons were given,
conforming some viewpoints of our interviewees.
For instance, there is the problem of overburdening national administrations. EU Member
States have several reporting obligations, not only under EU rules, but also under the
UNFCCC. The reporting requirements of the latter are embedded in the EU’s Monitoring
Mechanism Regulation, while EU policies demand reports not only for issue-specific
Directives (e.g. on energy efficiency and renewable energy), but also for overall
strategies such as the EU Energy Union initiative. Here, it becomes apparent that
streamlining and bringing different reporting strands together would be a welcome step
to reduce the bureaucratic burden for Member States.
Smaller countries in particular struggle to find enough human and financial capacity to
respond to all reporting requirements in a timely manner. But also within Member States,
there may be room for improvement. Sometimes, sub-optimal communication between
national institutions and a lack of national reporting provisions makes it difficult for
countries to come up with the right data. European institutions, such as the EEA, which

Co-funded by the H2020 Programme of the EU
Grant Agreement no.: 642242
Report on climate change mitigation policy
mapping and interaction
21
hosted the workshop, already provide guidance for Member States on how to report on
policies, but these could be improved by providing best practice examples of reporting.
But then there are also technical issues, such as the difficulties of linking estimated or
even verified emission reductions to a specific policy. And while models and scenarios
often exist ex ante, ex post evaluations after a certain period are often not carried out
due to resource constraints and the complexity of disentangling empirical effects of a
certain policy from other emission-reducing factors such as economic cycles or weather
conditions.
Last but not least, one could add a political dimension to the challenges of data gathering.
Information such as the costs of policies are often not reported simply because this sort
of information proves to be a sensitive issue; power dynamics between governing
institutions are often a hindering factor. Think for example about coalition governments,
where different ministries are staffed by different parties and where opinions of
objectives and priorities might diverge.
In a similar vein, the next interview question inquired whether databases were generally
perceived as up to date. While four respondents were generally of the opinion that the
information available was up-to-date, three respondents felt that this was not the case.
Here, it is interesting to note the probable limitations of policy databases. The interviewees
from the NGO, consultancy and business indicated that timely information was important.
However, it was felt that this information cannot be provided by managers of databases
because of lacking resources. Often, business sector clients would employ specialised
advisors and analysts who would gather information already during the stage where
policies are debated by decision makers, while policy databases normally contain only
information on already enacted policies. However, it remains questionable whether policy
databases can and even should provide for this close to real time information.
2.4.4 Improving databases
The last set of questions asked interviewees to propose some measures to: 1) improve the
basis of policy information; and 2) elaborate on what managers of databases could do to
improve the relevance of policy information to its users. To improve the basis of policy
information, interviewees pointed out the need for more tacit and more contextual
knowledge. Even though one respondent argued for more quantitative data (and another
pointed to the need of more comparable data), the need for qualitative data and was clearly
suggested as one way to improve the quality of information. One way to assure this would
be to concentrate and pool research efforts as proposed by one interviewee, since research
efforts were often carried out in parallel, which would leave room for improvement.
Supporting these efforts with financial resources was another suggestion, as well as
regrouping research efforts under the auspices of one organisation which would take the
lead. However, then the reliability of available information would be heavily dependent on
the credibility of such an organisation.

Co-funded by the H2020 Programme of the EU
Grant Agreement no.: 642242
Report on climate change mitigation policy
mapping and interaction
22
Regarding the strengthening of information provision to users (and increasing the
relevance of this information), standardisation efforts were mentioned by one interviewee
as a means to achieve this objective. Other respondents argued for an increased
communication effort in the sense that policy database managers should increase
awareness of existing knowledge in a continuous manner, for instance through a regular
update service (e.g. a newsletter) or presentations to key stakeholders, making use of
several forums such as workshops or expert conferences. Moreover, one respondent
stressed the need to increase usability by using creative visualisation tools and easily
searchable and downloadable information, which was very much in line with findings from
the online survey.
2.4.5 Summary of interview findings
The follow-up interviews corroborated initial research findings as well as survey results,
and provided some additional insights into user needs of policy information databases.
Overall, interviewees argued that information about costs and environmental impacts of
policies was a sought-after quality in policy databases. While some interviewees also
stressed the need to go beyond simple facts and figures and to include more qualitative
information about contextual factors when providing information about climate change
mitigation policies, these were also arguments made by survey participants. However, and
also similar to the survey respondents, interviewed stakeholders opined that the quality of
the information on that matter leaves room for improvement. Interviews and survey both
yielded only a moderate satisfaction with data availability on those matters but also in
general. In addition to that, interview partners emphasised the importance of up-to-date
and even prospective information. However, it is doubtful whether databases can provide
for this timely and continuous flow of information.
Besides those opinions corroborating survey findings, the interviews also yielded some
interesting insights on some of the main findings of both the survey and the initial analysis
of policy databases: the uneven sectoral and geographical distribution of information and
the absence of policy evaluation and assessment.
With respect to the geographical and sectoral distribution of policy information, the
interviews further accentuated the picture, suggesting that sectoral and geographical
information gaps could be due to methodological difficulties in those areas and sectors. For
the agricultural sector for example, linking cause and effect, policies and actual emissions
saved proves to be challenging, while lower policy reporting demands and technical know-
how have been identified as potential barriers for low income countries but also in the
industrialised North.
These methodological difficulties, the lack of appropriate human and financial resources as
well as the perceived sensitivity of the information gathered were suggested as the main
reasons for why policies are seldom evaluated and assessed even on the national level.
Given that databases often rely on information provided by national governments, they

Co-funded by the H2020 Programme of the EU
Grant Agreement no.: 642242
Report on climate change mitigation policy
mapping and interaction
23
subsequently also lack this kind of information. This has been confirmed by interviewees,
but also during the EEA workshop. However, besides those difficulties to get “hard” data,
there also seems to be a need to broaden the analytical assessment spectrum and go
beyond indicators such as costs or emission reductions, and include more social indicators
such as co-benefits into the calculations.
2.5 Conclusions and the way forward
The work on climate change mitigation policy databases described here yielded some
interesting insights and observations. First, the initial analysis of existing databases
allowed for some gauging and categorisation of existing knowledge on climate change
mitigation policies. Second, the survey gave us a better understanding of what kind of
databases are already used by a variety of stakeholders, what kind of information is sought
and where the gaps between this desired information and the actual information available
are to be found. The third step, consisting of interviews with climate change mitigation
experts, corroborated some of the findings from the first two steps, and offered interesting
explanations to some of the questions that had arisen.
Overall, information about climate change mitigation policies is increasingly available and
stakeholders seem to have a good awareness of what information is available. Several
databases managed by well-known organisations such as the OECD seem to be able to
provide information that is deemed trustworthy.
However, the information available does not seem to fully match user needs. Satisfaction
with the information provided by databases was deemed mostly “moderate” by people
surveyed and an initial analysis indeed suggests that there are some gaps in the
information provided. While some sectors and some countries like the energy sector and
European countries are well represented, information about sectors such as agriculture
and/or countries in sub-Saharan Africa is seldom found. Moreover, evaluation and
assessment of climate change mitigation actions is mostly missing but a sought-after
feature by users according to our survey.
However, meeting some of those user needs is challenging. Particularly the issue of timing,
evaluation and assessment are difficult to tackle. Evaluation and assessment of policies is
less straightforward than it seems. Policies are enacted to achieve objectives that are the
product of heavily contested political decision-making processes, and the ultimate
objectives of policies are not always easy to uncover (e.g. to some, the overarching of an
emissions trading system would always be environmental – i.e. emission reductions; to
others, it would be about cost-effectiveness).
Moreover, from a practical perspective, evaluation is already fraught with difficulties at the
primary source: national governments. Resource limitations (both human and financial),
as well as methodological difficulties, can be important barriers for governmental
stakeholders. Also, information provided almost in real time as desired some interviewed
experts desired largely surpasses the capacities of database managers, with the potential

Co-funded by the H2020 Programme of the EU
Grant Agreement no.: 642242
Report on climate change mitigation policy
mapping and interaction
24
exception of larger databases managed by organisations with sufficient capacity. Besides
these major problems, there also seems to be room for improvement when it comes to
avoiding the duplication of information. Although some duplication may in fact be desirable
– as a pluralism of sources and methodologies may yield more insights about the
performance of policies than just one source or method – it may also lead to inefficiencies,
and confusion for the user. Finally, information could be made more appealing to users,
either through better visualisation methods or via searchable and downloadable data.
But despite those difficulties, there are several possible ways forward. First, the use and
usefulness of databases might be enhanced by strengthening their visual potential and
providing users with expressive and convincing graphs or more creative visualisation tools.
Survey respondents and interviewees felt that this might be a useful way to not only
strengthen the interaction with users but also to increase the use of available data.
Second, further efforts could be made to link users to databases. An initial interface
indicating what type of information can be found in which database would already be a first
step. Related to this, better communication by the managers of policy databases about the
information in their databases will be helpful. Users are often not aware of what kind of
information is available in online databases, and a continuous flow of information (regular
updates) was deemed necessary by several interviewees and stakeholders. Moreover,
increased communication effort by managers of databases could provide an opportunity
not only to present what databases can do, but also clearly communicate the limitations of
databases especially when it comes to assessment, evaluation and real-time information.
Third, collaboration across databases offers an opportunity to explore the
complementarities of the available data sources, and to reduce overlaps and exploit
synergies. The collaboration between the IEA and IRENA on renewable energy policies is a
step in this direction, as is the recently announced integration of the LSE Global Climate
Legislation Database and the Sabin Center Climate Change Laws Database.
Finally, given that many data are based on national reporting by countries (e.g. in the EU
or UNFCCC context), improved reporting should improve the quality of information in
databases. This may also, over time, allow for the generation of further information to
assess the environmental, economic and social effects of policies.

Co-funded by the H2020 Programme of the EU
Grant Agreement no.: 642242
Report on climate change mitigation policy
mapping and interaction
25
References
Aldy, J. & Pizer, W. (2016). Alternative metrics for comparing domestic climate change mitigation efforts and
emerging international climate policy architecture. Review of Environmental Economics and Policy, 10(1),
3–24.
Dubash N.K., Hagemann, M., Höhne, N. & Upadhyaya, P. (2013). Developments in national climate change
mitigation legislation and strategy. Climate Policy, 13, 649–664.
Jordan, A., Benson, D., Wurzel, R. & Zito, A. (2011). Policy instruments in practice. In The Oxford Handbook of
Climate Change and Society, Dryzek, J.S., Norgaard, R.B. & Schlosberg, D. (eds.). Oxford University Press,
Oxford.
Smith P., Bustamante, M. Ahammad, H., Clark, H., Dong, H., Elsiddig, E.A., Haberl, H., Harper, J., House, R.,
Jafari, M., Masera, O., Mbow, C., Ravindranath, N.H., Rice, C.W.,. Robledo Abad, C., Romanovskaya, A.,
Sperling, F. & Tubiello, F. (2014). Agriculture, Forestry and Other Land Use (AFOLU). In Climate Change
2014: Mitigation of Climate Change. Contribution of Working Group III to the Fifth Assessment Report of
the Intergovernmental Panel on Climate Change, Edenhofer, O., Pichs-Madruga, R., Sokona, Y., Farahani,
E., Kadner, S., Seyboth, K., Adler, A., Baum, I., Brunner, S., Eickemeier, P., Kriemann, B., Savolainen, J.,
Schlömer, S., von Stechow, C., Zwickel, T., & Minx, J.C. (eds.). Cambridge, UK: Cambridge University
Press.
Umpfenbach, K. (2015). Streamlining planning and reporting requirements in the EU Energy Union framework.
Berlin: Ecologic Institute. https://europeanclimate.org/wp-content/uploads/2016/01/Ecologic-2015-
Planning-Reporting-final.pdf.

Co-funded by the H2020 Programme of the EU
Grant Agreement no.: 642242
Report on climate change mitigation policy
mapping and interaction
26
3 Effects of interactions between EU climate and energy policies
3.1 Introduction
This part of the report analyses case studies of environmental and climate change policies
with a specific focus on how the results of chosen policies have been influenced by other
policies. Policy making usually takes place within complex systems, where multiple policies
and policy instruments are identified to achieve different policy goals (Tinbergen, 1952).
The reason for focusing on policy interactions is that co-existence of policies could also
result in one policy influencing another policy, for example, when they target similar
stakeholders who may respond differently to multiple policies than to an individual policy.
Such interactions could, for example, lead to policies reinforcing each other, but could also
lead to reduced policy effectiveness if one policy has a negative impact on another policy.
Policy interactions can be discussed from at least two perspectives. From the first
perspective, the design features of policies in a policy mix are analysed to identify (positive
or negative) overlaps. For example, as is explained elsewhere in this report, policy makers
for climate change mitigation, energy efficiency improvement and renewable energy
support often realise that their goals and targets may overlap. For greenhouse gas (GHG)
emission reductions, among others, low- or zero-emission energy technologies are needed,
which are also the focus of energy efficiency and renewable energy policies. These overlaps
can be justified if policies reinforce each other or when they focus on different aspects,
such as one policy focussing on current climate goals and another policy focussing on
developing energy technologies that will be needed for future climate and energy goals.
Such discussions also form the basis for environmental policy and economics literature on,
among others, policy instrument choice and justifications for directed technological change
(e.g. Acemoglu, Aghion, Bursztyn and Hemous (2012)).
The INTERACT project12 with its focus on potential interactions between the EU Emissions
Trading Scheme (ETS) and other climate and energy policy instruments in the EU and its
Member States was among the first studies to analyse how policies could interact within a
policy mix, and how policies could influence each other’s effectiveness through such
interactions (Sorrell, et al., 2003). Other studies have analysed policies individually in
terms of their targets and policy instruments and then compared them to see whether their
target setting and instrument choices were consistent (IEA, 2011a; IEA, 2011b;
Oikonomou, et al., 2011; Oikonomou, Flamos, & Grafakos, Is blending of energy and
climate policy instruments always desirable?, 2010; Spyridaki & Flamos, 2014; Duval,
2008; Jensen & Skytte, Interactions between the power and green certificate markets,
2002; 2003).
12 Interaction in EU Climate Policy 2001-2003, an EU funded project in the 5th Framework
Programme.

Co-funded by the H2020 Programme of the EU
Grant Agreement no.: 642242
Report on climate change mitigation policy
mapping and interaction
27
The second perspective complements this analysis by considering aspects that are typically
related to the contexts for the policies, such as economic development, technology
development, people’s awareness and preferences and policy implementation aspects.
Understanding policy contexts is important because consistent policies “on paper” could in
practice have negative interactions if, for example, the policy implementation is different
from what was anticipated, if the response of stakeholders to a set of policy instruments
is different from the assumed response to each individual policy instrument, or if public
acceptance of a policy is lower than anticipated. Consequently, while policy makers may
know and understand policy interactions based on theory and experience with similar policy
mixes in the past, this knowledge of policy instruments and how they are likely to interact
under a range of observed conditions is of limited use if the present context (the current
timeframe a policy instrument operates in) is different from the past context. It is noted
though that this perspective is not so much about policy interactions as it is about different
responses to the same policies given varying (temporal, spatial, social and regulatory)
contexts.
When analysing interactions between energy, environmental and climate policies (and their
policy instruments), the EU-funded project APRAISE (7th Framework programme)
particularly focused, using extensive case study analyses, on the behaviour of stakeholders
and their direct and indirect responses to multiple policy instruments, to explain why actual
policy results differed from expected results (APRAISE, 2012). Figure 3 illustrates the
approach taken by APRAISE, thereby assuming four policies which target two stakeholders.
Stakeholder 1 is targeted by policies 1, 2 and 3, while policy 4 targets stakeholder 2. The
behaviour of targeted stakeholder 1 is thus determined by three policies at the same time,
instead of just one policy. Thus, the stakeholder’s behaviour may differ from what the
policy makers of the individual policies had expected. Moreover, APRAISE (2012) also
explained situations where a stakeholder who is targeted by just one policy, may still
behave differently than expected, because of interactions (e.g., collaboration or
competition) with other stakeholders whose behaviour is affected by other policies. In
terms of Figure 3, there could be interaction between policy 4 and policies 1, 2 and 3
through the interaction between both stakeholders.
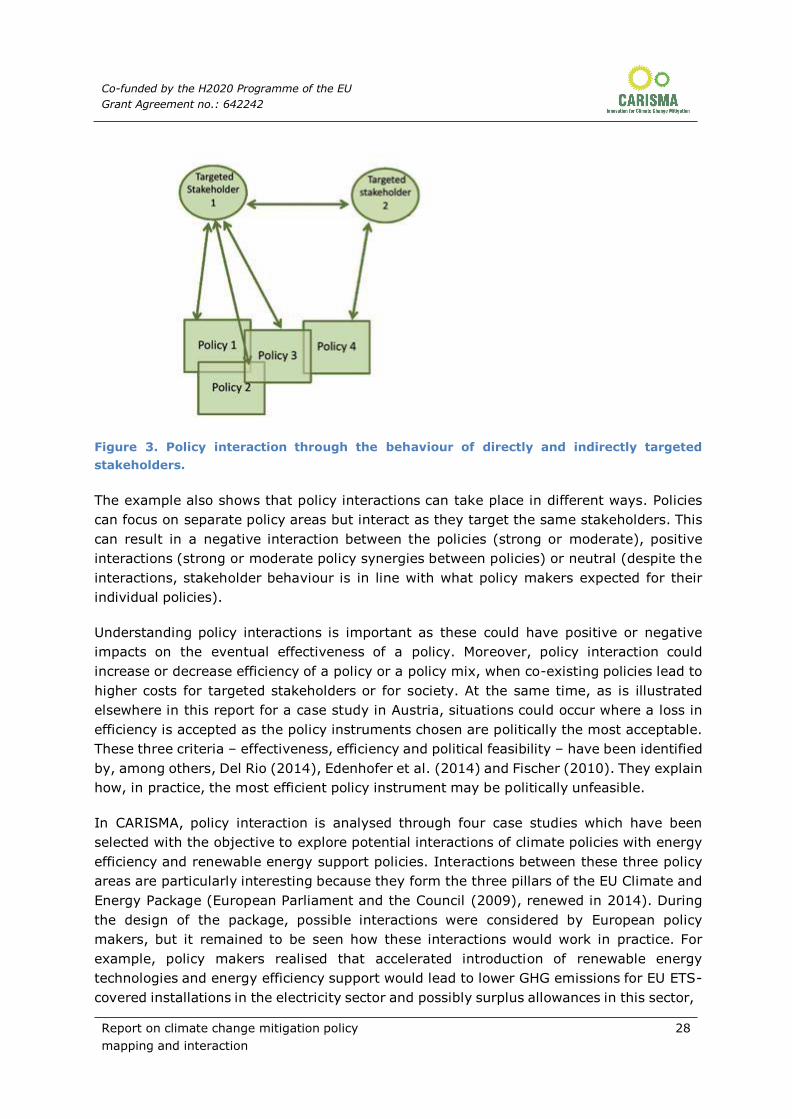
Co-funded by the H2020 Programme of the EU
Grant Agreement no.: 642242
Report on climate change mitigation policy
mapping and interaction
28
Figure 3. Policy interaction through the behaviour of directly and indirectly targeted
stakeholders.
The example also shows that policy interactions can take place in different ways. Policies
can focus on separate policy areas but interact as they target the same stakeholders. This
can result in a negative interaction between the policies (strong or moderate), positive
interactions (strong or moderate policy synergies between policies) or neutral (despite the
interactions, stakeholder behaviour is in line with what policy makers expected for their
individual policies).
Understanding policy interactions is important as these could have positive or negative
impacts on the eventual effectiveness of a policy. Moreover, policy interaction could
increase or decrease efficiency of a policy or a policy mix, when co-existing policies lead to
higher costs for targeted stakeholders or for society. At the same time, as is illustrated
elsewhere in this report for a case study in Austria, situations could occur where a loss in
efficiency is accepted as the policy instruments chosen are politically the most acceptable.
These three criteria – effectiveness, efficiency and political feasibility – have been identified
by, among others, Del Rio (2014), Edenhofer et al. (2014) and Fischer (2010). They explain
how, in practice, the most efficient policy instrument may be politically unfeasible.
In CARISMA, policy interaction is analysed through four case studies which have been
selected with the objective to explore potential interactions of climate policies with energy
efficiency and renewable energy support policies. Interactions between these three policy
areas are particularly interesting because they form the three pillars of the EU Climate and
Energy Package (European Parliament and the Council (2009), renewed in 2014). During
the design of the package, possible interactions were considered by European policy
makers, but it remained to be seen how these interactions would work in practice. For
example, policy makers realised that accelerated introduction of renewable energy
technologies and energy efficiency support would lead to lower GHG emissions for EU ETS-
covered installations in the electricity sector and possibly surplus allowances in this sector,

Co-funded by the H2020 Programme of the EU
Grant Agreement no.: 642242
Report on climate change mitigation policy
mapping and interaction
29
but it was assumed that these surpluses would be absorbed by installations in other ETS
sectors (Fischer, 2015).
However, the example of ETS and RED policy interaction also demonstrates the importance
of policy context. In their design of a policy mix with the ETS and the German feed-in tariff
system, policy makers in Germany had not anticipated the economic crisis after 2008 and
its consequences for the performance of both policy instruments. Because of the economic
crisis, industrial production dropped so that industrial sector installations covered by the
ETS required fewer allowances to cover their actual emissions and therefore did not absorb
the allowance surpluses in the German power sector. In other word, as Fischer (2015) and
Mulder (2016) conclude, while the interaction between RED and ETS was foreseen and
considered manageable, the ETS and RED-policy design has often not been ready for
handling an external shock such as the economic crisis.
The relationship between the German feed-in tariff for stimulation of renewable energy
technologies and the response of German electricity sector stakeholders to that has also
been topic of a PhD research at the University of Groningen (Mulder, 2016). The study
concludes that the performance of the EU ETS has been seriously undermined by the
interaction with “parallel instruments”, i.e. other energy and climate instruments that
operate in parallel to the EU ETS and affect the carbon dioxide (CO2) emission levels of
ETS installation. Mulder (2016) finds that these interactions has lowered the ETS allowance
price by €5 by 2030 (a 14% lower price) compared to a scenario without both parallel
instruments. For the EU as a whole, a similar, though stylised, simulation was performed,
leading to the conclusion that all parallel instruments currently in place in Europe are
expected to lead to a 50% reduction of the allowance price by 2030 (€20; compared to
€40 in a scenario without parallel instruments). Furthermore, in case of stagnating
economic growth, a carbon price below €10 would remain probable even in 2030.
Like Fischer (2015), Mulder (2016) does not proclaim that renewable energy and emissions
trading policies should not co-exist or should not interact. Co-existence of policies can be
justified if a feed-in tariff for developing technologies would help develop technologies that
will be needed for future climate targets. However, to avoid adverse interactions, Mulder
(2016), for example, proposes the introduction of a price floor and ceiling in the ETS and/or
limiting the use of parallel instruments (even though this would lead to reduced certainty
about the quantity of allowances in the ETS).
The CARISMA case study analysis on energy and climate policy interactions aims to
complement existing literature on policy interactions by addressing a set of aspects of
policy interactions related to: the policy levels at which interactions may occur (e.g.
interactions between policies at the national levels for achieving national goals and those
formulated at provincial levels aimed at sub-national goals), inter-temporal interactions
(e.g. interactions between policies aimed at short term versus those aimed at longer-term
policy goals), and interactions that occur if stakeholders are indirectly affected by a policy
instrument (even if they are explicitly excluded from the policy). For that, the following
four case studies have been analysed:

Co-funded by the H2020 Programme of the EU
Grant Agreement no.: 642242
Report on climate change mitigation policy
mapping and interaction
30
France: Impact of the implementation of the RED and energy efficiency measures on
GHG emissions in in the electricity sector under the EU ETS.
Austria: Interaction between energy efficiency policy measures at the levels of the
federal and regional governments.
Greece: Impact of the planned Energy Efficiency Obligation scheme in Greece on the
GHG emissions in the Greek power sector covered by the EU ETS.
EU-level: Implications of interaction between the EU ETS and the Renewable Energy
Directive.
Together, the case studies provide an illustrative pallet of policy interaction examples,
while it is acknowledged that the overview should not be considered fully representative
for all types of policy interactions that may occur because of implementation of the Energy
and Climate Package in the EU and the Member States (European Parliament and the
Council, 2009). For example, no case study was conducted on the above-described
situation in Germany as it has already been widely discussed in several literature sources
(including Fischer (2015) and Mulder (2016)). The EU-level case performs a similar analysis
on ETS and renewable energy interaction, but its geographical focus is broader. As policy
context aspects and analysis is covered by other tasks in the CARISMA project, the case
study analysis in this report does not systematically explore contextual factors in relation
to policy results, but where case study analysis touches upon specific local circumstances
determining policy interactions, these will be discussed.
3.2 Case study analysis approach
The case studies have been analysed as follows:
Introduction: What are the policies for which interaction is analysed?
Short background: What are interactions between the policies addressed by the case
study and how can these influence the results of the policies (impact on policy
effectiveness)?
Analysis of policy interactions: What has been/will be the impact of the policy
interactions on the policy outcomes?
Lessons and recommendations
Stakeholders in the case study contexts have been invited to share their knowledge for the
analysis, via personal communication, interview and requesting reviews of draft texts.
Table 3 presents an overview of the case studies, with indications of the policy areas
covered per case study and analysed for interaction.

Co-funded by the H2020 Programme of the EU
Grant Agreement no.: 642242
Report on climate change mitigation policy
mapping and interaction
31
Table 3. Overview of CARISMA case studies for policy interaction analysis.
Case study
country
Interaction level EU ETS Renewable
energy
Energy
efficiency
France National-regional level
interaction
(ex post analysis)
X X X
Austria National-regional
(ex post analysis)
X
Greece National level interaction
(ex ante analysis)
X X X
EU as a whole EU-level interaction
(ex post analysis)
X X
3.3 Introduction to the EU Directives covered by the case studies
3.3.1 The Energy Efficiency Directive (EED)
In October 2012, the European Commission adopted the Energy Efficiency Directive (EED)
with a goal to reduce consumption of primary energy by 20% by 2020 and enhance energy
efficiency beyond 2020. Member States must adopt national targets and notify these to
European Commission, which will undertake progress assessments and recommend further
measures, when needed (Article 24 of the Directive). The European Commission will
particularly monitor the impact of the EED on the EU ETS.
3.3.2 The EU Emissions Trading System
The EU ETS was established in 2005 to regulate GHG emissions of all major industrial and
power plants in the 28 EU Member States, Norway, Liechtenstein and Iceland. In total, it
covers about 11,000 installations, which account for half of total CO2 emissions in Europe.
The ETS is a “cap and trade” system, which allows installations to emit a certain amount
of CO2 per year. These allowances can be traded in the ETS market. Since 1 January 2013,
allowances have been largely auctioned, instead of freely distributed, as was the case
during the first two ETS phases.
3.3.3 The Renewable Energy Directive
The Renewable Energy Directive (RED) (2009/28/EC) focuses on the promotion of using
energy from renewable sources (e.g. biomass, geothermal, hydrothermal, hydropower,
ocean energy, landfill gas, sewage treatment plant gas, biogases, biofuels, solar and wind).
For that, the directive contains a mandatory target of a 20% share of renewable energy
sources in the EU by 2020. The scope of this directive includes renewable energy sources
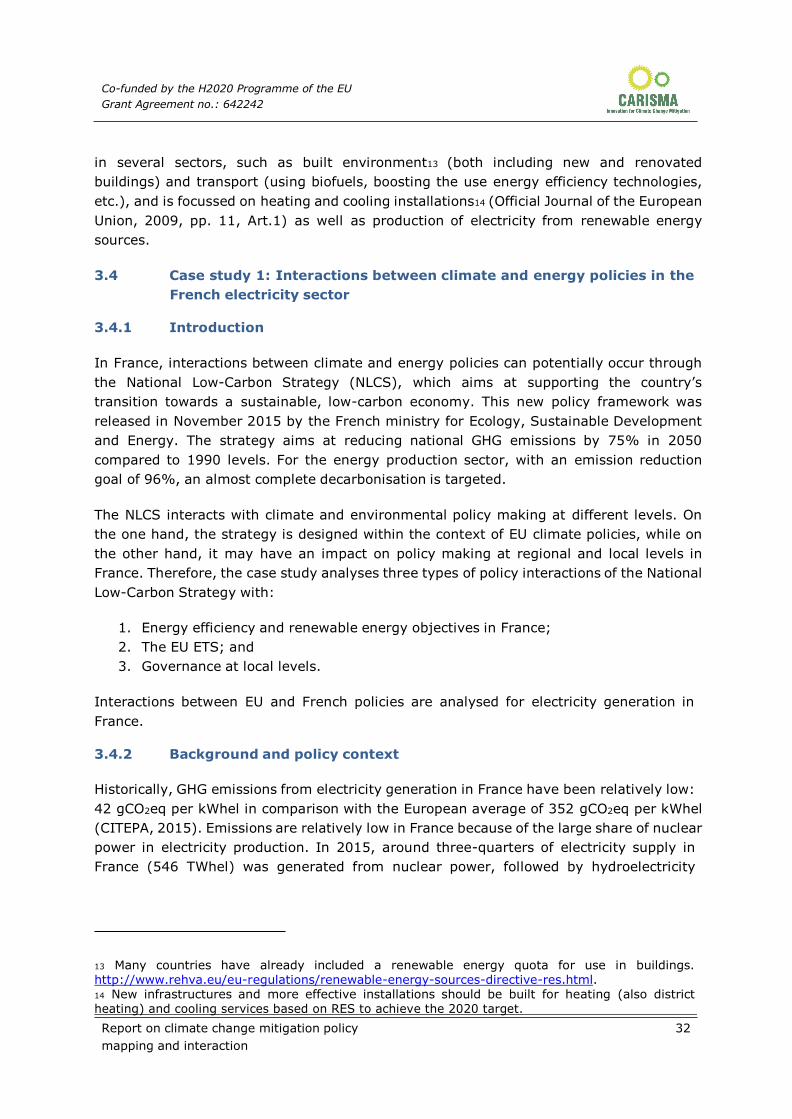
Co-funded by the H2020 Programme of the EU
Grant Agreement no.: 642242
Report on climate change mitigation policy
mapping and interaction
32
in several sectors, such as built environment13 (both including new and renovated
buildings) and transport (using biofuels, boosting the use energy efficiency technologies,
etc.), and is focussed on heating and cooling installations14 (Official Journal of the European
Union, 2009, pp. 11, Art.1) as well as production of electricity from renewable energy
sources.
3.4 Case study 1: Interactions between climate and energy policies in the
French electricity sector
3.4.1 Introduction
In France, interactions between climate and energy policies can potentially occur through
the National Low-Carbon Strategy (NLCS), which aims at supporting the country’s
transition towards a sustainable, low-carbon economy. This new policy framework was
released in November 2015 by the French ministry for Ecology, Sustainable Development
and Energy. The strategy aims at reducing national GHG emissions by 75% in 2050
compared to 1990 levels. For the energy production sector, with an emission reduction
goal of 96%, an almost complete decarbonisation is targeted.
The NLCS interacts with climate and environmental policy making at different levels. On
the one hand, the strategy is designed within the context of EU climate policies, while on
the other hand, it may have an impact on policy making at regional and local levels in
France. Therefore, the case study analyses three types of policy interactions of the National
Low-Carbon Strategy with:
1. Energy efficiency and renewable energy objectives in France;
2. The EU ETS; and
3. Governance at local levels.
Interactions between EU and French policies are analysed for electricity generation in
France.
3.4.2 Background and policy context
Historically, GHG emissions from electricity generation in France have been relatively low:
42 gCO2eq per kWhel in comparison with the European average of 352 gCO2eq per kWhel
(CITEPA, 2015). Emissions are relatively low in France because of the large share of nuclear
power in electricity production. In 2015, around three-quarters of electricity supply in
France (546 TWhel) was generated from nuclear power, followed by hydroelectricity
13 Many countries have already included a renewable energy quota for use in buildings. http://www.rehva.eu/eu-regulations/renewable-energy-sources-directive-res.html. 14 New infrastructures and more effective installations should be built for heating (also district heating) and cooling services based on RES to achieve the 2020 target.
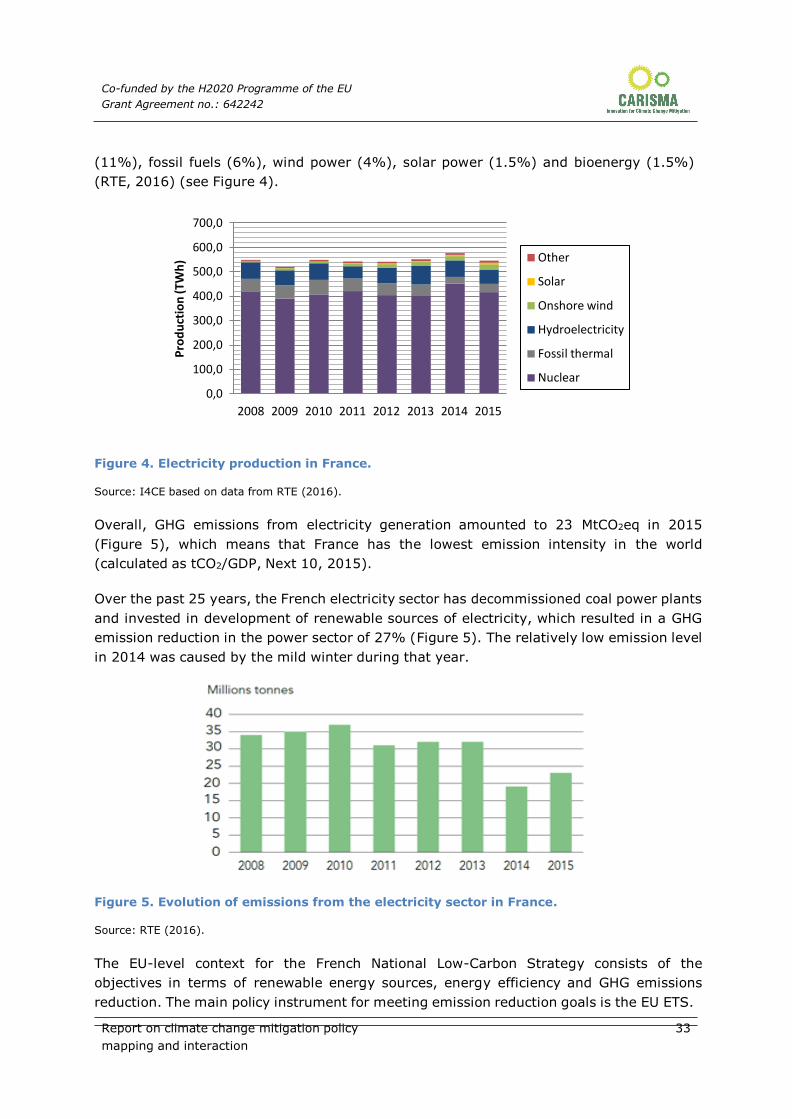
Co-funded by the H2020 Programme of the EU
Grant Agreement no.: 642242
Report on climate change mitigation policy
mapping and interaction
33
Pro
du
ctio
n (T
Wh
)
(11%), fossil fuels (6%), wind power (4%), solar power (1.5%) and bioenergy (1.5%)
(RTE, 2016) (see Figure 4).
700,0
600,0
500,0
400,0
300,0
200,0
100,0
0,0
2008 2009 2010 2011 2012 2013 2014 2015
Other
Solar
Onshore wind
Hydroelectricity
Fossil thermal
Nuclear
Figure 4. Electricity production in France.
Source: I4CE based on data from RTE (2016).
Overall, GHG emissions from electricity generation amounted to 23 MtCO2eq in 2015
(Figure 5), which means that France has the lowest emission intensity in the world
(calculated as tCO2/GDP, Next 10, 2015).
Over the past 25 years, the French electricity sector has decommissioned coal power plants
and invested in development of renewable sources of electricity, which resulted in a GHG
emission reduction in the power sector of 27% (Figure 5). The relatively low emission level
in 2014 was caused by the mild winter during that year.
Figure 5. Evolution of emissions from the electricity sector in France.
Source: RTE (2016).
The EU-level context for the French National Low-Carbon Strategy consists of the
objectives in terms of renewable energy sources, energy efficiency and GHG emissions
reduction. The main policy instrument for meeting emission reduction goals is the EU ETS.

Co-funded by the H2020 Programme of the EU
Grant Agreement no.: 642242
Report on climate change mitigation policy
mapping and interaction
34
In France, 119 aircraft operators and 1,183 industrial and energy production plants are
covered by the scheme, which together represented around 100 MtCO2eq emissions in
2015 (EEA GHG data viewer). 40 installations from the French power sector were covered
by the EU ETS in 2015, which together emitted 16 MtCO215 (European Union Transaction
Log, 2016).
The 2020 European objectives for both the deployment of renewable energy sources and
climate change mitigation efforts (see Section 3) were translated in France in the “Grenelle”
Laws (2009-2010). In 2015, following the updated EU goals for climate and energy
(covering the period 2020-2030) (European Commission, 2014), the French government
released the Energy Transition for Green Growth Act with five main objectives:
40% reduction of GHG emissions in 2030 compared to 1990 levels, in line with the
strategy of the EU;
30% reduction of fossil fuel consumption in 2030 compared to 2012;
Share of nuclear power in the electricity mix brought down to 50% by 2025;
Share of renewable sources of energy brought up to 32% in the total final energy
consumption by 2030;
Decrease by half of the final energy consumption in 2050 compared to 2012.
For achieving these objectives, the above-mentioned NLCS has been launched, which aims,
among others, at a GHG emission reduction from 552 MtCO2 in 1990 to 358 MtCO2 per
year during 2024-2028 (amounting to a 35% reduction). To realise this, the NLCS will
create nation-wide carbon budgets, both for ETS and non-ETS sectors. NLCS aims at an
almost full decarbonisation of energy production and consumption (96% emission
reduction compared to 1990 levels) in 2050, which will be supported by a planned halving
of final energy consumption (in 2050 compared to 2012) and further deployment of
renewable sources of energy.
While ETS-covered installations acquire emission allowances under the EU ETS, for non-
ETS sector installations a carbon tax has been introduced in France in 2014. In 2016, the
carbon tax amounts to €22 per ton of CO2 to be increased over time to €56 by 2020 and
€100 by 2050. For energy efficiency, France targets a 30% reduction in final energy
consumption in 2030 compared to 1990. In terms of renewable energy, the national target
is to achieve a 23% share in final energy consumption, which corresponds to a 27% share
of renewable energy in electricity by 2020, to comply with EU’s renewable energy goal. In
2014, 17% of electricity in France was generated from renewable sources, which was
mainly based on hydroelectricity. For reaching future targets, wind and solar are the two
15 This figure does not consider the fact that combined heat and power (CHP) plants have GHG emissions not related to electricity production. The emissions from electricity generation only are therefore lower.

Co-funded by the H2020 Programme of the EU
Grant Agreement no.: 642242
Report on climate change mitigation policy
mapping and interaction
35
most promising technologies with a potential increase from 15 GW in 2014 to 40 GW in
202316.
3.4.3 Analysis of policy interactions between French policies and EU ETS
3.4.3.1 Impact of French energy efficiency and renewable energy policies on
EU ETS
Berghmans (2012) concludes that national renewable energy deployment policies
contributed around 40% of total emission reductions within EU sectors during Phases II
and III of the EU ETS (2008-2020). In addition, national energy efficiency policies have led
to an emissions reduction of 500 MtCO2 within the ETS. Though the impact of national
energy efficiency and renewable energy policies can be significant at the European level
(see examples in Section 1), given the relatively low level of GHG emissions from electricity
generation in France (23 MtCO2 in 2015) compared to the total amount of allowances in
the EU (about 2 GtCO2 per year), French-level policies implemented in the national
electricity sector are likely to have a minor impact on the EU ETS.
3.4.3.2 The EU ETS impact on French energy efficiency policies through
earmarking auctioning revenues
Based on allowance auctioning, the EU ETS generates a public revenue stream for all EU
Member States which can be invested into cost-effective mitigation opportunities and the
development of low carbon technologies. In France, the government decided in 2013 that
90% of auction revenues were used to finance energy efficiency in the residential sector,
through the French National Housing Agency (Agence Nationale de l’Habitat) (Chevaleyre
& Berghman, 2013). It is noted that since using EU ETS revenues for energy efficiency is
not a necessary/mandatory element of the EU ETS, strictly speaking there is no direct
policy instrument interaction. Indirectly, though, given the political choice to invest part of
the revenues into energy efficiency measures, there is an effect.
3.4.3.3 Impact EU ETS allowance price on French deployment of renewable
energy in France
An intended impact of the EU ETS is to make fossil-fuel-based technologies relatively more
expensive and low-emission technologies more competitive (European Commission, 2012).
However, it has been demonstrated that even if CO2 emissions are duly priced in the power
sector, specific incentives for supporting the deployment of renewable energy technologies
are justified (Philibert, 2011). To further support deployment of renewable energy sources
at the national level, the French government has invested €100 billion in renewable energy
between 2005 and 2011 (ADEME - French Environnent and Energy Agency, 2016).17 In
16 Arrêté relatif aux objectifs de développement des énergies renouvelables, Journal Officiel, April
2016. 17 Through feed-in tariffs, feed-in premiums and revenue complements.
Co-funded by the H2020 Programme of the EU
Grant Agreement no.: 642242
Report on climate change mitigation policy
mapping and interaction
36
addition to these public expenditures, private sector investments have also contributed to
an increased share of electricity produced from solar and wind power from 1% in 2008 to
over 5% in 2015 (I4CE based on data from RTE (2016)). This was a priori driven by the
national renewable energy support measures rather than the EU ETS, but in France, the
EU carbon price was considered a policy signal to create a credible national framework for
promoting renewable energy.
During the annual Environmental Conference in April 2016 in France, the French
government announced that it would unilaterally set a carbon price floor of around
€30/tCO2 on electricity generation activities, including ETS installations in the power
sector, in 2017 (see also Reuters (2016)). With a carbon floor price a minimum price for
CO2 emission allowances is introduced in the market: “polluters must pay a minimum
amount of money for the right to pollute” (Sandbag, 2016). Should the market price drop
to a level below the floor price, companies with CO2 emissions pay a “tax” for the difference
between the market and the floor price. As such, a situation is created that the costs of
emitting CO2 remain relatively high, so that it becomes easier for installations with low- or
zero-emission technologies to compete in the market. Consequently, a carbon price floor
could increase certainty for potential investors in renewable energy and energy efficiency
technologies (Hood, 2011) (Trotignon, 2016). However, it remains to be seen whether a
carbon price floor is sufficiently high to tip the scale to the advantage of clean energy
producers in France, as it will barely be enough to encourage fuel switch from coal to gas.
In an analysis for the UK carbon floor proposal, Sandbag (2016) concludes that due to the
current oversupply of EU allowances in the market, a carbon floor price is not enough to
support the use of clean energy technologies; without measures to tighten the caps on
emissions, a floor price will not be effective. Therefore, the impacts of an EU carbon floor
at the level of €30 as proposed by France on renewable energy stimulation policies in
France, in terms of size, remain uncertain.18
The impacts of interactions of energy support and ETS policies in France are summarised
in Table 4.
18 Nevertheless, despite the uncertainty, it could be argued that an increase in the carbon price will, ceteris paribus, always have an effect. For example, a higher price will unlock several other measures that would have otherwise not have been incentivised.

Co-funded by the H2020 Programme of the EU
Grant Agreement no.: 642242
Report on climate change mitigation policy
mapping and interaction
37
Table 4. Summary of case study results France.
Key variables
ETS, energy efficiency and renewable energy
interaction impacts
CO2 emission
reduction in French
electricity sector
under ETS
National fossil-fuel
minor
Due to low level of GHG emissions from
electricity generation in France, French-
level policies implemented in the national
electricity sector are likely to have a
based electricity
generation
minor minor impact on the EU ETS
Energy and
electricity
demand/households
Decrease
Energy efficiency measures lead to a
reduced consumption of electricity
Energy efficiency
improvement
Increased, but
slowing down
90% of auction revenues of EU
allowances (EUAs) is used for energy efficiency improvement.
Due to lower EUA prices, renewable
energy support funds become lower.
Renewable energy
deployment
Increase
EU ETS was seen in France as a policy
signal for creating a national investment
framework for renewable energy
promotion. A carbon floor price can add more certainty to renewable energy
investors, but interaction between
carbon floor and renewable energy stimulation remain uncertain
3.4.4 Findings
In this case study on policy interactions in the French power sector, the following
conclusions can be drawn:
Energy efficiency and renewable energy stimulation policies implemented by the
French government in the electricity sector are unlikely to have a significant impact on
the EU ETS. This moderate policy interaction is mainly due to the relatively low GHG
emissions of the French electricity companies covered by the ETS. Thus, French-level
policies implemented in the national electricity sector are likely to have a minor impact
on the EU ETS.
The EU ETS impacts energy efficiency improvements in France using through
earmarking auctioning revenues. This policy effect (which, as explained above, may
not be considered a direct policy interaction, but more an indirect policy effect) can be
relatively strong in France, as the French government uses 90% of ETS auction
revenues to finance energy efficiency in the residential sector through the French
National Housing Agency.

Co-funded by the H2020 Programme of the EU
Grant Agreement no.: 642242
Report on climate change mitigation policy
mapping and interaction
38
The EU ETS allowance price can be a complementary policy instrument but is not
enough for large deployment of renewable energy in France. The French government
invested in renewable energy technology deployment through a subsidy scheme
amounting to €100 billion between 2005 and 2011, which has increased the share of
solar and wind energy in total energy production from 1 to 5% (between 2008 and
2015). To further support renewable energy deployment, the French government has
announced a carbon floor price for on electricity generation. However, the effect of
the latter policy interaction remains uncertain.
3.5 Case study 2: Interactions between energy efficiency policies in the
household sector in Austria
3.5.1 Introduction
In Austria, overall final energy consumption has increased again after the sharp decline in
2009, which was due to the financial crisis and corresponding economic recession. To
address this trend, Austria’s Energy Strategy, the National Renewable Energy Action Plan
(NREAP) and the Energy Efficiency Law have set a target value for primary energy
consumption of 1050 PetaJoule in 2020 (compared to 1120 PJ in 2013, see Figure 6).
Nevertheless, despite a range of measures in place, without additional efforts it will be
difficult to reach the target (Austrian Environment Agency, 2016). Therefore, Austria has
implemented the EED in 2015 via its Energy Efficiency Law, which will add additional
financial means to the existing policy framework.
Figure 6. Final energy consumption in Austria (2005-2020).
Source: (Austrian Energy Agency, 2015).
However, these additional policy measures for reducing energy demand come on top of
already existing policy measures, which increases the risk of possible overlaps with already
existing policy instruments.
Co-funded by the H2020 Programme of the EU
Grant Agreement no.: 642242
Report on climate change mitigation policy
mapping and interaction
39
3.5.2 Background and policy context
The relevant policy framework at the EU level for the Austrian policy instruments for energy
efficiency improvement consists of the EU RED, the Energy Performance of Buildings
Directive (EPBD) and the EED. The transposition of the RED in Austria has taken place via
the National Renewable Energy Action Plan, per which Austria must increase its share of
renewable energy in gross final energy consumption to 34% by 2020. This target is not
very ambitious, as the share of renewables in Austria had already reached a level of 29%
in 2008. Under the EPBD, all new buildings in Austria must fulfil a near zero-energy
standard by the end of 2020 (for public buildings this deadline needs to be reached already
by the end of 2018). Finally, the EED requires Austria to use energy more efficiently at all
stages of the energy chain from its production to its final consumption. Following the
transposition of the above EU directives into domestic legislation, the following policy
instruments have been formulated in Austria for energy efficiency in the household sector,
which are, except for the Federal law on energy efficiency, mainly subsidy schemes:
Renovation check (“Sanierungscheck”), which is a subsidy, provided at the
federal government level, in the form of a unique and non-repayable grant, which
private households obtain for the refurbishment of dwellings older than 20 years, such
as through insulation of outer walls and ceilings, replacement of windows and doors
and change of conventional heating systems to renewable systems.
The Federal Housing Subsidy Law (“Wohnbauförderungsgesetz”), which
includes general conditions for the provincial governments for energy efficiency
improvement measures in the built environment, such as thermal insulation and space
and water heating measures (MURE, 2015). Allocation of the subsidies is regulated by
provincial law and each province has a scope of freedom to decide on subsidy amounts
and set their own subsidy conditions and limitations, given the general federal
conditions. Subsidies in the scheme are provided mainly in form of soft loans. Potential
applicants are private persons, non-profit making housing associations, municipalities
and other legal entities.
Subsidies of the Austrian Energy and Climate Fund, which can both be focused
on energy conservation and GHG emission reduction measures, such as investments
in energy efficient stoves in households.
Federal law on energy efficiency (“Energieeffizienzgesetz”), adopted in 2016,
which obliges energy suppliers to initiate and annually implement energy efficiency
measures corresponding to at least a 0.6% reduction of their total energy supply to
energy end users in Austria in the preceding year aiming at a reduction of 159 PJ on
aggregate by 2020 (Government of Austria, 2016). At least 40% of these required
efficiency measures must be implemented by energy suppliers at the household level.
Based on reported plans, 40% of the intended measures relate to lighting, 30% to
kitchen devices and 20% to heating and warm water. As part of the energy efficiency
law a monitoring institution was created to support companies in complying with the
law and to evaluate proposed measures.

Co-funded by the H2020 Programme of the EU
Grant Agreement no.: 642242
Report on climate change mitigation policy
mapping and interaction
40
As can be concluded from this overview of energy efficiency enhancement plans, Austrian
energy and climate policy is characterised by a dense landscape of subsidies, including
investment incentives and subsidised loans for the adoption of energy-efficient
technologies. The subsidies are provided both at the federal and provincial government
levels.
3.5.3 Analysis of energy efficiency policies at different government levels
The effectiveness of the schemes is difficult to determine precisely. For example, the total
electricity consumption of Austrian households has increased, but this was largely due to
an increase in the number of households in Austria (E-Sieben, n.d.), which offset the
decrease in average household electricity consumption (by 230 kWh per year during 2008
to 2012). Moreover, as shown in Figure 7, Austria’s energy consumption in the household
sector over the past ten years has been above the EU average, but in terms of energy per
unit of GDP, it has been around or below the EU average. Austria has also managed to
continue the trend of decreasing energy consumption in households during the past few
years, while the EU average trend has shown an increase in energy consumption since
2012. Stakeholders consulted for this case study (from government, business and
research) have indicated that the overall decrease in energy demand in households cannot
be clearly attributed to the existing energy efficiency policy instruments, as the influence
of the mild winters in the past few years in Austria may also have been an important
explanation for lower household-level energy consumption.
Figure 7. Energy consumption in households in Austria and the EU as well as disposable
income.
Source: (Austrian Energy Agency, 2015).
Co-funded by the H2020 Programme of the EU
Grant Agreement no.: 642242
Report on climate change mitigation policy
mapping and interaction
41
In terms of policy interactions, the case study has analysed whether energy efficiency
improvement policies at the federal government level could lead to overlaps with policies
at the level of provincial governments and what this could mean for the effectiveness and
efficiency of the policies. At the federal government level, several ministries have specific
energy-related responsibilities, while at the regional level, the governments of the nine
federal provinces have responsibility for policy making, including setting subsidy levels and
implementing regulatory control of energy companies.
The case study analysis concludes that overlaps between federal and regional subsidies for
energy efficiency are unavoidable as the scope, instruments and target groups of different
subsidy scheme are too often similar. As such, this does not have to be a problem if in the
design and implementation stages, a detailed fine-tuning of measures takes place.
However, in actual practice fine-tuning of federal government energy efficiency policies
with all nine provinces is complicated as the provinces differ from each other in terms of
their regional policies and subsidies, based on different priorities, political coalitions and
technological as well as socioeconomic boundaries. Level and implementation of housing
subsidies vary in all federal states. Although the national government assigns federal states
with a specific funding volume, federal states are not obliged to report on the use of the
funding. This can result in cash flows to purposes that are different from the initial
purposes, which could lead to inefficiencies regarding the intended policy achievement
(Fruhmann, Tuerk, Kulmer, & Seeabauer, 2017 forthcoming).
An example of such fine-tuning can be found in the implementation of the Energy Efficiency
Law. As the law prescribes that 40% of the required energy efficiency measures should be
implemented by energy suppliers at the household level, there is a potential overlap with
existing policies, especially governmental subsidies for stimulating household-level energy
efficiency improvements. The Energy Efficiency Law tries to avoid such overlaps by an
“additionality check”: measures under the Renovation check and Housing Subsidy Law
cannot be accounted for under the new Energy Efficiency Law. For other measures that
energy suppliers want to have accounted for under the law, a combination with existing
subsidies is possible, and the accounted savings can be shared among the two funders (the
regional or national government and the companies under the energy efficiency law). This
requires an agreement between the two funders how the savings are shared before the
measure can be accounted for under the new energy efficiency law. So far, there has been
little experience with these provisions. Some NGOs complained that the legal basis to share
the accountable savings is too vaguely defined, especially with those measures that already
received federal subsidies in 2014 and 2015.
The federal government has made steps to avoid policy overlaps by limiting in some cases
combinations of its subsidy system with other regional subsidies. Moreover, a possible way
forward is to design a new target-oriented policy mix that is not entirely based on subsidies.
For example, energy saving investments in households that require complex financing
models (due to high transaction costs and long payback periods) cannot be induced by
subsidies alone. Some of the stakeholders interviewed for this case study mentioned that
for some measures, standards or a combination of standards with subsidies would be a

Co-funded by the H2020 Programme of the EU
Grant Agreement no.: 642242
Report on climate change mitigation policy
mapping and interaction
42
better way forward (it is noted that these views do not necessarily imply that there is
consensus on this topic in Austria). This would require terminating or changing some of
the subsidies. The latter may not be easy though as subsidies have the largest political
acceptance among policy instruments in Austria. Subsidies have been in place for long and
have been agreed on in a political process with a range of different interests that needed
to be satisfied. Such a “subsidy lock-in” of a policy system is not easy to change in the
short term.
A possible step forward in avoiding policy overlaps is the new monitoring institution in
Austria, which:
Systematically assesses the measures proposed by entities under the new Law on
Energy Efficiency. In case overlaps are expected or known, the other funding
institutions in Austria are contacted, and the share of funding and corresponding
energy savings can be split.
Increases the knowledge of the effectiveness and efficiency of energy efficiency
measures in Austria. The methods to assess effectiveness and efficiency are being
steadily further developed by the monitoring institution.
Develops national energy efficiency action plans that are submitted to the European
Commission. So far, the entire policy mix is not systematically considered but
stakeholders expect that the integrated climate and energy plans recently proposed
by the European Commission, if adopted, will require EU Member States investigate
and consider policy interactions much more strongly.
A better understanding of inefficiencies may serve as a suitable basis for improving and
fine-tuning the policy mix at a later stage.
3.5.4 Findings
Based on the case study on interactions between energy efficiency policies at different
policy levels in Austria, the following key findings can be formulated:
Overlaps between federal and regional subsidies for energy efficiency are unavoidable.
The scope, instruments and target groups of different subsidy schemes are often
similar. This could be avoided through a detailed fine-tuning in the policy design and
implementation stages, but in actual practice fine-tuning of federal government energy
efficiency policies with all nine provinces is complicated.
Overlaps in subsidies, over-subsidisation or insufficiently targeted use of funds imply
the risk that government funds are used inefficiently. Thus, the observed energy
savings in households are achieved at relatively high public costs. Moreover, in terms
of policy effectiveness, it is not entirely clear whether the observed reduction in
household-level energy demand during the past few years can be fully attributed to
the subsidy schemes. On the one hand, in terms of energy demand reduction Austria

Co-funded by the H2020 Programme of the EU
Grant Agreement no.: 642242
Report on climate change mitigation policy
mapping and interaction
43
performs better than the EU-average, but this performance may also have been caused
by the relatively mild winters in recent years.
A possible way forward is to design a new target-oriented policy mix that is not entirely
based on subsidies, but, for instance, enables a combination of energy or
environmental standards with subsidies.
The impacts of interactions of energy support policies at different policy levels in Austria
are summarised in Table 5.
Table 5. Summary of case study results Austria.
Key-Variables Impact of policy interactions on policy effectiveness
Caused by increase in the number of Electricity Increase
demand/households households
Caused by energy efficiency measures
and weather conditions. Energy demand Energy demand
Decrease reduction is however achieved in an /households
inefficient way due to overlapping
support schemes
National fossil-fuel Decrease consequence of lower energy Decrease
based generation demand
Decrease consequence of lower energy National CO2 Decrease
demand emissions
3.6 Case study: Interactions between the energy efficiency obligation and
the EU ETS in Greece
3.6.1 Introduction
Currently, the Greek government is formulating an Energy Efficiency Obligation scheme
(EEO, under the EU Energy Efficiency Directive). It targets energy distributors and retail
energy sales companies that are responsible for the installation, operation and
maintenance of smart-meters for electricity, gas, heating, cooling and hot water for
domestic consumption. Their obligation is to provide incentives to final energy consumers
to either adapt their energy consumption behaviour, or purchase energy-efficient
technologies.
This case study analyses potential interactions between the EEO and the EU ETS. Such
interactions could work in both directions. On the one hand, energy efficiency measures
may lead to lower electricity demand and thus reduce the demand of ETS power sector
installations for allowances. On the other hand, the ETS market price can lead to a higher
Co-funded by the H2020 Programme of the EU
Grant Agreement no.: 642242
Report on climate change mitigation policy
mapping and interaction
44
wholesale price for electricity which electricity distributors can pass on to consumers, so
that they have an incentive to save energy. In order to understand potential interaction
effects between the schemes in Greece and whether their parallel operation contradicts
their intended outcomes or causes potential unintended effects (e.g. environmental side-
effects or distributional effects), this case study analyses possible interactions between an
EEO scheme for retail energy sales companies in Greece and the obligations for energy-
producing installations in Greece that are covered by the ETS.
3.6.2 Background and policy context
Most electricity production in Greece is still carried out by the Public Power Corporation
(PPC), which owns transmission and distribution networks and is the major supplier for
customers. The Greek electricity market, despite its deregulation, remains concentrated
with PPC holding a share of 71.5% in the electricity market and only two other utilities
having a share of more than 5%. Since 2013, electricity producers in Greece are required
to purchase their ETS emissions allowances through auctions. Although this development
was expected for years, PPC did little to upgrade its energy portfolio for lower-emissions
electricity production and reduce compliance costs (Moris., 2013), as the company, given
its market share, usually follows the practice of passing on emission allowance purchase
costs to customers via the electricity bills. In fact, PPC has already proposed to the
Regulatory Authority of Energy (RAE) to increase charges for all customer categories (low,
medium and high voltage).19
In other words, higher wholesale prices are translated into higher retail prices for
consumers also for the Greek energy market. The economic recession and the consequent
reduction for electricity demand (PPC emissions in 2011 recorded a decrease of 10% from
2008) eventually softened this effect of passing on additional costs to retail prices.
The use of energy from renewable energy sources was promoted both in electricity
production and heat supply and transportation. In 2014, a Feed-in Tariff (FiT) scheme was
introduced to support that (under the so-called “New Deal”) (MStR Law Firm, 2014).
Moreover, the use of renewable energy technologies in heating and cooling has been
supported by the provision of subsidies granted by the government. Finally, in the transport
sector obligations have been introduced for use of fuel types, as well as taxes for different
kinds of polluting vehicles.
In many cases these implemented measures overlap, since a strict categorisation of
measures is not always possible. For instance, some measures mainly refer to renewable-
based electricity generation projects, but also cover renewable-based heat generation
19 Announcement from RAE 11/12/2012:
http://www.rae.gr/site/categories_new/about_rae/factsheets/general/11122012_2.csp.

Co-funded by the H2020 Programme of the EU
Grant Agreement no.: 642242
Report on climate change mitigation policy
mapping and interaction
45
projects (e.g. via the FiT), such as renewable energy-based co-generation installations and
other thermal energy generation projects.
The EU EED was only recently transposed into Greek law (in 2015). In view of the
requirements of the EED, the energy savings target for the period 2014-2020 amounts to
3.33 Mtoe, which is almost equal to 19.3% of the total final consumption in 2012. By 2020,
annual energy saving is targeted at 902.1 ktoe. Energy conservation measures in the
building sector are scheduled to contribute almost 58% of the national energy efficiency
target. The EEO scheme has been implemented since 1 January 2017 for contributing to
the national energy savings target (in the context of Article 7 of the EED). The policy
instrument for operating the EEO scheme in Greece is currently in its early formation phase.
Based on conversations held with Greek stakeholders (for this case study), it seems likely
that emphasis under the EEO will be placed on energy savings in the built environment
(residential dwellings and public buildings). Importantly, Greece has opted (in line with the
provisions of Article 7 of the EED) for excluding industrial sectors from the calculation of
the final energy savings target.
Table 6 summarises the key features of the two schemes for which the interaction analysis
is undertaken. Please note that for the EEO scheme, the description provided is a proposal
of its design, which is yet to be decided.

Co-funded by the H2020 Programme of the EU
Grant Agreement no.: 642242
Report on climate change mitigation policy
mapping and interaction
46
Table 6. Summary of the key features of the policy instruments.
Policy instrument 1:
EU ETS Policy instrument 2:
EEO scheme (proposed)
Level of
governance European National
Timeframe 2013-2020 (3rd phase of
implementation)
2017-2020 (1st phase of
implementation)
Type of
intervention Quota, market-based Command & control/ market-
based subsidies
Policy
target/outcome To reduce emissions of CO2
by setting a quantity limit. To
achieve national emissions
reduction target
No targets so far. Achieve final
energy savings targets in
frame of EED
Policy scope
/sector covered Energy-intensive installations (i.e. industry) and energy
production utilities
All end-use sectors with a focus on buildings.
Targeted
stakeholders
Obligated parties: Energy-
intensive industry, aviation,
energy-producing
installations
Obligated parties: retail energy
sales companies in gas &
electricity,
Eligible parties: third parties
(e.g. ESCOs, companies). Beneficiaries: households, public
buildings, vehicle drivers
Allocation of costs
Increase of the wholesale
electricity price, which is
passed on to the retail
electricity price.
Full cost-recovery is envisaged
to be allowed (additional costs
to be passed on to electricity
consumers through the retail
electricity price)
Flexibility Trading of emission
allowances
Not described so far. Financial
assistance and advice/audits to
consumers is foreseen to be
provided.
Related market
(price & quantity)
variables20
i) Wholesale electricity price
ii) Retail electricity price
iii) Electricity supply and demand
iv) CO2 Emissions allowances v) Price of emissions
allowances
i) Retail electricity price
ii) Electricity supply and demand
iii) CO2 Emissions allowances iv) Price of emissions allowances
Source: Authors’ own elaboration.
20 Τhese variables are listed here as they enable an analysis of how consumers’ and producers’
surpluses change due to concomitant implementation of the two schemes (compared to their surplus
when the schemes are in effect standalone).

Co-funded by the H2020 Programme of the EU
Grant Agreement no.: 642242
Report on climate change mitigation policy
mapping and interaction
47
Lignite
Natural
Gas
3.6.3 Analysis of policy interactions between the EEO, EU ETS and RED
When introducing an EEO scheme in an electricity market that is covered by the ETS, the
expectation is that demand for electricity will be reduced. In Figure 8 this is illustrated by
a shift from the electricity curve to the left, leading to a new equilibrium with a lower
wholesale price for and a lower quantity of wholesale electricity in the market. In terms of
quantity of electricity supplied to the market, the EEO enhances the impact of the ETS. As
shown in Figure 8, the ETS already leads to a quantity reduction (from QNo-ETS to QETS,
following a move along the demand curve) and due to the impact of the EEO, traded
electricity is further reduced to QETS, EEO (following a shift from the demand curve). In terms
of price development, the EEO is expected to reverse the wholesale electricity price
increase caused by the ETS (from Pwno_ETS to PwETS following the move along the demand
curve) by stimulating a price reduction (from PwETS to PwETS,EEO due to the shift from the
demand curve). This implies that the more expensive producing units stay out of the
market and do not generate electricity for the specified period.
Wholesale el. price
(€/MWh)
PwETS
PwNo_ETS
PwETS,EEO
DETS-EEO
DETS
S(1)
Natural
Gas
P
et
rol
eu
m
SETS
SNo-ETS
Hydro & RES
Lignite
QETS
QNo-ETS
QETS,EEO
Electricity (MW)
Figure 8. The impact of an EEO scheme on the Greek wholesale electricity market regulated
by the EU ETS.
The introduction of an EEO scheme may amplify the impact on energy retailers in
comparison with a situation in which they are only targeted by the ETS. Although the
obligation scheme will have no direct effect on the wholesale electricity price, a reduction
in final energy demand (which is the main intended outcome of the EEO) can cause the
power production units with the highest marginal costs, based on the merit order, to reduce

Co-funded by the H2020 Programme of the EU
Grant Agreement no.: 642242
Report on climate change mitigation policy
mapping and interaction
48
their power output, which could consequently lead to an electricity price reduction21. In the
longer run, energy efficiency gains will affect the power plant mix, changing the merit order
curve (Altmann, et al., 2013). Peak generators in the Greek power mix, which have the
highest variable (i.e. fuel) operating costs, are mainly diesel generators and natural gas
combustion turbines. Therefore, in periods with low electricity demand, it is highly likely
that gas-fired plants will reduce their power output. In this case, the imposition of the EEO
on the Greek electricity market can potentially make it more difficult or expensive to
increase renewable energy in the long term due to the reduction in fast-ramping gas
turbines that might be needed to balance variable/ intermittent RES. Operating units are
also faced with a profit reduction (i.e. lower producers’ surplus) as the difference between
their marginal costs and lower wholesale price becomes smaller (due to decrease in
demand for electricity).
The reduction of CO2 emissions caused by electricity savings depends on the type of power
plant that reduces its output, which may also vary depending on the time of day. In Greece,
the main fuels used for electricity production are lignite, natural gas and petroleum
products, and the impact of saving a KWhel in terms of CO2 emission reduction depends
on the power plant and time of the day. For the Greek fuel mix it can range from 550
gCO2/kWhel if natural gas is saved to almost 1,200 gCO2/kWhel if a lignite fired power
plant reduces its output.
When it comes to meeting climate policy commitments, the EEO scheme can pose
implications as it does not account for the CO2 intensity of different generating sources.
The imposition of the obligation scheme along with the structure of the Greek power
generation market may thus lead to a lock-in problem as this implicitly promotes cheaper,
but more carbon-intensive lignite generation at the expense of less carbon intensive
sources (e.g. natural gas). If the EEO scheme were revised to aim at CO2 reduction rather
than energy demand, in combination with a stricter EU ETS cap, it could become an efficient
climate policy tool.
With respect to impact on diffusion of low emission technologies at the end-user level in
Greece, the EEO scheme is expected to act as a strong driver for energy efficiency as it
helps to provide a stable source of funding and stimulates the development of the ESCO
(energy services company) market (European Commission, 2014). In that sense, the EEO
is expected to drive additional investments in energy efficiency measures, which will lead
to additional energy savings, compared to the situation with only the EU ETS, thus
reflecting a positive interaction between the two policy instruments.
At the same time, the EEO scheme is not aimed at accounting for switching from fossil
fuel-based to renewables-based energy consumption if the total energy consumption
remains the same. After all, in that case, one cannot speak of final energy saving. Instead,
21 When an emissions cap is in place, lower electricity demand compared to a reference case will lead to lower emission allowance prices and thus lower electricity prices, as long as there is no policy intervention (Thema, Suerkemper, Grave, & Amelung, 2013).

Co-funded by the H2020 Programme of the EU
Grant Agreement no.: 642242
Report on climate change mitigation policy
mapping and interaction
49
the energy end-use saving measures are considered eligible provided that they are more
energy efficient (than the baseline technology) and result in final energy savings. This may,
however, include the replacement of inefficient oil boilers with more efficient natural gas
boilers, which risks locking in technologies that are not compatible with the long-term
decarbonisation objective (and that do not significantly improve security of supply). In that
respect, the EEO could have a negative impact on investments in a low-emission climate
future.
On the other hand, Greek energy policy makers point out that arguably the biggest rival
of energy efficiency in the energy market is RES diffusion and subsequent state support.
There is a wide mix of policy measures for the promotion of RES systems for heating and
cooling in buildings as well as in the transport sector, while the new EEO scheme should
focus on energy end-use efficiency, thereby fostering savings at the demand side.
Last but not least, electricity consumers are expected to be directly influenced in a number
of ways by the combination of the EEO and ETS impacts on energy-intensive industries.
On the one hand, electricity retail prices may increase as power producers pass on the
costs of purchasing ETS allowances to consumers. Consumers may also be confronted with
an add-on to electricity prices in order cover deficits in the Special RES Account in Greece.22
On the other hand, further reductions in energy demand (due to both the carbon and EEO
charges on electricity bills, as well as due to energy efficient investments) may lower the
wholesale and subsequently the retail electricity price. Increases in energy costs can also
be offset for beneficiaries of the EEO scheme who receive financial aid for energy efficiency
investments. Overall, the reduction in the retail electricity price (due to reduction in
demand) is most likely to be offset by the expected increases in both GHG emission charges
and cost-recovery charges.23 Such surcharges in prices may in turn have substantial
distributional and political implications. For instance, a surcharge based on electricity
generation does not differentiate by carbon-intensity of the technologies used, so that, for
example, the surcharge, when expressed in €/tCO2-eq., is much higher for natural gas-
based electricity production than for, e.g., lignite-based power production.24
22 The Market Operator (LAGIE) is authorised to operate the support and funding mechanism for the
remuneration of the generated energy from RES power plants, through a dedicated account (Special Account for RES). Although the revenues of this account come from different sources, there are two primary revenue sources: 1. A charge calculated upon the consumed energy that all consumers pay through their electricity bills; 2. the amount resulting from the day-ahead electricity market dispatch (Anagnostopoulos, 2016 ). 23 Experience from European EEO schemes has shown that allowing for full cost-recovery of costs results in annual consumer charges ranging from 0.02 to 0.06 €/KWhel for consumers in the household sector (ENSPOL, 2015). 24 A volumetric charge on every kWh sold is comparable to an energy or carbon tax, and at the level
of 5-6 cents such a charge is quite significant if expressed in terms of tCO2-eq. For example, assuming that producing 1 KWhel using natural gas technology leads to emissions of 0.55 kgCO2, then generating 1.818 KWel causes an emission of 1 tCO2. At the upper range of a surcharge of 6 eurocents per kWhel, this would lead to an effective carbon price for producing electricity with natural gas of nearly €110/tCO2. For lignite, with a carbon intensity of over 1 kg/kWhel this could amount to up to €50 per tCO2.
Co-funded by the H2020 Programme of the EU
Grant Agreement no.: 642242
Report on climate change mitigation policy
mapping and interaction
50
Finally, the use of revenues from auctioning emissions allowances in the power sector can
be used to support energy savings at the end use level. Hence the impact of the EU ETS
on the EEO scheme and energy efficiency stimulation could become more positive.
However, until the end of 2015, the total revenues from auctions of CO2 allowances in
Greece were channelled to the Special RES Account. As of 1 January 2016, this was stopped
and an upcoming Ministerial Decision will determine the new allocation of the revenues. It
requires that at least 50% of these revenues are directed to "green actions", which may
also include the strengthening of RES support. The Ministry of Energy has reportedly
decided to allocate a 70% share of these revenues on supporting renewable energy
technology diffusion by contributing to the Special RES account. This offers an opportunity
to dedicate these funds to renewable energy technologies, which could go at the expense
of investments in energy savings technologies and may risk the successful implementation
of the EEO scheme, especially during the first critical years of its operation.
3.6.4 Findings
This case study discusses potential implications of introducing and EEO scheme in the EU
ETS regulated energy market in Greece, in terms of changes in the distribution of costs
and benefits for relevant market players. These effects are likely to occur due to
interactions (overlaps) between the two policy instruments and are exacerbated by the
operation of the Greek energy market, its nature (i.e. relatively concentrated) and several
market failures. Below, the implications of policy co-existence, likely to be observed due
to the expected Greek EEO design, are summarised, which may act as a trigger for
recommendations to Greek policy makers.
The increasing compliance costs of the combined EEO and ETS scheme for energy
producers are most likely to be passed on to Greek electricity consumers, lowering
their consumer surplus significantly especially in the short-term. Alternative financing
approaches to counterbalance the increase in compliance costs are highlighted as a
priority action for Greek policy makers. For that, the Greek Government envisages the
creation of a National Energy Efficiency Fund to support the obligation scheme with
revenues coming from alternative sources although its scope remains relative
ambiguous.
The Greek EEO scheme and its short-term targets may jeopardise the attainment of
long-term GHG emission targets due to a lower price for allowances, which may
implicitly put off R&D efforts in more efficient low emission technologies. Lower
emission prices due to less scarcity of allowances in the market can be mitigated by
temporarily withholding emission allowances to tackle the current and future
oversupply in the ETS.25
25 This argument is elaborated on in more detail in a Working Document on this case study, which can be downloaded from http://carisma-project.eu
Co-funded by the H2020 Programme of the EU
Grant Agreement no.: 642242
Report on climate change mitigation policy
mapping and interaction
51
Most importantly, the combination of EEO and RES policies can fundamentally alter the
merit order in Greek (and European) wholesale electricity markets, pushing natural
gas out down the merit order and reducing EUA prices, thereby weakening the fuel-
switch effect of a reversal in the clean dark and spark spread.
Investments in RES technology in end-use sectors (e.g. buildings or transport) are
discouraged within the implementation of the obligation scheme. To avoid lock-in
phenomena in fossil-fuel technologies at the demand-side, it is advisable to Greek
policy makers to consider putting in place energy efficiency measures under Article 7
(of the Energy Efficiency Directive). This would lead to changes in terms of final energy
savings, but also in terms of energy sources and therefore CO2 emissions.
The use of revenues from auctioning emission allowances in the power sector can be
used to support energy savings at the end use level. Hence the impact of the EU ETS
on the EEO scheme and energy efficiency improvements could become more positive.
The possible impacts of interactions of ETS, EEO and renewable energy support policies
are summarised in Table 7.

Co-funded by the H2020 Programme of the EU
Grant Agreement no.: 642242
Report on climate change mitigation policy
mapping and interaction
52
Table 7. Summary of case study results for ETS and EEO scheme interaction impacts.
Key Variables
EU ETS & Greek EEO scheme
Electricity demand Decrease Reduction in demand due to energy
efficiency investments and higher retail
electricity prices
Wholesale
electricity price
Decrease The shift in the demand curve to the left
results in lowering the wholesale price, since
less electricity is needed to cover lower
demand levels than with the ETS stand-
alone.
Retail electricity
price
Ambiguous/
Increase
Reduction in the retail electricity price (due
to reduction in demand and subsequent
reduction in the wholesale price) is likely to
be offset by the expected increases in both
GHG emissions chargers and cost-recovery
charges.
National fossil-fuel
based electricity
generation and
CO2 emissions
Decrease Decrease due to lower demand than with the
ETS alone; lower emissions from the power
sector due to reduction in demand in non-
ETS sectors (e.g. buildings).
Non-RES
Producers’ surplus
Ambiguous Lower surplus than with the ETS alone due to
decrease in demand may be offset by the
benefits from the ETS (reduction in emission
due to reduction in energy demand leading
to lower compliance costs).
Consumers
Surplus
Decrease Surplus is likely to be lower than with EU ETS
alone especially for non-EEO beneficiaries of
energy efficient investments.
EE technology
investments
Increase Investments in energy efficiency
technologies will be increased more than
with the ETS alone
RES technology
investments
Decrease Investments in RES technology are likely to
be reduced in the long term than with the
ETS alone due to lower emission prices and
non-eligibility of measures resulting in
primary energy savings.
Co-funded by the H2020 Programme of the EU
Grant Agreement no.: 642242
Report on climate change mitigation policy
mapping and interaction
53
3.7 Case Study 4: Interaction between the EU ETS and the Renewable
Energy Directive at the EU level
3.7.1 Introduction
When the original ETS Directive was drafted and later revised (European Union, 2003;
2009), the effects of the RED on the EU ETS were considered, but it is unlikely that the
effects of ETS Phase I (2005-07) and its transition to Phase II (2008-12) were anticipated.
The latest ETS reform proposal (European Commission, 2015) for Phase IV (2021-2030)
provides an opportunity to review in a systematic way the impacts of the co-existence of
the ETS and policies based on RED. A priori, this co-existence could be justified for several
reasons: to correct for market and policy failures and to meet multiple targets and
objectives (Rey, L., et al., 2013; Löschel & Schenker, 2015; Lehmann & Gawel, 2011;
OECD, 2011), but could also lead to lower policy effectiveness and efficiency.
This case study examines primarily the effects of the EU RED on the implementation of EU
ETS, with a focus on two main sources of literature: one from the research community
(both scientific and policy research) and the other based on consultation of market
participants (the power and trading sectors). At the same time, this analysis not only looks
at policies and policy instruments but also at policy targets (i.e. renewable energy targets,
GHG emission reductions).
3.7.2 Background and policy context
The adoption in 2008 of the EU’s Climate and Energy Package for 2020 (European
Parliament and the Council, 2009) was a strategic policy choice to support the UNFCCC
climate negotiations in Copenhagen (2009). As such, the package was mainly a climate
package with EU energy policies, especially those relying on renewable energy and energy
efficiency, contributing to the EU’s climate policy and the EU’s position in international
climate negotiations. This policy landscape has significantly changed since the start in 2015
of the European Energy Union, which has a stronger focus on the supply side of the energy
market, including security of energy supply and the internal energy market. Thus, EU
climate policy nowadays is also aimed at contributing to the Energy Union. Nevertheless,
the role of the ETS as the main European instrument to meet its 2030 climate target in the
most cost-effective manner was not only confirmed in the European Council Conclusions in
October 2014 (Council of the European Union, 2014) but also reaffirmed in the EU’s post-
Paris strategy published in March 2016 (European Commission, 2016).
A majority of European stakeholders perceive the ETS as the main policy instrument for
inducing GHG emission reductions (e.g. Nordeng et al. (2014) (2015), Fujiwara (2015)).
On the other hand, there are interesting changes in stakeholders’ perceptions as well as
Member States’ preferences. First, there is an increasing view that in contrast to the
conventional wisdom (Sartor & Mathieu, 2015), the ETS will remain the best but not the
only instrument for EU climate policy, and can be combined with other policy instruments
such as subsidies for renewable energy (for variance in preference across member states,

Co-funded by the H2020 Programme of the EU
Grant Agreement no.: 642242
Report on climate change mitigation policy
mapping and interaction
54
see Nordeng et al. (2015)). Second, there is a shift in preference for choice of policy
instruments, such as a shift from Feed-in-Tariffs (FiTs) to Feed-in-Premiums (FiPs) for
supporting renewable energy technology development (e.g. Ragwitz (2015). In a survey,
to which about 75 ETS-covered installations responded, 19% answered that the EU ETS
had induced their companies to reduce emissions in the early phase but has little impact
now. By comparison, 32% suggested that the ETS had and would continue to cause
reductions, while 29% were of the view that it had not and would not likely cause any
reductions (Nordeng, A. et al., 2015).
A survey commissioned by the European Commission found that carbon abatement and
prices for emission allowances were not the primary drivers for most companies and
sectors to invest in carbon-efficient solutions. Nevertheless, the survey concluded on a
positive note that the ETS played a supportive role in many decisions, especially in the
early years of the second ETS phase when the price was higher (around 2008-2009). This
has induced installations to minimise energy costs, improve financial viability and
profitability, raise awareness for climate issues at the management level and among
employees, and build capacity for more accurate monitoring and reporting of emissions
(European Commission, 2015). A ZEW survey among German installations revealed that
in ETS Phase I and Phase II the main drivers for these installations were the need for them
to reduce energy and raw material costs and improvements in the general efficiency of the
production process (European Commission (DG Climate Action), 2015).
3.7.3 Analysis of policy interactions RED and ETS at EU-level
The European Commission’s impact assessment for the 2020 Climate and Energy Package
(European Commission, 2008) assessed impacts of various design choices to implement
both renewable energy and GHG emission reduction targets. Nevertheless, actual effects
of the RED were realised by market participants such as power companies and traders,
then later verified by researchers when data for the ETS Phase I became available for ex-
post evaluation. By 2010, emission reductions triggered by the RED were estimated at
around 50 MtCO2 across the EU ETS sectors (IETA, 2015). Another assessment found that
over the last six years, renewable energy capacity has led to a reduction of GHG emissions
in the ETS-covered power sector of around 15 Mt every year (Energy Aspects, 2015).
Similar conclusions were found in an ex-post assessment based on the data from 12
Member States in Western and Southern Europe between 2007 and 2010: deployment of
renewable electricity technologies displaced CO2 emissions within the ETS sectors, thereby
reducing demand for ETS allowances resulting in a lower allowance prices (Van den Bergh,
Delarue, & D'haeseleer, 2012).
A case study of Germany showed that approximately 10 to 16% of the reduction in CO2
emissions from the electricity sector between 2005 and 2011 could be attributed to the
increase in the share of renewable energy technologies the energy mix (Weigt, Delarue, &
Ellerman, 2012). More recently, Berghmans et al. (2014) conducted an ex-post assessment
for CO2 emissions from the electricity sector in the EU during Phases I and II (2005-12)
and concluded that supporting policies for renewable energy generation enhanced
Co-funded by the H2020 Programme of the EU
Grant Agreement no.: 642242
Report on climate change mitigation policy
mapping and interaction
55
reductions of CO2 emissions in the power sector. Most of the new renewable energy
generation capacity was set in place by Member States in the form of FiTs or green
certificates without a link to EU allowance (EUA) prices. Berghmans et al. (2014) conclude
that CO2 emission reductions within the ETS-covered sectors have been mainly induced by
stimulation measures for renewable energy technologies. This has also been due to the
low ETS market prices because of the economic crisis, as with low allowance prices fewer
incentives exist for ETS installations to invest in low emission technologies. Koch et al.
(2014), using a data set which includes a full period of ETS Phase II (2008-12) and the
first year of Phase III (2013), also concluded that growth in renewable energy deployment,
especially that of wind and solar, contributed to (further) lowering EUA prices, although
they found that the effects of renewable energy growth on EU allowance prices are smaller
than what ex-ante simulation-based assessments predicted.
With a view to the future, IETA (2015) expects that interacting EU policies, including the
energy efficiency, renewable energy and Ecodesign Directives, will reduce demand for EUA
by 1.1 billion tonnes by 2020. Based on a calculation of the impact on emission reductions
from renewable energy sources in 2020, renewable energy generation in the EU-28
between 2008 and 2020 would amount to a reduction in demand for EUAs of approximately
210 MtCO2 (IETA, 2015). Similarly, other reports assume continuation of renewable energy
uptake but on a smaller scale, due to a fall in the levels of subsidies26 with annual emission
reductions from renewable energy in the range of approximately 10-15 Mt (Carbon Weekly,
2016).
Because of perceived low EUA prices over the long term, most ETS-compliant companies
in the power sector have stalled investments in newer and low-emission gas-fired plants
while having kept running existing coal and lignite-fired plants which have lower operating
costs (e.g. installation CEZ, see European Commission (2015)). An energy market research
group, AG Energiebilanzen (2015) (also quoted in an analysis by Carbon Pulse (2016)),
estimated that energy-related CO2 emissions in Germany increased by 0.9% in 2015 due
to increased energy demand (primarily due to the weather, which was slightly cooler than
the very mild previous year, and the associated higher demand for heating energy) and more
burning of lignite and natural gas. This figure would have been higher without a 10.5%
increase in renewables-based power (Carbon Pulse, 2016).27
Several stakeholders in the energy sector are concerned about the overlap of multiple
instruments and multiple objectives. For example, RWE suggests the use of the ETS for
climate policy and to move away from FiTs and towards FiPs and tendering schemes for
renewable energy support.28 In addition to the ETS, Repsol views that multiple targets for
renewable energy, fuel quality, and energy efficiency create a complex regulatory
26 For the case of Germany, see Nordeng et al. (2015). 27 Among other renewable technology types, wind power on land and off shore showed a plus of 50% compared to the previous year. The share of solar energy (photovoltaics and solar-thermal energy) increased by 6% and that of biomass by 2% (AG Energiebilanzen, 2015). 28 RWE, presentation at the 3rd POLIMP stakeholder workshop, Brussels, 11 February 2015.

Co-funded by the H2020 Programme of the EU
Grant Agreement no.: 642242
Report on climate change mitigation policy
mapping and interaction
56
framework with additional risks for competitiveness and uncertainties (European
Commission (DG Climate Action), 2015). CEZ even sees “a threat that the increased
deployment of renewables, based on a non-market approach and relying on national
support schemes, conflicts with the EU ETS as it creates emission buffers in the ETS with
absolute targets” (CEZ in European Commission (DG Climate Action) (2015)). Such
adverse effects have been also acknowledged by the research community (e.g. (Sartor &
Mathieu, 2015; Berghmans, Cheze, Alberola, & Chevallier, 2014; Van den Bergh, Delarue,
& D'haeseleer, 2012).
On the other hand, based on the concerns about the potential of the ETS to drive low-
emission technologies and innovation, most studies reviewed for this case study
recommend the continuation of combining different approaches, which they view as
complementary, instead of relying on the ETS as the only instrument of EU climate policy.
Based on the literature review and stakeholder consultation, there are three main
suggestions to avoid and/or mitigate possible detrimental effects of renewable energy
support on the ETS:
1. The ex-ante assessment of the ETS cap at the start of each Phase, i.e. no ex-post
adjustment to the cap during the Phase
Possible policy interaction effects need to be fully accounted before setting the ETS cap for
each phase through the review of the Linear Reduction Factor. At the start of a phase there
is a possibility for adjustments, depending on the need for making progress towards the
2050 goal (80-95% GHG emission reductions from 1990 levels) and in international
negotiations (IETA, 2015). Aligning complementary policies with the ETS means that the
ETS cap should be reduced by an equivalent amount of abatement expected from
complementary investment support policies in the context of National Energy and Climate
Plans (NECP) (Sartor & Mathieu, 2015) (for NECP see European Commission (2015).
2. Transparency in information
Greater transparency in information is needed to assess the adequacy of the ETS cap and
to monitor impacts of abatement delivered through complementary policies such as
renewable energy support. Essential data include GHG emission reductions and sub-
sectoral allocation at an installation level, as well as costs and impacts of complementary
policies (IETA, 2015). For example, this requires differentiation of technology types, as the
evidence for effects of renewable energy support measures on the ETS was robust in wind
and solar, but not necessarily in hydro (Koch, Fuss, Grosjean, & Edenhofer, 2014). In
addition, energy traders argue that Member States and the European Commission do not
provide detailed fundamental assumptions at a local or aggregated level, particularly on
economic growth (GDP growth) and carbon intensity (emission per unit GDP), and that
Member States fail to inform about the impacts that National Energy and Climate Plans
would have on the ETS (European Federation of Energy Traders, 2016).
3. The Market Stability Reserve

Co-funded by the H2020 Programme of the EU
Grant Agreement no.: 642242
Report on climate change mitigation policy
mapping and interaction
57
It was the over-achievement of the renewable energy target which caused high uncertainty
about the level of demand for EUAs (Jalard, Dahan, Alberola, Cail, & Keramidas, The EU
ETS emissions reduction target and interactions with energy and climate policies, 2015a).29
While the Market Stability Reserve (MSR) primarily aims to restore the balance between
supply and demand and enhance the ETS resilience against external shocks, it can be
regarded as the only and most effective instrument in place to mitigate the impacts of
complementary policies, which were unpredictable or/and unavoidable, during the phase.
It may not avoid the problem at its origin but could repair the negative effect of those
policies by withdrawing allowances from auctioning (IETA, 2015; Jalard, Dahan, Alberola,
Cail, & Cassisa, 2015b). The amount of withdrawal may be determined based on
assessment of different scenarios assuming different rates of increase in abatement
resulting from complementary policies such as on renewable energy (Sartor & Mathieu,
2015).
These three suggestions are not mutually exclusive but related to each other. Long-term
scarcity should be ensured by the ex-ante assessment of the ETS cap, which requires
comprehensive data collection and periodic and systematic monitoring of impacts of
abatement from complementary policies. Unavoidable effects of the latter could be
mitigated to some extent using the MSR.
The EU-level impacts of renewable energy support schemes on the ETS are summarised in
Table 8.
29 Unlike energy efficiency or offsets, the renewable energy target itself was accounted for in the ETS cap-setting at the start of Phase 3. What was unaccounted for was the overachievement of the target. Renewable energy policies accounted for a large share of CO2 emission reductions but their
contribution to allowance surpluses did not contribute significantly to the increasing surplus in contrast to the impacts of energy efficiency policies and offsets (Jalard, Dahan, Alberola, Cail, & Keramidas, The EU ETS emissions reduction target and interactions with energy and climate policies, 2015a).

Co-funded by the H2020 Programme of the EU
Grant Agreement no.: 642242
Report on climate change mitigation policy
mapping and interaction
58
Table 8. Summary of case study results on interaction renewable energy schemes and ETS
(at EU level).
Key variables
Impact of ETS and RED interaction
CO2 emissions in ETS power sector
Decreased
Renewable energy (through RED) has led
to additional emission reductions in ETS
sectors (e.g. 15 Mt per year during
2010-2015).
However, due to lower EUA prices, ETS-
compliant companies kept coal and
lignite-fired plans operational, which
counter-weighted the RE-induced
emission reduction
EUA price
Decreased
Renewable energy development support
has reduced demand for EUAs in ETS
sectors, resulting in EUA price reduction.
Renewable
electricity
technology
deployment
Increased
Instruments such as FIT and FIP have
resulted in stronger deployment of
renewable energy technologies, which
had not yet reached the stage of
commercial application.
Low emission
energy investments
in ETS power sector
Decreased
Most ETS-compliant companies in the
power sector have stalled investing in
newer and low-carbon gas-fired plants
due to lower EUA prices
3.7.4 Findings
From this EU level case study on interactions between renewable energy support policies
and the EU ETS, the following key findings can be presented:
The combination of policy instrument for energy efficiency improvement, renewable
energy support and the EU ETS can be justified because each of them has its own
target under the EU Climate and Energy Package.
Nevertheless, detrimental effects of renewable energy support measures on the EU
ETS have been among the major concerns of EU stakeholders in the power and energy
trading sectors. The overachievement of the renewable energy target meant that in
the power production sector demand for ETS allowances decreased, resulting in a lower
ETS market price. In terms of efficiency, this resulted in a loss as emission reductions
delivered by renewable energy support measures such as FiTs have higher abatement
costs than those through cap-and-trade systems such as the EU ETS.
While interactions between the policy instruments were foreseen, the overachievement
of the renewable energy target was not anticipated. This success has been driven by

Co-funded by the H2020 Programme of the EU
Grant Agreement no.: 642242
Report on climate change mitigation policy
mapping and interaction
59
policy objectives other than GHG emission reductions, e.g., energy security and air
pollution reductions. The current EU policy framework in this field, the Energy Union,
aims at an increase in renewable energy share for multiple reasons.
It is important to understand how RED affects the ETS, and to identify the conditions
under which this effect will become detrimental to undermining the purpose of the
latter, and how this can be prevented. For that the case study analysis concludes on
three key measures:
o The effects of policies such as renewable energy support need to be fully
accounted for when the ETS cap is set at the start of each ETS Phase through
the review of the Linear Reduction Factor, for which greater certainty about
future RES deployment would be needed, or more frequent reviews and
updates of the linear reduction factor under the EU ETS,30
o Greater transparency in information is needed to assess the adequacy of the
ETS cap and to monitor impacts of abatement delivered through
complementary policies such as RE,
o The Market Stability Reserve is the only and most effective instrument
currently available at the EU level to mitigate the impacts of complementary
policies, which are unpredictable or/and unavoidable.
3.8 Key findings from the case study analysis
In this part of the report, interactions between EU climate and energy policies have been
analysed based on four case studies. The case studies, while acknowledging that they
cannot cover the full landscape of potential energy and climate interactions, nor cover the
full policy landscape of all EU Member States, illustrate how simultaneous implementation
of policies can lead to interactions. Policies covered by the case studies are in the areas of
energy efficiency improvement, renewable energy support and the EU ETS. In three of the
case study the analysis has focused on national policies which are the result of transposing
the EU Directives for Renewable Energy, Energy Efficiency and the ETS into national law.
Findings from the four individual case studies were formulated in the preceding sections.
This section contains a few key findings which have been generated from the case study
analysis and which are assumed to have a wider applicability to cases of other energy and
climate policy interactions.
Consistency between policies during policy design stages: Policy interaction can take
place at the level of policies’ overarching objectives, policy instruments (to achieve
policy objectives) and their design characteristics (target, scope, technologies, and
target groups). Policy co-existence can be justified if the policies are aimed at different
30 Both of they may have tradeoffs: RES auctions and quota systems, for instance, tend to exclude smaller RES investors, such as households, farmers etc., while frequent updates to the linear reduction factor introduces new uncertainty and risk into the EUA market.

Co-funded by the H2020 Programme of the EU
Grant Agreement no.: 642242
Report on climate change mitigation policy
mapping and interaction
60
targets, such as one policy to achieve short-term environmental targets and another
policy for longer-term targets. Policies can be considered consistent when individual
policy instruments do not contradict each other, but instead, result in synergies within
the policy mix. To avoid negative interactions, it is therefore important that ex ante
impact assessments of policies consider potential interactions and ensure that they all
work in the same “direction”.
Have provisions in place in case the effects of policy interactions are not anticipated or
stronger than anticipated: There can be cases in practice where a specific policy
interaction is assumed to lead to synergistic effects (e.g. policies all contribute to CO2
emission reduction), but that actual practice shows that the policy results are
undesirable. For example, the EU-level and Greek case studies on interaction between
ETS and renewable energy support and ETS and the energy efficiency obligation
scheme, respectively, has shown that accelerated deployment of renewable energy
technologies has resulted in extra CO2 emission reductions, larger EUA surpluses and
a lower EUA price. While beforehand, these effects were expected (although not to the
full extent as experienced, due to uncertainty about RES growth and target
overachievement), the impacts of the economic crisis after 2008 on the ETS market
were not anticipated. Consequently, market imbalances could not be repaired.
Quantity management solutions, such as the ETS Market Stability Reserve (EU case
study) or price floors (French case study) can serve as a solution for that.
Streamline and fine tune policy making at different policy making levels within
countries: While most of the case studies focus on interactions between different policy
instruments covering different policy areas (i.e. energy efficiency, renewable energy
and climate), the case study in Austria has shown an example of policy interactions
taking place within one policy area but between federal and provincial levels of
government, which both, quite independently from each other, operate subsidy
schemes for energy efficiency improvements in households. The case study has shown
that Austria’s energy consumption in households decreased over the last years, which
is likely to be attributable to energy efficiency measures at different government levels.
However, it also raises the question of how efficient the current policy mix has been
and whether there is a need to reform the current system towards a policy mix that is
not entirely based on subsidies. One potential issue, which has been mentioned in the
Austrian case study, is that more efficient federal and provincial mixes of energy
efficiency policies may require termination or changing some of the subsidies. At the
same time, subsidies have the largest political acceptance among policy instruments
in the country, which may require a trade-off between policy efficiency and acceptance.
Renewable energy targets formulated as percentages can “automatically” be achieved
because of energy efficiency policies: The French case study shows how renewable
energy targets were “automatically” met because of achieving energy efficiency goals.
Due to energy efficiency measures, energy consumption reduced, so that renewable
energy goals, formulated as a percentage of energy consumption, were automatically
met (assuming that renewable energy generation does not drop with reduced energy

Co-funded by the H2020 Programme of the EU
Grant Agreement no.: 642242
Report on climate change mitigation policy
mapping and interaction
61
demand31). While this is no problem for short-term policy goals, this interaction
reduces the pressure to increase investments in renewable energy technologies, which
may be detrimental for development of technologies needed for future energy and
climate goals. To mitigate this, renewable energy targets can be set as absolute
amounts of renewable energy to be produced/consumed.
Impact of policy interactions partly depends on (energy) market characteristics: The
case study in Greece has shown how a monopoly situation in the electricity market can
lead to a passing on to consumers of increasing compliance costs due to the combined
effect of the energy efficiency obligation and ETS schemes for energy producers. The
case study in France has demonstrated that interaction between national renewable
energy support policies and the EU ETS is much weaker than in other Member States,
especially compared to Germany, as the French power sector has a relatively small
CO2-intensity so that national policies are likely to have a negligible impact on the EU
ETS (in terms of surpluses and prices).
Short-term interactions between EU ETS and renewable energy policies may result in
negative impacts on the fuel-switching between coal and natural gas. Additional RES
policies were aimed incentivising RES investments, but in co-existence with the EU
ETS, and against the backdrop of the economic recession, these incentives contributed
to lower EU ETS allowance prices, which has been primarily favourable for coal-based
technologies and detrimental to natural gas-based technologies.
31 For example, if wind turbines are not replaced once they reach the end of their useful lifetime.

Co-funded by the H2020 Programme of the EU
Grant Agreement no.: 642242
Report on climate change mitigation policy
mapping and interaction
62
References
Acemoglu, D., Aghion, P., Bursztyn, L., & Hemous, D. (2012). The Environment and Directed Technical Change.
American Economic Review, 131-166.
ADEME - French Environnent and Energy Agency (2016). Marches et Emplois lies a l’Efficacite Energetique et aux
Energies Renouvelables: Situation 2013-2014 et persective de long terme.
AG Energiebilanzen (2015). Press Release, Nr. 06/2015, 21 December.
Altman, M., Michalski, J., Brenninkmeijer, A., Lanoix, J.-C., Tisserand, P., Egenhofer, C., Ellison, D. (2010). EU
Energy Efficiency Policy – Achievements and Outlook. Brussels: European Parliament.
Altmann, M., Zerhusen, J., Maio, P., Lanoix, J.-C., Trucco, P., Egenhofer, C., Theiss, J. (2013). Energy Efficiency
and the ETS. Retrieved from:
http://www.europarl.europa.eu/RegData/etudes/etudes/join/2013/492468/IPOL-
ITRE_ET(2013)492468_EN.pdf.
Anagnostopoulos, P., N.-A. Spyridaki, A. Flamos (2016). A “New-Deal” for the development of photovoltaic
investments in Greece? A parametric techno-economic assessment. Working Paper.
APRAISE (2012). The APRAISE 3E Method - Deliverable 2.2. Groningen, the Netherlands; Graz, Austria:
Consortium for FP7 project APRAISE.
Austrian Energy Agency (2015). Final energy consumption in Austria 2005-2020, Vienna.
Austrian Environment Agency (2016). Klimaschutzbericht 2016. Vienna.
Berghmans, N. (2012). Energy efficiency, renewable energy and CO2 allowances in Europe: a need for
Coordination. CDC Climat Research, Climate Brief n°18.
Berghmans, N., Cheze, B., Alberola, E., & Chevallier, J. (2014). The CO2 emissions of the European power sector:
economic drivers and the climate-energy policies ‘contribution. CDC Climat Research.
Carbon Pulse (2016, February 3). Germany’s energy-related CO2 emissions up 0.9% in 2015. Retrieved from
Carbon Pulse: http://carbon-pulse.com/13587/.
Carbon Weekly (2016). Energy Aspects. Retrieved from:
https://www.energyaspects.com/publications/view/european-carbon180116.
Chevaleyre, G., & Berghman, N. (2013). Revenu des enchères de la Phase 3 de l’EU ETS: une nouvelle ressource
publique. CDC Climat Research, Point Climat n°36.
CITEPA (2015). Rapport National d’Inventaire pour la France au titre de la Convention cadre des Nations Unies sur
les Changements Climatiques et du Protocole de Kyoto. Paris, France: Centre Interprofessionnel Technique
d’Etudes de la Pollution Atmosphérique.
Council of the European Union (2014). European Council conclusions, 23-24 October 2014, Brussels.
Cour des Comptes (French Court of Audit) (2013). La politique de développement des energies renouvelables,
Rapport public thématique, Paris.
Del Rio, P. (2014). On evaluating success in complex policy mixes: the case of renewable energy support schemes,
Policy Science, 47, 267-287.
Duval, R. (2008). A Taxonomy of Instruments to Reduce Greenhouse Gas Emissions and their Interactions. Paris:
OECD Economics Department Working Papers, No. 636.
Edenhofer, O. et al. (eds.) (2014). Climate Change 2014: Mitigation of Climate Change. Contribution of Working
Group III to the Fifth Assessment Report of the Intergovernmental Panel on Climate Change, Cambridge
University Press, Cambride, UK, USA.
Energy Aspects (2015, June 30). Greece is the Word, Retrieved from:
https://www.energyaspects.com/publications/view/greece-is-the-word.
Co-funded by the H2020 Programme of the EU
Grant Agreement no.: 642242
Report on climate change mitigation policy
mapping and interaction
63
Energy Aspects (2016, January 18). European Carbon, Retrieved from:
https://www.energyaspects.com/publications/view/european-carbon180116.
ENSPOL (2015). Report on existing and planned EEOs in the EU - Part II Description of planned schemes,
Retrieved from: http://enspol.eu/results.
E-Sieben (n.d.). E-Sieben project: Electricity consumption of Austrian Households, Retrieved from: http://www.e-
sieben.at/en/projects/1206_austrian_electricity_diary.php.
European Commission (DG Climate Action) (2015). Study on the impacts on low carbon actions and investments
of the installations falling under the EU emissions trading system (EU ETS), final report, ZEW, SQ Consult,
CE Delft, ICF International, Publications Office of the European Union.
European Commission (2008). Impact assessment, Document accompanying the Package of Implementation
measures for the EU's objectives on climate change and renewable energy for 2020. Commission Staff
Working Document, SEC (2008) 85/3, Brussels.
European Commission (2009). National Action plans, Greece, Brussels.
European Commission (2012). The State of the European carbon market in 2012, DG Clima European
Commission, COM(2012) 652, Brussels.
European Commission (2014). A Policy Framework for Climate and Energy in the Period from 2020 to 2030,
COM(2014)15 final, Brussels, Belgium. Retrieved from: http://eur-lex.europa.eu/legal-
content/EN/ALL/?uri=CELEX:52014DC0015.
European Commission (2014). Energy Efficiency and its contribution to energy security and the 2030 framework
for climate and energy policy, COM(2014)0520 final, Brussels.
European Commission (2015). Annex: Guidance to Member States on National Energy and Climate Plans as part
of the Energy Union, Communication from the Commission to the European Parliament, the Council, the
European Economic and Social Committee, the Committee of the Regions and the European Investment Bank,
COM(2015) 572, Brussels.
European Commission (2016). The Road from Paris: assessing the implications of the Paris Agreement and
accompanying the proposal for a Council decision on the signing, on behalf of the European Union, of the
Paris agreement adopted under the United Nations Convention on Climate Change. Communication from the
Commission to the European Parliament and the Council, COM(2016) 110 final, Brussels.
European Federation of Energy Traders (2016). Tackling overlapping policies with the EU ETS, EFET discussion
paper, 18 January 2016.
European Parliament and the Council (2009). 2020 Climate and Energy Package, Retrieved from:
http://publications.europa.eu/resource/cellar/49c57f2a-3d7a-41d3-9471-fc2734119eba.0006.02/DOC_1.
European Union (2003). Directive 2003/87/EC of the European Parliament and of the Council of 13 October 2003
establishing a scheme for greenhouse gas emission allowance trading within the Community and amending
Council Directive 96/61/EC, Official Journal, Official Journal of the European Union, L275/32, Brussels.
European Union (2009). Directive 2009/29/EC of the European Parliament and of the Council of 23 April 2009
amending Directive 2003/87/EC so as to improve and extend the greenhouse gas emission allowance trading
scheme of the Community, Official Journal of the European Union, 5.6.2009, Brussels.
European Union Transaction Log (2016). EUTL Data Viewer, retrieved from
http://ec.europa.eu/environment/ets/allocationComplianceMgt.do;EUROPA_JSESSIONID=Ym4CpTdWrzoD
7tm9XIm5x0NNnOFv0Y7l-Y79CnNJe8jljX9J9V-r!12068461.
Fischer, C. (2015). Overlapping Climate and Energy Policy Instruments in the EU: Ready for 2020 and Beyond?
Dissertation thesis University of Oxford.
Fischer, C., & Preonas, L. (2010). Combining Policies for Renewable Energy: Is the Whole Less than the Sum of
Its Parts? RFF Discussion Paper 10-19, Resources for the Future, Washington, D.C.

Co-funded by the H2020 Programme of the EU
Grant Agreement no.: 642242
Report on climate change mitigation policy
mapping and interaction
64
Fruhmann, C., Tuerk, A., Kulmer, V., & Seeabauer, S. (2017 forthcoming). System complexity as key
determinants in achieving efficacious policy transposition and implementation, JOANNEUM RESEARCH, Graz.
Fujiwara, N. C. (2015). ‘European Stakeholders’ Perspectives on the EU ETS, POLIMP Policy Brief, No. 3, Retrieved
from: https://www.ceps.eu/system/files/PB_European_stakeholders_perspectives_0.pdf.
Government of Austria (2016). Federal law on energy efficiency. Retrieved from:
https://www.ris.bka.gv.at/GeltendeFassung.wxe?Abfrage=Bundesnormen&Gesetzesnummer=20008914.
Hood, C. (2011). Summing Up the parts, Combining policy Instruments for Least-Cost Mitigation Strategies.
IEA/OECD, Paris.
IEA (2011a). Energy efficiency policy and carbon pricing. International Energy Agency, Paris.
IEA (2011b). Summing up the parts – combining policy instruments for least-cost climate mitigation strategies -
Information Paper, International Energy Agency, Paris, France.
IETA (2015). Overlapping policies with the EU ETS. IETA, Geneva.
Jalard, M., Dahan, L., Alberola, E., Cail, S. & Keramidas, K. (2015a). “The EU ETS emissions reduction target and
interactions with energy and climate policies”, in: Jalard, M., E. Alberola, M. Afriat, M. Vaidyula, L. Dahan,
S. Cail, C. Cassisa, K. Keramidis, P. Coussy and P. Portenart (2015), Exploring the EU ETS Beyond 2020
(Chapter 1): First assessment of the EU Commission’s proposal, COPEC Research Program: the Coordination
of EU Policies on Energy and CO2 with the EU ETS by 2030, I4CE and Enerdata in collaboration with IFPen,
Paris.
Jalard, M., Dahan, L., Alberola, E., Cail, S. & Keramidas, K. (2015b). “The EU ETS and the Market Stability
Reserve”, in: Jalard, M., E. Alberola, M. Afriat, M. Vaidyula, L. Dahan, S. Cail, C. Cassisa, K. Keramidis, P.
Coussy and P. Portenart (2015), Exploring the EU ETS Beyond 2020 (Chapter 1): First assessment of the EU
Commission’s proposal, COPEC Research Program: the Coordination of EU Policies on Energy and CO2 with
the EU ETS by 2030, I4CE and Enerdata in collaboration with IFPen, Paris.
Jensen, S., & Skytte, K. (2002). Interactions between the power and green certificate markets, Energy Policy,
30(5), 425-435.
Jensen, S., & Skytte, K. (2003). Simultaneous attainment of energy goals by means of green certificates and
emission permits, Energy Policy, 31, 63-71.
Koch, N., Fuss, S., Grosjean, G., & Edenhofer, O. (2014). Causes of the EU ETS price drop: Recession, CDM,
renewable policies or a bit of everything? - New evidence, Energy Policy, 73, 676-685.
Lehmann, P., & Gawel, E. (2011). Why should support schemes for renewable electricity complement the EU
emissions trading scheme?, UFZ-Diskussionspapiere, No. 5/2011.
Löschel, A., & Schenker, O. (2015). Report on assessment and interaction of policy instruments and policy mixes,
ENTRACTE project, Retrieved from: http://entracte-project.eu/research/report-assessment-interaction-
policy-instrument-policy-mixes/.
Meng, S. S., Siriwardana, M., McNeill, J., & Nelson, T. (2015). The impact of an ETS on Australian energy sector:
an integrated CGE and electricity modelling approach, Retrieved from:
https://www.une.edu.au/
Sector.pdf.
data/assets/pdf_file/0007/122983/Impact-of-ETS-on-Australian-Energy-
Moris., D. (2013). Carbon Fatcat Companies in Greece, Policy Document, Sandbag, WWF, London, UK.
MStR Law Firm (2014). The Bill of the Ministry of Environment Energy & Climate Change (YPEKA) on New Deal
with the producers from RES and Cogeneration stations, Retrieved from: http://www.mstr-
law.gr/media/documents/2014/03/10/NewDeal_EN.pdf.
Mulder, A. (2016). CO2 emissions trading in the EU. University of Groningen, Ph.D thesis Groningen, the
Netherlands, Retrieved from: http://hdl.handle.net/11370/8c5fb9e2-5808-4f4f-a687-2a110fd51326.
MURE (2015). AU13 – Residential building subsidy, Retrieved from http://www.measures-odyssee-
mure.eu/public/mure_pdf/household/AU13.PDF.

Co-funded by the H2020 Programme of the EU
Grant Agreement no.: 642242
Report on climate change mitigation policy
mapping and interaction
65
Nordeng, A. et al. (2014). The carbon market survey 2014. Thomson Reuters Point Carbon.
Nordeng, A. et al. (2015). The carbon market survey 2015. Thomson Reuters Point Carbon.
OECD (2011). Interactions Between Emission Trading Systems and Other Overlapping Policy Instruments. OECD,
Paris, France.
Official Journal of the European Union (2009). Directive 2009/28/EC of the European Parliament and of the council
of 23 April 2009 on the promotion of the use of energy from renewable sources and amending and
subsequently repealing Directives 2001/77/EC and 2003/30/EC, European Parliament and the Council,
Brussels, Belgium.
Oikonomou, V., Flamos, A., & Grafakos, S. (2010). Is blending of energy and climate policy instruments always
desirable? Energy Policy, 38, 4186-4195.
Oikonomou, V., Flamos, A., Gargiulo, M., Giannakidis, G., Kanudia, A., Spijker, E., & Grafakos, S. (2011). Linking
least-cost energy system costs models with MCA: An assessment of the EU Renewable Energy targets and
supporting policies, Energy Policy, 39(5), 2786-2799.
Philibert, C. (2011). Interactions of Policies for Renewable Energy and Climate, Working Paper, IEA/OECD, Paris.
Ragwitz, M. (2015). Options for a Sustainable EU Renewable Energy Policy, DIACORE Policy Brief, Brussels.
Reuters (2016). Emissions trading: France Sets Carbon Price Floor, Retrieved from the Guardian:
https://www.theguardian.com/environment/2016/may/17/france-sets-carbon-price-floor.
Rey, L., Markandya, A., Gonzáles-Equino, M. and Drummond, P. (2013). Assessing Interaction Between
Instruments and the ‘Optimality’ of the Current Instrument Mix’, CECILIA2050 project, WP1, Deliverable 1.3,
Basque Centre for Climate Change (BC3), University College London (UCL), Bilbao, Spain and London, UK.
RTE (2016). “Signal-Prix du CO2: Analyse de son impact sur le système électrique européen”, Ademe, Paris,
France, Retrieved from: http://www.rte-france.com/sites/default/files/etude_signal_prix_du_co2.pdf.
Sandbag (2016). The UK Carbon Floor Price, Sandbag briefing, Sandbag, London.
Sartor, O., & Mathieu, M. (2015). What does the European Power Sector need to Decarbonise? The role of the EU
ETS & complementary policies post 2020. Final report, Climate Strategies, London.
Sorrell, S., Smith, A., Betz, R., Walz, R., Boemare, C., Quirion, R., Pilinis, C. (2003). Interaction in EU Climate
Policy, INTERACT project (EU 5th Framework Programme), Brussels.
Spyridaki, N., & Flamos, A. (2014). A paper trail of evaluation approaches to energy and climate policy interactions,
Renewable and Sustainable Energy Reviews, 40, 1090-1107.
Thema, J., Suerkemper, F., Grave, K., & Amelung, A. (2013). The Impact of Electrity Demand Reduction Policies
on the EU-ETS: Modelling electricity and carbon prices and the effect on industrial competitiveness.
Wuppertal, Cologne, Germany: Wuppertal Institute.
Tinbergen, J. (1952). On the Theory of Economic Policy, North-Holland Publishing Company, Amsterdam.
Trotignon, R. (2016). Prix plancher sur le secteur électrique: quelles conséquences pour le marché des quotas de
CO2 et sa réforme. Chaire Climate Economics and Chaire European Electricity Markets conference, University
Paris-Dauphine, Paris.
Van den Bergh, K., Delarue, E., & D'haeseleer, W. (2012). Impact of renewables deployment on the CO2 price
and the CO2 emissions in the European electricity sector, Working Papers, RSCAS, 2012/66, Robert Schuman
Centre For Advanced Studies, Climate Policy Research Unit.
Weigt, H., Delarue, E., & Ellerman, D. (2012). CO2 Abatement from Renewable Energy Injections in the German
Electricity Sector: Does a CO2 Price Help? CEEPR WP 2012-003, Cambridge, MA, USA.