D4.1.1 advanced decision support tools
40
This project is partially funded under the ICT Policy Support Programme (ICT PSP) as part of the Competitiveness and Innovation Framework Programme by the European Commission under grant agreement no. 621074 COMPETITIVENESS AND INNOVATION FRAMEWORK PROGRAMME CIP-ICT-PSP-2013-7 Pilot Type B WP4 – Data analysis, modelling and synthesis D4.1.1 Advanced Decision Support tools Deliverable Lead: WRLS Deliverable due date: 31/10/2015 Actual submission date: 02/11/2015 Version: 1.0
-
Upload
foodieproject -
Category
Software
-
view
31 -
download
1
Transcript of D4.1.1 advanced decision support tools

This project is partially funded under the ICT Policy Support Programme (ICT PSP) as part of the Competitiveness and Innovation Framework Programme by the European Commission under grant agreement no. 621074
COMPETITIVENESS AND INNOVATION
FRAMEWORK PROGRAMME
CIP-ICT-PSP-2013-7 Pilot Type B
WP4 – Data analysis, modelling and synthesis
D4.1.1 Advanced Decision Support tools
Deliverable Lead: WRLS
Deliverable due date: 31/10/2015
Actual submission date: 02/11/2015
Version: 1.0
D4.1.1 Advanced Decision Support tools
http://www.foodie-project.eu Copyright © FOODIE Project Consortium. All Rights Reserved. Grant Agreement No.: 621074 Page:2 / 40
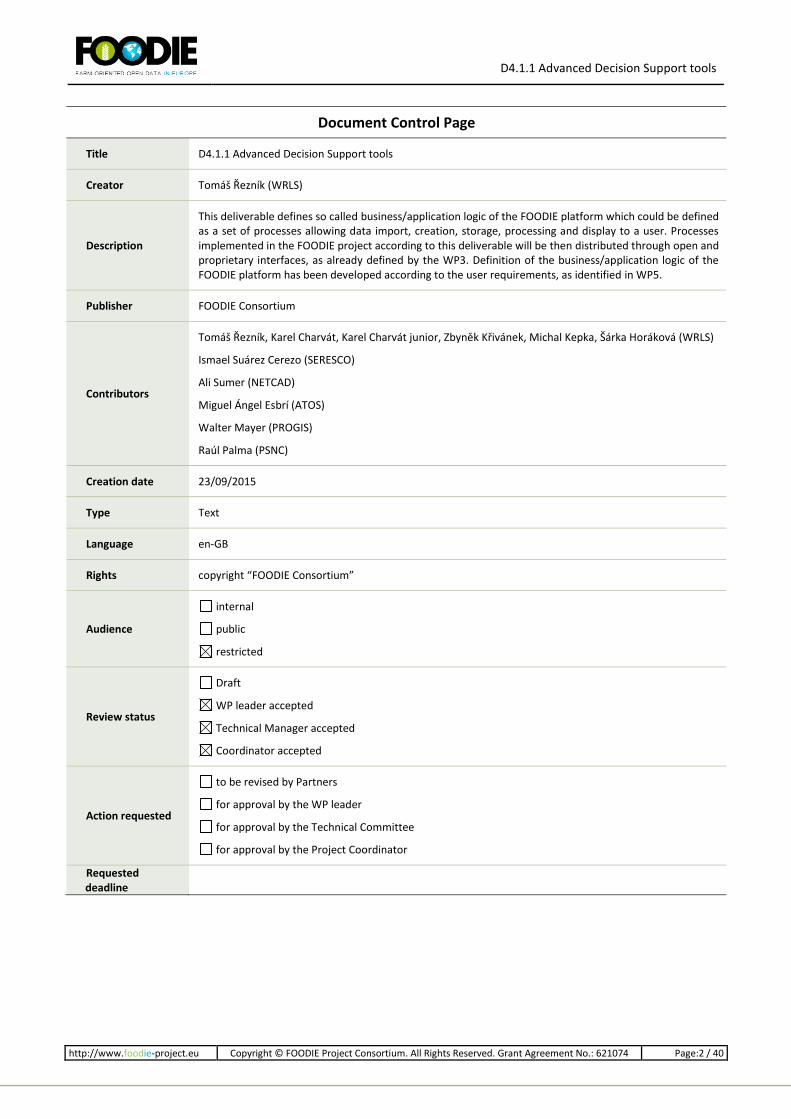
Document Control Page
Title D4.1.1 Advanced Decision Support tools
Creator Tomáš Řezník (WRLS)
Description
This deliverable defines so called business/application logic of the FOODIE platform which could be defined as a set of processes allowing data import, creation, storage, processing and display to a user. Processes implemented in the FOODIE project according to this deliverable will be then distributed through open and proprietary interfaces, as already defined by the WP3. Definition of the business/application logic of the FOODIE platform has been developed according to the user requirements, as identified in WP5.
Publisher FOODIE Consortium
Contributors
Tomáš Řezník, Karel Charvát, Karel Charvát junior, Zbyněk Křivánek, Michal Kepka, Šárka Horáková (WRLS)
Ismael Suárez Cerezo (SERESCO)
Ali Sumer (NETCAD)
Miguel Ángel Esbrí (ATOS)
Walter Mayer (PROGIS)
Raúl Palma (PSNC)
Creation date 23/09/2015
Type Text
Language en-GB
Rights copyright “FOODIE Consortium”
Audience
internal
public
restricted
Review status
Draft
WP leader accepted
Technical Manager accepted
Coordinator accepted
Action requested
to be revised by Partners
for approval by the WP leader
for approval by the Technical Committee
for approval by the Project Coordinator
Requested deadline

D4.1.1 Advanced Decision Support tools
http://www.foodie-project.eu Copyright © FOODIE Project Consortium. All Rights Reserved. Grant Agreement No.: 621074 Page:3 / 40
STATEMENT FOR OPEN DOCUMENTS
(c) 2015 FOODIE Consortium
The FOODIE Consortium (http://www.foodie-project.eu) grants third parties the right to use and dis-tribute all or parts of this document, provided that the FOODIE project and the document are properly referenced.
THIS DOCUMENT IS PROVIDED BY THE COPYRIGHT HOLDERS AND CONTRIBUTORS "AS IS" AND ANY EXPRESS OR IMPLIED WARRANTIES, INCLUDING, BUT NOT LIMITED TO, THE IMPLIED WARRANTIES OF MERCHANTABILITY AND FITNESS FOR A PARTICULAR PURPOSE ARE DISCLAIMED. EXCEPT WHAT SET FORTH BY MANDATORY PROVISIONS OF LAW IN NO EVENT SHALL THE COPYRIGHT OWNER OR CONTRIBUTORS BE LIABLE FOR ANY DIRECT, INDIRECT, INCIDENTAL, SPECIAL, EXEMPLARY, OR CONSEQUENTIAL DAMAGES (INCLUDING, BUT NOT LIMITED TO, PROCUREMENT OF SUBSTITUTE GOODS OR SERVICES; LOSS OF USE, DATA, OR PROFITS; OR BUSINESS INTERRUPTION) HOWEVER CAUSED AND ON ANY THEORY OF LIABILITY, WHETHER IN CONTRACT, STRICT LIABILITY, OR TORT (INCLUDING NEGLIGENCE OR OTHERWISE) ARISING IN ANY WAY OUT OF THE USE OF THIS DOCUMENT, EVEN IF ADVISED OF THE POSSIBILITY OF SUCH DAMAGE.
About the project
FOODIE project aims at creating a platform hub on the cloud where spatial and non-spatial data related to agricultural sector is available for agri-food stakeholders groups and interoperable. It will offer: an infrastructure for the building of an interacting and collaborative network; the integration of existing open datasets related to agriculture; data publication and data linking of external agriculture data sources, providing specific and high-value applications and services for the support of planning and decision-making processes.
FOODIE project is addressed to four basic groups of users: a) stakeholders from the agriculture sector as end-users of final applications, b) public sector for communication with farmers about taxation, subsidies and regulation, c) researchers for large scale experimentation on real data and d) ICT companies for the development of new applications for agriculture and food sector, mainly using implemented tools
FOODIE specifically works on three pilots:
Pilot 1: Precision Viticulture (Spain) will focus on the appropriate management of the inherent variability of crops,
Pilot 2: Open Data for Strategic and Tactical Planning (Czech Republic) will focus on improving future management of agricultural companies (farms) by introducing new tools and management methods,
Pilot 3: Technology allows integration of logistics via service providers and farm management including traceability (Germany).
Contact information
Miguel Angel Esbrí
Project Coordinator
Atos Spain, Madrid, Spain
E-mail: [email protected]
URL: http://www.foodie-project.eu
Twitter: https://twitter.com/FOODIE_Project

D4.1.1 Advanced Decision Support tools
http://www.foodie-project.eu Copyright © FOODIE Project Consortium. All Rights Reserved. Grant Agreement No.: 621074 Page:4 / 40
Table of Contents
Glossary...................................................................................................................................................................... 6
Abbreviations and Acronyms ...................................................................................................................................... 7
Executive Summary .................................................................................................................................................... 9
1 Introduction ....................................................................................................................................................... 10 1.1 Overview of “MUST” requirements .................................................................................................................. 10
2 Processes definition ........................................................................................................................................... 17 2.1 Vegetation, Water and Moisture Indices Computing ....................................................................................... 17 2.2 Land Cover Classification .................................................................................................................................. 19 2.3 Machinery Tracking .......................................................................................................................................... 20 2.4 Plot Geometry Verification by Sensor Measurements ..................................................................................... 21 2.5 Weather and Precipitation Aggregation ........................................................................................................... 23 2.6 Fertilization Planning ........................................................................................................................................ 24 2.7 Intervention Planning ....................................................................................................................................... 28 2.8 Pan-European Crop Statistics ........................................................................................................................... 30 2.9 Economic Statistics ........................................................................................................................................... 30 2.10 Recommendations for Crop Rotation ............................................................................................................... 32 2.11 Semantisation Added Value.............................................................................................................................. 32
3 Relations between processes ............................................................................................................................. 36
4 Thematic Working Groups ................................................................................................................................. 38
5 Conclusions ........................................................................................................................................................ 39
References ................................................................................................................................................................ 40

D4.1.1 Advanced Decision Support tools
http://www.foodie-project.eu Copyright © FOODIE Project Consortium. All Rights Reserved. Grant Agreement No.: 621074 Page:5 / 40
Index of Figures
Figure 1: Demonstration of the convex hull computing from sensor measurements and its update of the underlying
geometry of a Plot from source data (i.e. LPIS/OSM) .............................................................................................. 22 Figure 2: A harvest map where the different colours show how much kg/ha they represent ........................................ 25 Figure 3: An isoline model calculated out of point information that tells us how is the humidity on the field ............... 25 Figure 4: A truck of a machine that documents when and where the machine was driving ........................................... 26 Figure 5: Selection of the colours for defining a coloured map ....................................................................................... 26 Figure 6: Different versions of coloured map that tells us how much was planned where to fertilize and what was the
realization of the contract; out of both maps differences between plan and reality can be derived ...................... 26 Figure 7: Different versions of coloured map that tells us how much was planned where to fertilize and what was the
realization of the contract; out of both maps differences between plan and reality can be derived ...................... 27 Figure 8: Isoline model on a region that tells us height differences; runoff models can be calculated ........................... 27 Figure 9: Tracks and harvest results combined ................................................................................................................ 27
Index of Tables
Table 1: Abbreviations and Acronyms ................................................................................................................................ 8 Table 2: Overview of all requirements with priority “MUST” that have been considered as the basis for the definition
of fundamental processes of FOODIE platform. ....................................................................................................... 16 Table 3: Detailed description of the Vegetation, Water and Moisture Indices Computing process ................................ 19 Table 4: Detailed description of the Land Cover Classification process ........................................................................... 20 Table 5: Detailed description of the Machinery Tracking process ................................................................................... 21 Table 6: Detailed description of the Plot Geometry Verification by Sensor Measurements process .............................. 22 Table 7: Detailed description of the Weather and Precipitation Aggregation process .................................................... 23 Table 8: Detailed description of the Fertilization Planning process ................................................................................. 28 Table 9: Detailed description of the Intervention Planning process ................................................................................ 29 Table 10: Detailed description of the Pan-European Crop Statistics process................................................................... 30 Table 11: Detailed description of the Economic Statistics process .................................................................................. 31 Table 12: Detailed description of the Recommendations for Crop Rotation process ...................................................... 32 Table 13: Detailed description of the machinery advice for farm telemetry ................................................................... 33 Table 14: Detailed description of the machinery advice for crop monitoring .................................................................. 34 Table 15: Detailed description of categorization of phytosanitary bulletins.................................................................... 34 Table 16: Detailed description of automatic data transformation and publication as linked data .................................. 35 Table 17: Relations between fundamental processes of the FOODIE platform. .............................................................. 37 Table 18: Overview of thematic working groups for implementation and relevant (fundamental) processes. .............. 38
D4.1.1 Advanced Decision Support tools
http://www.foodie-project.eu Copyright © FOODIE Project Consortium. All Rights Reserved. Grant Agreement No.: 621074 Page:6 / 40
Glossary
The glossary of terms used in this deliverable can be found in the public document “FOODIE_Glossary.pdf” available at: http://www.foodie-project.eu

D4.1.1 Advanced Decision Support tools
http://www.foodie-project.eu Copyright © FOODIE Project Consortium. All Rights Reserved. Grant Agreement No.: 621074 Page:7 / 40
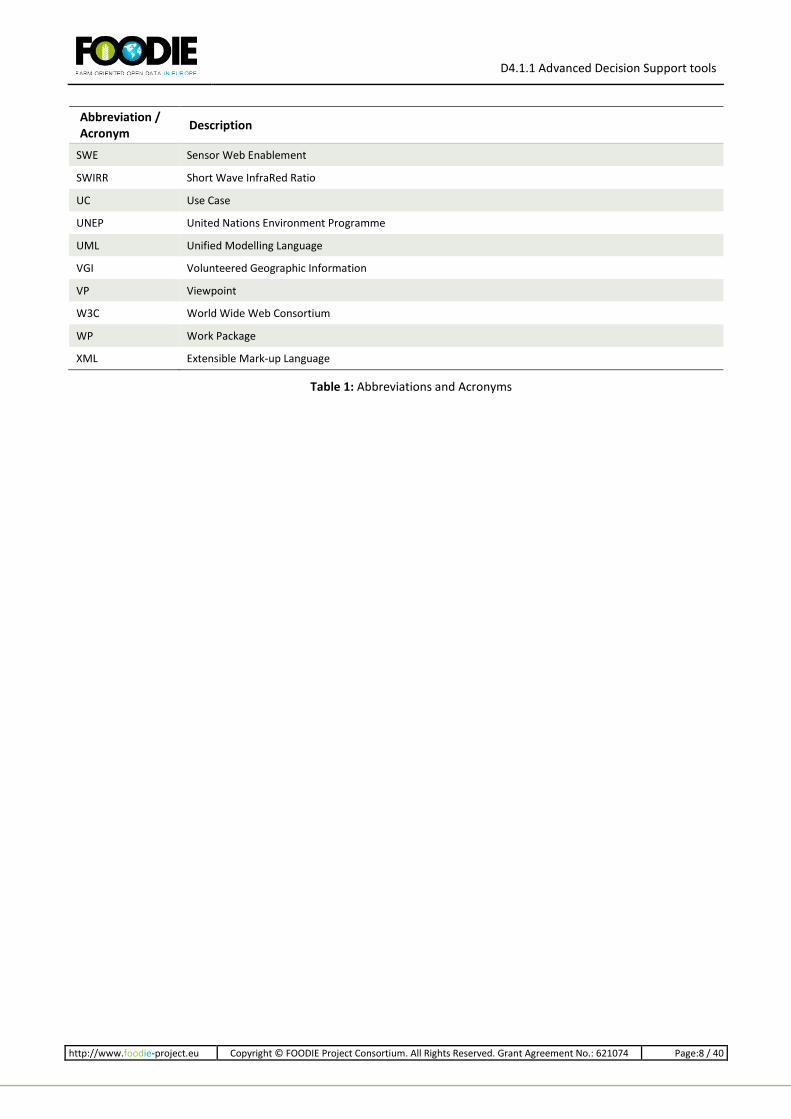
Abbreviations and Acronyms
Abbreviation / Acronym
Description
API Application Programming Interface
CAN-BUS Controller Area Network Bus
CORINE Coordination of Information on the Environment
DSS Decision Support System
EVI Enhanced Vegetation Index
EU European Union
FOODIE Farm Oriented Open Data in Europe
FAO Food and Agriculture Organization (of the United Nations)
GeoJSON Geographical JavaScript Object Notation
GEOSS Global Earth Observation System of Systems
GIS Geographic Information System
GPS Global Positioning System
GUI Graphical User Interface
GVMI Global Vegetation Moisture Index
ICT Information and Telecommunication Technologies
INSPIRE Infrastructure for Spatial Information in Europe
ISO International Organization for Standardization
ISO-BUS International Organization for Standardization Bus
LPIS Land Parcel Identification System
MSI Moisture Stress Index
MZ Management Zone
NDVI Normalized Difference Vegetation Index
NDI7 Normalized Difference Water Index 7
NUTS Nomenclature des Unites Territoriales Statistiques
OLI Operational Land Imager
OGC Open Geospatial Consortium
OSM OpenStreetMap
PCS Process
REST Representational State Transfer
RM-ODP Reference Model for Object Distributed Processing
SDI Spatial Data Infrastructure
SIWSI Shortwave Infrared Water Stress Index
SOA Service Oriented Architecture
SoS System of Systems
SPARQL Protocol and RDF Query Language (recursive acronym)
D4.1.1 Advanced Decision Support tools
http://www.foodie-project.eu Copyright © FOODIE Project Consortium. All Rights Reserved. Grant Agreement No.: 621074 Page:8 / 40
Abbreviation / Acronym
Description
SWE Sensor Web Enablement
SWIRR Short Wave InfraRed Ratio
UC Use Case
UNEP United Nations Environment Programme
UML Unified Modelling Language
VGI Volunteered Geographic Information
VP Viewpoint
W3C World Wide Web Consortium
WP Work Package
XML Extensible Mark-up Language
Table 1: Abbreviations and Acronyms

D4.1.1 Advanced Decision Support tools
http://www.foodie-project.eu Copyright © FOODIE Project Consortium. All Rights Reserved. Grant Agreement No.: 621074 Page:9 / 40
Executive Summary
This deliverable defines so called business/application logic of the FOODIE platform which could be defined as a set of processes allowing data import, creation, storage, processing and display to a user. Processes implemented in the FOODIE project according to this deliverable will be then available through open and proprietary interfaces, as already defined by the WP3. Definition of the business/application logic of the FOODIE platform has been developed according to the user requirements, as identified in WP5. WP5 will later on be used for the verification of the processes’ implementation.
This document comprises five main sections. The first section contains brief introduction into an establishment of a business/application logic and user requirements for the FOODIE platform. The second section defines explicit structure for a documentation of a process. Such unified documentation deals with the conceptual as well as technical levels of a process. So far, eleven fundamental processes have been defined. The third section is a result of an analysis on relations between the defined processes. The fourth section briefly informs about the creation of thematic working groups during the implementation phase of the project to better address the challenges related to an implementation of each process. Conclusions in section 5 include a description of current WP4 results, discussion on functionality provided by the FOODIE portal from server-side as well as client-side point of view and plans for future development.
Further iterations of this deliverable will be aimed at extended definitions of other FOODIE processes in both: quantity and quality. The quantitative aspect of such extension will be focused on definitions of new FOODIE processes. The qualitative aspect will aim at more detailed descriptions of already defined processes, like enhanced definition of the “Semantisation Added Value” process with respect to the development of the newly emerging initiative of the OpenAgrarMap.
D4.1.1 Advanced Decision Support tools
http://www.foodie-project.eu Copyright © FOODIE Project Consortium. All Rights Reserved. Grant Agreement No.: 621074 Page:10 / 40
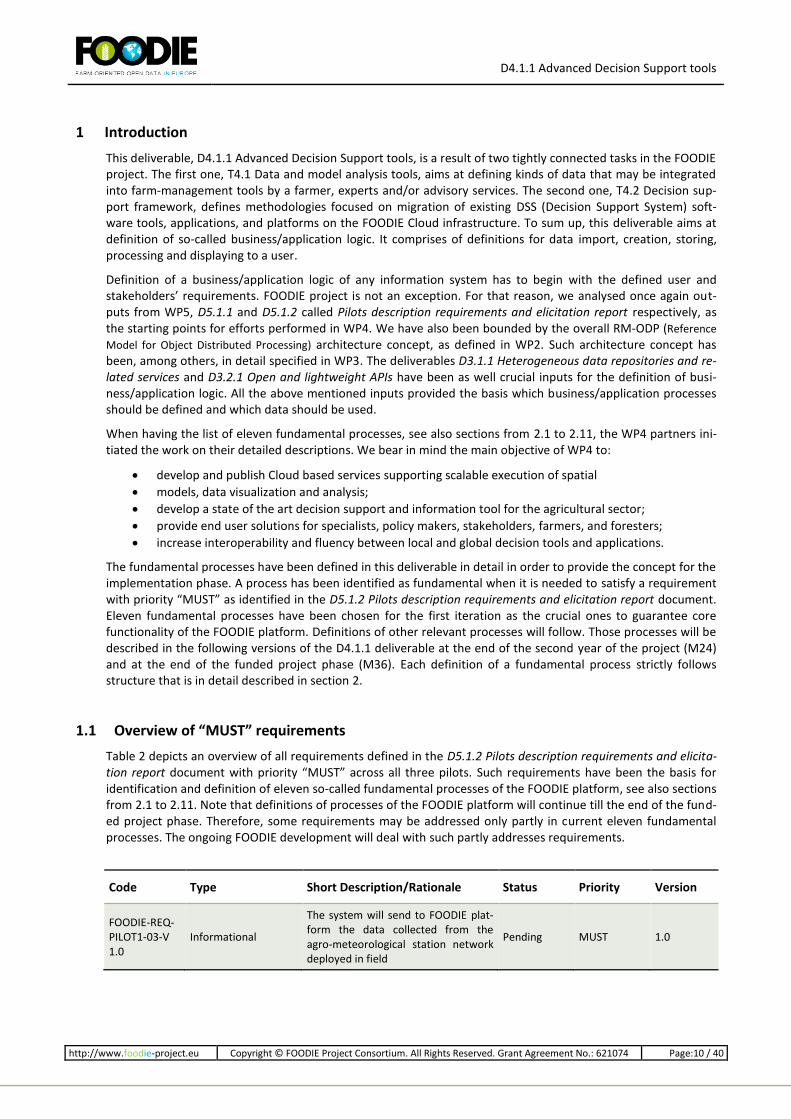
1 Introduction
This deliverable, D4.1.1 Advanced Decision Support tools, is a result of two tightly connected tasks in the FOODIE project. The first one, T4.1 Data and model analysis tools, aims at defining kinds of data that may be integrated into farm-management tools by a farmer, experts and/or advisory services. The second one, T4.2 Decision sup-port framework, defines methodologies focused on migration of existing DSS (Decision Support System) soft-ware tools, applications, and platforms on the FOODIE Cloud infrastructure. To sum up, this deliverable aims at definition of so-called business/application logic. It comprises of definitions for data import, creation, storing, processing and displaying to a user.
Definition of a business/application logic of any information system has to begin with the defined user and stakeholders’ requirements. FOODIE project is not an exception. For that reason, we analysed once again out-puts from WP5, D5.1.1 and D5.1.2 called Pilots description requirements and elicitation report respectively, as the starting points for efforts performed in WP4. We have also been bounded by the overall RM-ODP (Reference
Model for Object Distributed Processing) architecture concept, as defined in WP2. Such architecture concept has been, among others, in detail specified in WP3. The deliverables D3.1.1 Heterogeneous data repositories and re-lated services and D3.2.1 Open and lightweight APIs have been as well crucial inputs for the definition of busi-ness/application logic. All the above mentioned inputs provided the basis which business/application processes should be defined and which data should be used.
When having the list of eleven fundamental processes, see also sections from 2.1 to 2.11, the WP4 partners ini-tiated the work on their detailed descriptions. We bear in mind the main objective of WP4 to:
develop and publish Cloud based services supporting scalable execution of spatial
models, data visualization and analysis;
develop a state of the art decision support and information tool for the agricultural sector;
provide end user solutions for specialists, policy makers, stakeholders, farmers, and foresters;
increase interoperability and fluency between local and global decision tools and applications.
The fundamental processes have been defined in this deliverable in detail in order to provide the concept for the implementation phase. A process has been identified as fundamental when it is needed to satisfy a requirement with priority “MUST” as identified in the D5.1.2 Pilots description requirements and elicitation report document. Eleven fundamental processes have been chosen for the first iteration as the crucial ones to guarantee core functionality of the FOODIE platform. Definitions of other relevant processes will follow. Those processes will be described in the following versions of the D4.1.1 deliverable at the end of the second year of the project (M24) and at the end of the funded project phase (M36). Each definition of a fundamental process strictly follows structure that is in detail described in section 2.
1.1 Overview of “MUST” requirements
Table 2 depicts an overview of all requirements defined in the D5.1.2 Pilots description requirements and elicita-tion report document with priority “MUST” across all three pilots. Such requirements have been the basis for identification and definition of eleven so-called fundamental processes of the FOODIE platform, see also sections from 2.1 to 2.11. Note that definitions of processes of the FOODIE platform will continue till the end of the fund-ed project phase. Therefore, some requirements may be addressed only partly in current eleven fundamental processes. The ongoing FOODIE development will deal with such partly addresses requirements.
Code Type Short Description/Rationale Status Priority Version
FOODIE-REQ-PILOT1-03-V 1.0
Informational
The system will send to FOODIE plat-form the data collected from the agro-meteorological station network deployed in field
Pending MUST 1.0

D4.1.1 Advanced Decision Support tools
http://www.foodie-project.eu Copyright © FOODIE Project Consortium. All Rights Reserved. Grant Agreement No.: 621074 Page:11 / 40
Code Type Short Description/Rationale Status Priority Version
FOODIE-REQ-PILOT1-04-V 1.0
Informational
The system will send to FOODIE plat-form the data collected from the agro-meteorological station network deployed in the vineyard
Pending MUST 1.0
FOODIE-REQ-PILOT1-07-V 1.0
Informational
The system will use multispectral and thermal information from remote sensing instruments on satellite to calculate vegetation indices georefer-enced
Pending MUST 1.0
FOODIE-REQ-PILOT1-08-V 1.0
Informational The system will use data from Ter-ra/Aqua satellites
Pending MUST 1.0
FOODIE-REQ-PILOT1-09-V 1.0
Informational The system will use data generated from Landsat 8 satellite
Pending MUST 1.0
FOODIE-REQ-PILOT1-10-V 1.0
Informational The system will use data products from MODIS sensor related with sur-face reflectance
Pending MUST 1.0
FOODIE-REQ-PILOT1-11-V 1.0
Informational The system will use multispectral data from OLI instrument
Pending MUST 1.0
FOODIE-REQ-PILOT1-12-V 1.0
Informational The system will use thermal data from TIR instrument
Pending MUST 1.0
FOODIE-REQ-PILOT1-18-V 1.0
Informational The system will collect data from Sen-tinel 2 satellite
Pending MUST 1.0
FOODIE-REQ-PILOT1-28-V 1.0
Functional The system will calculate vegetation indices from reflectivity data for a ge-ographical zone and period of time
Pending MUST 1.0
FOODIE-REQ-PILOT1-29-V 1.0
Functional The system will calculate the NDVI Normalized Difference Vegetation In-dex
Pending MUST 1.0
FOODIE-REQ-PILOT1-30-V 1.0
Functional The system will calculate the EVI En-hanced Vegetation Index
Pending MUST 1.0
FOODIE-REQ-PILOT1-31-V 1.0
Functional The system will calculate the NDWI Normalized Difference Water Index
Pending MUST 1.0
FOODIE-REQ-PILOT1-32-V 1.0
Functional The system will calculate the NDI7 Normalized Difference Water Index 7
Pending MUST 1.0
FOODIE-REQ-PILOT1-33-V 1.0
Functional The system will calculate the SIWSI Shortwave Infrared Water Stress In-dex
Pending MUST 1.0
FOODIE-REQ-PILOT1-34-V 1.0
Functional The system will calculate the SWIRR index
Pending MUST 1.0
FOODIE-REQ-PILOT1-35-V 1.0
Functional The system will calculate the MSI Moisture Stress Index
Pending MUST 1.0

D4.1.1 Advanced Decision Support tools
http://www.foodie-project.eu Copyright © FOODIE Project Consortium. All Rights Reserved. Grant Agreement No.: 621074 Page:12 / 40
Code Type Short Description/Rationale Status Priority Version
FOODIE-REQ-PILOT1-36-V 1.0
Functional The system will calculate the GVMI Global Vegetation Moisture Index
Pending MUST 1.0
FOODIE-REQ-PILOT1-37-V 1.0
Functional
The system will calculate the NDVI Normalized Difference Vegetation In-dex from MODIS MYD09GA data product
Pending MUST 1.0
FOODIE-REQ-PILOT1-38-V 1.0
Functional
The system will calculate the NDVI Normalized Difference Vegetation In-dex from MODIS MOD09GD data product
Pending MUST 1.0
FOODIE-REQ-PILOT1-39-V 1.0
Functional The system will calculate the EVI En-hanced Vegetation Index from MODIS MYD09GA data product
Pending MUST 1.0
FOODIE-REQ-PILOT1-40-V 1.0
Functional The system will calculate the NDWI Normalized Difference Water Index from MODIS MYD09GA data product
Pending MUST 1.0
FOODIE-REQ-PILOT1-41-V 1.0
Functional The system will calculate the NDI7 Normalized Difference Water Index 7 from MODIS MYD09GA data product
Pending MUST 1.0
FOODIE-REQ-PILOT1-42-V 1.0
Functional
The system will calculate the SIWSI Shortwave Infrared Water Stress In-dex from MODIS MYD09GA data product
Pending MUST 1.0
FOODIE-REQ-PILOT1-43-V 1.0
Functional The system will calculate the SWIRR index from MODIS MYD09GA data product
Pending MUST 1.0
FOODIE-REQ-PILOT1-44-V 1.0
Functional The system will calculate the MSI Moisture Stress Index from MODIS MYD09GA data product
Pending MUST 1.0
FOODIE-REQ-PILOT1-45-V 1.0
Functional The system will calculate the from MODIS MYD09GA data product
Pending MUST 1.0
FOODIE-REQ-PILOT1-46-V 1.0
Functional The system will calculate the SRWI Shortwave Infrared Water Stress In-dex
Pending MUST 1.0
FOODIE-REQ-PILOT1-47-V 1.0
Functional
The system will calculate the SRWI Shortwave Infrared Water Stress In-dex from MODIS MYD09GA data product
Pending MUST 1.0
FOODIE-REQ-PILOT1-48-V 1.0
Functional The system will use a GIS viewer to show georeferenced information at the parcels
Pending MUST 1.0
FOODIE-REQ-PILOT1-49-V 1.0
Functional The system will show the geo-referenced information on separate layers for each type of information
Pending MUST 1.0
FOODIE-REQ-PILOT1-50-V 1.0
Functional The system will show geo-referenced data for a selected date interval
Pending MUST 1.0

D4.1.1 Advanced Decision Support tools
http://www.foodie-project.eu Copyright © FOODIE Project Consortium. All Rights Reserved. Grant Agreement No.: 621074 Page:13 / 40
Code Type Short Description/Rationale Status Priority Version
FOODIE-REQ-PILOT1-51-V 1.0
Functional The system will show Vegetation Indi-ces of each parcel in a GIS viewer
Pending MUST 1.0
FOODIE-REQ-PILOT1-52-V 1.0
Functional The system will show geo-referenced actions performed on the crops
Pending MUST 1.0
FOODIE-REQ-PILOT1-53-V 1.0
Functional The system will show geo-referenced issues detected by the farmer on the crops
Pending MUST 1.0
FOODIE-REQ-PILOT1-54-V 1.0
Functional The system will show geo-referenced data of the measures taken by the sensors deployed on the field
Pending MUST 1.0
FOODIE-REQ-PILOT1-55-V 1.0
Functional The system will show contour lines for the variables measured by the sensors deployed on the field
Pending MUST 1.0
FOODIE-REQ-PILOT1-56-V 1.0
Functional The system will show contour lines for the Vegetation Indices in a GIS viewer
Pending MUST 1.0
FOODIE-REQ-PILOT1-57-V 1.0
Functional The system will show the estimated percentage of the attack of mildew fungus in a GIS visor
Pending MUST 1.0
FOODIE-REQ-PILOT1-58-V 1.0
Functional The system will show the levels of soil nutrients according to the results of soil analysis
Pending MUST 1.0
FOODIE-REQ-PILOT1-60-V 1.0
Functional The system will calculate the percent-age of infection of mildew fungus
Pending MUST 1.0
FOODIE-REQ-PILOT1-63-V 1.0
Non functional Enclosure of portable agro-meteorological stations will be rated at least IP-65
Pending MUST 1.0
FOODIE-REQ-PILOT1-64-V1.0
Functional The system will provide functionalities for searching, registering and display-ing treatment plans.
Pending MUST 1.0
FOODIE-REQ-PILOT1-66-V1.0
Functional Information for the visualization of a treatment plan
Pending MUST 1.0
FOODIE-REQ-PILOT1-67-V1.0
Functional The system will provide functionalities for the registration and visualization of agricultural interventions
Pending MUST 1.0
FOODIE-REQ-PILOT1-68-V1.0
Functional The system will provide functionalities for the registration and visualization of pruning interventions
Pending MUST 1.0
FOODIE-REQ-PILOT1-69-V1.0
Functional The system will provide functionalities for the registration and visualization of herbicidal treatments
Pending MUST 1.0
FOODIE-REQ-PILOT1-70-V1.0
Functional The system will provide functionalities for the registration and visualization of phytosanitary treatments
Pending MUST 1.0

D4.1.1 Advanced Decision Support tools
http://www.foodie-project.eu Copyright © FOODIE Project Consortium. All Rights Reserved. Grant Agreement No.: 621074 Page:14 / 40
Code Type Short Description/Rationale Status Priority Version
FOODIE-REQ-PILOT1-71-V1.0
Functional The system will provide functionalities for the registration and visualization of fertilizer treatments
Pending MUST 1.0
FOODIE-REQ-PILOT1-74-V1.0
Functional The system will provide functionalities for the registration and visualization of the yield production
Pending MUST 1.0
FOODIE-REQ-PILOT2-01-V 1.0
Informational The system will use data about location of fields and warehouses of MJM’s partner
Pending MUST 2.0
FOODIE-REQ-PILOT2-02-V 1.0
Informational The system will use data about road network
Planned MUST 1.0
FOODIE-REQ-PILOT2-03-V 1.0
Informational The system will use technical specifica-tion of vehicles used by MJM
Pending MUST 2.0
FOODIE-REQ-PILOT2-04-V 1.0
Informational The system will use data about quantity of available vehicles
Pending MUST 2.0
FOODIE-REQ-PILOT2-08-V 1.0
Informational The system will use information about transport requests
Pending MUST 2.0
FOODIE-REQ-PILOT2-09-V 1.0
Informational The system will use preferences of MJM’s decision makers
Planned MUST 1.0
FOODIE-REQ-PILOT2-10-V 1.0
Functional The system will process input data for optimization model
Planned MUST 1.0
FOODIE-REQ-PILOT2-11-V 1.0
Functional The system will compute optimal transport schedule and accompanying analysis
Planned MUST 1.0
FOODIE-REQ-PILOT2-12-V 1.0
Functional The system will display solution and analysis
Planned MUST 1.0
FOODIE-REQ-PILOT2-13-V 1.0
Informational The system will collect the GPS position of the farm machinery
Pending MUST 1.0
FOODIE-REQ-PILOT2-18-V 1.0
Functional
The system will calculate usage proper-ties (usage time, speed, fuel consump-tion) of crop treatment within the se-lected time interval and field
Planned MUST 1.0
FOODIE-REQ-PILOT2-25-V 1.0
Functional The system will calculate and classify NDVI within the defined fields
Planned MUST 1.0

D4.1.1 Advanced Decision Support tools
http://www.foodie-project.eu Copyright © FOODIE Project Consortium. All Rights Reserved. Grant Agreement No.: 621074 Page:15 / 40
Code Type Short Description/Rationale Status Priority Version
FOODIE-REQ-PILOT2-27-V 1.0
Informational The system will use data generated from Landsat 8 satellite
Pending MUST 2.0
FOODIE-REQ-PILOT2-28-V 1.0
Informational The system will use multispectral data from OLI instrument
Pending MUST 2.0
FOODIE-REQ-PILOT2-31-V 1.0
Informational
The system will use multispectral and thermal information from remote sens-ing instruments on satellite in order to calculate vegetation indices georefer-enced
Planned MUST 1.0
FOODIE-REQ-PILOT2-32-V 1.0
Functional The system will calculate the NDVI Normalized Difference Vegetation In-dex
Pending MUST 2.0
FOODIE-REQ-PILOT2-33-V 1.0
Functional The system will calculate NDVI differ-ences between satellite images for change detection
Planned MUST 1.0
FOODIE-REQ-PILOT2-34-V 1.0
Functional The system will use a GIS viewer to show geo-referenced information at the parcels
Planned MUST 1.0
FOODIE-REQ-PILOT2-35-V 1.0
Functional The system will show the geo-referenced information on separate layers for each type of information
Planned MUST 1.0
FOODIE-REQ-PILOT2-36-V 1.0
Functional The system will show Vegetation Indi-ces of each parcel in a GIS viewer
Planned MUST 1.0
FOODIE-REQ-PILOT2-37-V 1.0
Functional The system will show geo-referenced actions performed on the crops
Planned MUST 1.0
FOODIE-REQ-PILOT2-38-V 1.0
Functional The system will show contour lines for the Vegetation Indices in a GIS viewer
Planned MUST 1.0
FOODIE-REQ-PILOT2-39-V 1.0
Informational The system will send to FOODIE plat-form the data collected from the agro-meteorological station at pilot farm
Planned MUST 1.0
FOODIE-REQ-PILOT2-41-V 1.0
Functional The system will show the tabular and graphical results of meteorological monitoring
Planned MUST 1.0

D4.1.1 Advanced Decision Support tools
http://www.foodie-project.eu Copyright © FOODIE Project Consortium. All Rights Reserved. Grant Agreement No.: 621074 Page:16 / 40
Code Type Short Description/Rationale Status Priority Version
FOODIE-REQ-PILOT3-01-V 1.0
Informational The system will use public raster data (ortho / satellite images)
Pending MUST 1.0
FOODIE-REQ-PILOT3-03-V 1.0
Informational The system will use public LPIS data in standard GIS formats (DXF, SHP, KML)
Pending MUST 1.0
FOODIE-REQ-PILOT3-04-V 1.0
Informational
The system get regional agricultural ex-pert data (machines, fertilizer, pesti-cides, seeds and methods) from FOODIE platform
Pending MUST 1.0
FOODIE-REQ-PILOT3-08-V 1.0
Informational The system will use data from various GPS devices
Pending MUST 1.0
FOODIE-REQ-PILOT3-11-V 1.0
Informational The system will send contract data from farm management software to lo-gistic platform
Pending MUST 1.0
FOODIE-REQ-PILOT3-12-V 1.0
Informational
The system will receive contract acknowledgement data from logistic platform in the farm management software
Pending MUST 1.0
FOODIE-REQ-PILOT3-14-V 1.0
Functional The GIS system will visualize farm (holding) maps based on ortho image and LPIS data
Pending MUST 1.0
FOODIE-REQ-PILOT3-18-V 1.0
Functional The farm management software will collect crop and activity data for further documentation
Pending MUST 1.0
FOODIE-REQ-PILOT3-20-V 1.0
Functional The system will use time management component in the farm management software
Pending MUST 1.0
FOODIE-REQ-PILOT3-21-V 1.0
Functional The system will integrate the GIS com-ponent in all farm management and lo-gistic modules
Pending MUST 1.0
FOODIE-REQ-PILOT3-22-V 1.0
Functional
The system will send regional agricul-tural expert data (machines, fertilizer, pesticides, seeds and methods) edited by local experts to FOODIE platform
Pending MUST 1.0
Table 2: Overview of all requirements with priority “MUST” that have been considered as the basis for the defi-nition of fundamental processes of FOODIE platform.

D4.1.1 Advanced Decision Support tools
http://www.foodie-project.eu Copyright © FOODIE Project Consortium. All Rights Reserved. Grant Agreement No.: 621074 Page:17 / 40
2 Processes definition
The FOODIE platform may be considered as one great modular and customizable application that may appear exactly as defined by the end users requirements in WP5. WP2 provided the concept of the overall architecture for such modular and customizable application. WP3, among others, further elaborated the definitions of open and proprietary standards as well as defined the available open data that may be (re)used within the FOODIE platform. It is therefore up to WP4 to define the so called business/application logic where developments from all the above mentioned WPs meet at one place.
The business/application logic typically consists of processes that state how data can be imported, created, stored, processed and displayed to a user. The intention of the sections from 2.1 to 2.11 is to define in detail the selected aspects of each process. Such definition has been made together developers to ease the upcoming im-plementation phase. Note that the processes definition has been made in the incremental manner. The eleven defined processes therefore represent the essential added value functionality within the FOODIE platform which may be a subject of a change in the future.
The consensus within the FOODIE consortium has proven that the following parameters of processes are needed to describe each process in a detail that enables its implementation:
name of the process: unique designation of each process by a code and a name, the code is composed of the word “FOODIE” like for the use cases definition within WP5, followed by the abbreviation “PCS” standing for a process, the code of a process starting from 1 and ending – so far – by 11, ending by the human readable name of the process, e.g. all together FOODIE-PCS-01 Vegetation, Water and Moisture Indices Computing;
computing environment: description of an application that is being used within the FOODIE platform for the processing of data in order to obtain data with added value, including a link to an API(s) that is being used for the communication as defined in WP3 such as Open Data Access API;
input(s): exhaustive description of data and their availability with focus on constraints related to access and use of such data;
functionality: brief description of/link to the used algorithm(s), parameters for setting the algorithm, conducted (spatial) operations etc., figures have been inserted where possible to increase the clarity;
output(s): definitions of output data, at least from a format, data model (grid vs. vector) and geometry (e.g. point/line/polygon/… in case of vectors and rectified mesh in case of grids) point of views, includ-ing their usage within and beyond FOODIE platform;
connection to other processes: explicit citation of another process(es) by the name of the process as defined above, e.g. FOODIE-PCS-03 Machinery Tracking;
connection to the FOODIE pilots (WP5): explicit citation of the associated use case and pilot as defined within the WP5, e.g. FOODIE-UC-PILOT2.B-01 Tracking the machinery fleet.
Sections from 2.1 to 2.11 follow the above defined structure to homogenously describe each process identified within the FOODIE platform.
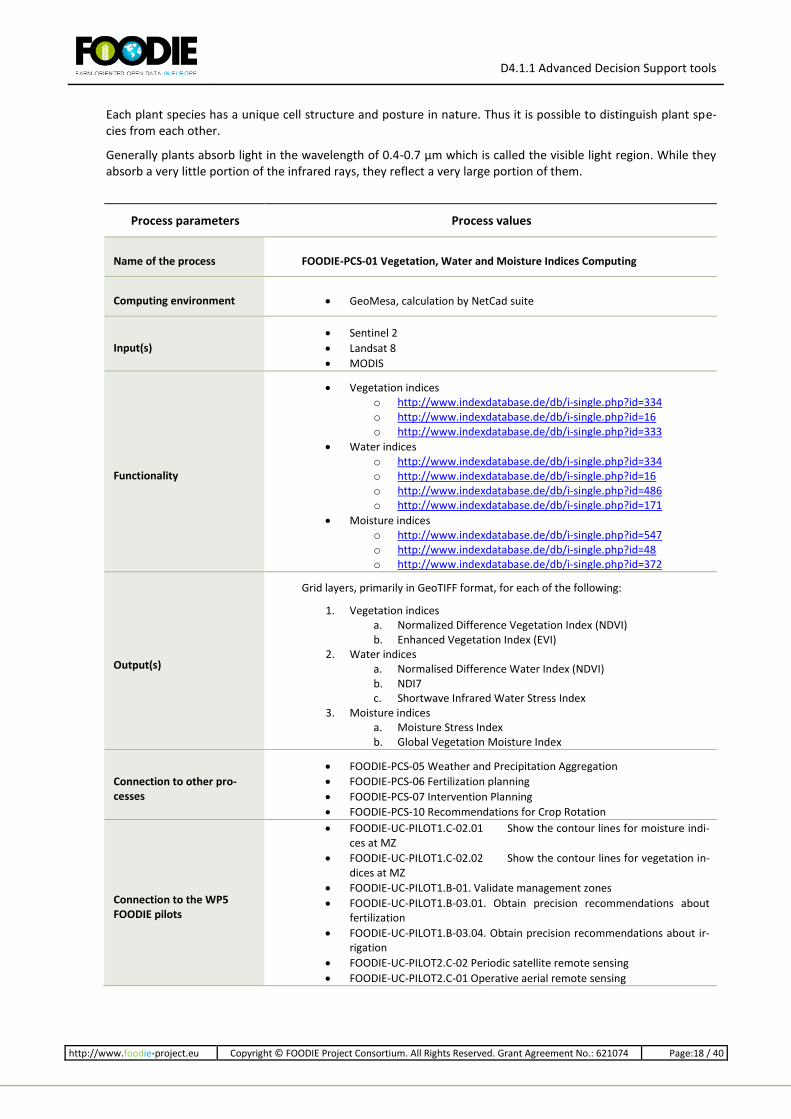
2.1 Vegetation, Water and Moisture Indices Computing
Vegetation, Water and Moisture Indexes are important measurements which provide geospatial information about farm fields and crops. These indexes require advanced geoprocessing capabilities and are implemented by means of the OGC Web Processing [3] and OGC Web Coverage Processing [1] Services. Computed indices can be defined as follows. Vegetation index provides a measurement of the presence of green vegetation on the land surface. Water indices are used to detect and monitor liquid water condition of vegetation canopies over large areas and finally moisture indices are used to evaluate the soil moisture values.
These indices are calculated by is obtaining a single value indicating the density of vegetation by applying math-ematical operations to reflection values with different wavelengths in electromagnetic spectrum.
Plants absorb or reflect rays in various wavelengths in a manner unique to them according to their cell struc-tures, leaf and surface widths, amount of water in their bodies and their positions in their natural environments.
D4.1.1 Advanced Decision Support tools
http://www.foodie-project.eu Copyright © FOODIE Project Consortium. All Rights Reserved. Grant Agreement No.: 621074 Page:18 / 40
Each plant species has a unique cell structure and posture in nature. Thus it is possible to distinguish plant spe-cies from each other.
Generally plants absorb light in the wavelength of 0.4-0.7 μm which is called the visible light region. While they absorb a very little portion of the infrared rays, they reflect a very large portion of them.
Process parameters Process values
Name of the process FOODIE-PCS-01 Vegetation, Water and Moisture Indices Computing
Computing environment GeoMesa, calculation by NetCad suite
Input(s)
Sentinel 2
Landsat 8
MODIS
Functionality
Vegetation indices o http://www.indexdatabase.de/db/i-single.php?id=334 o http://www.indexdatabase.de/db/i-single.php?id=16 o http://www.indexdatabase.de/db/i-single.php?id=333
Water indices o http://www.indexdatabase.de/db/i-single.php?id=334 o http://www.indexdatabase.de/db/i-single.php?id=16 o http://www.indexdatabase.de/db/i-single.php?id=486 o http://www.indexdatabase.de/db/i-single.php?id=171
Moisture indices o http://www.indexdatabase.de/db/i-single.php?id=547 o http://www.indexdatabase.de/db/i-single.php?id=48 o http://www.indexdatabase.de/db/i-single.php?id=372
Output(s)
Grid layers, primarily in GeoTIFF format, for each of the following:
1. Vegetation indices a. Normalized Difference Vegetation Index (NDVI) b. Enhanced Vegetation Index (EVI)
2. Water indices a. Normalised Difference Water Index (NDVI) b. NDI7 c. Shortwave Infrared Water Stress Index
3. Moisture indices a. Moisture Stress Index b. Global Vegetation Moisture Index
Connection to other pro-cesses
FOODIE-PCS-05 Weather and Precipitation Aggregation
FOODIE-PCS-06 Fertilization planning
FOODIE-PCS-07 Intervention Planning
FOODIE-PCS-10 Recommendations for Crop Rotation
Connection to the WP5 FOODIE pilots
FOODIE-UC-PILOT1.C-02.01 Show the contour lines for moisture indi-ces at MZ
FOODIE-UC-PILOT1.C-02.02 Show the contour lines for vegetation in-dices at MZ
FOODIE-UC-PILOT1.B-01. Validate management zones
FOODIE-UC-PILOT1.B-03.01. Obtain precision recommendations about fertilization
FOODIE-UC-PILOT1.B-03.04. Obtain precision recommendations about ir-rigation
FOODIE-UC-PILOT2.C-02 Periodic satellite remote sensing
FOODIE-UC-PILOT2.C-01 Operative aerial remote sensing
D4.1.1 Advanced Decision Support tools
http://www.foodie-project.eu Copyright © FOODIE Project Consortium. All Rights Reserved. Grant Agreement No.: 621074 Page:19 / 40
Process parameters Process values
FOODIE-UC-PILOT2.C-01.01 Process aerial multispectral images
FOODIE-UC-PILOT2.C-01.03 Display results
FOODIE-UC-PILOT2.C-02 Periodic satellite remote sensing
FOODIE-UC-PILOT2.C-02.01 Download Landsat imagery into geodatabase
FOODIE-UC-PILOT2.C-02.02 Compute time differences of Landsat NDVI images
FOODIE-UC-PILOT2.C-02.03 Show dynamic of crop growth
Table 3: Detailed description of the Vegetation, Water and Moisture Indices Computing process
2.2 Land Cover Classification
Land cover and Land use involves management and modification of natural environment or wilderness into built environment such as fields, pastures, and settlements. It also has been defined as "the arrangements, activities and inputs people undertake in a certain land cover type to produce, change or maintain it" (FAO/UNEP, 1999 [2]).
Land use practices vary considerably across the world. The United Nations' Food and Agriculture Organization Water Development Division explains that "Land use concerns the products and/or benefits obtained from use of the land as well as the land management actions (activities) carried out by humans to produce those products and benefits." In total, the world contains 5 billion ha agricultural land – 1,5 billion ha arable land and 3,5 billion ha pastures and 4 billion ha forests, the rest to 13 billion ha land area is other land (dessert, alpine rocks, water etc.).
Land use and land management practices have a major impact on natural resources including water, soil, nutri-ents, plants and animals. Land use information can be used to develop solutions for natural resource manage-ment issues such as salinity and water quality. For instance, water bodies in a region that has been deforested or having erosion will have different water quality than those in areas that are forested. Forest gardening, a plant-based food production system, is believed to be the oldest form of land use in the world
According to a report by the United Nations' Food and Agriculture Organisation, land degradation has been ex-acerbated where there has been an absence of any land use planning, or of its orderly execution, or the exist-ence of financial or legal incentives that have led to the wrong land use decisions, or one-sided central planning leading to over-utilization of the land resources - for instance for immediate production at all costs. As a conse-quence the result has often been misery for large segments of the local population and destruction of valuable ecosystems. Such narrow approaches should be replaced by a technique for the planning and management of land resources that is integrated and holistic and where land users are central. This will ensure the long-term quality of the land for human use, the prevention or resolution of social conflicts related to land use, and the conservation of ecosystems of high biodiversity value.1
Land cover / use studies are multidisciplinary in nature, and thus the participants involved in such work are nu-merous and varied, ranging from international wildlife and conservation foundations, to government research-ers, and forestry companies. LandUse/Cover data will be very important for public sector, for planning subsidies system, etc.
Process parameters Process values
Name of the process FOODIE-PCS-02 Land Cover Classification
Computing environment PostgreSQL for vector-based data
Geomesa/folder system for grid data
1 http://en.wikipedia.org/wiki/Land_use

D4.1.1 Advanced Decision Support tools
http://www.foodie-project.eu Copyright © FOODIE Project Consortium. All Rights Reserved. Grant Agreement No.: 621074 Page:20 / 40
Process parameters Process values
Input(s) CORINE Land Cover
OSM land cover data
Satellite data (Sentinel, LANDSAT)
Functionality
1. Reclassification from OSM/CORINE scheme into the following classes
artificial surfaces
agricultural areas o arable land o permanent crops
vineyard fruit trees and berry plantations olive groves
o grassland pastures meadows
o heterogeneous agricultural areas (e.g. annual crops associated with permanent crops)
other areas 2. Supervised classification of satellite/aerial images
Output(s) 1. Vector layer in GML/GeoJSON formats with land cover information
Connection to other pro-cesses
FOODIE-PCS-03 Machinery Tracking
FOODIE-PCS-04 Plot Geometry Verification by Sensor Measurements
FOODIE-PCS-08 Pan-European Crop Statistics
FOODIE-PCS-09 Economic Statistics
Connection to the WP5 FOODIE pilots
FOODIE-UC-PILOT2.A-01 Obtain input data
FOODIE-UC-PILOT2.B-03.02 Overlay machinery passes and zones with agroenvironmental limits
Table 4: Detailed description of the Land Cover Classification process
2.3 Machinery Tracking
The agri-food sector is one of the primary driving forces of the EU economy, being a source of income for around 20% of its inhabitants. According to the most recently available data (Eurostat, 2010), there were 12.2 million farms in the EU-28, covering 47% of the EU territory. Consequently agri-business has a significant impact on the environment. Farming business contributes to the depletion of non-renewable energy sources and to global warming (total emissions - CO2 equivalent arose from 404.637k in 2011 to 407.040k in 2012 as defined by FAOSTAT 2012 [4]). Inappropriate agricultural practices and land use can also have an adverse impact on natural resources, like the pollution of soil, water and air. The principal farming activity which causes a huge amount of direct energy con-sumption is linked to the use of machinery (e.g. cultivation of fields with tractors), although the application of machinery and mineral fertilisers has increased agricultural productivity and food supply. Increasing environ-mental pressures over agriculture sector lead farmers to find and adopt effective and affordable solutions that can meet at the same time their scope (profitability). Currently, precision agriculture technologies represent an effective answer to a more optimized farming man-agement. Machinery tracking provides a solution able to support farmers in the management of farming actions while reducing the energy consumption and improving carbon balance, maintaining high level of outputs. Ma-chinery tracking empowers farmers to maximise economic profitability of crop production in a sustainable man-ner, through the monitoring of the fuel consumption – and related carbon dioxide emissions – the control of performed treatments; the tracking of the vehicles position.
With its competitive edge based on availability of information on the precise location of the machine for later lo-gistics use, records by crops, field, machine, driver and time window (day, week, month, vegetation season,

D4.1.1 Advanced Decision Support tools
http://www.foodie-project.eu Copyright © FOODIE Project Consortium. All Rights Reserved. Grant Agreement No.: 621074 Page:21 / 40
year)nutrient- and CO2-balance, its versatility and easy portability to different machines, its tracking ability by us-ing GPS and online data transfer via GPRS, connection to CAN-BUS/ISO-BUS, the availability of tool for identifica-tion of machines and drivers, easy visualization of data in a GIS environment with the implementation of the background data, Machinery tracking is uniquely able to empower farmers and companies to make the right de-cisions and timely and optimize the level of farm inputs.
Process parameters Process values
Name of the process FOODIE-PCS-03 Machinery Tracking
Computing environment PostgreSQL with script developed by FOODIE
Input(s) FOODIE machinery fleet tracking though a GPS receiver mounted
in the tractor
Functionality
1. Display actual position/movement of a machine through e.g. a cell-phone application to a user
2. Use the result trajectory as a basis for other processes
Output(s) 1. Vector layer in GML/GeoJSON formats with information on trajec-
tory
Connection to other pro-cesses
FOODIE-PCS-02 Land Cover Classification
FOODIE-PCS-04 Plot Geometry Verification by Sensor Measure-ments
FOODIE-PCS-05 Weather and Precipitation Aggregation
FOODIE-PCS-06 Fertilization planning
FOODIE-PCS-07 Intervention Planning
FOODIE-PCS-09 Economic Statistics
Connection to the WP5 FOODIE pilots
FOODIE-UC-PILOT2.B-01 Tracking the machinery fleet
FOODIE-UC-PILOT2.B-02 Evaluation of economic efficiency
FOODIE-UC-PILOT2.B-03 Evaluation of machinery passes on the soil environment
FOODIE-UC-PILOT1.A-01.01. Register herbicide treatments
FOODIE-UC-PILOT1.A-01.02. Register phytosanitary treatments
FOODIE-UC-PILOT1.A-01.03. Register fertilizer treatments
FOODIE-UC-PILOT1.C-03. Display treatments applied
Table 5: Detailed description of the Machinery Tracking process
2.4 Plot Geometry Verification by Sensor Measurements
As a side effect of machinery tacking could be improving of available data, as agriculture roads and plots map-ping. Data from machinery tracking will allow defining borders of single plots and use such essential information in the FOODIE data model. The measurement from farm telemetry could be used for Plot verification. The data from filed operation could define borders of single plots.
There are two main models of LPIS data: field polygon is equal to LPIS or a region with several fields is equal to LPIS. As we for a well-organized logistics or Precision farming always need the field polygon, to create field poly-gons will be possible either by digitizing on orthoimages or by producing GPS-contour files with the help of ma-chines.
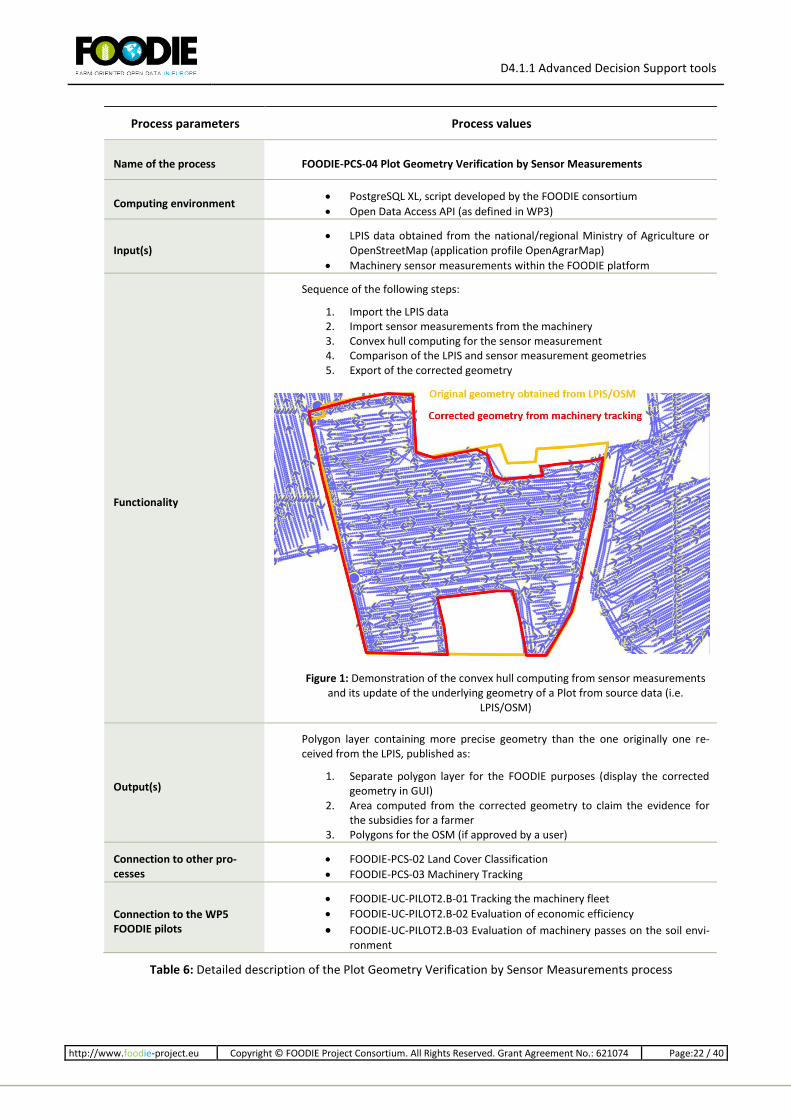
D4.1.1 Advanced Decision Support tools
http://www.foodie-project.eu Copyright © FOODIE Project Consortium. All Rights Reserved. Grant Agreement No.: 621074 Page:22 / 40
Process parameters Process values
Name of the process FOODIE-PCS-04 Plot Geometry Verification by Sensor Measurements
Computing environment PostgreSQL XL, script developed by the FOODIE consortium
Open Data Access API (as defined in WP3)
Input(s) LPIS data obtained from the national/regional Ministry of Agriculture or
OpenStreetMap (application profile OpenAgrarMap)
Machinery sensor measurements within the FOODIE platform
Functionality
Sequence of the following steps:
1. Import the LPIS data 2. Import sensor measurements from the machinery 3. Convex hull computing for the sensor measurement 4. Comparison of the LPIS and sensor measurement geometries 5. Export of the corrected geometry
Figure 1: Demonstration of the convex hull computing from sensor measurements and its update of the underlying geometry of a Plot from source data (i.e.
LPIS/OSM)
Output(s)
Polygon layer containing more precise geometry than the one originally one re-ceived from the LPIS, published as:
1. Separate polygon layer for the FOODIE purposes (display the corrected geometry in GUI)
2. Area computed from the corrected geometry to claim the evidence for the subsidies for a farmer
3. Polygons for the OSM (if approved by a user)
Connection to other pro-cesses
FOODIE-PCS-02 Land Cover Classification
FOODIE-PCS-03 Machinery Tracking
Connection to the WP5 FOODIE pilots
FOODIE-UC-PILOT2.B-01 Tracking the machinery fleet
FOODIE-UC-PILOT2.B-02 Evaluation of economic efficiency
FOODIE-UC-PILOT2.B-03 Evaluation of machinery passes on the soil envi-ronment
Table 6: Detailed description of the Plot Geometry Verification by Sensor Measurements process

D4.1.1 Advanced Decision Support tools
http://www.foodie-project.eu Copyright © FOODIE Project Consortium. All Rights Reserved. Grant Agreement No.: 621074 Page:23 / 40
2.5 Weather and Precipitation Aggregation
The FOODIE platform will provide specific and high-value applications and services for the support in the plan-ning and decision-making processes. In particular, the Weather and Precipitation Aggregation process will be in-volved in the prediction of crop diseases (Plasmopara viticola), the prediction of yield production and the esti-mation of the recommended date for harvesting.
Process parameters Process values
Name of the process FOODIE-PCS-05 Weather and Precipitation Aggregation
Computing environment PL/R - PostGIS
Input(s)
Polygons for the Management Zone (MZ) of a holding
Interpolated surface for sensors observations (temperature of the air, relative humidity, precipitation, etc.) provided by motes of FOODIE con-sortium and public Spanish meteo services.
Functionality
If conditions for development of Plasmopara viticola
Then
Calculate percentage of advance of Plasmopara viticola disease by means of the implementation of the Goidanich's model:
http://www.ruralcat.net/migracio_resources/617683_mildius.PDF
If date is in period of time for irrigation monitoring
Then
Calculate irrigation needs by means of evapotranspiration and adjusted by the pa-rameters provided by the technical director of the vineyard.
If date is in harvesting season and the MZ was not harvested
Then
Calculate maturity indices of the grapes
Output(s)
Percentage of advance of Plasmopara viticola for the MZ
Maturity indices of the grapes
Predicted date for harvesting
Connection to other pro-cesses
FOODIE-PCS-01 Vegetation, Water and Moisture Indices Computing
FOODIE-PCS-03 Machinery Tracking
FOODIE-PCS-06 Fertilization planning
FOODIE-PCS-07 Intervention Planning
FOODIE-PCS-08 Pan-European Crop Statistics
FOODIE-PCS-09 Economic Statistics
FOODIE-PCS-10 Recommendations for Crop Rotation
Connection to the WP5 FOODIE pilots
FOODIE-UC-PILOT1.B-03.03. Provide recommendations related with the need of apply phytosanitary treatments.
FOODIE-UC-PILOT1.B-03.04. Provide recommendations related with needs of irrigation.
FOODIE-UC-PILOT1.B-04. Provide recommendations related with when and where to start the harvesting.
Table 7: Detailed description of the Weather and Precipitation Aggregation process

D4.1.1 Advanced Decision Support tools
http://www.foodie-project.eu Copyright © FOODIE Project Consortium. All Rights Reserved. Grant Agreement No.: 621074 Page:24 / 40
2.6 Fertilization Planning
The DokuPlant expert model of today embeds beside other elements also for the pilot region Germany all inor-ganic fertilizer with their chemical contents as well as pricings and product names; further we worked out many organic fertilizers with their chemical contents, not only manure and liquid manure but also residues on the fields and their chemical contents, e.g. after harvesting of sugar-beets the leaves stay on the fields and rot resp. decompose there.
With the help of these data, farmers will be able to plan according the natural circular flow management mod-el – the nature has no waste – that means we have to understand how much of the different nutrients (mainly N, P, K, Ca, Mg and micronutrients contains the soil, how much is needed by the plants, some plants are able to store N via bacteries so also such calculations have to be done). Depending on the harvest result we have nutri-ents that disappear from the soil and are now stored in the harvest and a part of the production, e.g. leaves after sugarbeet harvesting, stays on the field and give some nutrients back. As a next step we have to know what happened in the past and what is planned on the field in the future. This circle we have to understand in detail to be able to calculate these datasets. In parallel we have to know the detailed weather situation as with e.g. heavy rain nitrogen is very moveable in the soil and will be washed out, it means we cannot give N-fertilizer at once as most of it will be washed out only. Other nutrients are better bound on the soil complex. Weather data like rain, temperature, wind etc. are also needed to evaluate and calculate the situation in detail. All these data we have to know for the different elements of the field – depending on the size - as a field is not unique, it has excellent soils here and mainly stones on another part, has differences in humus, in nutrients, etc.; only a sum-mary of all these data will give us as result the know how where to do what – m² precise with the target to save costs, to work more sustainable and optimize ecology and economy together.
Process parameters Process values
Name of the process FOODIE-PCS-06 Fertilization planning
Computing environment DokuPlant as farm management tool;
WinGIS for precise GIS calculations.
Input(s)
Fleet tracking sensor data
Point sensor measurement during the season (available for CZ and ES pi-lots)
Satellite images (Sentinel, LANDSAT)
See also the following pictures. Datasets available through further interfaces are necessary – LPIS data, cadastre data, soil map data from a public soil map, geologi-cal map to understand the potential of additional nutrient supply from the geology, harvest sensor data to understand the growth m² b m², soil measurements with NIRS analysis of the main nutrients, satellite images that tell us – if possible several times during the growth season – the chlorophyll content and with it the growth etc. The interface for all these inputs are an important step to have all the data available to make better decisions, m² precise, and create a map that in a next step can be transmitted to a machine. Both, technology and lots of agricultural know how is needed to optimize it and also the special situation on the field with its his-tory and future plans.
Functionality
At the moment we are working on a model that we call “circular flow manage-ment” to embed also feed and manure/liquid manure together with soil and plant/harvest data to be able in the future to calculate with few data the circular flow “Feed – manure – soil – harvest”; all other calculation are guessing. New lab technologies that have to be part of such a model are ready together with partners.
Together with soil data, chlorophyll data of an N-sensor or of satellite images, of yield maps from the last harvest period collected e.g. by a combine and the above mentioned data a fertilization map can be worked out and transmitted to our mobGIS that local via Bluetooth transfers the map to a terminal that is installed on

D4.1.1 Advanced Decision Support tools
http://www.foodie-project.eu Copyright © FOODIE Project Consortium. All Rights Reserved. Grant Agreement No.: 621074 Page:25 / 40
Process parameters Process values
the machine and that again triggers the e.g. fertilizer machine.
All this is a combination of different technologies (technology integration) and ser-vices (as not every farmer will be able to interpret all these data although if he could have them) and needs in the future these service structures to implement it on a wider level.
Extended GIS features like ISO model creation tools enables the advanced visualiza-tion of spatial measurement data (e.g. from sensors) for agricultural needs. The first step is to gather geo referenced attribute data and provide it in a standard file format or protocol for data exchange and delivery. GIS and GIS based agricultural applications or platforms enables farmers, advisors and experts to import and con-vert the raw data to useful maps due to visualization techniques like creating ISO models. The interpolation of values at specific positions is done via calculation methods like Kriging or Inverse Distance. The resolution depends on the quality and density of the raw data and the granularity of the used calculation method. The re-sult and also the transmission of the result e.g. to agricultural machines is an im-portant basis for applications like precision farming. Examples: soil maps, yield maps, telemetry data from machines, digital elevation and digital terrain models, visualization of weather conditions, soil moisture maps and many others.
Figure 2: A harvest map where the different colours show how much kg/ha they represent
Figure 3: An isoline model calculated out of point information that tells us how is the humidity on the field

D4.1.1 Advanced Decision Support tools
http://www.foodie-project.eu Copyright © FOODIE Project Consortium. All Rights Reserved. Grant Agreement No.: 621074 Page:26 / 40
Process parameters Process values
Figure 4: A truck of a machine that documents when and where the ma-chine was driving
Figure 5: Selection of the colours for defining a coloured map
Figure 6: Different versions of coloured map that tells us how much was planned where to fertilize and what was the realization of the contract; out
of both maps differences between plan and reality can be derived

D4.1.1 Advanced Decision Support tools
http://www.foodie-project.eu Copyright © FOODIE Project Consortium. All Rights Reserved. Grant Agreement No.: 621074 Page:27 / 40
Process parameters Process values
Figure 7: Different versions of coloured map that tells us how much was planned where to fertilize and what was the realization of the contract; out of both maps differences between plan and reality can be derived
Figure 8: Isoline model on a region that tells us height differences; runoff models can be calculated
Figure 9: Tracks and harvest results combined
Output(s)
1. Fertilization map as plan that integrates all gathered data and infor-mation (to optimize not only N but also other nutrients in future we will need better products in future as well than only N-P-K = 60-20-20)
2. Protocol of the done activity: to have a document what really was done and that is able to show the difference between plan and done.
Connection to other pro-cesses
FOODIE-PCS-01 Vegetation, Water and Moisture Indices Computing
FOODIE-PCS-03 Machinery Tracking
FOODIE-PCS-04 Plot Geometry Verification by Sensor Measurements
FOODIE-PCS-05 Weather and Precipitation Aggregation
FOODIE-PCS-06 Fertilization planning

D4.1.1 Advanced Decision Support tools
http://www.foodie-project.eu Copyright © FOODIE Project Consortium. All Rights Reserved. Grant Agreement No.: 621074 Page:28 / 40
Process parameters Process values
FOODIE-PCS-07 Intervention Planning
FOODIE-PCS-10 Recommendations for Crop Rotation
Connection to the WP5 FOODIE pilots
FOODIE-UC-PILOT2.A-02 Compute transport schedule
FOODIE-UC-PILOT2.B-02 Evaluation of economic efficiency
FOODIE-UC-PILOT2.B-03 Evaluation of machinery passes on the soil envi-ronment
FOODIE-UC-PILOT3.A-04 Selection of LPIS data provider depending on quality
FOODIE-UC-PILOT3.A-05 Decision for geological, soil, hydrological maps and data formats
FOODIE-UC-PILOT3.A-06 Map of farm holding with ownership (cadastre) and LPIS (field) data on ortho image
FOODIE-UC-PILOT3.A-06.01 Summary of groups of farms
FOODIE-UC-PILOT3.B-01 Regional adoptions of user interfaces of the farm management software, e.g. translation of language files
FOODIE-UC-PILOT3.8-02 Expert data as background information
FOODIE-UC-PILOT3.B-03 Planning
FOODIE-UC-PILOT3.B04 Detailed documentation of activities
FOODIE-UC-PILOT3.B-04.01 Data entry manually by farmer/advisor or da-ta entry from machinery
FOODIE-UC-PILOT3.B-07 Calculation per field, per farm and per crop
FOODIE-UC-PILOT3.B-08 Documentation of all activities per field
FOODIE-UC-PILOT3.B-13 Mandant module.
FOODIE-UC-PILOT1.A-01.03. Register fertilizer treatments
FOODIE-UC-PILOT1.B-03.01. Provide recommendations related to fer-tilization needs
Table 8: Detailed description of the Fertilization Planning process
2.7 Intervention Planning
In Europe we have different types of intervention – farmers support with the help of two major groups - public or private intervention. The public one is often integrated into Chambers, Cooperatives etc. and private exists in many cases in form of small or midsized consulting companies or also large entities like for lab-services, insur-ance etc.
Within the FOODIE platform we will be able to support intervention organizations of different types with data, with information or with ICT related services. Fertilization and fertilization maps based on different form of de-cision support information will be beside clean data supply one of the possibilities to deliver services for the FOODIE platform users.
Beside the fertilizer planning as one possibility to support intervention services, such could also be setup for data supply, tools supply and different else services. The FOODIE consortium will integrate the exploitation plan and business-model D 6.7.3 as a summary about possible services, tools etc. delivered to intervention planning.
Process parameters Process values
Name of the process FOODIE-PCS-07 Intervention Planning
Computing environment WinGIS
DokuPlant incl. mandatory solution Admin – system

D4.1.1 Advanced Decision Support tools
http://www.foodie-project.eu Copyright © FOODIE Project Consortium. All Rights Reserved. Grant Agreement No.: 621074 Page:29 / 40
Process parameters Process values
Input(s)
Farm level data regarding soil maps (could also be delivered via FOODIE)
meteorological maps
soil lab data
other lab data
information from farm management tools
crop rotation information
satellite data regarding soil moisture
chlorophyll content etc.
Functionality
Calculation based on several inputs a fertilizer recommendation map.
The mandatory model of DokuPlant can be used for intervention planning and enables a public and/or private advisory service group to manage the fields of many farmers in one system based on the expert model described already as well as the individual inputs from many farmers/fields. The advisor is after the input described in point 2.6. of this Deliverable able, to recommend activities, e.g. fertilization of a field, for many farmers resp. their fields and transmit them based on the input a fertilisation map that again will further trigger a machine to do the necessary steps for precise fertilization. This on smallholder level will be necessary as most of the smallholders will not be able to run these rather complex processes on their own so they will get as a service a ready fertilization map.
Output(s) 1. A precise fertilizer recommendation map is delivered as service
Connection to other pro-cesses
FOODIE-PCS-01 Vegetation, Water and Moisture Indices Computing
FOODIE-PCS-03 Machinery Tracking
FOODIE-PCS-04 Plot Geometry Verification by Sensor Measurements
FOODIE-PCS-05 Weather and Precipitation Aggregation
FOODIE-PCS-06 Fertilization planning
FOODIE-PCS-07 Intervention Planning
FOODIE-PCS-09 Economic Statistics
FOODIE-PCS-10 Recommendations for Crop Rotation
Connection to the WP5 FOODIE pilots
FOODIE-UC-PILOT1.B-01. Validate management zones
FOODIE-UC-PILOT1.B-02. Obtain annual irrigation and fertilization plan-ning
FOODIE-UC-PILOT1.B-03 Provide recommendations for MZ related to irrigation, fertilization, herbicidal and phytosanitary treatments
FOODIE-UC-PILOT2.C-01.02 Identification of management zones
FOODIE-UC-PILOT2.C-03.03 Implement pest and crop growth models
FOODIE-UC-PILOT3.B-01 Regional adoptions of user interfaces of the farm management software, e.g. translation of language files
FOODIE-UC-PILOT3.8-02 Expert data as background information
FOODIE-UC-PILOT3.B-03 Planning
FOODIE-UC-PILOT3.B04 Detailed documentation of activities
FOODIE-UC-PILOT3.B-04.01 Data entry manually by farmer/advisor or da-ta entry from machinery
FOODIE-UC-PILOT3.B-07 Calculation per field, per farm and per crop
FOODIE-UC-PILOT3.B-08 Documentation of all activities per field
FOODIE-UC-PILOT3.B-13 Mandant module
Table 9: Detailed description of the Intervention Planning process

D4.1.1 Advanced Decision Support tools
http://www.foodie-project.eu Copyright © FOODIE Project Consortium. All Rights Reserved. Grant Agreement No.: 621074 Page:30 / 40
2.8 Pan-European Crop Statistics
Agriculture in the European Union - Statistical and economic information covers a wide range of subjects: the economic situation in agriculture, structures, trade, markets, financial aspects and rural development. An intro-ductory chapter gives an overview of the agricultural year. Annual updates of key data on agricultural markets, providing the latest available statistics from Eurostat and data collected by the Commission's DG Agriculture and Rural Development, for the main groups of crop products as well as for animal products, wood and an overview of organic farming. Currently Euro-stat provided its data as Linked Data. It allows for a straight-forward com-parison of statistical indicators across EU countries. Through providing context for statistics it facilitates the in-terpretation process. Enables you to re-use observations in a fine-grained way.
Other potential data source is LUCAS: Land Use/Cover Area frame Statistical Survey. Following a decision of the European Parliament, the European Statistical Office (EUROSTAT) in close cooperation with the Directorate Gen-eral responsible for Agriculture and the technical support of the JRC, is organising regular, harmonised surveys across all Member States to gather information on land cover and land use. This survey is known as LUCAS (Land Use/Cover Area frame statistical Survey). The name reflects the methodology used to collect the information. Es-timates of the area occupied by different land use or land cover types are computed on the basis of observations taken at more than 250,000 sample points throughout the EU rather than mapping the entire area under inves-tigation. By repeating the survey every few years, changes to land use can be identified.
Process parameters Process values
Name of the process FOODIE-PCS-08 Pan-European Crop Statistics
Computing environment
EuroStat SPARQL endpoint
LUCAS Land Use/Cover Area frame Statistical Survey
Weather statistic
LAI index from Sentinel and Landsat data
Input(s) EUROSTAT NUTS 3 (small regions for specific diagnoses)
Functionality Compute and display as a reference to a user
Output(s) 1. Trends of production 2. Forecast of yield for season
Connection to other pro-cesses
FOODIE-PCS-02 Land Cover Classification
FOODIE-PCS-05 Weather and Precipitation Aggregation
FOODIE-PCS-06 Fertilization planning
FOODIE-PCS-07 Intervention Planning
FOODIE-PCS-09 Economic Statistics
FOODIE-PCS-10 Recommendations for Crop Rotation
Connection to the WP5 FOODIE pilots
FOODIE-UC-PILOT2.B-02 Evaluation of economic efficiency
FOODIE-UC-PILOT2.C-01.02 Identification of management zones
FOODIE-UC-PILOT2.C-01.03 Display results
Table 10: Detailed description of the Pan-European Crop Statistics process
2.9 Economic Statistics
The aim of the economic statistics calculation process is to provide aggregated information (e.g., on a daily, weekly, monthly, etc. basis) on the
amount of specific resources (e.g., water, fuel, seeds, fertilizers, pesticides, etc.) used to grow and col-

D4.1.1 Advanced Decision Support tools
http://www.foodie-project.eu Copyright © FOODIE Project Consortium. All Rights Reserved. Grant Agreement No.: 621074 Page:31 / 40
lect the different crops species cultivated at farm level together with the economic costs associated to each of them;
actual selling price of each crop species (e.g., measured as euro per ton or kg) obtained by the farmer;
global prices for different crops and regions (obtained from FAOStat and AMIS websites).
This will support farmers and farm managers in determining the daily expenses and income farm management accountability but also in the later decision making process of determining for next years which crops can more profitable based on past experiences (e.g., cost of producing a determined crop versus the benefit obtained after selling it), maximum recommendable plot area, crop rotation alternatives, etc.
Process parameters Process values
Name of the process FOODIE-PCS-09 Economic Statistics
Computing environment PostgreSQL with script/database procedure developed by FOODIE
Input(s)
Farm level o Sensor data collected within the FOODIE platform (such as irri-
gation system, fuel consumption in tractors, amount of fertiliz-ers and pesticides, etc.)
o Actual costs of the above measured parameters o Actual selling price of each crop species
Global level o FAOStat (Data for any country in the world) o AMIS
Functionality
Calculate aggregated information (on a daily, weekly, monthly, etc. basis) about amount of water, fuel, seeds, fertilizers, pesticides consumption per crop species
Calculate costs and benefits forecast for a crop species (used for the crop rotation plan)
Output(s)
Export as a GeoJSON (up to a client to choose the visualisation) o graph o map o time series
Connection to other pro-cesses
FOODIE-PCS-03 Machinery Tracking
FOODIE-PCS-06 Fertilization planning
FOODIE-PCS-07 Intervention Planning
FOODIE-PCS-08 Pan-European Crop Statistics
FOODIE-PCS-10 Recommendations for Crop Rotation
Connection to the WP5 FOODIE pilots
FOODIE-UC-PILOT1.A-01 - Register treatments
FOODIE-UC-PILOT1.A-02 - Register production
FOODIE-UC-PILOT1.A-03 - Register irrigation
FOODIE-UC-PILOT1.A-05 - Register treatment plans
FOODIE-UC-PILOT1.B-02 - Obtain annual Irrigation and fertilization plan-ning
FOODIE-UC-PILOT1.B-03 - Obtain precision recommendations
FOODIE-UC-PILOT1.B-04 - Obtain recommendations about harvesting
FOODIE-UC-PILOT1.B-05 - Obtain prediction about annual production
FOODIE-UC-PILOT1.C-04 - Display historical data about production
FOODIE-UC-PILOT2.B-01 - Tracking the machinery fleet
FOODIE-UC-PILOT2.B-02 - Evaluation of economic efficiency
Table 11: Detailed description of the Economic Statistics process
D4.1.1 Advanced Decision Support tools
http://www.foodie-project.eu Copyright © FOODIE Project Consortium. All Rights Reserved. Grant Agreement No.: 621074 Page:32 / 40
2.10 Recommendations for Crop Rotation
The recommendation for crop rotation can only be done if all necessary input data are available, otherwise it stays guessing; the most important input data will be: crop and their basic data like roots (deep or flat), nutrient needs, humus (additive or subtractive) etc., crop of last period and planned crop in the next period, soil and hu-mus- and nutrients-contents, weather situation, geological situation, local know how, market data, price data etc.; with all the input data an optimized crop ration model can be calculated case by case; in many cases it will also be a part of the advisory service as described in 2.7.
Process parameters Process values
Name of the process FOODIE-PCS-10 Recommendations for Crop Rotation
Computing environment WinGIS
DokuPlant
Input(s)
Local soil, geographical+weather-climate data+natural growth require-ments (crop rotation models to be developed with local support)
Crops, nutrient demand, sustainability models, humus demands harvest results, precise for precision farming
Functionality Sustainable crops models based on natural growth requirements as well
as market possibilities – all under economic and ecological sustainable conditions
Output(s) 1. Recommendations for Crop Rotation as a service
Connection to other pro-cesses
FOODIE-PCS-01 Vegetation, Water and Moisture Indices Computing
FOODIE-PCS-05 Weather and Precipitation Aggregation
FOODIE-PCS-06 Fertilization planning
FOODIE-PCS-07 Intervention Planning
FOODIE-PCS-08 Pan-European Crop Statistics
FOODIE-PCS-09 Economic Statistics
Connection to the WP5 FOODIE pilots
FOODIE-UC-PILOT2.B-02 Evaluation of economic efficiency
FOODIE-UC-PILOT3.B-03 Planning
FOODIE-UC-PILOT3.B-04 Realisation
FOODIE-UC-PILOT3.B-10 Statistics
Table 12: Detailed description of the Recommendations for Crop Rotation process
2.11 Semantisation Added Value
Ontologies not only enable the systematic (machine readable) representation of the domain related definitions, concepts and processes, but they can also facilitate the data sharing and federation with different systems, the provision of different views on the data, as well as the application of rules (among others), which together with other semantic technologies can be useful for verifying data constraints and to infer relationships based on the available data (e.g., to find or suggest potential relations between data elements).
For instance, farm telemetry tasks addressed in our Czech and German pilots require to select the right machine for a particular farm, as well as to improve the usage of machinery in a farm for a particular situation. In the same line, crop monitoring tasks addressed in our Spanish and Czech pilots, require the selection of the right fer-tiliser depending on the particular situation and constraints. The application of ontologies for the representation and storage of the relevant data, plus the application of semantic rules, can provide the basis for implementing these tasks, in addition to enabling the publication of linked data.
Another example is the Spanish pilot which requires access to the most relevant information published by the

D4.1.1 Advanced Decision Support tools
http://www.foodie-project.eu Copyright © FOODIE Project Consortium. All Rights Reserved. Grant Agreement No.: 621074 Page:33 / 40
local government regarding regulations, alerts, laws and other relevant news for their wine production. These reports are delivered in textual form and thus sometimes it is difficult and even time-consuming to find the right information. Ontologies along with other semantic technologies can serve as the basis to categorise these re-ports based on the key terms appearing in the text, so that users will be able to find easily the most relevant re-ports.
Finally, another task to be addressed in this WP is the automatic transformation of non-ontological data into semantic format for their integration with other datasets. Initially this task will be concerned with the integra-tion of relevant statistical data for the pilots and other future applications, as well as their publication as linked data. In this context, some of the most relevant statistical data sources include EUROSTAT and FAOSTAT. The former is available in semantic format, however, as the latter is available only in tabular format we will provide the automatic transformation of such data into semantic format.
Process parameters Process values
Name of the process FOODIE-PCS-11 machinery advice for farm telemetry
Computing environment Virtuoso (semantic triple store)
Input(s)
Agrovoc (branch equipment) + extensions
FOODIE ontology
SWRL rules
Machinery descriptions
Farm descriptions
SPARQL queries
Functionality
The component will enable to:
Record machinery activities in semantic format
Select the right machine for a particular farm;
Improve usage and effectiveness of machinery in the farm by providing the best configuration parameters for given farm characteristics
Output(s) 1. Advice in the form of textual information, extracted from Triples re-
trieved by SPARQL query
Connection to other pro-cesses
FOODIE-PCS-03 Machinery Tracking
FOODIE-PCS-04 Plot Geometry Verification by Sensor Measurements
Connection to the WP5 FOODIE pilots
FOODIE-UC-PILOT2.B-01 Tracking the machinery fleet
FOODIE-UC-PILOT2.B-02 Evaluation of economic efficiency
FOODIE-UC-PILOT2.B-03 Evaluation of machinery passes on the soil envi-ronment
Table 13: Detailed description of the machinery advice for farm telemetry
Process parameters Process values
Name of the process FOODIE-PCS-11 fertilizer advice for crop monitoring
Computing environment Virtuoso (semantic triple store)
Input(s)
Agrovoc (branch fertilizers) + extensions
FOODIE ontology
SWRL rules
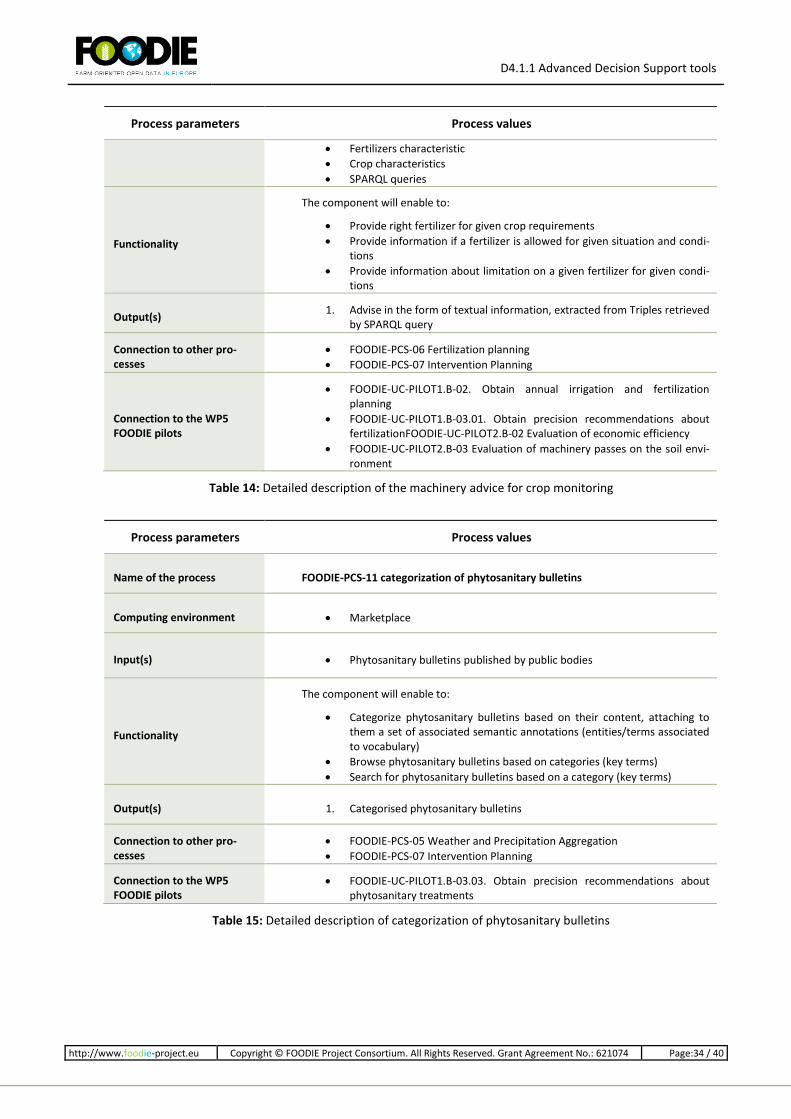
D4.1.1 Advanced Decision Support tools
http://www.foodie-project.eu Copyright © FOODIE Project Consortium. All Rights Reserved. Grant Agreement No.: 621074 Page:34 / 40
Process parameters Process values
Fertilizers characteristic
Crop characteristics
SPARQL queries
Functionality
The component will enable to:
Provide right fertilizer for given crop requirements
Provide information if a fertilizer is allowed for given situation and condi-tions
Provide information about limitation on a given fertilizer for given condi-tions
Output(s) 1. Advise in the form of textual information, extracted from Triples retrieved
by SPARQL query
Connection to other pro-cesses
FOODIE-PCS-06 Fertilization planning
FOODIE-PCS-07 Intervention Planning
Connection to the WP5 FOODIE pilots
FOODIE-UC-PILOT1.B-02. Obtain annual irrigation and fertilization planning
FOODIE-UC-PILOT1.B-03.01. Obtain precision recommendations about fertilizationFOODIE-UC-PILOT2.B-02 Evaluation of economic efficiency
FOODIE-UC-PILOT2.B-03 Evaluation of machinery passes on the soil envi-ronment
Table 14: Detailed description of the machinery advice for crop monitoring
Process parameters Process values
Name of the process FOODIE-PCS-11 categorization of phytosanitary bulletins
Computing environment Marketplace
Input(s) Phytosanitary bulletins published by public bodies
Functionality
The component will enable to:
Categorize phytosanitary bulletins based on their content, attaching to them a set of associated semantic annotations (entities/terms associated to vocabulary)
Browse phytosanitary bulletins based on categories (key terms)
Search for phytosanitary bulletins based on a category (key terms)
Output(s) 1. Categorised phytosanitary bulletins
Connection to other pro-cesses
FOODIE-PCS-05 Weather and Precipitation Aggregation
FOODIE-PCS-07 Intervention Planning
Connection to the WP5 FOODIE pilots
FOODIE-UC-PILOT1.B-03.03. Obtain precision recommendations about phytosanitary treatments
Table 15: Detailed description of categorization of phytosanitary bulletins

D4.1.1 Advanced Decision Support tools
http://www.foodie-project.eu Copyright © FOODIE Project Consortium. All Rights Reserved. Grant Agreement No.: 621074 Page:35 / 40
Process parameters Process values
Name of the process FOODIE-PCS-11 automatic data transformation and publication as linked data
Computing environment Virtuoso (semantic triple store)
Input(s) Statistical data, initially
o FAOStat (CSV format)
Functionality Convert automatically Excel files to RDF
Publish generated data as linked data
Output(s) 1. FAOStat data in linked data format
Connection to other pro-cesses
FOODIE-PCS-08 Pan-European Crop Statistics
FOODIE-PCS-09 Economic Statistics
Connection to the WP5 FOODIE pilots
FOODIE-UC-PILOT2.A-01 Obtain input data
FOODIE-UC-PILOT2.B-01.02 Show machinery tracks and treatment pa-rameters in GIS viewer
FOODIE-UC-PILOT2.C-01.03 Display results
FOODIE-UC-PILOT2.C-03.02 Aggregate and visualize meteorological data
Table 16: Detailed description of automatic data transformation and publication as linked data

D4.1.1 Advanced Decision Support tools
http://www.foodie-project.eu Copyright © FOODIE Project Consortium. All Rights Reserved. Grant Agreement No.: 621074 Page:36 / 40
3 Relations between processes
The section 2 of this document has provided the detailed overview of the application processes used within the FOODIE platform. The primary aim of the section 3 is to demonstrate relations between the processes identified in section 2. Such relations may be in a form of dependencies, e.g. where one processes may be conducted only if another (predeceasing) process has been finished. Typical example may be found in an association between a Plot geometry verification by sensor measurements that is feasible only after the finishing the process called Ma-chinery tracking.
Relations between identified processes are unidirectional or bidirectional. So far, directions between processes have not been assumed. Table 14 therefore depicts whether any relationship exists between two processes, however does not comprise e.g. whether a processes A is a pre-condition for a process B. Note that such feature will be added in the following version of this deliverable, i.e. in D4.1.2.
Processes of the FOODIE platform
FOO
DIE
-PC
S-0
1 V
eget
atio
n,
Wat
er a
nd
Mo
istu
re I
nd
ice
s
Co
mp
uti
ng
FOO
DIE
-PC
S-0
2 L
and
Co
ver
Cla
ssif
icat
ion
FOO
DIE
-PC
S-0
3 M
ach
iner
y Tr
acki
ng
FOO
DIE
-PC
S-0
4
Plo
t G
eom
etry
V
erif
icat
ion
b
y Se
nso
r
Mea
sure
men
ts
FOO
DIE
-PC
S-0
5 W
eath
er a
nd
Pre
cip
itat
ion
Agg
rega
tio
n
FOO
DIE
-PC
S-0
6 F
erti
lizat
ion
pla
nn
ing
FOO
DIE
-PC
S-0
7 In
terv
enti
on
Pla
nn
ing
FOO
DIE
-PC
S-0
8 P
an-E
uro
pea
n C
rop
Sta
tist
ics
FOO
DIE
-PC
S-0
9 E
con
om
ic S
tati
stic
s
FOO
DIE
-PC
S-1
0 R
eco
mm
end
atio
ns
for
Cro
p R
ota
tio
n
FOO
DIE
-PC
S-1
1 S
eman
tisa
tio
n A
dd
ed V
alu
e
FOODIE-PCS-01 Vegetation, Water and Moisture Indi-ces Computing
FOODIE-PCS-02 Land Cover Classification
FOODIE-PCS-03 Ma-chinery Tracking
FOODIE-PCS-04 Plot Geometry Verifica-tion by Sensor Measurements
FOODIE-PCS-05 Weather and Precip-itation Aggregation
FOODIE-PCS-06 Fer-tilization planning
FOODIE-PCS-07 In-tervention Planning

D4.1.1 Advanced Decision Support tools
http://www.foodie-project.eu Copyright © FOODIE Project Consortium. All Rights Reserved. Grant Agreement No.: 621074 Page:37 / 40
Processes of the FOODIE platform
FOO
DIE
-PC
S-0
1 V
eget
atio
n,
Wat
er a
nd
Mo
istu
re I
nd
ice
s
Co
mp
uti
ng
FOO
DIE
-PC
S-0
2 L
and
Co
ver
Cla
ssif
icat
ion
FOO
DIE
-PC
S-0
3 M
ach
iner
y Tr
acki
ng
FOO
DIE
-PC
S-0
4
Plo
t G
eom
etry
V
erif
icat
ion
b
y Se
nso
r
Mea
sure
men
ts
FOO
DIE
-PC
S-0
5 W
eath
er a
nd
Pre
cip
itat
ion
Agg
rega
tio
n
FOO
DIE
-PC
S-0
6 F
erti
lizat
ion
pla
nn
ing
FOO
DIE
-PC
S-0
7 In
terv
enti
on
Pla
nn
ing
FOO
DIE
-PC
S-0
8 P
an-E
uro
pea
n C
rop
Sta
tist
ics
FOO
DIE
-PC
S-0
9 E
con
om
ic S
tati
stic
s
FOO
DIE
-PC
S-1
0 R
eco
mm
end
atio
ns
for
Cro
p R
ota
tio
n
FOO
DIE
-PC
S-1
1 S
eman
tisa
tio
n A
dd
ed V
alu
e
FOODIE-PCS-08 Pan-European Crop Sta-tistics
FOODIE-PCS-09 Eco-nomic Statistics
FOODIE-PCS-10 Recommendations for Crop Rotation
FOODIE-PCS-11 Se-mantisation Added Value
Table 17: Relations between fundamental processes of the FOODIE platform.

D4.1.1 Advanced Decision Support tools
http://www.foodie-project.eu Copyright © FOODIE Project Consortium. All Rights Reserved. Grant Agreement No.: 621074 Page:38 / 40
4 Thematic Working Groups
Identification and definition phase of processes within the FOODIE platform have confirmed the heterogeneity of tasks for in the implementation phase. Heterogeneity on the one hand and necessity to go into depth on the other hand are challenging. Expert groups have been established within the FOODIE project to address the iden-tified and defined challenges. We have called such expert groups as thematic working groups since each of them is aiming at specific implementation task. Table 18 depicts five thematic working groups focusing on implemen-tation challenges. Table 18 also contains processes relevant for each thematic working group.
Name of thematic work-ing group
Relevant processes
Sensors
FOODIE-PCS-03 Machinery Tracking
FOODIE-PCS-04 Plot Geometry Verification by Sensor Measurements
FOODIE-PCS-05 Weather and Precipitation Aggregation
FOODIE-PCS-06 Fertilization planning
FOODIE-PCS-07 Intervention Planning
Satellite imagery FOODIE-PCS-01 Vegetation, Water and Moisture Indices Computing
FOODIE-PCS-02 Land Cover Classification
Global databases
FOODIE-PCS-01 Vegetation, Water and Moisture Indices Computing
FOODIE-PCS-02 Land Cover Classification
FOODIE-PCS-09 Economic Statistics
FOODIE-PCS-11 Semantisation Added Value
Portal development
FOODIE-PCS-01 Vegetation, Water and Moisture Indices Computing
FOODIE-PCS-02 Land Cover Classification
FOODIE-PCS-03 Machinery Tracking
FOODIE-PCS-04 Plot Geometry Verification by Sensor Measurements
FOODIE-PCS-05 Weather and Precipitation Aggregation
FOODIE-PCS-06 Fertilization planning
FOODIE-PCS-07 Intervention Planning
FOODIE-PCS-08 Pan-European Crop Statistics
FOODIE-PCS-09 Economic Statistics
FOODIE-PCS-10 Recommendations for Crop Rotation
FOODIE-PCS-11 Semantisation Added Value
Land Parcel Identification Systems (LPIS) and basic FOODIE data
FOODIE-PCS-02 Land Cover Classification
FOODIE-PCS-04 Plot Geometry Verification by Sensor Measurements
FOODIE-PCS-05 Weather and Precipitation Aggregation
FOODIE-PCS-08 Pan-European Crop Statistics
Table 18: Overview of thematic working groups for implementation and relevant (fundamental) processes.

D4.1.1 Advanced Decision Support tools
http://www.foodie-project.eu Copyright © FOODIE Project Consortium. All Rights Reserved. Grant Agreement No.: 621074 Page:39 / 40
5 Conclusions
Development of an information system like FOODIE has to follow certain steps to achieve implementation that will satisfy user requirements. These steps are, among others, revisions of user requirements, identification and definition of relevant processes (so-called business/application logic) as well as implementation of the processes. Exactly such steps have been conducted in order to develop further building stones of the FOODIE platform. This deliverable describes each step separately to capture the knowledge obtained during the development of the FOODIE platform.
The work in WP4 has confirmed validity of the previous steps performed in the FOODIE project, namely:
the RM-ODP approach in architecture, as defined in WP2, is a valid one for the implementation of the requested processes;
open and proprietary application programming interfaces, as defined in WP3, are capable to handle all kind of data and functionality that should be provided by the FOODIE platform;
current development in WP4 has confirmed that the identified and defined fundamental processes are implementable with effort and knowledge of the partners of the FOODIE consortium;
all requirements with priority “MUST”, as defined in WP5, have been addressed with one or more pro-cesses;
dissemination activities on implementation progress like the one in Global Earth Observation System of Systems (GEOSS), as a part of WP6, has proved the frontier development of the FOODIE platform in the agro-IT domain.
So far, technologies for the implementation phase have been evaluated as appropriate. Minor obstacles needed to be sorted out as in all similar developments, however the technological basis remains the same as originally planned.
Initial development of the FOODIE portal has also been a part of last six months of the project (from April 2015 to October 2015). Based on user requirements and expectations, almost any farmer would NOT like to move from a Graphical User Interface (GUI) of his/her platform into the GUI of the FOODIE platform (or any other sys-tem). Such change has been considered by farmers as a stressful one since they would like to focus on their work in the way they are used to do so. The FOODIE portal has therefore been designed as a “signpost” to three main (client) parts of the FOODIE platform:
FOODIE Marketplace, as a place for exchange of knowledge, experience and know-how focused on ag-riculture for farmers, advisory services, service organisations and retail business;
FOODIE Geoportal, as a place for connecting to the FOODIE datasets as well as open and proprietary services primarily intended for geospatial experts (typically as employees of the above mentioned us-ers);
FOODIE Dashboard, as a place offering a tool enabling configuration of a set of visualizations fitting the exact needs of the end user through widgets including their interconnections.
The ongoing work will aim at two main directions, extensive and intensive. The extensive directions comprise identification and definitions of other processes relevant for the FOODIE platform. The key inputs will be user requirements from WP5 with lower priority than “MUST”, newly emerging challenges during implementation phase as well as feedback from dissemination activities. The intensive direction consists of two interconnected activities: implementation of processes and updates of processes definitions.

D4.1.1 Advanced Decision Support tools
http://www.foodie-project.eu Copyright © FOODIE Project Consortium. All Rights Reserved. Grant Agreement No.: 621074 Page:40 / 40
References
[1] BAUMANN, P. (ed.) 2012. OGC® WCS 2.0 Interface Standard- Core: Corrigendum [online]. Open Geospatial Con-
sortium. Cited 12 October 2015. Available from: <https://portal.opengeospatial.org/files/09-110r4>.
[2] FAO/UNEP. 1999. Land Resources [online]. Food and Agriculture Organization of the United Nations. Cited 26 Oc-tober 2015. Available from: <http://www.fao.org/nr/land/use/en/>.
[3] SCHUTT, P. (ed.). 2007. OpenGIS® Web Processing Service [online]. Open Geospatial Consortium. Cited 12 Octo-ber 2015. Available from: <http://portal.opengeospatial.org/files/?artifact_id=24151>.
[4] TUBIELLO, F. N., SALVATORE, M., ROSSI, S., FERRARA, A., FITTO, N., SMITH, P. 2013. The FAOSTAT database of greenhouse gas emissions from agriculture. Environmental Research Letters 8 (2013), 10 p. Available from: <http://www.fao.org/climatechange/36143-0fa4483057747f41c08183b702ec5954e.pdf>