D4 GHG DAE 08-12-08 - Port of Los Angeles · San Pedro Waterfront Project EIS/EIR D4-1 D4...
58
D.4 CALCULATION METHODOLOGY FOR GREENHOUSE GAS EMISSIONS
Transcript of D4 GHG DAE 08-12-08 - Port of Los Angeles · San Pedro Waterfront Project EIS/EIR D4-1 D4...
D.4 CALCULATION METHODOLOGY FOR
GREENHOUSE GAS EMISSIONS


San Pedro Waterfront Project EIS/EIR D4-i
Contents
Section Page
D4 1 D4.1 Stationary Source Combustion ...................................................... 1
D4.1.1 Description ......................................................................... 1 D4.1.2 Equations ........................................................................... 1 D4.1.3 Data Requirements—Cargo Handling and Construction Equipment ...................................................................... 2 D4.1.4 Emission Factors ................................................................ 3
D4.2 Mobile Source Combustion ............................................................ 3 D4.2.1 Description ......................................................................... 3 D4.2.2 Equations ........................................................................... 4 D4.2.3 Data Requirements—Trucks and Worker Commute Vehicles ............................................................................... 4 D4.2.4 Data Requirements—Ships and Tugboats ......................... 5 D4.2.5 Emission Factors ................................................................ 5
D4.3 Electricity Usage ............................................................................ 5 D4.3.1 Description ......................................................................... 5 D4.3.2 Equations ........................................................................... 6 D4.3.3 Mass Emissions Estimates ................................................ 6 D4.3.4 Data Requirements—Electricity Usage .............................. 6 D4.3.5 Emission Factors ................................................................ 6 Attachment 1 Global Warming Potentials ............................................ 7 Attachment 2 Emission Factors ........................................................... 8 Attachment 3 GHG Descriptions ........................................................ 13 Attachment 4GHG Emission Calculations ......................................... 15


San Pedro Waterfront Project EIS/EIR D4-1
D4 Calculation Methodology for GHG
D2.1 Stationary Source Combustion
D2.1.1 Description Stationary combustion includes the following sources operated at the project location.
Category Assumptions:
Cargo handling equipment (CHE) and construction equipment within terminal boundaries.1
The fuel used for this equipment will be diesel liquefied propane gas (LPG), or liquefied natural gas (LNG).
Diesel and LPG emission factors for CO2 were provided directly by the OFFROAD2007 emission factor program in units of grams per horsepower-hour (g/hp-hr). Diesel and LPG CH4 emission factors were derived from the total organic gas (TOG) OFFROAD2007 emission rates per CARB's staff direction. Emission factors from the California Climate Action Registry’s General Reporting Protocol (GRP) were used for N2O and LNG CO2. Originally in units of kilograms GHG per gallon fuel (kg/gal), the N2O and CO2 emission factors were converted to units of g/hp-hr to simplify the emission calculations. This conversion used default values of brake-specific fuel consumption (BSFC) by equipment horsepower category, from OFFROAD2007, and a fuel density value from the GRP. The emission factor conversion from kg/gal to g/hp-hr is shown in Table XX-7.
D2.1.2 Equations
D2.1.2.1 Mass Emissions Estimates
General Equation:
Total Emissions = Emission Factor (g GHG/hp-hr)
1 Although most CHE sources are mobile, they are classified as stationary for the purposes of GHG reporting because they remain onsite.

San Pedro Waterfront Project EIS/EIR D4-2
× Work Produced (hp-hr) × 0.000001 (metric tons per gram)
Example:
Given: Equipment power output of 140,000 hp-hr per year Total Emissions CO2 = 568.3 (g CO2 /hp-hr) [from Table XX-7] × 140,000 (hp-hr/year) × 0.000001 (metric tons per gram) Total Emissions CO2 = 79.6 metric tons
D2.1.2.2 Converting Mass Estimates to Carbon Dioxide Equivalent (CO2e)
General Equation:
Metric Tons of CO2e = Metric Tons of GHG × GWP Global warming potentials (GWPs) are listed in Table XX-1.
Example:
Given: GHG Emission Rate = 0.014 metric tons of CH4; GWP = 21 (from Table XX-1) Metric Tons of CO2e = Metric Tons of GHG × GWP Metric Tons of CO2e = 0.014 Metric Tons of Methane × 21 Metric Tons of CO2e = 0.29
D2.1.3 Data Requirements—Cargo Handling and Construction Equipment Fuel Usage:
Propane _________ gallons2 Diesel _________ gallons
OR
Propane _________ hp-hr Diesel _________ hp-hr
2 Often, offroad equipment usage is provided in hp-hr rather than gallons of fuel consumed.In this case, the gallons of fuel consumed must be derived from the hp-hr by using a brake-specific fuel consumption (BSFC) value (in lb fuel per bhp-hr), which depends on the type of equipment.Offroad 2007 provides typical BSFC values by equipment horsepower category.
San Pedro Waterfront Project EIS/EIR D4-3
D2.1.4 Emission Factors OFFROAD2007 for Diesel and LPG CO2 emission factors (g/hp-hr)
Table XX-2 for original CH4 and N2O and LNG CO2 emission factors (kg/gal)
Table XX-7 for converted CH4 and N2O and LNG CO2 emission factors (g/hp-hr)
D2.2 Mobile Source Combustion
D2.2.1 Description This source category includes mobile sources that travel both on- and off-site.
Category Assumptions:
Primarily consists of trucks, worker commute vehicles, ships, and tugboats.
The fuel used will be diesel/distillate/residual fuel, gasoline, or liquefied natural gas (LNG).
For diesel trucks, CO2 emission factors in units of grams per mile (g/mi) were obtained directly from the EMFAC2007 emission factor program. Emission factors from the GRP (g/mi) were used for CH4 and N2O. For LNG trucks, emission factors from the GRP (kg/gal) were used for CO2 and (g/mi) for N2O and CH4. GRP CO2 emission factor, originally in units of kg/gal, were converted to units of g/hp-hr to simplify the emission calculations. This conversion used a manufacturer-provided BSFC value and a fuel density value from the GRP.
For worker commute vehicles, CO2 emissions were obtained from URBEMIS. Details and assumptions regarding the URBEMIS parameters are discussed in Section 3.2.4.4. The CO2 emission factor, originally in units of kg/gal, was converted to units of g/mi by using average fuel economy data by model year category from the U.S. Department of Transportation, Summary of Fuel Economy Performance (October 2006).The total miles traveled were calculated using the CO2 emission factor in terms of g/mi and the CO2 yearly emissions from URBEMIS. The CH4 and N2O emission factors were obtained from the GRP in units of g/mi. The vehicle years with the most conservative CH4 and N2O emission factors were used.
For main and auxiliary engines on ships and tugboats, CO2 emission factors in units of grams per kilowatt-hour (g/kWh) were obtained directly from Entec (2002) Tables 2.8, 2.9, and 2.10. Emission factors from the GRP (kg/gal) were used for CH4 and N2O. These emission factors were converted to units of g/kWh to simplify the emission calculations. This conversion used specific fuel consumption (SFC) values provided by Entec (2002) and fuel density values from the GRP. Emissions from ship boilers were calculated using emission factors from the GRP.
San Pedro Waterfront Project EIS/EIR D4-4
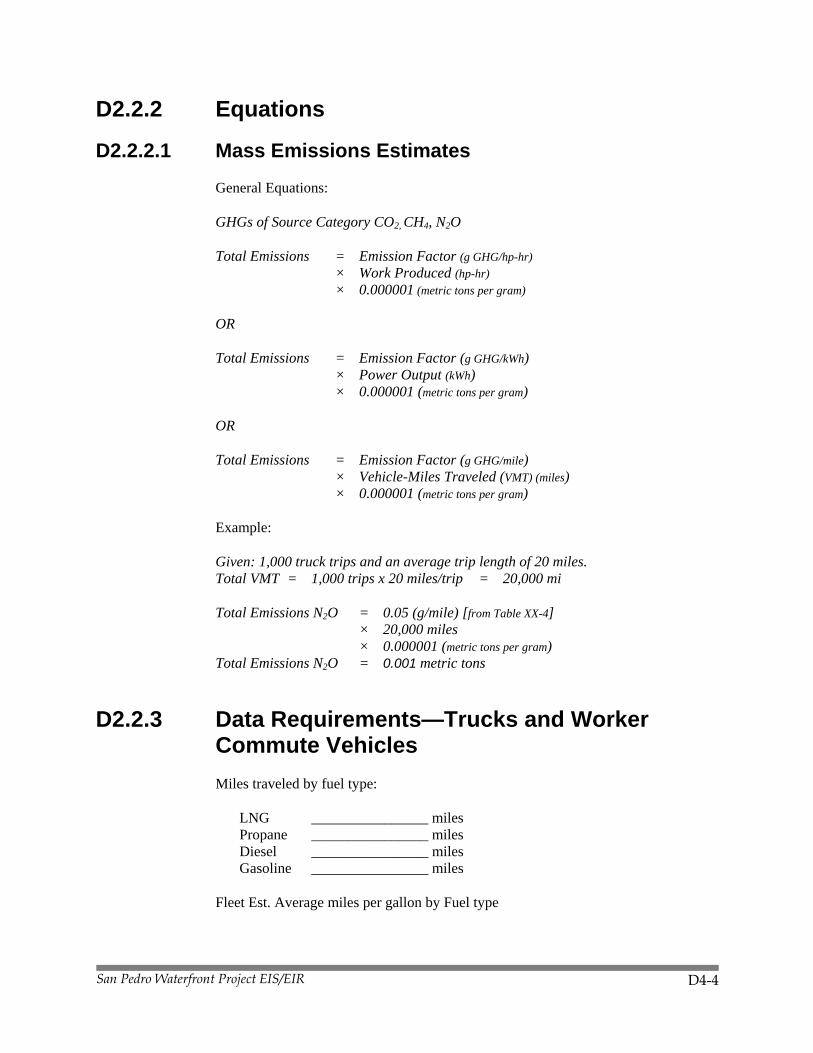
D2.2.2 Equations
D2.2.2.1 Mass Emissions Estimates
General Equations:
GHGs of Source Category CO2, CH4, N2O
Total Emissions = Emission Factor (g GHG/hp-hr) × Work Produced (hp-hr) × 0.000001 (metric tons per gram)
OR
Total Emissions = Emission Factor (g GHG/kWh) × Power Output (kWh) × 0.000001 (metric tons per gram)
OR
Total Emissions = Emission Factor (g GHG/mile) × Vehicle-Miles Traveled (VMT) (miles) × 0.000001 (metric tons per gram)
Example:
Given: 1,000 truck trips and an average trip length of 20 miles. Total VMT = 1,000 trips x 20 miles/trip = 20,000 mi
Total Emissions N2O = 0.05 (g/mile) [from Table XX-4] × 20,000 miles × 0.000001 (metric tons per gram) Total Emissions N2O = 0.001 metric tons
D2.2.3 Data Requirements—Trucks and Worker Commute Vehicles Miles traveled by fuel type:
LNG ________________ miles Propane ________________ miles Diesel ________________ miles Gasoline ________________ miles
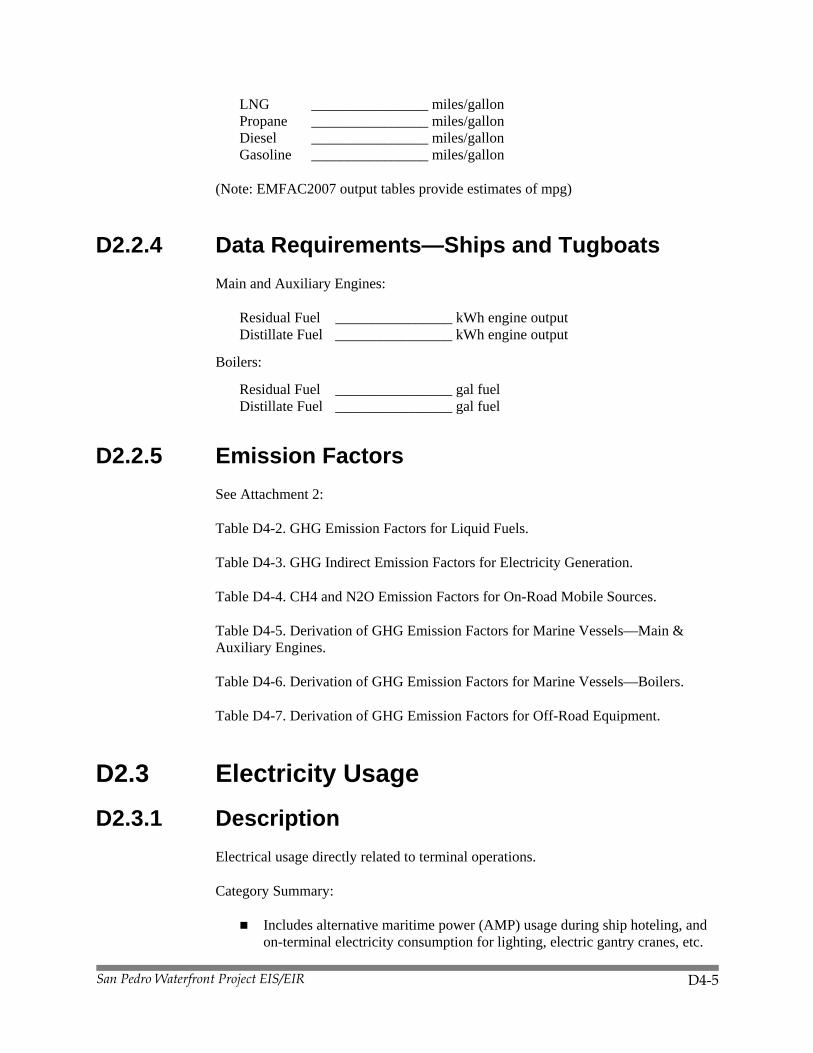
Fleet Est. Average miles per gallon by Fuel type
San Pedro Waterfront Project EIS/EIR D4-5
LNG ________________ miles/gallon Propane ________________ miles/gallon Diesel ________________ miles/gallon Gasoline ________________ miles/gallon
(Note: EMFAC2007 output tables provide estimates of mpg)
D2.2.4 Data Requirements—Ships and Tugboats Main and Auxiliary Engines:
Residual Fuel ________________ kWh engine output Distillate Fuel ________________ kWh engine output
Boilers:
Residual Fuel ________________ gal fuel Distillate Fuel ________________ gal fuel
D2.2.5 Emission Factors See Attachment 2:
Table D4-2. GHG Emission Factors for Liquid Fuels.
Table D4-3. GHG Indirect Emission Factors for Electricity Generation.
Table D4-4. CH4 and N2O Emission Factors for On-Road Mobile Sources.
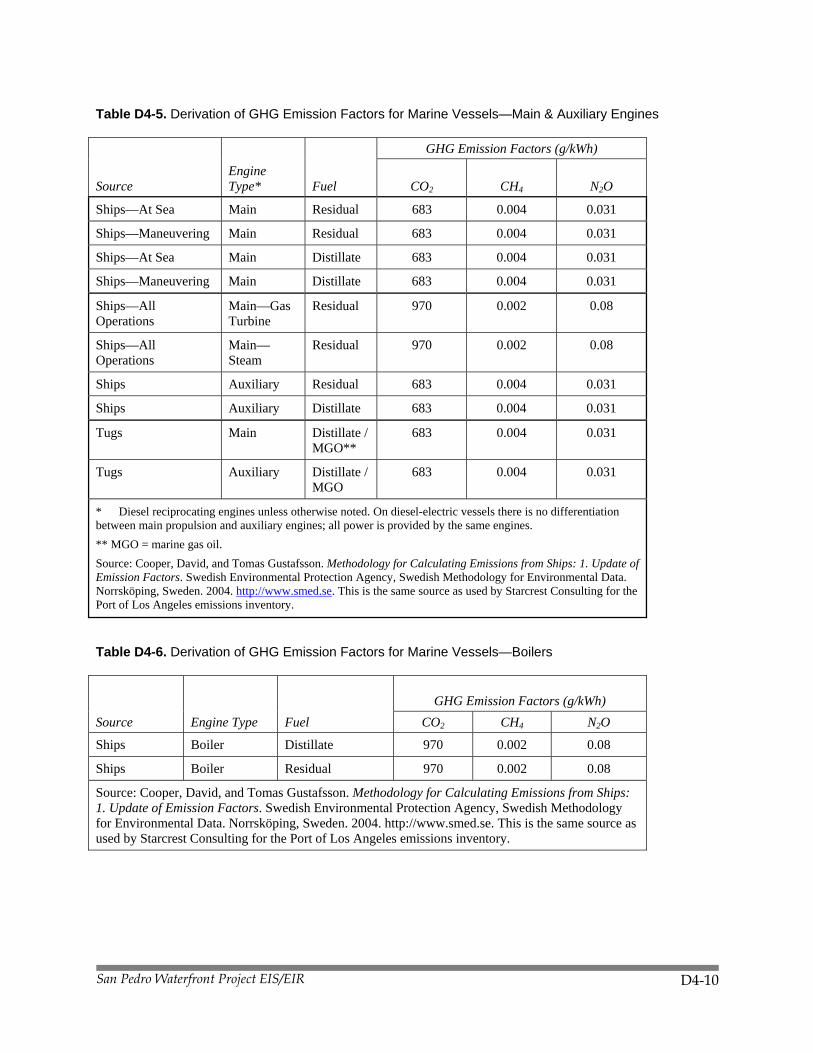
Table D4-5. Derivation of GHG Emission Factors for Marine Vessels—Main & Auxiliary Engines.
Table D4-6. Derivation of GHG Emission Factors for Marine Vessels—Boilers.
Table D4-7. Derivation of GHG Emission Factors for Off-Road Equipment.
D2.3 Electricity Usage
D2.3.1 Description Electrical usage directly related to terminal operations.
Category Summary:
Includes alternative maritime power (AMP) usage during ship hoteling, and on-terminal electricity consumption for lighting, electric gantry cranes, etc.

San Pedro Waterfront Project EIS/EIR D4-6
Assumes on-grid consumption
Emission factors for electricity usage were obtained from the GRP.
D2.3.2 Equations
D2.3.3 Mass Emissions Estimates General Equation:
GHGs of Source Category CO2, CH4, N2O
Total Emissions = Emission Factor (lbs GHG/Megawatt-hour [MWh]) × Electricity Used (kWh) × 0.001 MWh per kWh ÷ 2,204.62 lbs/metric ton
Example:
Given: Electricity Usage = 1,000,000 kWh
Total Emissions CO2 = 804.54 (lbs CO2 /MWh) [from Table XX-3] × 1,000,000 kWh × 0.001 MWh per kWh ÷ 2,204.62 lbs/metric ton Total Emissions CO2 = 364.9 metric tons
D2.3.4 Data Requirements—Electricity Usage Electricity Usage _____________ kilowatt- hours (kWh)
D2.3.5 Emission Factors Table D4-3 for emission factors
San Pedro Waterfront Project EIS/EIR D4-7
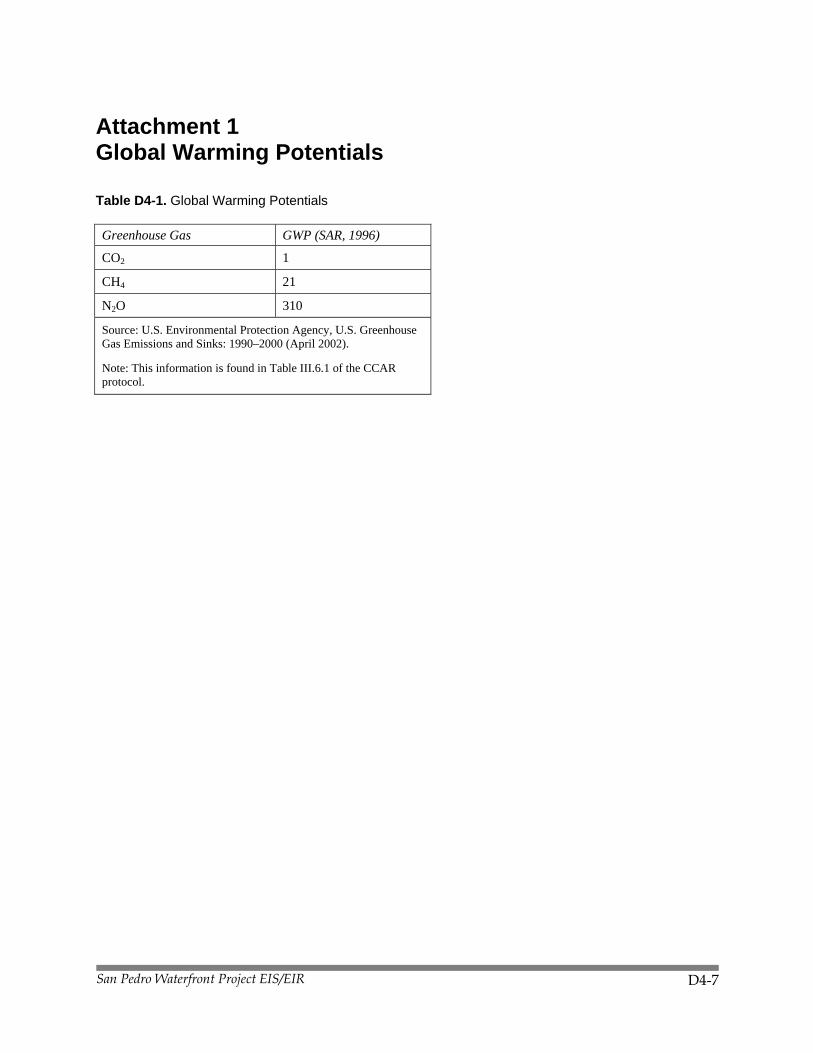
Attachment 1 Global Warming Potentials
Table D4-1. Global Warming Potentials
Greenhouse Gas GWP (SAR, 1996)
CO2 1
CH4 21
N2O 310
Source: U.S. Environmental Protection Agency, U.S. Greenhouse Gas Emissions and Sinks: 1990–2000 (April 2002).
Note: This information is found in Table III.6.1 of the CCAR protocol.
San Pedro Waterfront Project EIS/EIR D4-8
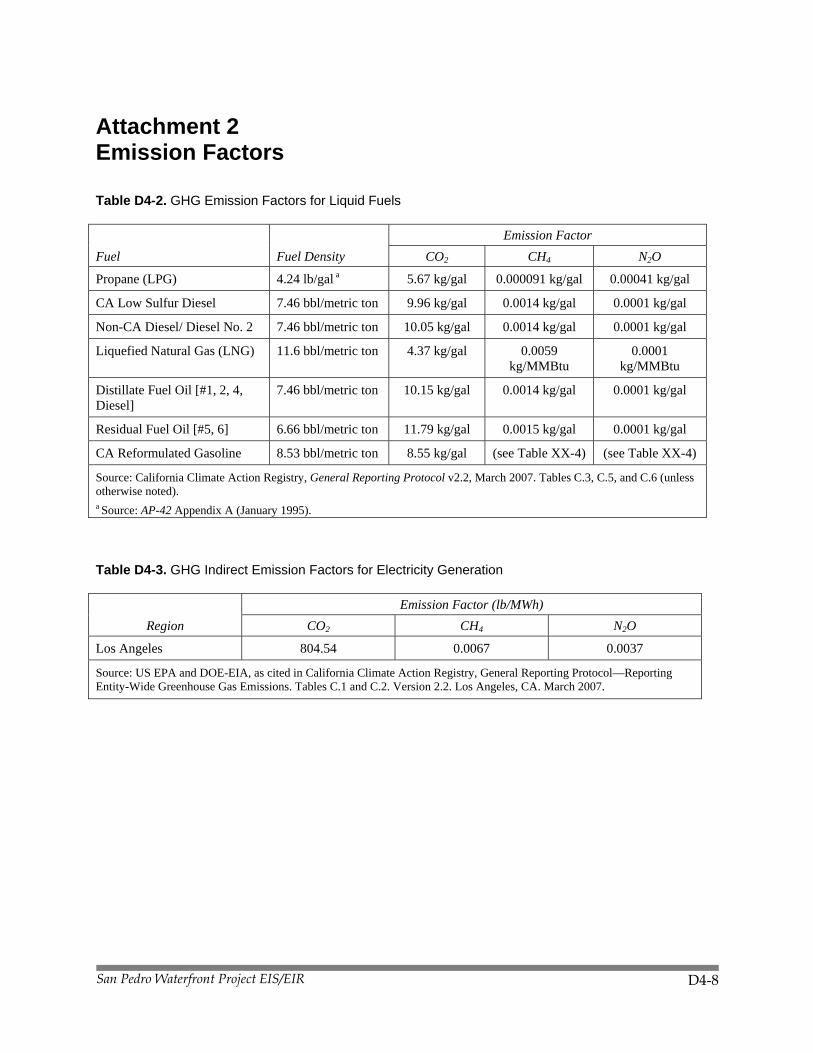
Attachment 2 Emission Factors
Table D4-2. GHG Emission Factors for Liquid Fuels
Fuel Fuel Density Emission Factor
CO2 CH4 N2O
Propane (LPG) 4.24 lb/gal a 5.67 kg/gal 0.000091 kg/gal 0.00041 kg/gal
CA Low Sulfur Diesel 7.46 bbl/metric ton 9.96 kg/gal 0.0014 kg/gal 0.0001 kg/gal
Non-CA Diesel/ Diesel No. 2 7.46 bbl/metric ton 10.05 kg/gal 0.0014 kg/gal 0.0001 kg/gal
Liquefied Natural Gas (LNG) 11.6 bbl/metric ton 4.37 kg/gal 0.0059 kg/MMBtu
0.0001 kg/MMBtu
Distillate Fuel Oil [#1, 2, 4, Diesel]
7.46 bbl/metric ton 10.15 kg/gal 0.0014 kg/gal 0.0001 kg/gal
Residual Fuel Oil [#5, 6] 6.66 bbl/metric ton 11.79 kg/gal 0.0015 kg/gal 0.0001 kg/gal
CA Reformulated Gasoline 8.53 bbl/metric ton 8.55 kg/gal (see Table XX-4) (see Table XX-4)
Source: California Climate Action Registry, General Reporting Protocol v2.2, March 2007. Tables C.3, C.5, and C.6 (unless otherwise noted). a Source: AP-42 Appendix A (January 1995).
Table D4-3. GHG Indirect Emission Factors for Electricity Generation
Region Emission Factor (lb/MWh)
CO2 CH4 N2O
Los Angeles 804.54 0.0067 0.0037
Source: US EPA and DOE-EIA, as cited in California Climate Action Registry, General Reporting Protocol—Reporting Entity-Wide Greenhouse Gas Emissions. Tables C.1 and C.2. Version 2.2. Los Angeles, CA. March 2007.

San Pedro Waterfront Project EIS/EIR D4-9
Table D4-4. CH4 and N2O Emission Factors for On-Road Mobile Sources
Vehicle Type/Model Years Emission Factor (g/mile)
CH4 N2O
Passenger Cars—Gasoline
Model Year 1966–1972 0.22 0.02
Model Year 1973–1974 0.19 0.02
Model Year 1975–1979 0.11 0.05
Model Year 1980–1983 0.07 0.08
Model Year 1984–1991 0.06 0.08
Model Year 1992 0.06 0.07
Model Year 1993 0.05 0.05
Model Year 1994–1999 0.05 0.04
Model Year 2000–present 0.04 0.04
Light Duty Trucks—Gasoline
Model Year 1966–1972 0.22 0.02
Model Year 1973–1974 0.23 0.02
Model Year 1975–1979 0.14 0.07
Model Year 1980–1983 0.12 0.13
Model Year 1984–1991 0.11 0.14
Model Year 1992 0.09 0.11
Model Year 1993 0.07 0.08
Model Year 1994–1999 0.06 0.06
Model Year 2000-present 0.05 0.06
Heavy Duty Trucks
Model Year 1966–1982 (Diesel) 0.10 0.05
Model Year 1983–1995 (Diesel) 0.08 0.05
Model Year 1996–present (Diesel) 0.06 0.05
CNG, LNG (all model years) 3.48 0.05
Source: California Climate Action Registry, General Reporting Protocol v2.2, March 2007. Table C.4.
San Pedro Waterfront Project EIS/EIR D4-10
Table D4-5. Derivation of GHG Emission Factors for Marine Vessels—Main & Auxiliary Engines
Source Engine Type* Fuel
GHG Emission Factors (g/kWh)
CO2 CH4 N2O
Ships—At Sea Main Residual 683 0.004 0.031
Ships—Maneuvering Main Residual 683 0.004 0.031
Ships—At Sea Main Distillate 683 0.004 0.031
Ships—Maneuvering Main Distillate 683 0.004 0.031
Ships—All Operations
Main—Gas Turbine
Residual 970 0.002 0.08
Ships—All Operations
Main—Steam
Residual 970 0.002 0.08
Ships Auxiliary Residual 683 0.004 0.031
Ships Auxiliary Distillate 683 0.004 0.031
Tugs Main Distillate / MGO**
683 0.004 0.031
Tugs Auxiliary Distillate / MGO
683 0.004 0.031
* Diesel reciprocating engines unless otherwise noted. On diesel-electric vessels there is no differentiation between main propulsion and auxiliary engines; all power is provided by the same engines. ** MGO = marine gas oil. Source: Cooper, David, and Tomas Gustafsson. Methodology for Calculating Emissions from Ships: 1. Update of Emission Factors. Swedish Environmental Protection Agency, Swedish Methodology for Environmental Data. Norrsköping, Sweden. 2004. http://www.smed.se. This is the same source as used by Starcrest Consulting for the Port of Los Angeles emissions inventory.
Table D4-6. Derivation of GHG Emission Factors for Marine Vessels—Boilers
Source Engine Type Fuel GHG Emission Factors (g/kWh)
CO2 CH4 N2O
Ships Boiler Distillate 970 0.002 0.08
Ships Boiler Residual 970 0.002 0.08
Source: Cooper, David, and Tomas Gustafsson. Methodology for Calculating Emissions from Ships: 1. Update of Emission Factors. Swedish Environmental Protection Agency, Swedish Methodology for Environmental Data. Norrsköping, Sweden. 2004. http://www.smed.se. This is the same source as used by Starcrest Consulting for the Port of Los Angeles emissions inventory.

San Pedro Waterfront Project EIS/EIR D4-11
Table D4-7. Derivation of GHG Emission Factors for Off-Road Equipment
Engine Size (hp)
BSFC (lb/hp-hr) a
Diesel Fuel Density (barrels/metric ton) b
LNG / LPG Fuel Density
(barrels/metric ton)
Converted Emission Factors (g/hp-hr)
Diesel N2O LNG CO2 LPG N2O
26–50 0.54 7.46 11.6 7.67E-03 521.49 0.01
51–120 0.49 7.46 11.6 6.96E-03 473.20 0.01
121–175 0.47 7.46 11.6 6.68E-03 453.89 0.01
176–250 0.47 7.46 11.6 6.68E-03 453.89 0.01 a Source: Off-road 2007 data file "Equip.csv". b Source: CCAR General Reporting Protocol v. 2.2.


San Pedro Waterfront Project EIS/EIR D4-13
Attachment 3 GHG Descriptions
Water vapor is the most abundant, important, and variable greenhouse gas in the atmosphere. It is not considered a pollutant; in the atmosphere it maintains a climate necessary for life. The main source of water vapor is evaporation from the oceans (approximately 85%). Other sources include evaporation from other water bodies, sublimation (change from solid to gas) from ice and snow, and transpiration from plant leaves. Water vapor is not one of the six GHGs identified by the World Resources Institute (WRI) as a man-made contributor to global climate change.
Carbon dioxide (CO2) is an odorless, colorless natural greenhouse gas. Natural sources include the following: decomposition of dead organic matter; respiration of bacteria, plants, animals, and fungus; evaporation from oceans; and volcanic outgassing. Anthropogenic (human caused) sources of carbon dioxide are from burning coal, oil, natural gas, and wood. Concentrations are currently around 370 ppm; some say that concentrations may increase to 540 ppm by 2100 as a direct result of anthropogenic sources (IPCC 2001). Some predict that this will result in an average global temperature rise of at least 2° Celsius (IPPCC 2001).
Methane (CH4) is a flammable gas and is the main component of natural gas. When one molecule of methane is burned in the presence of oxygen, one molecule of carbon dioxide and two molecules of water are released. There are no health effects from methane. A natural source of methane is from the anaerobic decay of organic matter. Geological deposits known as natural gas fields contain methane, which is extracted for fuel. Other sources are from landfills, fermentation of manure, and cattle.
Nitrous oxide (N2O), also known as laughing gas, is a colorless greenhouse gas. Higher concentrations can cause dizziness, euphoria, and sometimes slight hallucinations. Nitrous oxide is produced by microbial processes in soil and water, including those reactions which occur in fertilizer containing nitrogen. In addition to agricultural sources, some industrial processes (fossil fuel-fired power plants, nylon production, nitric acid production, and vehicle emissions) also contribute to its atmospheric load. It is used in rocket engines, as an aerosol spray propellant, and in race cars.
Ozone is a greenhouse gas; however, unlike the other greenhouse gases, ozone in the troposphere is relatively short-lived and therefore is not global in nature. According to CARB, it is difficult to make an accurate determination of the contribution of ozone precursors (NOx and VOCs) to global warming (CARB 2004b). Ozone is not one of the six GHGs identified by the World Resources Institute (WRI) as a man-made contributor to global climate change.
Aerosols are particles emitted into the air through burning biomass (plant material) and fossil fuels. Aerosols can warm the atmosphere by absorbing and emitting heat and can cool the atmosphere by reflecting light. Cloud formation can also be affected by aerosols. Sulfate aerosols are emitted when fuel with sulfur in it is burned. Black
San Pedro Waterfront Project EIS/EIR D4-14
carbon (or soot) is emitted during bio mass burning incomplete combustion of fossil fuels. Particulate matter regulation has been lowering aerosol concentrations in the United States; however, global concentrations are likely increasing. Aerosols are not one of the six GHGs identified by the World Resources Institute (WRI) as a man-made contributor to global climate change.
Source: AEP, 2007.

San Pedro Waterfront Project EIS/EIR D4-15
Attachment 4 GHG Emission Calculations

San Pedro Waterfront Project EIS/EIR D4-16
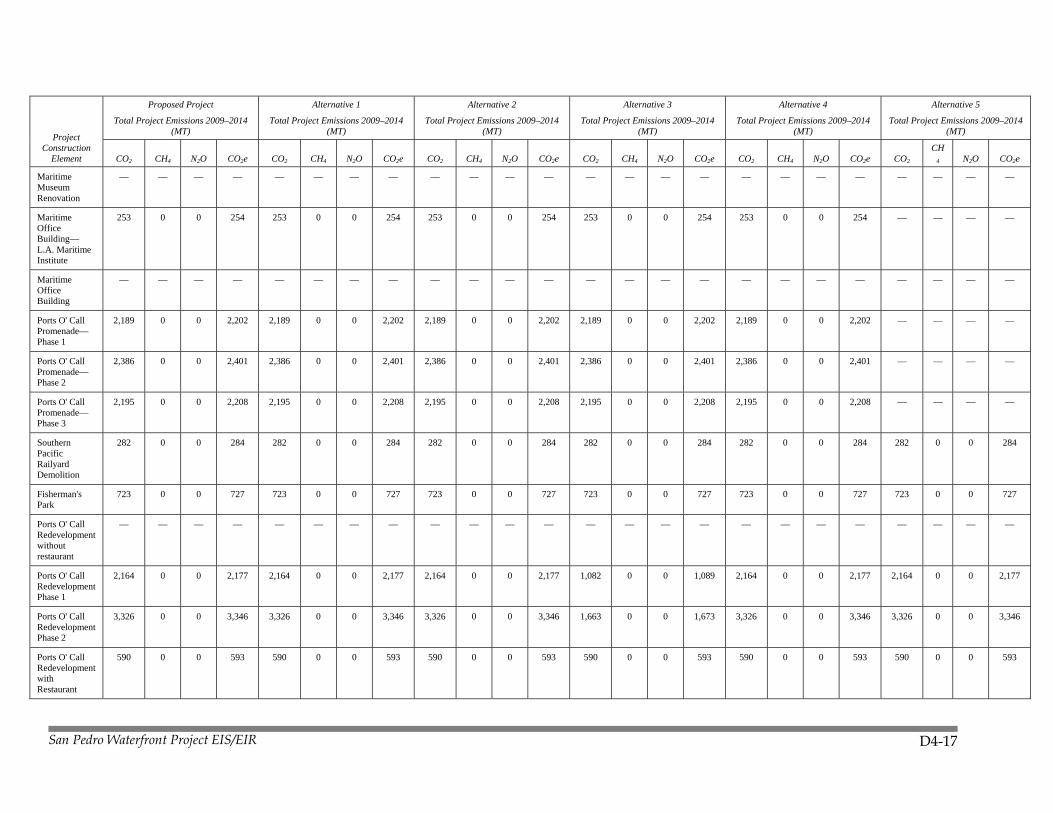
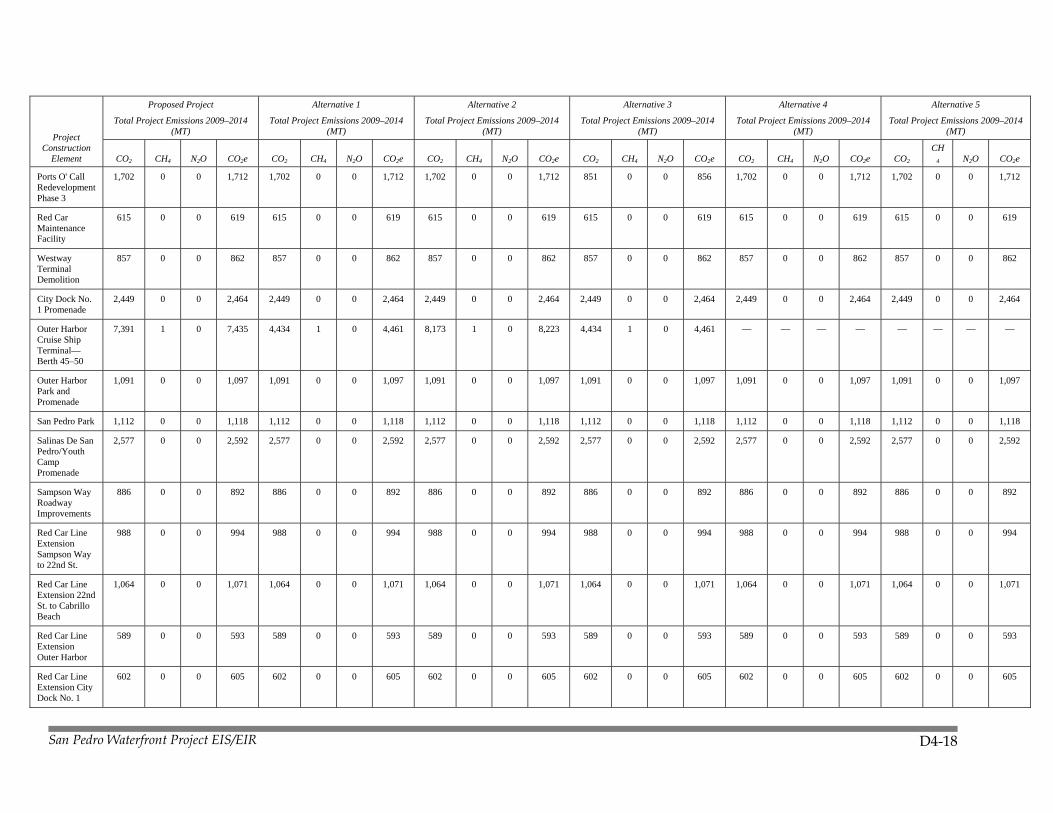
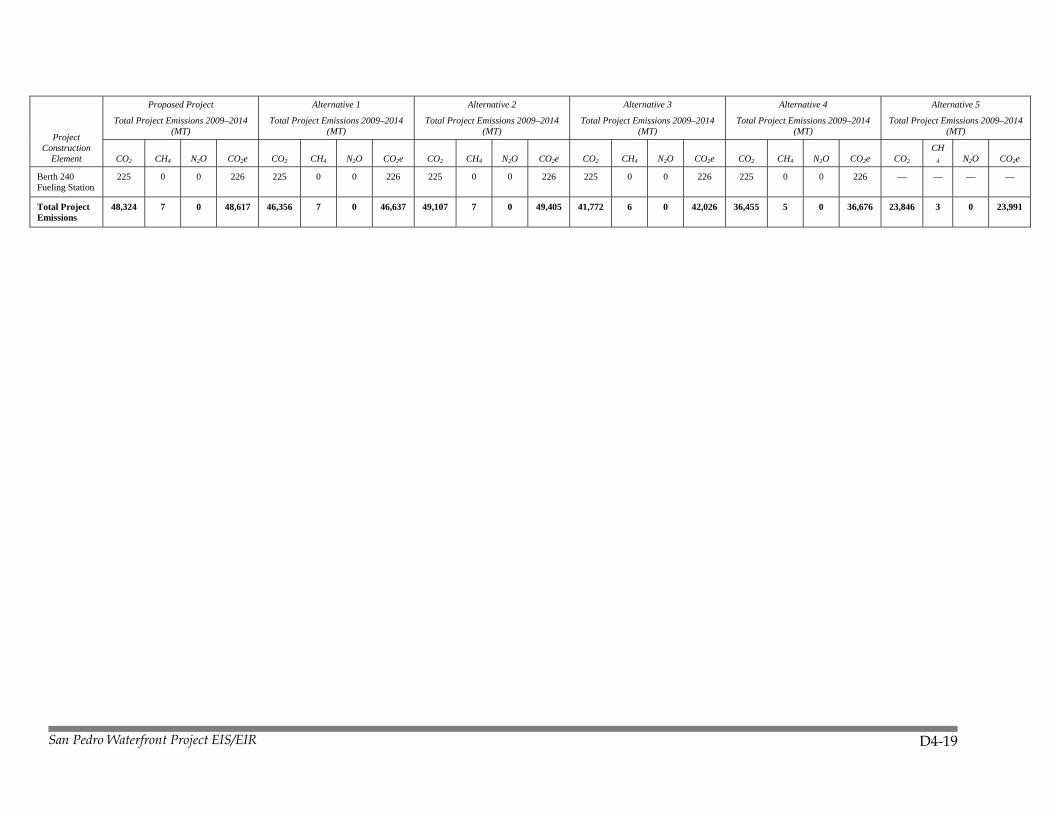
Table D4-8. Construction GHG Emissions by Project Element and Project Alternative
Project Construction
Element
Proposed Project
Total Project Emissions 2009–2014 (MT)
Alternative 1
Total Project Emissions 2009–2014 (MT)
Alternative 2
Total Project Emissions 2009–2014 (MT)
Alternative 3
Total Project Emissions 2009–2014 (MT)
Alternative 4
Total Project Emissions 2009–2014 (MT)
Alternative 5
Total Project Emissions 2009–2014 (MT)
CO2 CH4 N2O CO2e CO2 CH4 N2O CO2e CO2 CH4 N2O CO2e CO2 CH4 N2O CO2e CO2 CH4 N2O CO2e CO2 CH
4 N2O CO2e
Catalina Express Terminal
388 0 0 390 388 0 0 390 388 0 0 390 388 0 0 390 388 0 0 390 — — — —
Cruise Ship Terminal Berth 91–93
— — — — 988 0 0 994 — — — — — — — — 988 0 0 994 988 0 0 994
Cruise Ship Parking Facilities
1,565 0 0 1,575 1,565 0 0 1,575 1,565 0 0 1,575 1,565 0 0 1,575 783 0 0 787 783 0 0 787
North Harbor 4,214 1 0 4,239 4,214 1 0 4,239 4,214 1 0 4,239 4,214 1 0 4,239 — — — — — — — —
Maritime Office Building—Crowley
235 0 0 236 235 0 0 236 235 0 0 236 235 0 0 236 — — — — — — — —
Maritime Office Building—Millennium
235 0 0 236 235 0 0 236 235 0 0 236 235 0 0 236 — — — — — — — —
Maritime Office Building—Lane Victory
235 0 0 236 235 0 0 236 235 0 0 236 235 0 0 236 235 0 0 236 — — — —
Downtown Harbor
1,887 0 0 1,898 1,887 0 0 1,898 1,887 0 0 1,898 1,887 0 0 1,898 1,887 0 0 1,898 — — — —
7th Street Harbor
1,320 0 0 1,328 1,320 0 0 1,328 1,320 0 0 1,328 1,320 0 0 1,328 1,320 0 0 1,328 — — — —
7th Street Pier 1,160 0 0 1,167 1,160 0 0 1,167 1,160 0 0 1,167 1,160 0 0 1,167 1,160 0 0 1,167 — — — —
Downtown Square
168 0 0 169 168 0 0 169 168 0 0 169 168 0 0 169 168 0 0 169 168 0 0 169
Downtown Water Feature
118 0 0 119 118 0 0 119 118 0 0 119 118 0 0 119 118 0 0 119 118 0 0 119
John S. Gibson Park
174 0 0 175 174 0 0 175 174 0 0 175 174 0 0 175 174 0 0 175 174 0 0 175
Ralph J. Scott Fireboat Museum
372 0 0 374 372 0 0 374 372 0 0 374 372 0 0 374 372 0 0 374 — — — —
San Pedro Waterfront Project EIS/EIR D4-17
Project Construction
Element
Proposed Project
Total Project Emissions 2009–2014 (MT)
Alternative 1
Total Project Emissions 2009–2014 (MT)
Alternative 2
Total Project Emissions 2009–2014 (MT)
Alternative 3
Total Project Emissions 2009–2014 (MT)
Alternative 4
Total Project Emissions 2009–2014 (MT)
Alternative 5
Total Project Emissions 2009–2014 (MT)
CO2 CH4 N2O CO2e CO2 CH4 N2O CO2e CO2 CH4 N2O CO2e CO2 CH4 N2O CO2e CO2 CH4 N2O CO2e CO2 CH
4 N2O CO2e
Maritime Museum Renovation
— — — — — — — — — — — — — — — — — — — — — — — —
Maritime Office Building—L.A. Maritime Institute
253 0 0 254 253 0 0 254 253 0 0 254 253 0 0 254 253 0 0 254 — — — —
Maritime Office Building
— — — — — — — — — — — — — — — — — — — — — — — —
Ports O' Call Promenade—Phase 1
2,189 0 0 2,202 2,189 0 0 2,202 2,189 0 0 2,202 2,189 0 0 2,202 2,189 0 0 2,202 — — — —
Ports O' Call Promenade—Phase 2
2,386 0 0 2,401 2,386 0 0 2,401 2,386 0 0 2,401 2,386 0 0 2,401 2,386 0 0 2,401 — — — —
Ports O' Call Promenade—Phase 3
2,195 0 0 2,208 2,195 0 0 2,208 2,195 0 0 2,208 2,195 0 0 2,208 2,195 0 0 2,208 — — — —
Southern Pacific Railyard Demolition
282 0 0 284 282 0 0 284 282 0 0 284 282 0 0 284 282 0 0 284 282 0 0 284
Fisherman's Park
723 0 0 727 723 0 0 727 723 0 0 727 723 0 0 727 723 0 0 727 723 0 0 727
Ports O' Call Redevelopment without restaurant
— — — — — — — — — — — — — — — — — — — — — — — —
Ports O' Call Redevelopment Phase 1
2,164 0 0 2,177 2,164 0 0 2,177 2,164 0 0 2,177 1,082 0 0 1,089 2,164 0 0 2,177 2,164 0 0 2,177
Ports O' Call Redevelopment Phase 2
3,326 0 0 3,346 3,326 0 0 3,346 3,326 0 0 3,346 1,663 0 0 1,673 3,326 0 0 3,346 3,326 0 0 3,346
Ports O' Call Redevelopment with Restaurant
590 0 0 593 590 0 0 593 590 0 0 593 590 0 0 593 590 0 0 593 590 0 0 593
San Pedro Waterfront Project EIS/EIR D4-18
Project Construction
Element
Proposed Project
Total Project Emissions 2009–2014 (MT)
Alternative 1
Total Project Emissions 2009–2014 (MT)
Alternative 2
Total Project Emissions 2009–2014 (MT)
Alternative 3
Total Project Emissions 2009–2014 (MT)
Alternative 4
Total Project Emissions 2009–2014 (MT)
Alternative 5
Total Project Emissions 2009–2014 (MT)
CO2 CH4 N2O CO2e CO2 CH4 N2O CO2e CO2 CH4 N2O CO2e CO2 CH4 N2O CO2e CO2 CH4 N2O CO2e CO2 CH
4 N2O CO2e
Ports O' Call Redevelopment Phase 3
1,702 0 0 1,712 1,702 0 0 1,712 1,702 0 0 1,712 851 0 0 856 1,702 0 0 1,712 1,702 0 0 1,712
Red Car Maintenance Facility
615 0 0 619 615 0 0 619 615 0 0 619 615 0 0 619 615 0 0 619 615 0 0 619
Westway Terminal Demolition
857 0 0 862 857 0 0 862 857 0 0 862 857 0 0 862 857 0 0 862 857 0 0 862
City Dock No. 1 Promenade
2,449 0 0 2,464 2,449 0 0 2,464 2,449 0 0 2,464 2,449 0 0 2,464 2,449 0 0 2,464 2,449 0 0 2,464
Outer Harbor Cruise Ship Terminal—Berth 45–50
7,391 1 0 7,435 4,434 1 0 4,461 8,173 1 0 8,223 4,434 1 0 4,461 — — — — — — — —
Outer Harbor Park and Promenade
1,091 0 0 1,097 1,091 0 0 1,097 1,091 0 0 1,097 1,091 0 0 1,097 1,091 0 0 1,097 1,091 0 0 1,097
San Pedro Park 1,112 0 0 1,118 1,112 0 0 1,118 1,112 0 0 1,118 1,112 0 0 1,118 1,112 0 0 1,118 1,112 0 0 1,118
Salinas De San Pedro/Youth Camp Promenade
2,577 0 0 2,592 2,577 0 0 2,592 2,577 0 0 2,592 2,577 0 0 2,592 2,577 0 0 2,592 2,577 0 0 2,592
Sampson Way Roadway Improvements
886 0 0 892 886 0 0 892 886 0 0 892 886 0 0 892 886 0 0 892 886 0 0 892
Red Car Line Extension Sampson Way to 22nd St.
988 0 0 994 988 0 0 994 988 0 0 994 988 0 0 994 988 0 0 994 988 0 0 994
Red Car Line Extension 22nd St. to Cabrillo Beach
1,064 0 0 1,071 1,064 0 0 1,071 1,064 0 0 1,071 1,064 0 0 1,071 1,064 0 0 1,071 1,064 0 0 1,071
Red Car Line Extension Outer Harbor
589 0 0 593 589 0 0 593 589 0 0 593 589 0 0 593 589 0 0 593 589 0 0 593
Red Car Line Extension City Dock No. 1
602 0 0 605 602 0 0 605 602 0 0 605 602 0 0 605 602 0 0 605 602 0 0 605
San Pedro Waterfront Project EIS/EIR D4-19
Project Construction
Element
Proposed Project
Total Project Emissions 2009–2014 (MT)
Alternative 1
Total Project Emissions 2009–2014 (MT)
Alternative 2
Total Project Emissions 2009–2014 (MT)
Alternative 3
Total Project Emissions 2009–2014 (MT)
Alternative 4
Total Project Emissions 2009–2014 (MT)
Alternative 5
Total Project Emissions 2009–2014 (MT)
CO2 CH4 N2O CO2e CO2 CH4 N2O CO2e CO2 CH4 N2O CO2e CO2 CH4 N2O CO2e CO2 CH4 N2O CO2e CO2 CH
4 N2O CO2e
Berth 240 Fueling Station
225 0 0 226 225 0 0 226 225 0 0 226 225 0 0 226 225 0 0 226 — — — —
Total Project Emissions
48,324 7 0 48,617 46,356 7 0 46,637 49,107 7 0 49,405 41,772 6 0 42,026 36,455 5 0 36,676 23,846 3 0 23,991
San Pedro Waterfront Project EIS/EIR D4-20
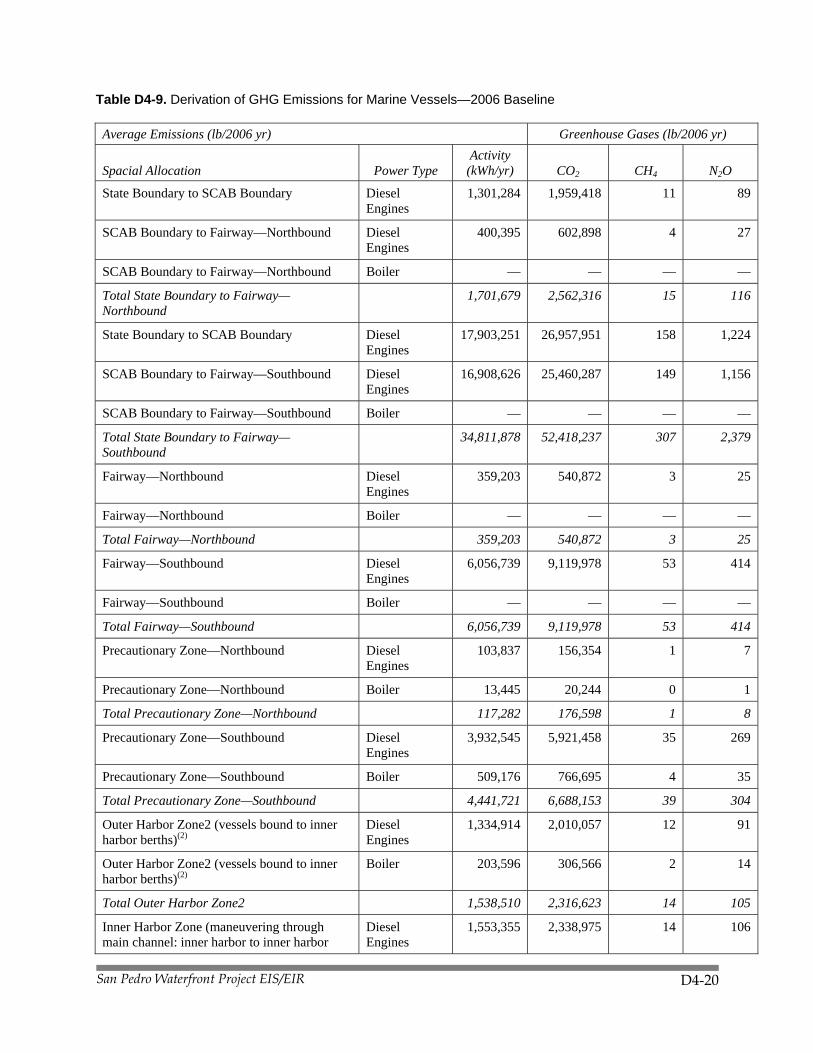
Table D4-9. Derivation of GHG Emissions for Marine Vessels—2006 Baseline
Average Emissions (lb/2006 yr) Greenhouse Gases (lb/2006 yr)
Spacial Allocation Power Type Activity
(kWh/yr) CO2 CH4 N2O
State Boundary to SCAB Boundary Diesel Engines
1,301,284 1,959,418 11 89
SCAB Boundary to Fairway—Northbound Diesel Engines
400,395 602,898 4 27
SCAB Boundary to Fairway—Northbound Boiler — — — —
Total State Boundary to Fairway—Northbound
1,701,679 2,562,316 15 116
State Boundary to SCAB Boundary Diesel Engines
17,903,251 26,957,951 158 1,224
SCAB Boundary to Fairway—Southbound Diesel Engines
16,908,626 25,460,287 149 1,156
SCAB Boundary to Fairway—Southbound Boiler — — — —
Total State Boundary to Fairway—Southbound
34,811,878 52,418,237 307 2,379
Fairway—Northbound Diesel Engines
359,203 540,872 3 25
Fairway—Northbound Boiler — — — —
Total Fairway—Northbound 359,203 540,872 3 25
Fairway—Southbound Diesel Engines
6,056,739 9,119,978 53 414
Fairway—Southbound Boiler — — — —
Total Fairway—Southbound 6,056,739 9,119,978 53 414
Precautionary Zone—Northbound Diesel Engines
103,837 156,354 1 7
Precautionary Zone—Northbound Boiler 13,445 20,244 0 1
Total Precautionary Zone—Northbound 117,282 176,598 1 8
Precautionary Zone—Southbound Diesel Engines
3,932,545 5,921,458 35 269
Precautionary Zone—Southbound Boiler 509,176 766,695 4 35
Total Precautionary Zone—Southbound 4,441,721 6,688,153 39 304
Outer Harbor Zone2 (vessels bound to inner harbor berths)(2)
Diesel Engines
1,334,914 2,010,057 12 91
Outer Harbor Zone2 (vessels bound to inner harbor berths)(2)
Boiler 203,596 306,566 2 14
Total Outer Harbor Zone2 1,538,510 2,316,623 14 105
Inner Harbor Zone (maneuvering through main channel: inner harbor to inner harbor
Diesel Engines
1,553,355 2,338,975 14 106

San Pedro Waterfront Project EIS/EIR D4-21
Average Emissions (lb/2006 yr) Greenhouse Gases (lb/2006 yr)
Spacial Allocation Power Type Activity
(kWh/yr) CO2 CH4 N2O berths):
Inner Harbor Zone (maneuvering through main channel: inner harbor to inner harbor berths):
Boiler 236,911 356,731 2 16
Total Inner Harbor Zone 1,790,266 2,695,706 16 122
Total Transit (Sea + Fairway + All Zones) All 50,817,277 76,518,483 448 3,473
Hoteling Diesel Engines
20,971,561 31,578,080 185 1,433
Hoteling Boiler 4,442,087 6,688,705 39 304
Total Hoteling 25,413,648 38,266,785 224 1,737
Annual Total (lb/yr) 76,230,925 114,785,268 672 5,210
Annual Total (ton/yr) 57,393 0.3 2.6
Sum of Baseline OGV + Berth 87 Total GHGs (lb/yr)
Total Transit (Sea + Fairway + All Zones) 77,148,836 452 3,502
Total Hoteling 38,495,753 225 1,750
Emissions = (Engine Power * Load Factor * Time * 2 (1-Way) Trips * Vessels per Year = Activity) * Emission Factor. Activity and emission factors obtained from linked file.
Table D4-10a. Baseline GHG Emissions—Berth 87 (Vessel Type 1: General Cargo)
Average Emissions (lb/2006 yr) Greenhouse Gases (lb/2006 yr)
Spacial Allocation Power Type Activity
(kWh/yr) CO2 CH4 N2O
State Boundary to SCAB Boundary Main Engine 43,378 65,316 0.4 3.0
State Boundary to SCAB Boundary Auxiliary Engine
2,660 4,005 0.0 0.2
State Boundary to SCAB Boundary Boiler — — — —
Sea/Fairway Main Engine 13,347 20,097 0.1 0.9
Sea/Fairway Auxiliary Engine
818 1,232 0.0 0.1
Sea/Fairway Boiler — — — —
Total Sea/Fairway 60,203 90,651 1 4
Fairway Main Engine 10,626 16,000 0.1 0.7
Fairway Auxiliary Engine
652 981 0.0 0.0
Fairway Boiler — — — —

San Pedro Waterfront Project EIS/EIR D4-22
Average Emissions (lb/2006 yr) Greenhouse Gases (lb/2006 yr)
Spacial Allocation Power Type Activity
(kWh/yr) CO2 CH4 N2O
Fairway 11,277 16,981 0 1
Precautionary Zone Main Engine 4,613 6,946 0.0 0.3
Precautionary Zone Auxiliary Engine
403 606 0.0 0.0
Precautionary Zone Boiler 141 302 0.0 0.0
Total Precautionary Zone 5,157 7,855 0 0
Harbor Zone (vessels bound to Berth 87)
Main Engine 110 166 0.0 0.0
Harbor Zone (vessels bound to Berth 87)
Auxiliary Engine
352 529 0.0 0.0
Harbor Zone (vessels bound to Berth 87)
Boiler 47 100 0.0 0.0
Harbor Zone (vessels bound to Berth 87)
508 795 0 0
Total Transit (Sea + Fairway + All Zones)
All 77,145 116,281 1 5
Hoteling Main Engine — — — —
Hoteling Auxiliary Engine
19,223 28,946 0.2 1.3
Hoteling Boiler 5,215 11,153 0.0 0.9
Total Hoteling 24,439 40,098 0 2
Annual Total (lb/yr) 101,584 156,379 0.9 7.5
Annual Total (ton/yr) 50.8 78.2 0.0004 0.0038
Emissions = Engine Power * Load Factor * Emission Factor * Time
VSRP (12 knots): 59% compliance to 20 nm
Average hourly emissions are based on residual fuel with 2.7% sulfur content.
Table D4-10b. Baseline GHG Emissions—Berth 87 (Vessel Type 2: Bulk Carrier)
Average Emissions (lb/2006 yr) Greenhouse Gases (lb/2006 yr)
Spacial Allocation Power Type Activity
(kWh/yr) CO2 CH4 N2O
State Boundary to SCAB Boundary Main Engine 184,768 278,215 1.6 12.6
State Boundary to SCAB Boundary Auxiliary Engine
17,896 26,948 0.2 1.2
State Boundary to SCAB Boundary Boiler — — — —
Sea/Fairway Main Engine 56,852 85,605 0.5 3.9
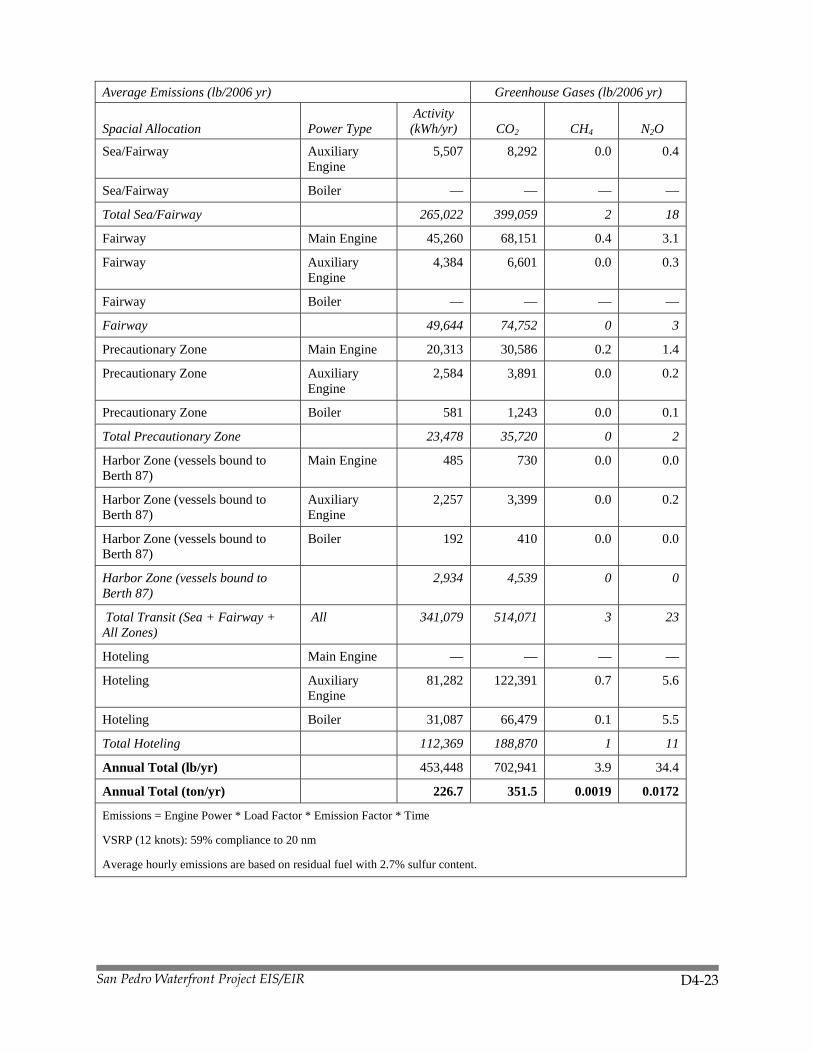
San Pedro Waterfront Project EIS/EIR D4-23
Average Emissions (lb/2006 yr) Greenhouse Gases (lb/2006 yr)
Spacial Allocation Power Type Activity
(kWh/yr) CO2 CH4 N2O
Sea/Fairway Auxiliary Engine
5,507 8,292 0.0 0.4
Sea/Fairway Boiler — — — —
Total Sea/Fairway 265,022 399,059 2 18
Fairway Main Engine 45,260 68,151 0.4 3.1
Fairway Auxiliary Engine
4,384 6,601 0.0 0.3
Fairway Boiler — — — —
Fairway 49,644 74,752 0 3
Precautionary Zone Main Engine 20,313 30,586 0.2 1.4
Precautionary Zone Auxiliary Engine
2,584 3,891 0.0 0.2
Precautionary Zone Boiler 581 1,243 0.0 0.1
Total Precautionary Zone 23,478 35,720 0 2
Harbor Zone (vessels bound to Berth 87)
Main Engine 485 730 0.0 0.0
Harbor Zone (vessels bound to Berth 87)
Auxiliary Engine
2,257 3,399 0.0 0.2
Harbor Zone (vessels bound to Berth 87)
Boiler 192 410 0.0 0.0
Harbor Zone (vessels bound to Berth 87)
2,934 4,539 0 0
Total Transit (Sea + Fairway + All Zones)
All 341,079 514,071 3 23
Hoteling Main Engine — — — —
Hoteling Auxiliary Engine
81,282 122,391 0.7 5.6
Hoteling Boiler 31,087 66,479 0.1 5.5
Total Hoteling 112,369 188,870 1 11
Annual Total (lb/yr) 453,448 702,941 3.9 34.4
Annual Total (ton/yr) 226.7 351.5 0.0019 0.0172
Emissions = Engine Power * Load Factor * Emission Factor * Time
VSRP (12 knots): 59% compliance to 20 nm
Average hourly emissions are based on residual fuel with 2.7% sulfur content.
San Pedro Waterfront Project EIS/EIR D4-24
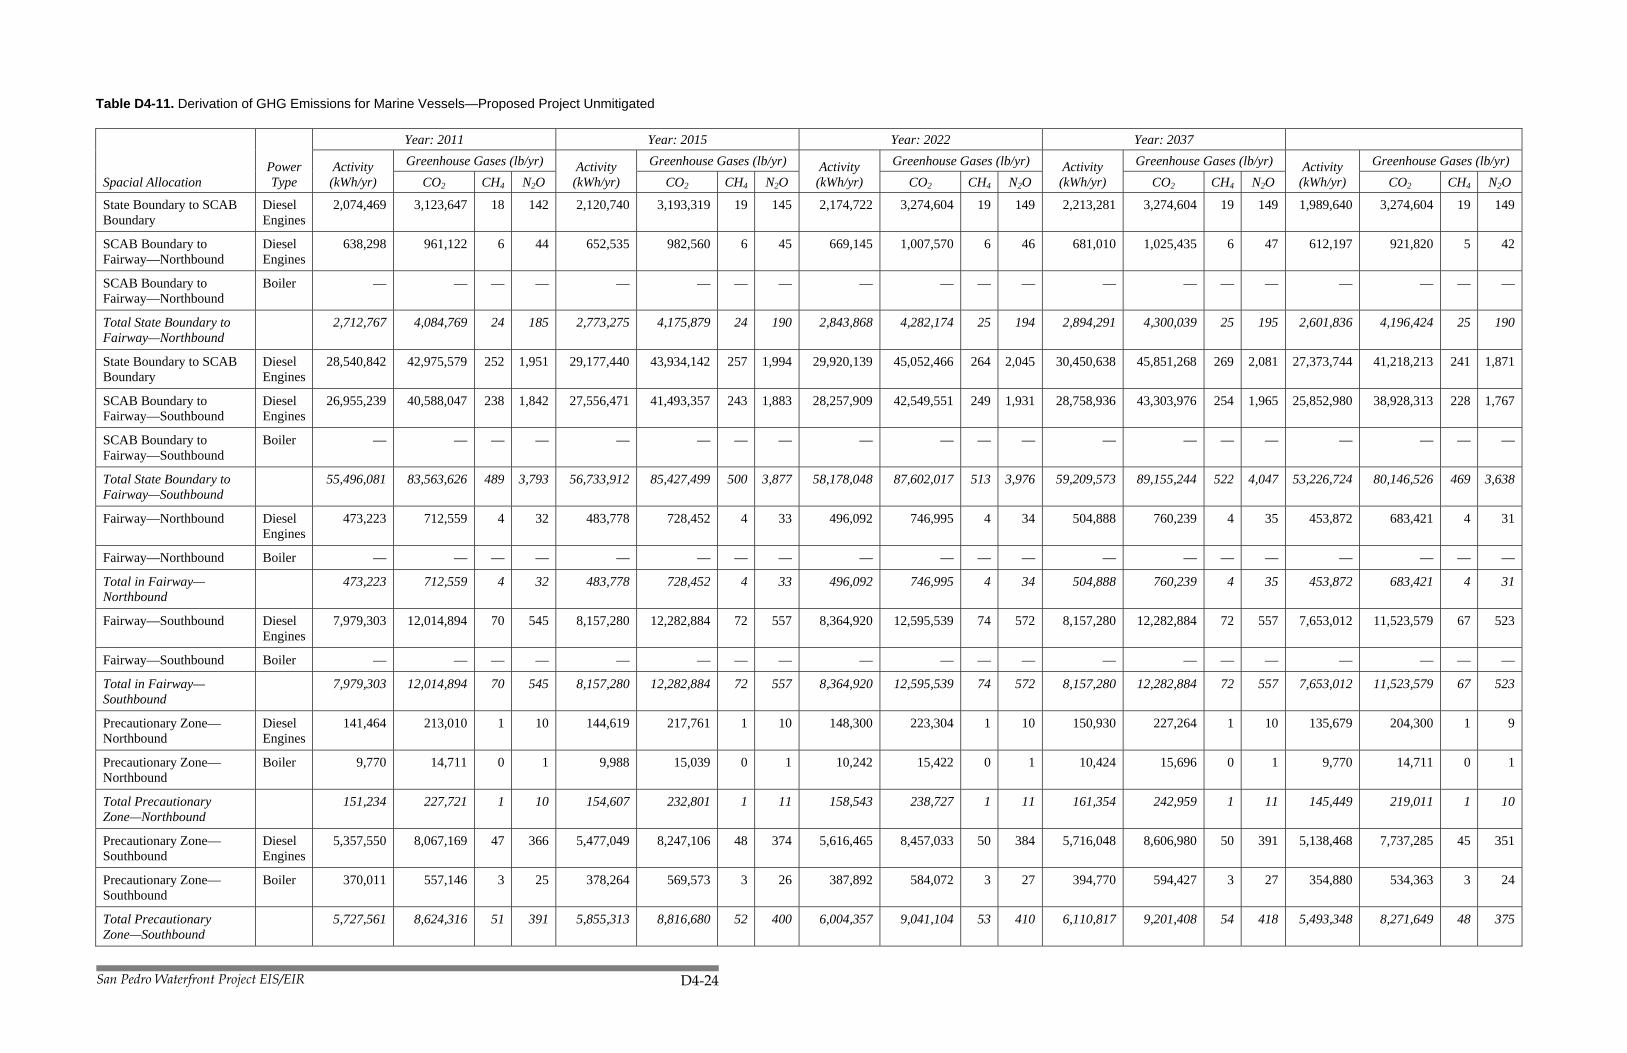
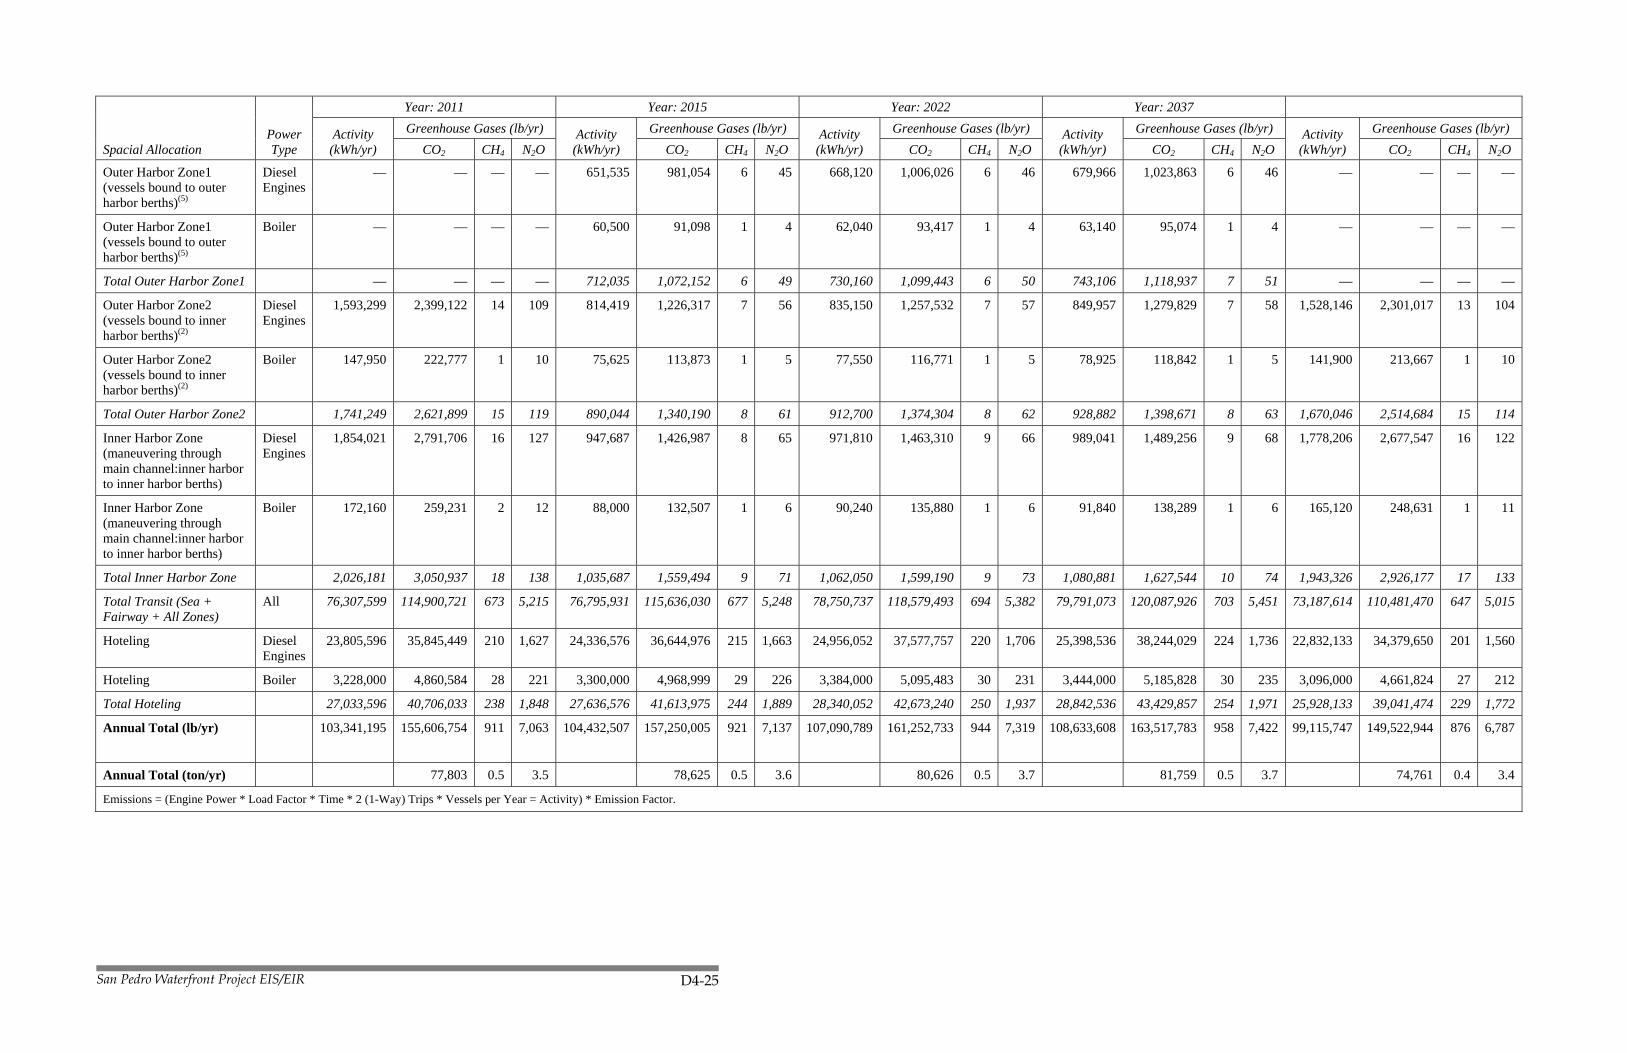
Table D4-11. Derivation of GHG Emissions for Marine Vessels—Proposed Project Unmitigated
Spacial Allocation Power Type
Year: 2011 Year: 2015 Year: 2022 Year: 2037
Activity (kWh/yr)
Greenhouse Gases (lb/yr) Activity (kWh/yr)
Greenhouse Gases (lb/yr) Activity (kWh/yr)
Greenhouse Gases (lb/yr) Activity (kWh/yr)
Greenhouse Gases (lb/yr) Activity (kWh/yr)
Greenhouse Gases (lb/yr) CO2
CH4 N2O CO2
CH4 N2O CO2
CH4 N2O CO2
CH4 N2O CO2
CH4 N2O
State Boundary to SCAB Boundary
Diesel Engines
2,074,469 3,123,647 18 142 2,120,740 3,193,319 19 145 2,174,722 3,274,604 19 149 2,213,281 3,274,604 19 149 1,989,640 3,274,604 19 149
SCAB Boundary to Fairway—Northbound
Diesel Engines
638,298 961,122 6 44 652,535 982,560 6 45 669,145 1,007,570 6 46 681,010 1,025,435 6 47 612,197 921,820 5 42
SCAB Boundary to Fairway—Northbound
Boiler — — — — — — — — — — — — — — — — — — — —
Total State Boundary to Fairway—Northbound
2,712,767 4,084,769 24 185 2,773,275 4,175,879 24 190 2,843,868 4,282,174 25 194 2,894,291 4,300,039 25 195 2,601,836 4,196,424 25 190
State Boundary to SCAB Boundary
Diesel Engines
28,540,842 42,975,579 252 1,951 29,177,440 43,934,142 257 1,994 29,920,139 45,052,466 264 2,045 30,450,638 45,851,268 269 2,081 27,373,744 41,218,213 241 1,871
SCAB Boundary to Fairway—Southbound
Diesel Engines
26,955,239 40,588,047 238 1,842 27,556,471 41,493,357 243 1,883 28,257,909 42,549,551 249 1,931 28,758,936 43,303,976 254 1,965 25,852,980 38,928,313 228 1,767
SCAB Boundary to Fairway—Southbound
Boiler — — — — — — — — — — — — — — — — — — — —
Total State Boundary to Fairway—Southbound
55,496,081 83,563,626 489 3,793 56,733,912 85,427,499 500 3,877 58,178,048 87,602,017 513 3,976 59,209,573 89,155,244 522 4,047 53,226,724 80,146,526 469 3,638
Fairway—Northbound Diesel Engines
473,223 712,559 4 32 483,778 728,452 4 33 496,092 746,995 4 34 504,888 760,239 4 35 453,872 683,421 4 31
Fairway—Northbound Boiler — — — — — — — — — — — — — — — — — — — —
Total in Fairway—Northbound
473,223 712,559 4 32 483,778 728,452 4 33 496,092 746,995 4 34 504,888 760,239 4 35 453,872 683,421 4 31
Fairway—Southbound Diesel Engines
7,979,303 12,014,894 70 545 8,157,280 12,282,884 72 557 8,364,920 12,595,539 74 572 8,157,280 12,282,884 72 557 7,653,012 11,523,579 67 523
Fairway—Southbound Boiler — — — — — — — — — — — — — — — — — — — —
Total in Fairway—Southbound
7,979,303 12,014,894 70 545 8,157,280 12,282,884 72 557 8,364,920 12,595,539 74 572 8,157,280 12,282,884 72 557 7,653,012 11,523,579 67 523
Precautionary Zone—Northbound
Diesel Engines
141,464 213,010 1 10 144,619 217,761 1 10 148,300 223,304 1 10 150,930 227,264 1 10 135,679 204,300 1 9
Precautionary Zone—Northbound
Boiler 9,770 14,711 0 1 9,988 15,039 0 1 10,242 15,422 0 1 10,424 15,696 0 1 9,770 14,711 0 1
Total Precautionary Zone—Northbound
151,234 227,721 1 10 154,607 232,801 1 11 158,543 238,727 1 11 161,354 242,959 1 11 145,449 219,011 1 10
Precautionary Zone—Southbound
Diesel Engines
5,357,550 8,067,169 47 366 5,477,049 8,247,106 48 374 5,616,465 8,457,033 50 384 5,716,048 8,606,980 50 391 5,138,468 7,737,285 45 351
Precautionary Zone—Southbound
Boiler 370,011 557,146 3 25 378,264 569,573 3 26 387,892 584,072 3 27 394,770 594,427 3 27 354,880 534,363 3 24
Total Precautionary Zone—Southbound
5,727,561 8,624,316 51 391 5,855,313 8,816,680 52 400 6,004,357 9,041,104 53 410 6,110,817 9,201,408 54 418 5,493,348 8,271,649 48 375
San Pedro Waterfront Project EIS/EIR D4-25
Spacial Allocation Power Type
Year: 2011 Year: 2015 Year: 2022 Year: 2037
Activity (kWh/yr)
Greenhouse Gases (lb/yr) Activity (kWh/yr)
Greenhouse Gases (lb/yr) Activity (kWh/yr)
Greenhouse Gases (lb/yr) Activity (kWh/yr)
Greenhouse Gases (lb/yr) Activity (kWh/yr)
Greenhouse Gases (lb/yr) CO2
CH4 N2O CO2
CH4 N2O CO2
CH4 N2O CO2
CH4 N2O CO2
CH4 N2O
Outer Harbor Zone1 (vessels bound to outer harbor berths)(5)
Diesel Engines
— — — — 651,535 981,054 6 45 668,120 1,006,026 6 46 679,966 1,023,863 6 46 — — — —
Outer Harbor Zone1 (vessels bound to outer harbor berths)(5)
Boiler — — — — 60,500 91,098 1 4 62,040 93,417 1 4 63,140 95,074 1 4 — — — —
Total Outer Harbor Zone1 — — — — 712,035 1,072,152 6 49 730,160 1,099,443 6 50 743,106 1,118,937 7 51 — — — —
Outer Harbor Zone2 (vessels bound to inner harbor berths)(2)
Diesel Engines
1,593,299 2,399,122 14 109 814,419 1,226,317 7 56 835,150 1,257,532 7 57 849,957 1,279,829 7 58 1,528,146 2,301,017 13 104
Outer Harbor Zone2 (vessels bound to inner harbor berths)(2)
Boiler 147,950 222,777 1 10 75,625 113,873 1 5 77,550 116,771 1 5 78,925 118,842 1 5 141,900 213,667 1 10
Total Outer Harbor Zone2 1,741,249 2,621,899 15 119 890,044 1,340,190 8 61 912,700 1,374,304 8 62 928,882 1,398,671 8 63 1,670,046 2,514,684 15 114
Inner Harbor Zone (maneuvering through main channel:inner harbor to inner harbor berths)
Diesel Engines
1,854,021 2,791,706 16 127 947,687 1,426,987 8 65 971,810 1,463,310 9 66 989,041 1,489,256 9 68 1,778,206 2,677,547 16 122
Inner Harbor Zone (maneuvering through main channel:inner harbor to inner harbor berths)
Boiler 172,160 259,231 2 12 88,000 132,507 1 6 90,240 135,880 1 6 91,840 138,289 1 6 165,120 248,631 1 11
Total Inner Harbor Zone 2,026,181 3,050,937 18 138 1,035,687 1,559,494 9 71 1,062,050 1,599,190 9 73 1,080,881 1,627,544 10 74 1,943,326 2,926,177 17 133
Total Transit (Sea + Fairway + All Zones)
All 76,307,599 114,900,721 673 5,215 76,795,931 115,636,030 677 5,248 78,750,737 118,579,493 694 5,382 79,791,073 120,087,926 703 5,451 73,187,614 110,481,470 647 5,015
Hoteling Diesel Engines
23,805,596 35,845,449 210 1,627 24,336,576 36,644,976 215 1,663 24,956,052 37,577,757 220 1,706 25,398,536 38,244,029 224 1,736 22,832,133 34,379,650 201 1,560
Hoteling Boiler 3,228,000 4,860,584 28 221 3,300,000 4,968,999 29 226 3,384,000 5,095,483 30 231 3,444,000 5,185,828 30 235 3,096,000 4,661,824 27 212
Total Hoteling 27,033,596 40,706,033 238 1,848 27,636,576 41,613,975 244 1,889 28,340,052 42,673,240 250 1,937 28,842,536 43,429,857 254 1,971 25,928,133 39,041,474 229 1,772
Annual Total (lb/yr) 103,341,195 155,606,754 911 7,063 104,432,507
157,250,005 921 7,137 107,090,789
161,252,733 944 7,319 108,633,608
163,517,783 958 7,422 99,115,747 149,522,944 876 6,787
Annual Total (ton/yr) 77,803 0.5 3.5 78,625 0.5 3.6 80,626 0.5 3.7 81,759 0.5 3.7 74,761 0.4 3.4
Emissions = (Engine Power * Load Factor * Time * 2 (1-Way) Trips * Vessels per Year = Activity) * Emission Factor.

San Pedro Waterfront Project EIS/EIR D4-26
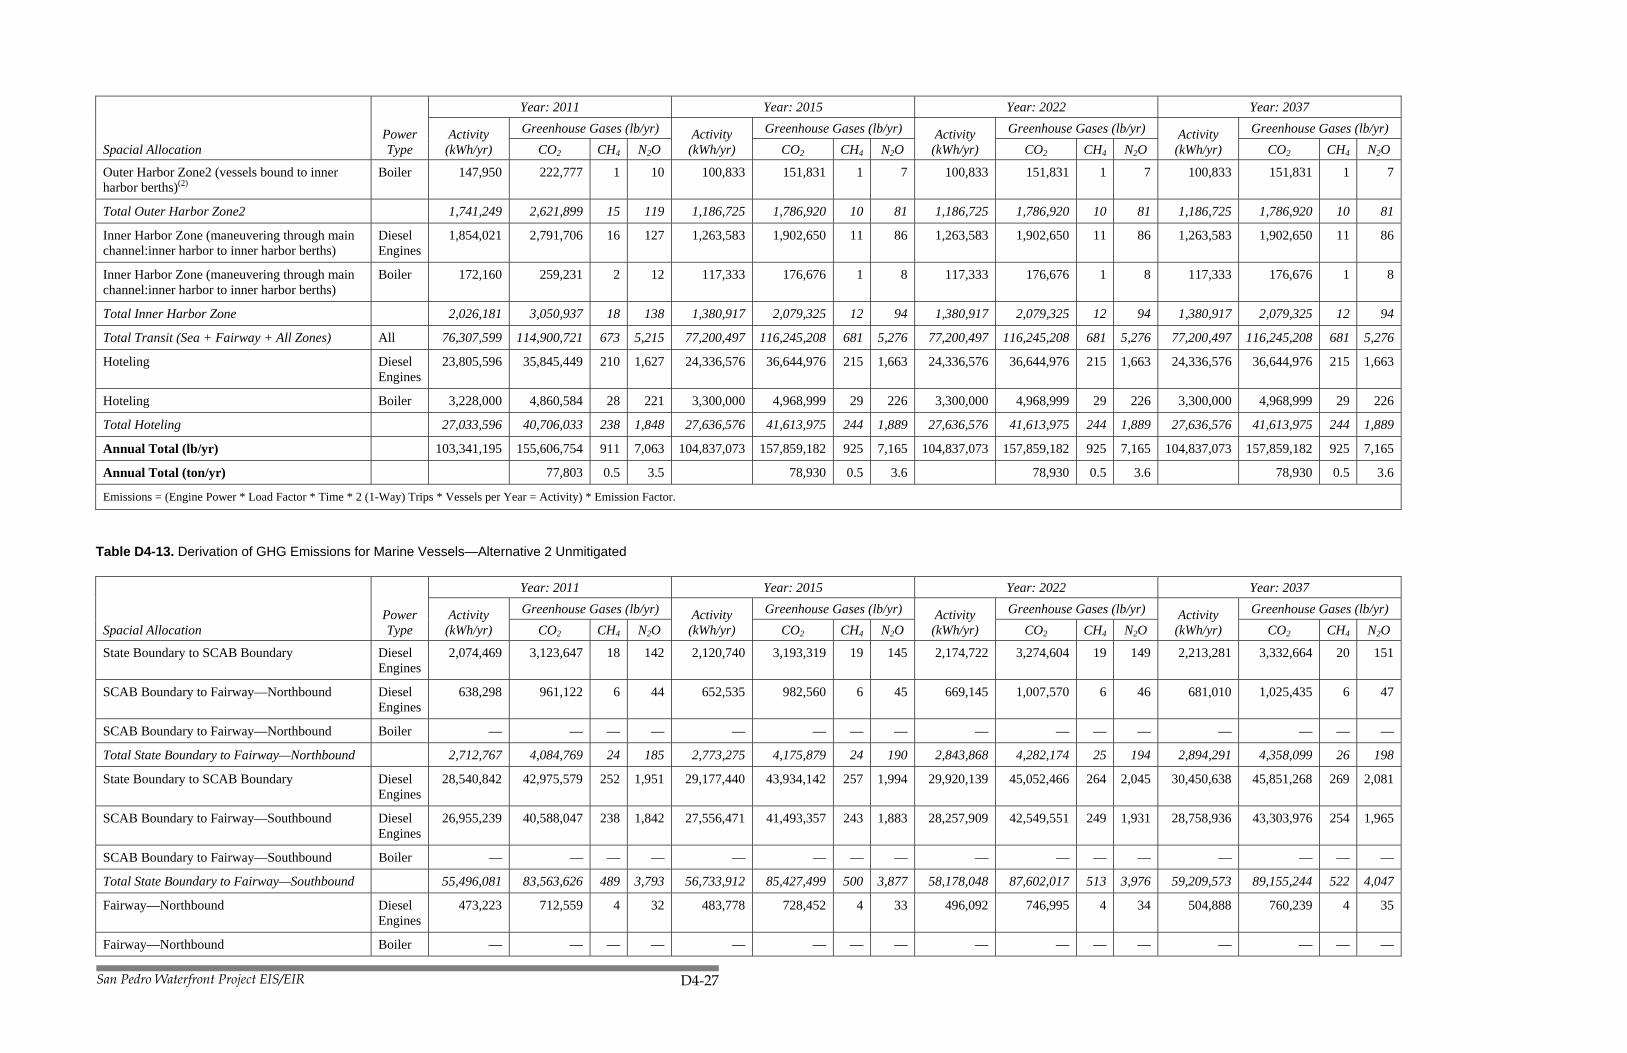
Table D4-12. Derivation of GHG Emissions for Marine Vessels—Alternative 1 Unmitigated
Spacial Allocation Power Type
Year: 2011 Year: 2015 Year: 2022 Year: 2037
Activity (kWh/yr)
Greenhouse Gases (lb/yr) Activity (kWh/yr)
Greenhouse Gases (lb/yr) Activity (kWh/yr)
Greenhouse Gases (lb/yr) Activity (kWh/yr)
Greenhouse Gases (lb/yr) CO2
CH4 N2O CO2
CH4 N2O CO2
CH4 N2O CO2
CH4 N2O
State Boundary to SCAB Boundary Diesel Engines
2,074,469 3,123,647 18 142 2,120,740 3,193,319 19 145 2,120,740 3,193,319 19 145 2,120,740 3,193,319 19 145
SCAB Boundary to Fairway—Northbound Diesel Engines
638,298 961,122 6 44 652,535 982,560 6 45 652,535 982,560 6 45 652,535 982,560 6 45
SCAB Boundary to Fairway—Northbound Boiler — — — — — — — — — — — — — — — —
Total State Boundary to Fairway—Northbound 2,712,767 4,084,769 24 185 2,773,275 4,175,879 24 190 2,773,275 4,175,879 24 190 2,773,275 4,175,879 24 190
State Boundary to SCAB Boundary Diesel Engines
28,540,842 42,975,579 252 1,951 29,177,440 43,934,142 257 1,994 29,177,440 43,934,142 257 1,994 29,177,440 43,934,142 257 1,994
SCAB Boundary to Fairway—Southbound Diesel Engines
26,955,239 40,588,047 238 1,842 27,556,471 41,493,357 243 1,883 27,556,471 41,493,357 243 1,883 27,556,471 41,493,357 243 1,883
SCAB Boundary to Fairway—Southbound Boiler — — — — — — — — — — — — — — — —
Total State Boundary to Fairway—Southbound 55,496,081 83,563,626 489 3,793 56,733,912 85,427,499 500 3,877 56,733,912 85,427,499 500 3,877 56,733,912 85,427,499 500 3,877
Fairway—Northbound Diesel Engines
473,223 712,559 4 32 483,778 728,452 4 33 483,778 728,452 4 33 483,778 728,452 4 33
Fairway—Northbound Boiler — — — — — — — — — — — — — — — —
Total in Fairway—Northbound 473,223 712,559 4 32 483,778 728,452 4 33 483,778 728,452 4 33 483,778 728,452 4 33
Fairway—Southbound Diesel Engines
7,979,303 12,014,894 70 545 8,157,280 12,282,884 72 557 8,157,280 12,282,884 72 557 8,157,280 12,282,884 72 557
Fairway—Southbound Boiler — — — — — — — — — — — — — — — —
Total in Fairway—Southbound 7,979,303 12,014,894 70 545 8,157,280 12,282,884 72 557 8,157,280 12,282,884 72 557 8,157,280 12,282,884 72 557
Precautionary Zone—Northbound Diesel Engines
141,464 213,010 1 10 144,619 217,761 1 10 144,619 217,761 1 10 144,619 217,761 1 10
Precautionary Zone—Northbound Boiler 9,770 14,711 0 1 9,988 15,039 0 1 9,988 15,039 0 1 9,988 15,039 0 1
Total Precautionary Zone—Northbound 151,234 227,721 1 10 154,607 232,801 1 11 154,607 232,801 1 11 154,607 232,801 1 11
Precautionary Zone—Southbound Diesel Engines
5,357,550 8,067,169 47 366 5,477,049 8,247,106 48 374 5,477,049 8,247,106 48 374 5,477,049 8,247,106 48 374
Precautionary Zone—Southbound Boiler 370,011 557,146 3 25 378,264 569,573 3 26 378,264 569,573 3 26 378,264 569,573 3 26
Total Precautionary Zone—Southbound 5,727,561 8,624,316 51 391 5,855,313 8,816,680 52 400 5,855,313 8,816,680 52 400 5,855,313 8,816,680 52 400
Outer Harbor Zone1 (vessels bound to outer harbor berths)(5)
Diesel Engines
— — — — 434,357 654,036 4 30 434,357 654,036 4 30 434,357 654,036 4 30
Outer Harbor Zone1 (vessels bound to outer harbor berths)(5)
Boiler — — — — 40,333 60,732 0 3 40,333 60,732 0 3 40,333 60,732 0 3
Total Outer Harbor Zone1 — — — — 474,690 714,768 4 32 474,690 714,768 4 32 474,690 714,768 4 32
Outer Harbor Zone2 (vessels bound to inner harbor berths)(2)
Diesel Engines
1,593,299 2,399,122 14 109 1,085,892 1,635,089 10 74 1,085,892 1,635,089 10 74 1,085,892 1,635,089 10 74
San Pedro Waterfront Project EIS/EIR D4-27
Spacial Allocation Power Type
Year: 2011 Year: 2015 Year: 2022 Year: 2037
Activity (kWh/yr)
Greenhouse Gases (lb/yr) Activity (kWh/yr)
Greenhouse Gases (lb/yr) Activity (kWh/yr)
Greenhouse Gases (lb/yr) Activity (kWh/yr)
Greenhouse Gases (lb/yr) CO2
CH4 N2O CO2
CH4 N2O CO2
CH4 N2O CO2
CH4 N2O
Outer Harbor Zone2 (vessels bound to inner harbor berths)(2)
Boiler 147,950 222,777 1 10 100,833 151,831 1 7 100,833 151,831 1 7 100,833 151,831 1 7
Total Outer Harbor Zone2 1,741,249 2,621,899 15 119 1,186,725 1,786,920 10 81 1,186,725 1,786,920 10 81 1,186,725 1,786,920 10 81
Inner Harbor Zone (maneuvering through main channel:inner harbor to inner harbor berths)
Diesel Engines
1,854,021 2,791,706 16 127 1,263,583 1,902,650 11 86 1,263,583 1,902,650 11 86 1,263,583 1,902,650 11 86
Inner Harbor Zone (maneuvering through main channel:inner harbor to inner harbor berths)
Boiler 172,160 259,231 2 12 117,333 176,676 1 8 117,333 176,676 1 8 117,333 176,676 1 8
Total Inner Harbor Zone 2,026,181 3,050,937 18 138 1,380,917 2,079,325 12 94 1,380,917 2,079,325 12 94 1,380,917 2,079,325 12 94
Total Transit (Sea + Fairway + All Zones) All 76,307,599 114,900,721 673 5,215 77,200,497 116,245,208 681 5,276 77,200,497 116,245,208 681 5,276 77,200,497 116,245,208 681 5,276
Hoteling Diesel Engines
23,805,596 35,845,449 210 1,627 24,336,576 36,644,976 215 1,663 24,336,576 36,644,976 215 1,663 24,336,576 36,644,976 215 1,663
Hoteling Boiler 3,228,000 4,860,584 28 221 3,300,000 4,968,999 29 226 3,300,000 4,968,999 29 226 3,300,000 4,968,999 29 226
Total Hoteling 27,033,596 40,706,033 238 1,848 27,636,576 41,613,975 244 1,889 27,636,576 41,613,975 244 1,889 27,636,576 41,613,975 244 1,889
Annual Total (lb/yr) 103,341,195 155,606,754 911 7,063 104,837,073 157,859,182 925 7,165 104,837,073 157,859,182 925 7,165 104,837,073 157,859,182 925 7,165
Annual Total (ton/yr) 77,803 0.5 3.5 78,930 0.5 3.6 78,930 0.5 3.6 78,930 0.5 3.6
Emissions = (Engine Power * Load Factor * Time * 2 (1-Way) Trips * Vessels per Year = Activity) * Emission Factor.
Table D4-13. Derivation of GHG Emissions for Marine Vessels—Alternative 2 Unmitigated
Spacial Allocation Power Type
Year: 2011 Year: 2015 Year: 2022 Year: 2037
Activity (kWh/yr)
Greenhouse Gases (lb/yr) Activity (kWh/yr)
Greenhouse Gases (lb/yr) Activity (kWh/yr)
Greenhouse Gases (lb/yr) Activity (kWh/yr)
Greenhouse Gases (lb/yr) CO2
CH4 N2O CO2
CH4 N2O CO2
CH4 N2O CO2
CH4 N2O
State Boundary to SCAB Boundary Diesel Engines
2,074,469 3,123,647 18 142 2,120,740 3,193,319 19 145 2,174,722 3,274,604 19 149 2,213,281 3,332,664 20 151
SCAB Boundary to Fairway—Northbound Diesel Engines
638,298 961,122 6 44 652,535 982,560 6 45 669,145 1,007,570 6 46 681,010 1,025,435 6 47
SCAB Boundary to Fairway—Northbound Boiler — — — — — — — — — — — — — — — —
Total State Boundary to Fairway—Northbound 2,712,767 4,084,769 24 185 2,773,275 4,175,879 24 190 2,843,868 4,282,174 25 194 2,894,291 4,358,099 26 198
State Boundary to SCAB Boundary Diesel Engines
28,540,842 42,975,579 252 1,951 29,177,440 43,934,142 257 1,994 29,920,139 45,052,466 264 2,045 30,450,638 45,851,268 269 2,081
SCAB Boundary to Fairway—Southbound Diesel Engines
26,955,239 40,588,047 238 1,842 27,556,471 41,493,357 243 1,883 28,257,909 42,549,551 249 1,931 28,758,936 43,303,976 254 1,965
SCAB Boundary to Fairway—Southbound Boiler — — — — — — — — — — — — — — — —
Total State Boundary to Fairway—Southbound 55,496,081 83,563,626 489 3,793 56,733,912 85,427,499 500 3,877 58,178,048 87,602,017 513 3,976 59,209,573 89,155,244 522 4,047
Fairway—Northbound Diesel Engines
473,223 712,559 4 32 483,778 728,452 4 33 496,092 746,995 4 34 504,888 760,239 4 35
Fairway—Northbound Boiler — — — — — — — — — — — — — — — —

San Pedro Waterfront Project EIS/EIR D4-28
Spacial Allocation Power Type
Year: 2011 Year: 2015 Year: 2022 Year: 2037
Activity (kWh/yr)
Greenhouse Gases (lb/yr) Activity (kWh/yr)
Greenhouse Gases (lb/yr) Activity (kWh/yr)
Greenhouse Gases (lb/yr) Activity (kWh/yr)
Greenhouse Gases (lb/yr) CO2
CH4 N2O CO2
CH4 N2O CO2
CH4 N2O CO2
CH4 N2O
Total in Fairway—Northbound 473,223 712,559 4 32 483,778 728,452 4 33 496,092 746,995 4 34 504,888 760,239 4 35
Fairway—Southbound Diesel Engines
7,979,303 12,014,894 70 545 8,157,280 12,282,884 72 557 8,364,920 12,595,539 74 572 8,157,280 12,282,884 72 557
Fairway—Southbound Boiler — — — — — — — — — — — — — — — —
Total in Fairway—Southbound 7,979,303 12,014,894 70 545 8,157,280 12,282,884 72 557 8,364,920 12,595,539 74 572 8,157,280 12,282,884 72 557
Precautionary Zone—Northbound Diesel Engines
141,464 213,010 1 10 144,619 217,761 1 10 148,300 223,304 1 10 150,930 227,264 1 10
Precautionary Zone—Northbound Boiler 9,770 14,711 0 1 9,988 15,039 0 1 10,242 15,422 0 1 10,424 15,696 0 1
Total Precautionary Zone—Northbound 151,234 227,721 1 10 154,607 232,801 1 11 158,543 238,727 1 11 161,354 242,959 1 11
Precautionary Zone—Southbound Diesel Engines
5,357,550 8,067,169 47 366 5,477,049 8,247,106 48 374 5,616,465 8,457,033 50 384 5,716,048 8,606,980 50 391
Precautionary Zone—Southbound Boiler 370,011 557,146 3 25 378,264 569,573 3 26 387,892 584,072 3 27 394,770 594,427 3 27
Total Precautionary Zone—Southbound 5,727,561 8,624,316 51 391 5,855,313 8,816,680 52 400 6,004,357 9,041,104 53 410 6,110,817 9,201,408 54 418
Outer Harbor Zone1 (vessels bound to outer harbor berths)(5)
Diesel Engines
— — — — 651,535 981,054 6 45 668,120 1,006,026 6 46 679,966 1,023,863 6 46
Outer Harbor Zone1 (vessels bound to outer harbor berths)(5)
Boiler — — — — 60,500 91,098 1 4 62,040 93,417 1 4 63,140 95,074 1 4
Total Outer Harbor Zone1 — — — — 712,035 1,072,152 6 49 730,160 1,099,443 6 50 743,106 1,118,937 7 51
Outer Harbor Zone2 (vessels bound to inner harbor berths)(2)
Diesel Engines
1,593,299 2,399,122 14 109 814,419 1,226,317 7 56 835,150 1,257,532 7 57 849,957 1,279,829 7 58
Outer Harbor Zone2 (vessels bound to inner harbor berths)(2)
Boiler 147,950 222,777 1 10 75,625 113,873 1 5 77,550 116,771 1 5 78,925 118,842 1 5
Total Outer Harbor Zone2 1,741,249 2,621,899 15 119 890,044 1,340,190 8 61 912,700 1,374,304 8 62 928,882 1,398,671 8 63
Inner Harbor Zone (maneuvering through main channel:inner harbor to inner harbor berths)
Diesel Engines
1,854,021 2,791,706 16 127 947,687 1,426,987 8 65 971,810 1,463,310 9 66 989,041 1,489,256 9 68
Inner Harbor Zone (maneuvering through main channel:inner harbor to inner harbor berths)
Boiler 172,160 259,231 2 12 88,000 132,507 1 6 90,240 135,880 1 6 91,840 138,289 1 6
Total Inner Harbor Zone 2,026,181 3,050,937 18 138 1,035,687 1,559,494 9 71 1,062,050 1,599,190 9 73 1,080,881 1,627,544 10 74
Total Transit (Sea + Fairway + All Zones) All 76,307,599 114,900,721 673 5,215 76,795,931 115,636,030 677 5,248 78,750,737 118,579,493 694 5,382 79,791,073 120,145,986 704 5,453
Hoteling Diesel Engines
23,805,596 35,845,449 210 1,627 24,336,576 36,644,976 215 1,663 24,956,052 37,577,757 220 1,706 25,398,536 38,244,029 224 1,736
Hoteling Boiler 3,228,000 4,860,584 28 221 3,300,000 4,968,999 29 226 3,384,000 5,095,483 30 231 3,444,000 5,185,828 30 235
Total Hoteling 27,033,596 40,706,033 238 1,848 27,636,576 41,613,975 244 1,889 28,340,052 42,673,240 250 1,937 28,842,536 43,429,857 254 1,971
Annual Total (lb/yr) 103,341,195 155,606,754 911 7,063 104,432,507 157,250,005 921 7,137 107,090,789 161,252,733 944 7,319 108,633,608 163,575,843 958 7,424
Annual Total (ton/yr) 77,803 0.5 3.5 78,625 0.5 3.6 80,626 0.5 3.7 81,788 0.5 3.7
Emissions = (Engine Power * Load Factor * Time * 2 (1-Way) Trips * Vessels per Year = Activity) * Emission Factor.
San Pedro Waterfront Project EIS/EIR D4-29
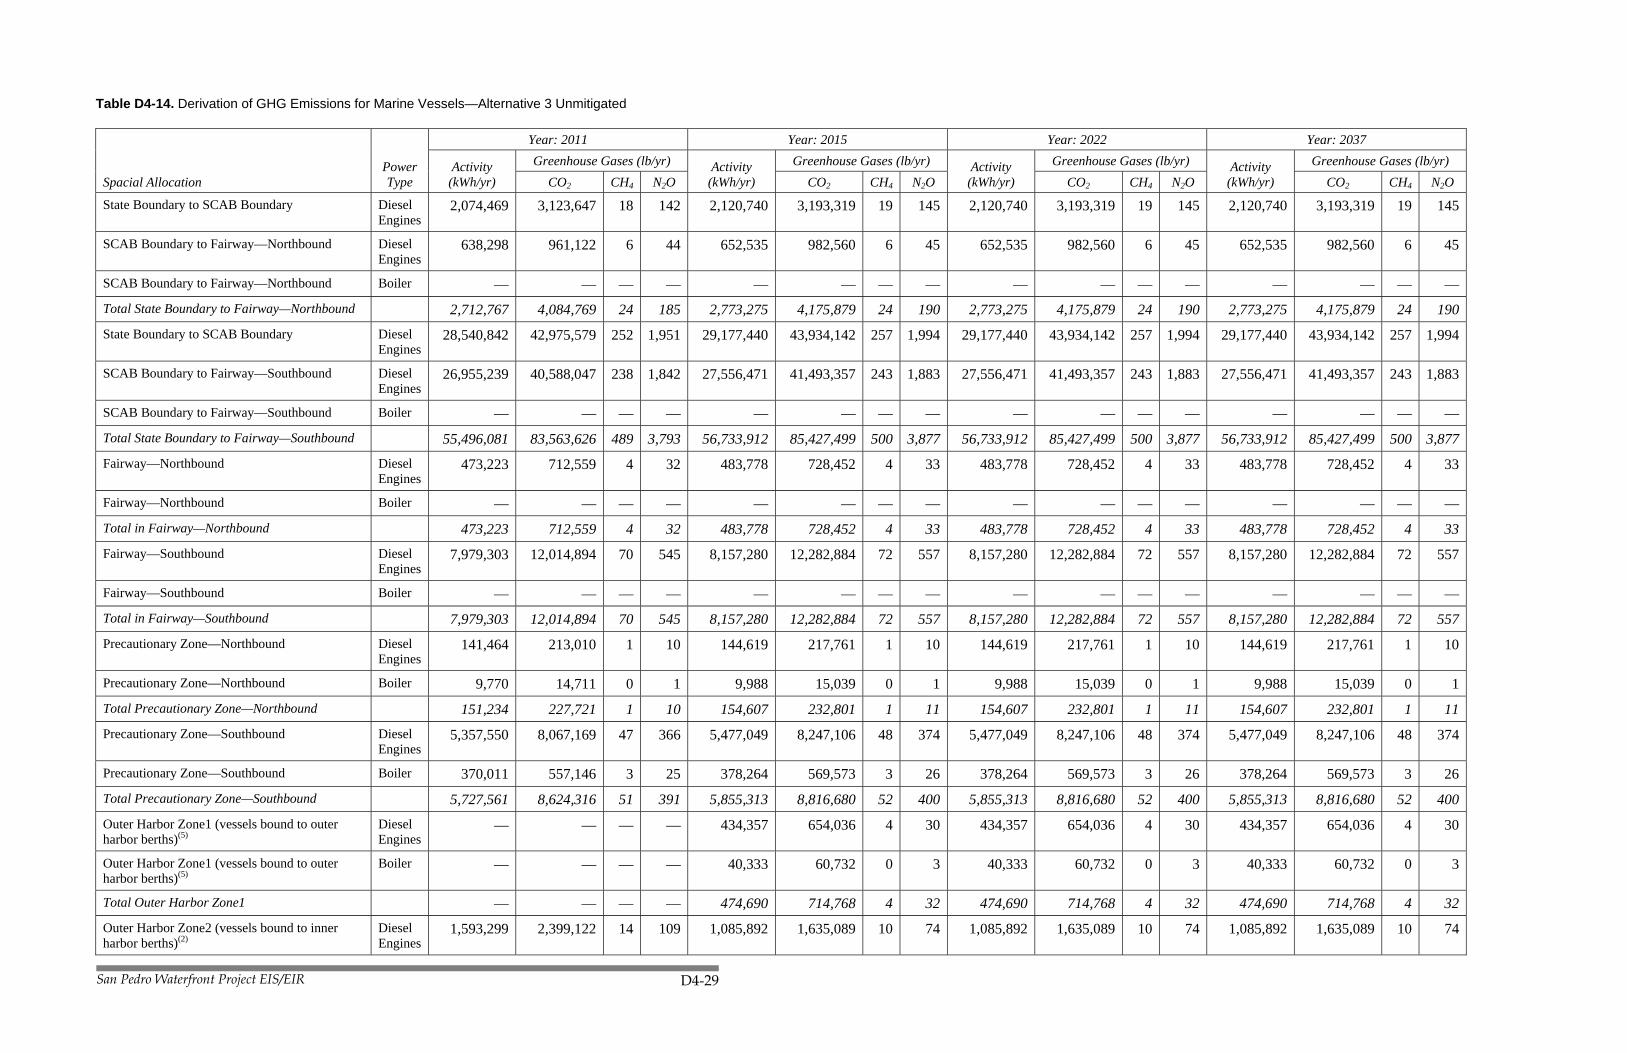
Table D4-14. Derivation of GHG Emissions for Marine Vessels—Alternative 3 Unmitigated
Spacial Allocation Power Type
Year: 2011 Year: 2015 Year: 2022 Year: 2037
Activity (kWh/yr)
Greenhouse Gases (lb/yr) Activity (kWh/yr)
Greenhouse Gases (lb/yr) Activity (kWh/yr)
Greenhouse Gases (lb/yr) Activity (kWh/yr)
Greenhouse Gases (lb/yr) CO2
CH4 N2O CO2
CH4 N2O CO2
CH4 N2O CO2
CH4 N2O
State Boundary to SCAB Boundary Diesel Engines
2,074,469 3,123,647 18 142 2,120,740 3,193,319 19 145 2,120,740 3,193,319 19 145 2,120,740 3,193,319 19 145
SCAB Boundary to Fairway—Northbound Diesel Engines
638,298 961,122 6 44 652,535 982,560 6 45 652,535 982,560 6 45 652,535 982,560 6 45
SCAB Boundary to Fairway—Northbound Boiler — — — — — — — — — — — — — — — —
Total State Boundary to Fairway—Northbound 2,712,767 4,084,769 24 185 2,773,275 4,175,879 24 190 2,773,275 4,175,879 24 190 2,773,275 4,175,879 24 190
State Boundary to SCAB Boundary Diesel Engines
28,540,842 42,975,579 252 1,951 29,177,440 43,934,142 257 1,994 29,177,440 43,934,142 257 1,994 29,177,440 43,934,142 257 1,994
SCAB Boundary to Fairway—Southbound Diesel Engines
26,955,239 40,588,047 238 1,842 27,556,471 41,493,357 243 1,883 27,556,471 41,493,357 243 1,883 27,556,471 41,493,357 243 1,883
SCAB Boundary to Fairway—Southbound Boiler — — — — — — — — — — — — — — — —
Total State Boundary to Fairway—Southbound 55,496,081 83,563,626 489 3,793 56,733,912 85,427,499 500 3,877 56,733,912 85,427,499 500 3,877 56,733,912 85,427,499 500 3,877
Fairway—Northbound Diesel Engines
473,223 712,559 4 32 483,778 728,452 4 33 483,778 728,452 4 33 483,778 728,452 4 33
Fairway—Northbound Boiler — — — — — — — — — — — — — — — —
Total in Fairway—Northbound 473,223 712,559 4 32 483,778 728,452 4 33 483,778 728,452 4 33 483,778 728,452 4 33
Fairway—Southbound Diesel Engines
7,979,303 12,014,894 70 545 8,157,280 12,282,884 72 557 8,157,280 12,282,884 72 557 8,157,280 12,282,884 72 557
Fairway—Southbound Boiler — — — — — — — — — — — — — — — —
Total in Fairway—Southbound 7,979,303 12,014,894 70 545 8,157,280 12,282,884 72 557 8,157,280 12,282,884 72 557 8,157,280 12,282,884 72 557
Precautionary Zone—Northbound Diesel Engines
141,464 213,010 1 10 144,619 217,761 1 10 144,619 217,761 1 10 144,619 217,761 1 10
Precautionary Zone—Northbound Boiler 9,770 14,711 0 1 9,988 15,039 0 1 9,988 15,039 0 1 9,988 15,039 0 1
Total Precautionary Zone—Northbound 151,234 227,721 1 10 154,607 232,801 1 11 154,607 232,801 1 11 154,607 232,801 1 11
Precautionary Zone—Southbound Diesel Engines
5,357,550 8,067,169 47 366 5,477,049 8,247,106 48 374 5,477,049 8,247,106 48 374 5,477,049 8,247,106 48 374
Precautionary Zone—Southbound Boiler 370,011 557,146 3 25 378,264 569,573 3 26 378,264 569,573 3 26 378,264 569,573 3 26
Total Precautionary Zone—Southbound 5,727,561 8,624,316 51 391 5,855,313 8,816,680 52 400 5,855,313 8,816,680 52 400 5,855,313 8,816,680 52 400
Outer Harbor Zone1 (vessels bound to outer harbor berths)(5)
Diesel Engines
— — — — 434,357 654,036 4 30 434,357 654,036 4 30 434,357 654,036 4 30
Outer Harbor Zone1 (vessels bound to outer harbor berths)(5)
Boiler — — — — 40,333 60,732 0 3 40,333 60,732 0 3 40,333 60,732 0 3
Total Outer Harbor Zone1 — — — — 474,690 714,768 4 32 474,690 714,768 4 32 474,690 714,768 4 32
Outer Harbor Zone2 (vessels bound to inner harbor berths)(2)
Diesel Engines
1,593,299 2,399,122 14 109 1,085,892 1,635,089 10 74 1,085,892 1,635,089 10 74 1,085,892 1,635,089 10 74

San Pedro Waterfront Project EIS/EIR D4-30
Spacial Allocation Power Type
Year: 2011 Year: 2015 Year: 2022 Year: 2037
Activity (kWh/yr)
Greenhouse Gases (lb/yr) Activity (kWh/yr)
Greenhouse Gases (lb/yr) Activity (kWh/yr)
Greenhouse Gases (lb/yr) Activity (kWh/yr)
Greenhouse Gases (lb/yr) CO2
CH4 N2O CO2
CH4 N2O CO2
CH4 N2O CO2
CH4 N2O
Outer Harbor Zone2 (vessels bound to inner harbor berths)(2)
Boiler 147,950 222,777 1 10 100,833 151,831 1 7 100,833 151,831 1 7 100,833 151,831 1 7
Total Outer Harbor Zone2 1,741,249 2,621,899 15 119 1,186,725 1,786,920 10 81 1,186,725 1,786,920 10 81 1,186,725 1,786,920 10 81
Inner Harbor Zone (maneuvering through main channel:inner harbor to inner harbor berths)
Diesel Engines
1,854,021 2,791,706 16 127 1,263,583 1,902,650 11 86 1,263,583 1,902,650 11 86 1,263,583 1,902,650 11 86
Inner Harbor Zone (maneuvering through main channel:inner harbor to inner harbor berths)
Boiler 172,160 259,231 2 12 117,333 176,676 1 8 117,333 176,676 1 8 117,333 176,676 1 8
Total Inner Harbor Zone 2,026,181 3,050,937 18 138 1,380,917 2,079,325 12 94 1,380,917 2,079,325 12 94 1,380,917 2,079,325 12 94
Total Transit (Sea + Fairway + All Zones) All 76,307,599 114,900,721 673 5,215 77,200,497 116,245,208 681 5,276 77,200,497 116,245,208 681 5,276 77,200,497 116,245,208 681 5,276
Hoteling Diesel Engines
23,805,596 35,845,449 210 1,627 24,336,576 36,644,976 215 1,663 24,336,576 36,644,976 215 1,663 24,336,576 36,644,976 215 1,663
Hoteling Boiler 3,228,000 4,860,584 28 221 3,300,000 4,968,999 29 226 3,300,000 4,968,999 29 226 3,300,000 4,968,999 29 226
Total Hoteling 27,033,596 40,706,033 238 1,848 27,636,576 41,613,975 244 1,889 27,636,576 41,613,975 244 1,889 27,636,576 41,613,975 244 1,889
Annual Total (lb/yr) 103,341,195 155,606,754 911 7,063 104,837,073 157,859,182 925 7,165 104,837,073 157,859,182 925 7,165 104,837,073 157,859,182 925 7,165
Annual Total (ton/yr) 77,803 0.5 3.5 78,930 0.5 3.6 78,930 0.5 3.6 78,930 0.5 3.6
Emissions = (Engine Power * Load Factor * Time * 2 (1-Way) Trips * Vessels per Year = Activity) * Emission Factor.
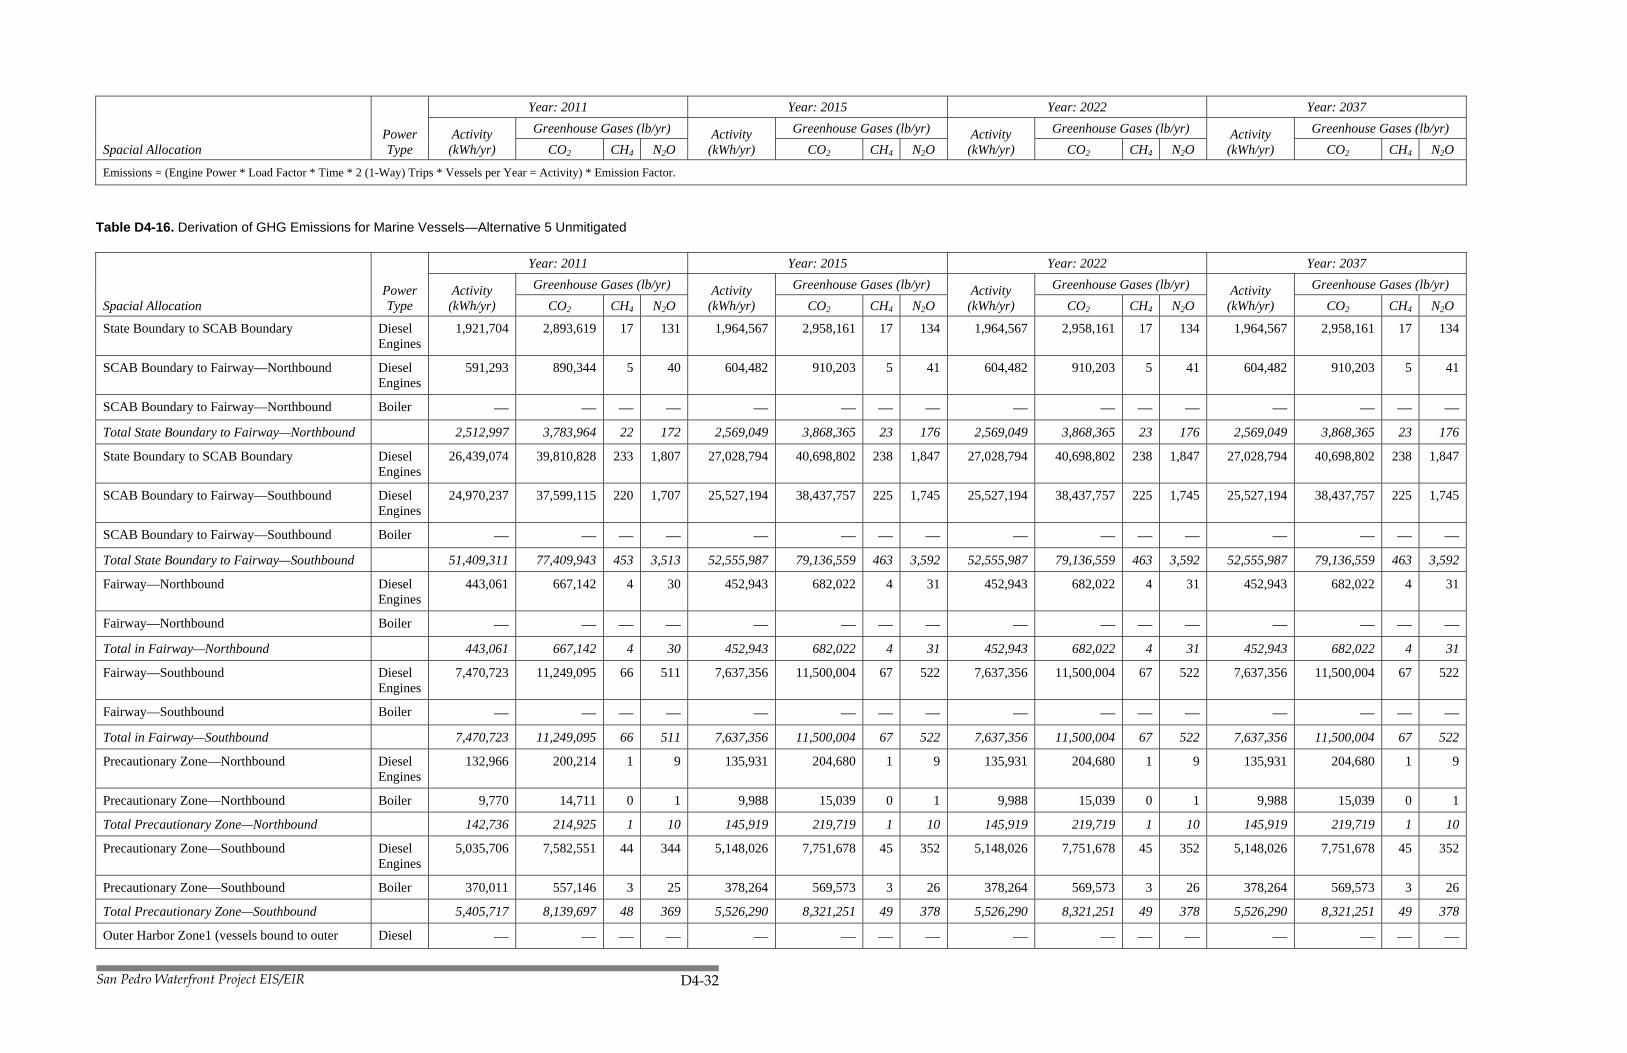
Table D4-15. Derivation of GHG Emissions for Marine Vessels—Alternative 4 Unmitigated
Spacial Allocation Power Type
Year: 2011 Year: 2015 Year: 2022 Year: 2037
Activity (kWh/yr)
Greenhouse Gases (lb/yr) Activity (kWh/yr)
Greenhouse Gases (lb/yr) Activity (kWh/yr)
Greenhouse Gases (lb/yr) Activity (kWh/yr)
Greenhouse Gases (lb/yr) CO2
CH4 N2O CO2
CH4 N2O CO2
CH4 N2O CO2
CH4 N2O
State Boundary to SCAB Boundary Diesel Engines
1,921,704 2,893,619 17 131 1,964,567 2,958,161 17 134 1,964,567 2,958,161 17 134 1,964,567 2,958,161 17 134
SCAB Boundary to Fairway—Northbound Diesel Engines
591,293 890,344 5 40 604,482 910,203 5 41 604,482 910,203 5 41 604,482 910,203 5 41
SCAB Boundary to Fairway—Northbound Boiler — — — — — — — — — — — — — — — —
Total State Boundary to Fairway—Northbound 2,512,997 3,783,964 22 172 2,569,049 3,868,365 23 176 2,569,049 3,868,365 23 176 2,569,049 3,868,365 23 176
State Boundary to SCAB Boundary Diesel Engines
26,439,074 39,810,828 233 1,807 27,028,794 40,698,802 238
1,847 27,028,794 40,698,802 238
1,847 27,028,794 40,698,802 238
1,847
SCAB Boundary to Fairway—Southbound Diesel Engines
24,970,237 37,599,115 220 1,707 25,527,194 38,437,757 225 1,745 25,527,194 38,437,757 225 1,745 25,527,194 38,437,757 225 1,745
SCAB Boundary to Fairway—Southbound Boiler — — — — — — — — — — — — — — — —
Total State Boundary to Fairway—Southbound 51,409,311 77,409,943 453 3,513 52,555,987 79,136,559 463 3,592 52,555,987 79,136,559 463 3,592 52,555,987 79,136,559 463 3,592
Fairway—Northbound Diesel Engines
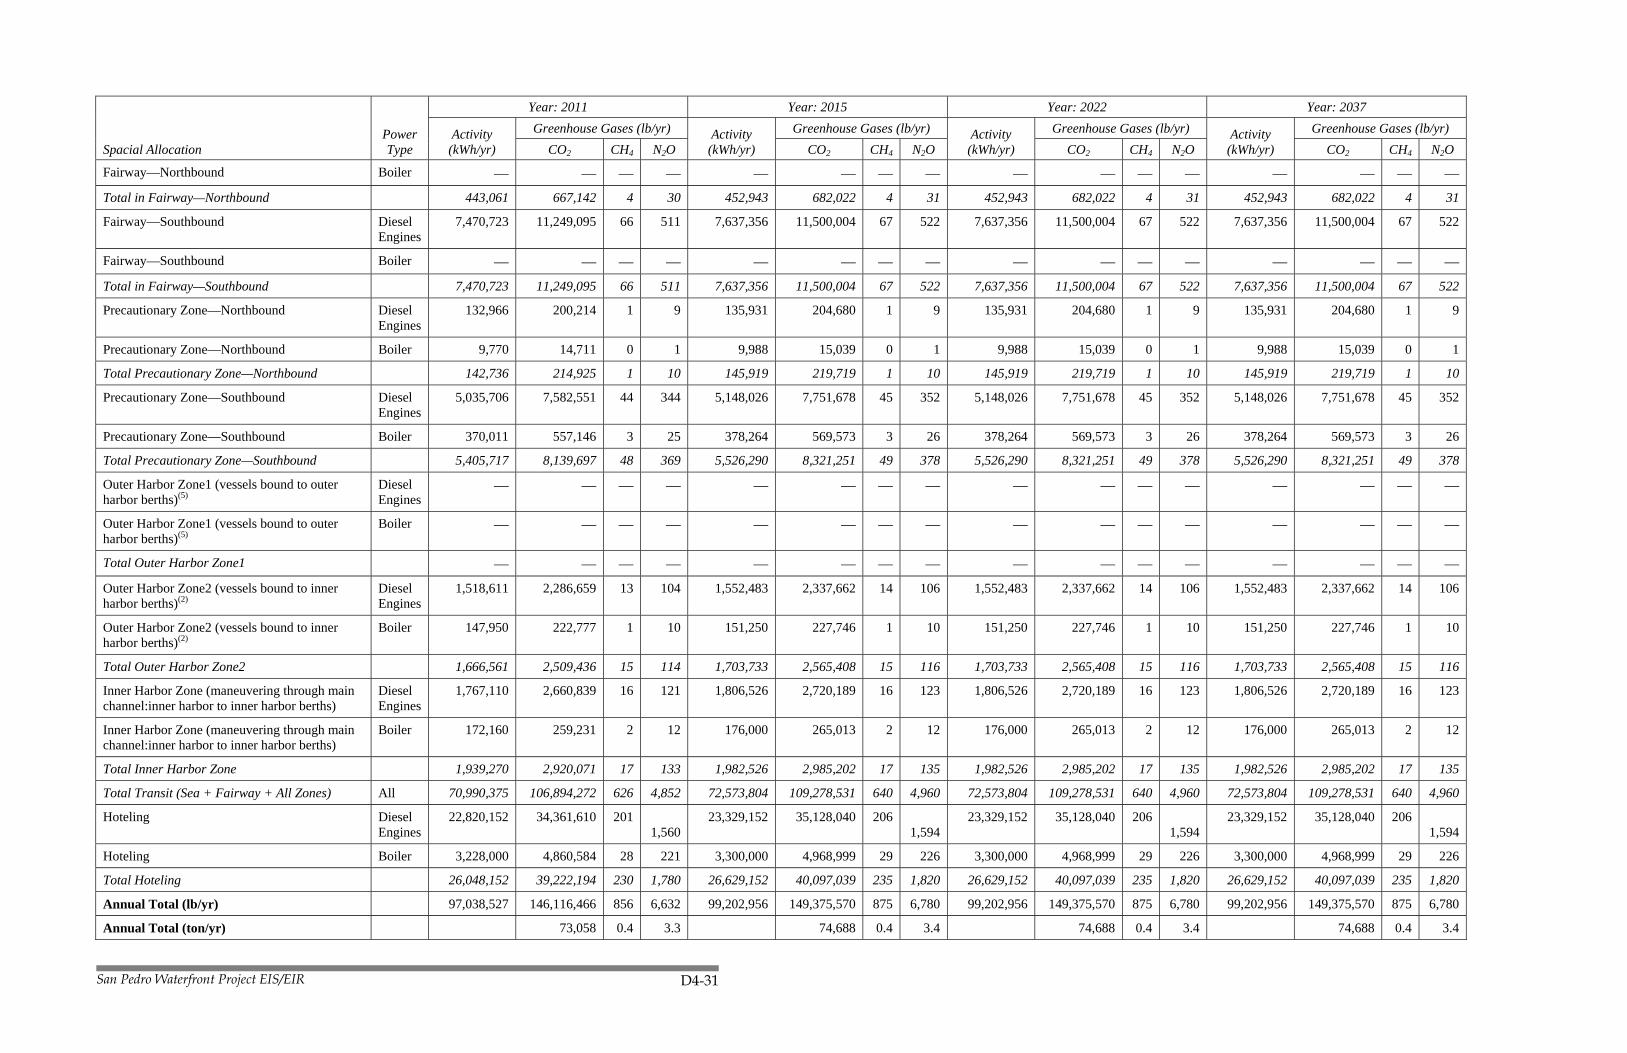
443,061 667,142 4 30 452,943 682,022 4 31 452,943 682,022 4 31 452,943 682,022 4 31
San Pedro Waterfront Project EIS/EIR D4-31
Spacial Allocation Power Type
Year: 2011 Year: 2015 Year: 2022 Year: 2037
Activity (kWh/yr)
Greenhouse Gases (lb/yr) Activity (kWh/yr)
Greenhouse Gases (lb/yr) Activity (kWh/yr)
Greenhouse Gases (lb/yr) Activity (kWh/yr)
Greenhouse Gases (lb/yr) CO2
CH4 N2O CO2
CH4 N2O CO2
CH4 N2O CO2
CH4 N2O
Fairway—Northbound Boiler — — — — — — — — — — — — — — — —
Total in Fairway—Northbound 443,061 667,142 4 30 452,943 682,022 4 31 452,943 682,022 4 31 452,943 682,022 4 31
Fairway—Southbound Diesel Engines
7,470,723 11,249,095 66 511 7,637,356 11,500,004 67 522 7,637,356 11,500,004 67 522 7,637,356 11,500,004 67 522
Fairway—Southbound Boiler — — — — — — — — — — — — — — — —
Total in Fairway—Southbound 7,470,723 11,249,095 66 511 7,637,356 11,500,004 67 522 7,637,356 11,500,004 67 522 7,637,356 11,500,004 67 522
Precautionary Zone—Northbound Diesel Engines
132,966 200,214 1 9 135,931 204,680 1 9 135,931 204,680 1 9 135,931 204,680 1 9
Precautionary Zone—Northbound Boiler 9,770 14,711 0 1 9,988 15,039 0 1 9,988 15,039 0 1 9,988 15,039 0 1
Total Precautionary Zone—Northbound 142,736 214,925 1 10 145,919 219,719 1 10 145,919 219,719 1 10 145,919 219,719 1 10
Precautionary Zone—Southbound Diesel Engines
5,035,706 7,582,551 44 344 5,148,026 7,751,678 45 352 5,148,026 7,751,678 45 352 5,148,026 7,751,678 45 352
Precautionary Zone—Southbound Boiler 370,011 557,146 3 25 378,264 569,573 3 26 378,264 569,573 3 26 378,264 569,573 3 26
Total Precautionary Zone—Southbound 5,405,717 8,139,697 48 369 5,526,290 8,321,251 49 378 5,526,290 8,321,251 49 378 5,526,290 8,321,251 49 378
Outer Harbor Zone1 (vessels bound to outer harbor berths)(5)
Diesel Engines
— — — — — — — — — — — — — — — —
Outer Harbor Zone1 (vessels bound to outer harbor berths)(5)
Boiler — — — — — — — — — — — — — — — —
Total Outer Harbor Zone1 — — — — — — — — — — — — — — — —
Outer Harbor Zone2 (vessels bound to inner harbor berths)(2)
Diesel Engines
1,518,611 2,286,659 13 104 1,552,483 2,337,662 14 106 1,552,483 2,337,662 14 106 1,552,483 2,337,662 14 106
Outer Harbor Zone2 (vessels bound to inner harbor berths)(2)
Boiler 147,950 222,777 1 10 151,250 227,746 1 10 151,250 227,746 1 10 151,250 227,746 1 10
Total Outer Harbor Zone2 1,666,561 2,509,436 15 114 1,703,733 2,565,408 15 116 1,703,733 2,565,408 15 116 1,703,733 2,565,408 15 116
Inner Harbor Zone (maneuvering through main channel:inner harbor to inner harbor berths)
Diesel Engines
1,767,110 2,660,839 16 121 1,806,526 2,720,189 16 123 1,806,526 2,720,189 16 123 1,806,526 2,720,189 16 123
Inner Harbor Zone (maneuvering through main channel:inner harbor to inner harbor berths)
Boiler 172,160 259,231 2 12 176,000 265,013 2 12 176,000 265,013 2 12 176,000 265,013 2 12
Total Inner Harbor Zone 1,939,270 2,920,071 17 133 1,982,526 2,985,202 17 135 1,982,526 2,985,202 17 135 1,982,526 2,985,202 17 135
Total Transit (Sea + Fairway + All Zones) All 70,990,375 106,894,272 626 4,852 72,573,804 109,278,531 640 4,960 72,573,804 109,278,531 640 4,960 72,573,804 109,278,531 640 4,960
Hoteling Diesel Engines
22,820,152 34,361,610 201 1,560
23,329,152 35,128,040 206 1,594
23,329,152 35,128,040 206 1,594
23,329,152 35,128,040 206 1,594
Hoteling Boiler 3,228,000 4,860,584 28 221 3,300,000 4,968,999 29 226 3,300,000 4,968,999 29 226 3,300,000 4,968,999 29 226
Total Hoteling 26,048,152 39,222,194 230 1,780 26,629,152 40,097,039 235 1,820 26,629,152 40,097,039 235 1,820 26,629,152 40,097,039 235 1,820
Annual Total (lb/yr) 97,038,527 146,116,466 856 6,632 99,202,956 149,375,570 875 6,780 99,202,956 149,375,570 875 6,780 99,202,956 149,375,570 875 6,780
Annual Total (ton/yr) 73,058 0.4 3.3 74,688 0.4 3.4 74,688 0.4 3.4 74,688 0.4 3.4
San Pedro Waterfront Project EIS/EIR D4-32
Spacial Allocation Power Type
Year: 2011 Year: 2015 Year: 2022 Year: 2037
Activity (kWh/yr)
Greenhouse Gases (lb/yr) Activity (kWh/yr)
Greenhouse Gases (lb/yr) Activity (kWh/yr)
Greenhouse Gases (lb/yr) Activity (kWh/yr)
Greenhouse Gases (lb/yr) CO2
CH4 N2O CO2
CH4 N2O CO2
CH4 N2O CO2
CH4 N2O
Emissions = (Engine Power * Load Factor * Time * 2 (1-Way) Trips * Vessels per Year = Activity) * Emission Factor.
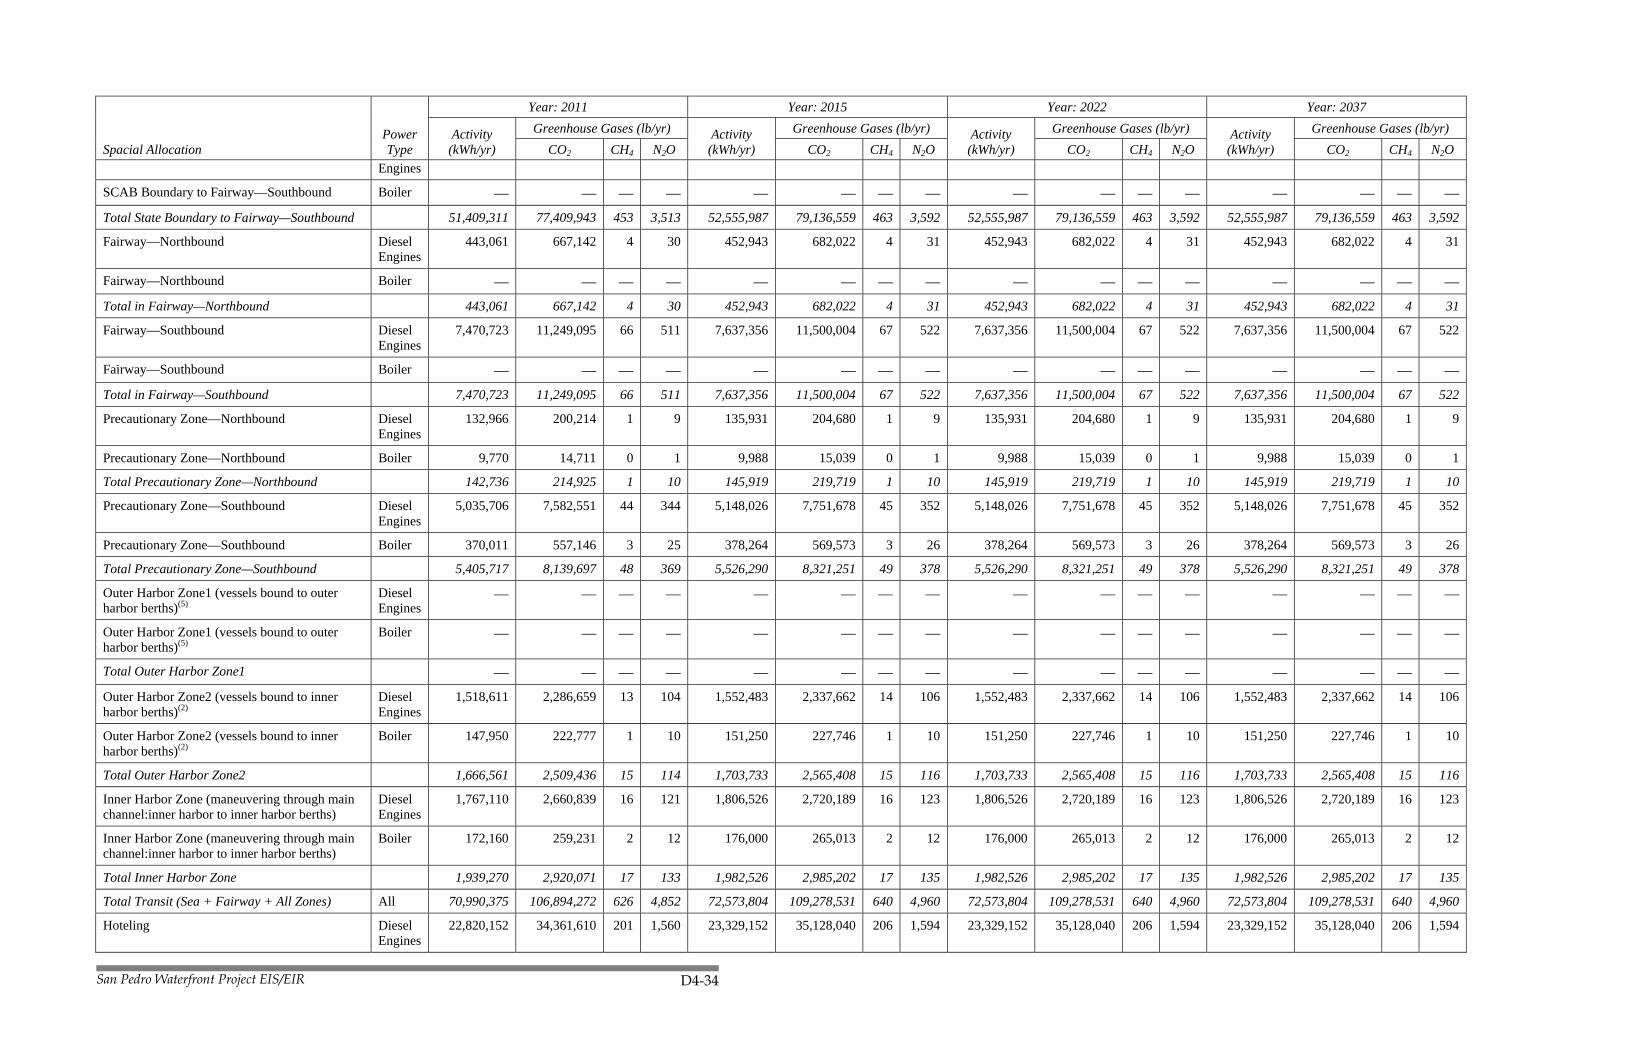
Table D4-16. Derivation of GHG Emissions for Marine Vessels—Alternative 5 Unmitigated
Spacial Allocation Power Type
Year: 2011 Year: 2015 Year: 2022 Year: 2037
Activity (kWh/yr)
Greenhouse Gases (lb/yr) Activity (kWh/yr)
Greenhouse Gases (lb/yr) Activity (kWh/yr)
Greenhouse Gases (lb/yr) Activity (kWh/yr)
Greenhouse Gases (lb/yr) CO2
CH4 N2O CO2
CH4 N2O CO2
CH4 N2O CO2
CH4 N2O
State Boundary to SCAB Boundary Diesel Engines
1,921,704 2,893,619 17 131 1,964,567 2,958,161 17 134 1,964,567 2,958,161 17 134 1,964,567 2,958,161 17 134
SCAB Boundary to Fairway—Northbound Diesel Engines
591,293 890,344 5 40 604,482 910,203 5 41 604,482 910,203 5 41 604,482 910,203 5 41
SCAB Boundary to Fairway—Northbound Boiler — — — — — — — — — — — — — — — —
Total State Boundary to Fairway—Northbound 2,512,997 3,783,964 22 172 2,569,049 3,868,365 23 176 2,569,049 3,868,365 23 176 2,569,049 3,868,365 23 176
State Boundary to SCAB Boundary Diesel Engines
26,439,074 39,810,828 233 1,807 27,028,794 40,698,802 238 1,847 27,028,794 40,698,802 238 1,847 27,028,794 40,698,802 238 1,847
SCAB Boundary to Fairway—Southbound Diesel Engines
24,970,237 37,599,115 220 1,707 25,527,194 38,437,757 225 1,745 25,527,194 38,437,757 225 1,745 25,527,194 38,437,757 225 1,745
SCAB Boundary to Fairway—Southbound Boiler — — — — — — — — — — — — — — — —
Total State Boundary to Fairway—Southbound 51,409,311 77,409,943 453 3,513 52,555,987 79,136,559 463 3,592 52,555,987 79,136,559 463 3,592 52,555,987 79,136,559 463 3,592
Fairway—Northbound Diesel Engines
443,061 667,142 4 30 452,943 682,022 4 31 452,943 682,022 4 31 452,943 682,022 4 31
Fairway—Northbound Boiler — — — — — — — — — — — — — — — —
Total in Fairway—Northbound 443,061 667,142 4 30 452,943 682,022 4 31 452,943 682,022 4 31 452,943 682,022 4 31
Fairway—Southbound Diesel Engines
7,470,723 11,249,095 66 511 7,637,356 11,500,004 67 522 7,637,356 11,500,004 67 522 7,637,356 11,500,004 67 522
Fairway—Southbound Boiler — — — — — — — — — — — — — — — —
Total in Fairway—Southbound 7,470,723 11,249,095 66 511 7,637,356 11,500,004 67 522 7,637,356 11,500,004 67 522 7,637,356 11,500,004 67 522
Precautionary Zone—Northbound Diesel Engines
132,966 200,214 1 9 135,931 204,680 1 9 135,931 204,680 1 9 135,931 204,680 1 9
Precautionary Zone—Northbound Boiler 9,770 14,711 0 1 9,988 15,039 0 1 9,988 15,039 0 1 9,988 15,039 0 1
Total Precautionary Zone—Northbound 142,736 214,925 1 10 145,919 219,719 1 10 145,919 219,719 1 10 145,919 219,719 1 10
Precautionary Zone—Southbound Diesel Engines
5,035,706 7,582,551 44 344 5,148,026 7,751,678 45 352 5,148,026 7,751,678 45 352 5,148,026 7,751,678 45 352
Precautionary Zone—Southbound Boiler 370,011 557,146 3 25 378,264 569,573 3 26 378,264 569,573 3 26 378,264 569,573 3 26
Total Precautionary Zone—Southbound 5,405,717 8,139,697 48 369 5,526,290 8,321,251 49 378 5,526,290 8,321,251 49 378 5,526,290 8,321,251 49 378
Outer Harbor Zone1 (vessels bound to outer Diesel — — — — — — — — — — — — — — — —

San Pedro Waterfront Project EIS/EIR D4-33
Spacial Allocation Power Type
Year: 2011 Year: 2015 Year: 2022 Year: 2037
Activity (kWh/yr)
Greenhouse Gases (lb/yr) Activity (kWh/yr)
Greenhouse Gases (lb/yr) Activity (kWh/yr)
Greenhouse Gases (lb/yr) Activity (kWh/yr)
Greenhouse Gases (lb/yr) CO2
CH4 N2O CO2
CH4 N2O CO2
CH4 N2O CO2
CH4 N2O
harbor berths)(5) Engines
Outer Harbor Zone1 (vessels bound to outer harbor berths)(5)
Boiler — — — — — — — — — — — — — — — —
Total Outer Harbor Zone1 — — — — — — — — — — — — — — — —
Outer Harbor Zone2 (vessels bound to inner harbor berths)(2)
Diesel Engines
1,518,611 2,286,659 13 104 1,552,483 2,337,662 14 106 1,552,483 2,337,662 14 106 1,552,483 2,337,662 14 106
Outer Harbor Zone2 (vessels bound to inner harbor berths)(2)
Boiler 147,950 222,777 1 10 151,250 227,746 1 10 151,250 227,746 1 10 151,250 227,746 1 10
Total Outer Harbor Zone2 1,666,561 2,509,436 15 114 1,703,733 2,565,408 15 116 1,703,733 2,565,408 15 116 1,703,733 2,565,408 15 116
Inner Harbor Zone (maneuvering through main channel:inner harbor to inner harbor berths)
Diesel Engines
1,767,110 2,660,839 16 121 1,806,526 2,720,189 16 123 1,806,526 2,720,189 16 123 1,806,526 2,720,189 16 123
Inner Harbor Zone (maneuvering through main channel:inner harbor to inner harbor berths)
Boiler 172,160 259,231 2 12 176,000 265,013 2 12 176,000 265,013 2 12 176,000 265,013 2 12
Total Inner Harbor Zone 1,939,270 2,920,071 17 133 1,982,526 2,985,202 17 135 1,982,526 2,985,202 17 135 1,982,526 2,985,202 17 135
Total Transit (Sea + Fairway + All Zones) All 70,990,375 106,894,272 626 4,852 72,573,804 109,278,531 640 4,960 72,573,804 109,278,531 640 4,960 72,573,804 109,278,531 640 4,960
Hoteling Diesel Engines
22,820,152 34,361,610 201 1,560 23,329,152 35,128,040 206 1,594 23,329,152 35,128,040 206 1,594 23,329,152 35,128,040 206 1,594
Hoteling Boiler 3,228,000 4,860,584 28 221 3,300,000 4,968,999 29 226 3,300,000 4,968,999 29 226 3,300,000 4,968,999 29 226
Total Hoteling 26,048,152 39,222,194 230 1,780 26,629,152 40,097,039 235 1,820 26,629,152 40,097,039 235 1,820 26,629,152 40,097,039 235 1,820
Annual Total (lb/yr) 97,038,527 146,116,466 856 6,632 99,202,956 149,375,570 875 6,780 99,202,956 149,375,570 875 6,780 99,202,956 149,375,570 875 6,780
Annual Total (ton/yr) 73,058 0.4 3.3 74,688 0.4 3.4 74,688 0.4 3.4 74,688 0.4 3.4
Emissions = (Engine Power * Load Factor * Time * 2 (1-Way) Trips * Vessels per Year = Activity) * Emission Factor.
Table D4-17. Derivation of GHG Emissions for Marine Vessels—Alternative 6
Spacial Allocation Power Type
Year: 2011 Year: 2015 Year: 2022 Year: 2037
Activity (kWh/yr)
Greenhouse Gases (lb/yr) Activity (kWh/yr)
Greenhouse Gases (lb/yr) Activity (kWh/yr)
Greenhouse Gases (lb/yr) Activity (kWh/yr)
Greenhouse Gases (lb/yr) CO2
CH4 N2O CO2
CH4 N2O CO2
CH4 N2O CO2
CH4 N2O
State Boundary to SCAB Boundary Diesel Engines
1,921,704 2,893,619 17 131 1,964,567 2,958,161 17 134 1,964,567 2,958,161 17 134 1,964,567 2,958,161 17 134
SCAB Boundary to Fairway—Northbound Diesel Engines
591,293 890,344 5 40 604,482 910,203 5 41 604,482 910,203 5 41 604,482 910,203 5 41
SCAB Boundary to Fairway—Northbound Boiler — — — — — — — — — — — — — — — —
Total State Boundary to Fairway—Northbound 2,512,997 3,783,964 22 172 2,569,049 3,868,365 23 176 2,569,049 3,868,365 23 176 2,569,049 3,868,365 23 176
State Boundary to SCAB Boundary Diesel Engines
26,439,074 39,810,828 233 1,807 27,028,794 40,698,802 238 1,847 27,028,794 40,698,802 238 1,847 27,028,794 40,698,802 238 1,847
SCAB Boundary to Fairway—Southbound Diesel 24,970,237 37,599,115 220 1,707 25,527,194 38,437,757 225 1,745 25,527,194 38,437,757 225 1,745 25,527,194 38,437,757 225 1,745
San Pedro Waterfront Project EIS/EIR D4-34
Spacial Allocation Power Type
Year: 2011 Year: 2015 Year: 2022 Year: 2037
Activity (kWh/yr)
Greenhouse Gases (lb/yr) Activity (kWh/yr)
Greenhouse Gases (lb/yr) Activity (kWh/yr)
Greenhouse Gases (lb/yr) Activity (kWh/yr)
Greenhouse Gases (lb/yr) CO2
CH4 N2O CO2
CH4 N2O CO2
CH4 N2O CO2
CH4 N2O
Engines
SCAB Boundary to Fairway—Southbound Boiler — — — — — — — — — — — — — — — —
Total State Boundary to Fairway—Southbound 51,409,311 77,409,943 453 3,513 52,555,987 79,136,559 463 3,592 52,555,987 79,136,559 463 3,592 52,555,987 79,136,559 463 3,592
Fairway—Northbound Diesel Engines
443,061 667,142 4 30 452,943 682,022 4 31 452,943 682,022 4 31 452,943 682,022 4 31
Fairway—Northbound Boiler — — — — — — — — — — — — — — — —
Total in Fairway—Northbound 443,061 667,142 4 30 452,943 682,022 4 31 452,943 682,022 4 31 452,943 682,022 4 31
Fairway—Southbound Diesel Engines
7,470,723 11,249,095 66 511 7,637,356 11,500,004 67 522 7,637,356 11,500,004 67 522 7,637,356 11,500,004 67 522
Fairway—Southbound Boiler — — — — — — — — — — — — — — — —
Total in Fairway—Southbound 7,470,723 11,249,095 66 511 7,637,356 11,500,004 67 522 7,637,356 11,500,004 67 522 7,637,356 11,500,004 67 522
Precautionary Zone—Northbound Diesel Engines
132,966 200,214 1 9 135,931 204,680 1 9 135,931 204,680 1 9 135,931 204,680 1 9
Precautionary Zone—Northbound Boiler 9,770 14,711 0 1 9,988 15,039 0 1 9,988 15,039 0 1 9,988 15,039 0 1
Total Precautionary Zone—Northbound 142,736 214,925 1 10 145,919 219,719 1 10 145,919 219,719 1 10 145,919 219,719 1 10
Precautionary Zone—Southbound Diesel Engines
5,035,706 7,582,551 44 344 5,148,026 7,751,678 45 352 5,148,026 7,751,678 45 352 5,148,026 7,751,678 45 352
Precautionary Zone—Southbound Boiler 370,011 557,146 3 25 378,264 569,573 3 26 378,264 569,573 3 26 378,264 569,573 3 26
Total Precautionary Zone—Southbound 5,405,717 8,139,697 48 369 5,526,290 8,321,251 49 378 5,526,290 8,321,251 49 378 5,526,290 8,321,251 49 378
Outer Harbor Zone1 (vessels bound to outer harbor berths)(5)
Diesel Engines
— — — — — — — — — — — — — — — —
Outer Harbor Zone1 (vessels bound to outer harbor berths)(5)
Boiler — — — — — — — — — — — — — — — —
Total Outer Harbor Zone1 — — — — — — — — — — — — — — — —
Outer Harbor Zone2 (vessels bound to inner harbor berths)(2)
Diesel Engines
1,518,611 2,286,659 13 104 1,552,483 2,337,662 14 106 1,552,483 2,337,662 14 106 1,552,483 2,337,662 14 106
Outer Harbor Zone2 (vessels bound to inner harbor berths)(2)
Boiler 147,950 222,777 1 10 151,250 227,746 1 10 151,250 227,746 1 10 151,250 227,746 1 10
Total Outer Harbor Zone2 1,666,561 2,509,436 15 114 1,703,733 2,565,408 15 116 1,703,733 2,565,408 15 116 1,703,733 2,565,408 15 116
Inner Harbor Zone (maneuvering through main channel:inner harbor to inner harbor berths)
Diesel Engines
1,767,110 2,660,839 16 121 1,806,526 2,720,189 16 123 1,806,526 2,720,189 16 123 1,806,526 2,720,189 16 123
Inner Harbor Zone (maneuvering through main channel:inner harbor to inner harbor berths)
Boiler 172,160 259,231 2 12 176,000 265,013 2 12 176,000 265,013 2 12 176,000 265,013 2 12
Total Inner Harbor Zone 1,939,270 2,920,071 17 133 1,982,526 2,985,202 17 135 1,982,526 2,985,202 17 135 1,982,526 2,985,202 17 135
Total Transit (Sea + Fairway + All Zones) All 70,990,375 106,894,272 626 4,852 72,573,804 109,278,531 640 4,960 72,573,804 109,278,531 640 4,960 72,573,804 109,278,531 640 4,960
Hoteling Diesel Engines
22,820,152 34,361,610 201 1,560 23,329,152 35,128,040 206 1,594 23,329,152 35,128,040 206 1,594 23,329,152 35,128,040 206 1,594

San Pedro Waterfront Project EIS/EIR D4-35
Spacial Allocation Power Type
Year: 2011 Year: 2015 Year: 2022 Year: 2037
Activity (kWh/yr)
Greenhouse Gases (lb/yr) Activity (kWh/yr)
Greenhouse Gases (lb/yr) Activity (kWh/yr)
Greenhouse Gases (lb/yr) Activity (kWh/yr)
Greenhouse Gases (lb/yr) CO2
CH4 N2O CO2
CH4 N2O CO2
CH4 N2O CO2
CH4 N2O
Hoteling Boiler 3,228,000 4,860,584 28 221 3,300,000 4,968,999 29 226 3,300,000 4,968,999 29 226 3,300,000 4,968,999 29 226
Total Hoteling 26,048,152 39,222,194 230 1,780 26,629,152 40,097,039 235 1,820 26,629,152 40,097,039 235 1,820 26,629,152 40,097,039 235 1,820
Annual Total (lb/yr) 97,038,527 146,116,466 856 6,632 99,202,956 149,375,570 875 6,780 99,202,956 149,375,570 875 6,780 99,202,956 149,375,570 875 6,780
Annual Total (ton/yr) 73,058 0.4 3.3 74,688 0.4 3.4 74,688 0.4 3.4 74,688 0.4 3.4
Emissions = (Engine Power * Load Factor * Time * 2 (1-Way) Trips * Vessels per Year = Activity) * Emission Factor.
Table D4-18. Derivation of GHG Emissions for Marine Vessels—Proposed Project with Mitigation
Spacial Allocation Power Type
Year: 2011 Year: 2015 Year: 2022 Year: 2037
Activity (kWh/yr)
Greenhouse Gases (lb/yr) Activity (kWh/yr)
Greenhouse Gases (lb/yr) Activity (kWh/yr)
Greenhouse Gases (lb/yr) Activity (kWh/yr)
Greenhouse Gases (lb/yr) CO2
CH4 N2O CO2
CH4 N2O CO2
CH4 N2O CO2
CH4 N2O
State Boundary to SCAB Boundary Diesel Engines 3,123,647 18 142 3,193,319 19 145 3,274,604 19 149 3,274,604 19 149
SCAB Boundary to Fairway—Northbound Diesel Engines 450,708 678,657 4 31 350,943 678,657 4 31 359,876 678,657 4 31 366,256 678,657 4 31
SCAB Boundary to Fairway—Northbound Boiler — — — — — — — — — — — — — — — —
Total State Boundary to Fairway—Northbound 450,708 3,802,304 22 173 350,943 3,871,977 23 176 359,876 3,953,261 23 179 366,256 3,953,261 23 179
State Boundary to SCAB Boundary Diesel Engines 42,975,579 252 1,951 43,934,142 257 1,994 45,052,466 264 2,045 45,851,268 269 2,081
SCAB Boundary to Fairway—Southbound Diesel Engines 19,033,349 28,659,604 168 1,301 14,820,250 28,659,604 168 1,301 15,197,493 28,659,604 168 1,301 15,466,952 28,659,604 168 1,301
SCAB Boundary to Fairway—Southbound Boiler — — — — — — — — — — — — — — — —
Total State Boundary to Fairway—Southbound 19,033,349 71,635,183 420 3,251 14,820,250 72,593,746 425 3,295 15,197,493 73,712,070 432 3,346 15,466,952 74,510,872 436 3,382
Fairway—Northbound Diesel Engines 296,969 447,164 3 20 420,360 447,164 3 20 431,060 447,164 3 20 438,703 447,164 3 20
Fairway—Northbound Boiler — — — — — — — — — — — — — — — —
Total in Fairway—Northbound 296,969 447,164 3 20 420,360 447,164 3 20 431,060 447,164 3 20 438,703 447,164 3 20
Fairway—Southbound Diesel Engines 5,007,383 7,539,904 44 342 7,087,946 7,539,904 44 342 7,268,366 7,539,904 44 342 7,397,238 7,539,904 44 342
Fairway—Southbound Boiler — — — — — — — — — — — — — — — —
Total in Fairway—Southbound 5,007,383 7,539,904 44 342 7,087,946 7,539,904 44 342 7,268,366 7,539,904 44 342 7,397,238 7,539,904 44 342
Precautionary Zone—Northbound Diesel Engines 102,168 153,841 1 7 144,619 153,841 1 7 148,300 153,841 1 7 150,930 153,841 1 7
Precautionary Zone—Northbound Boiler 7,056 10,625 0 0 9,988 10,625 0 0 10,242 10,625 0 0 10,424 10,625 0 0
Total Precautionary Zone—Northbound 109,224 164,465 1 7 154,607 164,465 1 7 158,543 164,465 1 7 161,354 164,465 1 7
Precautionary Zone—Southbound Diesel Engines 3,869,342 5,826,289 34 264 5,477,049 5,826,289 34 264 5,616,465 5,826,289 34 264 5,716,048 5,826,289 34 264
Precautionary Zone—Southbound Boiler 267,230 402,383 2 18 378,264 402,383 2 18 387,892 402,383 2 18 394,770 402,383 2 18
Total Precautionary Zone—Southbound 4,136,571 6,228,673 36 283 5,855,313 6,228,673 36 283 6,004,357 6,228,673 36 283 6,110,817 6,228,673 36 283
Outer Harbor Zone1 (vessels bound to outer harbor berths)(5)
Diesel Engines — — — — 651,535 — — — 668,120 — — — 679,966 — — —
Outer Harbor Zone1 (vessels bound to outer Boiler — — — — 60,500 — — — 62,040 — — — 63,140 — — —
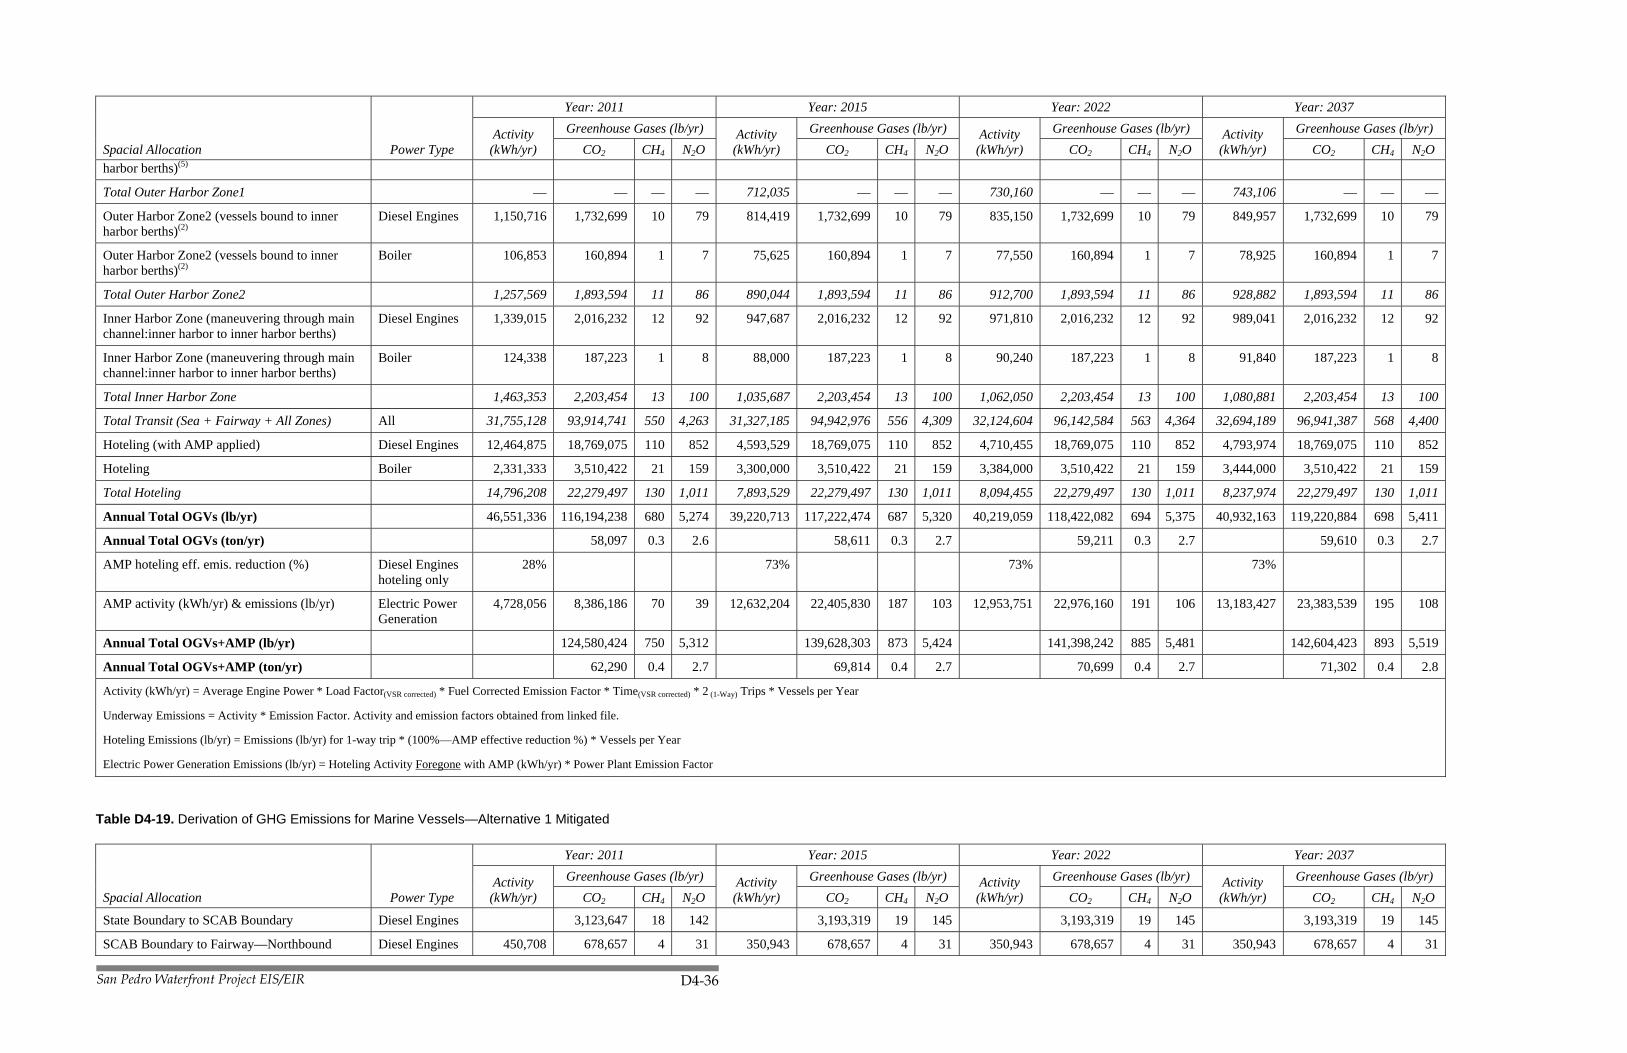
San Pedro Waterfront Project EIS/EIR D4-36
Spacial Allocation Power Type
Year: 2011 Year: 2015 Year: 2022 Year: 2037
Activity (kWh/yr)
Greenhouse Gases (lb/yr) Activity (kWh/yr)
Greenhouse Gases (lb/yr) Activity (kWh/yr)
Greenhouse Gases (lb/yr) Activity (kWh/yr)
Greenhouse Gases (lb/yr) CO2
CH4 N2O CO2
CH4 N2O CO2
CH4 N2O CO2
CH4 N2O
harbor berths)(5)
Total Outer Harbor Zone1 — — — — 712,035 — — — 730,160 — — — 743,106 — — —
Outer Harbor Zone2 (vessels bound to inner harbor berths)(2)
Diesel Engines 1,150,716 1,732,699 10 79 814,419 1,732,699 10 79 835,150 1,732,699 10 79 849,957 1,732,699 10 79
Outer Harbor Zone2 (vessels bound to inner harbor berths)(2)
Boiler 106,853 160,894 1 7 75,625 160,894 1 7 77,550 160,894 1 7 78,925 160,894 1 7
Total Outer Harbor Zone2 1,257,569 1,893,594 11 86 890,044 1,893,594 11 86 912,700 1,893,594 11 86 928,882 1,893,594 11 86
Inner Harbor Zone (maneuvering through main channel:inner harbor to inner harbor berths)
Diesel Engines 1,339,015 2,016,232 12 92 947,687 2,016,232 12 92 971,810 2,016,232 12 92 989,041 2,016,232 12 92
Inner Harbor Zone (maneuvering through main channel:inner harbor to inner harbor berths)
Boiler 124,338 187,223 1 8 88,000 187,223 1 8 90,240 187,223 1 8 91,840 187,223 1 8
Total Inner Harbor Zone 1,463,353 2,203,454 13 100 1,035,687 2,203,454 13 100 1,062,050 2,203,454 13 100 1,080,881 2,203,454 13 100
Total Transit (Sea + Fairway + All Zones) All 31,755,128 93,914,741 550 4,263 31,327,185 94,942,976 556 4,309 32,124,604 96,142,584 563 4,364 32,694,189 96,941,387 568 4,400
Hoteling (with AMP applied) Diesel Engines 12,464,875 18,769,075 110 852 4,593,529 18,769,075 110 852 4,710,455 18,769,075 110 852 4,793,974 18,769,075 110 852
Hoteling Boiler 2,331,333 3,510,422 21 159 3,300,000 3,510,422 21 159 3,384,000 3,510,422 21 159 3,444,000 3,510,422 21 159
Total Hoteling 14,796,208 22,279,497 130 1,011 7,893,529 22,279,497 130 1,011 8,094,455 22,279,497 130 1,011 8,237,974 22,279,497 130 1,011
Annual Total OGVs (lb/yr) 46,551,336 116,194,238 680 5,274 39,220,713 117,222,474 687 5,320 40,219,059 118,422,082 694 5,375 40,932,163 119,220,884 698 5,411
Annual Total OGVs (ton/yr) 58,097 0.3 2.6 58,611 0.3 2.7 59,211 0.3 2.7 59,610 0.3 2.7
AMP hoteling eff. emis. reduction (%) Diesel Engines hoteling only
28% 73% 73% 73%
AMP activity (kWh/yr) & emissions (lb/yr) Electric Power Generation
4,728,056 8,386,186 70 39 12,632,204 22,405,830 187 103 12,953,751 22,976,160 191 106 13,183,427 23,383,539 195 108
Annual Total OGVs+AMP (lb/yr) 124,580,424 750 5,312 139,628,303 873 5,424 141,398,242 885 5,481 142,604,423 893 5,519
Annual Total OGVs+AMP (ton/yr) 62,290 0.4 2.7 69,814 0.4 2.7 70,699 0.4 2.7 71,302 0.4 2.8
Activity (kWh/yr) = Average Engine Power * Load Factor(VSR corrected) * Fuel Corrected Emission Factor * Time(VSR corrected) * 2 (1-Way) Trips * Vessels per Year
Underway Emissions = Activity * Emission Factor. Activity and emission factors obtained from linked file.
Hoteling Emissions (lb/yr) = Emissions (lb/yr) for 1-way trip * (100%—AMP effective reduction %) * Vessels per Year
Electric Power Generation Emissions (lb/yr) = Hoteling Activity Foregone with AMP (kWh/yr) * Power Plant Emission Factor
Table D4-19. Derivation of GHG Emissions for Marine Vessels—Alternative 1 Mitigated
Spacial Allocation Power Type
Year: 2011 Year: 2015 Year: 2022 Year: 2037
Activity (kWh/yr)
Greenhouse Gases (lb/yr) Activity (kWh/yr)
Greenhouse Gases (lb/yr) Activity (kWh/yr)
Greenhouse Gases (lb/yr) Activity (kWh/yr)
Greenhouse Gases (lb/yr) CO2
CH4 N2O CO2
CH4 N2O CO2
CH4 N2O CO2
CH4 N2O
State Boundary to SCAB Boundary Diesel Engines 3,123,647 18 142 3,193,319 19 145 3,193,319 19 145 3,193,319 19 145
SCAB Boundary to Fairway—Northbound Diesel Engines 450,708 678,657 4 31 350,943 678,657 4 31 350,943 678,657 4 31 350,943 678,657 4 31

San Pedro Waterfront Project EIS/EIR D4-37
Spacial Allocation Power Type
Year: 2011 Year: 2015 Year: 2022 Year: 2037
Activity (kWh/yr)
Greenhouse Gases (lb/yr) Activity (kWh/yr)
Greenhouse Gases (lb/yr) Activity (kWh/yr)
Greenhouse Gases (lb/yr) Activity (kWh/yr)
Greenhouse Gases (lb/yr) CO2
CH4 N2O CO2
CH4 N2O CO2
CH4 N2O CO2
CH4 N2O
SCAB Boundary to Fairway—Northbound Boiler — — — — — — — — — — — — — — — —
Total State Boundary to Fairway—Northbound 450,708 3,802,304 22 173 350,943 3,871,977 23 176 350,943 3,871,977 23 176 350,943 3,871,977 23 176
State Boundary to SCAB Boundary Diesel Engines 42,975,579 252 1,951 43,934,142 257 1,994 43,934,142 257 1,994 43,934,142 257 1,994
SCAB Boundary to Fairway—Southbound Diesel Engines 19,033,349 28,659,604 168 1,301 14,820,250 28,659,604 168 1,301 14,820,250 28,659,604 168 1,301 14,820,250 28,659,604 168 1,301
SCAB Boundary to Fairway—Southbound Boiler — — — — — — — — — — — — — — — —
Total State Boundary to Fairway—Southbound 19,033,349 71,635,183 420 3,251 14,820,250 72,593,746 425 3,295 14,820,250 72,593,746 425 3,295 14,820,250 72,593,746 425 3,295
Fairway—Northbound Diesel Engines 296,969 447,164 3 20 420,360 447,164 3 20 420,360 447,164 3 20 420,360 447,164 3 20
Fairway—Northbound Boiler — — — — — — — — — — — — — — — —
Total in Fairway—Northbound 296,969 447,164 3 20 420,360 447,164 3 20 420,360 447,164 3 20 420,360 447,164 3 20
Fairway—Southbound Diesel Engines 5,007,383 7,539,904 44 342 7,087,946 7,539,904 44 342 7,087,946 7,539,904 44 342 7,087,946 7,539,904 44 342
Fairway—Southbound Boiler — — — — — — — — — — — — — — — —
Total in Fairway—Southbound 5,007,383 7,539,904 44 342 7,087,946 7,539,904 44 342 7,087,946 7,539,904 44 342 7,087,946 7,539,904 44 342
Precautionary Zone—Northbound Diesel Engines 102,168 153,841 1 7 144,619 153,841 1 7 144,619 153,841 1 7 144,619 153,841 1 7
Precautionary Zone—Northbound Boiler 7,056 10,625 0 0 9,988 10,625 0 0 9,988 10,625 0 0 9,988 10,625 0 0
Total Precautionary Zone—Northbound 109,224 164,465 1 7 154,607 164,465 1 7 154,607 164,465 1 7 154,607 164,465 1 7
Precautionary Zone—Southbound Diesel Engines 3,869,342 5,826,289 34 264 5,477,049 5,826,289 34 264 5,477,049 5,826,289 34 264 5,477,049 5,826,289 34 264
Precautionary Zone—Southbound Boiler 267,230 402,383 2 18 378,264 402,383 2 18 378,264 402,383 2 18 378,264 402,383 2 18
Total Precautionary Zone—Southbound 4,136,571 6,228,673 36 283 5,855,313 6,228,673 36 283 5,855,313 6,228,673 36 283 5,855,313 6,228,673 36 283
Outer Harbor Zone1 (vessels bound to outer harbor berths)(5)
Diesel Engines — — — — 434,357 — — — 434,357 — — — 434,357 — — —
Outer Harbor Zone1 (vessels bound to outer harbor berths)(5)
Boiler — — — — 40,333 — — — 40,333 — — — 40,333 — — —
Total Outer Harbor Zone1 — — — — 474,690 — — — 474,690 — — — 474,690 — — —
Outer Harbor Zone2 (vessels bound to inner harbor berths)(2)
Diesel Engines 1,150,716 1,732,699 10 79 1,085,892 1,732,699 10 79 1,085,892 1,732,699 10 79 1,085,892 1,732,699 10 79
Outer Harbor Zone2 (vessels bound to inner harbor berths)(2)
Boiler 106,853 160,894 1 7 100,833 160,894 1 7 100,833 160,894 1 7 100,833 160,894 1 7
Total Outer Harbor Zone2 1,257,569 1,893,594 11 86 1,186,725 1,893,594 11 86 1,186,725 1,893,594 11 86 1,186,725 1,893,594 11 86
Inner Harbor Zone (maneuvering through main channel:inner harbor to inner harbor berths)
Diesel Engines 1,339,015 2,016,232 12 92 1,263,583 2,016,232 12 92 1,263,583 2,016,232 12 92 1,263,583 2,016,232 12 92
Inner Harbor Zone (maneuvering through main channel:inner harbor to inner harbor berths)
Boiler 124,338 187,223 1 8 117,333 187,223 1 8 117,333 187,223 1 8 117,333 187,223 1 8
Total Inner Harbor Zone 1,463,353 2,203,454 13 100 1,380,917 2,203,454 13 100 1,380,917 2,203,454 13 100 1,380,917 2,203,454 13 100
Total Transit (Sea + Fairway + All Zones) All 31,755,128 93,914,741 550 4,263 31,731,750 94,942,976 556 4,309 31,731,750 94,942,976 556 4,309 31,731,750 94,942,976 556 4,309
Hoteling (with AMP applied) Diesel Engines 12,464,875 18,769,075 110 852 4,593,529 18,769,075 110 852 4,593,529 18,769,075 110 852 4,593,529 18,769,075 110 852
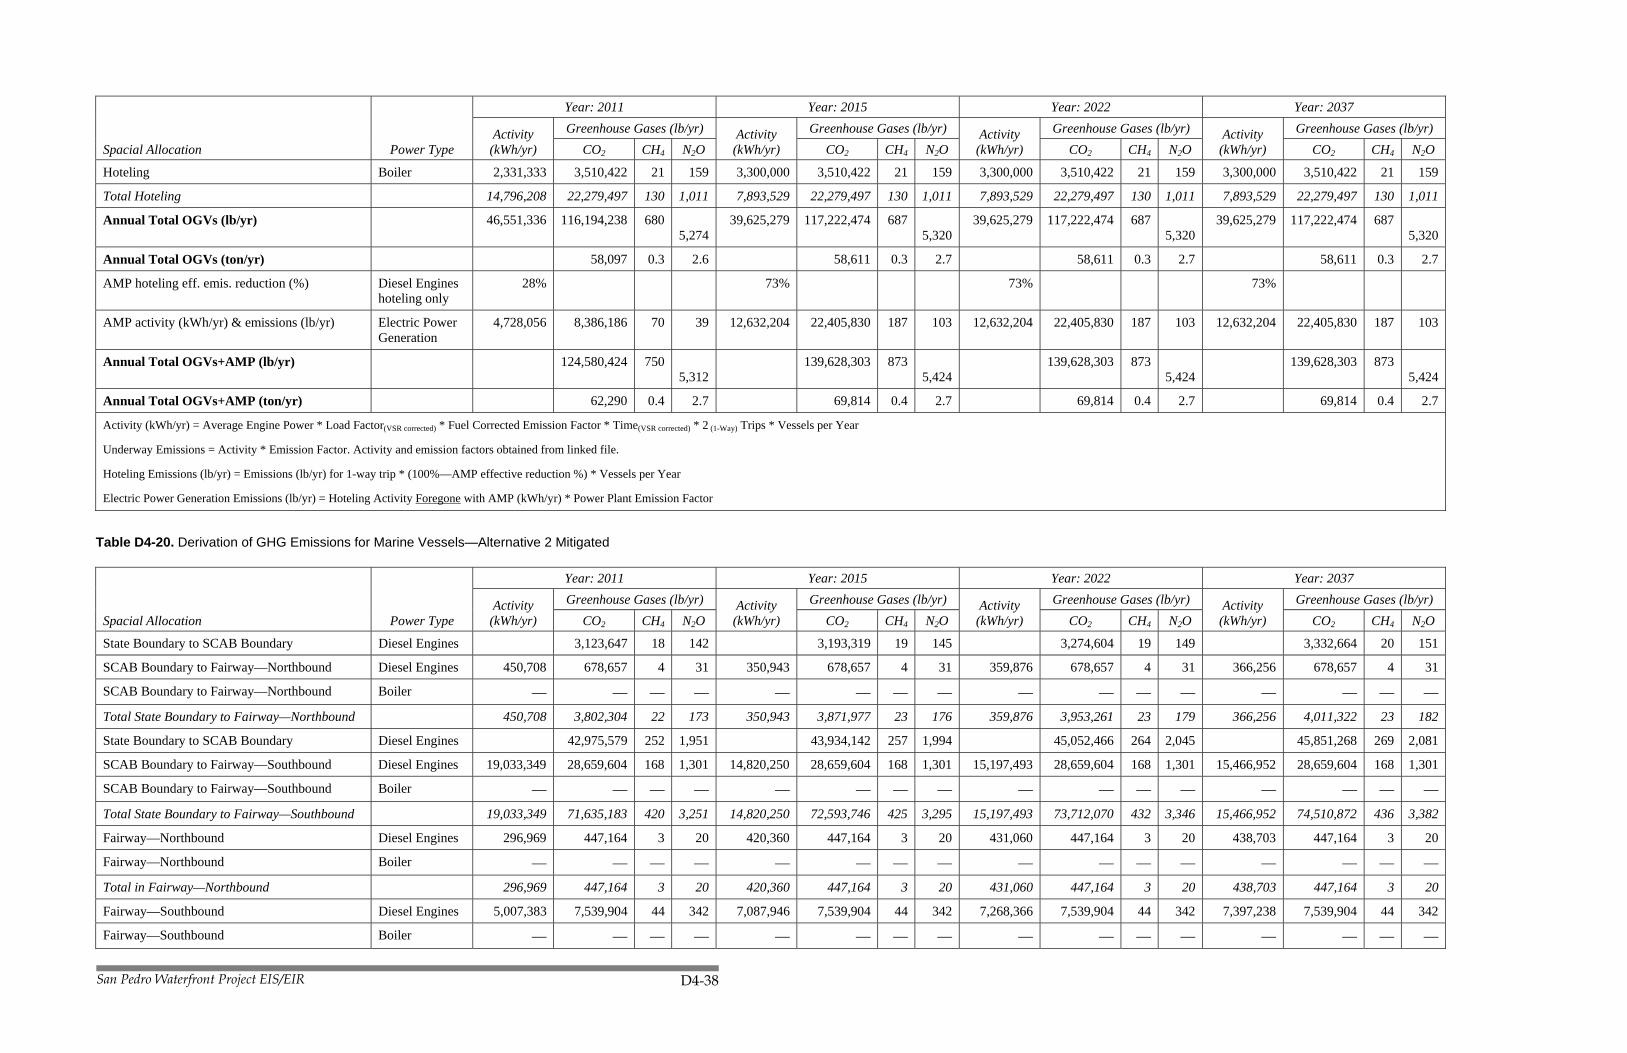
San Pedro Waterfront Project EIS/EIR D4-38
Spacial Allocation Power Type
Year: 2011 Year: 2015 Year: 2022 Year: 2037
Activity (kWh/yr)
Greenhouse Gases (lb/yr) Activity (kWh/yr)
Greenhouse Gases (lb/yr) Activity (kWh/yr)
Greenhouse Gases (lb/yr) Activity (kWh/yr)
Greenhouse Gases (lb/yr) CO2
CH4 N2O CO2
CH4 N2O CO2
CH4 N2O CO2
CH4 N2O
Hoteling Boiler 2,331,333 3,510,422 21 159 3,300,000 3,510,422 21 159 3,300,000 3,510,422 21 159 3,300,000 3,510,422 21 159
Total Hoteling 14,796,208 22,279,497 130 1,011 7,893,529 22,279,497 130 1,011 7,893,529 22,279,497 130 1,011 7,893,529 22,279,497 130 1,011
Annual Total OGVs (lb/yr) 46,551,336 116,194,238 680 5,274
39,625,279 117,222,474 687 5,320
39,625,279 117,222,474 687 5,320
39,625,279 117,222,474 687 5,320
Annual Total OGVs (ton/yr) 58,097 0.3 2.6 58,611 0.3 2.7 58,611 0.3 2.7 58,611 0.3 2.7
AMP hoteling eff. emis. reduction (%) Diesel Engines hoteling only
28% 73% 73% 73%
AMP activity (kWh/yr) & emissions (lb/yr) Electric Power Generation
4,728,056 8,386,186 70 39 12,632,204 22,405,830 187 103 12,632,204 22,405,830 187 103 12,632,204 22,405,830 187 103
Annual Total OGVs+AMP (lb/yr) 124,580,424 750 5,312
139,628,303 873 5,424
139,628,303 873 5,424
139,628,303 873 5,424
Annual Total OGVs+AMP (ton/yr) 62,290 0.4 2.7 69,814 0.4 2.7 69,814 0.4 2.7 69,814 0.4 2.7
Activity (kWh/yr) = Average Engine Power * Load Factor(VSR corrected) * Fuel Corrected Emission Factor * Time(VSR corrected) * 2 (1-Way) Trips * Vessels per Year
Underway Emissions = Activity * Emission Factor. Activity and emission factors obtained from linked file.
Hoteling Emissions (lb/yr) = Emissions (lb/yr) for 1-way trip * (100%—AMP effective reduction %) * Vessels per Year
Electric Power Generation Emissions (lb/yr) = Hoteling Activity Foregone with AMP (kWh/yr) * Power Plant Emission Factor
Table D4-20. Derivation of GHG Emissions for Marine Vessels—Alternative 2 Mitigated
Spacial Allocation Power Type
Year: 2011 Year: 2015 Year: 2022 Year: 2037
Activity (kWh/yr)
Greenhouse Gases (lb/yr) Activity (kWh/yr)
Greenhouse Gases (lb/yr) Activity (kWh/yr)
Greenhouse Gases (lb/yr) Activity (kWh/yr)
Greenhouse Gases (lb/yr) CO2
CH4 N2O CO2
CH4 N2O CO2
CH4 N2O CO2
CH4 N2O
State Boundary to SCAB Boundary Diesel Engines 3,123,647 18 142 3,193,319 19 145 3,274,604 19 149 3,332,664 20 151
SCAB Boundary to Fairway—Northbound Diesel Engines 450,708 678,657 4 31 350,943 678,657 4 31 359,876 678,657 4 31 366,256 678,657 4 31
SCAB Boundary to Fairway—Northbound Boiler — — — — — — — — — — — — — — — —
Total State Boundary to Fairway—Northbound 450,708 3,802,304 22 173 350,943 3,871,977 23 176 359,876 3,953,261 23 179 366,256 4,011,322 23 182
State Boundary to SCAB Boundary Diesel Engines 42,975,579 252 1,951 43,934,142 257 1,994 45,052,466 264 2,045 45,851,268 269 2,081
SCAB Boundary to Fairway—Southbound Diesel Engines 19,033,349 28,659,604 168 1,301 14,820,250 28,659,604 168 1,301 15,197,493 28,659,604 168 1,301 15,466,952 28,659,604 168 1,301
SCAB Boundary to Fairway—Southbound Boiler — — — — — — — — — — — — — — — —
Total State Boundary to Fairway—Southbound 19,033,349 71,635,183 420 3,251 14,820,250 72,593,746 425 3,295 15,197,493 73,712,070 432 3,346 15,466,952 74,510,872 436 3,382
Fairway—Northbound Diesel Engines 296,969 447,164 3 20 420,360 447,164 3 20 431,060 447,164 3 20 438,703 447,164 3 20
Fairway—Northbound Boiler — — — — — — — — — — — — — — — —
Total in Fairway—Northbound 296,969 447,164 3 20 420,360 447,164 3 20 431,060 447,164 3 20 438,703 447,164 3 20
Fairway—Southbound Diesel Engines 5,007,383 7,539,904 44 342 7,087,946 7,539,904 44 342 7,268,366 7,539,904 44 342 7,397,238 7,539,904 44 342
Fairway—Southbound Boiler — — — — — — — — — — — — — — — —

San Pedro Waterfront Project EIS/EIR D4-39
Spacial Allocation Power Type
Year: 2011 Year: 2015 Year: 2022 Year: 2037
Activity (kWh/yr)
Greenhouse Gases (lb/yr) Activity (kWh/yr)
Greenhouse Gases (lb/yr) Activity (kWh/yr)
Greenhouse Gases (lb/yr) Activity (kWh/yr)
Greenhouse Gases (lb/yr) CO2
CH4 N2O CO2
CH4 N2O CO2
CH4 N2O CO2
CH4 N2O
Total in Fairway—Southbound 5,007,383 7,539,904 44 342 7,087,946 7,539,904 44 342 7,268,366 7,539,904 44 342 7,397,238 7,539,904 44 342
Precautionary Zone—Northbound Diesel Engines 102,168 153,841 1 7 144,619 153,841 1 7 148,300 153,841 1 7 150,930 153,841 1 7
Precautionary Zone—Northbound Boiler 7,056 10,625 0 0 9,988 10,625 0 0 10,242 10,625 0 0 10,424 10,625 0 0
Total Precautionary Zone—Northbound 109,224 164,465 1 7 154,607 164,465 1 7 158,543 164,465 1 7 161,354 164,465 1 7
Precautionary Zone—Southbound Diesel Engines 3,869,342 5,826,289 34 264 5,477,049 5,826,289 34 264 5,616,465 5,826,289 34 264 5,716,048 5,826,289 34 264
Precautionary Zone—Southbound Boiler 267,230 402,383 2 18 378,264 402,383 2 18 387,892 402,383 2 18 394,770 402,383 2 18
Total Precautionary Zone—Southbound 4,136,571 6,228,673 36 283 5,855,313 6,228,673 36 283 6,004,357 6,228,673 36 283 6,110,817 6,228,673 36 283
Outer Harbor Zone1 (vessels bound to outer harbor berths)(5)
Diesel Engines — — — — 651,535 — — — 668,120 — — — 679,966 — — —
Outer Harbor Zone1 (vessels bound to outer harbor berths)(5)
Boiler — — — — 60,500 — — — 62,040 — — — 63,140 — — —
Total Outer Harbor Zone1 — — — — 712,035 — — — 730,160 — — — 743,106 — — —
Outer Harbor Zone2 (vessels bound to inner harbor berths)(2)
Diesel Engines 1,150,716 1,732,699 10 79 814,419 1,732,699 10 79 835,150 1,732,699 10 79 849,957 1,732,699 10 79
Outer Harbor Zone2 (vessels bound to inner harbor berths)(2)
Boiler 106,853 160,894 1 7 75,625 160,894 1 7 77,550 160,894 1 7 78,925 160,894 1 7
Total Outer Harbor Zone2 1,257,569 1,893,594 11 86 890,044 1,893,594 11 86 912,700 1,893,594 11 86 928,882 1,893,594 11 86
Inner Harbor Zone (maneuvering through main channel:inner harbor to inner harbor berths)
Diesel Engines 1,339,015 2,016,232 12 92 947,687 2,016,232 12 92 971,810 2,016,232 12 92 989,041 2,016,232 12 92
Inner Harbor Zone (maneuvering through main channel:inner harbor to inner harbor berths)
Boiler 124,338 187,223 1 8 88,000 187,223 1 8 90,240 187,223 1 8 91,840 187,223 1 8
Total Inner Harbor Zone 1,463,353 2,203,454 13 100 1,035,687 2,203,454 13 100 1,062,050 2,203,454 13 100 1,080,881 2,203,454 13 100
Total Transit (Sea + Fairway + All Zones) All 31,755,128 93,914,741 550 4,263 31,327,185 94,942,976 556 4,309 32,124,604 96,142,584 563 4,364 32,694,189 96,999,447 568 4,403
Hoteling (with AMP applied) Diesel Engines 12,464,875 18,769,075 110 852 4,593,529 18,769,075 110 852 4,710,455 18,769,075 110 852 4,793,974 18,769,075 110 852
Hoteling Boiler 2,331,333 3,510,422 21 159 3,300,000 3,510,422 21 159 3,384,000 3,510,422 21 159 3,444,000 3,510,422 21 159
Total Hoteling 14,796,208 22,279,497 130 1,011 7,893,529 22,279,497 130 1,011 8,094,455 22,279,497 130 1,011 8,237,974 22,279,497 130 1,011
Annual Total OGVs (lb/yr) 46,551,336 116,194,238 680 5,274
39,220,713 117,222,474 687 5,320
40,219,059 118,422,082 694 5,375
40,932,163 119,278,945 699 5,414
Annual Total OGVs (ton/yr) 58,097 0.3 2.6 58,611 0.3 2.7 59,211 0.3 2.7 59,639 0.3 2.7
AMP hoteling eff. emis. reduction (%) Diesel Engines hoteling only
28% 73% 73% 73%
AMP activity (kWh/yr) & emissions (lb/yr) Electric Power Generation
4,728,056 8,386,186 70 39 12,632,204 22,405,830 187 103 12,953,751 22,976,160 191 106 13,183,427 23,383,539 195 108
Annual Total OGVs+AMP (lb/yr) 124,580,424 750 5,312
139,628,303 873 5,424
141,398,242 885 5,481
142,662,483 893 5,521
Annual Total OGVs+AMP (ton/yr) 62,290 0.4 2.7 69,814 0.4 2.7 70,699 0.4 2.7 71,331 0.4 2.8

San Pedro Waterfront Project EIS/EIR D4-40
Spacial Allocation Power Type
Year: 2011 Year: 2015 Year: 2022 Year: 2037
Activity (kWh/yr)
Greenhouse Gases (lb/yr) Activity (kWh/yr)
Greenhouse Gases (lb/yr) Activity (kWh/yr)
Greenhouse Gases (lb/yr) Activity (kWh/yr)
Greenhouse Gases (lb/yr) CO2
CH4 N2O CO2
CH4 N2O CO2
CH4 N2O CO2
CH4 N2O
Activity (kWh/yr) = Average Engine Power * Load Factor(VSR corrected) * Fuel Corrected Emission Factor * Time(VSR corrected) * 2 (1-Way) Trips * Vessels per Year
Underway Emissions = Activity * Emission Factor. Activity and emission factors obtained from linked file.
Hoteling Emissions (lb/yr) = Emissions (lb/yr) for 1-way trip * (100%—AMP effective reduction %) * Vessels per Year
Electric Power Generation Emissions (lb/yr) = Hoteling Activity Foregone with AMP (kWh/yr) * Power Plant Emission Factor
Table D4-21. Derivation of GHG Emissions for Marine Vessels—Alternative 3 Mitigated
Spacial Allocation Power Type
Year: 2011 Year: 2015 Year: 2022 Year: 2037
Activity (kWh/yr)
Greenhouse Gases (lb/yr) Activity (kWh/yr)
Greenhouse Gases (lb/yr) Activity (kWh/yr)
Greenhouse Gases (lb/yr) Activity (kWh/yr)
Greenhouse Gases (lb/yr) CO2
CH4 N2O CO2
CH4 N2O CO2
CH4 N2O CO2
CH4 N2O
State Boundary to SCAB Boundary Diesel Engines 3,123,647 18 142 3,193,319 19 145 3,193,319 19 145 3,193,319 19 145
SCAB Boundary to Fairway—Northbound Diesel Engines 450,708 678,657 4 31 350,943 678,657 4 31 350,943 678,657 4 31 350,943 678,657 4 31
SCAB Boundary to Fairway—Northbound Boiler — — — — — — — — — — — — — — — —
Total State Boundary to Fairway—Northbound 450,708 3,802,304 22 173 350,943 3,871,977 23 176 350,943 3,871,977 23 176 350,943 3,871,977 23 176
State Boundary to SCAB Boundary Diesel Engines 42,975,579 252 1,951 43,934,142 257 1,994 43,934,142 257 1,994 43,934,142 257 1,994
SCAB Boundary to Fairway—Southbound Diesel Engines 19,033,349 28,659,604 168 1,301 14,820,250 28,659,604 168 1,301 14,820,250 28,659,604 168 1,301 14,820,250 28,659,604 168 1,301
SCAB Boundary to Fairway—Southbound Boiler — — — — — — — — — — — — — — — —
Total State Boundary to Fairway—Southbound 19,033,349 71,635,183 420 3,251 14,820,250 72,593,746 425 3,295 14,820,250 72,593,746 425 3,295 14,820,250 72,593,746 425 3,295
Fairway—Northbound Diesel Engines 296,969 447,164 3 20 420,360 447,164 3 20 420,360 447,164 3 20 420,360 447,164 3 20
Fairway—Northbound Boiler — — — — — — — — — — — — — — — —
Total in Fairway—Northbound 296,969 447,164 3 20 420,360 447,164 3 20 420,360 447,164 3 20 420,360 447,164 3 20
Fairway—Southbound Diesel Engines 5,007,383 7,539,904 44 342 7,087,946 7,539,904 44 342 7,087,946 7,539,904 44 342 7,087,946 7,539,904 44 342
Fairway—Southbound Boiler — — — — — — — — — — — — — — — —
Total in Fairway—Southbound 5,007,383 7,539,904 44 342 7,087,946 7,539,904 44 342 7,087,946 7,539,904 44 342 7,087,946 7,539,904 44 342
Precautionary Zone—Northbound Diesel Engines 102,168 153,841 1 7 144,619 153,841 1 7 144,619 153,841 1 7 144,619 153,841 1 7
Precautionary Zone—Northbound Boiler 7,056 10,625 0 0 9,988 10,625 0 0 9,988 10,625 0 0 9,988 10,625 0 0
Total Precautionary Zone—Northbound 109,224 164,465 1 7 154,607 164,465 1 7 154,607 164,465 1 7 154,607 164,465 1 7
Precautionary Zone—Southbound Diesel Engines 3,869,342 5,826,289 34 264 5,477,049 5,826,289 34 264 5,477,049 5,826,289 34 264 5,477,049 5,826,289 34 264
Precautionary Zone—Southbound Boiler 267,230 402,383 2 18 378,264 402,383 2 18 378,264 402,383 2 18 378,264 402,383 2 18
Total Precautionary Zone—Southbound 4,136,571 6,228,673 36 283 5,855,313 6,228,673 36 283 5,855,313 6,228,673 36 283 5,855,313 6,228,673 36 283
Outer Harbor Zone1 (vessels bound to outer harbor berths)(5)
Diesel Engines — — — — 434,357 — — — 434,357 — — — 434,357 — — —
Outer Harbor Zone1 (vessels bound to outer harbor berths)(5)
Boiler — — — — 40,333 — — — 40,333 — — — 40,333 — — —
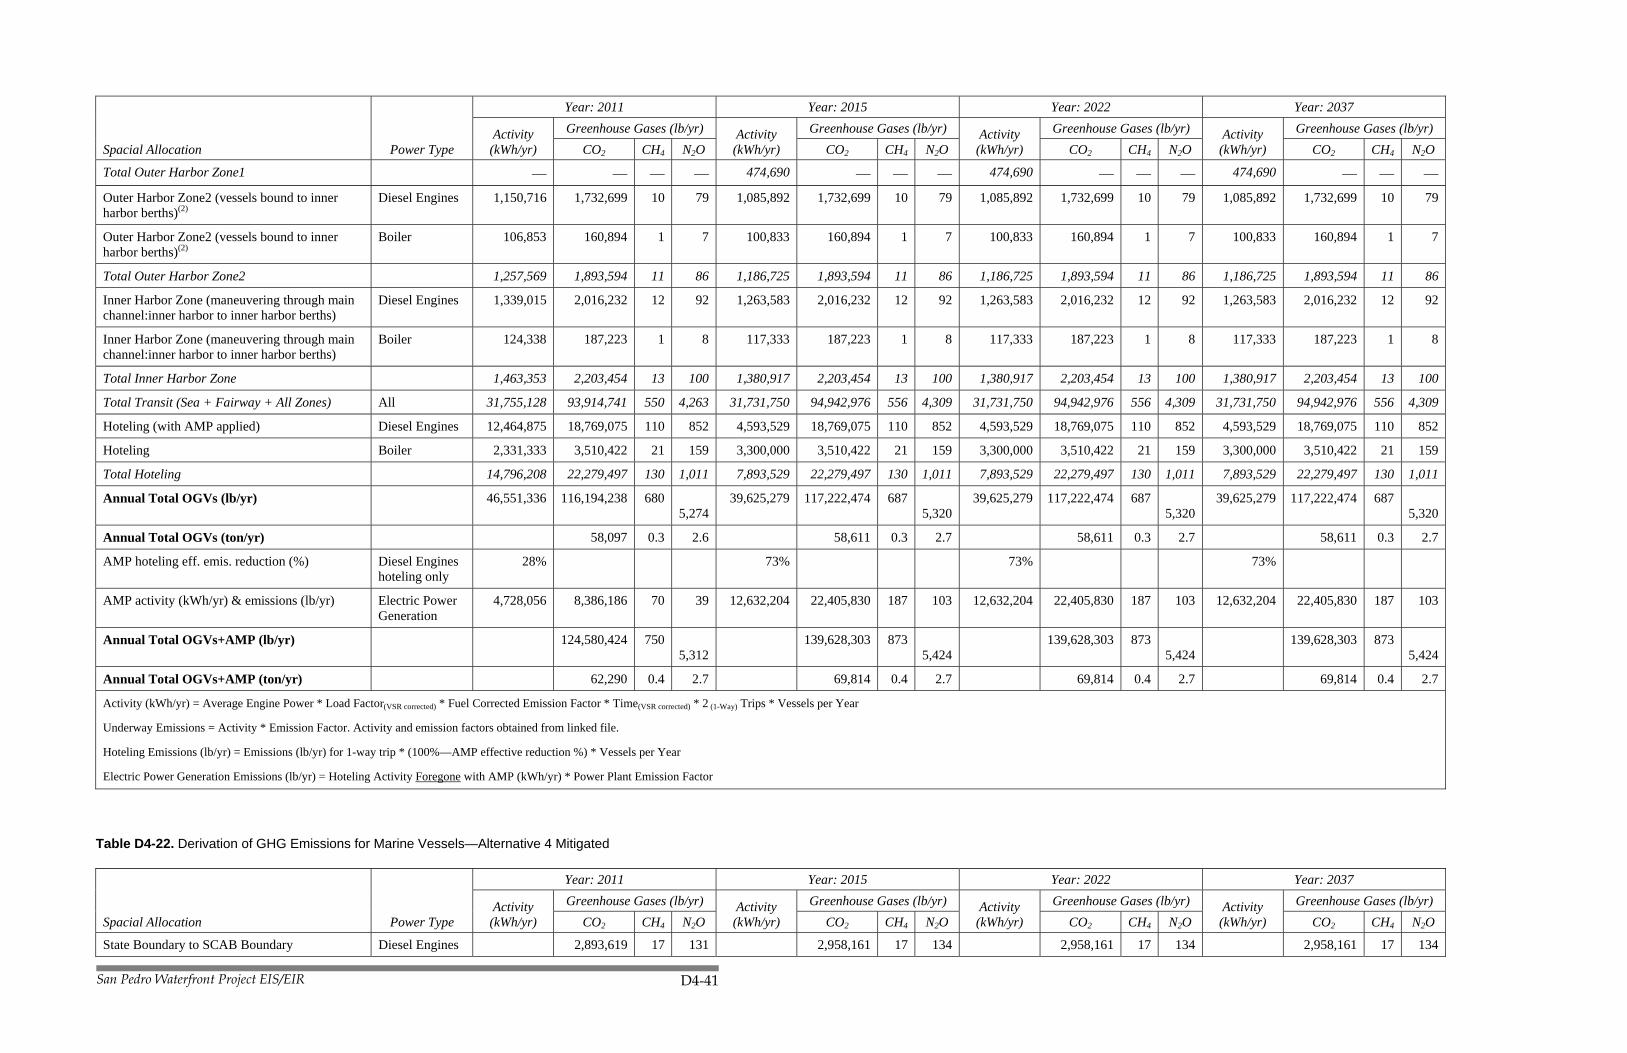
San Pedro Waterfront Project EIS/EIR D4-41
Spacial Allocation Power Type
Year: 2011 Year: 2015 Year: 2022 Year: 2037
Activity (kWh/yr)
Greenhouse Gases (lb/yr) Activity (kWh/yr)
Greenhouse Gases (lb/yr) Activity (kWh/yr)
Greenhouse Gases (lb/yr) Activity (kWh/yr)
Greenhouse Gases (lb/yr) CO2
CH4 N2O CO2
CH4 N2O CO2
CH4 N2O CO2
CH4 N2O
Total Outer Harbor Zone1 — — — — 474,690 — — — 474,690 — — — 474,690 — — —
Outer Harbor Zone2 (vessels bound to inner harbor berths)(2)
Diesel Engines 1,150,716 1,732,699 10 79 1,085,892 1,732,699 10 79 1,085,892 1,732,699 10 79 1,085,892 1,732,699 10 79
Outer Harbor Zone2 (vessels bound to inner harbor berths)(2)
Boiler 106,853 160,894 1 7 100,833 160,894 1 7 100,833 160,894 1 7 100,833 160,894 1 7
Total Outer Harbor Zone2 1,257,569 1,893,594 11 86 1,186,725 1,893,594 11 86 1,186,725 1,893,594 11 86 1,186,725 1,893,594 11 86
Inner Harbor Zone (maneuvering through main channel:inner harbor to inner harbor berths)
Diesel Engines 1,339,015 2,016,232 12 92 1,263,583 2,016,232 12 92 1,263,583 2,016,232 12 92 1,263,583 2,016,232 12 92
Inner Harbor Zone (maneuvering through main channel:inner harbor to inner harbor berths)
Boiler 124,338 187,223 1 8 117,333 187,223 1 8 117,333 187,223 1 8 117,333 187,223 1 8
Total Inner Harbor Zone 1,463,353 2,203,454 13 100 1,380,917 2,203,454 13 100 1,380,917 2,203,454 13 100 1,380,917 2,203,454 13 100
Total Transit (Sea + Fairway + All Zones) All 31,755,128 93,914,741 550 4,263 31,731,750 94,942,976 556 4,309 31,731,750 94,942,976 556 4,309 31,731,750 94,942,976 556 4,309
Hoteling (with AMP applied) Diesel Engines 12,464,875 18,769,075 110 852 4,593,529 18,769,075 110 852 4,593,529 18,769,075 110 852 4,593,529 18,769,075 110 852
Hoteling Boiler 2,331,333 3,510,422 21 159 3,300,000 3,510,422 21 159 3,300,000 3,510,422 21 159 3,300,000 3,510,422 21 159
Total Hoteling 14,796,208 22,279,497 130 1,011 7,893,529 22,279,497 130 1,011 7,893,529 22,279,497 130 1,011 7,893,529 22,279,497 130 1,011
Annual Total OGVs (lb/yr) 46,551,336 116,194,238 680 5,274
39,625,279 117,222,474 687 5,320
39,625,279 117,222,474 687 5,320
39,625,279 117,222,474 687 5,320
Annual Total OGVs (ton/yr) 58,097 0.3 2.6 58,611 0.3 2.7 58,611 0.3 2.7 58,611 0.3 2.7
AMP hoteling eff. emis. reduction (%) Diesel Engines hoteling only
28% 73% 73% 73%
AMP activity (kWh/yr) & emissions (lb/yr) Electric Power Generation
4,728,056 8,386,186 70 39 12,632,204 22,405,830 187 103 12,632,204 22,405,830 187 103 12,632,204 22,405,830 187 103
Annual Total OGVs+AMP (lb/yr) 124,580,424 750 5,312
139,628,303 873 5,424
139,628,303 873 5,424
139,628,303 873 5,424
Annual Total OGVs+AMP (ton/yr) 62,290 0.4 2.7 69,814 0.4 2.7 69,814 0.4 2.7 69,814 0.4 2.7
Activity (kWh/yr) = Average Engine Power * Load Factor(VSR corrected) * Fuel Corrected Emission Factor * Time(VSR corrected) * 2 (1-Way) Trips * Vessels per Year
Underway Emissions = Activity * Emission Factor. Activity and emission factors obtained from linked file.
Hoteling Emissions (lb/yr) = Emissions (lb/yr) for 1-way trip * (100%—AMP effective reduction %) * Vessels per Year
Electric Power Generation Emissions (lb/yr) = Hoteling Activity Foregone with AMP (kWh/yr) * Power Plant Emission Factor
Table D4-22. Derivation of GHG Emissions for Marine Vessels—Alternative 4 Mitigated
Spacial Allocation Power Type
Year: 2011 Year: 2015 Year: 2022 Year: 2037
Activity (kWh/yr)
Greenhouse Gases (lb/yr) Activity (kWh/yr)
Greenhouse Gases (lb/yr) Activity (kWh/yr)
Greenhouse Gases (lb/yr) Activity (kWh/yr)
Greenhouse Gases (lb/yr) CO2
CH4 N2O CO2
CH4 N2O CO2
CH4 N2O CO2
CH4 N2O
State Boundary to SCAB Boundary Diesel Engines 2,893,619 17 131 2,958,161 17 134 2,958,161 17 134 2,958,161 17 134
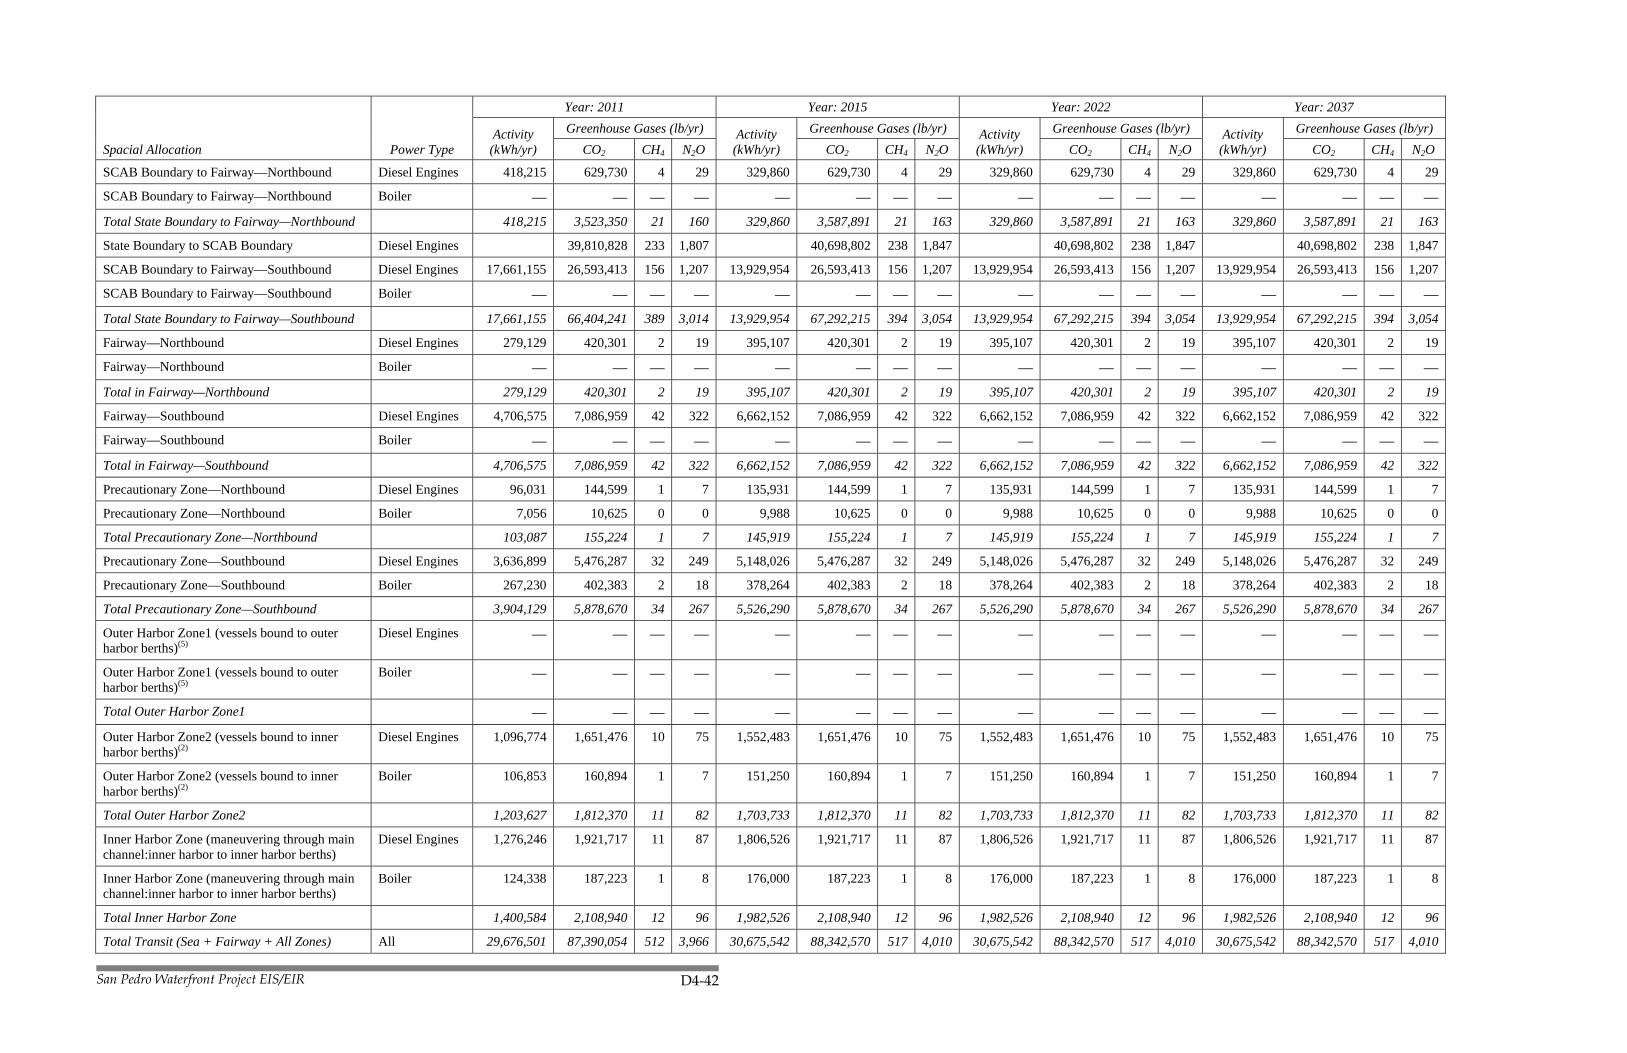
San Pedro Waterfront Project EIS/EIR D4-42
Spacial Allocation Power Type
Year: 2011 Year: 2015 Year: 2022 Year: 2037
Activity (kWh/yr)
Greenhouse Gases (lb/yr) Activity (kWh/yr)
Greenhouse Gases (lb/yr) Activity (kWh/yr)
Greenhouse Gases (lb/yr) Activity (kWh/yr)
Greenhouse Gases (lb/yr) CO2
CH4 N2O CO2
CH4 N2O CO2
CH4 N2O CO2
CH4 N2O
SCAB Boundary to Fairway—Northbound Diesel Engines 418,215 629,730 4 29 329,860 629,730 4 29 329,860 629,730 4 29 329,860 629,730 4 29
SCAB Boundary to Fairway—Northbound Boiler — — — — — — — — — — — — — — — —
Total State Boundary to Fairway—Northbound 418,215 3,523,350 21 160 329,860 3,587,891 21 163 329,860 3,587,891 21 163 329,860 3,587,891 21 163
State Boundary to SCAB Boundary Diesel Engines 39,810,828 233 1,807 40,698,802 238 1,847 40,698,802 238 1,847 40,698,802 238 1,847
SCAB Boundary to Fairway—Southbound Diesel Engines 17,661,155 26,593,413 156 1,207 13,929,954 26,593,413 156 1,207 13,929,954 26,593,413 156 1,207 13,929,954 26,593,413 156 1,207
SCAB Boundary to Fairway—Southbound Boiler — — — — — — — — — — — — — — — —
Total State Boundary to Fairway—Southbound 17,661,155 66,404,241 389 3,014 13,929,954 67,292,215 394 3,054 13,929,954 67,292,215 394 3,054 13,929,954 67,292,215 394 3,054
Fairway—Northbound Diesel Engines 279,129 420,301 2 19 395,107 420,301 2 19 395,107 420,301 2 19 395,107 420,301 2 19
Fairway—Northbound Boiler — — — — — — — — — — — — — — — —
Total in Fairway—Northbound 279,129 420,301 2 19 395,107 420,301 2 19 395,107 420,301 2 19 395,107 420,301 2 19
Fairway—Southbound Diesel Engines 4,706,575 7,086,959 42 322 6,662,152 7,086,959 42 322 6,662,152 7,086,959 42 322 6,662,152 7,086,959 42 322
Fairway—Southbound Boiler — — — — — — — — — — — — — — — —
Total in Fairway—Southbound 4,706,575 7,086,959 42 322 6,662,152 7,086,959 42 322 6,662,152 7,086,959 42 322 6,662,152 7,086,959 42 322
Precautionary Zone—Northbound Diesel Engines 96,031 144,599 1 7 135,931 144,599 1 7 135,931 144,599 1 7 135,931 144,599 1 7
Precautionary Zone—Northbound Boiler 7,056 10,625 0 0 9,988 10,625 0 0 9,988 10,625 0 0 9,988 10,625 0 0
Total Precautionary Zone—Northbound 103,087 155,224 1 7 145,919 155,224 1 7 145,919 155,224 1 7 145,919 155,224 1 7
Precautionary Zone—Southbound Diesel Engines 3,636,899 5,476,287 32 249 5,148,026 5,476,287 32 249 5,148,026 5,476,287 32 249 5,148,026 5,476,287 32 249
Precautionary Zone—Southbound Boiler 267,230 402,383 2 18 378,264 402,383 2 18 378,264 402,383 2 18 378,264 402,383 2 18
Total Precautionary Zone—Southbound 3,904,129 5,878,670 34 267 5,526,290 5,878,670 34 267 5,526,290 5,878,670 34 267 5,526,290 5,878,670 34 267
Outer Harbor Zone1 (vessels bound to outer harbor berths)(5)
Diesel Engines — — — — — — — — — — — — — — — —
Outer Harbor Zone1 (vessels bound to outer harbor berths)(5)
Boiler — — — — — — — — — — — — — — — —
Total Outer Harbor Zone1 — — — — — — — — — — — — — — — —
Outer Harbor Zone2 (vessels bound to inner harbor berths)(2)
Diesel Engines 1,096,774 1,651,476 10 75 1,552,483 1,651,476 10 75 1,552,483 1,651,476 10 75 1,552,483 1,651,476 10 75
Outer Harbor Zone2 (vessels bound to inner harbor berths)(2)
Boiler 106,853 160,894 1 7 151,250 160,894 1 7 151,250 160,894 1 7 151,250 160,894 1 7
Total Outer Harbor Zone2 1,203,627 1,812,370 11 82 1,703,733 1,812,370 11 82 1,703,733 1,812,370 11 82 1,703,733 1,812,370 11 82
Inner Harbor Zone (maneuvering through main channel:inner harbor to inner harbor berths)
Diesel Engines 1,276,246 1,921,717 11 87 1,806,526 1,921,717 11 87 1,806,526 1,921,717 11 87 1,806,526 1,921,717 11 87
Inner Harbor Zone (maneuvering through main channel:inner harbor to inner harbor berths)
Boiler 124,338 187,223 1 8 176,000 187,223 1 8 176,000 187,223 1 8 176,000 187,223 1 8
Total Inner Harbor Zone 1,400,584 2,108,940 12 96 1,982,526 2,108,940 12 96 1,982,526 2,108,940 12 96 1,982,526 2,108,940 12 96
Total Transit (Sea + Fairway + All Zones) All 29,676,501 87,390,054 512 3,966 30,675,542 88,342,570 517 4,010 30,675,542 88,342,570 517 4,010 30,675,542 88,342,570 517 4,010

San Pedro Waterfront Project EIS/EIR D4-43
Spacial Allocation Power Type
Year: 2011 Year: 2015 Year: 2022 Year: 2037
Activity (kWh/yr)
Greenhouse Gases (lb/yr) Activity (kWh/yr)
Greenhouse Gases (lb/yr) Activity (kWh/yr)
Greenhouse Gases (lb/yr) Activity (kWh/yr)
Greenhouse Gases (lb/yr) CO2
CH4 N2O CO2
CH4 N2O CO2
CH4 N2O CO2
CH4 N2O
Hoteling (with AMP applied) Diesel Engines 11,948,885 17,992,121 105 817 6,221,107 17,992,121 105 817 6,221,107 17,992,121 105 817 6,221,107 17,992,121 105 817
Hoteling Boiler 2,331,333 3,510,422 21 159 3,300,000 3,510,422 21 159 3,300,000 3,510,422 21 159 3,300,000 3,510,422 21 159
Total Hoteling 14,280,219 21,502,543 126 976 9,521,107 21,502,543 126 976 9,521,107 21,502,543 126 976 9,521,107 21,502,543 126 976
Annual Total OGVs (lb/yr) 43,956,720 108,892,597 638 4,942
40,196,649 109,845,113 643 4,986
40,196,649 109,845,113 643 4,986
40,196,649 109,845,113 643 4,986
Annual Total OGVs (ton/yr) 54,446 0.3 2.5 54,923 0.3 2.5 54,923 0.3 2.5 54,923 0.3 2.5
AMP hoteling eff. emis. reduction (%) Diesel Engines hoteling only
28% 73% 73% 73%
AMP activity (kWh/yr) & emissions (lb/yr) Electric Power Generation
4,532,336 8,039,036 67 37 17,108,045 30,344,660 253 140 17,108,045 30,344,660 253 140 17,108,045 30,344,660 253 140
Annual Total OGVs+AMP (lb/yr) 116,931,633 705 4,979
140,189,773 896 5,125
140,189,773 896 5,125
140,189,773 896 5,125
Annual Total OGVs+AMP (ton/yr) 58,466 0.4 2.5 70,095 0.4 2.6 70,095 0.4 2.6 70,095 0.4 2.6
Activity (kWh/yr) = Average Engine Power * Load Factor(VSR corrected) * Fuel Corrected Emission Factor * Time(VSR corrected) * 2 (1-Way) Trips * Vessels per Year
Underway Emissions = Activity * Emission Factor. Activity and emission factors obtained from linked file.
Hoteling Emissions (lb/yr) = Emissions (lb/yr) for 1-way trip * (100%—AMP effective reduction %) * Vessels per Year
Electric Power Generation Emissions (lb/yr) = Hoteling Activity Foregone with AMP (kWh/yr) * Power Plant Emission Factor
Table D4-23. Derivation of GHG Emissions for Marine Vessels—Alternative 5 Mitigated
Spacial Allocation Power Type
Year: 2011 Year: 2015 Year: 2022 Year: 2037
Activity (kWh/yr)
Greenhouse Gases (lb/yr) Activity (kWh/yr)
Greenhouse Gases (lb/yr) Activity (kWh/yr)
Greenhouse Gases (lb/yr) Activity (kWh/yr)
Greenhouse Gases (lb/yr) CO2
CH4 N2O CO2
CH4 N2O CO2
CH4 N2O CO2
CH4 N2O
State Boundary to SCAB Boundary Diesel Engines 2,893,619 17 131 2,958,161 17 134 2,958,161 17 134 2,958,161 17 134
SCAB Boundary to Fairway—Northbound Diesel Engines 418,215 629,730 4 29 329,860 629,730 4 29 329,860 629,730 4 29 329,860 629,730 4 29
SCAB Boundary to Fairway—Northbound Boiler — — — — — — — — — — — — — — — —
Total State Boundary to Fairway—Northbound 418,215 3,523,350 21 160 329,860 3,587,891 21 163 329,860 3,587,891 21 163 329,860 3,587,891 21 163
State Boundary to SCAB Boundary Diesel Engines 39,810,828 233 1,807 40,698,802 238 1,847 40,698,802 238 1,847 40,698,802 238 1,847
SCAB Boundary to Fairway—Southbound Diesel Engines 17,661,155 26,593,413 156 1,207 13,929,954 26,593,413 156 1,207 13,929,954 26,593,413 156 1,207 13,929,954 26,593,413 156 1,207
SCAB Boundary to Fairway—Southbound Boiler — — — — — — — — — — — — — — — —
Total State Boundary to Fairway—Southbound 17,661,155 66,404,241 389 3,014 13,929,954 67,292,215 394 3,054 13,929,954 67,292,215 394 3,054 13,929,954 67,292,215 394 3,054
Fairway—Northbound Diesel Engines 279,129 420,301 2 19 395,107 420,301 2 19 395,107 420,301 2 19 395,107 420,301 2 19
Fairway—Northbound Boiler — — — — — — — — — — — — — — — —
Total in Fairway—Northbound 279,129 420,301 2 19 395,107 420,301 2 19 395,107 420,301 2 19 395,107 420,301 2 19
Fairway—Southbound Diesel Engines 4,706,575 7,086,959 42 322 6,662,152 7,086,959 42 322 6,662,152 7,086,959 42 322 6,662,152 7,086,959 42 322
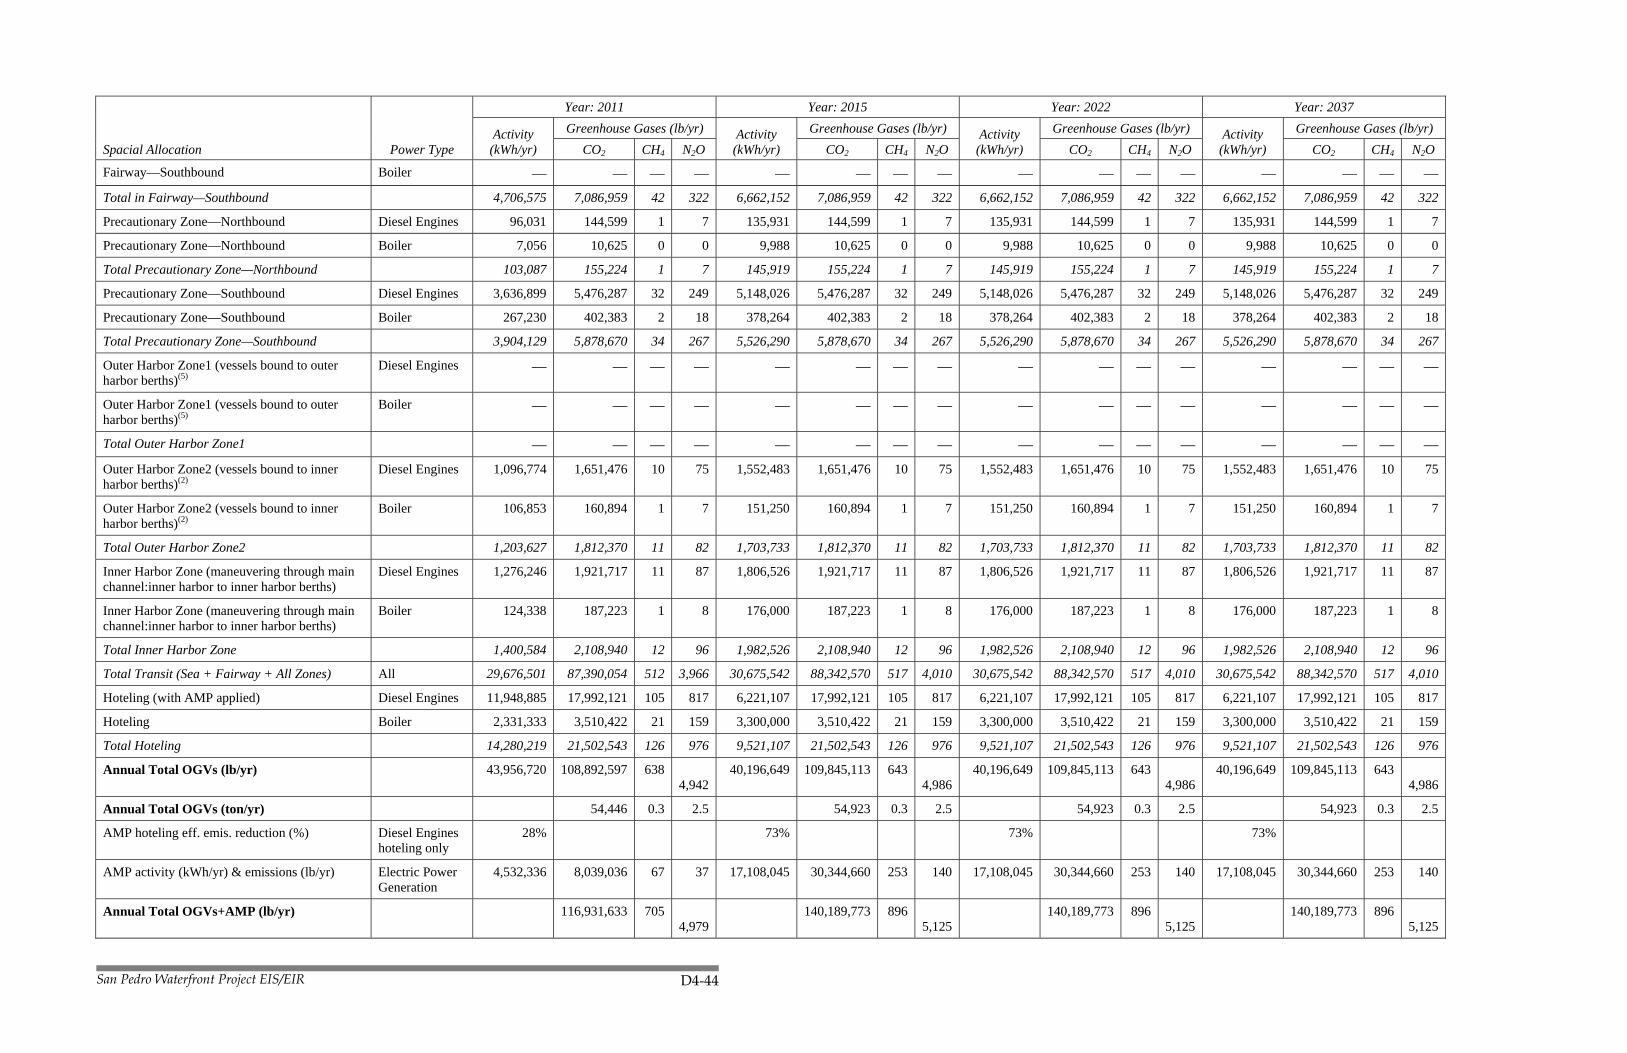
San Pedro Waterfront Project EIS/EIR D4-44
Spacial Allocation Power Type
Year: 2011 Year: 2015 Year: 2022 Year: 2037
Activity (kWh/yr)
Greenhouse Gases (lb/yr) Activity (kWh/yr)
Greenhouse Gases (lb/yr) Activity (kWh/yr)
Greenhouse Gases (lb/yr) Activity (kWh/yr)
Greenhouse Gases (lb/yr) CO2
CH4 N2O CO2
CH4 N2O CO2
CH4 N2O CO2
CH4 N2O
Fairway—Southbound Boiler — — — — — — — — — — — — — — — —
Total in Fairway—Southbound 4,706,575 7,086,959 42 322 6,662,152 7,086,959 42 322 6,662,152 7,086,959 42 322 6,662,152 7,086,959 42 322
Precautionary Zone—Northbound Diesel Engines 96,031 144,599 1 7 135,931 144,599 1 7 135,931 144,599 1 7 135,931 144,599 1 7
Precautionary Zone—Northbound Boiler 7,056 10,625 0 0 9,988 10,625 0 0 9,988 10,625 0 0 9,988 10,625 0 0
Total Precautionary Zone—Northbound 103,087 155,224 1 7 145,919 155,224 1 7 145,919 155,224 1 7 145,919 155,224 1 7
Precautionary Zone—Southbound Diesel Engines 3,636,899 5,476,287 32 249 5,148,026 5,476,287 32 249 5,148,026 5,476,287 32 249 5,148,026 5,476,287 32 249
Precautionary Zone—Southbound Boiler 267,230 402,383 2 18 378,264 402,383 2 18 378,264 402,383 2 18 378,264 402,383 2 18
Total Precautionary Zone—Southbound 3,904,129 5,878,670 34 267 5,526,290 5,878,670 34 267 5,526,290 5,878,670 34 267 5,526,290 5,878,670 34 267
Outer Harbor Zone1 (vessels bound to outer harbor berths)(5)
Diesel Engines — — — — — — — — — — — — — — — —
Outer Harbor Zone1 (vessels bound to outer harbor berths)(5)
Boiler — — — — — — — — — — — — — — — —
Total Outer Harbor Zone1 — — — — — — — — — — — — — — — —
Outer Harbor Zone2 (vessels bound to inner harbor berths)(2)
Diesel Engines 1,096,774 1,651,476 10 75 1,552,483 1,651,476 10 75 1,552,483 1,651,476 10 75 1,552,483 1,651,476 10 75
Outer Harbor Zone2 (vessels bound to inner harbor berths)(2)
Boiler 106,853 160,894 1 7 151,250 160,894 1 7 151,250 160,894 1 7 151,250 160,894 1 7
Total Outer Harbor Zone2 1,203,627 1,812,370 11 82 1,703,733 1,812,370 11 82 1,703,733 1,812,370 11 82 1,703,733 1,812,370 11 82
Inner Harbor Zone (maneuvering through main channel:inner harbor to inner harbor berths)
Diesel Engines 1,276,246 1,921,717 11 87 1,806,526 1,921,717 11 87 1,806,526 1,921,717 11 87 1,806,526 1,921,717 11 87
Inner Harbor Zone (maneuvering through main channel:inner harbor to inner harbor berths)
Boiler 124,338 187,223 1 8 176,000 187,223 1 8 176,000 187,223 1 8 176,000 187,223 1 8
Total Inner Harbor Zone 1,400,584 2,108,940 12 96 1,982,526 2,108,940 12 96 1,982,526 2,108,940 12 96 1,982,526 2,108,940 12 96
Total Transit (Sea + Fairway + All Zones) All 29,676,501 87,390,054 512 3,966 30,675,542 88,342,570 517 4,010 30,675,542 88,342,570 517 4,010 30,675,542 88,342,570 517 4,010
Hoteling (with AMP applied) Diesel Engines 11,948,885 17,992,121 105 817 6,221,107 17,992,121 105 817 6,221,107 17,992,121 105 817 6,221,107 17,992,121 105 817
Hoteling Boiler 2,331,333 3,510,422 21 159 3,300,000 3,510,422 21 159 3,300,000 3,510,422 21 159 3,300,000 3,510,422 21 159
Total Hoteling 14,280,219 21,502,543 126 976 9,521,107 21,502,543 126 976 9,521,107 21,502,543 126 976 9,521,107 21,502,543 126 976
Annual Total OGVs (lb/yr) 43,956,720 108,892,597 638 4,942
40,196,649 109,845,113 643 4,986
40,196,649 109,845,113 643 4,986
40,196,649 109,845,113 643 4,986
Annual Total OGVs (ton/yr) 54,446 0.3 2.5 54,923 0.3 2.5 54,923 0.3 2.5 54,923 0.3 2.5
AMP hoteling eff. emis. reduction (%) Diesel Engines hoteling only
28% 73% 73% 73%
AMP activity (kWh/yr) & emissions (lb/yr) Electric Power Generation
4,532,336 8,039,036 67 37 17,108,045 30,344,660 253 140 17,108,045 30,344,660 253 140 17,108,045 30,344,660 253 140
Annual Total OGVs+AMP (lb/yr) 116,931,633 705 4,979
140,189,773 896 5,125
140,189,773 896 5,125
140,189,773 896 5,125

San Pedro Waterfront Project EIS/EIR D4-45
Spacial Allocation Power Type
Year: 2011 Year: 2015 Year: 2022 Year: 2037
Activity (kWh/yr)
Greenhouse Gases (lb/yr) Activity (kWh/yr)
Greenhouse Gases (lb/yr) Activity (kWh/yr)
Greenhouse Gases (lb/yr) Activity (kWh/yr)
Greenhouse Gases (lb/yr) CO2
CH4 N2O CO2
CH4 N2O CO2
CH4 N2O CO2
CH4 N2O
Annual Total OGVs+AMP (ton/yr) 58,466 0.4 2.5 70,095 0.4 2.6 70,095 0.4 2.6 70,095 0.4 2.6
Activity (kWh/yr) = Average Engine Power * Load Factor(VSR corrected) * Fuel Corrected Emission Factor * Time(VSR corrected) * 2 (1-Way) Trips * Vessels per Year
Underway Emissions = Activity * Emission Factor. Activity and emission factors obtained from linked file.
Hoteling Emissions (lb/yr) = Emissions (lb/yr) for 1-way trip * (100%—AMP effective reduction %) * Vessels per Year
Electric Power Generation Emissions (lb/yr) = Hoteling Activity Foregone with AMP (kWh/yr) * Power Plant Emission Factor
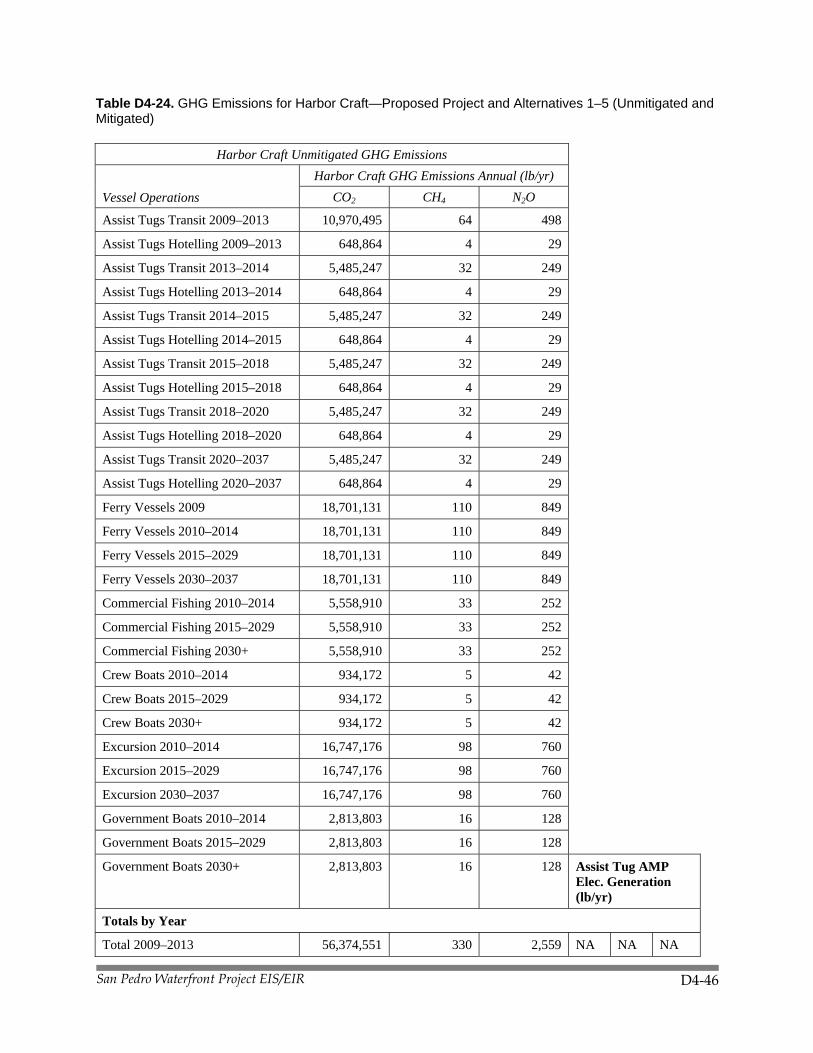
San Pedro Waterfront Project EIS/EIR D4-46
Table D4-24. GHG Emissions for Harbor Craft—Proposed Project and Alternatives 1–5 (Unmitigated and Mitigated)
Harbor Craft Unmitigated GHG Emissions
Vessel Operations Harbor Craft GHG Emissions Annual (lb/yr)
CO2 CH4 N2O
Assist Tugs Transit 2009–2013 10,970,495 64 498
Assist Tugs Hotelling 2009–2013 648,864 4 29
Assist Tugs Transit 2013–2014 5,485,247 32 249
Assist Tugs Hotelling 2013–2014 648,864 4 29
Assist Tugs Transit 2014–2015 5,485,247 32 249
Assist Tugs Hotelling 2014–2015 648,864 4 29
Assist Tugs Transit 2015–2018 5,485,247 32 249
Assist Tugs Hotelling 2015–2018 648,864 4 29
Assist Tugs Transit 2018–2020 5,485,247 32 249
Assist Tugs Hotelling 2018–2020 648,864 4 29
Assist Tugs Transit 2020–2037 5,485,247 32 249
Assist Tugs Hotelling 2020–2037 648,864 4 29
Ferry Vessels 2009 18,701,131 110 849
Ferry Vessels 2010–2014 18,701,131 110 849
Ferry Vessels 2015–2029 18,701,131 110 849
Ferry Vessels 2030–2037 18,701,131 110 849
Commercial Fishing 2010–2014 5,558,910 33 252
Commercial Fishing 2015–2029 5,558,910 33 252
Commercial Fishing 2030+ 5,558,910 33 252
Crew Boats 2010–2014 934,172 5 42
Crew Boats 2015–2029 934,172 5 42
Crew Boats 2030+ 934,172 5 42
Excursion 2010–2014 16,747,176 98 760
Excursion 2015–2029 16,747,176 98 760
Excursion 2030–2037 16,747,176 98 760
Government Boats 2010–2014 2,813,803 16 128
Government Boats 2015–2029 2,813,803 16 128
Government Boats 2030+ 2,813,803 16 128 Assist Tug AMP Elec. Generation (lb/yr)
Totals by Year
Total 2009–2013 56,374,551 330 2,559 NA NA NA
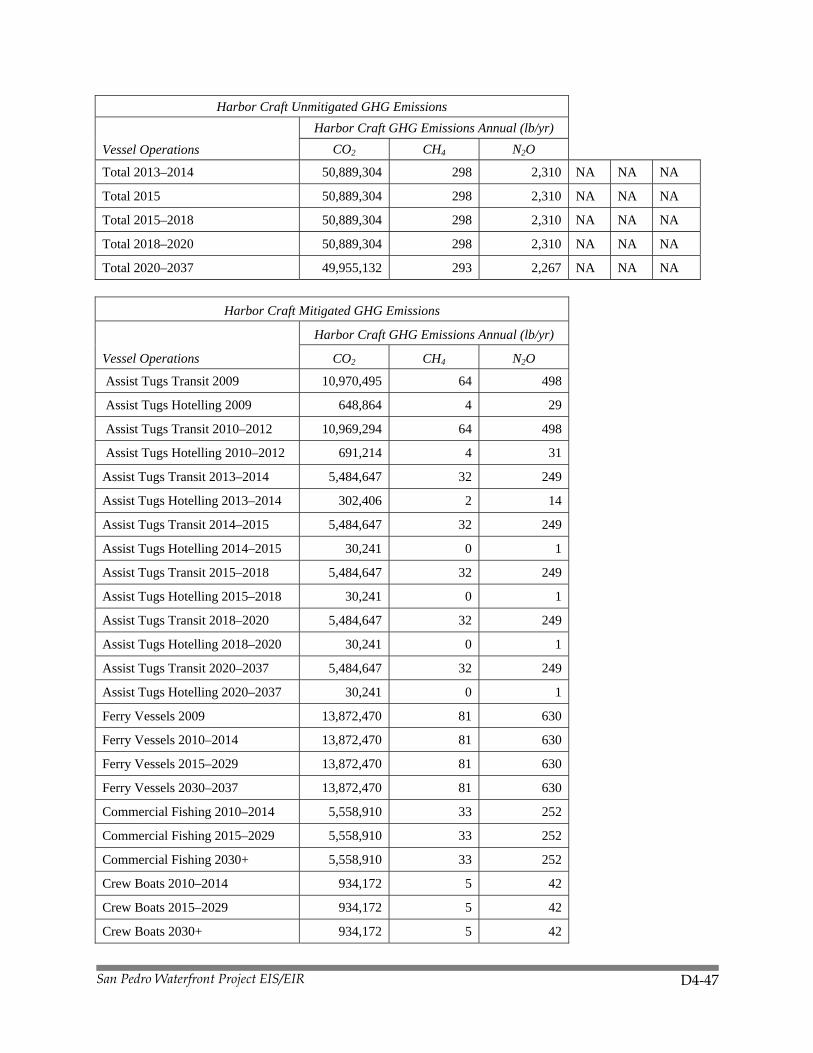
San Pedro Waterfront Project EIS/EIR D4-47
Harbor Craft Unmitigated GHG Emissions
Vessel Operations Harbor Craft GHG Emissions Annual (lb/yr)
CO2 CH4 N2O
Total 2013–2014 50,889,304 298 2,310 NA NA NA
Total 2015 50,889,304 298 2,310 NA NA NA
Total 2015–2018 50,889,304 298 2,310 NA NA NA
Total 2018–2020 50,889,304 298 2,310 NA NA NA
Total 2020–2037 49,955,132 293 2,267 NA NA NA
Harbor Craft Mitigated GHG Emissions
Vessel Operations
Harbor Craft GHG Emissions Annual (lb/yr)
CO2 CH4 N2O
Assist Tugs Transit 2009 10,970,495 64 498
Assist Tugs Hotelling 2009 648,864 4 29
Assist Tugs Transit 2010–2012 10,969,294 64 498
Assist Tugs Hotelling 2010–2012 691,214 4 31
Assist Tugs Transit 2013–2014 5,484,647 32 249
Assist Tugs Hotelling 2013–2014 302,406 2 14
Assist Tugs Transit 2014–2015 5,484,647 32 249
Assist Tugs Hotelling 2014–2015 30,241 0 1
Assist Tugs Transit 2015–2018 5,484,647 32 249
Assist Tugs Hotelling 2015–2018 30,241 0 1
Assist Tugs Transit 2018–2020 5,484,647 32 249
Assist Tugs Hotelling 2018–2020 30,241 0 1
Assist Tugs Transit 2020–2037 5,484,647 32 249
Assist Tugs Hotelling 2020–2037 30,241 0 1
Ferry Vessels 2009 13,872,470 81 630
Ferry Vessels 2010–2014 13,872,470 81 630
Ferry Vessels 2015–2029 13,872,470 81 630
Ferry Vessels 2030–2037 13,872,470 81 630
Commercial Fishing 2010–2014 5,558,910 33 252
Commercial Fishing 2015–2029 5,558,910 33 252
Commercial Fishing 2030+ 5,558,910 33 252
Crew Boats 2010–2014 934,172 5 42
Crew Boats 2015–2029 934,172 5 42
Crew Boats 2030+ 934,172 5 42

San Pedro Waterfront Project EIS/EIR D4-48
Harbor Craft Mitigated GHG Emissions
Vessel Operations
Harbor Craft GHG Emissions Annual (lb/yr)
CO2 CH4 N2O
Excursion 2010–2014 16,747,176 98 760
Excursion 2015–2029 16,747,176 98 760
Excursion 2030–2037 16,747,176 98 760 Hbr. Craft AMP Elec.
Generation Emis. (lb/yr)
Government Boats 2010–2014 2,813,803 16 128 AMP applies to assist tug
hoteling only.
Government Boats 2015–2029 2,813,803 16 128 Engine-hrs/yr replaced by
AMP, starting in
Government Boats 2030+ 2,813,803 16 128 2014 = 2,920
Totals by Year
Total 2009 51,545,890 302 2,340 NA NA NA
Total 2010–2012 51,587,040 302 2,341 NA NA NA
Total 2013–2014 45,713,585 268 2,075 NA NA NA
Total 2014–2015 45,441,419 266 2,062 2,349,257 20 11
Total 2015–2018 45,441,419 266 2,062 2,349,257 20 11
Total 2018–2020 45,441,419 266 2,062 2,349,257 20 11
Total 2020–2037 45,441,419 266 2,062 2,349,257 20 11
Table D4-25. GHG Emissions for Harbor Craft—Alternative 6
Vessel Operations Harbor Craft GHG Emissions Annual (lb/yr)
CO2 CH4 N2O
Assist Tugs Transit 2010–2014 10,969,294 64 498
Assist Tugs Hotelling 2010–2014 691,214 4 31
Assist Tugs Transit 2014–2015 10,969,294 64 498
Assist Tugs Hotelling 2014–2015 691,214 4 31
Assist Tugs Transit 2015–2018 10,969,294 64 498
Assist Tugs Hotelling 2015–2018 691,214 4 31
Assist Tugs Transit 2018–2020 10,969,294 64 498
Assist Tugs Hotelling 2018–2020 691,214 4 31
Assist Tugs Transit 2020–2037 10,969,294 64 498
Assist Tugs Hotelling 2020–2037 691,214 4 31
Ferry Vessels 2010–2014 18,708,115 110 849
Ferry Vessels 2015–2029 18,708,115 110 849

San Pedro Waterfront Project EIS/EIR D4-49
Ferry Vessels 2030–2037 18,708,115 110 849
Commercial Fishing 2010–2014 7,389,779 33 252
Commercial Fishing 2015–2029 5,558,910 33 252
Commercial Fishing 2030+ 5,558,910 33 252
Crew Boats 2010–2014 934,172 5 42
Crew Boats 2015–2029 934,172 5 42
Crew Boats 2030+ 934,172 5 42
Excursion 2010–2014 16,747,176 98 760
Excursion 2015–2029 16,747,176 98 760
Excursion 2030–2037 16,747,176 98 760
Government Boats 2010–2014 2,813,803 16 128
Government Boats 2015–2029 2,813,803 16 128
Government Boats 2030+ 2,813,803 16 128
Total 194,419,937 1,128 8,741
Total 2010–2014 58,253,553 330 2,561
Total 2015 56,422,684 330 2,561
Total 2015–2018 56,422,684 330 2,561
Total 2018–2020 56,422,684 330 2,561
Total 2020–2037 55,488,512 325 2,519

San Pedro Waterfront Project EIS/EIR D4-50
Table D4-26. GHG Emissions for Commercial Land Uses/Activities
Land Uses/Activities (sq ft)
CEQA Baseline (2006)
Proposed Project (2015)
Proposed Project (2037)
Alt. 1 (2015)
Alt. 1 (2037)
Alt. 2 (2015)
Alt. 2 (2037)
Alt. 3 (2015)
(Reduced Project)
Alt. 3 (2037)
(Reduced Project)
Alt. 4 (2015)
Alt. 4 (2037)
Alt. 5 (2015) (No
Federal Action/ NEPA
Baseline)
Alt. 5 (2037) (No
Federal Action/ NEPA
Baseline)
Alt. 6 (2015) (No
Project)
Alt. 6 (2037) (No
Project)
Catalina Terminal 38,642 38,642 38,642 38,642 38,642 38,642 38,642 38,642 38,642 38,642 38,642 38,642 38,642 38,642 38,642
Crowley Marine Tugs
4,225 10,000 10,000 10,000 10,000 10,000 10,000 10,000 10,000 0 0 0 0 0 0
Cruise Ship Terminals
248,140 448,140 448,140 253,250 253,250 448,140 448,140 348,140 348,140 153,250 153,250 153,250 153,250 248,140 248,140
Millenium Tugs 0 10,000 10,000 10,000 10,000 10,000 10,000 10,000 10,000 0 0 0 0 0 0
Ports O'Call 150,000 375,000 375,000 375,000 375,000 375,000 375,000 187,500 187,500 375,000 375,000 375,000 375,000 375,000 375,000
Jankovich & Sons 10,197 0 0 0 0 0 0 0 0 0 0 0 0 0 0
Mikes Marine 1,548 1,548 1,548 0 0 1,548 1,548 1,548 1,548 0 0 1,548 1,548 0 0
Red Car Maintenance
10,000 17,600 17,600 17,600 17,600 17,600 17,600 17,600 17,600 17,600 17,600 17,600 17,600 0 0
Westways 11,853 0 0 0 0 0 0 0 0 0 0 0 0 0 0
Municipal Warehouse No. 1
504,000 504,000 504,000 474,000 474,000 504,000 504,000 504,000 504,000 504,000 504,000 504,000 504,000 504,000 504,000
Warehouse #9 70,000 70,000 70,000 70,000 70,000 70,000 70,000 70,000 70,000 70,000 70,000 70,000 70,000 0 0
Warehouse #10 87,500 87,500 87,500 87,500 87,500 87,500 87,500 87,500 87,500 87,500 87,500 87,500 87,500 0 0
LA Maritime Institute
3,400 4,225 4,225 4,225 4,225 4,225 4,225 4,225 4,225 4,225 4,225 5,500 5,500 5,500 5,500
Ralph J. Scott Historic Fireboat
0 10,000 10,000 10,000 10,000 10,000 10,000 10,000 10,000 10,000 10,000 10,000 10,000 0 0
SS Lane Victory 2,400 10,000 10,000 10,000 10,000 10,000 10,000 10,000 10,000 10,000 10,000 10,000 10,000 10,000 10,000
Red Car Museum 0 0 0 12,400 12,400 0 0 10,000 10,000 10,000 10,000 0 0 0 0
Surface Parking 2,800,000 3,124,454 3,124,454 2,999,823 2,999,823 3,109,419 3,109,419 2,407,859 2,407,859 3,311,795 3,311,795 3,308,236 3,308,236 2,800,000 2,800,000
Total Sq Ft 3,941,905 4,711,109 4,711,109 4,372,440 4,372,440 4,696,074 4,696,074 3,717,014 3,717,014 4,592,012 4,592,012 4,581,276 4,581,276 3,981,282 3,981,282
Projected Electricity Demand KW hours/year (Commercial)**
57,946,004 69,253,302 69,253,302 64,274,868 64,274,868 69,032,288 69,032,288 54,640,106 54,640,106 67,502,576 67,502,576 67,344,757 67,344,757 58,524,845 58,524,845
** Based on 14.7 kwh/yr/sq ft for all land uses, from figure 134 of the California Energy Commission’s California Energy Demand 2008–2018 Staff Revised Forecast Report.
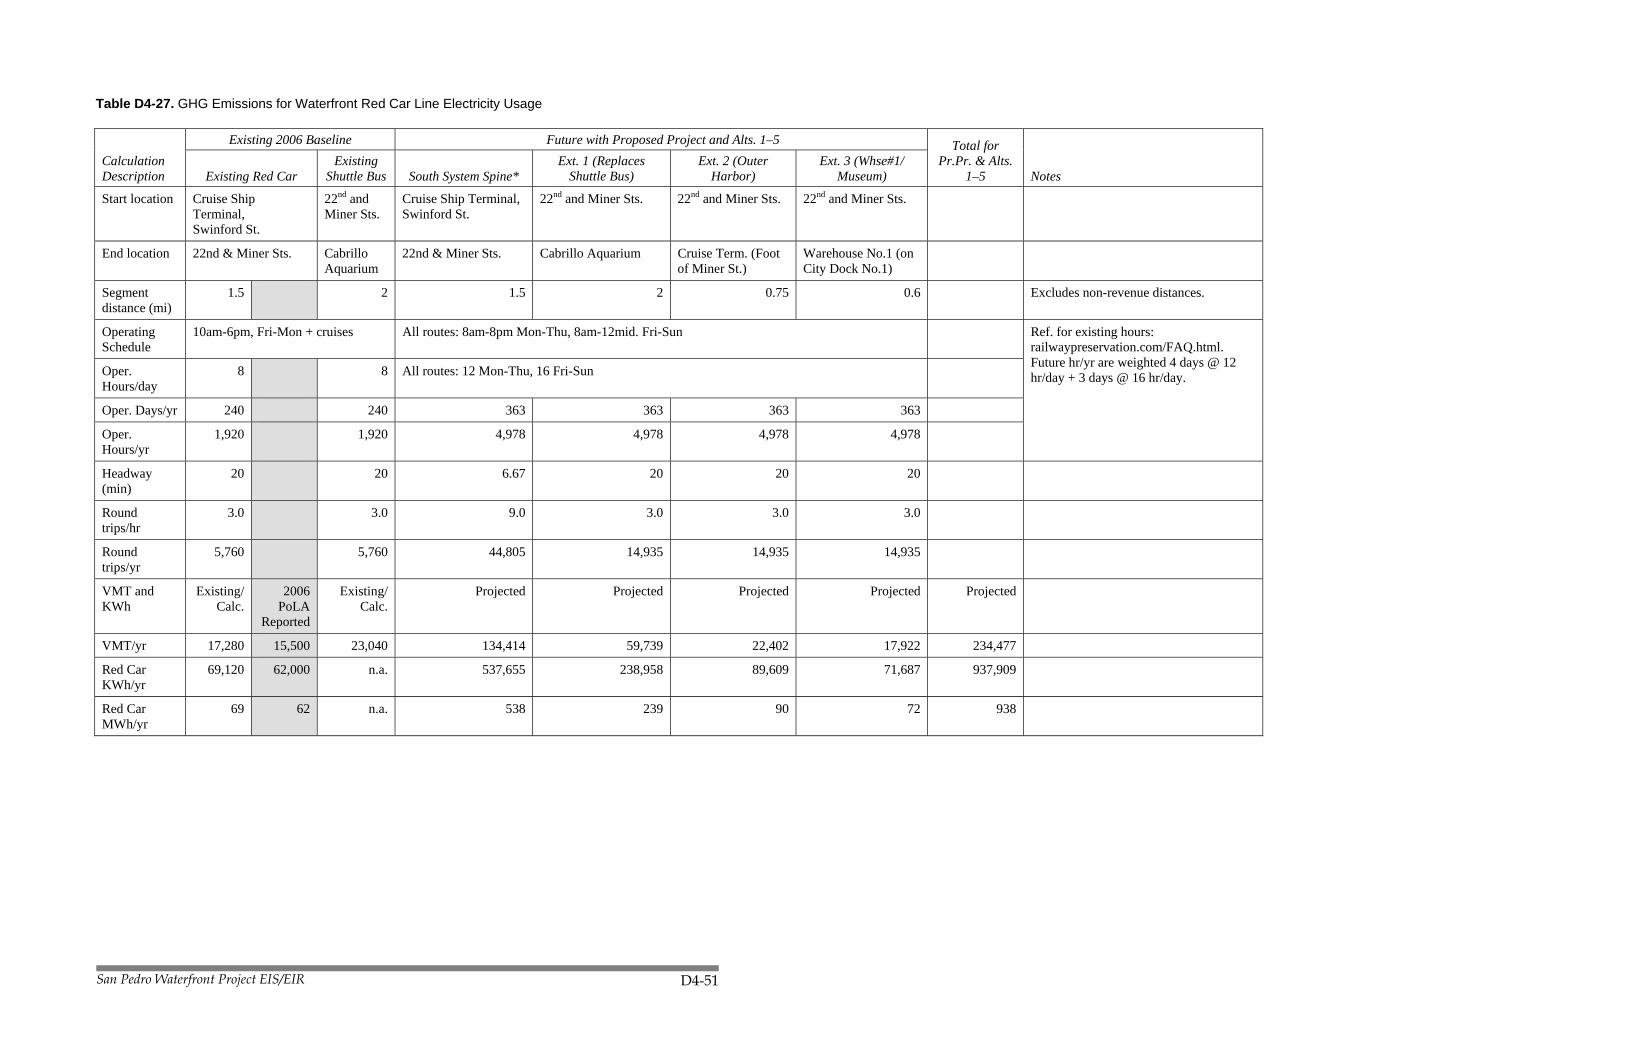
San Pedro Waterfront Project EIS/EIR D4-51
Table D4-27. GHG Emissions for Waterfront Red Car Line Electricity Usage
Calculation Description
Existing 2006 Baseline Future with Proposed Project and Alts. 1–5 Total for Pr.Pr. & Alts.
1–5 Notes Existing Red Car Existing
Shuttle Bus South System Spine* Ext. 1 (Replaces
Shuttle Bus) Ext. 2 (Outer
Harbor) Ext. 3 (Whse#1/
Museum)
Start location Cruise Ship Terminal, Swinford St.
22nd and Miner Sts.
Cruise Ship Terminal, Swinford St.
22nd and Miner Sts. 22nd and Miner Sts. 22nd and Miner Sts.
End location 22nd & Miner Sts. Cabrillo Aquarium
22nd & Miner Sts. Cabrillo Aquarium Cruise Term. (Foot of Miner St.)
Warehouse No.1 (on City Dock No.1)
Segment distance (mi)
1.5 2 1.5 2 0.75 0.6 Excludes non-revenue distances.
Operating Schedule
10am-6pm, Fri-Mon + cruises All routes: 8am-8pm Mon-Thu, 8am-12mid. Fri-Sun
Ref. for existing hours: railwaypreservation.com/FAQ.html. Future hr/yr are weighted 4 days @ 12 hr/day + 3 days @ 16 hr/day. Oper.
Hours/day 8 8 All routes: 12 Mon-Thu, 16 Fri-Sun
Oper. Days/yr 240 240 363 363 363 363
Oper. Hours/yr
1,920 1,920 4,978 4,978 4,978 4,978
Headway (min)
20 20 6.67 20 20 20
Round trips/hr
3.0 3.0 9.0 3.0 3.0 3.0
Round trips/yr
5,760 5,760 44,805 14,935 14,935 14,935
VMT and KWh
Existing/Calc.
2006 PoLA
Reported
Existing/ Calc.
Projected Projected Projected Projected Projected
VMT/yr 17,280 15,500 23,040 134,414 59,739 22,402 17,922 234,477
Red Car KWh/yr
69,120 62,000 n.a. 537,655 238,958 89,609 71,687 937,909
Red Car MWh/yr
69 62 n.a. 538 239 90 72 938

San Pedro Waterfront Project EIS/EIR D4-52
Energy Intensity Assumption for KWh Calculation
Appears reasonable based on LRT performance relationships shown in Caltrans, Energy and Transportation Systems, FHWA/CA/TL-83/08, 1983, Fig. E-1.
Calc. from PoLA reported 2006 data above 4.00 KWh/VMT
* "South System Spine" is same segment as existing line. Future VMT on this segment includes trips bound for extensions. For SPW EIR, calculations include SPW project area only and do not include travel north of Swinford St. Cruise Ship Terminal or to downtown San Pedro.
GHG Emissions Summary (Mt/yr) Alternative CO2 CH4 N2O Notes
2006 Baseline (Alt. 6)
25 0.0002 0.0001 Shuttle bus emissions assumed to be included in motor vehicles analysis, not here.
Prop. Proj. & Alts. 1–5
342 0.0029 0.0016
Notes:
Total GHG emissions values in this tab are passed to final report tables.
Shuttle bus applies to CEQA Baseline and Alt. 6 only.
Shuttle bus GHG emissions are assumed to be included in [JSA's data used in] the vehicle GHG emissions analysis, and are not calculated separately here.
All 3 Red Car Line extensions assumed to apply to all alternatives except 6 (No Project).
Existing Red Car operational data are PoLA reported 2006. Existing Shuttle Bus operational data are assumed such that bus meets each Red Car trip (bus assumed same headway as Red Car).
Future Red Car operations for all alts. assume Recommended System Operating Concept per Waterfront Red Car Line Expansion Feasibility Study, Draft Final Report, PoLA, 11/26/07, sec. 6.3. Also Draft System Operating Scenarios Evaluation Report, Waterfront Red Car Line Expansion Feasibility Study. PoLA, July 2007 (DraftSystemOperatingScenariosEvaluationReport.pdf), sec. 2.6 for operating days/yr.
Table D4-28. GHG Emissions for Terminal Equipment Electrification
Unmitigated Emissions
CEQA Baseline (w/Berth 87): 2006 Alt. 6 (No-Build)—Unmit.: 2011–2037
Year Activity CO2 CH4 N2O
2006 1,218,050 0.0 0.0 0.0
2011 994,850 0.0 0.0 0.0
2015 994,850 0.0 0.0 0.0
2022 994,850 0.0 0.0 0.0
2037 994,850 0.0 0.0 0.0 Unmitigated Emissions Proposed Project—Unmit. Alt. 1—Unmit. Alt. 2—Unmit. Alt. 3—Unmit. Alt. 4—Unmit. Alt. 5—Unmit. Year Activity CO2 CH4
N2O Activity CO2 CH4 N2O Activity CO2 CH4
N2O Activity CO2 CH4 N2O Activity CO2 CH4
N2O Activity CO2 CH4 N2O
2006 – – – – – – – – – – – – – – – – – – – – – – – –
2011 – 0.0 0.0 0.0 – 0.0 0.0 0.0 – 0.0 0.0 0.0 – 0.0 0.0 0.0 – 0.0 0.0 0.0 – 0.0 0.0 0.0
2015 – 0.0 0.0 0.0 – 0.0 0.0 0.0 – 0.0 0.0 0.0 – 0.0 0.0 0.0 – 0.0 0.0 0.0 – 0.0 0.0 0.0

San Pedro Waterfront Project EIS/EIR D4-53
2022 – 0.0 0.0 0.0 – 0.0 0.0 0.0 – 0.0 0.0 0.0 – 0.0 0.0 0.0 – 0.0 0.0 0.0 – 0.0 0.0 0.0
2037 – 0.0 0.0 0.0 – 0.0 0.0 0.0 – 0.0 0.0 0.0 – 0.0 0.0 0.0 – 0.0 0.0 0.0 – 0.0 0.0 0.0 Mitigated Emissions Proposed Project—Mit. Alt. 1—Mit. Alt. 2—Mit. Alt. 3—Mit. Alt. 4—Mit. Alt. 5—Mit. Year Activity CO2 CH4
N2O Activity CO2 CH4 N2O Activity CO2 CH4
N2O Activity CO2 CH4 N2O Activity CO2 CH4
N2O Activity CO2 CH4 N2O
2006 – – – – – – – – – – – – – – – – – – – – – – – –
2011 1,250,950 340 0.003 0.002 994,850 271 0.002 0.001 1,250,950 340 0.003 0.002 994,850 271 0.002 0.001 994,850 271 0.002 0.001 994,850 271 0.002 0.001
2015 1,250,950 340 0.003 0.002 994,850 271 0.002 0.001 1,250,950 340 0.003 0.002 994,850 271 0.002 0.001 994,850 271 0.002 0.001 994,850 271 0.002 0.001
2022 1,250,950 340 0.003 0.002 994,850 271 0.002 0.001 1,250,950 340 0.003 0.002 994,850 271 0.002 0.001 994,850 271 0.002 0.001 994,850 271 0.002 0.001
2037 1,250,950 340 0.003 0.002 994,850 271 0.002 0.001 1,250,950 340 0.003 0.002 994,850 271 0.002 0.001 994,850 271 0.002 0.001 994,850 271 0.002 0.001
Activity indicates energy usage by equipment that has been electrified. Activity units are hp-hr/yr. Emissions units are metric tons per year.
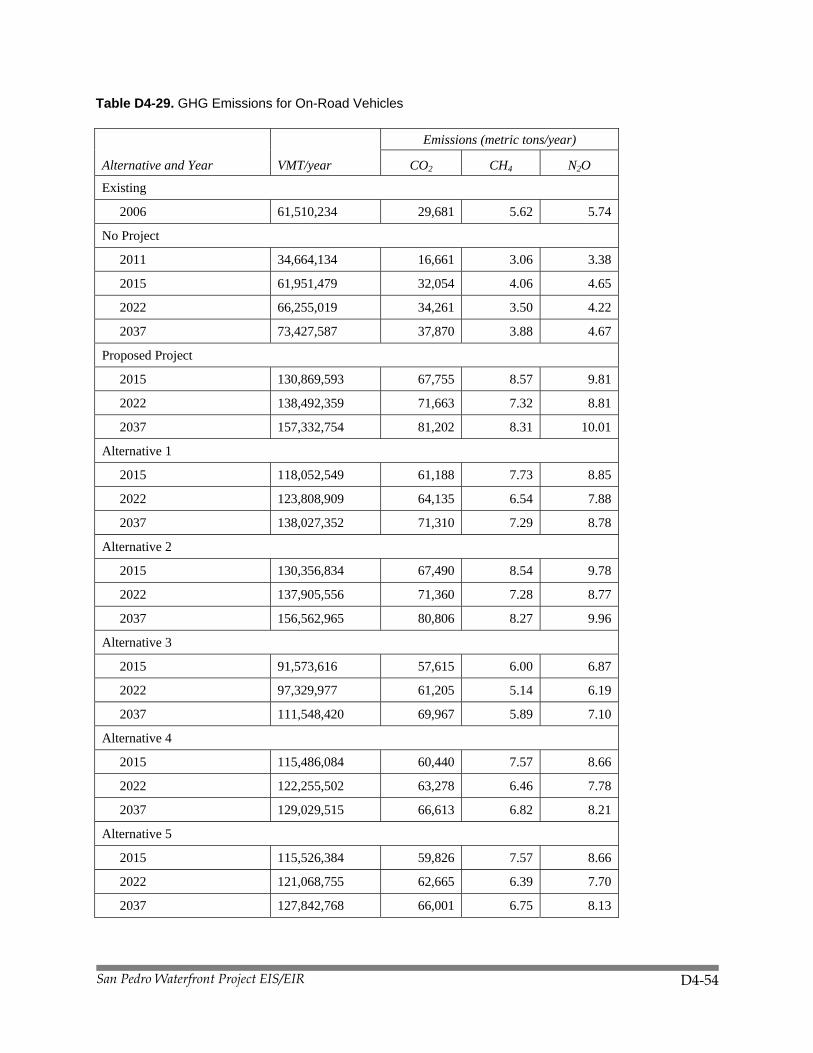
San Pedro Waterfront Project EIS/EIR D4-54
Table D4-29. GHG Emissions for On-Road Vehicles
Alternative and Year
VMT/year
Emissions (metric tons/year)
CO2 CH4 N2O
Existing
2006 61,510,234 29,681 5.62 5.74
No Project
2011 34,664,134 16,661 3.06 3.38
2015 61,951,479 32,054 4.06 4.65
2022 66,255,019 34,261 3.50 4.22
2037 73,427,587 37,870 3.88 4.67
Proposed Project
2015 130,869,593 67,755 8.57 9.81
2022 138,492,359 71,663 7.32 8.81
2037 157,332,754 81,202 8.31 10.01
Alternative 1
2015 118,052,549 61,188 7.73 8.85
2022 123,808,909 64,135 6.54 7.88
2037 138,027,352 71,310 7.29 8.78
Alternative 2
2015 130,356,834 67,490 8.54 9.78
2022 137,905,556 71,360 7.28 8.77
2037 156,562,965 80,806 8.27 9.96
Alternative 3
2015 91,573,616 57,615 6.00 6.87
2022 97,329,977 61,205 5.14 6.19
2037 111,548,420 69,967 5.89 7.10
Alternative 4
2015 115,486,084 60,440 7.57 8.66
2022 122,255,502 63,278 6.46 7.78
2037 129,029,515 66,613 6.82 8.21
Alternative 5
2015 115,526,384 59,826 7.57 8.66
2022 121,068,755 62,665 6.39 7.70
2037 127,842,768 66,001 6.75 8.13