Managing Data Visualization Pipeline with Backbone.js and D3.js
Upload
apptensionCategory
view
381download
3
D3.jsA picture is worth a thousand words

Why data visualization?
<- Because of that

But what do we GET?
{
“id” : 6,
“wall_id” : 55,
“resource_id” : 42,
“project_id” : 3,
“hours” : 3,
“intervals” : [
{
“start_date” : “2016-05-06” ,
“end_date” : “2016-05-08” ,
“booking_id” : 6
} ,
{
“start_date” : “2016-05-19” ,
“end_date” : “2016-05-19” ,
} ,
{
“start_date” : “2016-05-21” ,
“end_date” : “2016-05-24” ,
“booking_id” : 6
} ,
{
“start_date” : “2016-06-01” ,
“end_date” : “2016-10-25” ,
“booking_id” : 6
}

The two paths

The imperative one
For each of the element do…
Change width to 100px and then…
Rotate if rotate===true…
...
Then debug

The declarative one
I want the elements to be there
(I want an animation for the elements
that are not there)
I don’t give a …
how it all happens

D3 is...
Declarative approach
Data-oriented
Lots of built-in stuff
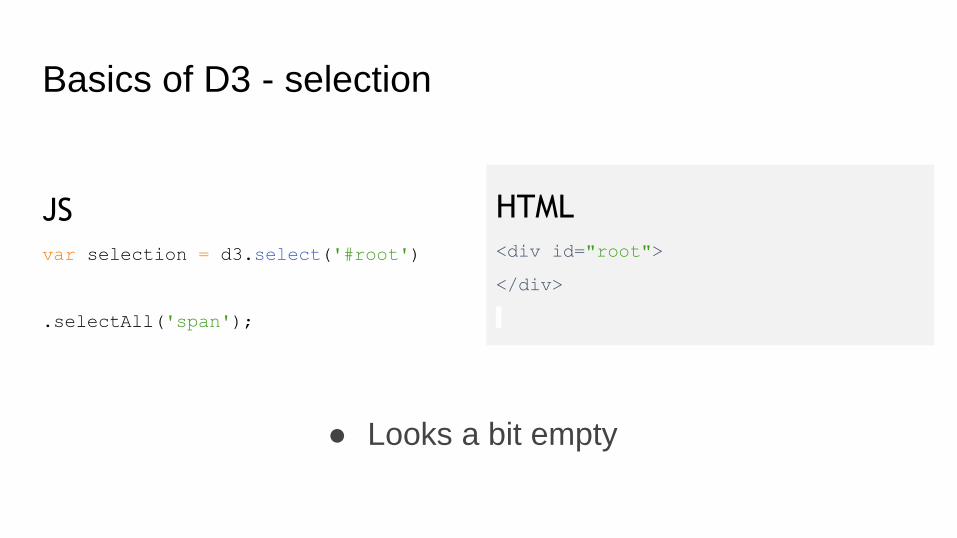
Basics of D3 - selection
JS
var selection = d3.select('#root')
.selectAll('span');
HTML
<div id="root">
</div>
● Looks a bit empty

Basics of D3 - enter, update, exit
JSvar updateSelection = d3.select('#root')
.selectAll('span');
.data([
'Lorem',
'Ipsum'
]);
updateSelection.enter().append('span');
updateSelection.text(el => el);
updateSelection.exit().remove();
HTML<div id="root">
<span>Lorem</span>
<span>Ipsum</span>
</div>
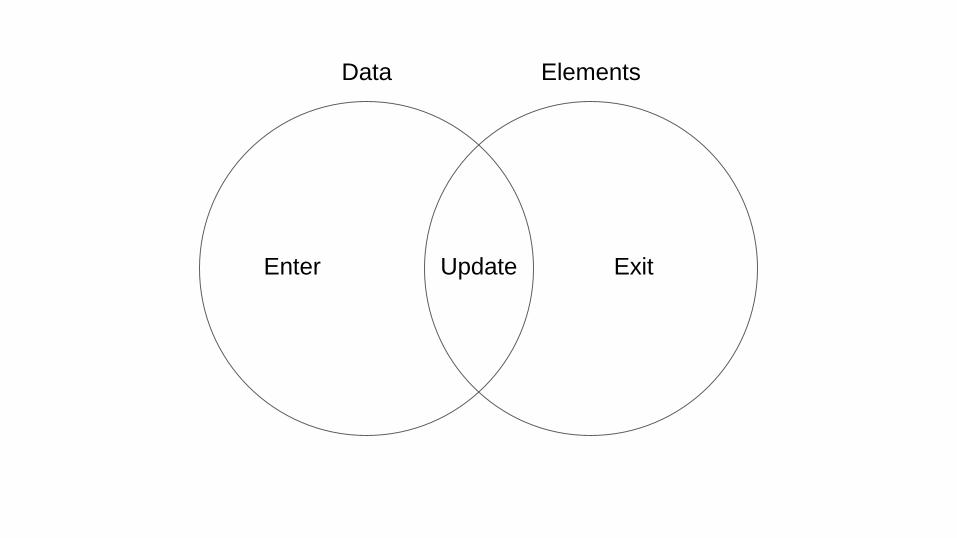
Enter Exit
Data Elements
Update
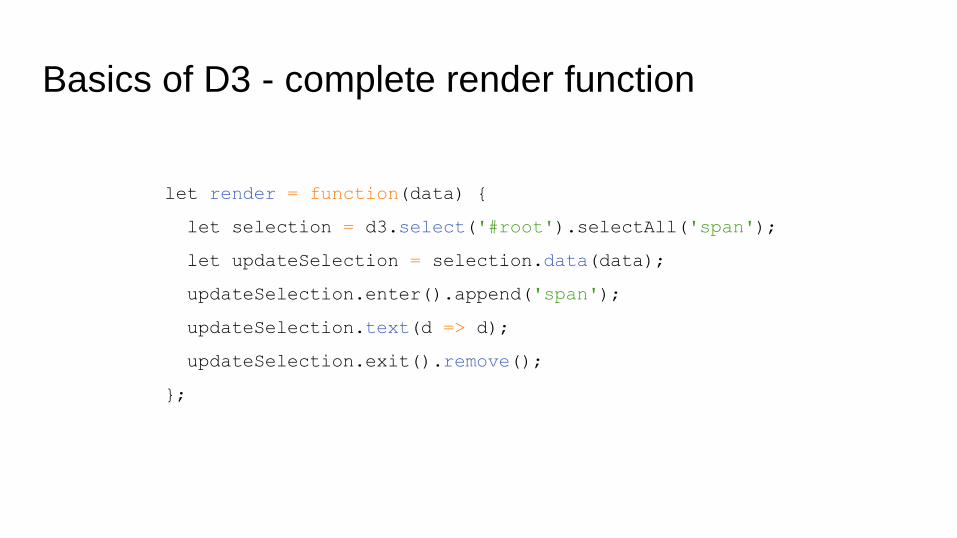
Basics of D3 - complete render function
let render = function(data) {
let selection = d3.select('#root').selectAll('span');
let updateSelection = selection.data(data);
updateSelection.enter().append('span');
updateSelection.text(d => d);
updateSelection.exit().remove();
};
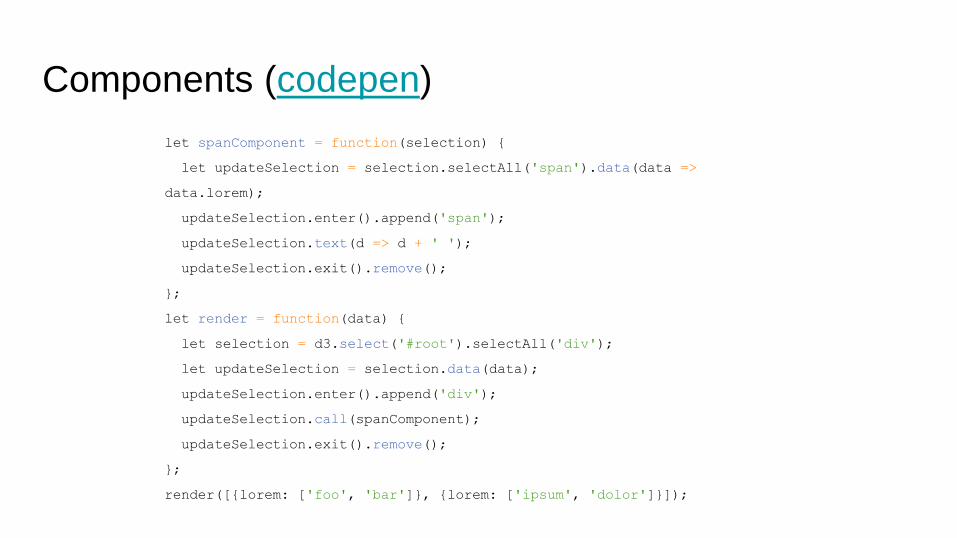
Components (codepen)
let spanComponent = function(selection) {
let updateSelection = selection.selectAll('span').data(data =>
data.lorem);
updateSelection.enter().append('span');
updateSelection.text(d => d + ' ');
updateSelection.exit().remove();
};
let render = function(data) {
let selection = d3.select('#root').selectAll('div');
let updateSelection = selection.data(data);
updateSelection.enter().append('div');
updateSelection.call(spanComponent);
updateSelection.exit().remove();
};
render([{lorem: ['foo', 'bar']}, {lorem: ['ipsum', 'dolor']}]);

Transitions (codepen)
let spanComponent = function(selection) {
let updateSelection = selection.selectAll('span').data(data =>
data.lorem);
updateSelection.enter().append('span')
.style('opacity', 0)
.transition()
.delay((d, i) => i * 400)
.duration(500)
.style('opacity', 1);
updateSelection
.text(d => d + ' ');
updateSelection.exit().remove();
};

Scales
let myLinearScale = d3.scale
.linear()
.domain([0, 10])
.range([0, 800]);
let x = myLinearScale(5);
console.log(x); // prints 400

Scales (2)
let myTimeScale = d3.time
.scale()
.domain([new Date('2016-01-01'), new Date('2017-01-01')])
.range([0, 800]);
let anyDate = new Date('2016-05-10');
let x = myTimeScale(anyDate);
myTimeScale.invert(x); // equals anyDate

SVG, Axes (codepen)
let svg = d3.select('#root').append('svg')
.attr("width", 300)
.attr("height", 300);
let x = d3.scale.linear()
.range([0, 300]);
let xAxis = d3.svg.axis()
.ticks(4)
.scale(x);
svg.append("g")
.attr("transform", "translate(0,100)")
.call(xAxis);
let line = d3.svg.line()
.x(d => d.x)
.y(d => d.y)
.interpolate('monotone');
svg.data([[ {x: x(0.1), y: 60}, {x: x(0.3), y: 20},
{x: x(0.5), y: 30}, {x: x(0.7), y: 10},
{x: x(0.9), y: 80} ]]);
svg.append("path")
.attr('fill', 'none')
.attr('stroke', '#000')
.attr("d", line);
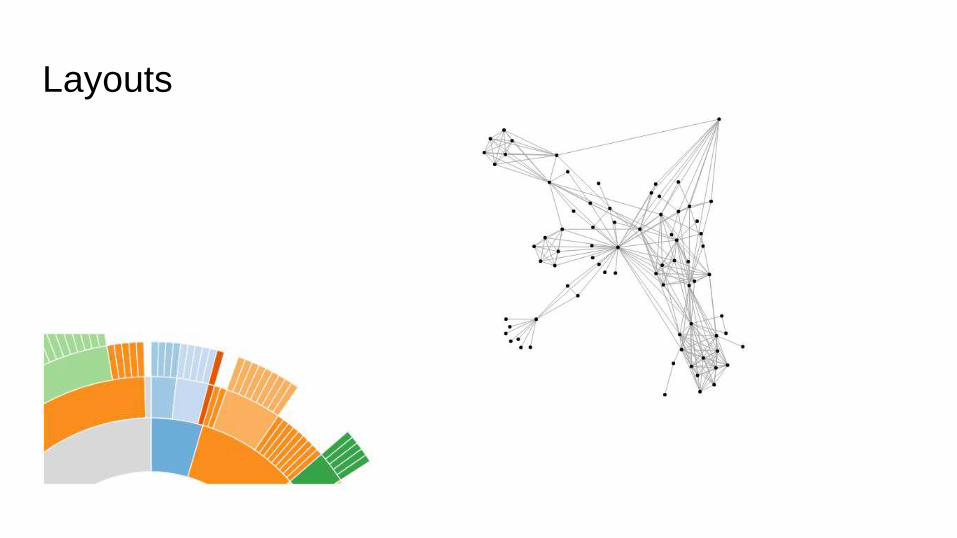
Layouts

And much more
A lot of examples here: https://bl.ocks.org/mbostock

Thank you for your attention!
Tymoteusz Bleja
Junior Frontend Developer @ Apptension