D3.4+D3.6 Annex 3 - Logistical case study in Finland 161117s2biom.alterra.wur.nl/doc/D3.4+D3.6 Annex...
23
S2Biom Project Grant Agreement n°608622 D3.4 + D3.6 : Annex 3 Logistical case study in Finland 17 November 2016 Delivery of sustainable supply of non-food biomass to support a “resource-efficient” Bioeconomy in Europe
Transcript of D3.4+D3.6 Annex 3 - Logistical case study in Finland 161117s2biom.alterra.wur.nl/doc/D3.4+D3.6 Annex...
S2Biom Project Grant Agreement n°608622
D3.4 + D3.6 : Annex 3
Logistical case study in Finland
17 November 2016
Delivery of sustainable supply of non-food biomass to support a
“resource-efficient” Bioeconomy in Europe
D3.2
2
About S2Biom project
The S2Biom project - Delivery of sustainable supply of non-food biomass to support a
“resource-efficient” Bioeconomy in Europe - supports the sustainable delivery of non-
food biomass feedstock at local, regional and pan European level through developing
strategies, and roadmaps that will be informed by a “computerized and easy to use”
toolset (and respective databases) with updated harmonized datasets at local,
regional, national and pan European level for EU28, Western Balkans, Moldova,
Turkey and Ukraine. Further information about the project and the partners involved
are available under www.s2biom.eu.
Project coordinator
Scientific coordinator
Project partners
D3.2
3
About this document
This report corresponds to D3.3 of S2Biom. It has been prepared by:
Due date of deliverable: 31 October 2016 (Month 38) Actual submission date: 2016-11-05 Start date of project: 2013-01-09 Duration: 36 months
Work package WP3 Task 3.3 Lead contractor for this deliverable
DLO
Editor E. Annevelink Authors K. Väätäinen, P. Anttila & E. Annevelink Quality reviewer Rene van Ree
Dissemination Level
PU Public X
PP Restricted to other programme participants (including the Commission Services)
RE Restricted to a group specified by the consortium (including the Commission Services):
CO Confidential, only for members of the consortium (including the Commission Services)
Version Date Author(s) Reason for modification Status
0.1 28/07/2016 E. Annevelink
First version contents sent to WP3
partners with request for additions &
comments
Done
0.2 07/09/16 K. Väätäinen &
P. Anttila Draft for review Done
0.3 20/09/16 K. Väätäinen &
P. Anttila Final draft for review Done
1.0 17/11/16
K. Väätäinen &
P. Anttila &
E. Annevelink
Final version Done
This project has received funding from the European Union’s Seventh Programme for research, technological development and demonstration under grant agreement No 608622.
The sole responsibility of this publication lies with the author. The European Union is not responsible for any use that may be made of the information contained therein.
D3.2
4
Executive summary
In Finland, the operating environment in timber transports by trucks is challenging.
Difficulties in logistics are caused by the high number of timber assortments and end
use facilities, as well as high fluctuation in road trafficability, in the weather affecting
bearing capacity of roads and in the timber demand of mills. Forest industry together
with logistics companies and timber truck entrepreneurs has eagerly searched for the
solutions for improving timber transport efficiency.
The logistical case study in Finland tried to find cost-efficient operation models in
timber transport logistics by trucks in a preset case environment in Central Finland.
As an objective of the study, the influence of a multi-assortment load method was
studied and compared to a single-assortment load method. In the single-assortment
load method only one timber assortment can be transported during one transport
cycle whereas in the multi-assortment load method different timber assortments can
be transported in the same load.
Discrete-event simulation was used for studying the timber truck transports for the
Finnish case. Simulation model included four trucks operating in Central Finland and
supplying 25 different timber assortments to 12 end-use facilities being eight saw
mills, two pulp mills and two train loading terminals. The total timber demand of end-
use facilities over one year was 258,000 solid-m³.
The multi-assortment load method was on average 3.3% cheaper than the single
assortment load method. In addition, the driving performance - presented as solid-m³
of timber per 100 kilometers - was 4.0% higher with the multi-assortment load
method. Small assortment piles at roadsides caused difficulties in efficient timber
transport due to driving between piles and the need of loading many small piles for
filling the entire load space. The multi-assortment load method decreased drastically
the number of rides between piles and, therefore, improved the performance of the
fleet.
The developed model can be used to analyze in depth the effect of different logistical
concepts on, e.g., transport costs, transported volumes and the utilization rate of
capacity. The model can also be extended to other geographical regions.
D3.2
5
Table of contents
About S2Biom project .............................................................................................. 2
About this document ................................................................................................ 3
Executive summary .................................................................................................. 4
1. Introduction ........................................................................................................... 6
1.1 Aim of the case study ........................................................................................ 6
1.2 Content of report ............................................................................................... 6
2. Assessment methods for logistical case studies .............................................. 7
2.1 Introduction ....................................................................................................... 7
2.4 Witness simulation model ................................................................................. 7
3. Set-up of the Finnish case study....................................................................... 10
3.1 Introduction ..................................................................................................... 10
3.2 The region ....................................................................................................... 10
3.3 Biomass value chains ..................................................................................... 10
4. Type of data requirements ................................................................................. 12
5. Actual data used for case study ........................................................................ 13
5.1 Storage and demand data ............................................................................... 13
5.2 Transport data ................................................................................................. 14
5.3 Cost accounting data ...................................................................................... 17
6. Results case study ............................................................................................. 19
6.2 Results of the simulation study ....................................................................... 19
6.3 Discussion ....................................................................................................... 21
7. Conclusions and recommendations ................................................................. 22
7.1 Conclusions .................................................................................................... 22
7.2 Recommendations .......................................................................................... 22
References .............................................................................................................. 23
D3.2
6
1. Introduction
In Finland, 76% of all roundwood transports from roadside storages to end-use
facilities is conducted by timber trucks (Strandström, 2016). Timber transports in
Finland are a big logistical affair. The operating environment is really challenging,
mainly because of the high number of timber assortments and end use facilities, and
high fluctuation in road trafficability, in the weather affecting in bearing capacity of
roads and in the timber demand of mills.
At the moment, cost-competitiveness, profitability and resource efficiency are of
special interest in wood purchasing operations in Finland. A few years ago, new
traffic legislation allowed bigger dimensions and masses of trucks to be used in truck
transports on Finnish roads (Valtioneuvoston asetus, 2013). Compared to the earlier
law allowing truck-trailer units with maximum mass of 60 tonnes, the new law enables
trucks with 64, 68 and 76 ton masses depending on the amount of axels in the truck-
trailer unit. Moreover, Finnish forest industries jointly released a national vision to
enhance wood purchasing efficiency with 30% lower costs in 2025 compared to
present situation (Tehokas puuhuolto, 2025). Improvement of timber transport
efficiency is playing a key role in the efficient wood procurement 2025 vision.
1.1 Aim of the case study
The simulation study for the S2Biom project tried to find cost-efficient operation
models for further studies in timber transport logistics by trucks in a preset case
environment in Central Finland. The study concentrated on a way to simulate
prevailing and alternative operation models in a case operating environment and to
reveal the behavior of the supply system in order to detect and pinpoint places to be
improved in the logistics system. As a specific objective, the influence of a multi-
assortment load method was studied and compared to a single-assortment load
method. In the single-assortment load method only one timber assortment can be
transported during one transport cycle whereas in the multi-assortment load method
different timber assortments can be transported in the same load.
1.2 Content of report
This report shortly presents the simulation model developed in S2Biom project. In
addition, a comparison with the prevailing single-assortment load method with the
multi-assortment load method is reported here with values of system performances
and relative transport costs. Alternative operation models are listed at the end and
finally suggestions are made about research in the future.
D3.2
7
2. Assessment methods for logistical case studies
2.1 Introduction
Various logistical assessment methods have been described in Deliverable D3.2
‘Logistical concepts’ (Annevelink et al., 2015). The following methods have been
chosen for further assessments in the logistical case studies for the S2Biom project
viz.:
• BeWhere for the European & national level;
• LOCAgistics for the Burgundy and Spanish case on the regional level;
• Witness simulation model for the Finnish case.
BeWhere and LocaGIStics have not been used in this case study. Witness®
simulation software (Lanner, 2016) was used for building the simulation environment
for the Finnish case. The simulation is based on a discrete-event approach, where
the system is chancing as discrete events in predetermined timespans. Discrete-
event simulation is a proper method for modelling complex environments, which have
a lot of interactions between the modeled objects, where stochasticity is included in
the system and where system operations are unstable and time dependent. Timber
truck transport logistics indeed have this kind of complexity.
2.4 Witness simulation model
Previously Witness simulation environment has been utilized in various research
projects to study biomass logistics (see e.g. Windisch ym. 2015, Asikainen 2001,
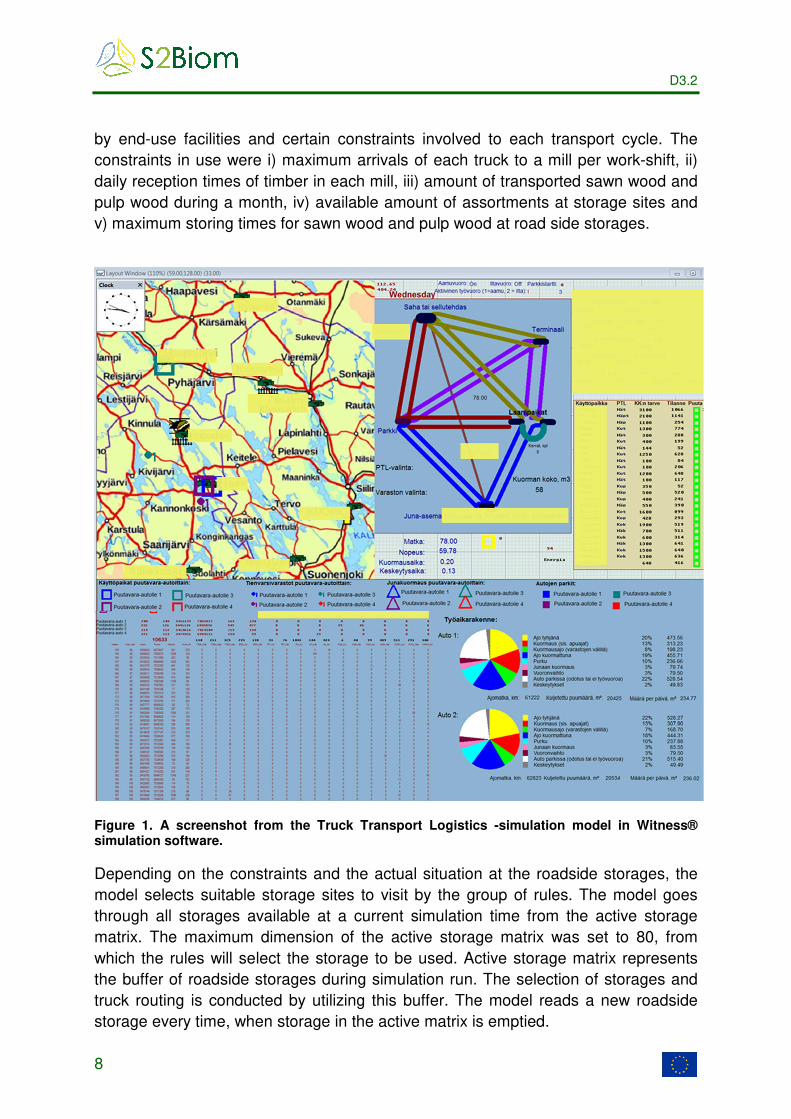
Karttunen ym. 2012). The Truck Transport Logistics -simulation model was compiled
in Witness simulation software and combined with an Excel-spreadsheet environment
(Figure 1). A combination of these two tools enabled us to study the transport
logistics of timber trucks from roadside storages to end-use facilities. Simulation runs
are conducted in Witness, whereas the Excel-spreadsheet file controls simulation
scenario parameters and combines time and performance data from Witness to cost
accounting carried out in Excel workbook.
The simulation requires timber storage data at roadside, data of monthly timber
demand of mills, parameter input of the work model and truck characteristics and
parameters of timber receptions at the mills. The simulation model reads this
information from Excel as initial input data at the beginning of a simulation run.
Before the trucks start to drive unloaded from a truck park, mill or terminal, the model
determines the end-use facility, timber assortment and roadside storage for the new
transport cycle. A new transport cycle is determined by the highest demand of timber
D3.2
8
by end-use facilities and certain constraints involved to each transport cycle. The
constraints in use were i) maximum arrivals of each truck to a mill per work-shift, ii)
daily reception times of timber in each mill, iii) amount of transported sawn wood and
pulp wood during a month, iv) available amount of assortments at storage sites and
v) maximum storing times for sawn wood and pulp wood at road side storages.
Figure 1. A screenshot from the Truck Transport Logistics -simulation model in Witness® simulation software.
Depending on the constraints and the actual situation at the roadside storages, the
model selects suitable storage sites to visit by the group of rules. The model goes
through all storages available at a current simulation time from the active storage
matrix. The maximum dimension of the active storage matrix was set to 80, from
which the rules will select the storage to be used. Active storage matrix represents
the buffer of roadside storages during simulation run. The selection of storages and
truck routing is conducted by utilizing this buffer. The model reads a new roadside
storage every time, when storage in the active matrix is emptied.

D3.2
9
In the selection of storage, the shortest distance method is used, if previously
presented constraints are not influencing in the ruling. Time consumption functions
and truck speed functions are taken from Nurminen and Heinonen (2007), where
time studies for timber truck transports in Finland have been carried out. In addition,
loading and unloading parameters are defined in the Excel control file.
D3.2
10
3. Set-up of the Finnish case study
3.1 Introduction
In the case study, the simulation model included four trucks operating in Central
Finland and supplying timber to 12 end-use facilities being eight saw mills, two pulp
mills and two train loading terminals. A simulation run covered a period of one year.
Timber trucks were operating with the following shift arrangement; six 12 hours
morning shifts + five 12 hours evening shifts. Each scenario was simulated by five
stochastic repetitions and the average values of these five repetitions were used for
calculating the result data of a certain scenario.
Two simulation scenario sets were simulated in Finnish case study. The business as
usual scenario corresponded to timber transports with the single-assortment load
method, whereas the multi-assortment scenario included the multi-assortment load
transports. Each simulation scenario was repeated five times and the averages of the
five repetitions were used for comparing scenario results.
3.2 The region
The logistics company owning the trucks operates mainly within the province of
Central Finland. The relatively high forest productivity and numerous forest industry
facilities both within and surrounding the province form the basis for active forestry
and timber logistics. The general challenges of timber transport in Finland described
in the Introduction are also valid in Central Finland. The company operates within a
radius of roughly 100 km and the annual demand of timber for all end-use facilities
was set to 258 000 m³/year, in total.
3.3 Biomass value chains
In the Finnish case study, saw logs, pulp wood and delimbed energy wood stems
were transported to end-use facilities. In total, 25 different timber assortments were
included in the supply chain in this case.
Currently, each timber assortment is transported as single-assortment loads to the
end-use facility. Due to the small volume of individual assortments in a roadside
storage, the timber trucks often have to collect timber from several roadside storages
to obtain a full load. This kind of driving between piles at different roadside storages
and setup times at these piles are relatively time consuming elements in the whole
D3.2
11
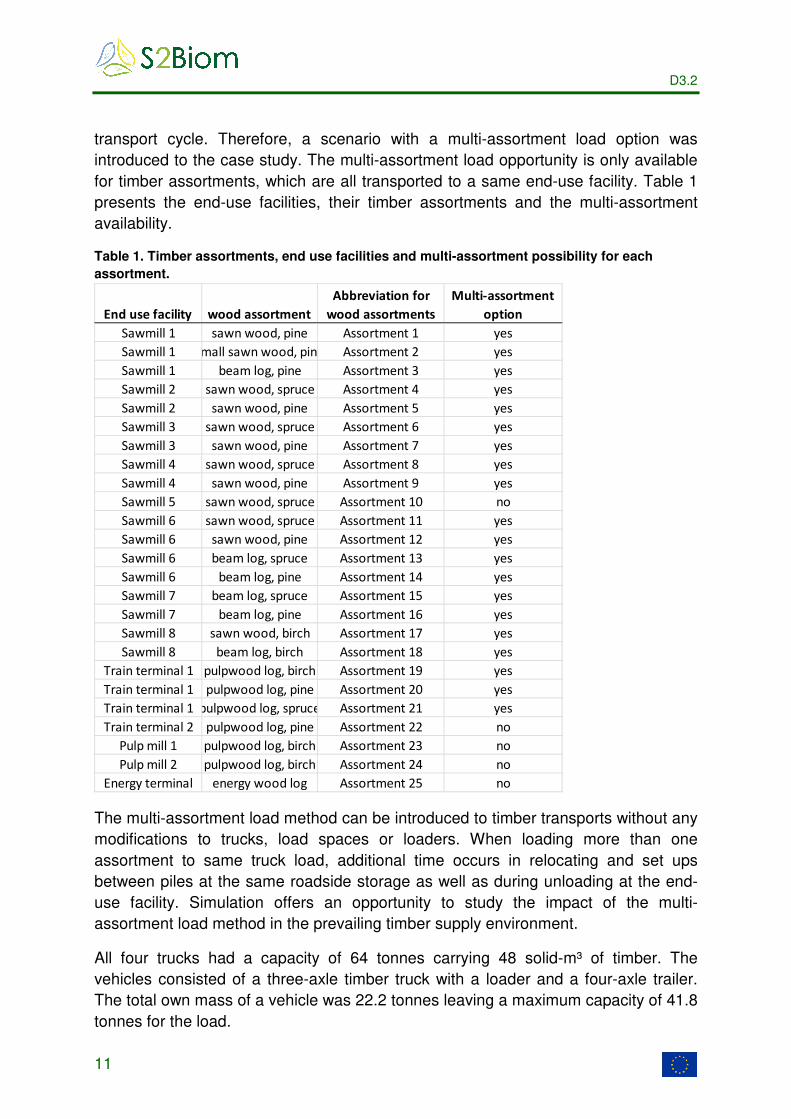
transport cycle. Therefore, a scenario with a multi-assortment load option was
introduced to the case study. The multi-assortment load opportunity is only available
for timber assortments, which are all transported to a same end-use facility. Table 1
presents the end-use facilities, their timber assortments and the multi-assortment
availability.
Table 1. Timber assortments, end use facilities and multi-assortment possibility for each
assortment.
The multi-assortment load method can be introduced to timber transports without any
modifications to trucks, load spaces or loaders. When loading more than one
assortment to same truck load, additional time occurs in relocating and set ups
between piles at the same roadside storage as well as during unloading at the end-
use facility. Simulation offers an opportunity to study the impact of the multi-
assortment load method in the prevailing timber supply environment.
All four trucks had a capacity of 64 tonnes carrying 48 solid-m³ of timber. The
vehicles consisted of a three-axle timber truck with a loader and a four-axle trailer.
The total own mass of a vehicle was 22.2 tonnes leaving a maximum capacity of 41.8
tonnes for the load.
End use facility wood assortment
Abbreviation for
wood assortments
Multi-assortment
option
Sawmill 1 sawn wood, pine Assortment 1 yes
Sawmill 1 small sawn wood, pine Assortment 2 yes
Sawmill 1 beam log, pine Assortment 3 yes
Sawmill 2 sawn wood, spruce Assortment 4 yes
Sawmill 2 sawn wood, pine Assortment 5 yes
Sawmill 3 sawn wood, spruce Assortment 6 yes
Sawmill 3 sawn wood, pine Assortment 7 yes
Sawmill 4 sawn wood, spruce Assortment 8 yes
Sawmill 4 sawn wood, pine Assortment 9 yes
Sawmill 5 sawn wood, spruce Assortment 10 no
Sawmill 6 sawn wood, spruce Assortment 11 yes
Sawmill 6 sawn wood, pine Assortment 12 yes
Sawmill 6 beam log, spruce Assortment 13 yes
Sawmill 6 beam log, pine Assortment 14 yes
Sawmill 7 beam log, spruce Assortment 15 yes
Sawmill 7 beam log, pine Assortment 16 yes
Sawmill 8 sawn wood, birch Assortment 17 yes
Sawmill 8 beam log, birch Assortment 18 yes
Train terminal 1 pulpwood log, birch Assortment 19 yes
Train terminal 1 pulpwood log, pine Assortment 20 yes
Train terminal 1 pulpwood log, spruce Assortment 21 yes
Train terminal 2 pulpwood log, pine Assortment 22 no
Pulp mill 1 pulpwood log, birch Assortment 23 no
Pulp mill 2 pulpwood log, birch Assortment 24 no
Energy terminal energy wood log Assortment 25 no
D3.2
12
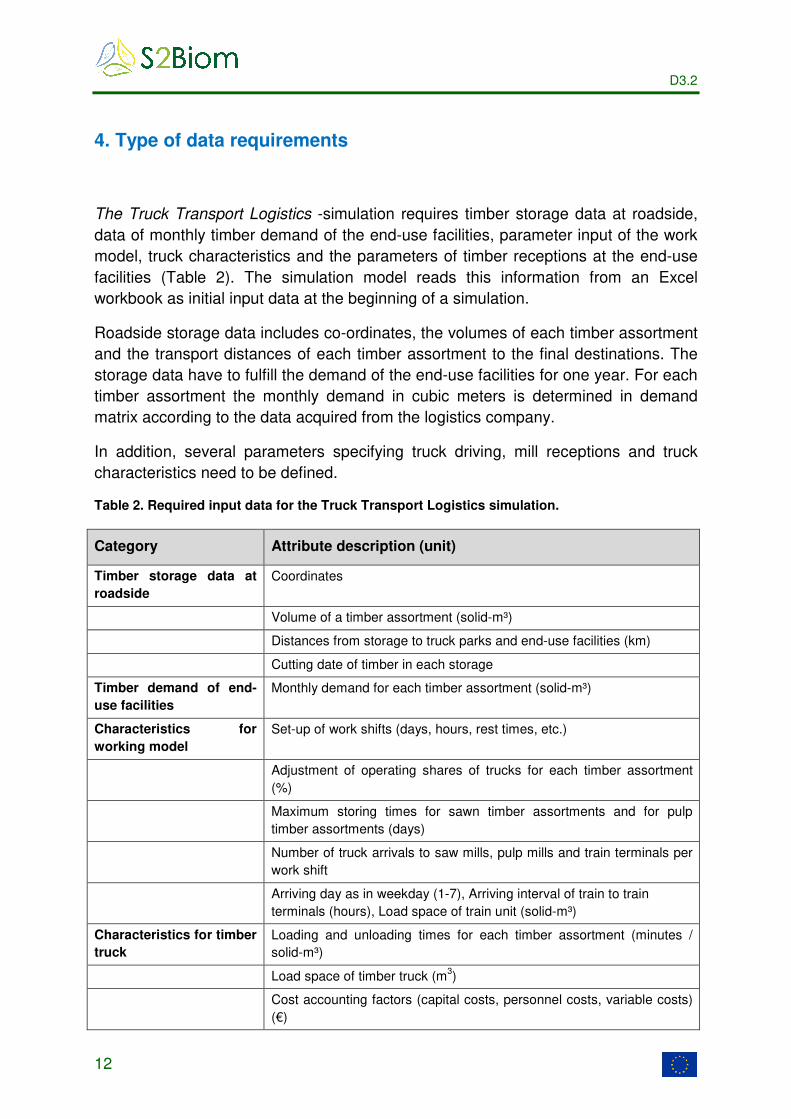
4. Type of data requirements
The Truck Transport Logistics -simulation requires timber storage data at roadside,
data of monthly timber demand of the end-use facilities, parameter input of the work
model, truck characteristics and the parameters of timber receptions at the end-use
facilities (Table 2). The simulation model reads this information from an Excel
workbook as initial input data at the beginning of a simulation.
Roadside storage data includes co-ordinates, the volumes of each timber assortment
and the transport distances of each timber assortment to the final destinations. The
storage data have to fulfill the demand of the end-use facilities for one year. For each
timber assortment the monthly demand in cubic meters is determined in demand
matrix according to the data acquired from the logistics company.
In addition, several parameters specifying truck driving, mill receptions and truck
characteristics need to be defined.
Table 2. Required input data for the Truck Transport Logistics simulation.
Category Attribute description (unit)
Timber storage data at
roadside
Coordinates
Volume of a timber assortment (solid-m³)
Distances from storage to truck parks and end-use facilities (km)
Cutting date of timber in each storage
Timber demand of end-
use facilities
Monthly demand for each timber assortment (solid-m³)
Characteristics for
working model
Set-up of work shifts (days, hours, rest times, etc.)
Adjustment of operating shares of trucks for each timber assortment
(%)
Maximum storing times for sawn timber assortments and for pulp
timber assortments (days)
Number of truck arrivals to saw mills, pulp mills and train terminals per
work shift
Arriving day as in weekday (1-7), Arriving interval of train to train
terminals (hours), Load space of train unit (solid-m³)
Characteristics for timber
truck
Loading and unloading times for each timber assortment (minutes /
solid-m³)
Load space of timber truck (m3)
Cost accounting factors (capital costs, personnel costs, variable costs)
(€)
D3.2
13
5. Actual data used for case study
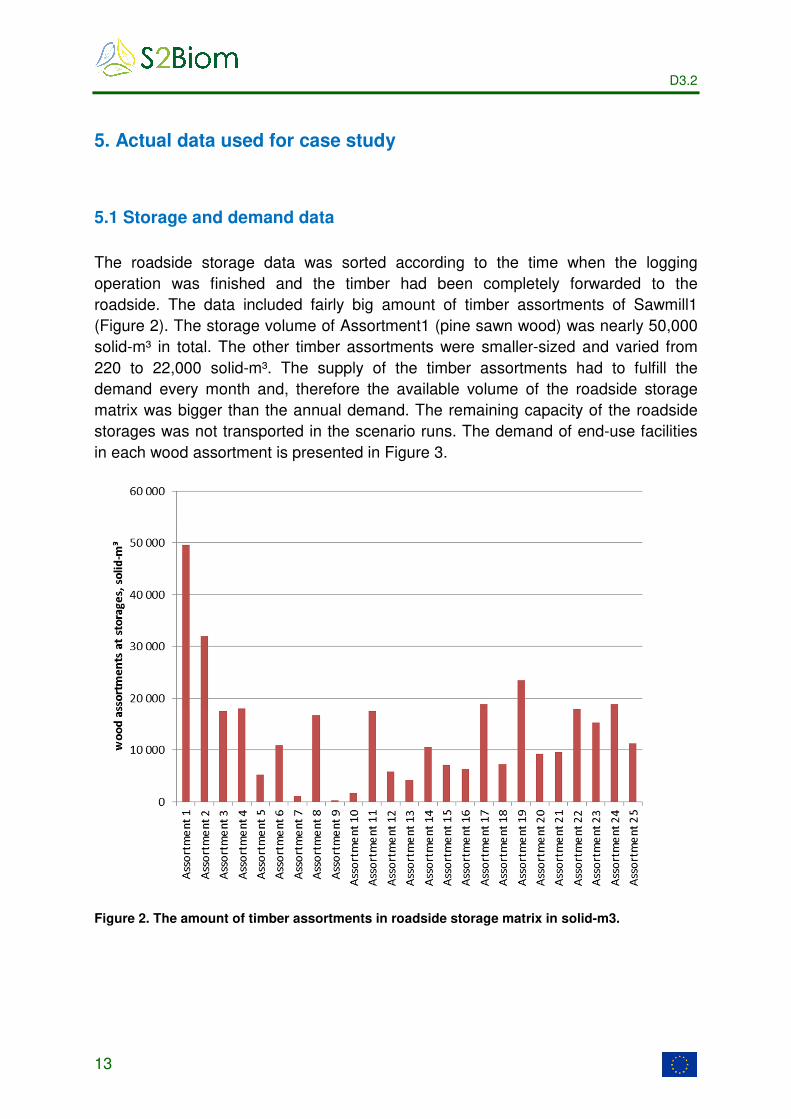
5.1 Storage and demand data
The roadside storage data was sorted according to the time when the logging
operation was finished and the timber had been completely forwarded to the
roadside. The data included fairly big amount of timber assortments of Sawmill1
(Figure 2). The storage volume of Assortment1 (pine sawn wood) was nearly 50,000
solid-m³ in total. The other timber assortments were smaller-sized and varied from
220 to 22,000 solid-m³. The supply of the timber assortments had to fulfill the
demand every month and, therefore the available volume of the roadside storage
matrix was bigger than the annual demand. The remaining capacity of the roadside
storages was not transported in the scenario runs. The demand of end-use facilities
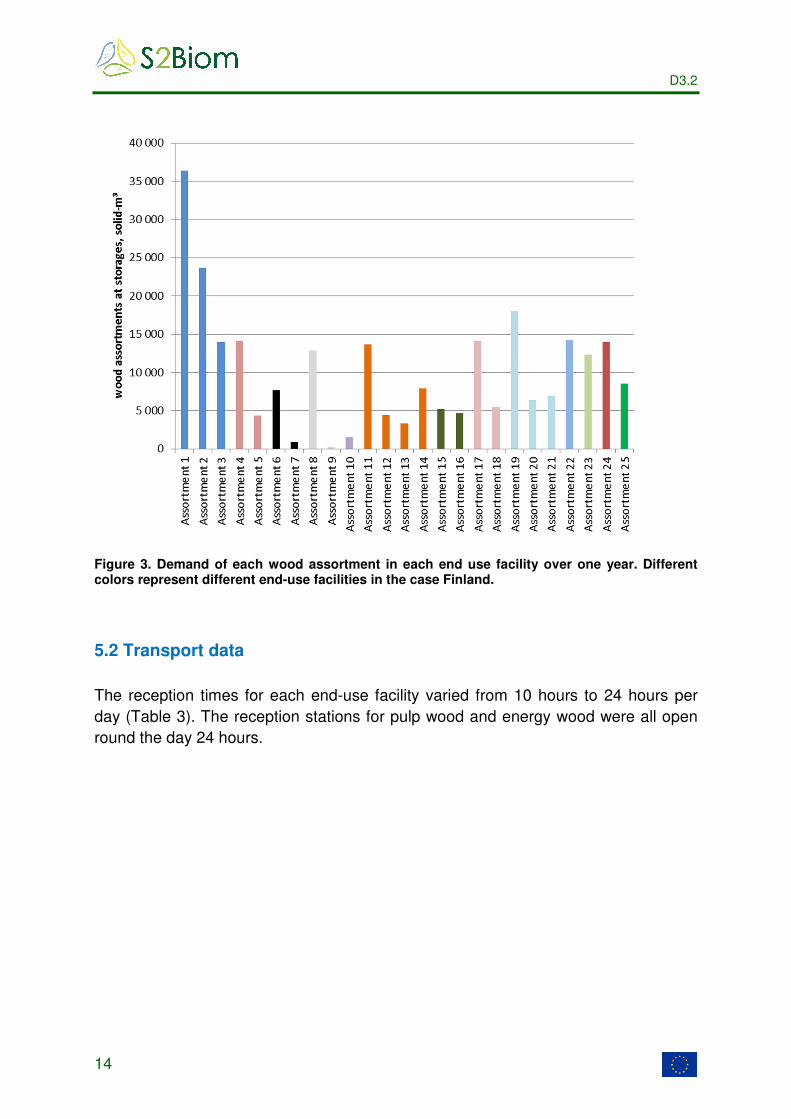
in each wood assortment is presented in Figure 3.
Figure 2. The amount of timber assortments in roadside storage matrix in solid-m3.
D3.2
14
Figure 3. Demand of each wood assortment in each end use facility over one year. Different colors represent different end-use facilities in the case Finland.
5.2 Transport data
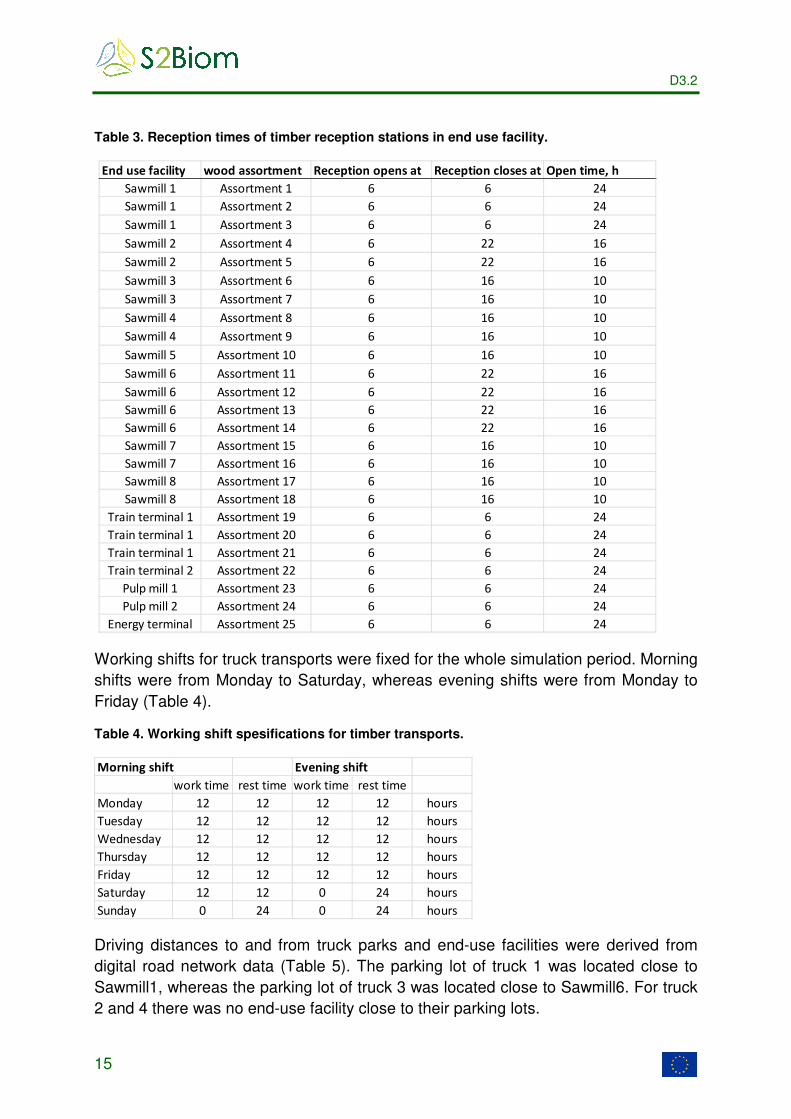
The reception times for each end-use facility varied from 10 hours to 24 hours per
day (Table 3). The reception stations for pulp wood and energy wood were all open
round the day 24 hours.
D3.2
15
Table 3. Reception times of timber reception stations in end use facility.
Working shifts for truck transports were fixed for the whole simulation period. Morning
shifts were from Monday to Saturday, whereas evening shifts were from Monday to
Friday (Table 4).
Table 4. Working shift spesifications for timber transports.
Driving distances to and from truck parks and end-use facilities were derived from
digital road network data (Table 5). The parking lot of truck 1 was located close to
Sawmill1, whereas the parking lot of truck 3 was located close to Sawmill6. For truck
2 and 4 there was no end-use facility close to their parking lots.
End use facility wood assortment Reception opens at Reception closes at Open time, h
Sawmill 1 Assortment 1 6 6 24
Sawmill 1 Assortment 2 6 6 24
Sawmill 1 Assortment 3 6 6 24
Sawmill 2 Assortment 4 6 22 16
Sawmill 2 Assortment 5 6 22 16
Sawmill 3 Assortment 6 6 16 10
Sawmill 3 Assortment 7 6 16 10
Sawmill 4 Assortment 8 6 16 10
Sawmill 4 Assortment 9 6 16 10
Sawmill 5 Assortment 10 6 16 10
Sawmill 6 Assortment 11 6 22 16
Sawmill 6 Assortment 12 6 22 16
Sawmill 6 Assortment 13 6 22 16
Sawmill 6 Assortment 14 6 22 16
Sawmill 7 Assortment 15 6 16 10
Sawmill 7 Assortment 16 6 16 10
Sawmill 8 Assortment 17 6 16 10
Sawmill 8 Assortment 18 6 16 10
Train terminal 1 Assortment 19 6 6 24
Train terminal 1 Assortment 20 6 6 24
Train terminal 1 Assortment 21 6 6 24
Train terminal 2 Assortment 22 6 6 24
Pulp mill 1 Assortment 23 6 6 24
Pulp mill 2 Assortment 24 6 6 24
Energy terminal Assortment 25 6 6 24
Morning shift Evening shift
work time rest time work time rest time
Monday 12 12 12 12 hours
Tuesday 12 12 12 12 hours
Wednesday 12 12 12 12 hours
Thursday 12 12 12 12 hours
Friday 12 12 12 12 hours
Saturday 12 12 0 24 hours
Sunday 0 24 0 24 hours
D3.2
16
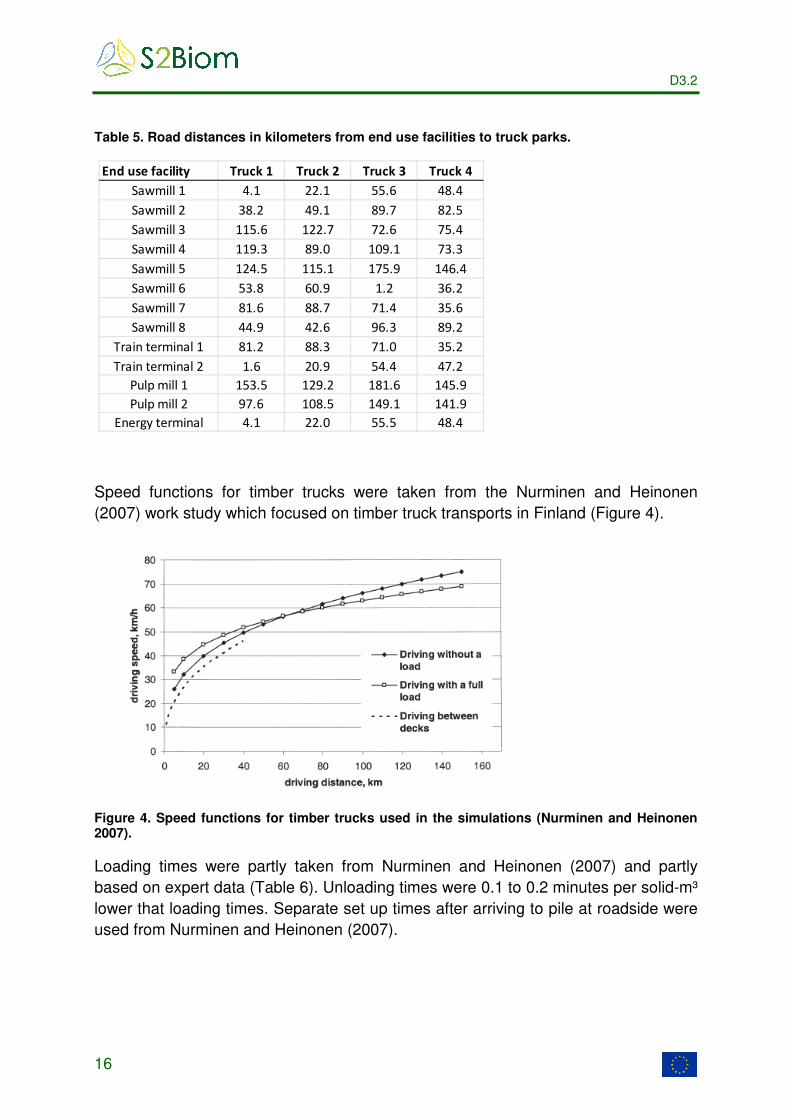
Table 5. Road distances in kilometers from end use facilities to truck parks.
Speed functions for timber trucks were taken from the Nurminen and Heinonen
(2007) work study which focused on timber truck transports in Finland (Figure 4).
Figure 4. Speed functions for timber trucks used in the simulations (Nurminen and Heinonen 2007).
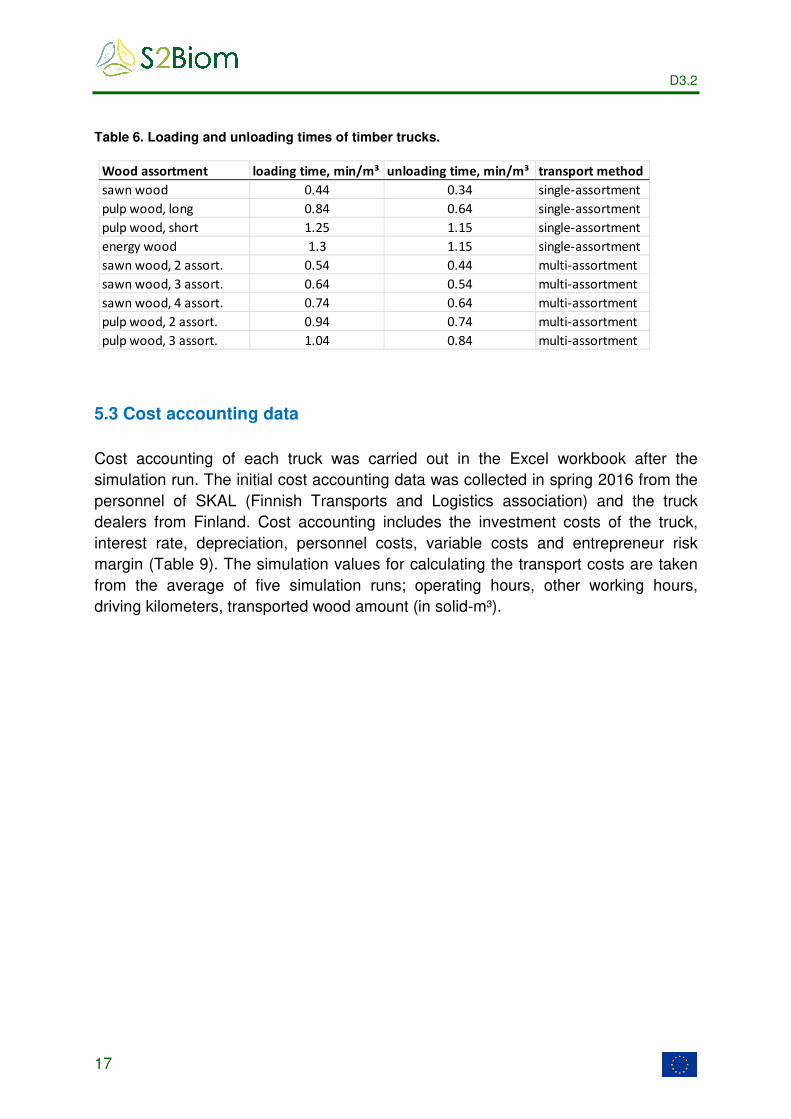
Loading times were partly taken from Nurminen and Heinonen (2007) and partly
based on expert data (Table 6). Unloading times were 0.1 to 0.2 minutes per solid-m³
lower that loading times. Separate set up times after arriving to pile at roadside were
used from Nurminen and Heinonen (2007).
End use facility Truck 1 Truck 2 Truck 3 Truck 4
Sawmill 1 4.1 22.1 55.6 48.4
Sawmill 2 38.2 49.1 89.7 82.5
Sawmill 3 115.6 122.7 72.6 75.4
Sawmill 4 119.3 89.0 109.1 73.3
Sawmill 5 124.5 115.1 175.9 146.4
Sawmill 6 53.8 60.9 1.2 36.2
Sawmill 7 81.6 88.7 71.4 35.6
Sawmill 8 44.9 42.6 96.3 89.2
Train terminal 1 81.2 88.3 71.0 35.2
Train terminal 2 1.6 20.9 54.4 47.2
Pulp mill 1 153.5 129.2 181.6 145.9
Pulp mill 2 97.6 108.5 149.1 141.9
Energy terminal 4.1 22.0 55.5 48.4
D3.2
17
Table 6. Loading and unloading times of timber trucks.
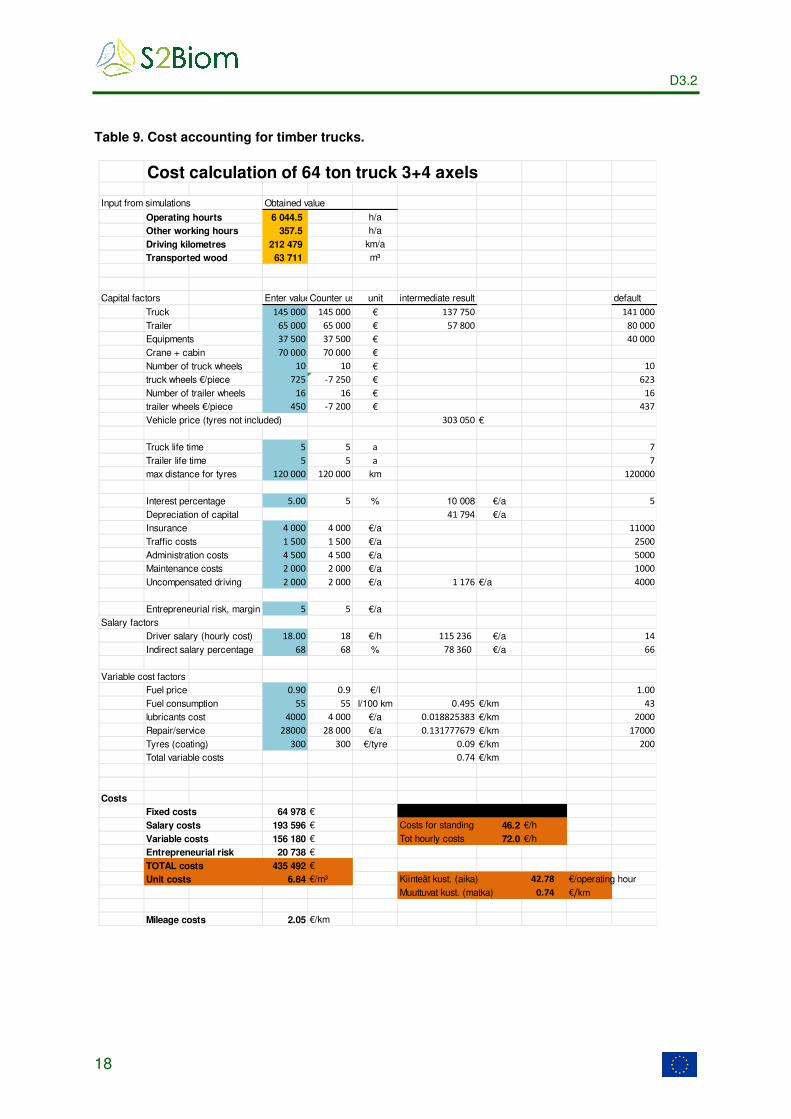
5.3 Cost accounting data
Cost accounting of each truck was carried out in the Excel workbook after the
simulation run. The initial cost accounting data was collected in spring 2016 from the
personnel of SKAL (Finnish Transports and Logistics association) and the truck
dealers from Finland. Cost accounting includes the investment costs of the truck,
interest rate, depreciation, personnel costs, variable costs and entrepreneur risk
margin (Table 9). The simulation values for calculating the transport costs are taken
from the average of five simulation runs; operating hours, other working hours,
driving kilometers, transported wood amount (in solid-m³).
Wood assortment loading time, min/m³ unloading time, min/m³ transport method
sawn wood 0.44 0.34 single-assortment
pulp wood, long 0.84 0.64 single-assortment
pulp wood, short 1.25 1.15 single-assortment
energy wood 1.3 1.15 single-assortment
sawn wood, 2 assort. 0.54 0.44 multi-assortment
sawn wood, 3 assort. 0.64 0.54 multi-assortment
sawn wood, 4 assort. 0.74 0.64 multi-assortment
pulp wood, 2 assort. 0.94 0.74 multi-assortment
pulp wood, 3 assort. 1.04 0.84 multi-assortment
D3.2
18
Table 9. Cost accounting for timber trucks.
Cost calculation of 64 ton truck 3+4 axels
Input from simulations Obtained value
Operating hourts 6 044.5 h/a
Other working hours 357.5 h/a
Driving kilometres 212 479 km/a
Transported wood 63 711 m³
Capital factors Enter valueCounter uses unit intermediate result default
Truck 145 000 145 000 € 137 750 141 000
Trailer 65 000 65 000 € 57 800 80 000
Equipments 37 500 37 500 € 40 000
Crane + cabin 70 000 70 000 €
Number of truck wheels 10 10 € 10
truck wheels €/piece 725 -7 250 € 623
Number of trailer wheels 16 16 € 16
trailer wheels €/piece 450 -7 200 € 437
Vehicle price (tyres not included) 303 050 €
Truck life time 5 5 a 7
Trailer life time 5 5 a 7
max distance for tyres 120 000 120 000 km 120000
Interest percentage 5.00 5 % 10 008 €/a 5
Depreciation of capital 41 794 €/a
Insurance 4 000 4 000 €/a 11000
Traffic costs 1 500 1 500 €/a 2500
Administration costs 4 500 4 500 €/a 5000
Maintenance costs 2 000 2 000 €/a 1000
Uncompensated driving 2 000 2 000 €/a 1 176 €/a 4000
Entrepreneurial risk, margin percent 5 5 €/a
Salary factors
Driver salary (hourly cost) 18.00 18 €/h 115 236 €/a 14
Indirect salary percentage 68 68 % 78 360 €/a 66
Variable cost factors
Fuel price 0.90 0.9 €/l 1.00
Fuel consumption 55 55 l/100 km 0.495 €/km 43
lubricants cost 4000 4 000 €/a 0.018825383 €/km 2000
Repair/service 28000 28 000 €/a 0.131777679 €/km 17000
Tyres (coating) 300 300 €/tyre 0.09 €/km 200
Total variable costs 0.74 €/km
Costs
Fixed costs 64 978 € Costs for driving 97.3 €/h
Salary costs 193 596 € Costs for standing 46.2 €/h
Variable costs 156 180 € Tot hourly costs 72.0 €/h
Entrepreneurial risk 20 738 €
TOTAL costs 435 492 €
Unit costs 6.84 €/m³ Kiinteät kust. (aika) 42.78 €/operating hour
Muuttuvat kust. (matka) 0.74 €/km
Mileage costs 2.05 €/km
D3.2
19
6. Results case study
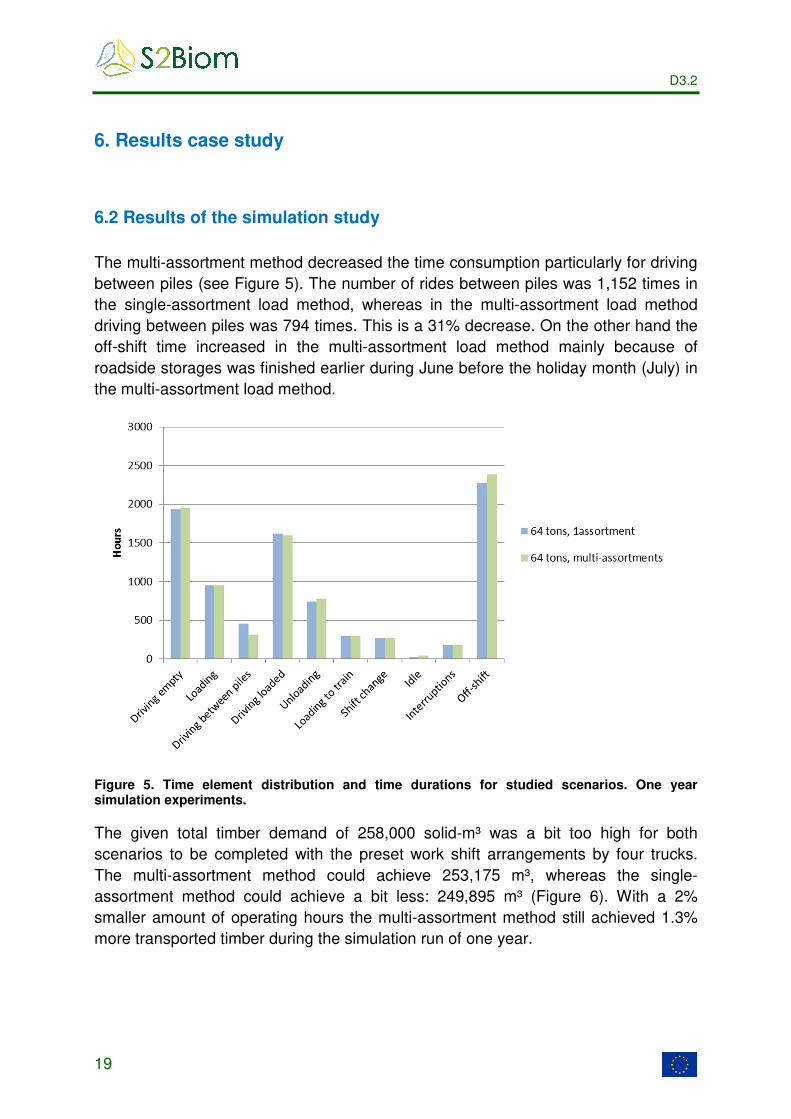
6.2 Results of the simulation study
The multi-assortment method decreased the time consumption particularly for driving
between piles (see Figure 5). The number of rides between piles was 1,152 times in
the single-assortment load method, whereas in the multi-assortment load method
driving between piles was 794 times. This is a 31% decrease. On the other hand the
off-shift time increased in the multi-assortment load method mainly because of
roadside storages was finished earlier during June before the holiday month (July) in
the multi-assortment load method.
Figure 5. Time element distribution and time durations for studied scenarios. One year simulation experiments.
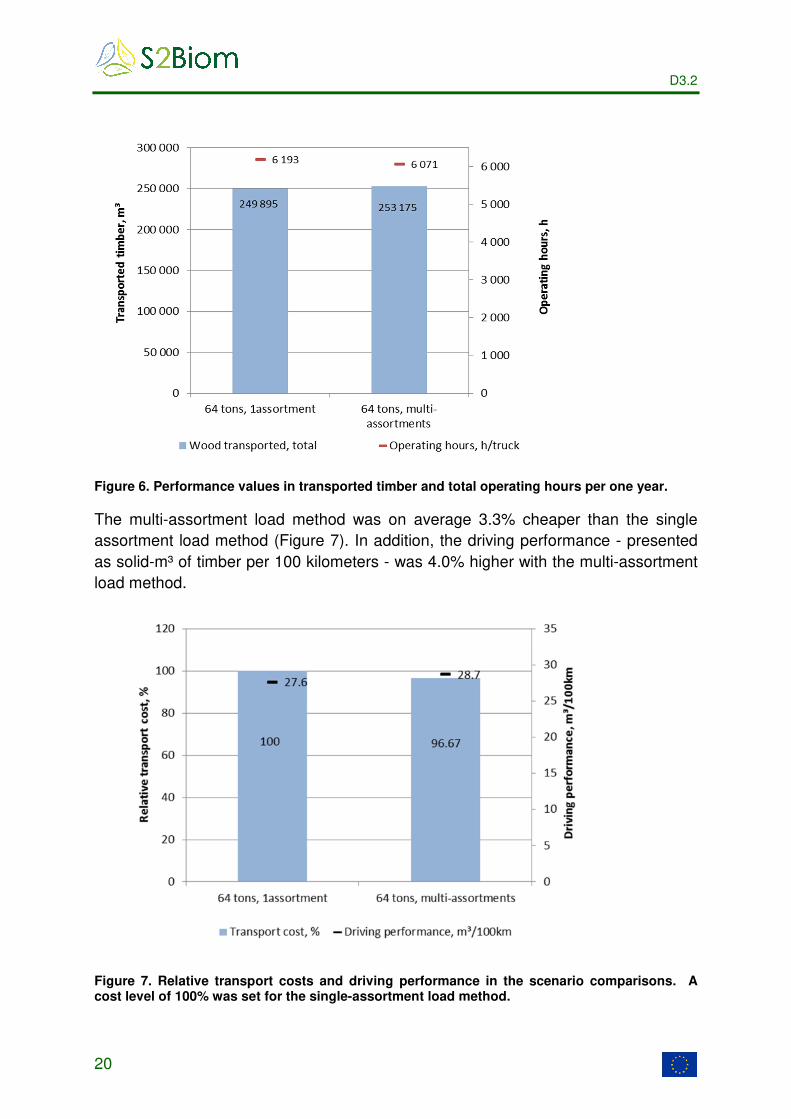
The given total timber demand of 258,000 solid-m³ was a bit too high for both
scenarios to be completed with the preset work shift arrangements by four trucks.
The multi-assortment method could achieve 253,175 m³, whereas the single-
assortment method could achieve a bit less: 249,895 m³ (Figure 6). With a 2%
smaller amount of operating hours the multi-assortment method still achieved 1.3%
more transported timber during the simulation run of one year.
D3.2
20
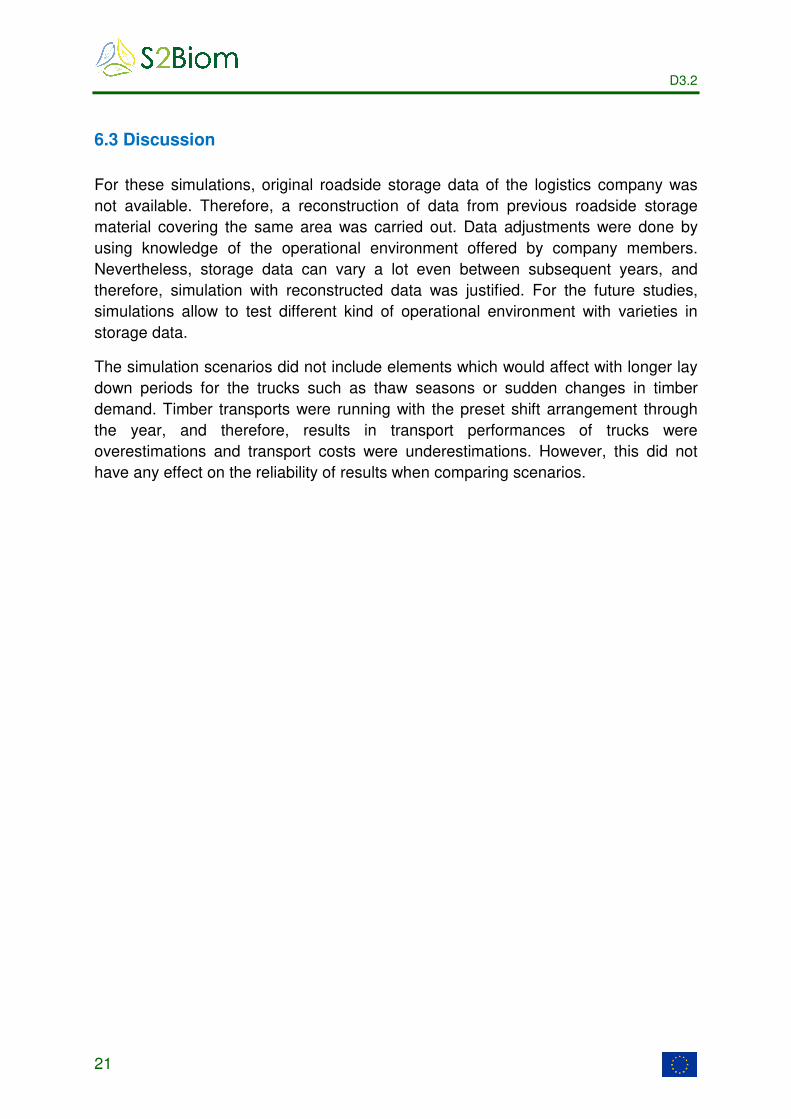
Figure 6. Performance values in transported timber and total operating hours per one year.
The multi-assortment load method was on average 3.3% cheaper than the single
assortment load method (Figure 7). In addition, the driving performance - presented
as solid-m³ of timber per 100 kilometers - was 4.0% higher with the multi-assortment
load method.
Figure 7. Relative transport costs and driving performance in the scenario comparisons. A cost level of 100% was set for the single-assortment load method.
D3.2
21
6.3 Discussion
For these simulations, original roadside storage data of the logistics company was
not available. Therefore, a reconstruction of data from previous roadside storage
material covering the same area was carried out. Data adjustments were done by
using knowledge of the operational environment offered by company members.
Nevertheless, storage data can vary a lot even between subsequent years, and
therefore, simulation with reconstructed data was justified. For the future studies,
simulations allow to test different kind of operational environment with varieties in
storage data.
The simulation scenarios did not include elements which would affect with longer lay
down periods for the trucks such as thaw seasons or sudden changes in timber
demand. Timber transports were running with the preset shift arrangement through
the year, and therefore, results in transport performances of trucks were
overestimations and transport costs were underestimations. However, this did not
have any effect on the reliability of results when comparing scenarios.
D3.2
22
7. Conclusions and recommendations
7.1 Conclusions
A detailed and precise simulation model for analyzing timber truck transport logistics
was compiled in S2Biom project using the Witness software. The simulation model
has proved to express well the behavior of truck transports of timber. According to
the first feedback from the personnel of the logistics company, the model could
certainly be used for supporting their decisions on enhancing the transport
operations.
Compared with the other logistical assessment methods in S2Biom, i.e., BeWhere
and LocaGIStics, Truck Transport Logistics is the most detailed one. This means that
it can simulate the operation of real logistical chains and even the interactions
between logistical components and stochasticity can be taken into account. The
downside of this ability is that very detailed input data, which not always is available,
is needed. The model also needs to be tailored to the operating environment which
requires expertise. Therefore, Truck Transport Logistics is not publicly available
unlike the two other tools. The ones interested in the model are advised to contact
the authors of this report.
The multi-assortment load method offers a nearly 4% improvement potential for the
transport economy compared to the prevailing single-assortment load method. Small
assortment piles at roadsides cause difficulties in efficient timber transport due to
driving between piles and the need of loading many small piles for filling the entire
load space. The multi-assortment load method decreases drastically the number of
rides between piles and, therefore, improves performance of the fleet.
7.2 Recommendations
Research topics for the future in timber transports by road with the Witness
simulation model would be to study the effect of bigger roadside storage sizes,
smaller number of timber assortments, including terminals and including high
capacity trucks for long distance transports. In addition, the influence of bigger trucks
for transporting timber from roadside storages to mills could be tested with the
Witness simulation model.
D3.2
23
References
Asikainen, A. 2001. Simulation of logging and barge transport of wood from forests
on islands. International Journal of Forest Engineering. Volume 12(2).
Karttunen, K., Väätäinen, K., Asikainen, A. & Ranta, T. 2012. The operational
efficiency of waterway transport of forest chips on Finland’s Lake Saimaa. Silva
Fennica 46(3): 395–413.
Lanner 2016. 2016. http://www.lanner.com/technology/witness-simulation-
software.html
Strandström, M. 2016. Puunkorjuu ja kaukokuljetus vuonna 2015. Metsätehon
tuloskalvosarja 4a/2016. Metsäteho Oy. 32 slides.
Tehokas puuhuolto 2025. 2015. Metsäteho Oy. 12 p.
Valtioneuvoston asetus 2013. 2013. Valtioneuvoston asetus ajoneuvojen käytöstä
tiellä annetun asetuksen muuttamisesta. 407/2013.
http://www.finlex.fi/fi/laki/alkup/2013/20130407?search%5Btype%5D=pika&search%5
Bpika%5D=ajoneuvon%20mitat%20ja%20massat
Windisch, J., Väätäinen, K., Anttila, P., Nivala, M., Laitila, J., Asikainen, A. & Sikanen,
L. 2015. Discrete-event simulation of an information-based raw material allocation
process for increasing the efficiency of an energy wood supply chain. Applied Energy
149: 315-325.