UK; Report on the experimental arrangement of Green Roof mesocosms - Sustainable Water Management
018530 - SWITCH
Sustainable Water Management in the City of the Future
Integrated Project
Global Change and Ecosystems
D.2.3.1.1 Report on the experimental arrangement of
green roof mesocosms
Due date of deliverable: 1/06/06
Actual submission date: 10/10/06
Start date of project: 1 February 2006 Duration: 60 months
Organisation name of lead contractor for this deliverable Uinversity of Birmingham, UK
Revision [final]
Project co-funded by the European Commission within the Sixth Framework Programme (2002-2006)
Dissemination Level
PU Public yes
PP Restricted to other programme participants (including the Commission Services)
RE Restricted to a group specified by the consortium (including the Commission Services)
CO Confidential, only for members of the consortium (including the Commission Services)

2
SWITCH Green Roof Project: Rationale and Experimental design
Adam Bates, Richard Greswell, Rae Mackay, Rossa Donovan and Jon Sadler
3
Contents
Introduction ......................................................................................................................... 5
Sustainable Water management Improves Tomorrow‟s Cities‟ Health (SWITCH) ...... 5
What are green roofs? ..................................................................................................... 6
What are the benefits of green roofs? ........................................................................... 11
Broad benefits ........................................................................................................... 11
Benefits related to the SWITCH project objectives .................................................. 12
Are the SWITCH benefits mutually attainable? ........................................................... 14
Aims and objectives .......................................................................................................... 14
Objectives and research questions ................................................................................ 15
The effect of height and roof type on coloniser availability ..................................... 15
Sustainable management and re-use of storm water ................................................. 15
Ecological enhancement ........................................................................................... 16
Knowledge transfer ................................................................................................... 16
Methods ............................................................................................................................. 17
The city of Birmingham, site and roof description ....................................................... 17
Green roof substrate effects .......................................................................................... 20
Experimental design .................................................................................................. 20
Statistical analysis ..................................................................................................... 21
Mesocosm design ...................................................................................................... 22
Monitoring ................................................................................................................ 23
Ecological ................................................................................................................. 24
Hydrological and Meteorological ............................................................................. 29
Water quality ............................................................................................................. 31
„Soil‟ conditions ........................................................................................................ 34
Variability in coloniser availability .............................................................................. 37
Experimental design .................................................................................................. 39
Environmental variables ........................................................................................... 39
Statistical analysis ..................................................................................................... 40
Seed dispersal ............................................................................................................ 41
Plant establishment ................................................................................................... 42
Invertebrate dispersal ................................................................................................ 43
Invertebrate establishment ........................................................................................ 44
Knowledge transfer ....................................................................................................... 44
References ......................................................................................................................... 44
Appendices ........................................................................................................................ 52
List of Figures
Figure 1 Schematic diagram of a state of the art green roof system ................................... 8
Figure 2 The experimental design (the exact distribution of mesocosms will likely vary
from that shown). The letters a-f represent sediment treatments, the arrows represent
possible broad directional environmental gradients and „edge‟ to „centre‟ gradients.
................................................................................................................................... 20
4
Figure 3 Brown roof tray design used in this investigation .............................................. 23
Figure 4 Design of the modified pitfall trap. The two outer section of the trap are 0.2L
clear plastic cups, the innermost section is a 0.3L clear plastic cup with the upper
part removed. Holes (3mm) in the bottom of the innermost and outermost sections
allow small arthropods and water to pass through respectively. Pin-sized holes in the
middle section allow the drainage of water, but not the passage of small arthropods.
Damp sediment in the lower section reduces mortality due to desiccation. ............. 28
Figure 5 A schematic diagram of the mesocosm monitoring network. ............................ 31
Figure 6 Schematic diagram of the seed trap that will be used in the investigation. ........ 42
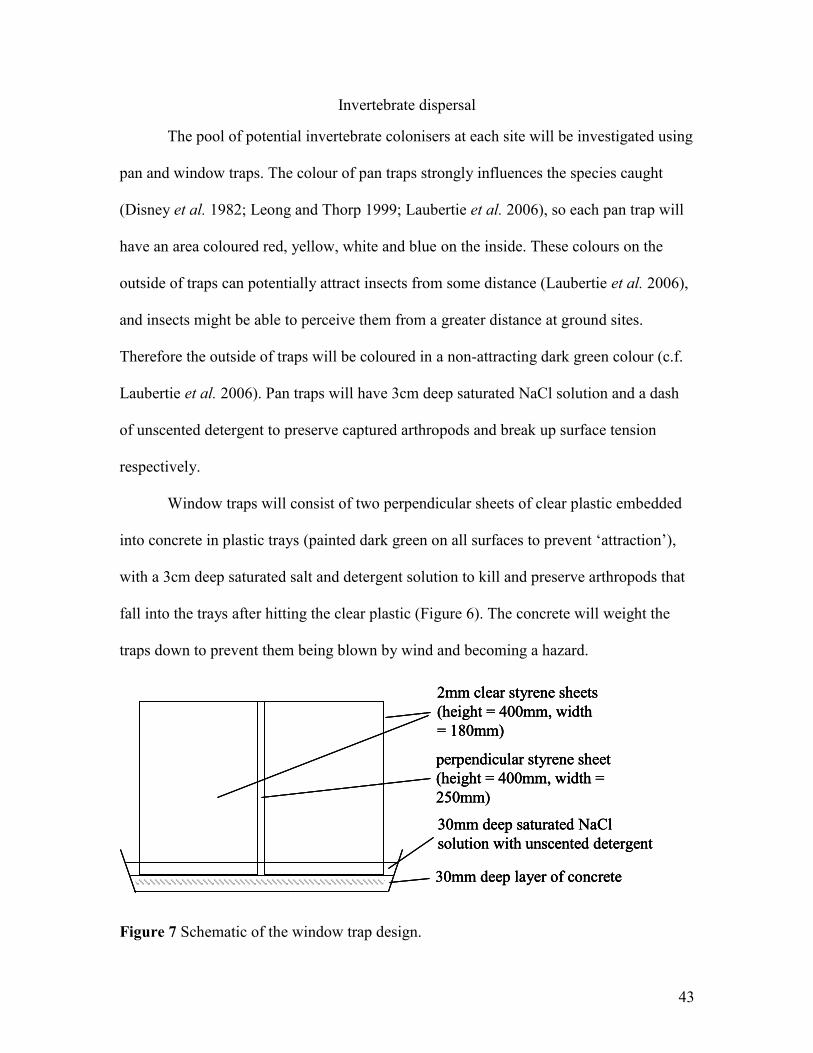
Figure 7 Schematic of the window trap design. ................................................................ 43
List of Tables
Table 1 Environmental variables used to characterise trap position ................................. 40
List of Plates
Plate 1 A selection of extensive green roof types, which vary in the substrate type,
substrate depth, and planting regime (photograph Rossa Donovan). ......................... 7
Plate 2 An extensive brown/eco-roof in Basel Switzerland (photograph Rossa Donovan)
................................................................................................................................... 10
Plate 3 The roof of the Watson building (photograph Adam Bates) ................................ 19
Plate 4 The roof of the north wing of the Arts building (photograph Adam Bates) ......... 19
Appendices
Appendix 1 The seed mix chosen for the seeded roof ...................................................... 52
Appendix 2 Vegetation record sheet ................................................................................. 53
Appendix 3 Bird activity record sheet .............................................................................. 54
Appendix 4 Drinking water quality standards under: the water supply (water quality)
regulations 2000. Prescribed concentrations and values at consumer‟s taps. ........... 55
Appendix 5 ColitagTM
test for the presence or absence of total coliforms and E. coli ..... 55
Appendix 6 ISO 10390:2005 determination of soil pH .................................................... 55
Appendix 7 BS 7755-3.4:1995 Determination of the specific electrical conductivity of the
soil. ............................................................................................................................ 56
Appendix 8 The determination of the overall density of soil particles (modified from
Rowell 1994). ............................................................................................................ 56
Appendix 9 Determination of overall dry bulk density (modified from ISO 11272:1998)
................................................................................................................................... 56
Appendix 10 Measurement of water content at the approximate field capacity,
approximate permanent wilting point and loss on ignition (modified from Rowell
1994). ........................................................................................................................ 57
5
Introduction
Sustainable Water management Improves Tomorrow’s Cities’ Health (SWITCH)
Global population growth and increasing per capita demand for water resources
have caused huge unsustainable negative social, environmental and economic impacts
around the world (Micklin 1988; Bulloch and Darwish 1993; Nilsson and Berggren 2000;
Tockner and Stanford 2002). These problems are likely to intensify in the future due to
concomitant increases in population size, per capita water demand, and the intensity of
climate change, with precipitation and hydrological regimes typically becoming more
unpredictable and extreme (IPPC 2001; Chiew and McMahon 2002; Hulme et al. 2002;
Pilling and Jones 2002; Christensen and Christensen 2003). Of particular concern are
urban areas, where high population density and extreme environmental modification
make sustainable water management particularly challenging (Ellis and Marsalek 1997;
White and Howe 2004). These challenges can only increase in the future as urban land
area and population increase (c.f. UNFPA 1996; UN 2002). There is therefore, an urgent
need for a paradigm shift in urban water management (UWM), which converts current
retrospective, fragmented, problem driven approaches to proactive, holistic, sustainability
driven approaches (Ellis and Marsalek 1997; White and Howe 2004; House of Lords
2006; SWITCH-Annex 1 2006). It is with this eventual aim in mind that the Sustainable
Water management Improves Tomorrow‟s Cities‟ Health (SWITCH) project has been
developed.
SWITCH is a research driven action orientated project, which has as its main
objective: “The development, application and demonstration of a range of tested
scientific, technological and socio-economic solutions and approaches that contribute to
6
the achievement of sustainable and effective UWM schemes in „The City of the future‟”
(SWITCH-Annex 1 2006). It brings together 32 partners to develop robust and flexible
interactive urban water systems and services across nine cities, which can then be
adjusted and conveyed to the geographical and ecological settings of other cities via
vertical and horizontal exchange of information through learning alliances. In this way it
aims to provide criteria and guiding principles to help cities convert to sustainable UWM
practices, with a view to providing high quality water services for all in a way that does
not unduly compromise environmental and ecological processes.
What are green roofs?
Green roofs is a broad term for roofs of buildings that have plants growing on
them. They are of two main types: (1) intensive green roofs, which are usually heavily
landscaped „gardens‟ that usually require additional structural support, heavy
management and considerable expenditure, and (2) extensive green roofs, which have a
shallow substrate layer, can be installed on most low-angle roofs, require minimal
management and are relatively inexpensive. The application of green roofs over large
urban areas is only really practical using extensive designs and these are the focus of this
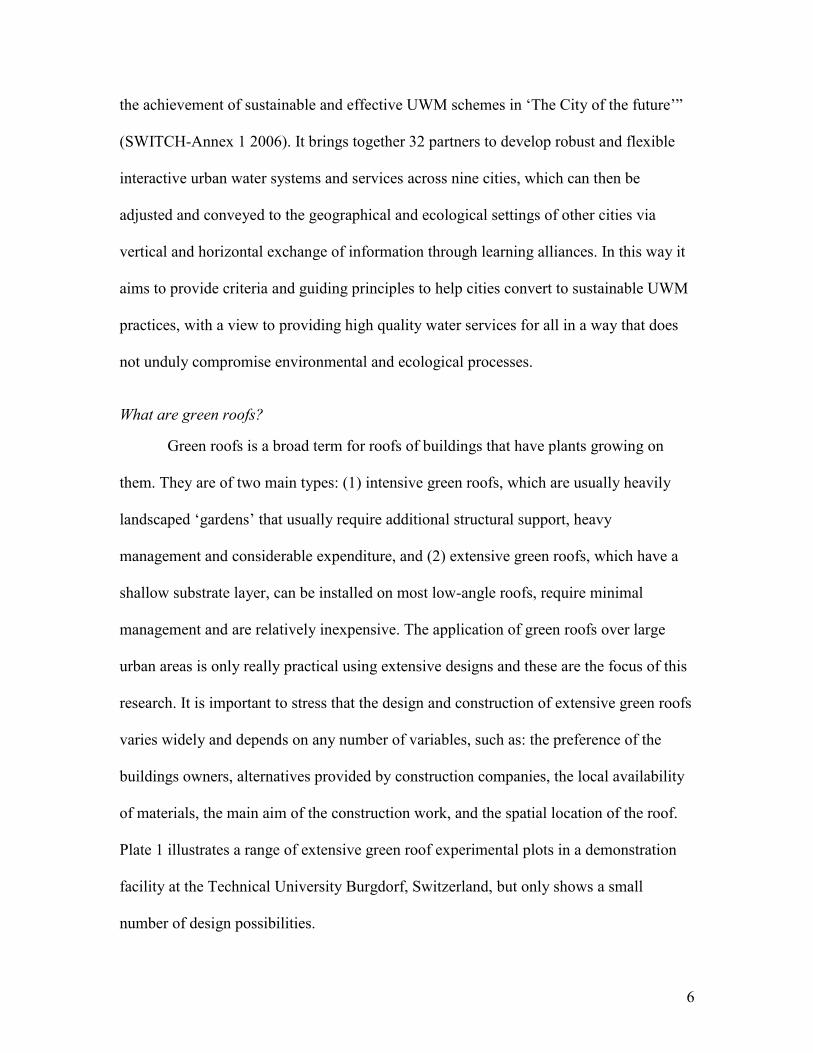
research. It is important to stress that the design and construction of extensive green roofs
varies widely and depends on any number of variables, such as: the preference of the
buildings owners, alternatives provided by construction companies, the local availability
of materials, the main aim of the construction work, and the spatial location of the roof.
Plate 1 illustrates a range of extensive green roof experimental plots in a demonstration
facility at the Technical University Burgdorf, Switzerland, but only shows a small
number of design possibilities.
7
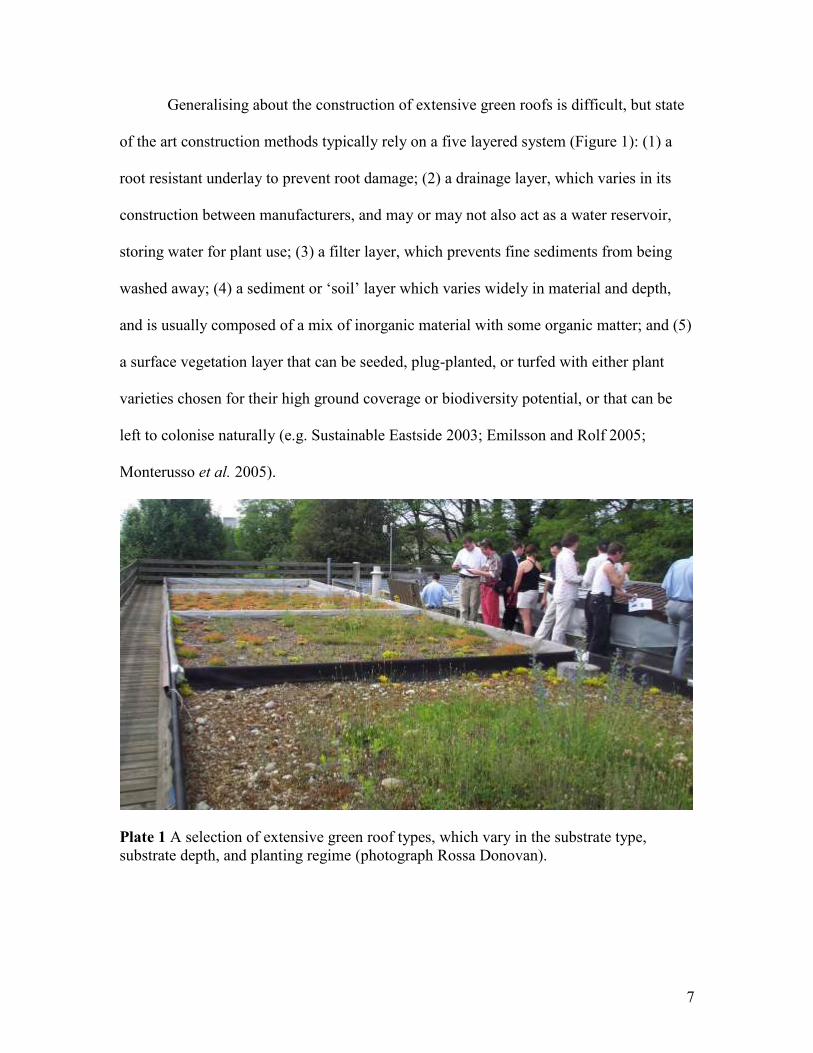
Generalising about the construction of extensive green roofs is difficult, but state
of the art construction methods typically rely on a five layered system (Figure 1): (1) a
root resistant underlay to prevent root damage; (2) a drainage layer, which varies in its
construction between manufacturers, and may or may not also act as a water reservoir,
storing water for plant use; (3) a filter layer, which prevents fine sediments from being
washed away; (4) a sediment or „soil‟ layer which varies widely in material and depth,
and is usually composed of a mix of inorganic material with some organic matter; and (5)
a surface vegetation layer that can be seeded, plug-planted, or turfed with either plant
varieties chosen for their high ground coverage or biodiversity potential, or that can be
left to colonise naturally (e.g. Sustainable Eastside 2003; Emilsson and Rolf 2005;
Monterusso et al. 2005).
Plate 1 A selection of extensive green roof types, which vary in the substrate type,
substrate depth, and planting regime (photograph Rossa Donovan).
8
Roof surface
Drainage/Reservoir layer
Filter layer
Growing medium
Anti-root layers
Vegetation
Roof surface
Drainage/Reservoir layer
Filter layer
Growing medium
Anti-root layers
Vegetation
Figure 1 Schematic diagram of a state of the art green roof system
Old demolition and post-industrial sites, often known as brownfields, typically
provide important centres of biodiversity not only locally within an urban area but also
across regional and sometimes national scales (e.g. Gilbert 1984; Shepherd 1994; Lott
and Daws 1995; Spalding and Haes 1995; Eversham et al. 1996; Gibson 1998; Small et
al. 2003, 2006; Woodward et al. 2003; Donovan et al. 2005; Angold et al. 2006). They
provide habitat for a diversity of rare species, which were mainly formerly associated
with steppe like grassland and later nutrient poor farmland, but are now selected against
in intensively managed „improved‟ agricultural landscapes (Wilson 1992; Eversham et al.
1996; Rich and Woodruff 1996; Andersen 2000). As such, they are now increasingly
viewed as habitats deserving conservation protection, both to conserve the habitat itself
and to safeguard wider urban biodiversity and habitat connectivity (Harrison and Davies
2002; Donovan et al. 2005). At present, the extent of brownfields in the UK is an
estimated 66,000 ha and is growing at a rate of 7 ha per day (Thornton and Nathanail
2005). Nonetheless, brownfield communities are under considerable development
pressure in many cities (Harrison and Davies 2002), and this pressure can only increase,
as their redevelopment is considered a key element of sustainable regeneration, is
9
currently enshrined in several UK development policies, and can be subject to several
funding initiatives and tax breaks (Pediaditi et al. 2005; Thorton and Nathanail 2005).
However, if sustainability in its absolute sense is the goal, redevelopment should
compensate for the habitat destroyed by recreating brownfield habitat of a type as close
as possible to that lost (Donovan et al., 2005). These factors have made brownfield
habitat recreation one of the main aims of ecologically orientated extensive green roof
development.
Ecological surveys of brownfield sites (Gibson 1998; Small et al. 2003; Donovan
et al. 2005), experience from habitat creation and restoration (Gilbert and Anderson
1998; Sackville Hamilton 2001; Bischoff et al. 2006), and exploratory green roof
research in several countries (e.g. Brenneisen 2003; Gedge 2003; Ngan 2004), have
produced a number of useful design criterion for recreating brownfield habitat and
maximising biodiversity using extensive green roofs. These are to: (a) use low nutrient
substrate layers, to prevent dominance by a few highly competitive species; (b) maximise
the range of microhabitats, from open bare ground to areas heavily vegetated with ruderal
species by controlling substrate type and depth; and (c) allow natural colonisation, or use
seed with a local provenance in order to preserve genetic diversity and to possibly (c.f.
Wilkinson 2001; Bischoff et al. 2006) increase plant adaptation to local environmental
conditions. Due to their nature, extensive green roofs that fulfil these criteria are
sometimes termed brown, or eco-roofs (e.g. Plate 2) and it is this type of roof that is the
main focus of this research. There remain important questions however, about how
closely brown roofs replicate brownfield habitats and can be used to support species
associated with these habitats (Grant et al. 2003), particularly in relation to the effect of
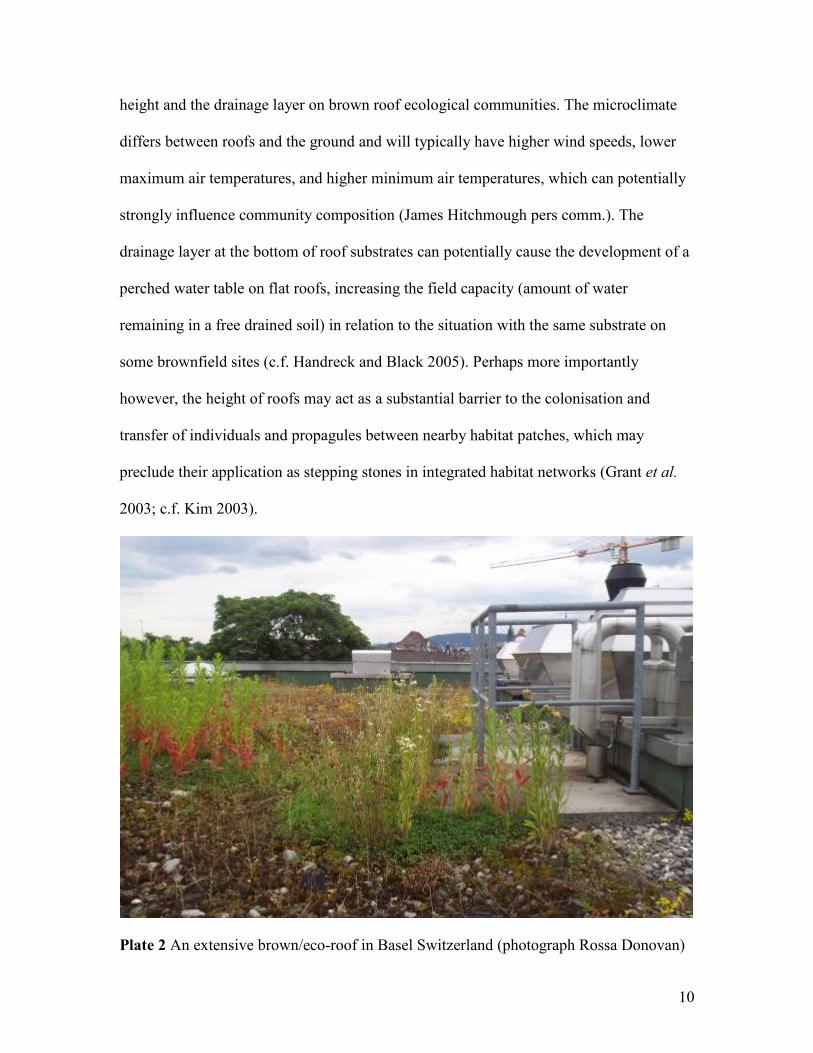
10
height and the drainage layer on brown roof ecological communities. The microclimate
differs between roofs and the ground and will typically have higher wind speeds, lower
maximum air temperatures, and higher minimum air temperatures, which can potentially
strongly influence community composition (James Hitchmough pers comm.). The
drainage layer at the bottom of roof substrates can potentially cause the development of a
perched water table on flat roofs, increasing the field capacity (amount of water
remaining in a free drained soil) in relation to the situation with the same substrate on
some brownfield sites (c.f. Handreck and Black 2005). Perhaps more importantly
however, the height of roofs may act as a substantial barrier to the colonisation and
transfer of individuals and propagules between nearby habitat patches, which may
preclude their application as stepping stones in integrated habitat networks (Grant et al.
2003; c.f. Kim 2003).
Plate 2 An extensive brown/eco-roof in Basel Switzerland (photograph Rossa Donovan)
11
What are the benefits of green roofs?
Broad benefits
The installation of extensive green roofs increases the construction cost of new
buildings and can represent a significant monetary investment when retro-fitted.
However, the life cycle costs of using extensive green roofs can be lower than
conventional roofs, even in countries (e.g. UK, Singapore) where low uptake has meant
that economies of scale do not yet exist (e.g. Wong et al. 2003), and the life cycle
environmental benefits of using green roofs are significant (Saiz et al. 2006; Kosareo and
Ries in press). Advantages include: (1) reductions in the need for air conditioning and
heating through their effect on a buildings thermal performance (Barrio 1998;
Eumorfopoulou and Aravantinos 1998; Niachou et al. 2001; Onmura et al. 2001;
Takakura et al. 2000; Liu 2002; Kumar and Kaushik 2005; Lazzarin et al. 2005; Saiz et
al. 2006); (2) reductions in atmospheric carbon dioxide through the uptake by plants and
lower levels of release; (3) an improvement in air quality through the binding of dust,
filtering of air pollution, increased levels of oxygen and humidity, and reduced ozone
concentrations due to city temperature reductions (McMarlin 1997; Rosenfeld et al. 1998;
Grant et al. 2003; Ngan 2004; c.f. Wolverton and Wolverton 1993; Orwell et al. 2004);
(4) a reduction in the urban heat island effect through increased humidity and alteration
of the specific heat capacity of roof surfaces (Onmura et al. 2001; Bass and Kryenhoff
2002; c.f. Rosenfeld et al. 1998; Takakura et al. 2000; Akbari et al. 2001; Dimoudi and
Nikolopoulou 2003); (5) protection of roof waterproof membranes by (a) moderating
temperature and thus reducing expansion and shrinkage damage, (b) providing protection
from mechanical damage caused by human traffic and hail, and (c) providing protection
12
from ultra-violet radiation (Liu 2002; Wong et al. 2003); (6) the attenuation of outside
noise from rainwater, hail, and airplanes; (7) aesthetic and amenity value, which can
potentially enhance emotional wellbeing (c.f. Ulrich 1984; Relf and Lohr 2003) and raise
property value (Ngan 2004); (8) the enhancement of a company‟s environmental image
(e.g. Ford Motor Company, Dearborn, Michigan; and Barclays Bank, Canary Wharf,
London); and (9) the sustainable re-use of „waste‟ aggregates, reducing landfill pressure,
and material transport costs (Grant et al. 2003), which are currently associated with
financial incentives in the UK due to the landfill tax and aggregates levy. Some of these
potential advantages have been the subject of careful academic investigation (advantages
1, 3 and 4) others, however, are yet to be rigorously tested.
Benefits related to the SWITCH project objectives
Extensive green roofs can potentially fulfil several features highlighted by the
SWITCH project objectives as essential for the development of sustainable UWM.
Firstly, extensive green roofs can reduce storm water runoff intensity by delaying,
retaining and returning water to the atmosphere via evapotranspiration (Köhler et al.
2002; Monterusso et al. 2004; Bengtsson 2005; Bengtsson et al. 2005; Kidd 2005,
VanWoert 2005; Villarreal and Bengtsson 2005; Mentens et al. 2006; Carter and Jackson
in press; Carter and Rasmussen in press). They can therefore reduce pressure on the urban
drainage infrastructure, and reduce the incidence of flooding and fluvial erosion, thereby
having considerable potential for utilization within Sustainable (Urban) Drainage
System‟s (SUDS) or stormwater Best Management Practices (BMPs) (Carter and Jackson
in press; c.f. White and Howe 2004; Ellis and Marsalek 1997). Secondly, extensive green
roofs can potentially improve ecological conditions in urban streams by reducing the
13
influx (e.g. from combined sewer overflows) and re-suspension of pollutants during
heavy rainfall and high flow events, reducing the level of hydrological disturbance
(Carter and Jackson in press; c.f. White and Howe 2004; Walsh et al. 2005a, b; Lawler et
al. 2006; Robson et al. in press), and by storing or removing pollutants from precipitation
as the water travels through the sediment (Köhler et al. 2002). The latter can be due to
high pH taking metals out of suspension, or the uptake of nutrients by plants (Aziz and
Smith 1992; Johnston and Newton 1993; Steusloff 1998), although recent evidence
suggests that extensive fertilised sedum-moss roofs can in some instances increase the
level of contaminants in runoff (Berndtsson et al. 2006). Thirdly, green roof water
through-flow could potentially be harvested for non-potable uses such as toilet flushing,
cleaning, and garden watering (Saiz et al. 2006; c.f. Hochstrat et al. 2006; House of
Lords 2006).
Extensive green roofs can potentially be used to address all three of these
SWITCH project objectives and should not compromise the environment, but rather have
favourable effects on the communities of urban streams and rivers. Moreover, the
installation of extensive green roofs should actually enhance a city‟s natural environment
by creating new habitat, particularly when a brown roof design is used. Extensive green
roofs have successfully been installed in a large number of countries with widely
differing climates (e.g. Köhler et al. 2002; Onmura et al. 2002; Gedge 2003; Grant et al.
2003; Ngan 2004; Emilsson and Rolf 2005; Kumar and Kaushik 2005), so the method is
likely to be robust and flexible and has large global potential. Although it must be
appreciated that findings from one climatic region cannot easily be extrapolated to
different climatic regions (Mentens et al. 2006; James Hitchmough pers comm.).
14
Are the SWITCH benefits mutually attainable?
The largest green roof reductions in storm water run-off are achieved through the
use of large sediment depth and/or vegetation ground cover (Emilsson and Rolf 2005;
Kidd 2005; Mentens et al. 2006). The maintenance of high vegetation cover typically
requires the use of specialist xerophilic plants such as species of Sedum, and a fertile soil.
High soil fertility can lead to nitrate leaching, which can compromise through-flow water
quality (Ngan 2004), whilst continuous coverage of Sedum compromises roof
biodiversity (Kadas 2002). Green roof designs that maximise reductions in storm water
run-off may not permit sufficient through-flow of water to allow viable use for toilet
flushing and garden watering. So the potential SWITCH benefits of extensive green roofs
do trade-off against each other to some degree. It is hoped that a brown roof design can
combine high biodiversity value with sufficient reductions in storm water run-off, whilst
still supplying enough water, of sufficient quality, for viable water use in certain
applications.
Aims and objectives
This investigation has three distinct, but interrelated broad research aims: (1) to
examine how closely brown roofs mirror the conditions on brownfield sites, particularly
in relation to the differing propensity for colonisation between these two habitat types; (2)
to investigate the effect of substrate type on the ecology and hydrochemistry of brown
roofs to determine which substrate can be used to best fulfil storm water interception,
water re-use and biodiversity objectives; (3) to transfer the findings of the project to
encourage the uptake of the best-practise in green roof design, as identified by this
research.
15
Objectives and research questions
The project objectives and research questions have been sub-divided into four
themes, (a) the effect of height and roof type on coloniser availability, (b) the sustainable
management and re-use of storm water, (c) the ecological enhancement effects of green
roofs, and (d) the knowledge transfer of new understanding and techniques to the
Birmingham Learning Alliance.
The effect of height and roof type on coloniser availability
1. To measure the relative fallout/rain of plant seeds at multiple ground sites and
roofs of various types and character.
2. To assess the viability of the collected seeds for colonisation and establishment on
brown roofs.
3. To measure the relative availability of indicator groups of invertebrate colonisers
on the same ground sites and roofs.
4. Does the height of brown roofs mean that they are too isolated from other similar
habitats to be naturally colonised by plants and invertebrates, and can they
therefore act as stepping stones between brownfield habitats?
Sustainable management and re-use of storm water
5. To measure the quantity of local precipitation, „traditional‟ roof run-off, and green
roof through-flow to calculate the amount of precipitation intercepted, stored and
lost through evapotranspiration by brown roofs.
6. To measure the chemical quality of local precipitation, „traditional‟ roof run-off,
and brown roof through-flow, to determine the effect of brown roofs on water
quality.

16
7. How do different substrate types, different amounts and types of vegetation cover,
the „age‟ of green roofs, and local climatic conditions affect the quantity and
quality of brown roof through flow?
8. Can brown roofs be used as a useful tool for the management of storm water
quantity and quality?
9. Can the through-flow of brown roofs form a viable source of water for domestic
use, and if so, what is it most suitable for (e.g. toilet flushing, gardening,
drinking)?
Ecological enhancement
10. To measure the changing diversity of a number of ecological indicator groups and
investigate the influence of substrate type on ecological diversity.
11. To measure the changing ecological functional resource diversity on brown roofs
(e.g. vegetation cover, nectar sources, etc) and investigate the influence of
substrate type on functional resource diversity.
12. Can brown roofs with natural colonisation be used to mitigate for the loss of
brownfield habitat, or is the use of substrates sourced from local brownfields, or
seeding of brown roofs necessary to achieve this?
Knowledge transfer
13. To transfer knowledge both independently and via the Birmingham learning
alliance to water utility managers, urban planners, consultancies, the general
public, and academics and their students to illustrate the ecological, hydrological,
social and economic value of green roofs for sustainable urban living.
17
Methods
The city of Birmingham, site and roof description
Birmingham is one of the nine demonstration cities in the SWITCH project and in
terms of the SWITCH global change indicators is characterised by: (a) changing rainfall
patterns, (b) limited water scarcity, (c) limited population growth, and (d) limited
urbanisation and industrialisation. In addition the city has a: (e) high per capita income,
(f) high water sector development, and (g) a moderate, maritime climate. Birmingham
city itself has a population of one million but is part of a much larger conurbation.
The city largely developed in the 18th
and 19th
centuries as an industrial centre in
Britain‟s industrial revolution, but over the last fifty years industry has declined
substantially. The resultant industrial derelict buildings and brown-field sites have
become home to diverse urban ecological communities at a variety of stages of
succession (Angold et al. 2006; Small et al. 2003). However current regeneration projects
(e.g. Eastside Porter and Hunt 2005) are rapidly developing derelict and brown-field sites
to the detriment of Birmingham‟s biodiversity resource. The Nature Conservation
Strategy for Birmingham (Birmingham City Council 1997) aspires to sustainably manage
the city‟s biodiversity resources, aiming to keep the amount of brownfield habitat
constant, and to allow all people close access to natural open spaces. The construction of
brown roofs in the city can help achieve those aims if (a) brown roofs are shown to be a
reasonable replacement for brownfield habitat, and (b) people are able to enjoy brown
roof habitat, either through direct access, or by other exposure to them (e.g. seeing them
through their windows).
18
The Nature Conservation Strategy for Birmingham also aims to link isolated
wildlife habitats using wildlife corridors and wildlife stepping stones (c.f. Dawson 1994).
Such initiatives are only likely to be successful where corridors and stepping stones are of
a similar habitat type to the isolated habitat patches (Dawson 1994; Fernández-juricic
2000; Angold et al. 2006), therefore brown roofs may act as stepping stones between
communities of brownfield and other disturbed early successional habitat patches.
However, it is possible that the dispersal abilities of many species associated with
disturbed habitats are so good, that they are capable of colonising new habitat patches
regardless of the degree of connectivity between patches of habitat, and that only species
with intermediate dispersal abilities could benefit from brown roof stepping stones (c.f.
Gilpin 1980; Dawson 1994; Small et al. 2006). Good evidence supporting the concept
that enhancing levels of habitat connectivity increase the dispersal of individuals between
habitats is generally lacking (Dawson 1994), so the whole concept may be erroneous.
The two brown roof outdoor laboratories will be situated on The University of
Birmingham‟s main Edgbaston campus. A phase-1 habitat survey of the campus has
recently been completed and digitised. This allows the testing of the effects of a number
of landscape parameters on colonisation characteristics. Two buildings have been
selected for the installation of the two brown roof field laboratories: (1) the Watson
building (Plate 3), and (2) the north wing of the Arts building (Plate 4). Each building is
4-5 stories high and has sufficient edge protection to allow safe sampling.
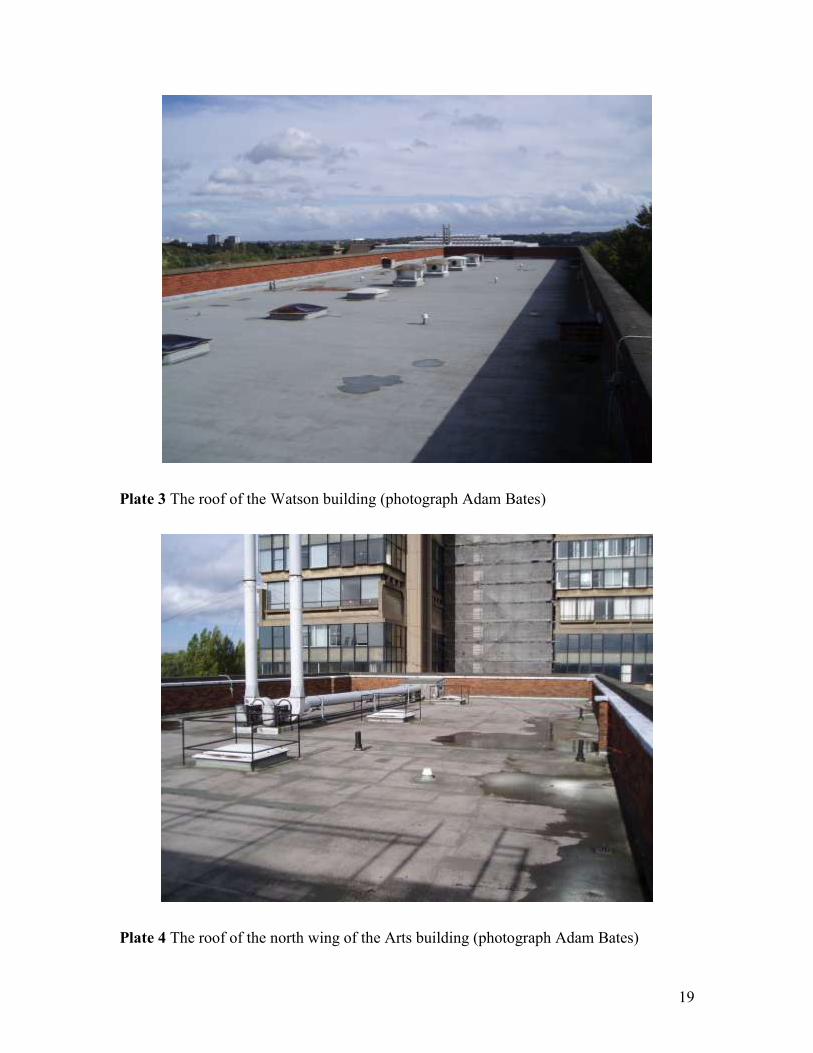
19
Plate 3 The roof of the Watson building (photograph Adam Bates)
Plate 4 The roof of the north wing of the Arts building (photograph Adam Bates)
20
Green roof substrate effects
Experimental design
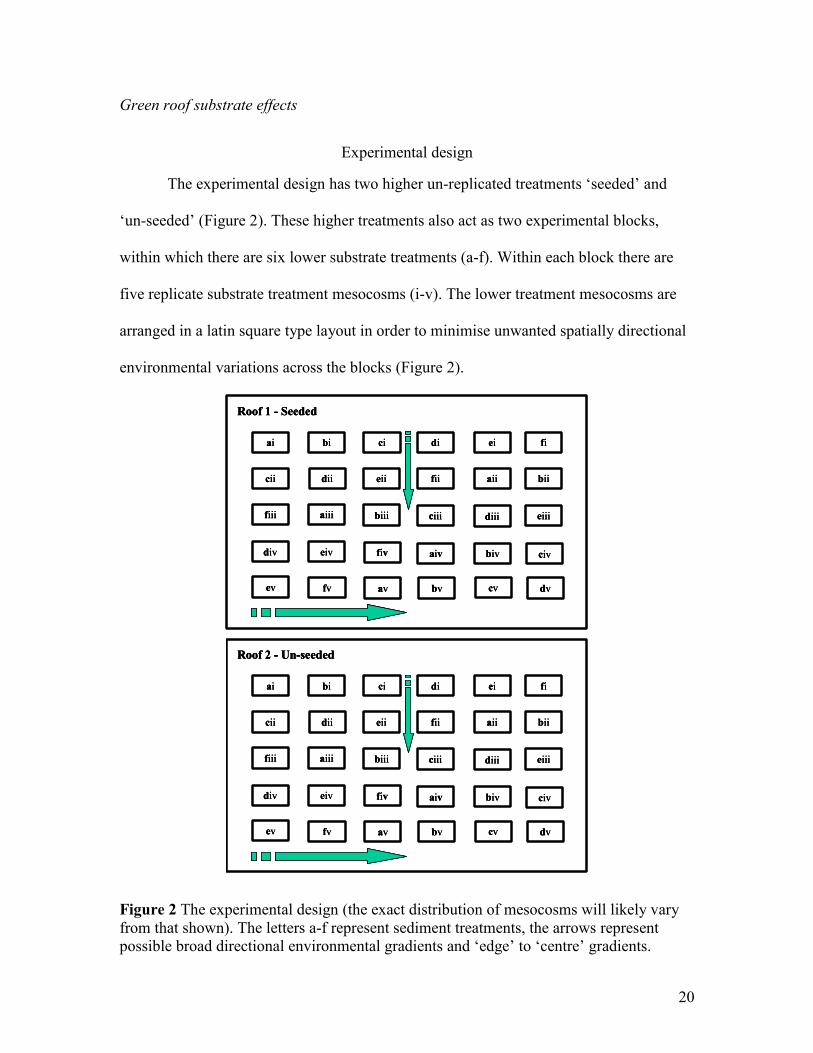
The experimental design has two higher un-replicated treatments „seeded‟ and
„un-seeded‟ (Figure 2). These higher treatments also act as two experimental blocks,
within which there are six lower substrate treatments (a-f). Within each block there are
five replicate substrate treatment mesocosms (i-v). The lower treatment mesocosms are
arranged in a latin square type layout in order to minimise unwanted spatially directional
environmental variations across the blocks (Figure 2).
ai bi ci
cii dii
fiii
eii
aiii biii
Roof 1 - Seeded
aiv
ev dv
biv
fv
civ
cvav bv
di ei fi
fii aii
ciii
bii
diii eiii
div eiv fiv
ai bi ci
cii dii
fiii
eii
aiii biii
Roof 2 - Un-seeded
aiv
ev dv
biv
fv
civ
cvav bv
di ei fi
fii aii
ciii
bii
diii eiii
div eiv fiv
ai bi ci
cii dii
fiii
eii
aiii biii
Roof 1 - Seeded
aiv
ev dv
biv
fv
civ
cvav bv
di ei fi
fii aii
ciii
bii
diii eiii
div eiv fiv
ai bi ci
cii dii
fiii
eii
aiii biii
Roof 1 - Seeded
aiv
ev dv
biv
fv
civ
cvav bv
di ei fi
fii aii
ciii
bii
diii eiii
div eiv fiv
ai bi ci
cii dii
fiii
eii
aiii biii
Roof 2 - Un-seeded
aiv
ev dv
biv
fv
civ
cvav bv
di ei fi
fii aii
ciii
bii
diii eiii
div eiv fiv
ai bi ci
cii dii
fiii
eii
aiii biii
Roof 2 - Un-seeded
aiv
ev dv
biv
fv
civ
cvav bv
di ei fi
fii aii
ciii
bii
diii eiii
div eiv fiv
Figure 2 The experimental design (the exact distribution of mesocosms will likely vary
from that shown). The letters a-f represent sediment treatments, the arrows represent
possible broad directional environmental gradients and „edge‟ to „centre‟ gradients.
21
Individual mesocosms will be spatially separated in order to minimise as far as
possible the transfer of individuals and propagules between mesocosms, but will not be
so far apart that small-scale environmental variation is likely to become very important.
On the seeded roof block, a mixture of seeds that are known to do well on brown roofs
(Dusty Gedge and Emorsgate wild seed company pers comm.), mainly made up of
species associated with brownfield sites in Birmingham (Appendix 1) will be spread on
the trays at a density of 1 g m-2
, with the seed mixed with dry sand to help ensure an even
distribution. Grasses have been avoided in this mix, as they tend to outperform and
competitively exclude forb species on aggregate substrates and therefore lead to low
diversity (Hitchmough et al. 2001). Cross-colonisation between mesocosms is a
possibility, but their spatial separation will mean that this can only be achieved through
active, or inactive „flight‟, rather than cursorial movements. To date, as far as the authors
are aware, all ecological investigations of green roof substrate effects have used no, or
very little separation (short vertical wooden boards), to separate experimental plots. The
degree of spatial separation in this experiment is therefore a considerable improvement
on the other designs.
Statistical analysis
Data from the seeded and un-seeded blocks will be analysed separately. One-way
ANOVA‟s will be performed using substrate type as the treatment, with data
transformations where it is necessary to homogenise variance and move towards
statistical normality.
22
Mesocosm design
The overall design of all mesocosms will be the same, the only factor that will
vary between treatments is the substrate composition. Mesocosms will consist of a
plywood deck (2.44 x 1.22m) with timber curbs at all sides and a 50mm outlet in one
corner. Two bitumen waterproof layers, the upper being root resistant, will be fixed to the
plywood deck, above which will sit a composite drainage-reservoir board and fleece
layer. The waterproof layers will be wrapped around the timber curbs. The drainage-
reservoir board will allow free drainage of the substrate and will provide a temporary
store of water. The fleece layer will limit the amount of fine sediment that washes
through the mesocosms. The mesocosms will be installed with a 2 slope along their long
axis. Roof blocks will be placed on protection boards that will extend 1m beyond the
experimental area to protect the roofs from foot traffic during sampling.
Bengtsson (2005) has shown that altering the size of experimental green roof plots
does not alter the hydrological response of the plots as the response is controlled by
vertical, rather than horizontal flow characteristics. Brown roof biodiversity experiments
in London (Kadas pers comm.) have sampled large numbers of invertebrates from small
experimental plots. Therefore the relatively small size of the experimental mesocosms
was considered sufficient for the purposes of the investigation.
The sediment layer will be composed of on average 10cm of inorganic substrate,
with a 1cm mulch of either sterilised loam or IKO extensive soil mix in all treatments
(see below). Each tray will include one 20cm mound of inorganic substrate at the up-
slope end as a biodiversity enhancement measure. The six treatments will be: (1) 40mm
down crushed demolition aggregate (mainly concrete and brick, but also ceramics, sand,
etc.) with a sterilised loam mulch, (2) 40mm down crushed demolition aggregate with an
23
IKO extensive soil mix mulch (3) 40mm down solid municipal waste incinerator bottom
ash (glass, ceramics, concrete, fused material, etc) with a sterilised loam mulch, (4) 3:1
crushed demolition aggregate : conditioned pulverised fuel ash mix with a sterilised loam
mulch, (5) 1:1 crushed demolition aggregate : asphalt shavings mix with a sterilised loam
mulch, (6) 1:1 crushed demolition waste : solid municipal waste incinerator bottom ash
mix with a sterilised loam mulch. The substrate production processes do not necessarily
preclude the colonisation by plant or invertebrate propagules, but substrates will be used
soon after their production to minimise the chance of propagule contamination as much
as possible, and few seeds are typically contained in such aggregates (Hitchmough et al.
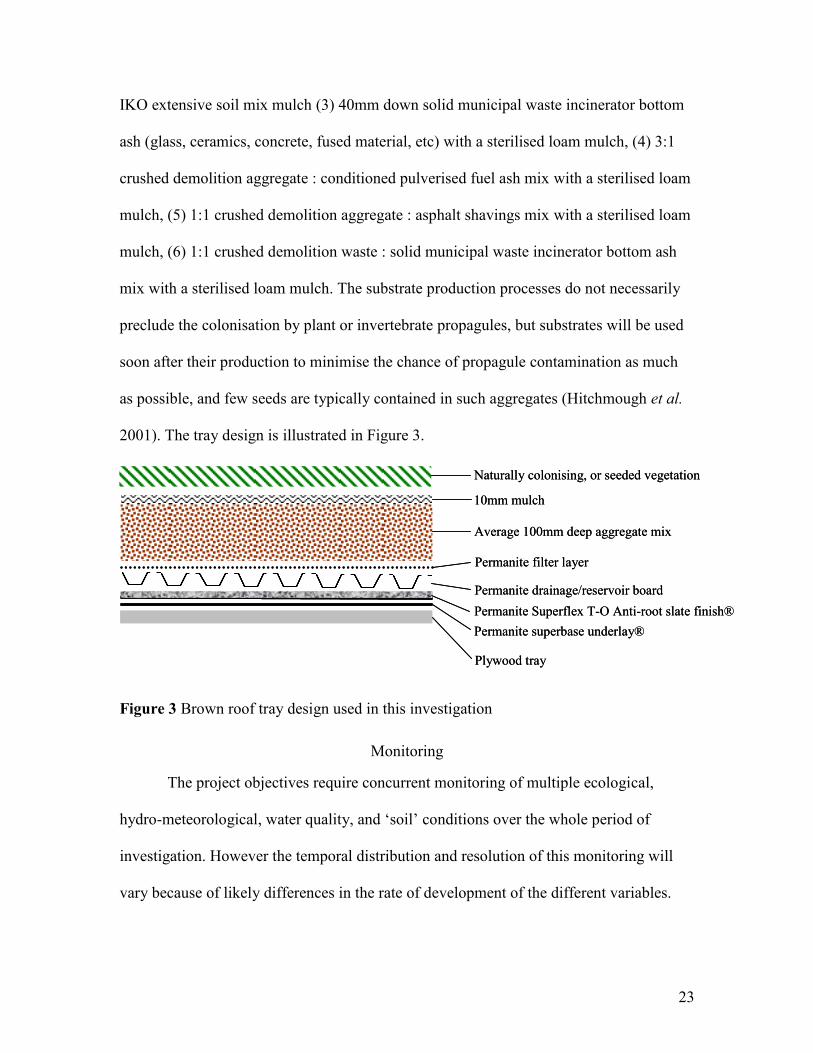
2001). The tray design is illustrated in Figure 3.
Permanite Superflex T-O Anti-root slate finish®
Permanite superbase underlay®
Permanite drainage/reservoir board
Permanite filter layer
Average 100mm deep aggregate mix
Naturally colonising, or seeded vegetation
10mm mulch
Plywood tray
Permanite Superflex T-O Anti-root slate finish®
Permanite superbase underlay®
Permanite drainage/reservoir board
Permanite filter layer
Average 100mm deep aggregate mix
Naturally colonising, or seeded vegetation
10mm mulch
Plywood tray
Figure 3 Brown roof tray design used in this investigation
Monitoring
The project objectives require concurrent monitoring of multiple ecological,
hydro-meteorological, water quality, and „soil‟ conditions over the whole period of
investigation. However the temporal distribution and resolution of this monitoring will
vary because of likely differences in the rate of development of the different variables.
24
The temporal distribution of sampling is currently provisional, and will depend very
much on the rate of development and changing meteorological conditions.
Ecological
Target taxonomic study groups and identification precision
Changing biodiversity and ecological community composition on the
experimental units will be assessed using a number of taxonomical groups chosen for
their community function, ease of sampling and identification, and microhabitat
dependencies. Sampling and identification of all species will not be possible due to the
large range of sampling methods, requirements for diverse taxonomical expertise, and
potential damage to the developing biological communities.
The target study groups and level of identification are: (1) carabid beetles
(Coleoptera, Carabidae), identified to species; (2) other beetles (Coleoptera) identified to
species in most instances; (3) spiders identified to species in most instances; (4) wasps,
identified to species where possible; (5) bees, identified to species; (6) butterflies,
identified to species; (7) birds, identified to species; and (8) plants, identified to species
where possible. Carabid beetles are strongly dependent on sediment microclimate and
structure, so are good indicators of substrate conditions and have variable active flight
capabilities (Thiele 1977). Spiders can be indicative of substrate conditions if they are
ground dwelling, but can also be indicative of plant structural conditions if they are orb
weaving. They are not capable of active flight, but are dependent on passive „flight‟ by
ballooning on air currents (Bristowe 1958). Other beetle species range markedly in their
microhabitat and dispersal capabilities and are indicative of substrate conditions, and
plant structure and species. Many species of bees and wasps are dependent on open
25
friable substrate for nesting and shelter, and are therefore often associated with
brownfield sites (Falk 1991; O‟Toole and Raw 1991) and could be favoured by brown
roofs (Grant et al. 2003). Some species, particularly the social species, are strong fliers,
but flight ability typically decreases strongly with body size (Gathmann and Tscharntke
2002). Adult and larval bees and many wasps require nectar and pollen for food (Potts et
al. 2003), and in most geographical regions bees are the principle pollinator group
(Michener 2000). Similarly, adult butterflies require nectar for food, often from specific
plants, and the larvae of many species are often associated with a specific host plant
(Howarth 1973). Birds travel widely looking for food and are good indicators of the type
and range of food resources available on the mesocosms. Plants are the most important
functional group, largely determining the habitat structure and ecological resource
availability (e.g. nectar and pollen foodstuffs).
The chosen taxonomic study groups thus comprise species with wide ranging
dispersal abilities, which are likely to act as indicators of several ecological habitat
characteristics. They also occupy several levels in the food chain and occupy many
different feeding niches, including general and specialist phytophages (plant eaters), for
example, granivores (seed eaters), nectar feeders, pollen feeders; detritivores (detritus
eaters); scavengers; generalists; parasites; and predators. They should therefore provide a
good representation of the biodiversity and ecological community composition of the
mesocosms.
Sampling methods
Due to the limited spatial extent of the study mesocosms and the need to limit
interference with successional trajectories as far as possible, sampling methods have been
26
designed to minimise physical damage to the habitats and the removal of organisms.
Where possible therefore, organisms will be identified in situ, with only a few samples
taken for identification purposes.
Sampling will take place every two weeks between April and September, and less
frequently during the winter. The sequence of sampling will be rotated in order to avoid
bias due to the diurnal rhythms of the various study groups. Ecological sampling will
comprise four elements: (1) vegetation surveys, (2) non-fatal pitfall trapping, (3) bird
surveys, and (4) „general‟ entomological surveys. Digital photographs of the mesocosms
will also be taken as a visual record of their development.
Vegetation surveys will comprise both floristic, and structural components, which
will encompass the entire area of each tray. Given the relative small size of the
mesocosms, and the recommended quadrat sizes for the expected communities, smaller
samples are not appropriate (c.f. Kent and Coker 1996). Floristic surveys will involve the
identification of all vascular plants, except the graminoids, to species or taxonomic group
using appropriate floristic keys and identification guides (e.g. Clapham et al. 1985; Stace
and Thompson 1997; Rose and O‟Reilly 2006). Voucher specimens and digital colour
photographs will be taken in cases when identification proves difficult and the opinion of
botanical experts sought. The cover abundance of taxa will be estimated on the Domin-
Krajina scale. This semi-quantitative measure involves the rapid visual estimation of
abundance at low density, or cover at higher density, and although subject to some degree
of error is likely to provide a good summary of the coverage of different taxa (c.f. Smartt
et al. 1976).
27
Vegetation structural surveys will comprise three main elements: (a) analysis of
stratification, (b) analysis of the cover-abundance of different structural elements, and (c)
analysis of the richness of nectar, pollen and seed resources. The approximate average
and maximum height of ground, field and scrub layers (when present) will be measured
to provide a summary of vegetation stratification. The Domin-Krajina scale will be used
to estimate the cover abundance of bare ground, forbs, graminoids, lichens and mosses,
flowering plants, plants in seed, and woody plants. The richness and abundance of nectar,
pollen and seed resources will be determined simply by summing the number of species
in seed or flower, and estimating the cover abundance of plants in seed and flower. Plant
pollinator and plant granivore interactions are clearly complex and dependent on a variety
of factors, such as the amount of nectar and pollen, nectar concentration, flower
morphology, seed abundance, seed size, and seed shape (e.g. O‟Toole and Raw 1991;
Honek et al. 2003; Potts et al. 2003). However, the abundance and diversity of flowering
plants have been shown to be strongly positively correlated with the diversity and
abundance of pollinators (Banaszak 1996; Steffan-Dewenter and Tscharntke 1997; Potts
et al. 2003, 2004), and granivores are known to be adapted to eating seeds of certain
species (Honek et al. 2003), so they are likely to provide reasonable summary measures
of the diversity of nectar and seed resources. The vegetation survey record sheet that will
be used is shown in Appendix 2.
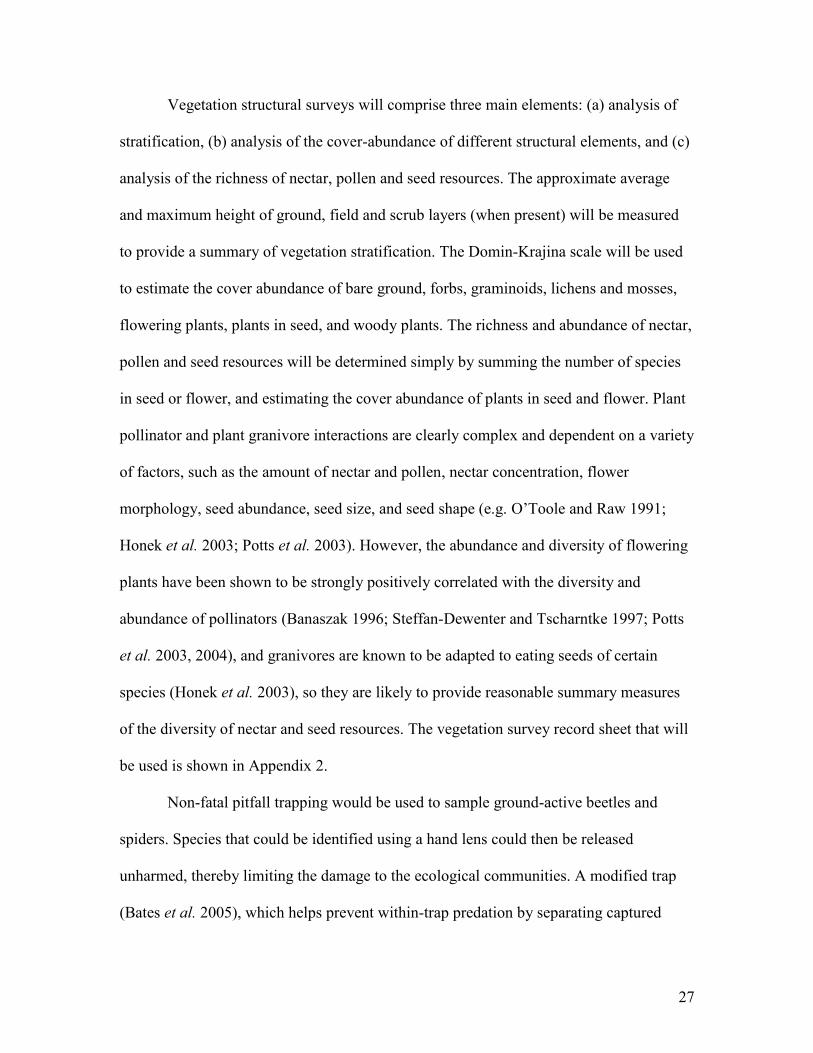
Non-fatal pitfall trapping would be used to sample ground-active beetles and
spiders. Species that could be identified using a hand lens could then be released
unharmed, thereby limiting the damage to the ecological communities. A modified trap
(Bates et al. 2005), which helps prevent within-trap predation by separating captured
28
individuals by size, would be employed with damp sediment in the bottom to prevent the
desiccation of captured individuals (Figure 4). Two traps would be used per tray and
opened for 24-hours at the time of sampling.
100mm
65mm
65mm
Figure 4 Design of the modified pitfall trap. The two outer section of the trap are 0.2L
clear plastic cups, the innermost section is a 0.3L clear plastic cup with the upper part
removed. Holes (3mm) in the bottom of the innermost and outermost sections allow small
arthropods and water to pass through respectively. Pin-sized holes in the middle section
allow the drainage of water, but not the passage of small arthropods. Damp sediment in
the lower section reduces mortality due to desiccation.
Bird survey techniques are adapted from those of Brenneisen (2003) and would
involve sitting out of sight close to each experimental block identifying bird species with
the aid of binoculars and bird keys where necessary. The best time of the day for general
bird surveys is dawn, as this is the time when bird territorial displays and song are most
common (Bibby et al. 2000). However, the aim of this survey is to detect the utilization
of green roof resources by birds, rather than to detect their presence in the area of the
29
green roof mesocosms. Therefore, observations will be made over three one-hour periods
in mid-morning, mid-afternoon and early evening and notes taken on which mesocosms
are used by each bird and their activity at the time. It will not be possible to determine the
actual numbers of visiting birds during observation periods, because of the difficulty in
determining re-visits from individuals. Therefore, data will be expressed in terms of the
number of visits, rather than number of visiting individuals. Appendix 3 illustrates the
bird recording sheet that will be used.
General invertebrate surveys would mainly be aimed at bees, wasps and orb
weaving spiders and will involve general observations, combined with limited sweep
netting. Species will either be identified in situ when feasible, captured and identified, or
captured and removed for later identification. Additional notes will be made about the
activity of bees and wasps (e.g. using burrow, visiting flowers, etc.), so that foraging and
nesting activity can be distinguished.
Hydrological and Meteorological
To adequately quantify and understand the hydrological process within the roof
trays it is necessary to measure the inputs and outputs from the system over time. The
climate is clearly a key control as this determines the amount of water entering the system
as well as influencing evaporative losses, soil moisture content and temperature. Local
microclimates are common in the proximity of buildings as the mesoclimate is influenced
by site aspect, elevation and roof form. In order to accurately measure the microclimate
variables, a fully logged weather station will be installed on the roof to monitor air
temperature, rainfall, wind speed, wind direction, relative humidity, and direct and
indirect solar radiation.
30
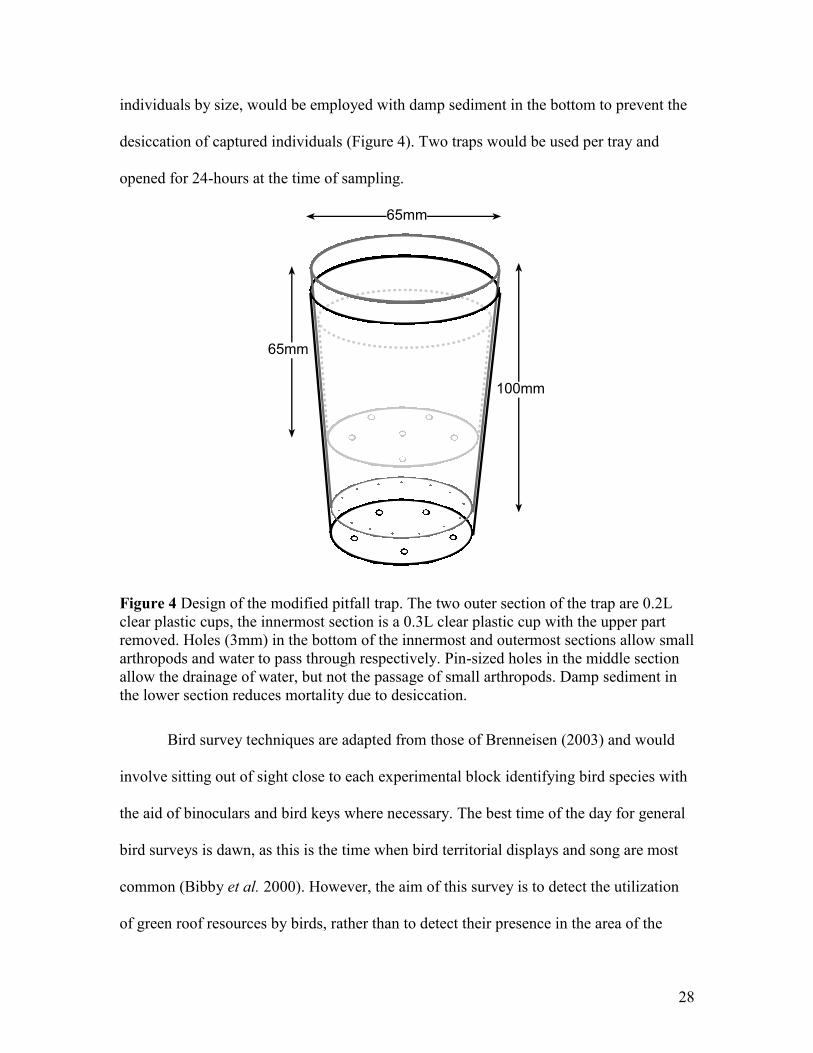
Water falling on the roof tray will percolate through the substrate. That which is
not retained by the substrate or lost due to evapotranspiration will leave mesocosms via
the 50mm diameter drain situated in the base. To more accurately quantify the volume of
through-flow, the discharge from three mesocosms with the same substrate treatment will
be combined and channeled through a „V-notch‟ weir. The depth of the water behind the
weir will be measured using an ultrasonic transducer, the output from which will be used
to calculate the water flow. The apparatus will be semi-mobile insofar as it will be
possible to move the monitoring hardware between trays containing different substrates
until an adequate dataset for each treatment has been gathered.
Soil moisture and temperature probes will also be installed at various depths
within the substrate. By comparing inflows and outflows, the hydrological properties of
the substrates and the influences upon flow and water balances will be investigated. Both
the transducers of the weather station and the roof trays will be continuously monitored
and recorded by datalogger.
logger
Soil moisture
probe
Temperature
(surface and
at depth) Flow meter
31
Figure 5 A schematic diagram of the mesocosm monitoring network.
Water quality
The water quality of through-flow from the brown roofs is of importance for both
the possible effects on surface or groundwater quality, and for the potential viability of
harvesting it for sub-potable household use such as toilet flushing, car washing, and
garden watering. The likely required water quality for sub-potable household use is
higher than that for release into surface or groundwater in most cases so the water quality
monitoring will be mainly aimed at detecting failure of suitability for household re-use.
However, the negative effects of certain substances (e.g. sulphate and phosphate) are
most apparent in aquatic habitats, so in some cases water quality monitoring was
extended to substances not covered by drinking water quality standards. Other measured
variables, such as pH, conductivity and alkalinity, are useful in the interpretation of the
through-flow water quality.
At present there is no national or EU legislation defining the required water
quality standards for using sub-potable water in households (Hochstrat et al. 2006; House
of Lords 2006). However, pets and children can potentially drink from toilets, and there is
a genuine risk of misconnecting harvested water to the mains (House of Lords 2006). The
water can be treated (e.g. disinfected and filtered), but each level of treatment will
increase its cost and therefore decrease the financial viability of using the harvested
water. Furthermore, the general public are often somewhat reticent about using harvested
water in the home (Baggett 2006). Therefore, harvested water should ideally be of high
quality in order to minimise potential health risks, be financially viable, and convince the
general public that the water is safe to use.
32
The national (and EU) Water Supply (Water Quality) regulations (2000) for
potable water were used to produce a preliminary list of water quality standards
(Appendix 4), out of which several substances were selected, which our preliminary
knowledge of rainfall and aggregate chemistry suggested might be of concern. Pulverised
fuel ash (PFA), for example, can have very high levels of trace metals sorbed to particle
surfaces (e.g. Mo, Se, As, Cr, Zn, Cd, Pb, Ni, Ti and Hg), and elevated levels of calcium
ions, sulphate, boron, molybdenum, arsenic and selenium, can, depending on pH, leach
from PFA (Theis and Wirth 1977; Cherkauer 1980; Le Seur Spencer and Drake 1987;
Lee and Spears 1995). Municipal incinerator bottom ash can leach a variety of metals
(e.g. As, Ba, Be, Cd, Cr, Cu, Hg, Mo, Pb, Sr and Zn) when the pH is very high before it
begins to weather (mainly through carbonation), and also under low pH conditions
(Buchholz and Landsberger 1995; Johnson et al. 1995; Meima and Comans 1999; Meima
et al. 2002). Calcium and magnesium can leach from Portland cement concrete aggregate
(Dollimore et al. 2001) and sulphate often leaches from brick and concrete aggregate
(David Coleman pers comm.). Escherichia coli concentrations are also known to
sometimes (e.g. the BedZED extensive sedum green roof) be high from green roof
through-flow (Peter Wright pers. comm.). Green roof through-flow often has high
concentrations of nitrate and phosphate, particularly when composts or fertilisers are used
(Ngan 2004; Ed Snodgrass pers comm.). In addition, bituminous roof waterproofing has
been shown to elevate pH, conductivity and the concentration of calcium, potassium,
magnesium, silicon and chloride relative to rainfall in Birmingham (Jane Harris
unpublished data).
33
Through-flow water quality will be compared with the water quality of three
rainfall samples per roof collected during the same storm event. Rainfall will be collected
from sloping 1m2 plastic sheets that decant into collecting vessels in order to collect
sufficient rainfall for all analyses. Sealable containers will be positioned to catch through-
flow from three replicate mesocosms of each substrate treatment at the onset of rainfall
events before any through-flow is generated and then removed at the end of the rainfall
event to give an integrated water sample for that rainfall event. The number of rainfall
events studied will depend upon the frequency of events and the consistency of results.
The collection, preparation and storage of the water samples will follow the
recommendations of Eaton et al. (2005) wherever possible. As soon as possible on site
the conductivity and pH of samples will be measured with the appropriate meters and the
turbidity determined using a Nova 60 Spectroquant® photometer. The volume of samples
will be measured and the samples (or sub-samples, depending on sample volume) filtered
on pre-weighed 0.45μm cellulose nitrate filters (acid-washed for metal analysis) as soon
as possible to remove any suspended sediments and to allow later determination of the
concentration of suspended sediments. Total alkalinity will be determined using sulphuric
acid (H2SO4) titration with phenolphthalein and methyl purple indicator solutions using a
HACH digital titrator (model 16900-01). The concentration of nitrate (NO3-N),
ammonium (NH4-N), sulphate (SO4), phosphate (PO4-P) and chloride (Cl) anions will be
determined using a Nova 60 Spectroquant®
photometer using the appropriate photometric
test kits.
Sub-samples will be collected in acid-washed polypropylene or linear polythene
sample bottles and acidified with Aristar nitric acid to a 2% solution (~pH 2), to keep
34
metals in solution, and refrigerated until later (<6 months) analysis. These samples will
be analysed using an Agilent 7500 series inductively coupled plasma mass spectrometer
(ICPMS) using an ASX-520 autosampler for a range of metals. Initial semi-quantitative
analyses on water samples will be run to identify elements in high relative concentration
and these elements will be focused on in later element-specific analyses. These element
specific analyses will at least include analysis of the concentrations of aluminium,
arsenic, copper, molybdenum, iron, lead and cadmium.
The enzyme substrate ColitagTM
test will be used to test for the presence or
absence of coliform bacteria and, more specifically, Escherichia coli, in 100ml samples
of through-flow. This method relies on the detection of β-glucuronidase and β-D-
galactosidase, which are characteristic of E. coli and coliform groups respectively.
Samples will be refrigerated as quickly as possible and processed within 24 hours (see
Appendix 5 for details). A test for the presence or absence of coliform bacteria and E.
coli is a sufficient microbiological quality assessment because the national water quality
regulations dictate that no coliform bacteria or E. coli should be present in potable water
(Eaton et al. 2005), and the method is at least as efficient as the membrane filter and
multiple-fermentation-tube methods at detecting the presence of coliform bacteria and E.
coli (Clark and El-Shaarawi 1993).
„Soil‟ conditions
The changing conditions within the soil are of fundamental importance for the
development of plants, the water quality of through-flow, the water storage capacity, and
to a lesser extent, the development of invertebrate assemblages. The soil water content is
seen as a key variable for extensive green roof plant communities because of the
35
relatively thin depth of soils and the increased level of evapotranspiration due to
enhanced wind speeds. For healthy plant growth the concentration of water in soils
should be high enough to be easily available to roots, but not so high that roots cannot get
enough oxygen for respiration (Handreck and Black 2005). The ability of a soil to hold
water is dependent on a range of factors including the amount of organic matter and the
particle size distribution (Rowell 1994). Bengtsson (2005) and Bengtsson et al. (2005)
showed that runoff is not generated until the roof substrate has reached field capacity and
that the amount of runoff storage corresponds with the conditions at the permanent
wilting point.
Schrader and Bőning (2006) have shown that in extensive sedum green roofs the
total soil nitrogen and percentage organic matter increase with roof age, and pH declines
with roof age. The availability of nutrients, such as nitrogen, is another key determinant
of plant growth and the water quality of through-flow. Both the ash based and demolition
waste based substrates are likely to develop into alkaline soils, but pH may fall over time
due to the leaching of carbonate and bicarbonate and the addition of sulphuric and nitric
acid from acid rain (Darlington 1981; Handreck and Black 2005). Changing pH is of
particular importance because it controls the availability of many heavy metals (e.g.
Theis and Wirth 1977; Buchholz and Landsberger 1995; Steusloff 1998).
Selected chemical and physical characteristics of the soils will be determined. Soil
samples will be taken from each mesocosm every five months for physical measures after
a two-month bedding in period, and every two months for chemical measures. Following
analysis the samples will be returned to the same area from which they were sampled. An
undisturbed area of soil will be sampled each time.
36
Chemical
The pH will be measured in three sub-samples of 5ml of soil in a calcium chloride
solution according to the methods in ISO 10390:2005 (Appendix 6). Calcium chloride
solution is thought to give the pH reading most close to that in the soil (Handreck and
Black 2005) and was therefore chosen over water and potassium chloride. Electrical
conductivity will be measured from three 20g sub-samples of soil suspended in 100ml of
water according to the methods in BS 7755-3.4:1995 (Appendix 5).
Physical
The sediment size distribution will be determined once after the bedding-in period
from three sub-samples by wet sieving, oven drying (105oC) and weighing the sediments
for each phi size class division above 2mm. The size distribution of particles <2mm will
be determined using a laser particle sizer. The overall (all size fractions) density of soil
particles will be determined from three sub-samples by measuring the volume of a known
mass of soil particles using a method modified from Rowell (1994), see Appendix 7. The
overall (all size fractions) dry bulk density of the soil will be determined from three small
areas of the mesocosms using the excavation method, which involves excavating a
quantity of soil, drying and weighing it and determining the volume of the excavation by
filling it with sand (modified from ISO 11272:1998, Appendix 8). The soil porosity
expressed as a volume ratio will be calculated using:
Porosity = 1 – (bulk density/particle density)
The air filled and water filled porosity at the approximate field capacity and
permanent wilting point will be measured in three sub-samples of about 10g of soil by
measuring the change in mass after heating at 105oC (Appendix 9). Soil samples for the
37
determination of field capacity will be taken a day after heavy rainfall, when the soil has
freely drained, and samples for the determination of permanent wilting point will be
taken during prolonged dry periods. Due to the difficulty associated with determining
when each of these soil water contents are reached, soil moisture content will also be
measured remotely using soil moisture probes and used to help determine when the field
capacity and permanent wilting point are reached. The water content measurements will
help to ground truth the readings from the moisture probes. The air filled porosity at the
approximate field capacity and permanent wilting point will be calculated using:
Air filled porosity = porosity – water content at field capacity
or permanent wilting point
The loss on ignition, which is an approximate measure of organic matter content, will be
determined in three oven-dried (105oC) sub-samples of about 10g of soil by measuring
the change in mass after heating at 550oC in a muffle furnace (modified from Rowell
1994, Appendix 10).
Variability in coloniser availability
The colonisation of green roofs will generally require the ability to disperse
aerially, and the relative colonisation ability will vary markedly between species. Birds,
for example, are almost all capable of the flight distance necessary to utilise green roofs,
but their behaviour and habitat requirements will dictate whether they utilise green roofs
in reality. Many flighted invertebrates will be capable of dispersal to green roofs but this
will depend on their behaviour, habitat requirements, flight ability and weather conditions
(c.f. Southwood 1962). Furthermore, other species propagules or individuals may
disperse to green roofs through: (1) movement by wind, or anemochory, (2) transport by
38
birds (ornithochory), which can occur through three processes: (a) synzoochory, where a
bird disgorges seeds usually after eating the fruit, (b) endozoochory, where a seed passes
through the digestive system of a bird, and (c) epizoochory, where a seed is transported
on the body of a bird, although this is generally a rare phenomenon (c.f. Van der Pijl
1982), or even (3) transport by ants (myrmecochory), which are known to disperse seeds
to walls (Darlington 1981; Gilbert 1992). Invertebrate specialists of early successional
(e.g. brownfield sites, exposed riverine sediments, grasslands), and therefore, transient
habitats are typically capable of dispersing long distances (Southwood 1962), as are many
plant species of similar habitats, mainly through anemochory (Van der Pijl 1982; Fenner
1985; Soons and Heil 2002). Plant species are known to colonise new habitat from long
distances surprisingly rapidly (e.g. Bradshaw 1983; Gibson et al. 1987), and many
species of plant colonise the roofs, walls and gutters of buildings, mainly through
anemochory (Ridley 1930; Darlington 1981; Payne 2000). Walls and buildings tend to
concentrate airflows and wind blown particles in strong up-draughts, with a large
proportion of these particles falling out of suspension at the top where the velocity of the
wind slows down (Darlington 1981; Payne 2000). However, it remains to be seen
whether pools of dispersers on roofs are comparable with those on the ground. In
addition, species whose individuals or propagules can disperse to green roofs are not
necessarily capable of establishing and, thus, colonising green roofs. Both the propensity
for the target study groups (see „Green roof substrate effects‟) to disperse to green roofs
and to establish themselves on green roofs will be assessed.
39
Experimental design
Six ground sites and nine roof sites (1-6 stories) have been selected across the
University of Birmingham campus. Ground sites vary from brownfield sites with bare
ground and ruderal vegetation where there are distinct swards of vegetation to „rain‟ into
seed traps, to mown grass, where seeds will have to disperse in from elsewhere. Roofs
vary widely in both their height and character (e.g. type of parapet, area). All sites are
spread over a wide area and vary in their proximity to potential source habitats. At each
site 12 seed traps, 3 window traps and 3 pan traps will be installed and emptied weekly
during the spring, summer and autumn and sampled less frequently in winter. Data will
be analysed by individual months in order to investigate the seasonal variation in
coloniser availability.
Environmental variables
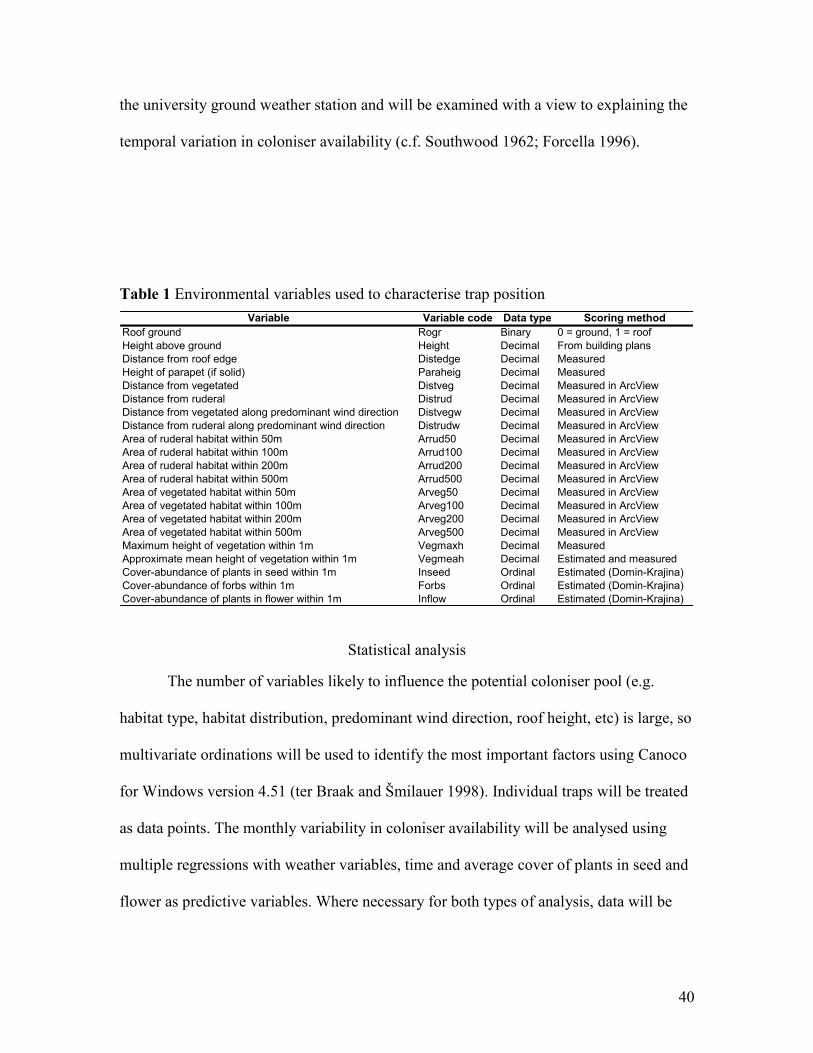
A range of semi-quantitative and quantitative environmental variables will be
measured for each trap on a monthly basis (Table 1). The distance from the nearest sites
that are vegetated or contain ruderal species, and the area of this habitat within 50, 100,
200 and 500m will be measured in ArcView from the phase 1 habitat survey geographical
information system. Distances to roof sites will be the shortest possible distance to the
roof accounting for the building height (ie the hypotenuse calculated using Pythagoras‟
theorem). The wind direction will be measured on each visit and used to work out the
predominant wind direction at each site. The cover-abundance of forbs, plants in seed,
and plants in flower within 1m of the trap will be estimated on the Domin-Krajina scale.
The variables that are only relevant to roof sites will be examined using separate
ordinations in order to test their significance. Weather variables will also be measured at
40
the university ground weather station and will be examined with a view to explaining the
temporal variation in coloniser availability (c.f. Southwood 1962; Forcella 1996).
Table 1 Environmental variables used to characterise trap position
Variable Variable code Data type Scoring method
Roof ground Rogr Binary 0 = ground, 1 = roof
Height above ground Height Decimal From building plans
Distance from roof edge Distedge Decimal Measured
Height of parapet (if solid) Paraheig Decimal Measured
Distance from vegetated Distveg Decimal Measured in ArcView
Distance from ruderal Distrud Decimal Measured in ArcView
Distance from vegetated along predominant wind direction Distvegw Decimal Measured in ArcView
Distance from ruderal along predominant wind direction Distrudw Decimal Measured in ArcView
Area of ruderal habitat within 50m Arrud50 Decimal Measured in ArcView
Area of ruderal habitat within 100m Arrud100 Decimal Measured in ArcView
Area of ruderal habitat within 200m Arrud200 Decimal Measured in ArcView
Area of ruderal habitat within 500m Arrud500 Decimal Measured in ArcView
Area of vegetated habitat within 50m Arveg50 Decimal Measured in ArcView
Area of vegetated habitat within 100m Arveg100 Decimal Measured in ArcView
Area of vegetated habitat within 200m Arveg200 Decimal Measured in ArcView
Area of vegetated habitat within 500m Arveg500 Decimal Measured in ArcView
Maximum height of vegetation within 1m Vegmaxh Decimal Measured
Approximate mean height of vegetation within 1m Vegmeah Decimal Estimated and measured
Cover-abundance of plants in seed within 1m Inseed Ordinal Estimated (Domin-Krajina)
Cover-abundance of forbs within 1m Forbs Ordinal Estimated (Domin-Krajina)
Cover-abundance of plants in flower within 1m Inflow Ordinal Estimated (Domin-Krajina)
Statistical analysis
The number of variables likely to influence the potential coloniser pool (e.g.
habitat type, habitat distribution, predominant wind direction, roof height, etc) is large, so
multivariate ordinations will be used to identify the most important factors using Canoco
for Windows version 4.51 (ter Braak and Šmilauer 1998). Individual traps will be treated
as data points. The monthly variability in coloniser availability will be analysed using
multiple regressions with weather variables, time and average cover of plants in seed and
flower as predictive variables. Where necessary for both types of analysis, data will be
41
transformed prior to analysis to satisfy assumptions of normality and homogeneity of
variance.
Seed dispersal
There are a large number of different types of traps used to measure seed rain, but
no kind of trap provides a perfect measure of seed rain, the type of trap that is best is
heavily dependent on the aims of the study (Forcella et al. 1996; Kollmann and Goetze
1998; Page et al. 2002; Chabrerie and Alard 2005). The traps used have been designed to
intercept and capture wind-blown seeds and still effectively sample gravity seed rain.
Sticky traps were not used because of the danger of damaging seeds whilst removing
them, which would interfere with the plant establishment investigation. The design of the
trap is shown in Figure 5. The plywood vane on the trap is designed to intercept
windblown seeds, the mesh collects seeds, but allows water to drain away. Seeds will be
collected on a weekly basis and identified under a dissecting microscope where possible
using appropriate keys. Seeds will be classified as filled, partially filled, or empty, and
classified as plumed, plane winged, rotating winged, or fruited. Seeds from each trap will
be weighed, either individually or collectively depending on their size, and the average
weight of each seed type calculated. In instances where the species of seed cannot be
identified, several of each seed morphotype will be grown on in a greenhouse until
identification is possible.
42
House brick
300mm long, 25 by
50mm section of
treated timber
180mm diameter
plastic funnel
200 micron mesh
Cable ties
Two perpendicular 3.6mm
thick, 185 by 140mm
treated plywood sheets
slotted together and into the
top of the funnel
House brick
300mm long, 25 by
50mm section of
treated timber
180mm diameter
plastic funnel
200 micron mesh
Cable ties
Two perpendicular 3.6mm
thick, 185 by 140mm
treated plywood sheets
slotted together and into the
top of the funnel
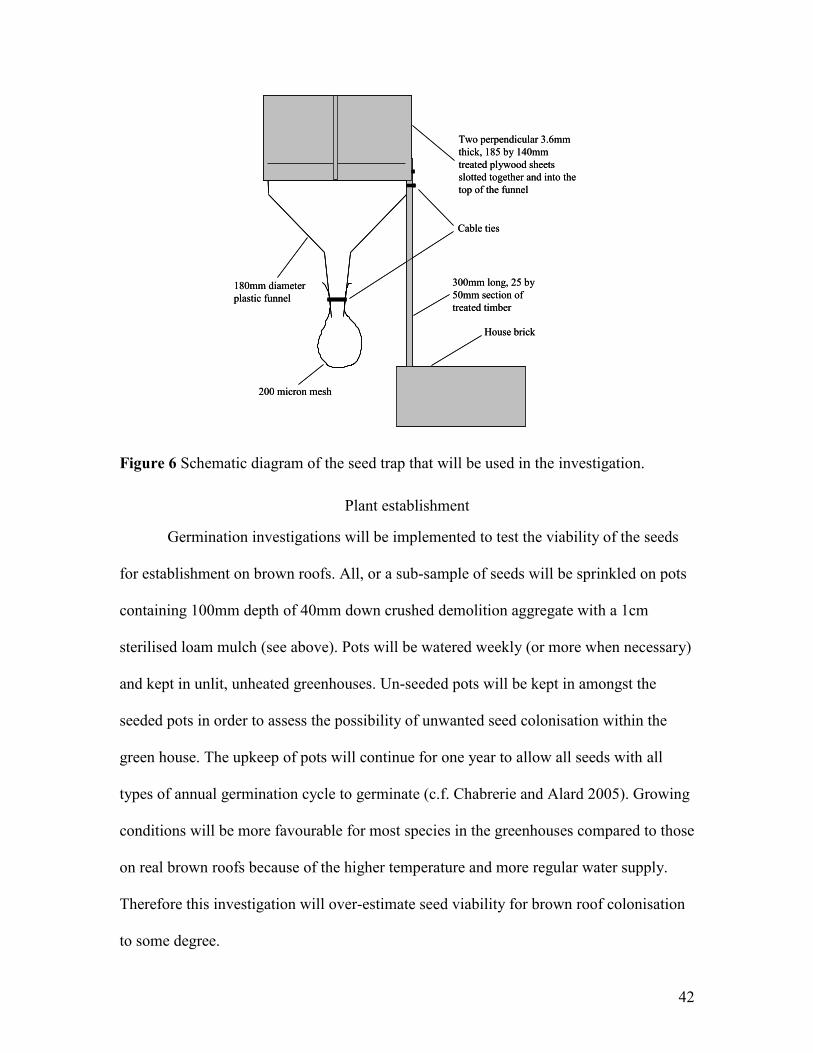
Figure 6 Schematic diagram of the seed trap that will be used in the investigation.
Plant establishment
Germination investigations will be implemented to test the viability of the seeds
for establishment on brown roofs. All, or a sub-sample of seeds will be sprinkled on pots
containing 100mm depth of 40mm down crushed demolition aggregate with a 1cm
sterilised loam mulch (see above). Pots will be watered weekly (or more when necessary)
and kept in unlit, unheated greenhouses. Un-seeded pots will be kept in amongst the
seeded pots in order to assess the possibility of unwanted seed colonisation within the
green house. The upkeep of pots will continue for one year to allow all seeds with all
types of annual germination cycle to germinate (c.f. Chabrerie and Alard 2005). Growing
conditions will be more favourable for most species in the greenhouses compared to those
on real brown roofs because of the higher temperature and more regular water supply.
Therefore this investigation will over-estimate seed viability for brown roof colonisation
to some degree.
43
Invertebrate dispersal
The pool of potential invertebrate colonisers at each site will be investigated using
pan and window traps. The colour of pan traps strongly influences the species caught
(Disney et al. 1982; Leong and Thorp 1999; Laubertie et al. 2006), so each pan trap will
have an area coloured red, yellow, white and blue on the inside. These colours on the
outside of traps can potentially attract insects from some distance (Laubertie et al. 2006),
and insects might be able to perceive them from a greater distance at ground sites.
Therefore the outside of traps will be coloured in a non-attracting dark green colour (c.f.
Laubertie et al. 2006). Pan traps will have 3cm deep saturated NaCl solution and a dash
of unscented detergent to preserve captured arthropods and break up surface tension
respectively.
Window traps will consist of two perpendicular sheets of clear plastic embedded
into concrete in plastic trays (painted dark green on all surfaces to prevent „attraction‟),
with a 3cm deep saturated salt and detergent solution to kill and preserve arthropods that
fall into the trays after hitting the clear plastic (Figure 6). The concrete will weight the
traps down to prevent them being blown by wind and becoming a hazard.
2mm clear styrene sheets
(height = 400mm, width
= 180mm)
perpendicular styrene sheet
(height = 400mm, width =
250mm)
30mm deep saturated NaCl
solution with unscented detergent
30mm deep layer of concrete
2mm clear styrene sheets
(height = 400mm, width
= 180mm)
perpendicular styrene sheet
(height = 400mm, width =
250mm)
30mm deep saturated NaCl
solution with unscented detergent
30mm deep layer of concrete
2mm clear styrene sheets
(height = 400mm, width
= 180mm)
perpendicular styrene sheet
(height = 400mm, width =
250mm)
30mm deep saturated NaCl
solution with unscented detergent
30mm deep layer of concrete
Figure 7 Schematic of the window trap design.
44
Invertebrate establishment
The species detected in window and pan traps on roofs will be compared with the
species sampled from the brown roof mesocosms in order to assess to the difference
between those species able to disperse to brown roofs and those species able to colonise
brown roofs.
Knowledge transfer
ARUP will provide support for the overall development and coordination of
Birmingham‟s Learning Alliance. The working knowledge gained from the green roof
project will be an important contribution to this alliance, and will be transferred via the
planned meetings of the Alliance, the Alliance newsletter and through the Web site.
Within the wider SWITCH community and the other Learning Alliances, the current
plans are to prepare training materials describing the implementation of the roofs and the
tools that have been developed as part of the current research to address design issues and
materials impacts. In addition the findings will be more widely circulated in the public
and academic domains by University of Birmingham researchers through local press
releases, journal publications, academic conference presentations, and lectures to
university students.
References
Akbari H, Pomerantz M, Taha H. 2001. Cool surfaces and shade trees to reduce energy
use and improve air quality in urban areas. Solar Energy 70: 295-310.
Andersen J. 2000. What is the origin of the carabid beetle fauna of dry, anthropogenic
habitats in western Europe? Journal of Biogeography 27: 795-806.
Angold PG, Sadler JP, Hill MO, Pullin A, Rushton S, Austin K, Small E, Wood B,
Wadsworth R, Sanderson R, Thompson K. 2006. Biodiversity in urban habitat patches.
Science of the Total Environment 360: 196-204.
Aziz HA, Smith PG. 1992. The influence of pH and coarse media on manganese
precipitation from water. Water Research 26: 853-855.
45
Baggett S, Jeffrey P, Jefferson B. 2006. Risk perception in participatory planning for
water reuse. Desalination 187: 149-158.
Banaszak J. 1996. Ecological bases of conservation of wild bees. 55-62. In Matheson A,
Buchmann SL, O‟Toole C, Westrich P, Williams IH (eds.) The conservation and
biology of bees in temperate habitats. Linnean Society Symposium Series 18.
Academic Press, London, UK.
Barrio EPD. 1998. Analysis of the green roofs cooling potential in buildings. Energy &
Buildings 27: 179-193.
Bass B, Krayenhoff S. 2002. Mitigating the urban heat island with green roof
infrastructure. North American urban heat island summit, Toronto.
Bates AJ, Sadler JP, Fowles AP, Butcher CR. 2005. Spatial dynamics of beetles living on
exposed riverine sediments in the Upper River Severn: Method development and
preliminary results. Aquatic Conservation: Marine and Freshwater Ecosystems 15:
159-174.
Bengtsson L. 2005. Peak flows from thin sedum-moss roof. Nordic Hydrology 36: 269-
280.
Bengtsson L, Grahn L, Olsson J. 2005. Hydrological function of a thin extensive green
roof in southern Sweden. Nordic Hydrology 36: 259-268.
Berndtsson JC, Emilsson T, Bengtsson L. 2006. The influence of extensive vegetated
roofs on runoff water quality. Science of the Total Environment 355: 48-63.
Bibby CJ, Burgess ND, Hill DA, Mustoe S. 2000. Bird census techniques (2nd
Ed.).
Academic Press, London.
Birmingham City Council. 1997. Nature Conservation Strategy for Birmingham.
Birmingham City Council, Birmingham.
Bischoff A, Vonlanthen B, Steinger T, Müller-Schärer H. 2006. Seed provenance matters
– Effects on germination of four plant species used for ecological restoration. Basic &
Applied Ecology 7: 347-359.
ter Braak CFJ, Šmilauer P. 1998. CANOCO reference manual and user’s guide to
Canoco for Windows: Software for canonical community ordination (version 4).
Microcomputer Power, Ithaca.
Bradshaw AD. 1984. Land restoration of ecosystems. Journal of Applied Ecology 20: 1-
17.
Brenneisen S. 2003. The benefits of biodiversity from green roofs – key design
consequences. Green roofs for healthy cities – Chicago 2003, conference preceedings.
Bristowe WS. 1958. The world of spiders. Collins.
Buchholz BA, Landsberger S. 1995. Leaching dynamics studies of municipal solid-waste
incinerator ash. Journal of the Air & Waste Management Association 45: 579-590.
Bulloch J, Darwish A. 1993. Water wars: coming conflicts in the Middle East. Victor
Gollancz, London.
Cain ML, Milligan BG, Strand AE. 2000. Long-distance seed dispersal in plant
populations. American Journal of Botany 87: 1217-1227.
Carter T, Jackson CR. In press. Vegetated roofs forstormwater management at multiple
spatial scales. Landscape & Urban Planning
Carter TL, Rasmussen TC. In press. Evaluation of the hydrologic behavior of green roofs.
Journal of the American Water Resources Association
46
Chabrerie O, Alard D. 2005. Comparison of three seed trap types in a chalk grassland:
toward a standardised protocol. Plant Ecology 176: 101-112.
Cherkauer DS. 1980. The effect of fly ash disposal on a shallow groundwater system.
Ground Water 18: 544-550.
Chiew FHS, McMahon A. 2002. Modelling the impacts of climate change on Australian
streamflow. Hydrological Processes 16: 1235-1245.
Christensen J, Christensen O. 2003. Climate modelling: severe summertime flooding in
Europe. Nature 6925: 805-806.
Clapman AR, Tutlin TG, Moore DM. 1985. Flora of the British Isles. Cambridge
University Press, Cambridge.
Clark JA, El-Shaarawi AH. 1993. Evaluation of commercial presence-absence test kits
for detection of total coliforms, Escherichia coli, and other indicator bacteria. Applied
& Environmental Microbiology 59: 380-388.
Darlington A. 1981. Ecology of walls. Heinemann Educational Books, London.
Dawson D. 1994. Are habitat corridors conduits for animals and plants in a fragmented
landscape? A review of the scientific evidence. English Nature Research Report 94,
Peterborough.
Dimoudi A, Nikolopoulou M. 2003. Vegetation in the urban environment: microclimatic
analysis and benefits. Energy & Buildings 35: 69-76.
Disney RHL, Erzinçlioğlu YZ, Howse DJdeCHD, Unwin DM, Withers P, Woods A.
1982. Collecting methods and the adequacy of attempted fauna surveys, with reference
to the Diptera. Field Studies 5: 607-621.
Dollimore D, Lerdkanchanaporn S, Gupta JW, Nippani S. 2001. An examination of
recycled Portland cement concrete rich in dolomite and low in calcite obtained from
various locations in Ohio. Thermochimica Acta 367: 311-319.
Donovan RG, Sadler JP, Bryson JR. 2005. Urban biodiversity and sustainable
development. Engineering Sustainability. 158 (ES2): 105-114.
Eaton AD, Clesceri LS, Rice EW, Greenberg AE (eds.). 2005. Standard methods for the
examination of water and wastewater. 21st Edition. American Public Health
Association.
Ellis JB, Marsalek J. 1997. Overview of urban drainage: environmental impacts and
concerns, means of mitigation and implementation policies. Journal of Hyraulic
Research 34: 723-731.
Emilsson T, Rolf K. 2005. Comparison of establishment methods for extensive green
roofs in southern Sweden. Urban Forestry & Greening 3: 103-111.
Eumorfopoulou E, Aravantinos D. 1998. The contribution of a planted roof to the thermal
protection of buildings in Greece. Energy & Buildings 27: 29-36.
Eversham BC, Roy DB, Telfer MG. 1996. Urban, industrial and other manmade sites as
analogues of natural habitats for Carabidae. Ann. Zool. Fennici 33: 149-156.
Falk S. 1991. A review of the scarce and threatened bees, wasps and ants of Great
Britain. Research & survey in nature conservation no. 35. NCC, Peterborough.
Fenner M. 1985. Seed ecology. Chapman & Hall, London.
Fernández-Juricic E. 2000. Avifaunal use of wooded streets in an urban landscape.
Conservation Biology 14: 513-521.
Forcella F, Peterson DH, Barbour JC. 1996. Timing and measurement of weed seed shed
in corn (Zea mays). Weed Technology 10: 533-543.
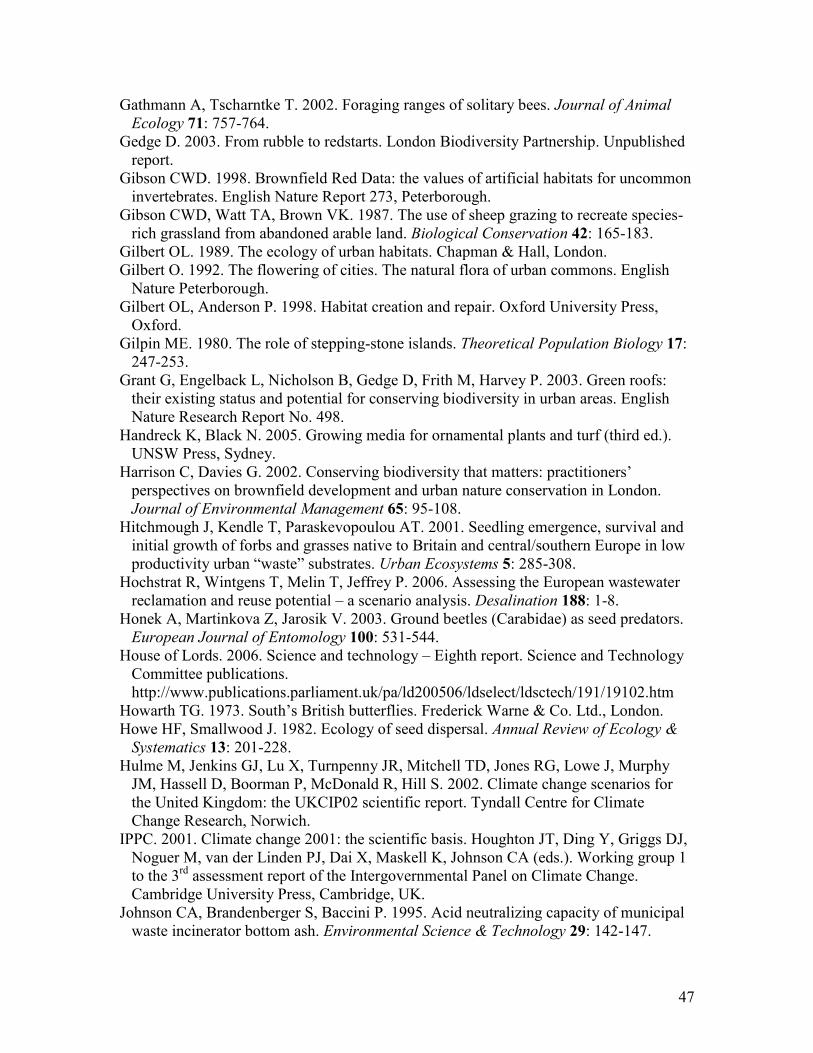
47
Gathmann A, Tscharntke T. 2002. Foraging ranges of solitary bees. Journal of Animal
Ecology 71: 757-764.
Gedge D. 2003. From rubble to redstarts. London Biodiversity Partnership. Unpublished
report.
Gibson CWD. 1998. Brownfield Red Data: the values of artificial habitats for uncommon
invertebrates. English Nature Report 273, Peterborough.
Gibson CWD, Watt TA, Brown VK. 1987. The use of sheep grazing to recreate species-
rich grassland from abandoned arable land. Biological Conservation 42: 165-183.
Gilbert OL. 1989. The ecology of urban habitats. Chapman & Hall, London.
Gilbert O. 1992. The flowering of cities. The natural flora of urban commons. English
Nature Peterborough.
Gilbert OL, Anderson P. 1998. Habitat creation and repair. Oxford University Press,
Oxford.
Gilpin ME. 1980. The role of stepping-stone islands. Theoretical Population Biology 17:
247-253.
Grant G, Engelback L, Nicholson B, Gedge D, Frith M, Harvey P. 2003. Green roofs:
their existing status and potential for conserving biodiversity in urban areas. English
Nature Research Report No. 498.
Handreck K, Black N. 2005. Growing media for ornamental plants and turf (third ed.).
UNSW Press, Sydney.
Harrison C, Davies G. 2002. Conserving biodiversity that matters: practitioners‟
perspectives on brownfield development and urban nature conservation in London.
Journal of Environmental Management 65: 95-108.
Hitchmough J, Kendle T, Paraskevopoulou AT. 2001. Seedling emergence, survival and
initial growth of forbs and grasses native to Britain and central/southern Europe in low
productivity urban “waste” substrates. Urban Ecosystems 5: 285-308.
Hochstrat R, Wintgens T, Melin T, Jeffrey P. 2006. Assessing the European wastewater
reclamation and reuse potential – a scenario analysis. Desalination 188: 1-8.
Honek A, Martinkova Z, Jarosik V. 2003. Ground beetles (Carabidae) as seed predators.
European Journal of Entomology 100: 531-544.
House of Lords. 2006. Science and technology – Eighth report. Science and Technology
Committee publications.
http://www.publications.parliament.uk/pa/ld200506/ldselect/ldsctech/191/19102.htm
Howarth TG. 1973. South‟s British butterflies. Frederick Warne & Co. Ltd., London.
Howe HF, Smallwood J. 1982. Ecology of seed dispersal. Annual Review of Ecology &
Systematics 13: 201-228.
Hulme M, Jenkins GJ, Lu X, Turnpenny JR, Mitchell TD, Jones RG, Lowe J, Murphy
JM, Hassell D, Boorman P, McDonald R, Hill S. 2002. Climate change scenarios for
the United Kingdom: the UKCIP02 scientific report. Tyndall Centre for Climate
Change Research, Norwich.
IPPC. 2001. Climate change 2001: the scientific basis. Houghton JT, Ding Y, Griggs DJ,
Noguer M, van der Linden PJ, Dai X, Maskell K, Johnson CA (eds.). Working group 1
to the 3rd
assessment report of the Intergovernmental Panel on Climate Change.
Cambridge University Press, Cambridge, UK.
Johnson CA, Brandenberger S, Baccini P. 1995. Acid neutralizing capacity of municipal
waste incinerator bottom ash. Environmental Science & Technology 29: 142-147.
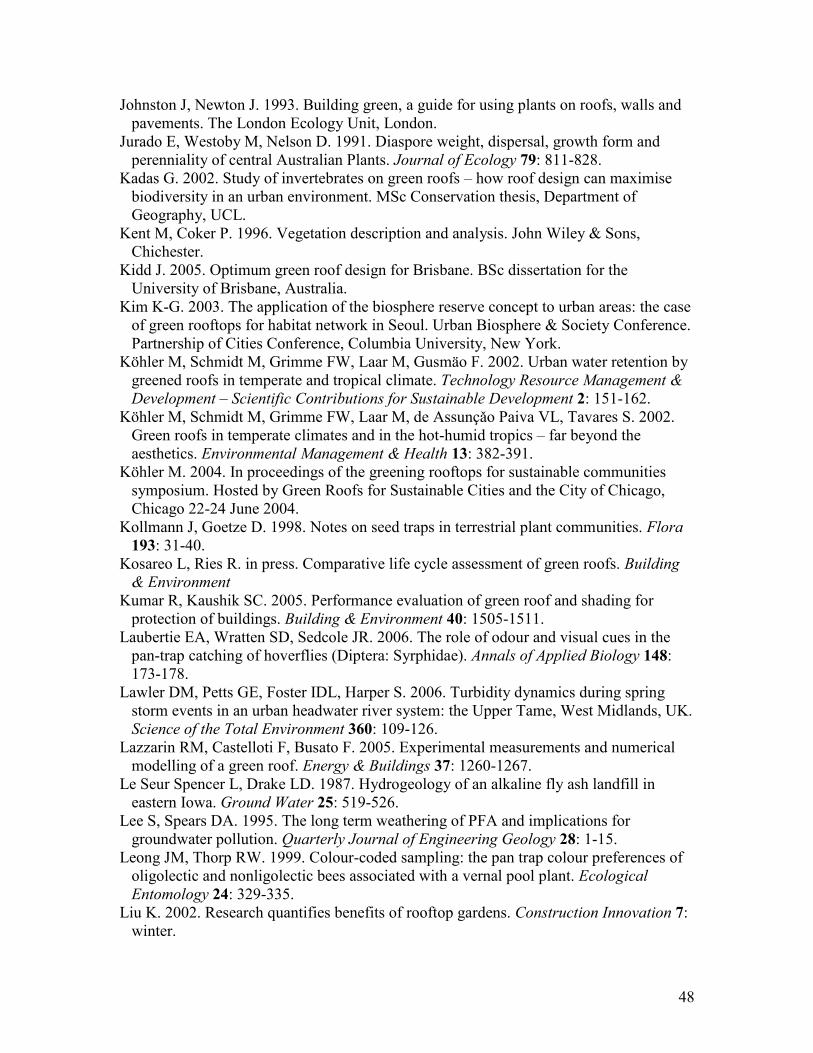
48
Johnston J, Newton J. 1993. Building green, a guide for using plants on roofs, walls and
pavements. The London Ecology Unit, London.
Jurado E, Westoby M, Nelson D. 1991. Diaspore weight, dispersal, growth form and
perenniality of central Australian Plants. Journal of Ecology 79: 811-828.
Kadas G. 2002. Study of invertebrates on green roofs – how roof design can maximise
biodiversity in an urban environment. MSc Conservation thesis, Department of
Geography, UCL.
Kent M, Coker P. 1996. Vegetation description and analysis. John Wiley & Sons,
Chichester.
Kidd J. 2005. Optimum green roof design for Brisbane. BSc dissertation for the
University of Brisbane, Australia.
Kim K-G. 2003. The application of the biosphere reserve concept to urban areas: the case
of green rooftops for habitat network in Seoul. Urban Biosphere & Society Conference.
Partnership of Cities Conference, Columbia University, New York.
Köhler M, Schmidt M, Grimme FW, Laar M, Gusmäo F. 2002. Urban water retention by
greened roofs in temperate and tropical climate. Technology Resource Management &
Development – Scientific Contributions for Sustainable Development 2: 151-162.
Köhler M, Schmidt M, Grimme FW, Laar M, de Assunçǎo Paiva VL, Tavares S. 2002.
Green roofs in temperate climates and in the hot-humid tropics – far beyond the
aesthetics. Environmental Management & Health 13: 382-391.
Köhler M. 2004. In proceedings of the greening rooftops for sustainable communities
symposium. Hosted by Green Roofs for Sustainable Cities and the City of Chicago,
Chicago 22-24 June 2004.
Kollmann J, Goetze D. 1998. Notes on seed traps in terrestrial plant communities. Flora
193: 31-40.
Kosareo L, Ries R. in press. Comparative life cycle assessment of green roofs. Building
& Environment
Kumar R, Kaushik SC. 2005. Performance evaluation of green roof and shading for
protection of buildings. Building & Environment 40: 1505-1511.
Laubertie EA, Wratten SD, Sedcole JR. 2006. The role of odour and visual cues in the
pan-trap catching of hoverflies (Diptera: Syrphidae). Annals of Applied Biology 148:
173-178.
Lawler DM, Petts GE, Foster IDL, Harper S. 2006. Turbidity dynamics during spring
storm events in an urban headwater river system: the Upper Tame, West Midlands, UK.
Science of the Total Environment 360: 109-126.
Lazzarin RM, Castelloti F, Busato F. 2005. Experimental measurements and numerical
modelling of a green roof. Energy & Buildings 37: 1260-1267.
Le Seur Spencer L, Drake LD. 1987. Hydrogeology of an alkaline fly ash landfill in
eastern Iowa. Ground Water 25: 519-526.
Lee S, Spears DA. 1995. The long term weathering of PFA and implications for
groundwater pollution. Quarterly Journal of Engineering Geology 28: 1-15.
Leong JM, Thorp RW. 1999. Colour-coded sampling: the pan trap colour preferences of
oligolectic and nonligolectic bees associated with a vernal pool plant. Ecological
Entomology 24: 329-335.
Liu K. 2002. Research quantifies benefits of rooftop gardens. Construction Innovation 7:
winter.
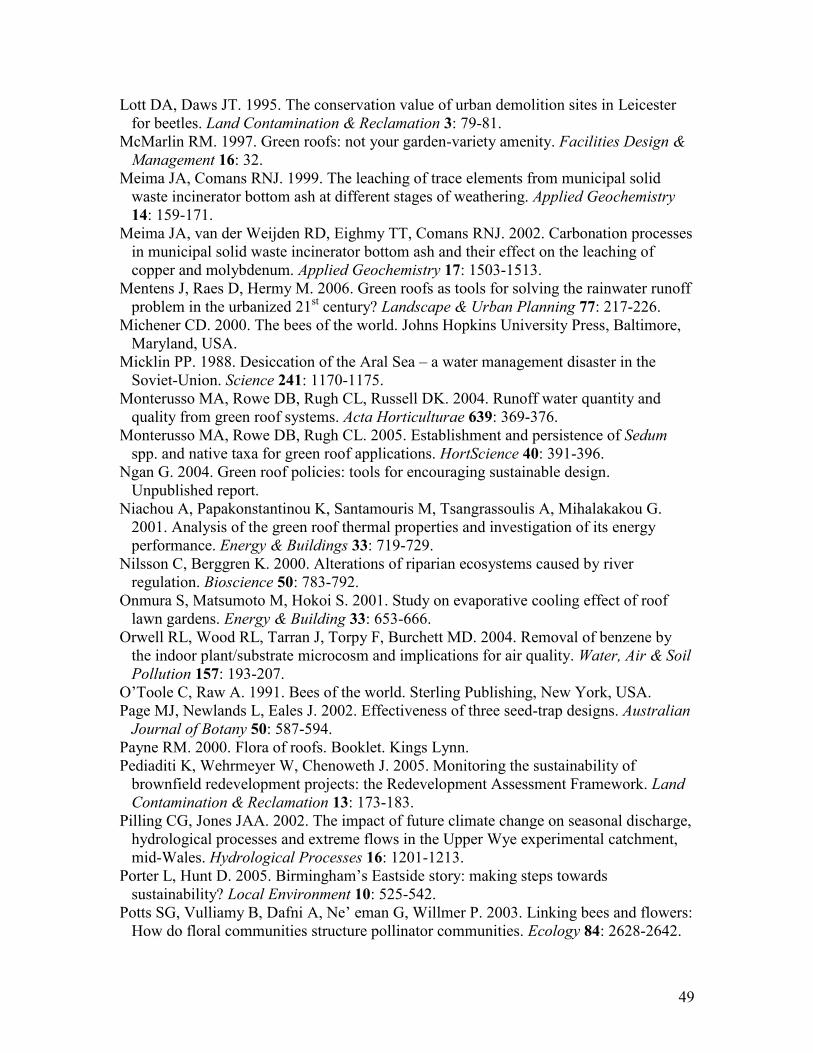
49
Lott DA, Daws JT. 1995. The conservation value of urban demolition sites in Leicester
for beetles. Land Contamination & Reclamation 3: 79-81.
McMarlin RM. 1997. Green roofs: not your garden-variety amenity. Facilities Design &
Management 16: 32.
Meima JA, Comans RNJ. 1999. The leaching of trace elements from municipal solid
waste incinerator bottom ash at different stages of weathering. Applied Geochemistry
14: 159-171.
Meima JA, van der Weijden RD, Eighmy TT, Comans RNJ. 2002. Carbonation processes
in municipal solid waste incinerator bottom ash and their effect on the leaching of
copper and molybdenum. Applied Geochemistry 17: 1503-1513.
Mentens J, Raes D, Hermy M. 2006. Green roofs as tools for solving the rainwater runoff
problem in the urbanized 21st century? Landscape & Urban Planning 77: 217-226.
Michener CD. 2000. The bees of the world. Johns Hopkins University Press, Baltimore,
Maryland, USA.
Micklin PP. 1988. Desiccation of the Aral Sea – a water management disaster in the
Soviet-Union. Science 241: 1170-1175.
Monterusso MA, Rowe DB, Rugh CL, Russell DK. 2004. Runoff water quantity and
quality from green roof systems. Acta Horticulturae 639: 369-376.
Monterusso MA, Rowe DB, Rugh CL. 2005. Establishment and persistence of Sedum
spp. and native taxa for green roof applications. HortScience 40: 391-396.
Ngan G. 2004. Green roof policies: tools for encouraging sustainable design.
Unpublished report.
Niachou A, Papakonstantinou K, Santamouris M, Tsangrassoulis A, Mihalakakou G.
2001. Analysis of the green roof thermal properties and investigation of its energy
performance. Energy & Buildings 33: 719-729.
Nilsson C, Berggren K. 2000. Alterations of riparian ecosystems caused by river
regulation. Bioscience 50: 783-792.
Onmura S, Matsumoto M, Hokoi S. 2001. Study on evaporative cooling effect of roof
lawn gardens. Energy & Building 33: 653-666.
Orwell RL, Wood RL, Tarran J, Torpy F, Burchett MD. 2004. Removal of benzene by
the indoor plant/substrate microcosm and implications for air quality. Water, Air & Soil
Pollution 157: 193-207.
O‟Toole C, Raw A. 1991. Bees of the world. Sterling Publishing, New York, USA.
Page MJ, Newlands L, Eales J. 2002. Effectiveness of three seed-trap designs. Australian
Journal of Botany 50: 587-594.
Payne RM. 2000. Flora of roofs. Booklet. Kings Lynn.
Pediaditi K, Wehrmeyer W, Chenoweth J. 2005. Monitoring the sustainability of
brownfield redevelopment projects: the Redevelopment Assessment Framework. Land
Contamination & Reclamation 13: 173-183.
Pilling CG, Jones JAA. 2002. The impact of future climate change on seasonal discharge,
hydrological processes and extreme flows in the Upper Wye experimental catchment,
mid-Wales. Hydrological Processes 16: 1201-1213.
Porter L, Hunt D. 2005. Birmingham‟s Eastside story: making steps towards
sustainability? Local Environment 10: 525-542.
Potts SG, Vulliamy B, Dafni A, Ne‟ eman G, Willmer P. 2003. Linking bees and flowers:
How do floral communities structure pollinator communities. Ecology 84: 2628-2642.
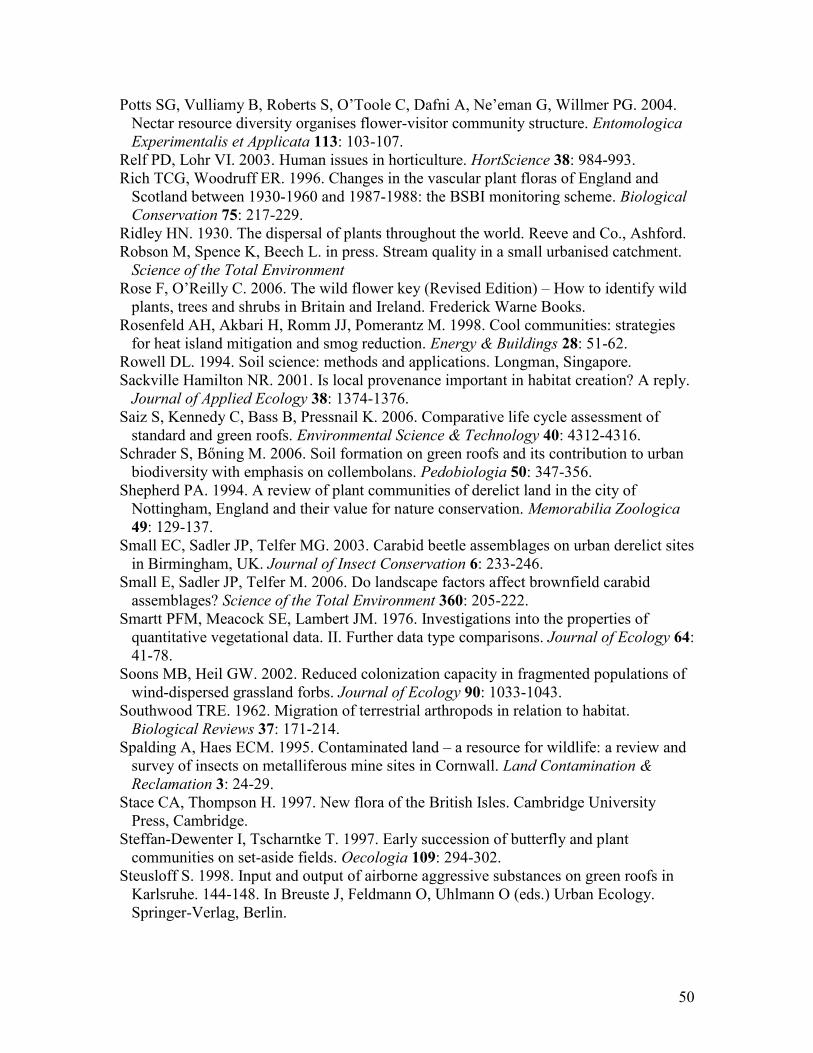
50
Potts SG, Vulliamy B, Roberts S, O‟Toole C, Dafni A, Ne‟eman G, Willmer PG. 2004.
Nectar resource diversity organises flower-visitor community structure. Entomologica
Experimentalis et Applicata 113: 103-107.
Relf PD, Lohr VI. 2003. Human issues in horticulture. HortScience 38: 984-993.
Rich TCG, Woodruff ER. 1996. Changes in the vascular plant floras of England and
Scotland between 1930-1960 and 1987-1988: the BSBI monitoring scheme. Biological
Conservation 75: 217-229.
Ridley HN. 1930. The dispersal of plants throughout the world. Reeve and Co., Ashford.
Robson M, Spence K, Beech L. in press. Stream quality in a small urbanised catchment.
Science of the Total Environment
Rose F, O‟Reilly C. 2006. The wild flower key (Revised Edition) – How to identify wild
plants, trees and shrubs in Britain and Ireland. Frederick Warne Books.
Rosenfeld AH, Akbari H, Romm JJ, Pomerantz M. 1998. Cool communities: strategies
for heat island mitigation and smog reduction. Energy & Buildings 28: 51-62.
Rowell DL. 1994. Soil science: methods and applications. Longman, Singapore.
Sackville Hamilton NR. 2001. Is local provenance important in habitat creation? A reply.
Journal of Applied Ecology 38: 1374-1376.
Saiz S, Kennedy C, Bass B, Pressnail K. 2006. Comparative life cycle assessment of
standard and green roofs. Environmental Science & Technology 40: 4312-4316.
Schrader S, Bőning M. 2006. Soil formation on green roofs and its contribution to urban
biodiversity with emphasis on collembolans. Pedobiologia 50: 347-356.
Shepherd PA. 1994. A review of plant communities of derelict land in the city of
Nottingham, England and their value for nature conservation. Memorabilia Zoologica
49: 129-137.
Small EC, Sadler JP, Telfer MG. 2003. Carabid beetle assemblages on urban derelict sites
in Birmingham, UK. Journal of Insect Conservation 6: 233-246.
Small E, Sadler JP, Telfer M. 2006. Do landscape factors affect brownfield carabid
assemblages? Science of the Total Environment 360: 205-222.
Smartt PFM, Meacock SE, Lambert JM. 1976. Investigations into the properties of
quantitative vegetational data. II. Further data type comparisons. Journal of Ecology 64:
41-78.
Soons MB, Heil GW. 2002. Reduced colonization capacity in fragmented populations of
wind-dispersed grassland forbs. Journal of Ecology 90: 1033-1043.
Southwood TRE. 1962. Migration of terrestrial arthropods in relation to habitat.
Biological Reviews 37: 171-214.
Spalding A, Haes ECM. 1995. Contaminated land – a resource for wildlife: a review and
survey of insects on metalliferous mine sites in Cornwall. Land Contamination &
Reclamation 3: 24-29.
Stace CA, Thompson H. 1997. New flora of the British Isles. Cambridge University
Press, Cambridge.
Steffan-Dewenter I, Tscharntke T. 1997. Early succession of butterfly and plant
communities on set-aside fields. Oecologia 109: 294-302.
Steusloff S. 1998. Input and output of airborne aggressive substances on green roofs in
Karlsruhe. 144-148. In Breuste J, Feldmann O, Uhlmann O (eds.) Urban Ecology.
Springer-Verlag, Berlin.
51
Sustainable Eastside. 2003. Green roofs: benefits and cost implications. Eastside
Sustainability Advisory Group & Groundwork Birmingham. Unpublished report.
SWITCH-Annex 1. 2006. Sustainable Water management Improves Tomorrow‟s Cities‟
Health – Annex 1 “Description of Work”. Sixth Framework Programme Priority
[1.1.6.3] [Global Change and Ecosystems]. Contract no.: 018530-2
Takakura T, Kitade S, Goto E. 2000. Cooling effect of greenery cover over a building.
Energy & Buildings 31: 1-6.
Theis TL, Wirth JL. 1977. Sorptive behaviour of trace metals on fly ash in aqueous
systems. Environmental Science & Technology 11: 1096-1100.
Thiele HU. 1977. Carabid beetles in their environments: A study on habitat selection by
adaptation. Springer-Verlag, Berlin, New York.
Thornton G, Nathanail P. 2005. Are incentives for regenerating UK brownfield sites
sustainable? Land Contamination & Reclamation 13: 327-338.
Tockner K, Stanford JA. 2002. Riverine flood plains: present state and future trends.
Environmental Conservation 29: 308-330.
Ulrich RS. 1984. View through a window may influence recovery from surgery. Science
224: 420-421.
UN. 2002. World urbanization prospects: the 2001 revision. United Nations, New York.
UNFPA. 1996. Changing places: population, development and the urban future. State of
world population 1996, United Nations Population Fund.
Villarreal EL, Bengtsson L. 2005. Response of a Sedum green-roof to individual rain
events. Ecological Engineering 25: 1-7.
Walsh CJ, Fletcher TD, Ladson AR. 2005a. Stream restoration in urban catchments
through redesigning stormwater systems: looking to the catchment to save the stream.
Journal of the North American Benthological Society 24: 690-705.
Walsh CJ, Roy AH, Feminella JW, Cottingham PD, Groffman PM, Morgan II RP. 2005b.
The urban stream syndrome: current knowledge and search for a cure. Journal of the
North American Benthological Society 24: 706-723.
White I, Howe J. 2004. The mismanagement of surface water. Applied Geography 24:
261-280.
Wilkinson DM. 2001. Is local provenance important in habitat creation? Journal of
Applied Ecology 38: 1371-1373.
Wilson PJ. 1992. Britain‟s arable weeds. British Wildlife 3: 149-161.
Wolverton BC, Wolverton JD. 1993. Plants and soil micro-organisms-removal of
formaldehyde, xylene and ammonia from the indoor environment. Journal of the
Mississippi Academy of Sciences 38: 11-15.
Wong NH, Tay SF, Wong R, Ong CL, Sia A. 2003. Life cycle cost analysis of rooftop
gardens in Singapore. Building & Environment 38: 499-509.
Woodward JC, Eyre MD, Luff ML. 2003. Beetles (Coleoptera) on brownfield sites in
England: an important conservation resource? Journal of Insect Conservation 7: 223-
231.
52
Appendices
Appendix 1 The seed mix chosen for the seeded roof
% Latin name Common English name Typical habitat
6 Agrimonia eupatoria Agrimony Grassy places in fields & hedgerows
6 Agrostemma githago Corn cockle Cultivated & waste ground
5 Anthyllis vulneraria Kidney vetch Grassland, dunes, cliff tops, waste ground, usually calcareous
5 Centaurea cyanus Cornflower Traditionally native to cornfields, now mainly in waste places
5 Centaurea nigra Common knapweed Grassy places, rough ground & waysides
3 Daucus carota Wild carrot Grassy & rough ground mostly on chalky soils and near the sea (stunted)
5 Echium vulgare Viper's-bugloss Open grassy places, cliffs, dunes, shingle, rough ground on light calcareous soils
6 Knautia arvensis Field scabious Dry grassy places on light soils
5 Leontodon hispidus Rough hawkbit Basic, often calcareous grassland
4 Leucanthemum vulgare Oxeye daisy Grassy places, especially rich soils
1 Linaria vulgaris Common toadflax Rough & waste ground, stony places, banks, open grassland
5 Lotus corniculatus Birdsfoot trefoil Grassy & harsh places, mainly well-drained soils
2 Origanum vulgare Wild majorum Dry grassland, hedgebanks & scrub, usually on calcareous soils
2 Papaver dubium Long-headed poppy Arable ground, roadsides & waste places
4 Papaver rhoeas Common poppy Arable ground, roadsides & waste places
5 Plantago media Hoary plantain Neutral & basic grassland
5 Prunella vulgaris Selfheal Grassland, lawns, wood-clearings, rough ground
5 Ranunculus bulbosus Bulbous buttercup Dry grassland & fixed dunes
5 Reseda lutea Wild mignonette Disturbed, waste & arable land esp. calcareous soils
6 Sanguisorba minor ssp minor Salad burnet Calcareous or neutral grassland
5 Silene vulgaris Bladder campion Grassy places, open & rough ground
1 Verbascum thapsus Great Mullein Waste and rough ground, banks & grassy places esp. sandy and chalky soils
4 Viola tricolor Wild pansy Waste, marginal & cultivated ground

53
Appendix 2 Vegetation record sheet
Recorder Tray code
Date
Taxa cover-abundance ( * indicates in flower, ** indicates in seed, PTO for extra space)
Stratification
Present Ave. height Max. height
Ground layer - -
Field layer
Scrub layer
Domin-Krajina cover-abundance scale Cover-abundance
+ Solitary, insignificant cover
1 Seldom, insignificant cover Bare ground
2 <1% cover Forbs
3 1-5% cover Graminoids
4 5-10% cover Lichens & Mosses
5 10-25% cover Woody plants
6 25-33% cover Flowering plants
7 33-50% cover Plants in seed
8 50-75% cover
9 >75% cover
10 ~100% cover
Vegetation Survey
Floristic Survey
Structural Survey
Notes

54
Appendix 3 Bird activity record sheet
Bird activity survey
Recorder Block code
Date Time
Species Activity (block/mes. code)
Bird activity codes
1 Foraging/feeding
1a Foraging/feeding - arthropods
1b Foraging/feeding - seeds
2 Preening
3 Collecting nesting material
4 Displaying/singing
5 Resting
6 Unknown/other activity
No. visits (block/mes. code)
Black redstart (Phoenicurus ochruros )
Chaffinch (Fringilla coelebs )
Collared dove (Streptopelia decaocto )
Feral pigeon (Columba livia )
Goldfinch (Carduelis carduelis )
Greenfinch (Carduelis chloris )
House sparrow (Passer domesticus )
Magpie (Pica pica )
Notes
Tree sparrow (Passer montanus )
Starling (Sturnus vulgaris )
Pied Wagtail (Motacilla alba )
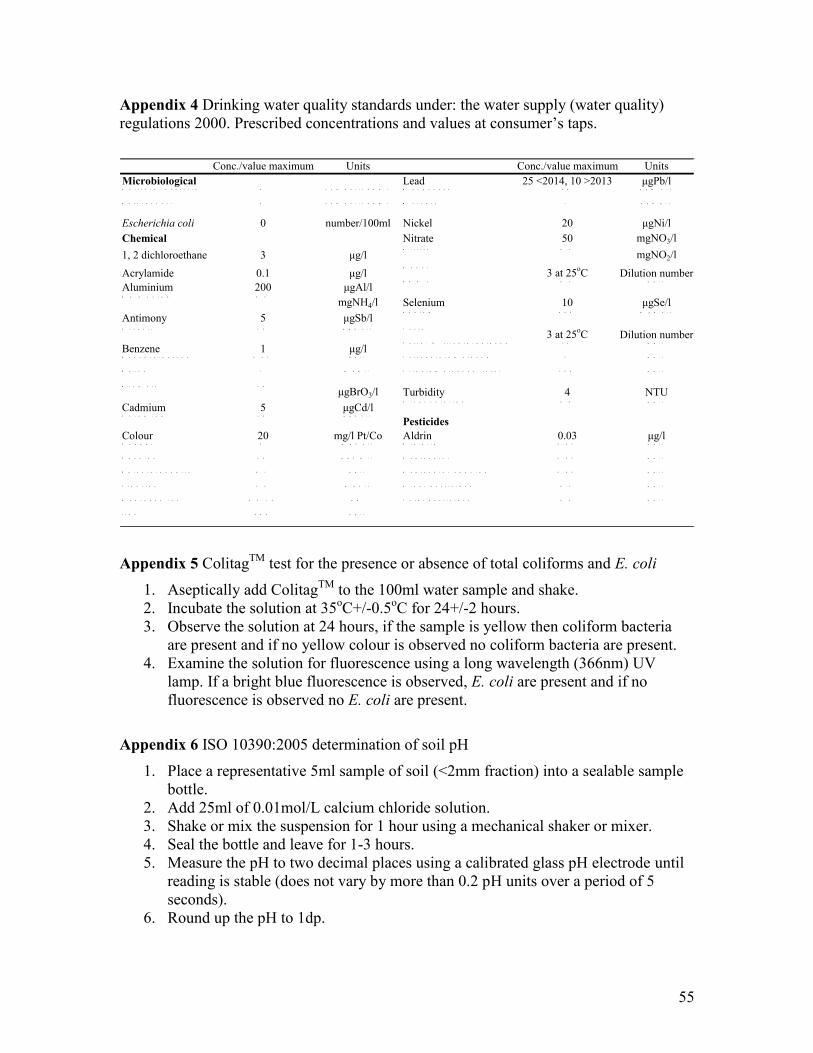
55
Appendix 4 Drinking water quality standards under: the water supply (water quality)
regulations 2000. Prescribed concentrations and values at consumer‟s taps.
Conc./value maximum Units Conc./value maximum Units
Microbiological Lead 25 <2014, 10 >2013 μgPb/lC o l i f o r m b a c t e r i a 0 n u m b e r / 1 0 0 m l M a n g a n e s e 5 0 μ g M n / l
E n t e r o c o c c i 0 n u m b e r / 1 0 0 m l M e r c u r y 1 μ g H g / l
Escherichia coli 0 number/100ml Nickel 20 μgNi/l
Chemical Nitrate 50 mgNO3/l
1, 2 dichloroethane 3 μg/lN i t r i t e 0 . 5
mgNO2/l
Acrylamide 0.1 μg/lO d o u r
3 at 25oC Dilution number
Aluminium 200 μgAl/lP A H ' s 0 . 1 μ g / l
A m m o n i u m 0 . 5
mgNH4/l Selenium 10 μgSe/l
Antimony 5 μgSb/lS o d i u m 2 0 0 m g N a / l
A r s e n i c 1 0 μ g A s / l T a s t e
3 at 25oC Dilution number
Benzene 1 μg/lT e t r a - & t r i c h l o r o e t h e n e 1 0 μ g / l
B e n z o ( a ) p y r e n e 0 . 0 1 μ g / l T e t r a c h l o r o m e t h a n e 3 μ g / l
B o r o n 1 m g B / l T r i h a l o m e t h a n e s : t o t a l 1 0 0 μ g / l
B r o m a t e 1 0
μgBrO3/l Turbidity 4 NTU
Cadmium 5 μgCd/lV i n y l c h l o r i d e 0 . 5 μ g / l
C h r o m i u m 5 0 μ g C r / l
Pesticides
Colour 20 mg/l Pt/Co Aldrin 0.03 μg/lC o p p e r 2 m g C u / l D i e l d r i n 0 . 0 3 μ g / l
C y a n i d e 5 0 μ g C N / l H e p t a c h l o r 0 . 0 3 μ g / l
E p i c h l o r o h y d r i n 0 . 1 μ g / l H e p t a c h l o r e p o x i d e 0 . 0 3 μ g / l
F l o u r i d e 1 . 5 m g F / l O t h e r p e s t i c i d e s 0 . 1 μ g / l
H y d r o g e n i o n 6 . 5 - 1 0 p H T o t a l p e s t i c i d e s 0 . 5 μ g / l
I r o n 2 0 0 μ g / l
Appendix 5 ColitagTM
test for the presence or absence of total coliforms and E. coli
1. Aseptically add ColitagTM
to the 100ml water sample and shake.
2. Incubate the solution at 35oC+/-0.5
oC for 24+/-2 hours.
3. Observe the solution at 24 hours, if the sample is yellow then coliform bacteria
are present and if no yellow colour is observed no coliform bacteria are present.
4. Examine the solution for fluorescence using a long wavelength (366nm) UV
lamp. If a bright blue fluorescence is observed, E. coli are present and if no
fluorescence is observed no E. coli are present.
Appendix 6 ISO 10390:2005 determination of soil pH
1. Place a representative 5ml sample of soil (<2mm fraction) into a sealable sample
bottle.
2. Add 25ml of 0.01mol/L calcium chloride solution.
3. Shake or mix the suspension for 1 hour using a mechanical shaker or mixer.
4. Seal the bottle and leave for 1-3 hours.
5. Measure the pH to two decimal places using a calibrated glass pH electrode until
reading is stable (does not vary by more than 0.2 pH units over a period of 5
seconds).
6. Round up the pH to 1dp.
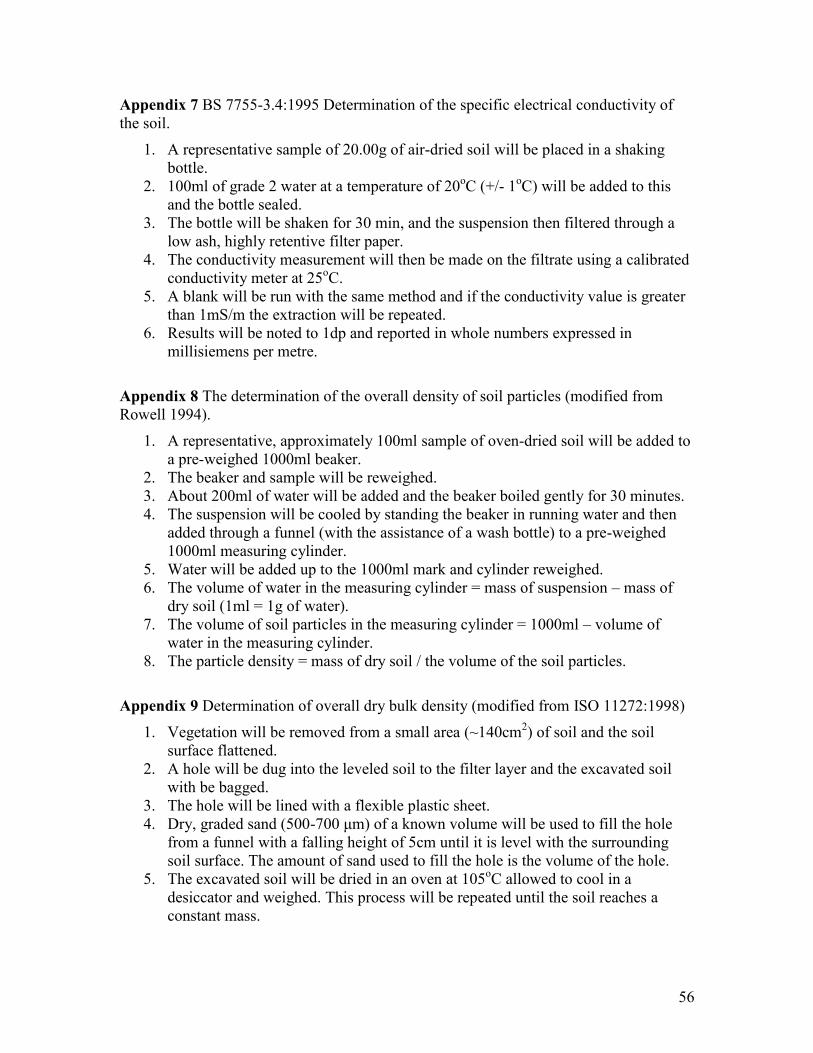
56
Appendix 7 BS 7755-3.4:1995 Determination of the specific electrical conductivity of
the soil.
1. A representative sample of 20.00g of air-dried soil will be placed in a shaking
bottle.
2. 100ml of grade 2 water at a temperature of 20oC (+/- 1
oC) will be added to this
and the bottle sealed.
3. The bottle will be shaken for 30 min, and the suspension then filtered through a
low ash, highly retentive filter paper.
4. The conductivity measurement will then be made on the filtrate using a calibrated
conductivity meter at 25oC.
5. A blank will be run with the same method and if the conductivity value is greater
than 1mS/m the extraction will be repeated.
6. Results will be noted to 1dp and reported in whole numbers expressed in
millisiemens per metre.
Appendix 8 The determination of the overall density of soil particles (modified from
Rowell 1994).
1. A representative, approximately 100ml sample of oven-dried soil will be added to
a pre-weighed 1000ml beaker.
2. The beaker and sample will be reweighed.
3. About 200ml of water will be added and the beaker boiled gently for 30 minutes.
4. The suspension will be cooled by standing the beaker in running water and then
added through a funnel (with the assistance of a wash bottle) to a pre-weighed
1000ml measuring cylinder.
5. Water will be added up to the 1000ml mark and cylinder reweighed.
6. The volume of water in the measuring cylinder = mass of suspension – mass of
dry soil (1ml = 1g of water).
7. The volume of soil particles in the measuring cylinder = 1000ml – volume of
water in the measuring cylinder.
8. The particle density = mass of dry soil / the volume of the soil particles.
Appendix 9 Determination of overall dry bulk density (modified from ISO 11272:1998)
1. Vegetation will be removed from a small area (~140cm2) of soil and the soil
surface flattened.
2. A hole will be dug into the leveled soil to the filter layer and the excavated soil
with be bagged.
3. The hole will be lined with a flexible plastic sheet.
4. Dry, graded sand (500-700 μm) of a known volume will be used to fill the hole
from a funnel with a falling height of 5cm until it is level with the surrounding
soil surface. The amount of sand used to fill the hole is the volume of the hole.
5. The excavated soil will be dried in an oven at 105oC allowed to cool in a
desiccator and weighed. This process will be repeated until the soil reaches a
constant mass.

57
6. The overall dry bulk density = the dry mass of the excavated soil / the volume of
the hole.
Appendix 10 Measurement of water content at the approximate field capacity,
approximate permanent wilting point and loss on ignition (modified from Rowell 1994).
1. A representative sample of soil will be taken at approximate field capacity or
approximate permanent wilting point.
2. About 10g of the soil will be weighed, placed into a weighed crucible and then
placed in an oven at 105oC. The samples will be placed in a desiccator while they
cool and then weighed. This drying will be repeated until they reach a constant
mass.
3. Water content (g H2O g-1
) at approximate field capacity or permanent wilting
point = mass of water lost/mass of oven dry soil
4. The samples will then be cooled in a desiccator and reweighed.
5. The samples will then be placed in a muffle furnace at 550oC until they reach a
constant mass.
6. The samples will again be cooled in a desiccator and reweighed.