D2 12 sos final
38
enviroGRIDS – FP7 European project Building Capacity for a Black Sea Catchment Observation and Assessment supporting Sustainable Development - 1 - Sensor web services Title Sensor web services. Creator Creation date 28.02.2012 Date of last revision Subject Sensor web services Status Final Type Word document Description For the integration of the sensor environment in the Web environment, we will use the Web interface defined by the Open Geospatial Consortium (OGC) initiative, which is called Sensor Web Enablement (SWE). Contributor(s) Karel Charvat, Zbynek Krivanek, Marek Musil, Jan Jezek, Michal Kepka, Martin Vlk, Premysl Vohnout, Petr Horak (CCSS) Rights Public Identifier EnviroGRIDS_D2-12 Language English Relation 1. Abstract: The deliverable EnviroGRIDS_D2-12 describes the implementation of Sensor Observation Services in the frame of EnviroGRIDS@BlackSee. It describes full chain of actions for integration of sensor observations into SDI in the frame of GEOSS and GMESS. The deliverable is focused not only on the implementation of standard sensors, but also on concept Human as a Sensor.
-
Upload
karel-charvat -
Category
Technology
-
view
623 -
download
1
Transcript of D2 12 sos final

enviroGRIDS – FP7 European project
Building Capacity for a Black Sea Catchment
Observation and Assessment supporting Sustainable Development
- 1 -
Sensor web services
Title Sensor web services.
Creator
Creation date 28.02.2012
Date of last revision
Subject Sensor web services
Status Final
Type Word document
Description For the integration of the sensor environment in the Web
environment, we will use the Web interface defined by
the Open Geospatial Consortium (OGC) initiative, which
is called Sensor Web Enablement (SWE).
Contributor(s) Karel Charvat, Zbynek Krivanek, Marek Musil, Jan
Jezek, Michal Kepka, Martin Vlk, Premysl Vohnout, Petr
Horak (CCSS)
Rights Public
Identifier EnviroGRIDS_D2-12
Language English
Relation 1.
Abstract:
The deliverable EnviroGRIDS_D2-12 describes the implementation of Sensor Observation Services in the
frame of EnviroGRIDS@BlackSee. It describes full chain of actions for integration of sensor observations
into SDI in the frame of GEOSS and GMESS. The deliverable is focused not only on the implementation of
standard sensors, but also on concept Human as a Sensor.
enviroGRIDS – FP7 European project
Building Capacity for a Black Sea Catchment
Observation and Assessment supporting Sustainable Development
- 2 -
1 Executive Summary
The EnviroGRIDS_D2-12 deliverable describes the implementation of Sensor Observation Services within
the EnviroGRids@BlackSee project. The deliverable starts with the explanation of the role of sensors in the
frame of GEOSS and GMES activities.
The deliverable defines the following use cases:
• Alert system in case of excess drawing of ground water,
• Testing of concept Human Sensors using Android based technologies.
Theimplementation is tested using these use cases.
In next chapter defines the architecture which includes not only SOS implementation but full chain of
actions for accessing sensors measurements. The chain includes:
• Sensors and Sensors Networks;
• Hardware gate for accessing sensors measurements (Mort and Android based);
• Software gate (deamon) for storing data into a database;
• Database structure for the SOS implementation;
• Implementation of the SOS server for accessing sensor observations in the standardised form;
• Integration with the Micka catalogue;
• Integration with the analytical tools (LernSens, PyWPS);
• Visualisation client for SOS in HSlayers.
There are two possibilities for the integration of SOS with the the rest of the EnviroGrids infrastructure;
either to integrate accessing client for SOS in the Grid environment and use sensor observation for GRID
analytical computing or to use SOS service for collecting data in pilots on the principle Human as a
Service.
The recommendations of the deliverable for the next period are:
• technological recommendations
o To develop client side for accessing sensor measurement from the side of GRID;
o To integrate the import of metadata into the Micka catalogue from SOS GetCapabilities;
o To integrate catalogue client into the SOS embedded client;
o To extend the metadata profile for sensors;
o To integrate the SOS client into the WPS client embedded into Hslayers;
• organisational recommendations
• To organise a large testbed inside of EnviroGrids@BlackSee with Android technology
for Human as a Sensor;
• To implement the SOS server on the EnviroGrids@BlackSee pilot side;
• To provide a test with accessibility of sensor measurement in the Grid environment;

enviroGRIDS – FP7 European project
Building Capacity for a Black Sea Catchment
Observation and Assessment supporting Sustainable Development
- 3 -
• To provide a test with the LernSens technology on the pilot area Litovelske Pomoravi;
• To implement Alert Services in Litovelske Pomoravi.

enviroGRIDS – FP7 European project
Building Capacity for a Black Sea Catchment
Observation and Assessment supporting Sustainable Development
- 4 -
Contents
1 EXECUTIVE SUMMARY .......................................................................................................................... 2
CONTENTS ...................................................................................................................................................... 4
2 LIST OF FIGURES .................................................................................................................................... 5
3 LIST OF TABLES...................................................................................................................................... 5
4 INTRODUCTION ...................................................................................................................................... 6
4.1 PURPOSE AND SCOPE ................................................................................................................................................... 6
4.1.1 Scope and purpose of Task 2.3 .......................................................................................................................... 6
4.1.2 Scope and purpose of Deliverable 2.12 ............................................................................................................. 6
4.2 DOCUMENT STRUCTURE .............................................................................................................................................. 6
5 IN SITU OBSERVATION AS SUPPORT FOR GEOSS AND GMESS ........................................................... 7
5.1 GEOSS ....................................................................................................................................................................... 7
5.2 IN SITU MONITORING IN FRAME OF GMES.................................................................................................................. 7
6 DESCRIPTION OF DEMONSTRATION USE CASE FOR ENVIROGRIDS ...................................................... 9
6.1 ALERT SYSTEM IN CASE OF EXCESS DRAWING OF GROUND WATER ............................................................................ 9
6.2 HUMAN SENSORS TECHNOLOGY ................................................................................................................................ 11
7 ENVIROGRIDS@BLACKSEE SENSOR SOLUTION. ..............................................................................13
7.1 GENERIC ARCHITECTURE .......................................................................................................................................... 13
7.2 COMPONENTS DESCRIPTION ...................................................................................................................................... 14
7.2.1 Sensor technologies .......................................................................................................................................... 14
7.3 HARDWARE GATEWAY .............................................................................................................................................. 18
7.3.1 Mort gateway ..................................................................................................................................................... 19
7.3.2 Android based SmartPhones or Tablets ........................................................................................................... 20
7.4 SOFTWARE GATEWAY ............................................................................................................................................... 20
7.5 DATABASE................................................................................................................................................................. 20
7.6 SOS INTERFACE ........................................................................................................................................................ 22
7.7 CATALOGUE FOR SOS .............................................................................................................................................. 26
7.8 ANALYTICAL MODULES ............................................................................................................................................ 27
7.8.1 PyWPS ............................................................................................................................................................... 27
7.8.2 LernSens ............................................................................................................................................................ 27
7.9 ALERT SYSTEMS ........................................................................................................................................................ 28
7.10 VISUALISATION CLIENT ............................................................................................................................................. 28
8 HOW TO USE SENSORS OBSERVATION BY REST OF ENVIROGRIDS SERVICES ....................................31
9 CONCLUSIONS AND RECOMMENDATIONS ............................................................................................32
9.1 CONCLUSIONS ........................................................................................................................................................... 32
9.2 RECOMMENDATIONS ................................................................................................................................................. 32
REFERENCES .................................................................................................................................................34
TERMINOLOGY .............................................................................................................................................35
ABBREVIATIONS AND ACRONYMS ....................................................................................................................................... 37

enviroGRIDS – FP7 European project
Building Capacity for a Black Sea Catchment
Observation and Assessment supporting Sustainable Development
- 5 -
2 List of figures
Figure 1 GEOSS AIP Engineering Components with Services [2] ................................................................ 7
Figure 2 GMES architecture (source EC) ....................................................................................................... 8
Figure 3 Data source sharing and new services creation ................................................................................ 8
Figure 4 Pilot area .......................................................................................................................................... 9
Figure 5 Demonstration photos of protected are Litovelské Pomoraví .........................................................10
Figure 6 EnviroGrids@BlackSee sensor architecture ...................................................................................13
Figure 7 Instalation of preasure sensor for single dril ...................................................................................15
Figure 8 Scheme of measurment ...................................................................................................................15
Figure 9 Prototype PCB - sensor inputs, control of sensor power management of each sensors .................18
Figure 10 Mort Getaway ...............................................................................................................................19
Figure 11 UML scheme for database.............................................................................................................21
Figure 12 SOS dependencies .........................................................................................................................24
Figure 13 ObservationCollection document ..................................................................................................26
Figure 14 HSlayers UML scheme .................................................................................................................29
Figure 15 HSlayers SOS client ......................................................................................................................30
Figure 16 Graf of measurement .....................................................................................................................31
3 List of tables
Table 1 The total of 22 monitoring/pump wells, the mutual distance of which is 100 to 300 meters, an
electrified railway line and road leads across the measurement line .............................................................11
Table 2 Equivalent terms ..............................................................................................................................25

enviroGRIDS – FP7 European project
Building Capacity for a Black Sea Catchment
Observation and Assessment supporting Sustainable Development
- 6 -
4 Introduction
4.1 Purpose and scope
4.1.1 Scope and purpose of Task 2.3
Task 2.3 is focused on the implementation of interfaces to enable any kind of sensor to publish its data as a
part of EnviroGRIDS@BlackSee as well as providing EnviroGRIDS@BlackSee tools to access sensors
measurment in a standardised form, and finally to store the gathered data on the imide of the
EnviroGRIDS@BlackSee repositories. The integration of the data generated by active sensors with the
EnviroGRIDS@BlackSee environment is a prerequisite for the handling of this data imide of
EnviroGRIDS@BlackSee.
For the integration of the Sensor environment within the Web Environment the Web Interface as defined
by the Open Geospatial Consortium (OGC) initiative is used. It is called Sensor Web Enablement (SWE),
mainly Sensor Observation Services. This allows:
• to describe the sensors in a standardised way;
• to standardise the access to observed data;
• building a framework and encoding for measurements and observations.
4.1.2 Scope and purpose of Deliverable 2.12
The scope of Deliverible D2.12 is not only to describe the implementation of Sensor Observation Standard
(SOS), but also to describe the implementation of this standard in relation to GEOSS and GMES on
concrete use cases. It also demonstrates how SOS can be integrated in the overall infrastructure. The
document describes also the pilot use cases, different sensors used, the integration of sensor measurement
with the Web environment, the possibilities of analysing the measurements and tools for visualisation of
measurements.
4.2 Document structure
The document is structured into the following chapters:
• In situ measurement in the frame of GEOSS and GMES;
• Basic description of EnviroGRIDS@BlackSee sensor measurement chain;
• Definition of Testing Use Cases;
• Hardware technologies for Sensor Measurment;
• Software Sensor Architecture components used inside of EnviroGrids@BlackSee;
• Status of the pilot implementations;
• Sensors and EnviroGrids@BlackSee;
• Conclusions and recommendations.

enviroGRIDS – FP7 European project
Building Capacity for a Black Sea Catchment
Observation and Assessment supporting Sustainable Development
- 7 -
5 In situ observation as a support for GEOSS and GMESS
5.1 GEOSS
The Global Earth Observation System of Systems (GEOSS) has been built by the Group on Earth
Observations (GEO). The GEOSS is focused on user needs and aims to support better utilisation of
environmental data and decision-support tools by users. GEOSS is focused on the global infrastructure
supplying near-real-time environmental data, information and analyses. GEOSS supports the utilisation of
information by wide range of users. There are nine areas in GEOSS: disasters, health, energy, climate,
water, weather, ecosystems, agriculture and biodiversity [1].
The GEOSS Architecture Implementation Pilot (AIP) defined reference architecture for the implementation
of GEOSS services. The integration of sensors is a part of this architecture. The basic architecture scheme
defined by Architecture Implementation Pilot (AIP) is depicted in Figure 1.
Figure 1 GEOSS AIP Engineering Components with Services [2]
The GEOSS architecture is based on the OGC specifications (SWE). Sensor Web Servers has to offer
Services in order to access sensors and sensor networks like ground stations and in-situ networks of
sensors.
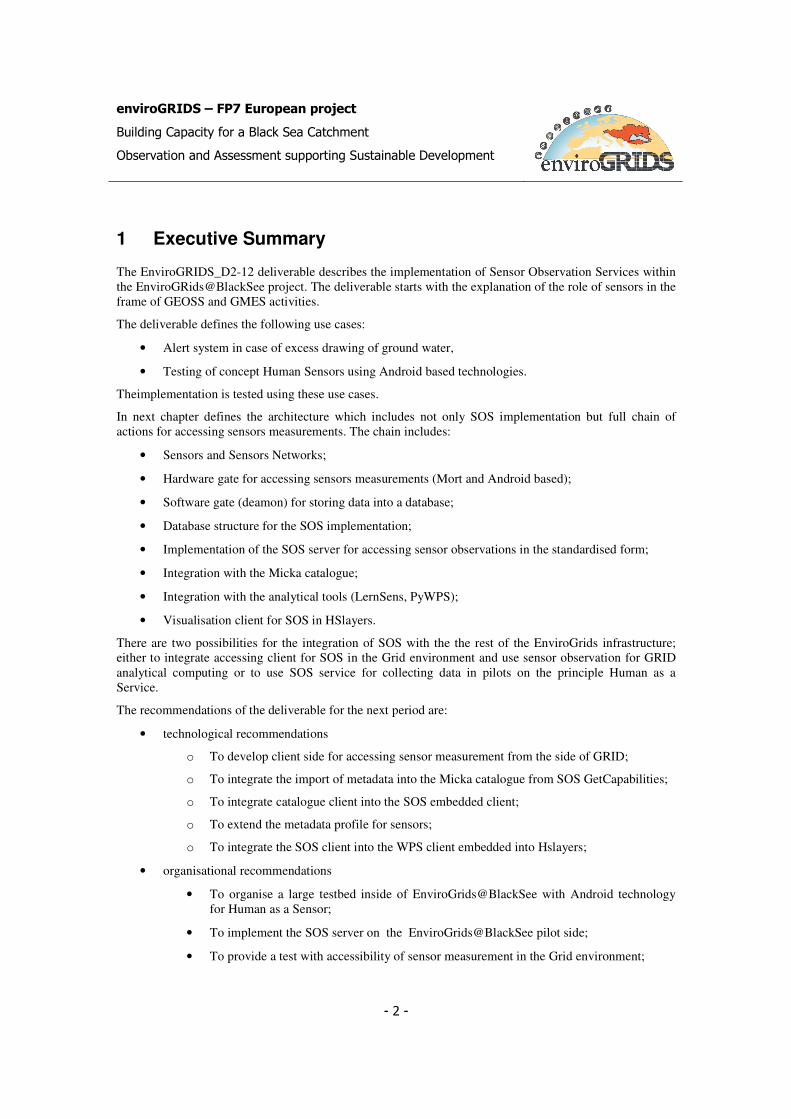
5.2 In situ monitoring in the frame of GMES
GMES expects that basic components of GMES will be given on the base of the schema showed in Fugure
2.
enviroGRIDS – FP7 European project
Building Capacity for a Black Sea Catchment
Observation and Assessment supporting Sustainable Development
- 8 -
Figure 2 GMES architecture (source EC)
The in situ component in GMES will be based on an observation infrastructure, which is expected to be
owned and operated by large number of stakeholders. There will be necessity to coordinate such
infrastructure as a part of the global infrastructure. In situ observation activities and associated
infrastructures will be derived from a range of national, EU and international regulatory requirements and
agreements or from part of research processes [3],[4].
One example of pilot GMES implementation was relaised inside of the Earthlook.cz project. This concept
and the implementation are also used for the EnviroGrid@BlackSee architecture. The basic schema is in
Fugure 3.
Figure 3 Data source sharing and new services creation

enviroGRIDS – FP7 European project
Building Capacity for a Black Sea Catchment
Observation and Assessment supporting Sustainable Development
- 9 -
A part of the solution was a GMES data management allowing registered users are to import their own data
onto the portal, create new map compositions, integrate external GMES sources through web services and
to make them available to other users as a new web service [5].
6 Description of demonstration use case for EnviroGrids
To test the different possibilities of sensor integration and also to demonstrate the usability of the Sensor
observation services implementation, two different demonstration scenarios were selected, on which
different technologies are tested. They include:
• Alert system in case of excess drawing of ground water;
• Testing of concept Human Sensors using Android based technologies.
These two pilots demonstrate different technological possibilities of the implementation of the SWE
environment and different types of scenarios and demonstrate the possibilities of static and dynamic
systems.
6.1 Alert system in case of excess drawing of ground water
The pilot is implemented in the protected area Litovelské Pomoraví (Litovelske Pomoravi PLA)
(www.litovelskepomoravi.nature.cz), which belongs to the Black See catchment. The scenario can be easily
used in all regions of the Black See catchment.
NCA Litovelské Pomoraví is a bottomland forests conservation area and it is also the source of drinking
water from surrounding cities and towns. During the summer, when there is a rainfall deficit, demand for
drinking water consumption increases and at the same time, it is necessary to actively protect the cover of
bottomland forests, so that they are not damaged irreversibly. For the bottomland forest, the biggest danger
is the fall of the ground water level to a critical limit, when the water column to the root system of the
forest is interrupted.
Figure 4 Pilot area

enviroGRIDS – FP7 European project
Building Capacity for a Black Sea Catchment
Observation and Assessment supporting Sustainable Development
- 10 -
Figure 5 Demonstration photos of the protected area Litovelské Pomoraví
Another particular local problem is the drying up of the Benkovský brook spring and watercourse.
Consequences can be seen in the village Střeň (located further on the Benkovský brook watercourse),
where waters drained out of the local sewage treatment plant led to Benkovský brook and, in the case of
low level of water or drying up of the brook, water from the sewage treatment plant is not diluted
sufficiently.
The use case aims to create a system, which would independently monitor the ground water level and
thereby enable the optimisation of drawing the ground water from individual pump wells in order to
comply with the demand of consumers and at the same time ensure the protection of the bottomland forest.
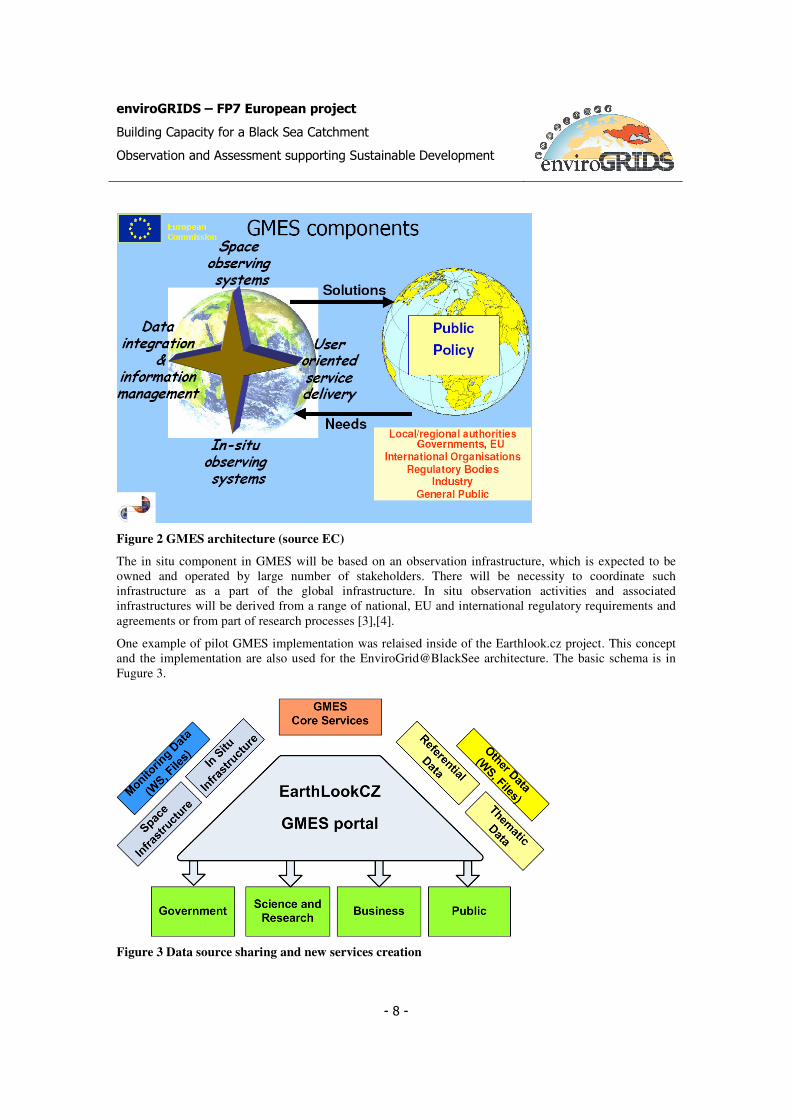
The testig pilot runs with 22 drils
identification
HV 101 49°43‘46‘‘N 17°09‘02‘‘E
HV 102 49°43‘44‘‘N 17°08‘59‘‘E
HV 103 49°43‘42‘‘N 17°08‘56‘‘E
HV 104 49°43‘39‘‘N 17°08‘52‘‘E
enviroGRIDS – FP7 European project
Building Capacity for a Black Sea Catchment
Observation and Assessment supporting Sustainable Development
- 11 -
HV 105 49°43‘34‘‘N 17°08‘45‘‘E
HV 106 49°43‘31‘‘N 17°08‘42‘‘E
HV 207 49°43‘19‘‘N 17°08‘47‘‘E
HV 208 49°43‘16‘‘N 17°08‘45‘‘E
HV 209 49°43‘12‘‘N 17°08‘44‘‘E
HV 210 49°43‘06‘‘N 17°08‘41‘‘E
HV 211 49°43‘00‘‘N 17°08‘39‘‘E
HV 212 49°42‘51‘‘N 17°08‘32‘‘E
HV 213 49°42‘48‘‘N 17°08‘25‘‘E
HV 214 49°42‘42‘‘N 17°08‘18‘‘E
HV 315 49°42‘37‘‘N 17°08‘10‘‘E
HV 316 49°42‘38‘‘N 17°07‘57‘‘E
HV 317 49°42‘45‘‘N 17°07‘47‘‘E
HV 418 49°42‘29‘‘N 17°07‘35‘‘E
HV 419 49°42‘25‘‘N 17°07‘30‘‘E
HV 420 49°42‘22‘‘N 17°07‘25‘‘E
HV 421 49°42‘19‘‘N 17°07‘22‘‘E
HV 422 49°42‘13‘‘N 17°07‘12‘‘E
Table 1 22 monitoring/pump wells, the mutual distance is 100 to 300 meters, an electrified railway
line and road leads across the measurement line
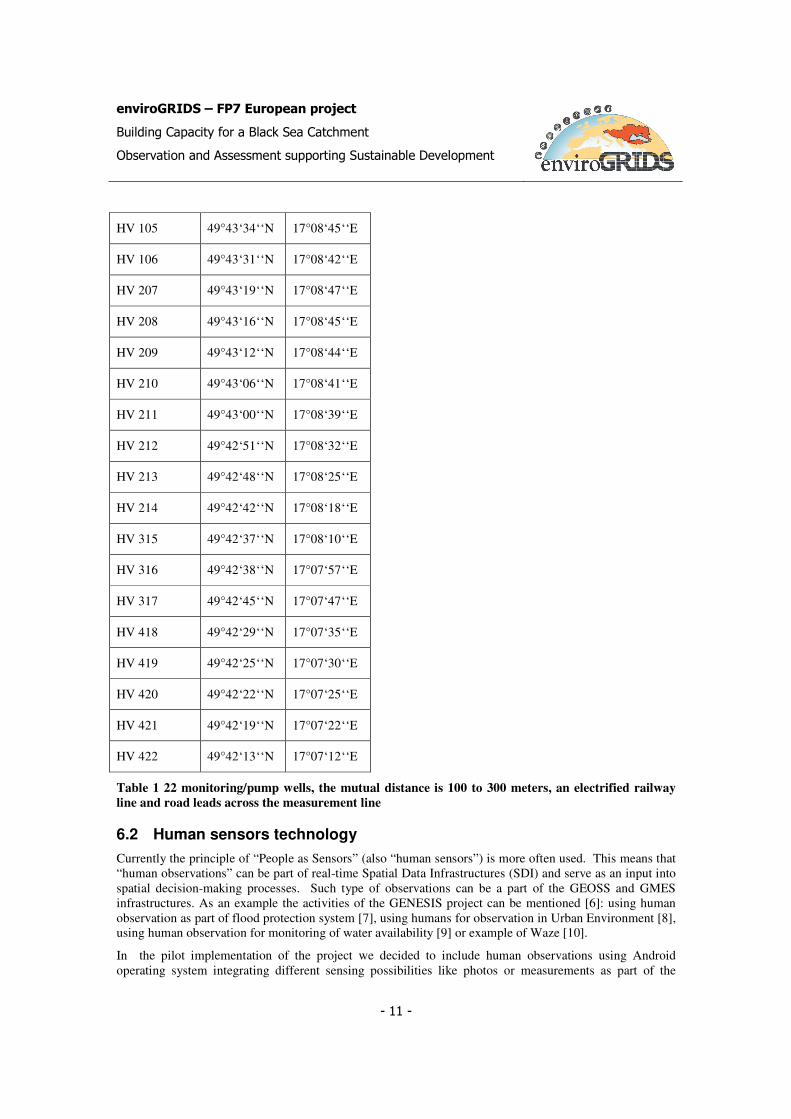
6.2 Human sensors technology
Currently the principle of “People as Sensors” (also “human sensors”) is more often used. This means that
“human observations” can be part of real-time Spatial Data Infrastructures (SDI) and serve as an input into
spatial decision-making processes. Such type of observations can be a part of the GEOSS and GMES
infrastructures. As an example the activities of the GENESIS project can be mentioned [6]: using human
observation as part of flood protection system [7], using humans for observation in Urban Environment [8],
using human observation for monitoring of water availability [9] or example of Waze [10].
In the pilot implementation of the project we decided to include human observations using Android
operating system integrating different sensing possibilities like photos or measurements as part of the

enviroGRIDS – FP7 European project
Building Capacity for a Black Sea Catchment
Observation and Assessment supporting Sustainable Development
- 12 -
Sensor Enablement Infrastructure to support operations including semi-automated quality assurance, sensor
fusion, standardised alerting (including Complex Processing) and integration of different Volunteered
Geographic Information as part of the EnviroGrids infrastructure.
The pilot implemtation demonstrates data collection coming from smart phones and tablets with the
Android operation system and their accessibility using Sensor Observation Interfaces. This could be used
for water monitoring, waste management, but also for collection of observations, which can be used for
calibration of remote sensing tasks.
enviroGRIDS – FP7 European project
Building Capacity for a Black Sea Catchment
Observation and Assessment supporting Sustainable Development
- 13 -
7 EnviroGRIDS@BlackSee Sensor Solution
7.1 Generic architecture
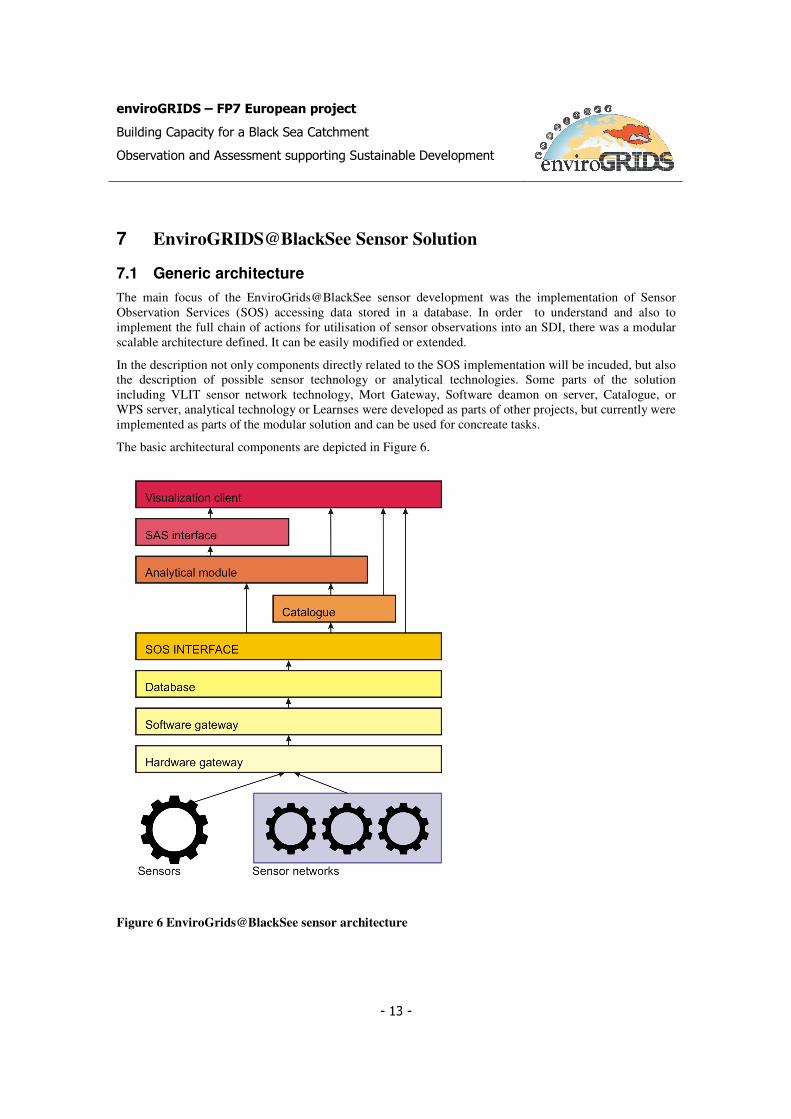
The main focus of the EnviroGrids@BlackSee sensor development was the implementation of Sensor
Observation Services (SOS) accessing data stored in a database. In order to understand and also to
implement the full chain of actions for utilisation of sensor observations into an SDI, there was a modular
scalable architecture defined. It can be easily modified or extended.
In the description not only components directly related to the SOS implementation will be incuded, but also
the description of possible sensor technology or analytical technologies. Some parts of the solution
including VLIT sensor network technology, Mort Gateway, Software deamon on server, Catalogue, or
WPS server, analytical technology or Learnses were developed as parts of other projects, but currently were
implemented as parts of the modular solution and can be used for concreate tasks.
The basic architectural components are depicted in Figure 6.
Figure 6 EnviroGrids@BlackSee sensor architecture

enviroGRIDS – FP7 European project
Building Capacity for a Black Sea Catchment
Observation and Assessment supporting Sustainable Development
- 14 -
7.2 Components description
7.2.1 Sensor technologies
In the EnviroGRIDS@BlackSee project we are providing a test with two types of sensor technology. The
first type is a specific solution developed directly for the purpose of pilot Litovelské Pomoraví supporting
measurement of height of water column. The second technology is more generic and it is new generation of
Wireless Sensors Network technology called VLITE node. This technological solution was developed as
part of the VLIT Node project with financial support from state resources provided by the Ministry of
Industry and Trade of the Czech Republic for support of project of the program “TIP-2009” with
registration number FR—TI1/523 and we only integrated this technology within the
EnviroGrids@BlackSee infrastructure. We are testing both technologies in pilot areas of Litovelske
Pomoravi. The data collection is provided by two methods:
• Single drils – use a separate sensor node with GPRS data transmission to the Internet. To save
power, the data are scanned every hour, but sent in batches with every 24 hours. The system is
battery powered and has a lifetime of several years.
• Group of drills - individual sensor nodes are interconnected by wireless sensor communications
(VLITE technology). Measured data transmission between the measuring nodes using multihop on
the gateway, which serves to control the sensor network and data transmission to the Internet.
Nodes ares battery powered and have a lifetime of several years. The Gateway Energy intensity is
higher, it is necessary to charge with a minimum of solar cells.
7.2.1.1 Sensors technology used for groundwater measurement in the EnviroGrids@BlackSee project
A sensor is a device that measures a physical quantity and converts it into a signal which can be read by an
observer or by an instrument. Groundwater level is measured by determining the height of water column
above the pressure sensor. Pressure sensor is equipped with temperature compensation and compensation
for changes in atmospheric pressure. The measured values are transmited using GPRS.

enviroGRIDS – FP7 European project
Building Capacity for a Black Sea Catchment
Observation and Assessment supporting Sustainable Development
- 15 -
Figure 7 Installation of preassure sensor for single drill
Figure 8 Scheme of the measurment architecture

enviroGRIDS – FP7 European project
Building Capacity for a Black Sea Catchment
Observation and Assessment supporting Sustainable Development
- 16 -
7.2.1.2 Wireless Sensor Network and VliteNod technology
The future utilisation of sensors technologies will be mainly based on Wireless Sensors Network which is
an emerging technology made up from tiny, wireless sensors or “motes.” Sensor Network Systems provide
a novel paradigm for managing, modelling and supporting complex systems requiring massive data
gathering, with pervasive and persistent detection/monitoring capabilities.
The main features that a sensor network should have are:
• each node should have a very low power consumption, the capability of recharging its battery or
scavenging energy from the environment, and very limited processing capabilities;
• each node should be allowed to go in stand-by mode (to save as much battery as possible) without
severely degrading the connectivity of the whole network and without requiring complicated re-
routing strategies;
• the estimation/measurement capabilities of the system as a whole should significantly outperform
the capabilities of each sensor and the performance should improve as the number of sensors
increases, with no mandatory requirement on the transmission of the data of each single sensor
toward a centralised control/processing unit; in other words, the network must be scalable and
self-organising, i.e. capable of maintaining its functionality (although modifying the performance)
when the number of sensor is increased;
• a sensor network is ultimately an event-driven system, so that what it is really necessary to
guarantee is that the information about events of interest reach the appropriate control nodes,
possibly through the simplest propagation mechanism, not necessarily bounded to the common
OSI protocol stack layer;
• congestion around the sink nodes should be avoided by introducing some form of distributed
processing;
• the information should flow through the network in the simplest way, not necessarily relying on
sophisticated modulation or multiplexing techniques.
Summarising, the fundamental requirements of a sensor network are:
• Very low complexity of elementary sensors, associated with a low power consumption and low-
cost;
• High reliability of the decision/estimation/measurement of the network as a whole;
• Long network life-time for low maintenance and stand-alone operation;
• High scalability; [11]
Currently, there is a number of technologies, protocols and standards for building wireless sensor networks.
Sensor networks are generally seen as cloud of mutually communicating measurement units that are
capable of measuring one or more physical parameters. Each measuring unit consists of a communication
node ensuring the communication with other units of measurement and its own sensor. The communication
nodes are built on different platforms. Their drawback is that they are able to guarantee the communication
between sensors of only tens of meters. This reduces the network ranges and the networks are not
affordable.
The development of the second generation RFID offers the possibility to create a new generation
communication nodes using RFID technology. In VlitNod project Cominfo ltd. Together with CCSS
developed RFID technology with unique properties based on long-range communication and cost-
effectiveness. The technology known as Very Long Range Identification Tag is characterized by a working
frequency of 868 MHz and protocol that supports communication in Point-to-Point, Point-to-MultiPoint
and retranslation of the large distance across multiple devices. In combination with the mobile unit and the
software interface is generated by Research Centre CCSS. vLite NODE represents a completely new and
unique solution for the construction of mobile sensor networks.
enviroGRIDS – FP7 European project
Building Capacity for a Black Sea Catchment
Observation and Assessment supporting Sustainable Development
- 17 -
The node consists of two parts. The first is the host board for connecting the communication module and
pour connectivity for data line sensors. The second part is the electronics that provides controlled power
sensors and the module itself to achieve minimum energy consumption.
When the measured data are transferred with standard data packet the information about the signal strength
(RSSI) and the voltage level of node are also carried. Receiving of data in the the observation area provides
the network access point that deals with other communication and data transfer.
One of the goals of the VLIT Node project is to build an extensive network of wireless sensors
communicating with the MESH topology. MESH topology enables connection of nodes to any other node
in the network. This connection can be established using one or more hops. As part of the MESH topology
is provided automatic configuration of network structure, reliable routing between nodes and automatic
access to new nodes in the network via the existing nodes. Hop identifies the network segment, where all
participants can communicate to each other without the need for routing. Multi-hop network is a network
composed of several such segments, where information could be routed among the nodes. In the area of
wireless networks AH-HOC is used. AH-HOC is a network where actors do not require any pre-created
infrastructure to be able to communicate with each other and it provides the necessary functionality for the
network management.
The main benefit of using mesh topology is the possibility to form redundant links, due the nature of
network topology guarantee transmission of information. Mesh topology is not restrictive in the network
structure and therefore simplifies the automatic compilation of links and network recovery after failure. The
connection between two points in a full mesh topology can be set up whenever they are able to
communicate. Mesh topology can be set up almost always. Implementation of mesh networks in practice is
highly dependent on the method of communication, the technical and application requirements. Mesh
networks are divided according to whether they are mobile or stationary, wireless or wired, occasional or
defined (e.g. sensory). Each type of MESH network can solve a specific protocol, which is mainly different
algorithm to find and build paths from the data source to the destination.
Firmware microprocessor module VLIT can generally be divided into several general programme blocks.
Mesh networks are a way to transmit data, voice and commands between nodes. They allow continuous
connections and reconfiguration around the fallen or blocked paths by jumping from node to node until it is
achieved. MESH network whose nodes are all interconnected with other nodes is fully connected network.
Mesh networks differ from other networks in the fact that the parts can all connect to each other. Each node
MESH network can be a router. Mesh network can be viewed as a type of temporary or occasional (ad hoc)
network. Mobile ad-hoc network (MANET) and mesh networks are thus closely linked, but pose problems
of MANET nodes mobility.
Mesh networks are self-healing. The network can remain in operation whenever any node fails or drops the
connection. The result is large network reliability. This concept is applicable to wireless networks, cable
networks, and software interaction. Wireless Mesh Networks are the highest rank of MESH networks. They
were originally developed for military applications but experienced great development. Design of Mesh
networking nodes has become more modular - a single node can support multiple radio cards - each
working on different frequencies.
Proactive algorithms require enough memory for routing tables. In these data are stored to reach any
network node. The main problem of the algorithm is then given by constructing a routing table and its
updates. Their main disadvantage is the memory consumption and slow reaction to changes in the network
structure.
Reactive algorithms have low memory requirements, because they do not store routing algorithms for all
network nodes, or even no routing information. Each connection is established just before the data transfer.
Then the connection is terminated. The connection is omnidirectional. Their main disadvantages are large
unexploited time in search of connection and network congestion at risk of broadcast queries.
enviroGRIDS – FP7 European project
Building Capacity for a Black Sea Catchment
Observation and Assessment supporting Sustainable Development
- 18 -
Hybrid algorithms are used as the routing table establishing a connection before transferring data. These
algorithms have been developed in a large amount of effort to optimize the memory requirements of nodes,
the need for frequent updating of routing tables (optimization in time and space), minimizing broadcast
queries to build path [12].
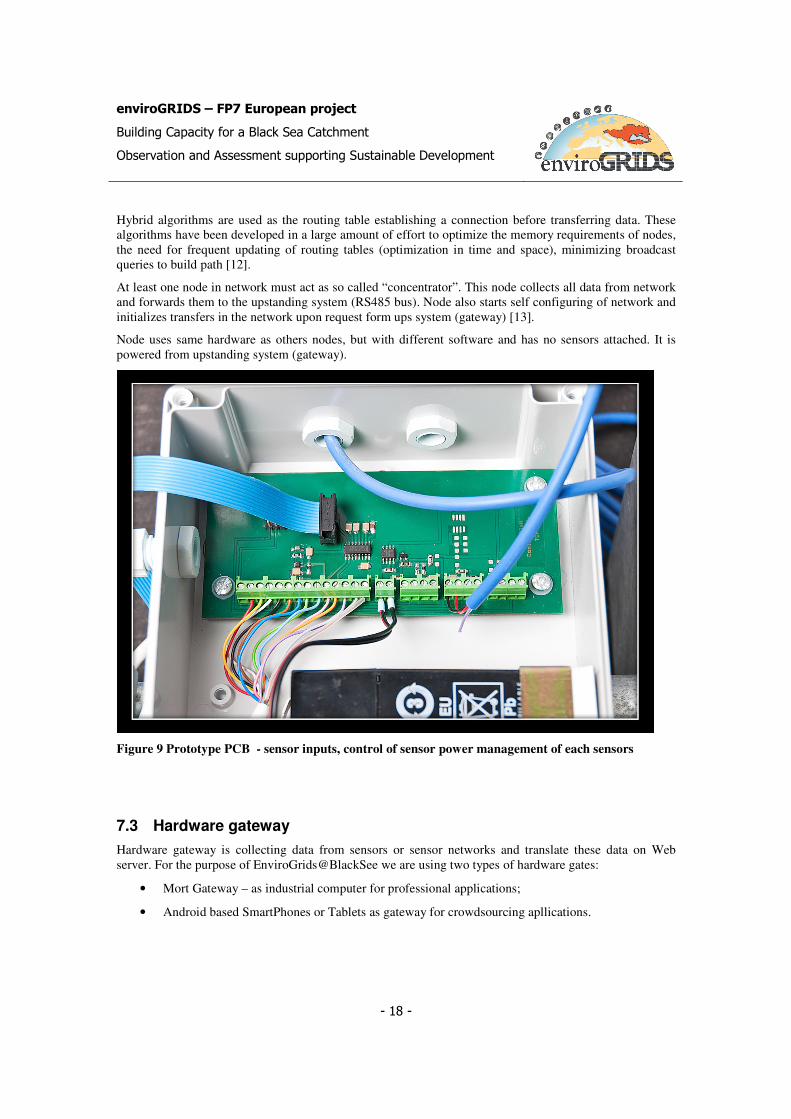
At least one node in network must act as so called “concentrator”. This node collects all data from network
and forwards them to the upstanding system (RS485 bus). Node also starts self configuring of network and
initializes transfers in the network upon request form ups system (gateway) [13].
Node uses same hardware as others nodes, but with different software and has no sensors attached. It is
powered from upstanding system (gateway).
Figure 9 Prototype PCB - sensor inputs, control of sensor power management of each sensors
7.3 Hardware gateway
Hardware gateway is collecting data from sensors or sensor networks and translate these data on Web
server. For the purpose of EnviroGrids@BlackSee we are using two types of hardware gates:
• Mort Gateway – as industrial computer for professional applications;
• Android based SmartPhones or Tablets as gateway for crowdsourcing apllications.

enviroGRIDS – FP7 European project
Building Capacity for a Black Sea Catchment
Observation and Assessment supporting Sustainable Development
- 19 -
7.3.1 Mort gateway
Gateway is a small computer kit based on modules compatible with industrial standard PC104. Boards (cpu
or peripherals) are stack together like building blocks. Each board has mounting holes in the corners which
allow the boards to be fastened to each other with standoffs. Standard also defines electrical connections
(parallel ISA like bus), which is in the Mort case supplemented by proprietary connectors providing
specific buses (SPI, UART ….) and power connection. In the network gateway it creates main data
collector, buffer and transmitter to the outer world.
In the case, gateway consists of power board (powering of other boards, battery handling), processor board
(AVR Atmega with sram memory, flash), GPRS modem board (optionally with GPS module) and RS485
expansion board.
Gateway has a small four line alphanumerical display, used to show current status of the gateway and
actually processed sensor measurement.
System uses modified open source real time operating system Ethernut (www.ethernut.de) with extensions
respective to used peripherals and connected sensors. OS consists of several libraries and general API
framework for user application with support of easy data acquisition via common API.
In the case of the VlitNode gateway uses one VlitNode connected through serial line as access point to the
wireless vlit node network, issues data acquisition and receives measured data. Adds time stamp and sensor
unique number to sensor data packet and stores in internal memory. System buffers acquired sensor data in
its internal memory in ring buffer, in inbuilt flash memory or user CD micro card. Once buffer is full, the
oldest data are deleted.
Figure 10 Mort Getaway
It can also do some data processing including averaging, maximum, minimum, sum, and more. To reach
the Internet, the gateway uses GSM modem with GPRS capability. Modem firmware comprises its own

enviroGRIDS – FP7 European project
Building Capacity for a Black Sea Catchment
Observation and Assessment supporting Sustainable Development
- 20 -
TCP/IP stack. The gateway sends data through GPRS channel in configured time intervals to the defined
server. It uses proprietary binary protocol on UDP, which is byte saving with CRC and data
acknowledgment system from server side. If needed, TCP can be also used. If it is possible (depends if
wired ethernet network is reachable in locality), gateway can use built in ethernet controller instead of
modem for data transport.
7.3.2 Android based SmartPhones or Tablets
For testing of the Human as a Sensor concept we selected Android operating system as a Linux-based
operating system for mobile devices. The reason is that Android has a large community of developers and
also possibilities of easy writing applications ("apps") that extend the functionality of the devices. It is one
of the most popular systems and the community is growing fast.Smartphones and tablets with Androids
allow to connect different sensors using Arduino ADK Mega board. This board integrates a USB host
controller compatible with Google ADK. This is an interface for external sensors. Originally it is used for
displaying measurements from sensor data on Smartphones.
We developed special apps for Android, which allows transferring position and measurement on the web. It
can transfer measurements, but also text written by the users or videos and photos. The software interface
on the side of Web is the same as for Mort.
So far there has been a simple prototype application implemented for Android based smartphone (Nexus
S). The main concept of sensor web is based on http communication that is easy implementable on
Smartphones. Smartphones can also easily provide its position by using GPS or GSM network. Finally
there exist many third party hardware devices that enable connection of Android based devices to any
custom sensor device. As a particular example Arduino ADK can be used to integrate Nexus S (and many
others Android devices) with any off the shelf custom sensor device. It is also worth to mention that the
Android device as such can provide many sensor capacities, where the camera is probably one of the most
useful.
In the scope of our prototype we used an Android based mobile phone that sends its position and measured
temperature to the server side database. Such data are then accessible through SOS.
7.4 Software gateway
After the data reach the server by UDP or TCP protocol, they have to be stored into the database. For that
propose we have designed several web services that can be called using HTTP GET or POST. Server side
application then perform insertions of data to database (this is implemented as Java web application). Then
a set request that is available as REST services has been implemented. These services enable client side
application to query the database and retrieve output in JSON format. This format can be then easily used
for AJAX based client application. The database design has been tested with special emphasis on
performance and scalability.
7.5 Database
As the main data storage Postgres with PostGIS relation database management system is used. The
database schema is shown bellow. Couple of functions and trigger functions has been implemented in
Plpgsql to process and sort the data during insertion for improving the performance. The database schema
is also designed for the case of moving sensors (attached to cars for example).
Important tables:
• Units - List of Mobile Units located in sensor network.
• Sensors - List of sensor types located in sensor network, sensors are attached to units (m:n)

enviroGRIDS – FP7 European project
Building Capacity for a Black Sea Catchment
Observation and Assessment supporting Sustainable Development
- 21 -
• Phenomenon - Phenomenon of measured values
• Observations - particular sensor observations
• Alert events - Real events of alert situation (e.g. temperature is exceeding predefined
threshold)
• Alerts - General description of alert situation that should be monitored
Figure 11 UML scheme for the database
As every software system, a DBMS for sensor data operates in a faulty computing environment. A failure
can corrupt the respective database unless special measures are taken to prevent this.
In solution proposed for EnviroGrids we have to deal with scalability and high availability of data. We are
proposing to use proper replication and clustering mechanism. For that propose, we are using pgpool-II.
Pgpool-II is a middleware that works between PostgreSQL servers and a PostgreSQL database client. It
provides the following features

enviroGRIDS – FP7 European project
Building Capacity for a Black Sea Catchment
Observation and Assessment supporting Sustainable Development
- 22 -
• Connection Pooling
pgpool-II saves connections to the PostgreSQL servers, and reuse them whenever a new connection with
the same properties (i.e. username, database, protocol version) comes in. It reduces connection overhead,
and improves system's overall throughput.
• Replication
pgpool-II can manage multiple PostgreSQL servers. Using the replication function enables creating a
realtime backup on 2 or more physical disks, so that the service can continue without stopping servers in
case of a disk failure.
• Load Balance
If a database is replicated, executing a SELECT query on any server will return the same result. pgpool-II
takes an advantage of the replication feature to reduce the load on each PostgreSQL server by distributing
SELECT queries among multiple servers, improving system's overall throughput. At best, performance
improves proportionally to the number of PostgreSQL servers. Load balance works best in a situation
where there are a lot of users executing many queries at the same time.
• Limiting Exceeding Connections
There is a limit on the maximum number of concurrent connections with PostgreSQL, and connections are
rejected after this many connections. Setting the maximum number of connections, however, increases
resource consumption and affect system performance. pgpool-II also has a limit on the maximum number
of connections, but extra connections will be queued instead of returning an error immediately.
• Parallel Query
Using the parallel query function, data can be divided among the multiple servers, so that a query can be
executed on all the servers concurrently to reduce the overall execution time. Parallel query works the best
when searching large-scale data. This software features are being extensively tested nowadays and will be
used with respect to supposed amount of data and users. One of the other solutions that are being under
research nowadays are NoSQL distributed databases such as Cassandra.
Hypertext Transfer Protocol (HTTP) API for inserting measured data was made in Java programming-
language. Therefore common users will not need to deal with the database itself. There are HTTP GET
methods for inserting observations, positions and alert events. These services are based on simple but
proprietary protocol. Another possibility of insertion is to utilize more complicated SOS transactional
profile that is based on HTTP Post and XML based communication.
Main interface for client side application is designed as a set of web services written in Java that provides
HTTP GET interface to retrieve data from database. These services provide users with particular data in
JSON format. The services are using authentication so user can get just data that they have privileges to
see. After authentication you can start to query the database using HTTP GET requests [14].
7.6 SOS interface
The SOS Senslog interface was the main part of the development inside of EnviroGrids@BlackSee. The
idea of Sensor Webs was established just for these cases. OGC’s Sensor Web Enablement (SWE) activities
have established the interfaces and protocols that will enable Sensor Webs [15].
The most relevant standards from SWE are:

enviroGRIDS – FP7 European project
Building Capacity for a Black Sea Catchment
Observation and Assessment supporting Sustainable Development
- 23 -
● Observations & Measurements (O&M) – The general models and XML encodings for sensor
observations and measurements.
● Sensor Model Language (SensorML) – The general models and XML schema for describing
sensors and processes associated with measurement.
● Transducer Markup Language (TML) – General characterizations of transducers, their data, the
phenomenon, transporting the data, and any and all support data (metadata) necessary for later
processing and understanding of the transducer data.
● Sensor Observation Service (SOS) – The service provides an API for managing deployed sensors
and retrieving sensor data (observations).
SOS provides access to observations from sensors and sensor systems in a standard. The same way is used
for any type of sensor systems. It can be remote sensing, in-situ, fixed and mobile sensors. SOS leverages
the O&M specification for modelling observations and the TML and SensorML specifications for
modelling sensors and sensor systems. SOS is primarily designed to provide access to observations.
SensLog prototype of SOS was implemented using data model from Figure 10.
In Senslog we are mainly focused on publication of observation in standard form for consumers of
observation. It can be analytical modules, view client etc [16].
For every SOS implementation the three operations are mandatory:
● GetCapabilities – provides the means to access SOS service metadata.
● GetObservation – provides access to sensor observations and measurement data, a spatio-temporal
query filtered by phenomena can be used.
● DescribeSensor – retrieves detailed information about the sensors and processes generating those
measurements.
There exist also non mandatory operations. Two are supporting transactions – RegisterSensor and
InsertObservation. And there are also six enhanced operations – GetResult, GetFeatureOfInterest,
GetFeatureOfInterestTime, DescribeFeatureOfInterest, DescribeObservationType, and
DescribeResultModel.
All SOS requests and responses are in the form of XML encoded documents sent by HTTP POST method.
The forms of requests and responses are provided in W3C XML Schema (XSD) language. These schemes
are part of SOS Implementation standard. SOS is one of the SWE technologies builds the Sensor Webs. It
uses partially components from other SWE standards. Figure 11 shows the SOS dependency on other OGC
standards [17].

enviroGRIDS – FP7 European project
Building Capacity for a Black Sea Catchment
Observation and Assessment supporting Sustainable Development
- 24 -
Figure 12 SOS dependencies
Figure 11 demonstrates that SOS uses a lot of other OGC standards. SOS is consider as a complex service
for all possible observations. This makes SOS very complicated.
The implementation of SOS is a server-side application which accepts request, collects data from database
and compiles responses. The response sent by SOS can be a standard document with requested data or an
exception when SOS encounters an error while performing the operation.
Senslog implemented SOS service [18] based on the technology of data binding. It means that classes and
interfaces are derived from XML schemas by binding compiler. Java Architecture for XML Binding
(JAXB) was used for our purposes [19]. They are used compiled schemes from the OGC Schemas and
Tools Project at this time. The OGC Schemas project provides JAXB 2.x bindings for XML Schemas
defined by OGC. These compiled schemas are developed by Aleksei Valikov under 3-clause BSD license
[20]. Binding a schema means generating a set of Java classes that represents the schema. All JAXB
implementations provide a tool called a binding compiler to bind a schema (XJC) [Lau08]. After binding
we do not have to deal with XML documents ourselves, we deal with programming-language objects, in
this case with Java classes. Reading an XML document in JAXB terminology is called unmarshalling.
Unmarshalling an XML document means creating a tree of content objects that represents the content and
organisation of the document. Writing an XML document is called marshalling, it creates a XML document
from a content tree.
The implementation is a server-side application that includes core operations of SOS with mandatory
parameters at this time.
Implemented operations and their parameters are:
● GetCapabilities
○ Request – GetCapabilities document with mandatory parameters service and request

enviroGRIDS – FP7 European project
Building Capacity for a Black Sea Catchment
Observation and Assessment supporting Sustainable Development
- 25 -
○ Response – Capabilities document with elements: ServiceIdentification, ServiceProvider,
OperationsMetadata, Filter_Capabilities and Contents.
● DescribeSensor
○ Request – DescribeSensor document with mandatory parameters service, procedure,
outputFormat, version
○ Response – SensorML document with elements: identification, capabilities, outputs and
positions
● GetObservations
○ Request – GetObservation document with mandatory parameters and supported values:
■ service: SOS
■ version: 1.0.0
■ srsName: urn:ogc:def:crs:EPSG:4326
■ offering: according to values in Capabilites document
■ eventTime: TM_During
■ procedure: according to values in Capabilites document
■ observedProperty: according to values in Capabilites document
■ responseFormat: text/xml; subtype=”om/1.0.0”
■ resultModel: om:Observation
■ responseMode: inline
○ Response – ObservationCollection document with one element Observation with
elements: samplingTime, procedure, observedProperty, result
There are few features that are not yet implemented like scalar or spatial filtering of observations. It might
be worth to mention what term is in our data model (see Fig. 10) equivalent to term in SOS standard (see
Tab. 2).
SOS standard Data model
Observation offering Group
Procedure Unit
Observed property Phenomenon
FeatureOfInterest not in use yet
Table 2 Equivalent terms

enviroGRIDS – FP7 European project
Building Capacity for a Black Sea Catchment
Observation and Assessment supporting Sustainable Development
- 26 -
There must be set a procedure and an observed property in GetObservations request for getting
observations from particular sensor. Affiliation sensors with units can be found in DescribeSensor
response.
Raw ObservationCollection document is shown in Figure 12.
Figure 13 ObservationCollection document
7.7 Catalogue for SOS
The catalogue allows describing SOS by metadata records and also supporting discovery of SOS from other
applications (processing, visualisation). As a catalogue we use Micka components (Editor, Importer and
Client) adding SOS metadata profile. The catalogue is a part of EnviroGrids Uniform Resource
Management (URM). It supports easy integration of SOS with the rest of the platform.

enviroGRIDS – FP7 European project
Building Capacity for a Black Sea Catchment
Observation and Assessment supporting Sustainable Development
- 27 -
7.8 Analytical modules
As analytical modules, could be used any services or applications, which are able to access observations
using SOS services. This could be also different GRID solution accessing data through SOS. For practical
testing we tried two possibilities:
• Using services based on WPS;
• LernSens application - is the solution which was developed with financial support from state
resources provided by the Ministry of Industry and Trade of the Czech Republic for support of
project of the program “TIP-2009” with registration number FR—TI1/332. [21]
7.8.1 PyWPS
Web Processing Service (WPS) is designed to standardise the way that GIS calculations are made available
to the Internet. WPS can describe any calculation (i.e. process) including all of its inputs and outputs, and
trigger its execution as a Web Service. WPS supports simultaneous exposure of processes via HTTP GET,
HTTP POST, and SOAP, thus allowing the client to choose the most appropriate interface mechanism. The
specific processes served up by a WPS implementation are defined by the owner of that implementation.
Although WPS was designed to work with spatially referenced data, it can be used with any kind of data.
WPS makes it possible to publish, find, and bind to processes in a standardized and thus interoperable
fashion. Theoretically it is transport/platform neutral (like SOAP), but in practice it has only been specified
for HTTP.
PyWPS is project, which is developed since 2006, and tries to implement OGC WPS standard in its 0.4.0
version. It is written in Python programming language. The main goal of PyWPS is, that it has been written
from the beginning, with direct support for GRASS GIS. So, PyWPS can be understand, as kind of
translation library, which translates requests complain to WPS standard, overhands them to GRASS GIS or
other command line tool (such as GDAL/OGR, PROJ.4 or R statistical package), monitors the calculation
progress and informs the user and after the calculation is completed, it returns back it's result. PyWPS is
part of EnviroGrids infrastructure, for sensor measurement PyWPS is using as input data SOS observation.
7.8.2 LernSens
The sensor networks are able to generate enormous amount of data for environment condition monitoring.
A lot of effort is invested to perpetual collection. Till now the main effort is focused on data collection
process to be cheap, robust and reliable. With growing amount of data it is necessary to be more focused
on access to measured values, which has to offer permanent proactive monitoring. LernSens project
implements such solution, which was integrated with the Senslog SOS implementation and also with
visualisation client using possibilities to send alerts.
The LernSens concept is divided into four levels:
• Event collection as event or measurement collector;
• Event filtering and routing allow to filter collected measurements according to simple conditions
(e.g. if temperature on sensor X is greater than 20 degrees) and to generate low level alerts;
• Situation prediction - based on event pattern detection and ability to create partially instantiated
patterns. If pattern instantion reach some threshold based on given metrics, system generate alert
that given situation is nearly to come;
• Adaptation during monitoring system implementation or there it can be supported by some
advanced techniques from domain of machine learning. Adaptation to specific environment is
typically done by computing profiles of monitored objects typical behaviour. Advanced systems

enviroGRIDS – FP7 European project
Building Capacity for a Black Sea Catchment
Observation and Assessment supporting Sustainable Development
- 28 -
are able to update profiles perpetually. It allows to smoothly adapt to changing conditions in
monitored environment.
LernSens developed mature monitoring solution with the
- ability to process event based data (measurements, logs, alerts, ...) in real-time;
- ability to detect event patterns;
- ability to adapt the system to actual environment.
It is based on Complex Event Processing (CEP) - technology designed for processing huge event streams in
real-time [22]. It offers a lot of useful techniques to fulfil the mentioned requirements.
It is independent component, which is possible to integrate with Senslog and, which could be used for
controlling of monitoring chain.
7.9 Alert systems
Both PyWPS and LernSens are able to generate alerts in the form of SMS.
7.10 Visualisation client
The SOS client in HSLayers is a component which can be used for browsing data from any OpenGIS
Sensor Observation Service (OGC SOS) compliant services. The component can be used together with map
application based on HSLayers, or independently with any non map application.
The actual version of component supports only operations from OGC SOS Core Profile which must be
implemented in every OGC SOS compliant services.
Operations supported in the actual version are:
• GetCapabilities - returns a service description containing information about the service interface and
the available sensor data;
• DescribeSensor - returns a description of one specific sensor, sensor system or data producing
procedure;
• GetObservation - provides pull-based access to sensor observations and measurement-data via a
spatio-temporal query that can be filtered by phenomena and value constraints.
Future versions of the components will contain also operations from OGC SOS Enhanced Profile and will
offer more functionality for working with data from OGC SOS services.
• User invokes HSLayers SOS Client UI dialog;
• User inputs URL of required OGC SOS;
• HSLayers SOS Client sends GetCapabilities request to OGC SOS, parses its response and displays
available information about OGC Service (name, abstract) in UI;
• User selects offering and all parameters for required observations (procedure, observed property,
date-time interval);
• User invokes getting observations;
• HSLayers SOS Client sends GetObservation request with all passed parameters to OGC SOS, parses
its response and display all obtained data in table and chart;

enviroGRIDS – FP7 European project
Building Capacity for a Black Sea Catchment
Observation and Assessment supporting Sustainable Development
- 29 -
• If the HSLayers SOS Client is used within map application based on HSLayers, user can display
location of obtained observations in map.
Figure 14 HSlayers UML schema

enviroGRIDS – FP7 European project
Building Capacity for a Black Sea Catchment
Observation and Assessment supporting Sustainable Development
- 30 -
Figure 15 HSlayers SOS client

enviroGRIDS – FP7 European project
Building Capacity for a Black Sea Catchment
Observation and Assessment supporting Sustainable Development
- 31 -
Figure 16 Graf of measurement
8 How to use sensors observation by rest of the EnviroGRIDS services
The implementation of sensors environment in EnviroGRIDS can be viewed from two points:
• Poor implementation of Sensor Observation Server and client for Sensor Observation, which are
now two independent components. The first is published as Open Source under name Senslog, the
second is part of HSlayers (also Open Source product). This allows integration of both
components with other modules. Senslong is able to transform heterogeneous observation
(including human observation) into interoperable form of SOS. It allows access heterogeneous

enviroGRIDS – FP7 European project
Building Capacity for a Black Sea Catchment
Observation and Assessment supporting Sustainable Development
- 32 -
measurement by analytical modules including GRID application trough SOS. The condition is
including SOS client as part of this solution. SOS client is the first example of the client allowing
visualisation of sensors measurements including dynamic graphs.
• Implementation of a complex solution as part of URM. It could demonstrate with heterogeneous
sensors possibility of accessibility of sensors measurement based on given requirements, their
analysis and visualisation. There are implemented two concrete pilot cases as examples. Both pilot
cases could be extended to any regions of project, but could be also easily modified for different
types of monitoring.
For full utilisation, it is necessary to prepare scenarios with local sensors in other areas. The easiest way
will be to implement scenarios with technology focused on human as sensors. Other issue is to test the
implementation of the SOS client on the side of Grid.
9 Conclusions and Recommendations
9.1 Conclusions
The deliverable EnviroGRIDS_D2-12 provided next work:
• Two testing scenarios for testing Sensor Observation Services were defined:
o Measurement of level of underground water;
o Human as a Sensor Scenario;
• There were implemented:
o SOS server for publishing heterogeneous sensor observation in interoperable form;
o SOS invoking client for HSlayers;
• There were tested description and discovery of Sensors Observation by Catalogue System Micka;
• The SOS services were integrated with full sensor chain (some operations are coming from other
projects) including:
o Single sensors for Measuring Level of Underground Water;
o Sensors Network for Measuring Level of Underground Water;
o MORT hardware gate for interconnecting Sensors or sensors network with Web
environment;
o Android based Smartphone or tablets as tools for human observation;
o Software gateway (daemon) for integration of sensor measurement with Web;
o PyWPS server for analysis of sensor data;
o Integration of SOS with LearnSens system.
The implementation demonstrates the functionality of all the solutions and the possibility to use it in
practice.
9.2 Recommendations
The recommendation for future period could be divided into two parts:

enviroGRIDS – FP7 European project
Building Capacity for a Black Sea Catchment
Observation and Assessment supporting Sustainable Development
- 33 -
• Technological;
• Organisational.
The technological recommendations are:
• To develop client side for access of sensors measurement from the side of GRID;
• To integrate import of metadata to Micka catalogue from SOS GetCapabilities;
• To integrate Catalogue client into SOS embedded Client;
• To extend metadata profile for sensors;
• To integrate SOS client into WPS client embedded into Hslayers.
Organisational recommendations are:
• To organise large testbed inside of EnviroGrids@BlackSee with Android technology for
Human As a Sensor;
• To implement SOS server on one pilot side of EnviroGrids@BlackSee;
• To provide a test with accessibility of sensor measurements in the Grid environment;
• To provide a test with the LernSens technology on the pilot area Litovelske Pomoravi;
• To implement Alert Services for Litovelske Pomoravi.

enviroGRIDS – FP7 European project
Building Capacity for a Black Sea Catchment
Observation and Assessment supporting Sustainable Development
- 34 -
References
[1]http://www.earthobservations.org/geoss.shtml
[2]GEOSS AIP Architecture, GEOSS Architecture Implementation Pilot (AIP), Version: 28 February 2012,
http://www.earthobservations.org/documents/cfp/201202_geoss_cfp_aip5_architecture.pdf
[3]Ondrej Mirovsky, GMES – The European ambition to bring Earth Observation capacities in daily use, in
INSPIRE, GMES and GEOSS Activities, Methods and Tools towards a Single Information Space in
Europe for the Environment,
[4]http://ec.europa.eu/gmes/obser_infra.htm
[5]Petr Horak, Sarka Horakova, Karel Charvat, Martin Vlk, EarthLookCZ - GMES data publication,
combination and sharing on the web, in INSPIRE, GMES and GEOSS Activities, Methods and Tools
towards a Single Information Space in Europe for the Environment
[6]GENESIS - GENeric European Sustainable Information Space for Environment, Instrument: D5200.1 -
Report on Sensor Network Architecture / Assessment Activity
[7]http://www.ikg.uni-hannover.de/geosensor/Lecture/Thursday/Session6/sess6_poser.pdf
[8]Resch, B., Zipf, A., Breuss-Schneeweis, P., Beinat, E. and Boher, M. (in press) Live Cities and Urban
Services - A Multi-dimensional Stress Field between Technology, Innovation and Society. GEOProcessing
2012, Valencia, Spain, 2012.
[9]Eike Hinderk Jürrens, Arne Bröring, and Simon Jirka A Human Sensor Web for Water Availability
Monitoring, http://onespace.ace.ed.ac.uk/2009/docs/onespace2009_submission_2.pdf
[10]http://world.waze.com/
[11]Karel CHARVAT, Zbynek KRIVANEK, Marek MUSIL, Jan JEZEK VLITE NODE – SOLUTION for
PRECISION FARMING, in IST Africa 2011, Gabarobe
[12]Karel Charvat, Zbynek Krivanek, Jan Jezek, Marek Musil VLIT NODE – new technology for wireless
sensor network, in ICT in Agriculture, Food and Environment – Where we are? Where we go? In Press
[13]Charvat et al., 2009, INSPIRE, GMES and GEOSS Activities, Methods and Tools towards a Single
Information Space in Europe for the Environment, Riga, Latvia
[14]Jan Ježek, Michal Kepka, Server-side solution for sensor data, in ICT in Agriculture, Food and
Environment – Where we are? Where we go? In Press
[15]OGC 06-009r6. Sensor Observation Service: OpenGIS® Implementation Standard. Wayland (Mass.):
Open Geospatial Consortium, Inc., 26. 10. 2007. xiv, 90 s. WWW:
<http://www.opengeospatial.org/standards/sos>.
[16]KEPKA, Michal. Implementation of Sensor Observation Service standard [online]. Pilsen: University
of West Bohemia in Pilsen, 2011. 77 p. Diploma thesis. WWW:
<https://portal.zcu.cz/wps/PA_StagPortletsJSR168/KvalifPraceDownloadServlet?typ=1&adipidno=42585>
[17]TAMAYO, Alain; GRANELL, Carlos; HUERTA, Joaquín. OGC Schemas Browser: Visualizing OWS'
XML Schemas. In Geospatial Thinking: Proceedings of AGILE 2010 [online]. [Guimarães]: [s.n.], 2010
[cit. 2011-05-01]. WWW: <http://plone.itc.nl/agile_old/Conference /2010-
guimaraes/ShortPapers_PDF/82_DOC.pdf>. ISBN 978-989-20-1953-6
[18]Jan Ježek, Michal Kepka, Server-side solution for sensor data, in ICT in Agriculture, Food and
Environment – Where we are? Where we go? In Press

enviroGRIDS – FP7 European project
Building Capacity for a Black Sea Catchment
Observation and Assessment supporting Sustainable Development
- 35 -
[19]LAUN, Wolfgang. A JAXB Tutorial [online]. 2008, 14. 4. 2011 [cit. 2011-04-30]. WWW:
<http://jaxb.java.net/tutorial/>.
[20]VALIKOV, Aleksei. OGC Schemas and Tools Project. 2006 - 2011. Karlsruhe. WWW:
http://confluence.highsource.org/display/OGCS/Home
[21]Filip Prochazka, Michal Oskera, Martin Svehla Advanced monitoring systems for processing sensor
network data in ICT in Agriculture, Food and Environment – Where we are? Where we go? In Press
[22]Event Processing Technical Society 2011, www.ep-ts.com
Terminology
The terms and the definitions used in this document are according with the terminologies published in
known glossaries such as ISO TC-211 Glossary, OGC Glossary, OASIS SAML/XACML Glossary, and
Wikipedia. We have added new terms and definitions when it was necessary.
Definitions
Access Control: A process by which use of resources is regulated according to a security policy and is
permitted by only authorized system entities according to that policy.
Access Rights: A description of the type of authorized interactions a user or a program can have with a
system. Examples include read, write, execute, add, modify, and delete operations.
Actor: A coherent set of roles that user of system plays when interacting with this system.
Attribute: Feature that describes the range of values an element may hold.
Authentication: To confirm a system entity’s asserted principal identity with a specified, or understood,
level of confidence.
Authorization: The process of determining, by evaluating applicable access control information, whether a
subject is allowed to have the specified types of access to a particular resource. Usually,
authorization is in the context of authentication. Once a subject is authenticated, it may be
authorized to perform different types of access.
Catalogue: A collection of entries, each of which describes and points to a feature collection. Catalogues
include indexed listings of feature collections, their contents, their coverage, and other metadata. It
registers the existence, location, and description of feature collections held by Information
Community. Catalogues provide the capability to add and delete entries. At a minimum Catalogue
will include the name for the feature collection and the location handle that specifies where this
data may be found.
Data product: Dataset or Dataset series that conforms to a data product specification. Data product
specification is a detailed description of a dataset or dataset series together with additional
information that will enable it to be created, supplied to and used by another party.
Dataset: A Dataset is an abstract object. It corresponds to the ideal of a data set, independent of a physical
form or an encoding in which it is being distributed. It represents an identifiable collection of data.
Dataset series: Collection of datasets sharing the same product specification.

enviroGRIDS – FP7 European project
Building Capacity for a Black Sea Catchment
Observation and Assessment supporting Sustainable Development
- 36 -
Digital Repository: A complex collection of datasets. The main functionalities concern with data access
and related services provided to users. Data repository could support the following functionalities
on data: organize, store, administrate, secure access and retrieve, search and discover.
Feature: Abstraction of a real world object and phenomenon. In data repository a feature has a digital
representation.
Feature collection: A group of features having common metadata and formal relationships. The feature
collection can be identified as another feature at different abstraction levels.
Infrastructure for spatial information: Metadata, spatial data sets and spatial data services; network
services and technologies; agreements on sharing, access and use; and procedures, established,
operated or made available in accordance with particular specifications.
Interoperability: Possibility for spatial data sets to be combined, and for services to interact, without
repetitive manual intervention, in such a way that the result is coherent and the added value of the
data sets and services is enhanced.
ISO 19115: most widely used international standard ISO for describing geographic information and
services. It provides information about the identification, the extent, the quality, the spatial and
Metadata: Data describing another data or service. In the web service based system, the metadata is XML-
encoded and stored in catalogues and registries, in order to support operations such as search,
discover, and retrieve data and services.
Metadata dataset: The set of metadata describing a specific dataset.
Middleware: Software in a distributed computing environment that mediates between clients and servers.
Policy: A set of rules, sometimes described through an algorithm as an obligation.
Portal: A Web site that provides a view into a universe of content and activity through a variety of links to
other sites, communication and collaboration tools, and special features geared toward the
community served by the portal.
Portlet: From user’s perspective, a portlet is a window in a portal that provides a specific service or
information, for instance, a calendar or weather. From the application development perspective,
the portlets are pluggable modules that are designed to run inside the portlet container of a portal
server. The portlet container provides a runtime environment in which portlets are instantiated,
used, and finally destroyed. Portlets rely on the overall portal infrastructure to access user profile
information, participate in window and action events, and communicate with other portlets, access
remote content, and lookup credentials, and store persistent data.
Portrayal: The presentation of information to humans, e.g., a map. In the context of the Web, portrayal
refers to how data is presented to the user.
Protocol: A set of semantic and syntactic rules that determine the behavior of entities that interact.
Schema: Formal description of a model or a structured framework. A metadata schema specifies the order
and types and labels of information elements describing a data set.
Server: A particular instance of a service. The server denotes sometimes the computer running a service.
Service: A computation performed by a software entity on one side of an interface in response to a request
made by a software entity on the other side of the interface. It is a collection of operations that
allows a user to evoke a behavior or a value.
Service interface: Shared boundary between an automated system or human being and another automated
system or human being.

enviroGRIDS – FP7 European project
Building Capacity for a Black Sea Catchment
Observation and Assessment supporting Sustainable Development
- 37 -
Service metadata: Metadata describing the operations and (geographic) information available at a server.
Spatial data: Any data with a direct or indirect reference to a specific location or geographical area.
Spatial data services: Operations which may be performed, by invoking a computer application, on the
spatial data contained in spatial data sets or on the related metadata.
Spatial data set: An identifiable collection of spatial data.
Spatial object: An abstract representation of a real world phenomenon related to a specific location or
geographical area.
Spatial metadata: Information describing spatial data sets and spatial data services and making it possible
to discover, inventory and use them.
storage with certain quality properties.
Use case scenario: A possible sequence of real world events used as a test case for specifying or testing
information systems designed to help manage such events.
Universally Unique Identifier (UUID): An identifier standard used in software construction, standardized
by the Open Software Foundation (OSF) as part of the Distributed Computing Environment
(DCE). The intent of UUIDs is to enable distributed systems to uniquely identify information
without significant central coordination.
Web Service: A Web Service is defined by the W3C as a software system designed to support
interoperable machine-to-machine interaction over a network. It has an interface described in a
machine based processing format (e.g. WSDL). Other systems interact with the Web service in a
manner prescribed by its description using SOAP-messages, typically conveyed using HTTP with
an XML serialization in conjunction with other Web-related standards.
Abbreviations and Acronyms
AIP Architecture Implementation Pilot
CCSS Czech Centre for Science and Society
CEP Complex event processing
GEO Group on Earth Observations
GEOSS Global Earth Observation System of Systems
GMES Global Monitoring for Environment and Security
GPRS General Packet Radio Service
GPS Global Positioning System
GSM Global System for Mobile Communications
HTTP Hypertext Transfer Protocol
JAXB Java Architecture for XML Binding
JSON JavaScript Object Notation
MANET Mobile ad-hoc network
OGC Open Geospatial Consortium

enviroGRIDS – FP7 European project
Building Capacity for a Black Sea Catchment
Observation and Assessment supporting Sustainable Development
- 38 -
RFID Radio Frequency Identification
RSSI Received Signal Strength Indication
SOAP Simple Object Access Protocol
SOS Sensor Observation Standards
SWE Sensor Web Enablement
TCP Transmission Control Protocol
UDP User Datagram Protocol
UML Unified Modeling Language
URM Uniform Resource Management
W3C World Wide Web Consortium
WPS Web Processing Service
XML Extensible Markup Language