D. Yin Foo November, 2004 Report 37/2004D · works outlined below. i. ... focussing on the Rum...
57
, , Northern Territory Government _Ii Department of Infrostrueture( Planning and Environment Natural Systems Division Conservation and Natural Resources Group Department of Infrastructure, Planning and Environment D. Yin Foo November, 2004 Report 37/2004D
Transcript of D. Yin Foo November, 2004 Report 37/2004D · works outlined below. i. ... focussing on the Rum...

, , Northern Territory Government_Ii Department of Infrostrueture( Planning and Environment
Natural Systems DivisionConservation and Natural Resources GroupDepartment of Infrastructure, Planning and Environment
D. Yin FooNovember, 2004
Report 37/2004D

Executive Summary
A groundwater investigation project was undertaken by the NaturalSystems Division in the area between the Darwin River Dam and MantonDam during August and October, 2004. This work was commissioned bythe Power and Water Corporation to furnish hydrogeological informationand assessment of the groundwater resources hosted within theCoomalie Dolomite Formation within this area.
This work has determined that a high yielding aquifer exists in thekarstic weathered profile of the Coomalie Dolomite Formation. Theformation traverses the study area for 11kms, trending approximatelyeast-west between the Darwin River and Manton Dams. The aquiferoffers the potential for development as individual bores in the formationwould have an instantaneous pumping capacity in the order of 40L/s.
The potential yield from a borefield in the area could be up to 7300MLannually, equating to 20ML/ d. This scenario is based on the modelledassumption that interception of the surface water storages at either endof the system will occur. Under natural conditions, the sustainable yieldof the groundwater resource in the Coomalie Dolomite Formation isestimated to be between 1500 and 3000ML, based on potential rechargeand throughflow calculation, and modelling of the aquifer system.
The aquifer is suited to yield enhancement through artificial recharge,such as an aquifer storage and recovery scheme, by virtue of itsproximity to the open water storages. Such a system would utilise anywater excesses offered over the wet season.
The groundwater water quality available from the aquifer is characterisedby levels of total dissolved solids of 300mg/L, a moderate to highhardness of 250mg/L (as CaC03) and a neutral pH. It is potable forhuman consumption in accordance with guidelines for drinking water asadopted by the Power and Water Corporation.
Vll

CONTENTS
List of Figures
List of Tables
Executive Summary
1. Introduction
2. Hydrogeology
2.1 Geology
2.2 Aquifer Occurrence
2.3 Aquifer Parameters
2.4 Groundwater Movement and Recharge
2.5 Water Quality
3. Modelling
3.1 Model Layout
3.2 Boundary Conditions
3.3 Model Parameters
3.4 Recharge
3.5 Model Calibration
3.6 Development Scenarios
3.7 Model Results
4. Water Supply Development Potential
5. Conclusions
6. Recommendations
7. References
Appendices
Appendix A
Appendix B
Appendix C
Appendix D
Appendix E
Appendix F
Appendix G
Lithological Logs of Boreholes
Bore Construction Details
Natural Gamma logs of Boreholes
Test Pumping Data
Water Quality Data
Sustainable Yield of the Aquifer System
Scope of Recommended Further Work
iii

List of Figures
Figure I Study Area Location
Figure 2 Bore Locations
Figure 3 Interpreted Geology
Figure 4 Cross-Section A-B
Figure 5 Cross-Section C-D
Figure 6 Postulated General Groundwater Movement
Figure 7 Model Layout
Figure CI Natural Gamma Logs of RN34221, RN34222 and RN34223
Figure C2 Natural Gamma Logs of RN34224, RN34225 and RN34226
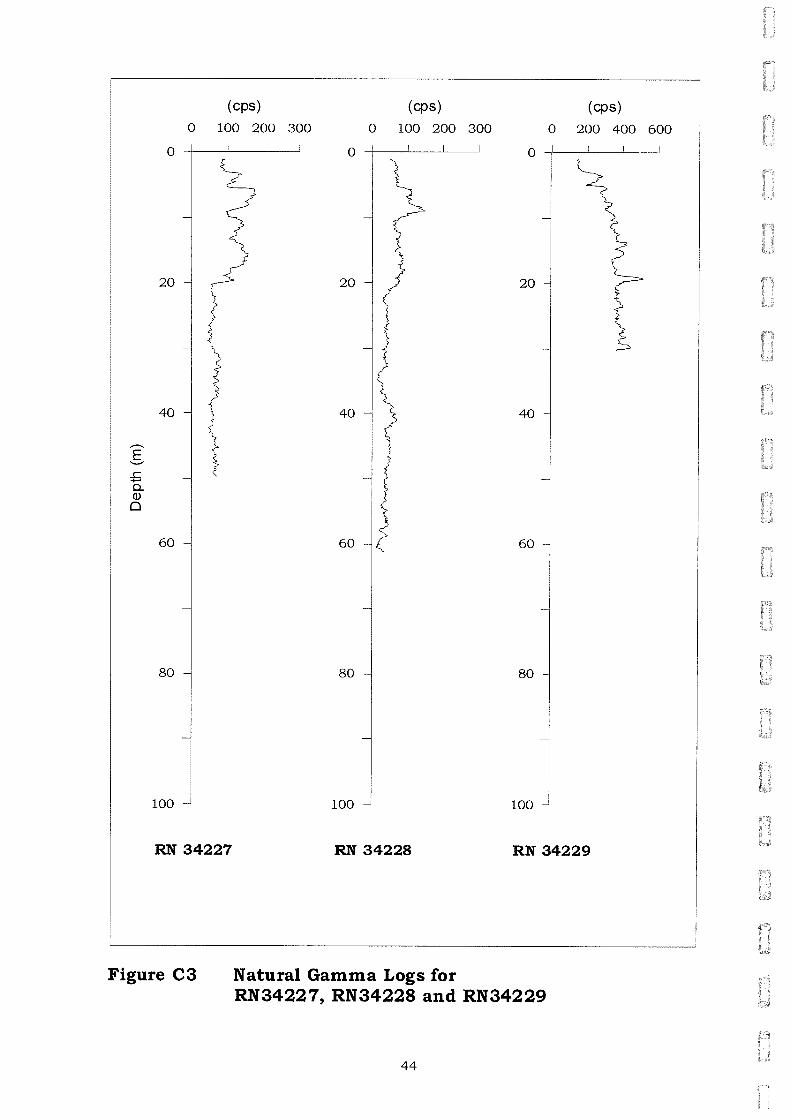
Figure C3 Natural Gamma Logs of RN34227, RN34228 and RN34229
Figure D I Constant Discharge Test - Pumped Bore RN 34228
- Observation Bore RN 34222
Figure D2 Constant Discharge Test - Pumped Bore RN 34228
- Observation Bore RN 34223
Figure D3
Figure D4
Logger Data - RN34222
Logger Data - RN34223
List of Tables
Table I Aquifer Parameters
Table 2 Water Level Data
Table 3 Transient Model Recharge Schedule
Table 4 Modelled Drawdown for a Borefield Production of IOMLj d
Table 5 Modelled Drawdown for a Borefield Production of I5MLj d
Table 6 Modelled Drawdown for a Borefield Production of 20MLj d
Table Al Lithological Logs of Boreholes
Table B I Bore Construction Details
Table EI Water Quality Data - General Chemical and Metals
Table E2 Water Quality Data - Radionuclides
v

1. Introduction /
Between August and September 2004, a groundwater investigation wasconducted by the Natural Systems Division within the area between theDarwin River Dam and Manton Dam. The study area is indicated inFigure 1. This work was commissioned by the Power and Water Corporationto identify and evaluate the groundwater supply prospect within theCoomalie Dolomite Formation.
This report presents an assessment based on existing data and the results ofa field programme, consisting of investigative drilling and test boreconstruction, bore testing, and stratigraphic and geophysical logging.
Successful outcomes have been delivered in accordance with the scope ofworks outlined below.
i. Drill investigation bores to obtain infonnation on the extent of theCoomalie Dolomite in the area and obtain water yield) stratigraphy) waterlevel and water chemistry infonnation. Nine investigation bores were drilled.Six bores were constructed using 100mm PVC for water level monitoring andsampling purposes.
11. Drill and construct a test bore suitable for test pumping to detenninehydraulic parameters. A 203mm test bore was constructed. Initialindications are that it has a potential capacity to produce at approximately40 Lis. However, the test pumping conducted was limited due to difficultyin achieving a sand free discharge.
Ill. Assess the groundwater resources of the Coomalie Dolomite Fonnationin the study area.
1

f"
kms30
!
MaJor Road
MlnOf Road
. Drainage
20!
Ileslll'" Frio' ~[) L..aJll~ ~Ph'l Ft~ Otuwn-R-{)am...Sludy-A1f'1l
LEGEND
10;;;;;J
Northern Territory GovernmentDt!paollllllfO~ loh-.:ruo PIoMoonnd EnoillMlllorCOllSERVATIO,j an" ,lATURAL RESOURCES GIlOOl'
DARWIN RIVER OA A TO DAMWATEA RESOURCES ASSESSMENT
STUDY AREA LOCATION
kmsob
~....~lot(D
....
r.n,.,.=C.
'<'l
> .lot(DII)
t"'I0 <;(')II)
...t,.,.....0l:S

2. Hydrogeology
The locations of bores drilled in the 2004 investigation are shown onFigure 2 below. Other data obtained during the investigation are presentedin the Appendices. Such data includes lithological and geophysical logs,bore test and construction details.
kms4
Oc,::tlgn AI•. OflD_BOfM_52mFiol Ale DarwInoRoOcIm Bare.
2~IllS
o
Track
Najor Rood
Minor ~o"d
Hillh VOUall" Uno
Railway
80'0
. .. Boro Regi.lored umbel
LEGEND
Bore Locations
,, '.
'" \~ RN34225 ,.
/RN34224 \4 RN34226
........ -......... "\~ ..... ,RN34226', '.
RN34227' \R"N' ....."\ 34223
• "R 34222~N34221
RN34220 '~RN34229
\"-
'\~\-..------ ......-..... ----" ,-::..~'.., ..... '"""-' "'-
~~"
~<
/t
/•RN34221
Figure 2
2.1 Geology ~~..) 2-The most recent geological mapping of the region has been undertaken at1:100000 scale, focussing on the Rum Jungle Uranium Field within the PineCreek Geosyncline. Pietsch et al (1987) provides detailed descriptions of thestratigraphy and associated lithologies on this map sheet. Lally (2002)updates this work, compiling new data to map the mineral explorationpotential in the area.
The geology within the current study area comprises the outcropping andsub-cropping Proterozoic aged sedimentary rocks of the Mount PartridgeGroup which conformably overlie the granite on the northern rim of the"Rum Jungle Dome". These rocks have generally undergone low-grademetamorphism and numerous quartz veins are exposed as evidence ofstrong deformation and faulting throughout the area. The shale is phyllitic,the sandstone has been transformed to quartzite and the dolomite is stronglyrecrystallised. The beds in the area are generally vertical to steeply dipping(35°) to the north. The interpreted sub-cropping geology is shown on themap in Figure 3. North to south geological cross-sections in the study area
3

are shown on Figures 4 and 5 and provide indication of the stratigraphicrelationships. The locations of the cross-sections are shown on Figure 3.
The geological formations described below are present either within or adjointhe study area. They are listed from youngest to oldest - the four youngestare Proterozoic aged rocks of the Mount Partridge Group. Lithologies asencountered by bores drilled during the investigation are in Table AI.
Acacia Gap Quartzite (Ppa): This is a hard grey quartzite, wellexposed in the ranges to the north of the study area.
Whites Formation (Ppi): Whites Formation covers a large part of thestudy area. Black shale and siltstone are the main rock types. Theytend to be pyritic and occasionally dolomitic. A weak foliation ispresent and they are often phyllitic. Sparse quartzite beds occurthroughout the sequence and these are the only parts of the formation,which outcrop well. This formation was intersected in bore RN 34223to about 60m. In bore RN 34225, recognisable shale was encounteredat about 60m and the contact with the underlying Coomalie Dolomiteintersected at 69m. In both bores, quartz veins up to several metreswide cut the formation. Thin calcite veins are found associated withdolomitic shale.
Coomalie Dolomite (Ppc): This formation consists of hard grey fine tomedium grained crystalline dolomite. It is rarely mapped in outcropas it is usually extensively weathered. In the study area, it appearslargely as a weathering horizon to about 70m consisting of clay, sandand quartz indurated rock overlying recognisable crystalline dolomite.The presence of quartz veins are detected throughout the weatheredformation. Investigative drilling during this project has confirmed theinterpreted extent of the western part of the Coomalie Dolomite inFigure 3.
The Coomalie Dolomite was targeted in most of the boreholes. BoresRN 34220, RN 34221, RN 34222 and RN 34223 (refer Figure 5) drilledthe formation across strike to determine permeability and lithologicalvariation. The former two bores intersected clean, friable quartz sandswhich represent possibly the lowest units of the formation. Jolly(1981) attributes this sandy unit to the Coomalie Dolomite. Theencounter of large round pebbles and cobbles at 34m in boreRN 34220 suggests this depth probably represents the contact withthe Crater Formation. Bore RN 34223 identified the northern extent ofthe Coomalie Dolomite on this transect. Other bores intersecting theCoomalie Dolomite include RN 34224, RN 34225, RN 34227 andRN 34228 and are shown on Figure 2.
Crater Formation (Ppr): The Crater Formation outcrops along anorth-west/ south-east trending low ridge south of the mapped extentof the Coomalie Dolomite in the study area (refer Figure 3). Outcropsconsist of coarse grained to granule sized quartz sandstone with minor
4

fine sandstone and siltstone interbeds.feldspathic sandstones are also present.
Pebbly horizons and
Rum Jungle Complex (Ar): This group consisting of Archaean agedgranite, gneiss and schist in the southern part of the study area is notdifferentiated for the purposes of this study. Rocks of the MountPartridge Group unconformably overlie this group.
2.2 Aquifer OccurrenceThe only aquifer examined in detail in this study is that which has developedin the Coomalie Dolomite. However, small supplies of less than lL/ s wereintersected in the weathered horizon of the Rum Jungle Complex granite intwo bores, RN 34226 and RN 34229.
The investigation has indicated that the Coomalie Dolomite Formation existsas a significant groundwater resource and individual bores may yieldapproximately 40L/s. The formation is indicated to be extensive, andcontinuous with consistent weathering throughout the area. The aquifer isdeveloped in the weathered zone of this formation and the high permeabilityis due to the "karstic" nature of the weathering. This term best describes thefractured, jointed and cavernous landscape resulting from dissolution andweathering of dolomite or limestone.
In the Acacia area study, Tickell (2000) describes the aquifer in the CoomalieDolomite as a profile in two parts - "an upper highly weathered rock and anunderlying harder fresh rock. The upper layer consists of a framework oftotally silicified dolomite with zones of rust brown clay. The dolomite hasbeen replaced by fine to medium grained crystalline quartz with a sugarytexture. Parts of this rock have high porosity. It grades down into the lowerlayer which consists of grey partially silicified dolomite with narrow zones ofyellowish brown completely silicified dolomite along fractures. The highyields suggest that the fractures have been enlarged by solution. The waterintersections are associated with these fractures."
During the investigation, two bores, RN 34227 and RN 34228, drilled 40mapart, struck cavities at different depths. Bore RN34227 intersected nearly30m of hard dolomite before encountering a cavity of at least 3m in height.However, bore RN 34228 further drilled north, encountered a similar sizedcavity immediately beneath the weathering zone. The airlifted supply fromthese bores were in excess of 30L/ s. Other bores such as RN 34223 andRN 34225 which were drilled with mud and constructed with PVC casing,provided indicative information. Cavernous strata were intersected in each.Bores RN 34220, RN 34221 and RN 34222 intersected friable sandstone inthe lower units of this Formation. Bore RN 34220 produced an airlifted yieldof about 15L/s. It was constructed and used as a water supply bore for theinvestigation.
At Batchelor some 24 kilometres to the south, a similar lithology occurs atthe base of the same formation and represents the source of the town watersupply. Airlift yields of up to 50 L/ s were recorded when the town'sproduction bores were drilled (Jolly 1981).
5

Zamu 00leri1e
o BooslOns Formallon
Rct.., P, tSCh 01 I (19B7) f():I dOSCrlpltOn
kms4I
Major Road
Minor Road
Track
Railwav
Fault
Cross Secl on
:3I
Ontgll rl~' D~D_Gt-o~f_1$2mp"" FI~ O'l,wnl.fl·Deffl_O€tQk>gy[]ilology modllll'd fram
tHGS Ibft Junalll 1lJOK~
27
LEGEND
Northern Territory Governmento.pe"'..,,"' ~t 1itI1I",,,,,,n.,,,,. Plcllnl1ll <Jnd ElM'Onm<I"tOONSEfI'/ATION .mel r~WJRAL AESOUllCES GftOUP
IlmsoI
DARWIN RIVER DAM - iANTON DAMWATER RESOURCES ASSESSME T
INTERPRETED GEOLOGY
o G"rO'lIi.Tuf[
o Koel",ln Formation
o Ella Creek Member
o Acacia Gap Quartz,lo
o Wildman $IIISIOI'lO
o Whltas Formetlon
o Coomal'9 Dole>rn e
o Clalor Form lion
o Rum Jungle CompleM
Cella Dolomite
---
~""--------"""'~--~--P--IIIIIl!IIIIl-~""~~-""'''''''''---------~~.-----~lot(D
~

Cross Section A - B B
Acacia GapQuartzite
WhitesFormation
Coomalie/" Dotomite
RN 3-4224I RN 3<225
I
Craler Formation
RN 3422~ I
Rum JungleComplex
A2SO
200
150
'00
'00I
<~ 0
!·50
60005000<0002000 3000DISTANCE (metres)
.100+---....---....---....----....----....----~-I--...._---l..-...._--...._--...._-...l.-...._-___<
o 1000
Vertical Exaggeration. It ~ 6.75
Figure 4 Cross-Section A-B
C Cross Section C - 0 o250
200
RN 34220
,so
100
'0
-50
Crater Formation
AN 3<229I
Rum JungleComplex
AN 3<221
AN 3<222AN 34223
WhitesFormation
Acacia GapQuartzite
6000500040002000 3000DISTANCE {melros}
_'oo+-__..---__..---__....-_..l-..J-__....--..l.-_....--__...._--...._--...._l--_...._-_.-----lo 1000
Vertical Exaggeration. It ~ 6.75
Figure 5 Cross-Section C-D
2.3 Aquifer Parameters \\~)2
A pumping test was carried out on the bore RN 34228 with the aIm todetermine indicative hydraulic properties of the dolomite aquifer. Testingcommenced at a pumping rate of 30Lj s. However, due to excessive sandingression during the early stages of the test, pumping was ceased.Pumping recommenced at 16Ljs producing a sandy discharge. Althoughonly limited hydraulic analysis is possible using the available test data, thisinformation confirms the continuity of the aquifer and its high permeability.Table 1 presents a summary of the aquifer parameters. Plots of the availabletest data are presented in Appendix D.
7

Table 1 Aquifer Parameters
~l»
r:: r:: rIJ ..'"' .... l» rIJ0 0 o :I :> .. ..= ~~
.,.. .... .... - .... r::""Cl ~"Cl .E:'g~
~ e~i ~..~ ~
.... ...... .. aCIS aN CISQ, Q ~ '"' ~~- rIJ a '"' aa rIJ 0 0,e=
@~r::- .. 0
:I 0 CIS rtJ C)J:l.. '"'Eo<
34228 28/10/04 30 minute const. rate testonly at l6L/s. Drawdownmaintained at 16m.
34227 40 n/a Data not available
34223 1000 >1000 < 1x10⁻⁵ Response < 5 mins, maxdrawdown 0.015m
34222 1300 n/a < 1x10⁻⁵ Response < 5 mins, maxdrawdown 0.002m
A transmissivity value greater than 1000 m 2 j day is indicated from availabletest data. A value in this order is also derived using a numerical modellingapproach which is described in Section 3.
Two bores, RN 34222 and RN 34223, located approximately 1000m and1300m respectively south-west of the test site, were equipped with waterlevel loggers for a period of a month. This enabled the capture of antecedentwater level data and the expected small magnitude response due topumping. The downloaded data over the period of the test are plotted onFigures D3 and D4. Inspection of this data indicates that such responseswere detected in each bore in less than 5 minutes of the commencement ofpumping. Although comprehensive analysis is not possible, its rapidresponse to pumping indicates that the aquifer is characteristically confinedand the transmissivity is in the order of 1000 to 5000 m 2 jday. However,based on stratigraphic data, and responses observed from this aquifer inother localities, it is expected to display semi-unconfined, then unconfinedbehaviour in the longer term. A delayed yield response was not observedduring the limited testing and therefore only an estimate of specific yield ofthe potentially draining sediments can be made at this stage. Specific yieldvalues typical for the weathered zone of this formation may be in the order of3 to 10%. The modelling in Section 3 indicates that the value is about 5%.
2.4 Groundwater Movement and RechargeLimited data exists on which to firm the understanding of regionalgroundwater rnovements. However, the available data, and knowledge ofaquifer characteristic and extent, provides such a basis for the postulatepresented in this section. Table 2 lists current spot water level information.The ground levels in the table were estimated using a 1: 10000 scale, 2mcontour map, obtained from Department of Infrastructure Planning andEnvironment as a continuous digital contour map. This data is adequate for
8

the purpose of gaining an understanding of general groundwater movements.However, more accurate levels should be obtained for detailed analysis.Figure 6 indicates the postulated general groundwater movement.
Infiltration of rainfall, diffusely distributed over the sub-cropping aquiferarea is the most likely mode of recharge under natural conditions. Asmapped, the aquifer has an average width of about 650m and is 11000m inlength within the area of interest (refer Figure 6). The areal coveragetherefore is approximately 7.2 x 10⁶m 2 . The lithologies intersected byboreholes indicate predominantly clay and sandy sediments overlying theaquifer. Although at this stage it is difficult to determine the rate andproportion of annual rainfall to eventually infiltrate the aquifer. However,comparison with the Batchelor area, which is stratigraphically similar,provides useful data for the initial estimate of recharge. Monitoring data forthe period 1985 to 1996 indicates seasonal water level rises of between 2and 8m with an average of about 6m. Modelling of the aquifer system inSection 3 was also used to define a possible range of recharge rates to beexpected.
In the Coomalie Dolomite in the Acacia area, Tickell (2000) determines that"recharge is detected by water level rise in bores which corresponds closelyto the onset of the heavy rains. Some bores show a sharp initial risefollowed by a more gradual, steady rise. The sharp rise is interpreted toreflect rapid recharge via preferred pathways such as major fractures.Following that, the effect of distributed recharge, via widespread downwardseepage dominates the hydrographs. The presence of thin soils in manyareas also points to distributed recharge as a likely recharge mechanism."
A forty year rainfall record for the station R8150332 in the Darwin RiverDam catchment area indicates the mean annual rainfall for this area is1340mm (compared to 1793mm for the same period at Darwin Airport DR104015). The estimates presented in Appendix F and the modelling inSection 3 indicates the recharge may be up to 40 % of this figure.
The high permeability of the Coomalie Dolomite aquifer results in a flowregime predominantly directed along strike of the formation. The relatively'flat' water levels of September, 2004 listed in Table 2 is an indication of itshigh permeability.
Under natural conditions, wet season recharge will eventually drainlongitudinally from the system as indicated in Figure 6. The Darwin RiverDam appears to submerge the discharge zone at its western end. There isanecdotal evidence, substantiated by aerial photographs taken in 1963,which indicate the existence of a spring from the Coomalie Dolomite beforethe Darwin River Dam was commissioned (pers. comm. I. Smith). However,aquifer water levels measured in September 2004 are approximately 7mhigher than the dam water level. This is an indication that the hydraulicconnection is impeded.
9

Table 2 Water Level Data
Estimated Water WaterLocation Date Easting Northing Ground Level Level
Level (mBGL) (mAHD)(mAHD)
RN34220 5/10/04 724932 8576889 62 9.51 52.5*
RN34221 5/10/04 724915 8576905 62 12.25 49.7 ?
RN34222 5/10/04 724789 8577095 65 12.70 52.3*
RN34223 5/10/04 724624 8577370 63 10.83 52.2*
RN34225 5/10/04 721838 8579553 60 9.09 50.9*
RN34226 18/9/04 721472 8578937 69 8.61 60.4+
RN34227 5/10/04 723804 8577891 63 11.87 51.1*
RN34228 28/9/04 723783 8577923 63 10.09 52.9*
RN34229 5/10/04 725202 8576504 55 4.08 50.9+
Darwin 5/10/04 43.13#RiverDam
Manton 4/10/04 37.35#Dam
* Coomalie DolomIte + Rum Jungle Complex ? DubIOUS # Water Level near dam wall
The nature of the flow regime towards the Manton Dam needs to bedetermined. A discontinuity in the aquifer system is inferred by thepresence of geological faulting mapped in this area. The faults appear tohave manifested as spring fed creeks and seepages. Further work isrequired to determine if the creeks and seepages represent discharges fromthe Coomalie Dolomite aquifer, and indeed, if the seepage area represents a"natural" groundwater dependent ecosystem. However, this would beunlikely if the aquifer water levels were artificially elevated due to the dam.
Two bores, RN 34222 and RN 34223 equipped with loggers during the period5 October to 9 November 2004 (34 days) indicated "earth tide" and diurnaleffects in the water level movement as well as a decline of 0.57m over thatperiod. This extrapolates to a seasonal decline of at least 6m for 2004. Thisdata is presented in Figures D5 and D6.
Order of magnitude estimates of the sustainable yield of the formation,based on potential recharge and throughflow approximation, are provided inAppendix F. This work indicates the sustainable yield, under currentconditions, is in the range 1500 to 3000ML/y. Modelling of the aquifersystem in Section 3 indicates that annual recharge is about 2600ML.
10

Postulated General Groundwater Movements
O."$ftFJI DfID_gr6.Y,a,.Ul1a,_52mPIal FollI. D.ww1n fNJQ,"_ Grou",:JAlllla,
~ms
o
\\,,
\ ,,'- ...._-
" ,...-....... -------------LEGEND
. ~t*)f Ro.od
Minor Road
T.ack
Railway
. Spo1 'tVate. Lewt (Sept 200. AHD)
_ Direction of Gmundwater Movement
. oeMetued AQ"iW EXlent
.521m
"""", 50.91m
I
Figure 6
2.5 Water QualityWater analyses for general chemical parameters, specific metals andradionuclides for the test production bore are included in Tables Eland E2.The water samples were obtained by pumping in accordance with proceduresspecified by the Power and Water Corporation (2003). The water quality issuitable for human consumption.
General parameter analyses for other groundwaters sampled during thisinvestigation are also listed in Table E 1.
There are two distinct types of chemical composition with the followingcharacteristics:
• Low Total Dissolved Solids (less than 30 mg/l), low hardness (less than5 mg/l) and slightly acidic (pH between 4.9 and 6.0).
• Moderate Total Dissolved Solids (typically 300mg/l), moderate to highhardness (200 to 300 mg/l) and near neutral pH.
The low total dissolved solids (TDS) waters occur where the aquifer isintersected in the shallow and extremely weathered units of the CoomalieDolomite. They result from minor evaporative concentration of rainwaterduring recharge. The main constituent ions are chloride, sulphate andsodium, all of which are present in rainwater. The silica present has beenleached from the surrounding rock.
11

Moderate TDS waters are from the lower units of the Coomalie Dolomite.Their composition results from dissolution of dolomite by acidic rechargewaters. Calcium, magnesium and bicarbonate are the major ions and theseare sourced from the mineral dolomite (calcium-magnesium carbonate).Acidic recharge waters are neutralised by the dissolution reaction. Thispresumably reflects the proportion of dolomite in the rock.
12

3. Aquifer Modelling \\,~ '0 \
A simple numerical model was constructed and utilised to provide indicationof the potential of the Coomalie Dolomite aquifer in this area for watersupply development. A finite difference modelling package, MODFLOW(McDonald and Harbaugh, 1988) was used to simulate the groundwaterregime and a range of development scenarios were applied to determine anoptimal yield scenario under pumping. The model setup and execution wasfacilitated using PM5 (Chiang and Kinzelbach, 1993) as a graphical userinterface. A number of assumptions were made in developing the model.
• the extent of the aquifer is as shown on Figure 7• the aquifer is continuous and isotropic in the study area• the aquifer is recharged annually• there is hydraulic connection with the Darwin River Dam to the west
and Manton Dam to the east• there is no lateral connection with other aquifers
3.1 Model Layout \).U!'~\.() 1,..,The model layout is shown on Figure 7, indicating 100m x 100m uniformcells superimposed within the delineated aquifer extent. The aquifer ismodelled as a single layer unconfined system. Cells outside of the grid aredesignated as inactive.
Figure 7
3.2 Boundary ConditionsThe significant features of this model are the hydraulic connections with theDarwin River and Manton Dams at each of the longitudinal boundaries asthe only avenues for aquifer discharge. The cells representing these featuresare assigned "constant head" attributes with water levels of the cells "fixed"at the values indicated in Table 2. The marked difference in relation to thewater levels of the dams is indicative of only moderate hydraulic connection.This factor has proved to be critical in developing an appropriate flowgradient (about 1:200) between the "constant head" discharge nodes at thewestern end of the model and the water level indicated in bore RN 34225. Itshould be noted that the water levels are based on estimated ground
13

elevations and need to be substantiated or otherwise, if further work is to beconducted.
The lateral boundaries of the model are designated as "no-flow".
3.3 Model ParametersThe "flat" nature of the groundwater flow regime presented in Section 2.4and indicative results of the pumping test, affirm an understanding that theaquifer is highly permeable. A range of possible values for transmissivity inthe range 500 to 5000m2 / day were trialled by modelling the steady stateregime. Corresponding variables induding recharge rates and the value forpermeability of the constant head nodes adjacent to the dams, were derivedto reasonably replicate the postulated groundwater flow regime in Figure 6.The recharge data is further discussed in Section 3.4 below.
In the transient model, the range of transmissivity values and recharge rateswere used to determine an appropriate and corresponding specific yieldvalue. The range of values trialled was between 3% and 10%.
3.4 RechargeRecharge to the model is input via all active cells in the model. A range ofrecharge rates equivalent to between 10% and 40% of annual rainfall (135 to540mm/y) were input to the model and run under steady state conditions.A value of 500mm/y for recharge was adopted for the model.
A recharge scenario for the transient model was developed from a soilmoisture deficit model for the adjacent Berry Creek catchment (Jolly et aI,2000) which determined potential daily recharge. The monthly potentialrecharge input pattern thus derived from this analogy is presented in Table 3below. The model's "actual" recharge input for each month represents aproportion of the "Average Monthly Potential Recharge".
Table 3 Transient Model Recharge Schedule
Month
JanFebMarAprMayJunJulAugSepOctNovDec
Average MonthlyPotential Recharge
(mm)
23518418159oooooo
50166
14
Actual Input for ModelRecharge (ml d)
0.00430.00370.00330.0011
oooooo
0.00090.0031

3.5 Model Calibration
3.5.1 Steady State ModelThe flow regime postulated in Section 2.4 and water level data in Table 2provided an approximate calibration target. Transmissivity values ofbetween 500 and 5000m2 j day were trialled. Corresponding valuesrepresenting the transmissivity of the "constant head" aquifer dischargenodes and recharge were determined to achieve the calibration of a steadystate model.
(1) Transmissivity = 500m2/ dayA poor calibration was achieved for this model since the "flat" water leveldistribution in Figure 6 could not be replicated. The aquifertransmissivity value was indicated to be the critical "variable" since asignificant flow gradient is developed by this "low" value. Acorresponding value for recharge of 170mmjy is applied to obtain theapproximate solution to this model. The value for transmissivity of theconstant head nodes was 50m2 j day.
(2) Transmissivity = 1OOOm2/ dayOnly an approximate calibration was achieved for this model. The mostsuitable value for recharge was determined to be 300mmjy toapproximately achieve the required groundwater levels in the model. Avalue of 50m2 j day was applied for the transmissivity of the constanthead nodes.
(3) Transmissivity = greater than 1OOOm2/ dayA model applying a value for transmissivity of 2500m2 j day produced thegradient observed from existing water level data. To achieve thecalibration, a recharge equivalent to 500mmjy was applied to match themagnitude of observed water levels, and the value for transmissivity ofthe constant head nodes was 50m2 j day.
Values of transmissivity greater than 2500m2 j day resulted in "too flat" agradient.
In adopting steady state solution (3) above, the annual recharge,representing the upper limit of the sustainable yield, is determined to beapproximately 2600ML.
3.5.2 Transient ModelA transient model was developed to represent a period spanning 5 years, andbased on a transmissivity value of 2500 m 2 j day as determined from previoussteady state modelling. However, since there is scant seasonal water level orother historical data on which to base a calibration, only a range of possibleoutcomes has been presented in this section.
The value for recharge of 500mmjy was used to model the "no pumping"scenario. The individual monthly recharge input values indicated in Table 3above, equates to an annual recharge of 2600ML.
15

A range of possible values for specific yield of the aquifer were trialled. Thevalues applied were 3%,5% and 10%. The outputs from the model indicatedthe average seasonal fluctuation to be 9.6m, 5.8m and 2.8m respectively.These results, when compared to similar aquifer systems at Acacia andBatchelor where seasonal fluctuations have varied from 2 to 8m over themonitored period, suggest the specific yield of the formation is likely to beabout 5%.
3.6 Development ScenariosThree borefield production scenarios - 10, 15 and 20MLj d, were modelledwith extraction points distributed evenly along the length of the aquifersystem. The maximum drawdowns, experienced at the end of each dryseason are presented in Tables 4,5 and 6 below.
Table 4 Modelled Drawdown for a Borefield Production of 10ML/ d
Specific Yield Value Maximum Drawdown (m)3% 165% 15.510% 15
Table 5 Modelled Drawdown for a Borefield Production of 15ML/d
Specific Yield Value Maximum Drawdown (m)3% 245% 2310% 22
Table 6 Modelled Drawdown for a Borefield Production of 20ML/ d
Specific Yield Value Maximum Drawdown (m)3% 315% 3010% 29
3.7 Model ResultsThe aquifer's high permeability and the even distribution of model boresresults in relatively "flat" drawdown along the length of the system. Theproduction rates modelled exceed the annual recharge to the system, andhence a significant proportion of the yield is drawn from aquifer storage.Continued extraction at the modelled rates results in the dewatering of theaquifer, although an equilibrium situation is attained due to the reversal ofthe flow gradient from each of the dams. The maximum drawdown underthis regime does not appear to be critically dependent on the specific yield ofthe sediments being drained.
Even, under the 20MLj d pumping scenario, the model results indicate theborefield would still be viable after each year of continuous pumping due tothe reversal of the hydraulic gradient from the dams.
16

4. Water Supply Development Potential
A borefield in the Coomalie Dolomite between the Darwin River Dam andManton Dam could potentially yield up to 20MLj d, equating to 7300MLannually. This is possible by virtue of the interception of the water storagesat either end of the system. The close proximity of the dams present afurther option in the use of an artificial recharge scheme.
The sustainable yield analysis in Appendix F indicates the recharge to thesystem is between 1500 and 3000MLjy under natural conditions. This islimited by the small area of the sub-cropping aquifer system and hence thepotential capture of recharge. However, it is possible for this recharge figureto increase under development if the aquifer retains the recharge which is"normally rejected", although this is not likely to add more than anestimated 1000MLjy to the aquifer.
Preliminary modelling analysis in Section 3 was undertaken to provideindicative data on the development potential of this aquifer. Assumptionssuch as aquifer continuity and hydraulic connection with the Darwin RiverDam and Manton Dams were made. The modelling results indicate that anappropriately designed borefield may yield up to 20MLj d from the system.However, this level of production will result in the dewatering of the aquiferuntil equilibrium is established by the interception of flow from the dams.The aquifer water level under this regime would be a maximum of about 30mbelow the current level. This level is assumed to represent the limit ofviability of bores.
A recharge enhancement option should also be considered. The options mayinclude the use of an artificial recharge scheme such as aquifer storage andrecovery (ASR) or pit recharge of (presumably) wet season excess from theManton or Darwin River Dams. The cavernous nature of the aquifer isconsidered an advantage in this regard. The production borefield wouldthus be designed to accept injectant waters during the wet season if ASRwere used.
The area of groundwater investigation was limited to only that area betweenthe dams. However, further areas of the dolomite are mapped to the west ofthe Darwin River Dam and to the south of Manton Dam. The dolomite inthese areas are considered to also host significant groundwater resources.Further development plans should consider these resources.
A further issue to be considered in developing a borefield in the CoomalieDolomite is the construction of production bores. Appendix B describes thedifficulty encountered in constructing test bore RN34228. Such difficultiesare typical of the nature of problems met in constructing bores in karsticconditions. As well, the performance of bores in the Coomalie Dolomite isoften constrained by the potential for sand and fine particle ingression athigh pumping rates.
17

5. Conclusions
The 2004 investigation of the Coomalie Dolomite Formation between DarwinRiver Dam and Manton Dam has located a significant groundwater resourcein the karstic weathering profile of this formation. The sustainable yield ofthe resource is estimated to be between 1500 and 3000MLjy based onrecharge and throughflow calculations.
Investigative drilling has confirmed the interpreted geological mapping of theformation (Lally et aI, 2002) in the study area. The Coomalie DolomiteFormation has been defined as trending approximately east-west betweenthe Darwin River Dam and Manton Dam as shown on Figure 3. Correlatedwater level data and the limited bore testing conducted indicate that theaquifer is hydraulically extensive in this area.
A test bore was constructed to provide data for hydraulic analysis. It waspumped at a rate of 30Lj s before testing was ceased due to sand ingressionproblems. The analysis of the limited test pumping data indicates theaquifer is highly permeable with a transmissivity in excess of 1000m2 j d.This is supported by modelling results. The specific yield of the formation isestimated to be 5%.
Hydraulic connection with the Darwin River and Manton Dams is inferred.The only likely avenue for aquifer discharge is identified as the sub-croppingformation beneath each of the dams. However, the nature of the connectionneeds to be better defined.
Numerical modelling was conducted to provide indicative informationregarding the development potential of the aquifer. This work indicates thata borefield yielding up to 20MLj d is feasible. However, such a scheme wouldresult in aquifer dewatering. An equilibrium situation is attained throughthe interception of water from the dams at either end of the system.
The water quality is potable for human consumption in accordance withguidelines for drinking water as adopted by the Power and WaterCorporation. It is typified by total dissolved solids of 300mgj L, a moderateto high hardness of 250mgjL (as CaC03) and a neutral pH.
19

6. Recommendations
Should plans to develop the groundwater resource in the current study areaproceed, it is recommended that
(i) a further stage of investigation is conducted to confirm the extent andcontinuity of the aquifer to the east of the power transmission lines(see Figure 2). This should commence by conducting geophysicalsurveys intermittently across the formation to delineate it. Furtherdrilling is required in the western part of this aquifer to confirm thenature of the aquifer in this area. The investigation should also aim tolocate potential production bore sites along the length of the aquifersystem. An estimate of the scope and cost of this work is provided inAppendix G.
(ii) further testing of bore RN 34228 be conducted following workover todevelop the bore so as to achieve a sand free discharge.
(iii) water levels be measured at least monthly from the following bores RN 34220, RN 34222, RN 34223, RN 34227 and RN 34225. Acontinuous water level recorder installed in at least one monitoringbore will provide information on the aquifer response to wet seasonrecharge.
(iv) the nature of the hydraulic connection with the dams be established.One approach is to locate water level monitoring bores at either end ofthe system to correlate with water level fluctuations in the dams. Thehydraulic resistance properties of the intervening material may thusbe determined.
(v) the potential for artificial recharge through an aquifer storage andrecovery system or through drainage pits be investigated.
To investigate further developable groundwater resources In the CoomalieDolomite of the area, it is recommended that
(i) the groundwater resources in the areas of mapped sub-croppingCoomalie Dolomite to the west and south of the Darwin River Dam andManton Dam respectively be investigated.
21

7. References
Chiang, W-H. and Kinzelbach, W., Processing Modflow Version 5.0,Hamburg, 1998.
Coffey and Partners pty Ltd, McMinns - Benham Lagoon GroundwaterInvestigation - Report on Project Studies, 1980, Department ofTransport and Works, Report Number H8-AO, 1980.
Cook, P.G., Hatton, T.J., Eamus, D., Hutley, L. and Pidsley, D., 1998,Hydrological Investigation at Howard East, NT. Technical Report 41/98,Centre for Groundwater Studies, CSIRO Land and Water, Adelaide,S.A. November, 1998
Johnson, K., D'Addario, G.W., Jorritsma, P.J. and Bultitude, J.M.1977, edited 1984, Geology of the Rum Jungle Uranium Field, 1:100000Scale Geological Map Special, Bureau of Mineral Resources, Geologyand Geophysics, Commonwealth Department of Resources andEnergy, Hobart, 1984.
Johnson, K., Hone, LG., Ingram, J.A. and Crick, LH., 1979,Stratigraphic Drilling in the Rum Jungle area, N.T. 1973-74, Record1979/89, Geological and Geophysical Results, Bureau of MineralResources, Australia, 1979 (unpublished).
Jolly, P.B., 1982, Batchelor Water Supply - Investigation ofGroundwater Resources 1981, Report No. 14/82D, Department ofTransport and Works, Water Resources Division, Darwin, June 1982.
Jolly, P.B., 1983, McMinns - Benham Lagoon Borefield Investigation,Report No. 17/1983, Department of Mines and Energy, WaterResources Division, Darwin, April 1983.
Jolly, P., Sutcliffe, E., Jolly, I., George, D. and Jolly, S., 2000,Prediction of Springflows at GS8150027 on Berry Creek for the Period1870 to 1999, Department of Lands, Planning and Environment,Natural Resources Division, Palmerston, August, 2000.
Lally, J.H., 2002, Stratigraphy, Structure and Mineralisation, RumJungle Field, Record 2002-005, Northern Territory, Department ofBusiness, Industry and Development, Northern Territory GeologicalSurvey, Darwin, October, 2002.
Likens, G.E., Keen, W.C., Miller, J.M. and Galloway, J.N., 1987,Chemistry of Precipitation from a Remote Terrestrial Site in Australia,Journal of Geophysical Research, 92, pp13299 - 13314.
McDonald, M.G. and Harbaugh, A.W., 1988, A Modular ThreeDimensional Finite-Difference Groundwater Flow Model, United StatesGeological Survey, 1988.
23

Pietsch, B.A. and Stuart-Smith, P.G., 1987, 1:250000 GeologicalSeries Explanatory Notes, Darwin SD52-4, Northern TerritoryGeological Survey, Department of Mines and Energy, Darwin, 1987
PowerWater Water Facilities, 2003, Water Services OperatingProcedure 03/02 - Procedure for Water Quality Sampling of New BoresPrior to Development: Chemical, Physiological and Radiological WaterQuality for Water Supply Purposes, PowerWater Corporation, April2003.
Tickell, S.J., 1994, Dryland Salinity Hazard Map of the NorthernTerritory, Report No. 54/94D, Power and Water Authority, NorthernTerritory of Australia, Darwin, 1994.
Tickell, S.J., 2000, Groundwater Resources of the Acacia Area, ReportNo. 4/2000D, Department of Lands Planning and Environment,Natural Resources Division, Darwin, February, 2000.
24

APPENDIX A
Lithological Logs of Boreholes
25

TABLE Al Lithological Logs of Boreholes
Bore RN Depth Interval Lithology (observed) CommentsDrilled
(m)
34220 34 0-3 Grey topsoil, bright red clays and silts, Crater Formationlaterite 0- 34m
3-6 Yellow laterised clays, occasionallaterite chips, slightly sandy and silty
6-9 White and brown claystone
9 - 12 Brown to red brown claystone,becoming sandy (fine) at bottom ofinterval
12 - 15 White sandy claystone (soft)
15 - 18 As above, becoming sandier with depth
18 - 21 White sandy claystone to clayey Water at aboutsandstone, chunks laterised, iron 19m, airlift 0.2Ljscemented maroon sandstone
21 - 24 Laterised sandstone, soft Hole washing inairlift 3~4Ljsconductivity26/lsjcmIpH 7.38
24 - 27 Laterised sandstone, minor clays and Hole washing inwhite sandstone, rounded laterite badly, airliftpebbles. ~10Ljs
weatheringsurface?
27 - 30 Fine white clayey quartz sandstone, airlift 10+Lj slarge rounded river pebbles to cobbles
30 - 33 Fine to medium white to slightly buffcoloured sandstone, rounded rivergravels to large cobbles (dark greydolerite?)
33 - 34 As above Too much sandwashing in, airlift10+L/s
26

TABLE Al continued
Bore RN Depth Interval Lithology (observed) CommentsDrilled
(m)
34221 85 0-3 Laterised clayey sandstone, brown and Crater Formationred/pink 0-72m
3-6 as above, more clayey
6-9 Laterised claystone, brown and white,hard
9 - 12 Laterised sandy claystone, yellow andwhite
12 - 15 Pink and white clayey sandstone
15 - 18 White clayey sandstone
18 - 21 Clayey sandstone, slightly clayier thanabove
21 - 33 Fine pink clayey sandstone
33 - 45 Fine pink quartz sandstone, slightlyclayey, rounded quartz grainscoarsening towards 45m, rare reddishgrains
45 - 48 Clayey pink quartz sandstone, sub-rounded and well graded grains
48 - 60 Quartz gravels and clays, sub-angularto sub-rounded grains to 3mm, grainseven sized, white to pink clays @ 54-57m
60 - 72 Clays, white to pink, quartz gravels asabove with fine, well graded sands,sub-angular to sub-rounded
72 - 85 Yellow clays and quartz gravels (from Weathering surfaceabove ?), sandy assortment, incl. small (?)grains possibly dolerite, chocolate clay Coomalie Dolomite@81-84m (?) from 72m
27

TABLE Al continued
Bore RN Depth Interval Lithology (observed) CommentsDrilled
(m)
34222 65 0-3 Bright red/orange laterite and clays @ Coomalie Dolomitesurface, pebbly with laterised 0-65msandstone, white clays @ end ofinterval
3-6 Buff coloured claystone, slightly sandy,few laterite pebbles, yellow clays @ 6m
6-9 Laterised mottled claystone, yellow redand white, layer laterised sandstone
9 - 12 as above, slightly siliceous
12 - 15 White, yellow and pink claystone,siliceous
15 - 18 as above, highly siliceous claystone(porcellanite)
18 - 21 Red brown plastic claystone, somewhite
21 - 27 White claystone, layers pink claystone,few sand grains
27 - 29 White claystone as above
29 - 40 Yellow to brown medium sandstone,rounded gravels to 3mm, 29-33m V.coarse well rounded grains, minor claythroughout.
40 - 47 White sandy claystone, slightly sandy40-42m
47 - 63 Large quartz gravels, bedded with whiteclays, sands and gravels from 1 to10mm, mostly sub-rounded
63 - 65 Quartz gravel, hard, some vein quartz Airlift 2L/ son(?), Small band fine sandstone (?), completion,white clays conductivity
2071ls / cmpH 7
28

TABLE Al continued
Bore RN Depth Interval Lithology (observed) CommentsDrilled
(m)
34223 81 0- 3 Red to reddish orange clays, hard Coomalie Dolomite(laterised), occasional remnant quartz 0-81m
3-6 Red orange laterised clays to purpleclays, pale to yellow clays (bedded),hard
6-9 Red laterised clays, nodular ironstone,going to buff, yellow and red colouredmottled claystone, soft
9 - 12 White to light yellow mottled claystone,slightly sandy
12 - 21 Bright white claystone, slightly sandy,increasingly sandy 18-21m
21 - 24 White sandy claystone with quartz,angular, possibly as vein quartz
24 - 27 As above, more quartz than above,mainly sub-angular, some sub-rounded
27 - 30 Quartz and white clays, large gravels to10mm, fracturing, weathered and sub-angular, fine crystalline structure
30 -36 Highly weathered quartz and clays,quartz fractured with iron staining(mainly 33-36m), siliceous claystone
36 - 39 Maroon to chocolate claystone, slightlysiliceous, quartz beds (veins?) with ironstaining on fracture faces, quartz fineto coarse crystalline (as quartzite)structure and discoloured to brown.
39 - 45 Brown mottled quartz and white clays,fine crystalline quartz, fractured.
45 - 48 Fine crystalline quartz, going to greyand brown highly weathered claystone
48 - 57 Maroon to chocolate brown claystone,rare quartz chips
57 - 63 ~lght brown claystone, highly [email protected], quartz beds
63 - 66.4 Dolomite, grey and chert, fractured water - airlift ILl son completion,conductivity3321ls/cmpH 8.2
66.4 - 81 Light grey dolomite, crystalline
29

TABLE Al continued
Bore RN Depth Interval Lithology (observed) CommentsDrilled
(m)
34224 60.9 0-3 Topsoil, then redlorange laterised Coomalie Dolomiteclaystone, round nodular ironstone 0- 60.9m
3-6 Hard, nodular iron and claystone, pinkto pale yellow laterised claystone
6-9 Yellow, white and red mottledclaystone, slightly sandy, soft
9 - 12 Pink, red and white mottled claystone
12 - 15 White claystone, rare quartz - ironstained
15 - 18 White claystone, quartz piecesthroughout, angular to sub-angular,some "fine sugary" pieces
18 - 21 as above, occasional grey quartz
21 - 24 Quartz, gravels to 8mm, angular, finelycrystalline, brown and grey in colour,clays throughout
24 - 27 Quartz and clay, harder and lessfractured (smaller chips), crystalline
27 - 33 Light and dark grey quartz, crystalline,pink clays, probably interbedded
33 - 36 Red clays and small chips grey andbrown quartz, bedded and finelycrystalline
36 - 39 Yellow and olive coloured clays, Rock rollerdolomite @38m, hard grey platy chips.
39 - 45 Light and dark grey dolomite, hard, no notablefinely laminated structure detected
while drilling45 - 60.9 Fresh dolomite, fine to coarse
crystalline, grey to khaki, whitespeckles, hard
30

TABLE Al continued
Bore RN Depth Interval Lithology (observed) CommentsDrilled
(m)
34225 96 0-3 Red brown laterised claystone, some Whites Formationnodular laterite 0-69m
3-6 Pale yellow and white laterisedclaystone, some mottled, ironstone
6-9 Pisolitic ironstone and mottledclaystone
9 - 12 Pale grey claystone, some mottling
12 18 Light grey and khaki claystone,mottled, rare quartz, «5%)
18 - 21 Grey and khaki claystone as above,quartz angular to sub-angular(probably as veins or fingers)
21- 30 Pale grey and khaki claystone, quartzabsent
30 - 69 Highly weathered mudstone, grey andbrown to 36m, then olive to khaki to45m. dark grey then black @69malmost no quartz
69 - 72 Black, HW shale(?), then quartz fingers Coomalie Dolomiteand dolomite in layers 69 - 96m
72 - 78 Dolomite, coarse dolomitic sandt?), to water (?)pebbly, white quartz gravels and greygreen speckled dolomite
78 - 81 Black mudstone and dolomitic sands (?highly contaminated sample), andpyrite veins in quartz, grey and greenclay (spotty - probably dolomite)
81 - 84 as above, traces red crystalline Rock roller bitdolomite, quartzy
84 - 96 Hard grey dolomite, quartzy grains, sample appearsmicaceous -microscopicexaminationindicates chipsfractured oncleavage face
31

TABLE Al continued
Bore RN Depth Interval Lithology (observed) CommentsDrilled
(m)
34226 43.5 0-3 Maroon laterised claystone, white Rum Jungleclaystone, nodular ironstone Complex (granite)
0- 43.5m3-6 White and brown clays, quartz sands
(possibly HW granite)
6-9 as above, slightly coarser
9 - 12 White clays, brown/ orange clays andquartz
12 - 15 Pink clays and quartz as above
15 - 39 Highly weathered granitic sands, quartz water intersected-increasing and becoming coarser 0.5L/stowards 39m,white and brown clays asabove, vein quartz @30-33m
39 - 43.5 Black granite, coarsely crystalline V.hard, slowpenetration withhammerairlift 0.5L/sconductivity99!ls/cmIpH 7.7
32

TABLE Al continued
Bore RN Depth Interval Lithology (observed) CommentsDrilled
(m)
34227 84.8 0-3 Grey topsoil, then bright red lateritic Coomalie Dolomiteclays 0-84m
notable absence ofironstone nodules
3-6 Maroon to red laterised claystone, someironstone (possibly disseminated)
6-9 Brown, white and purple lateritic(mottled) claystone
9 - 12 Yellow to pale brown claystone, slightlysandy
12 - 15 Sand and claystone, yellow to brown Airlift - lOLls,(laterised) and quartz sandstone and conductivityquartz - possibly as veins, angular, 451ls/cmassorted sizes to 10mm (-10%) pH 8.3
15 - 18 Porcellanite and slightly siliceousclaystone, maroon and white
18 - 21 White and purple mottled claystone,siliceous
21 - 27 Siliceous white claystone, sandyclaystone, becoming sandier@27m
27 - 30 Buff coloured sandstone, slightlyclayey, layer maroon sandstone,assorted angular quartz gravels
30 - 33 Brick red clays and sand, white claysand assorted quartz sands and gravels,angular chips quartz possibly vein.
33 - 36 As above, larger quartz pieces to10mm, (-50% of sample)
36 - 51 Large quartz pebbles and cobbles, No increase inkhaki sands (quartzy) and quartz after water noteddolomite, angular, highly vuggy and cased to 51msugary quartz
51 - 54 Light grey and white dolomite some cave in
54 -84.8 Light grey dolomite as above, hard, Airlift 15L/s [email protected] completion
conductivity3041ls / cmpH 7.7
33

TABLE Al continued
Bore RN Depth Interval Lithology (observed) CommentsDrilled
(m)
34228 64 0-3 Bright red laterised clays Coomalie Dolomite0-64miron nodulesabsent
3-6 as above, slightly silty rare iron nodules
6-9 Brown/red laterised claystone, white probably weatheredclay@9m mudstone
9 - 12 Bright red, white and purple claystone,ironstone or laterised sandstone
12 - 18 Mottled laterised claystone, pale yellow,white and red/brown ironstone bands16-18m
18 - 21 White claystone, slightly siliceous,mottled with purple and yellowclaystone
21 - 30 Mottled white claystone with yellow andbrown, less siliceous with depth, silty @27-30m
30 - 33 White sandy claystone, slight mottling,minor quartz
33 - 36 White mottled claystone, quartz gravel,sub-angular (50% of sample)
36 - 39 Quartz gravel with white clays, sub-rounded to sub-angular, quartz to 3mm
39 - 48 Dark yellow clays, quartz gravels andsands, occasional dark quartz chip
48 - 51 Dark yellow going to red and chocolatebrown clays, quartz gravels as above,vuggy
51 - 57 Chocolate brown clays and greydolomite, vuggy quartz
57 - 61 Quartz after dolomite, silt and mud, v. vuggy anddark grey coarse crystalline dolomite fractured country
61 - 64 no returns cavity, airlift 40L/son completionconductivity2271ls/cmpH 8.2
34

TABLE Al continued
Bore RN Depth Interval Lithology (observed) CommentsDrilled
(m)
34229 36.9 0-3 Grey alluvial topsoil, laterised Rum Jungleclaystone, mottled brick red and white Complex (granite)
0- 36.9mshallow lateriteIprofile
3-6 Grey clay and quartz sands E.W. granite
6-9 Quartz sands and white clay
9 -30 Pink and orange granitic sands and H.W. granite,clay seepage supply
30 - 36.9 granite, weathered ILls airlift,conductivity 36pH 7.95temperature 23.4
0
35

APPENDIX B
Bore Construction Details
37

The encounter of difficulty in the drilling and construction of productionbores in the Coomalie Dolomite Formation has previously been documentedby Coffey and Partners (1980), Jolly (1982) and Jolly (1983). Such reportsinvariably emphasise the need to drill an investigation bore to firmproduction bore sites. Information gained from the bore will assist indetermining the nature of the strata to be encountered. A pilot hole for theproduction bore will confirm the existence of permeable strata in the hole.and the appropriate interval to target for screening.
During the 2004 investigation, a 203mm investigation hole (RN34227) wasdrilled near the test bore (RN34228). Highly weathered and vuggy dolomitewas encountered from 39 to 54m. This part of the formation was unstableand was cased. The hole was continued to 84m where a 3m cavity wasintersected.
The test bore (RN34228) was sited 40m north. A 254mm hole was drilled.The upper part of the hole encountered a similar highly weathered andunstable rock as previously intersected in bore RN34227. This causedconsiderable difficulty in the construction of the bore which was exacerbatedby the larger hole diameter. The 203mm casing was seated at 58.4m. Thehole was continued to 64m, intersecting a 3m cavity from 61m. Thescreening interval was thus targeted at 61 - 64m.
However, instability of the formation between 58.4 and 61m did not allowsubsequent access to the cavity once the drill string was withdrawn. Afternumerous failed attempts to recover the hole, it was decided to screen thefractured interval between 58.4 and 61m.
The hole was airlifted and the discharge was in excess of 30LI s. The borewas surged until the discharge was sand-free.
The initial test pumping rate was 30LI s. The bore produced fine quartzsand with eventual clogging of the screens after 30 minutes. Microscopicexamination has confirmed the quartz sand to be of dolomite origin.
Further workover of this bore to clear the screens is recommended. The boreshould then be re-tested using a low rate initially (lOLls). The rate may beincreased as the bore develops.
The bore construction and sanding problems encountered are similar tothose experienced when constructing the production bores at Batchelor.Persistence with gentle development has produced sand free bores in thelonger term.
Table B 1 on the following page presents a construction summary of all boresdrilled during this investigation.
38

TABLE Bl Bore Construction Details
BOI"eRN Easting Northing Depth Ail"lift Yield (Lis) Casing details Current statusdrilled (m)
34 10 - 15L/s (est)0- 5.5m 203mm steel casing W/L
34220 724932 8576889 0- 21m 102mm PVC casing Monitor@27m 21 - 25m 102mm slotted PVC, 2mm apert
25 -27.1m 102mm PVC casing
85 2L/s@ 18m0- 5.5m 203mm steel casing W/L
34221 724915 8576905 0- 74.5m 102mm PVC casing Monitor74.5 -77.5m 102mm slotted PVC, 2mm apert TD 24048mGL77.5 -78m 102mm PVC casing
34222 724789 8577095 65 2L/s@41m0- 5.5m 203mm steel casing W/L0- 58.6m 102mm PVC casing Monitor58.6 - 64.6m 102mm slotted PVC, 2mm apert TD 64.63mGL
34223 724624 8577370 81 1L/s@63m0- 5.5m 203mm steel casing W/L0- 6004m 102mm PVC casing Monitor6004 6604m 102mm slotted PVC, 2mm apert TD 61.80mGL6604 - 81m 102mm PVC casing
34224 721639 8579210 60.9 None installed, hole backfilled Backfilled
34225 721838 8579553 96 0.5L/s0- 5.5m 203mm steel casing W/Lo-75m 102mm PVC casing Monitor69 - 75m 102mm slotted PVC, 2mm apert TD 40041mGL75 - 95.7m 102mm PVC casing
34226 721472 8578937 43.5 0.5L/s@ 27m0 5.5m 203mm steel casing W/L5.5 -43.5m open hole Monitor
34227 723804 8577891 84.8 5L/s@ 15m 0 5.5m 203mm steel casing Observ.15+L/s@ 84m 0- 50m 102mm PVC casing TD 49.66mGL
34228 723783 8577923 64 30+L/s@ 58m0- 5.5m 254mm steel casing Testing/prod0- 5804m 203mm steel casing TD 6I.57mGL55.5 - 61.9m 152mm ID sis scr, 2mm apert
34229 725202 8576504 36.9 1L/s@36m0- 5.5m 203mm steel casing W/L5.5 - 36.9m open hole Monitor

APPENDIX C
Natural Gamma logs of Boreholes
41

(cps)
o 100 200 300
(cps)
o 100 200 300
(cps)
o 100 200 300
o ---,,1_----'-_--'-_--'
20
o -+---'---------'----'
20
o +---'---------'----'
20
40 40 40
-E'-"
..c:-0-Q)
0
60 60 60
80 80 80
100 100 100
RN 34221 RN 34222 RN 34223
Figure Cl Natural Gamma Logs forRN34221, RN34222 and RN34223
42

(cps)
o 100 200 300
(cps)
o 100 200 300
(cps)
o 200 400 600
o -\---'----'----'
20
80
100
o -l---'------'-------"
20
80
100
40 40 40
........E'-'
:Sc..Q)
0
60 60 60
RN 34224 RN 34225 RN 34226
Figure C2 Natural Gamma Logs forRN34224, RN34225 and RN34226
43
(cps)
o 100 200 300
(cps)
o 100 200 300
(cps)
o 200 400 600
o ,,1_--'--_---'------'
20
80
100
o -j-_-'-------'-_---J
20
80
100
40 40 40
,.-.....
E'-"
:E0-m0
60 60 60
RN 34227 RN 34228 RN 34229
Figure C3 Natural Gamma Logs forRN34227, RN34228 and RN34229
44

APPENDIX D
Test Pumping Data
45

-..
.. ..•- .. ..
•.. ..~
Start of test "- ..
------------
~.
End of test.....
- ... .• •-
•.... ....
-
I I I I
PUMPED BORE RN 34228DATE 28/10/2004DISCHARGE 25 L/s
OBSERVATION BORE RN 34222CAG = 0.69mSWL = 13.76m
r = l300m
CONSTANT DISCHARGE TESTOBSERVATION BORE
~~.
('fQr::...t'D
0""""(")01::1en,.,.$I)
1::1,.,.0~.
enn=r$I)...
('fQt'D
~t'Den
..j::. ,.,.0\ I
0 "t'C'" r::en at'D
~ "CSt'D
$I)~,.,.
~.
~01::1 0...~ t'D0 :::t'...t'D 2::::t' cu2: ~
Ncu N~ 00NNN
13.74
U 13.745
~~o] 13.75
r.IJ
~..j-Ja13.755--'Vj
13.76I-<(])
tj.~
13.765
13.77
28/1012004 12:10:00 28/10/2004 12: 10:36 28/10/2004 13:10:12Date / Time
28/10/2004 14: 10:48 28/10/2004 15:10:24
RN 34228RN 34222

PUMPED BORE RN 34228DATE 28/10/2004DISCHARGE 25 L/s
OBSERVATION BORE RN 34223CAG = 0.65 mSWL = 12.17m
r = 1000m
-Start of ~est
~ •..- • .. • • • •
•.. .. ..
• •-• . •. .. • • •
•
'"-
End of test
-
-
I I I I12.18
28/1012004 11:10:13 28/10/2004 15: 10:36
RN 34228RN 34223
28/10/2004 14: 10:0028/10/2004 13: 10:24Date / Time
CONSTANT DISCHARGE TESTOBSERVATION BORE
28/10/2004 12: 10:48
l-<
~~
12.175
12.15
'V
~ 12.17
012.155
~~o
] 12.16
rJ)
~.j-J
8 12.165---
~....~'1(D
I:'1,1.;)
()0l:SrnI"'!'Jl)l:SI"'!'
I:'....rn(')
l:f'Jl)
aa(D
~(D
Irn
..j:>. I"'!'"'l 0 I
tr ~rn =(D a~ ""Jl) (DI"'!' Q......0
~l:S0
~ '10 (D
'1 ::tJ(D
::tJ ~
~ eN.p.
eN 1,1.;).p. 1,1.;)1,1.;) 001,1.;)eN

Figure D3 Logger Data - RN34222
48
II: tl to001 II 160
II:tl to00/11 ItO
Ol:tl to001 01/0£
Ol:tl t000/01/s0
Ol:tl t000/0J 100
01: tl t0001 01 Is I
01: tl t0001 0110 I
OJ:tl t000/0J Iso

Figure D4 Logger Data - RN34223
49
Tl:£1 too1:/Tl/60
Tl:£1 too1:/Tl Ito
01:£1 too1:/ol/o£
01:£1 too1:/ol/s1:
01: £1 too1:/OJ 101:
01: £1 too1:1 01 Is I
OI:SI too1:/ol/ol
OJ:£! rOO1:/OI Iso

APPENDIX E
Water Quality Data
51

Table El Water Quality Data - General Chemical and Metals
Parameter unit RN34220 RN34222 RN34223 RN34227 RN34228pH 5.7 6.3 7.2 8.1 7.8EC IJS/cm 37 41 150 302 224Alkalinity mg/L 9 11 58 170 118C03 I mg/L 0 0 48 0 0
HC03 mg/L 11 13 71 207 144OH mg/L
Hardness mg/L 3 48 171 121NH3 as N mg/L
F mg/L <0.1 <0.1 <0.1 0.2 <0.1Turbidity NTU
TSS mg/L
TDS mg/L 23 46 126 153 106N02 as N mg/LCI mg/L 4 7 10 5 4N03 as N mg/L <1 <1 <1 <1 <1
P04 as P mg/L
Ca mg/L <1 1 1 1 1K mg/L <1 <1 1 <1 1Mg mg/L <1 <1 11 41 29Na mg/L 3 8 18 2 3Si02 mg/L 12 13 16 14 15S04 mg/L 2 1 1Ag IJg/LAl (filtered) IJg/LAl (Total) IJg/LAs IJg/LB IJg/LBa IJg/LBe IJg/LBr IJg/LCd IJg/LCr IJg/LCu IJg/LFe mg/L 4.5 1.8 u/s u/s u/s
Hg IJg/LI IJg/LMn IJg/LMo IJg/LNi IJg/LPb IJg/LSb IJg/LSn IJg/LSe IJg/LU IJg/LZn IJg/L
All metals analyses as total u/ s unsuitable for determination
52

APPENDIX F
Sustainable Yield of the Aquifer System
53
This section provides only an order of magnitude estimate of systemrecharge and throughflow based on current data. Recharge to the CoomalieDolomite aquifer is assumed to only occur over the sub-cropping formation.This area is shown on Figure 2. At the present time, aquifer discharge fromits western end probably occurs into the Darwin River Dam, and from itseastern end, into Manton Dam. Spring discharge into creeks in the area(discussed in Section 2.4) is inferred from aerial photograph interpretationonly.
Flo Potential RechargeThe following broad approach calculates a volume based on typical rechargethrough the Coomalie Dolomite. An order of magnitude estimate can beobtained by comparing chloride ion concentrations in the local rainwaterwith that in the groundwater. The recharge is equal to the annual rainfallmultiplied by the ratio of the two chloride concentrations. Values of chloridein rainwater of 1.3mgjL and 0.5mgjL for Darwin and Katherine respectively(Tickell, 1994) are based on measured values (Likens et. aI., 1987). For thisestimate, a value of 1mgjL is assumed. Average values of between 4 8mgj L is adopted for chloride in the groundwaters of dolomite aquifer originin the study area (refer Table E 1). Based on an average annual rainfall of1340mm, the recharge to the dolomite aquifer equates to between 168 and335mmjy, or the equivalent to between 1200 and 2500MLjy.
An alternative method for determining recharge is to multiply the observedseasonal groundwater level rise by the specific yield of the aquifer. Althoughthis data is not yet available, data from the Batchelor area which isstratigraphically similar, is applied for the purposes of this estimate. Themaximum and minimum observed wet season water level rises areapproximately 2 and 8m respectively with an average of about 6m. Thestrata in which the water level fluctuates is of a clayey nature and specificyields for such strata range between 0.03 and 0.1. The resultant rechargefor the dolomite aquifer is between 180mm and 600mm. As a comparison,Cook et. ai. (1998) calculated recharge to the Coomalie Dolomite aquiferunderlying the Darwin rural area to be 200mm using chlorofluorocarbonanalysis. Therefore, the annual volume of water added to the groundwaterequates to between 1300 and 4300 MLjy based on the recharge area of7.2 x 106 m 2 and the possible range for recharge depth of between 180mmand 600mm.
The nature of the strata overlying the aquifer indicates that spatial variabilityin recharge potential should be expected. However, for the purposes of thisstudy, the possible range for total recharge volume is 1200 to 4300 MLjy.
F2. ThroughflowThe amount of groundwater moving horizontally through the aquifer fromrecharge areas to the discharge area is the through flow. It may beestimated by applying Darcy's Law to flow in the aquifer. Darcy's Lawrelates flow through porous rock to aquifer permeability (transmissivity), thegradient of the watertable and the width of the aquifer perpendicular to flow.
54

Figure 6 shows the extent of this aquifer with an indication of thepredominant flow path.
This analysis is applied to the section of aquifer, which drains towards theDarwin River Dam since it is the only section where the watertable gradientcan be calculated. Based on water levels recorded in September, 2004, thegradient was 1:1000. The width of the aquifer is approximately 650m andthe transmissivity between 1000 and 5000m2 / day. Throughflow towards theDarwin River Dam was therefore between 650 and 3200m3 / day inSeptember, 2004. Assuming a similar order of magnitude flow is directedtowards the Manton Dam, the total throughflow from the system is between1300 and 6400m3 / day. Applied annually, this equates to a volume ofbetween 470 and 2300ML.
F3. Comparison with Other SystemsThe estimate of sustainable yield of the aquifer system based on the limiteddata at the present time may be compared to a similar system at Batchelorfor which resource performance data is available. The "safe yield" of thesystem in the Batchelor area was initially estimated to be 1000ML annually(Jolly, 1982) based on limited data. Production bores at Batchelor provideapproximately 600 to 700ML annually to the town's water supply system. Areassessment of the sustainable yield has not since been undertaken.However, monitoring data available for the period 1985 - 1996 indicates thatimpact of production pumping is not discernable.
The Coomalie Dolomite in the Batchelor area provides the baseflow toCoomalie Creek. Examination of the flow record for G8170066 (1958 present) at the Stuart Highway indicates the wet season and average dryseason baseflows are about 0.15 and 0.05 cumecs respectively. The annualdischarge volume calculated from this (about 3000ML) is comparable to thesustainable yield calculated in this study. Furthermore, the flow record doesnot indicate that there has been an impact by the town's productionpumping.
Anecdotal data exists for dewatering at the Woodcutters mine approximately13km to the south-east of the study area. Annual extraction from thedewatering bores in the Coomalie Dolomite is reported to be 10000ML.
F4. Sustainable Yield SummaryThe sustainable yield of the aquifer is likely to be in the order of 1500 to3000ML/y. This range is considered reasonable based on the upper andlower limits determined from both potential recharge, throughflowcalculations and comparison with existing information from the Batchelorarea.
55

APPENDIX G
Scope of Recommended Further Work
57

1. Development of the Groundwater Resources in the Current StudyArea
This section details the scope of further work and costs associated with thefirming of the current assessment of the groundwater resource in the studyarea and the location of potential production bore sites.
The further work recommended below is outlined as a two stage project. Theinitial stage should aim to confirm or otherwise, the viability of a borefield inthis study area. A subsequent stage need only be undertaken if viability isindicated. It is important to note that the estimated costs below should beconfirmed once the scope of proposed work is agreed.
Stage 1 Investigation of Production Borefield Viability - continuation(i) Project Management
The professional input required in coordinating the project, providingfeedback as required and ensuring delivery of the agreed scope of workis summarised in this activity.(a) Project and On-Site SupervisionOn-site supervision is maintained at all times during the fieldoperation. Investigation bores are sited and drilled to optimise theinformation to be recovered. Day to day supervision of the project isprovided to ensure coordination of all works and that all available datais captured as a basis for hydrogeological assessment.(b) Analyse and Evaluate Data and ReportingAll field data from the investigation and the assessment of results willbe documented. The assessment report will provide documentation ofthe hydrogeological interpretation, examine water level data andinterpretation of flow regimes and water quality analysis results. Theestimated cost associated with this activity is $25000.
(ii) GeophysicsGround geophysics is recommended to improved definition of thebounds of the aquifer along its length. One traverse per kilometre forthe length of the aquifer is recommended to adequately track theformation. In particular, clarification of the extent of the aquifer to theeast of the power transmission lines (see Figure 2) is required. Theestimated cost associated with this activity is $16000.
(iii) Conduct investigation and monitoring bore drillingThis activity will largely aim to verify the aquifer's existence across theeastern part of the area. Within the western part of the system,further sites are required for water levels and to provide objective datato assess the nature of the hydraulic connection with the Darwin Riverand Manton Dams. As constructed, they will represent a spatialnetwork of water level monitors to provide clarification of thegroundwater flow regime. 15 investigation/monitoring bores areexpected to provide the minimum of data required. The order of costassociated with this activity is $210000.
58

Stage 2 Development of Production Borefield
(i) Project Management(a) Project and On-Site SupervisionAs detailed above.(b) Analyse and Evaluate Data and Reporting
The location of the production borefield and appropriate bore design needs tobe undertaken following the completion of the investigation-drilling phase.An assessment report will provide documentation of all available data,propose an operating strategy for the borefield and for ongoing monitoring ofthe resources. The estimated cost associated with this activity is $5000 persite.
(iii) Drill Production BoresThe approach to the borefield construction will be proposed following thefirst stage. It is expected the borefield construction phase will be staged onan "as required" basis. For the anticipated yield of over 40Lj s per bore, it isrecommended that 254mm steel casing is utilised. The estimated cost is$40000 per bore.
(iii) Conduct bore testingThe suite of testing required is recommended to consist of at least an eighthour multi-rate and an 24 hour constant rate pumping test. It is anticipatedthat bore development will represent additional costs to this activity. Theestimated cost is $12000 per bore.
(iv) Water Quality TestingProduction bore water samples will be obtained and submitted for therequired suite of laboratory tests in accordance with the Procedures for WaterQuality Sampling of New Bores Prior to Development (Power and WaterCorporation, 2003). The cost associated with this activity is $365 per bore.
59

2. Investigation of the Groundwater Resources in an Alternative Area
This section details the scope of work and costs associated with theinvestigation and assessment of the groundwater resource in the alternativeareas mentioned within this report. The new investigation work shouldprimarily aim to provide indicative information regarding the sustainabilityof the resource and assess the viability of a borefield in the area.
(i) Project Management(a) Project and On-Site SupervisionAs detailed above.(b) Analyse and Evaluate Data and ReportingAs detailed above
The cost associated with this activity would be $10000.
(ii) Conduct investigation and monitoring bore drillingThis activity aims to verify the aquifer's existence across the areatargeted for investigation. The investigation bores should beconstructed so as to build a spatial network of water level monitors toprovide indication of the groundwater flow regime. 10 investigationbores should provide a minimum of indicative data required forassessment. The order of cost associated with this activity would be$110000.
60