D Leverage and Firms’ Vulnerability: Do Crises and ...
14
161 Int. Journal of Economics and Management 15 (2): 161-174 (2021) IJEM International Journal of Economics and Management Journal homepage: http://www.ijem.upm.edu.my Leverage and Firms’ Vulnerability: Do Crises and Industry Matter? SANTI NOVITA a* , BAMBANG TJAHJADI a AND FITRI ISMIYANTI a a Economics and Business Faculty, Airlangga University, Indonesia ABSTRACT This study aims to test whether a firm with a higher degree of leverage is more likely to be vulnerable during the financial crisis. The research sample comprises non-financial firms in Indonesia, Malaysia, and Korea during the period 2007-2019. Besides considering the duration and type of industry in comparing the effect of leverage, this study utilizes the pre- crisis period to determine the vulnerability. Using logistic regression, the result indicates that a higher degree of leverage is more likely to reduce a firms’ financial health as expected, but surprisingly the effect is higher during the industry crisis than the global financial crisis. Furthermore, the nature of the industry provides different effects of leverage on firms’ vulnerability. A further concern of the industry characteristic is needed, especially the new and emerging industries, particularly in evaluating and crafting regulation relates to leverage. Additional tests explore channels through which leverage generates these effects. JEL Classification: G01, G32 Keywords: Crises; industry characteristic; leverage; vulnerability Article history: Received: 5 January 2021 Accepted: 5 May 2021 * Corresponding author: Email: [email protected]
Transcript of D Leverage and Firms’ Vulnerability: Do Crises and ...
161
Int. Journal of Economics and Management 15 (2): 161-174 (2021)
IJEM International Journal of Economics and Management
Journal homepage: http://www.ijem.upm.edu.my
Leverage and Firms’ Vulnerability: Do Crises and Industry Matter?
SANTI NOVITAa*, BAMBANG TJAHJADIa AND FITRI ISMIYANTIa
aEconomics and Business Faculty, Airlangga University, Indonesia
ABSTRACT
This study aims to test whether a firm with a higher degree of leverage is more likely to be
vulnerable during the financial crisis. The research sample comprises non-financial firms in
Indonesia, Malaysia, and Korea during the period 2007-2019. Besides considering the
duration and type of industry in comparing the effect of leverage, this study utilizes the pre-
crisis period to determine the vulnerability. Using logistic regression, the result indicates
that a higher degree of leverage is more likely to reduce a firms’ financial health as expected,
but surprisingly the effect is higher during the industry crisis than the global financial crisis.
Furthermore, the nature of the industry provides different effects of leverage on firms’
vulnerability. A further concern of the industry characteristic is needed, especially the new
and emerging industries, particularly in evaluating and crafting regulation relates to
leverage. Additional tests explore channels through which leverage generates these effects.
JEL Classification: G01, G32
Keywords: Crises; industry characteristic; leverage; vulnerability
Article history:
Received: 5 January 2021
Accepted: 5 May 2021
* Corresponding author: Email: [email protected]
D
162
International Journal of Economics and Management
INTRODUCTION
The composition of debt and equity has become an issue of fiscal policy due to deductible expenses allowed.
Instead of mitigating tax avoidance, the purpose is to strengthen the economic buffer to face financial crises.
Hill and Shiraishi (2007) stating that Indonesia was more severely affected by the crisis than any other country
in Asia. The Asian financial crisis in 1997-1998 showed that Indonesia, Korea, Malaysia were the country in
Asia that had the highest number of companies experiencing financial distress (Pomerleano, 1998). It raised a
fundamental issue that leverage is predicted as the main factors in dealing with the cause of firms’ distress.
The effort to determine the factors that cause companies to experience decreasing financial health or
being vulnerable is crucial. Leverage is an important factor, especially during a crisis Claessens et al. (2000).
The weak financial structure before the crisis left companies vulnerable to economic conditions. This is
supported by Hossain and Nguyen (2016) and Matsumoto (2007). By looking at the impact of the global
financial crisis, it is very important to further study the leverage and its effect on the vulnerability of companies
in Indonesia, Korea, and Malysia. Research related to is said to still receive little attention (Haron and Haron,
2016; Moosa and Li, 2012). This poor condition is supported by poor performance and industry conditions
(Andrade and Kaplan, 1998).
The firms need to adjust the capital structure in a financial crisis (Indonesia, 2009). Alfaro et al. (2019)
examined the relationship of leverage and fragility of non-financial firms in developing countries during the
global crisis. The results of the study prove that leverage plays an important role in influencing performance in
times of crisis. This supports the research of Opler and Titman (1994) and Fosu et al. (2016).
The choice between debt and equity, called governance structures, takes into account transaction costs.
Equity is a form of funding suitable for projects that are high-specificity or high transaction costs. Transaction
economic theory (TCE) underlines the importance of leverage as a governance structure instead of as a financial
instrument. Under this theory, the structures which are governed by the nature of transactions will give a lower
cost. If a highly specific asset is financed by debt, it will lead to low performance (Williamson, 1979). On the
other side, agency theory (AT) states that high debt will lead the company to have a better performance.
This study aims to test whether leverage is a determinant of firms’ vulnerability during the financial
crisis, the effect of leverage during the first until the third years of the crisis, and those effects for mining and
non-mining industries. The difference from the previous research is the determination of vulnerability. The
previous research uses a particular score to determine the healthy or vulnerable firms. In this study, the pre-
crisis financial condition is considered as an addition to the financial score. When the pre-crisis and during a
crisis the score is low, it cannot be categorized as vulnerable. Therefore, it directly differentiates the vulnerable
firm from those who are inefficient in the long term period. This study covered financial crisis that includes
both global and industry crises together with its duration. The industry crisis occurred in different periods
between industries during 2007-2019.
LITERATURE REVIEW
In general, research on leverage and financial vulnerability is rooted in research on leverage and performance
that usually explained by two perspective i.e. Agency theory (AT) and TCE. The agency theory perspective on
capital structure states that debt is an investment or management plan to reduce agency conflicts. It explains that
leverage is positively related to company performance or value (Margaritis and Psillaki, 2007; Vithessonthi and
Tongurai, 2015b).
TCE is related to governance of contractual relations in two-party transactions (Williamson, 1979; Coase,
1937; Williamson, 1975). It can explain that leverage has a negative effect on company performance when
examined during a crisis period (Olaniyi et al., 2015; Molina, 2005). Singhal and Zhu (2013) states there are
two ways to manage them, namely debt and equity. TCE is used in supporting the hypothesis that leverage has
a negative effect on firm performance for companies that are expanding in new markets (O'Brien et al., 2014).
TCE is said to be a perspective that provides a more complete picture because it includes several factors such
as lenders' expectations of the risk of investments (Kochhar, 1996; Balakrishnan and Fox, 1993). In the crisis
163
Leverage and Firms’ Vulnerability: Do Crises and Industry Matter?
period, the firms emphasize managing transaction costs more than mitigating agency conflict. The strategy to
manage the cost relates to the industry characteristic has to be considered. Based on the context of developing
countries as expressed by Le and Phan (2017), industry characteristics and the effort to govern financing
structure in facing the crisis period will minimize transaction cost. Thus, TCE theory will be used in this study.
Leverage and firms’ vulnerability in global financial crisis
The financial crisis is associated with phenomena such as substantial changes in credit volumes and asset prices,
disruption of the intermediary function, and supply of external funding, as well as problems with the balance of
the company, household, government, and financial institutions (Claessens and Kose, 2013). Vithessonthi and
Tongurai (2015a) state that the leverage effect on performance is positive for large firms, and those firms have
managed to survive the global financial crisis of 2007-2009. The firms’ vulnerability must be emphasized in
this study due to the different form from the long-term inefficient firms. When using only the financial score,
these firms can be treated similarly. Thus, in this study, the pre-crisis period will be considered.
The financial crisis raises the fundamental issue of the role of leverage in the business continuity (Berger
and Bouwman, 2013; Salim and Yadav, 2012; Dodd et al., 2021). Capital is said to be the main line of corporate
defense in the face of a crisis. Crisis conditions are considered to have an influence on firms’ performance
(Zeitun and Saleh, 2015). In unfavorable environmental conditions, the risk faced is certainly greater if the
company has a higher level of debt. In unfavorable conditions, high leverage tends to reduce the percentage of
market share and has a lower operating profit than competitors.
H1: Firms with higher leverage who experience a period of global financial crisis tend to be
vulnerable.
Leverage and firms’ vulnerability in industry crisis
Industry crisis is a narrower scope of financial crisis but affects the condition of the company. This industry
crisis is a decline in industry performance due to certain events outside the control of the organization (Calandro
Jr, 2007). Industry is said to be distressed when the median sales growth is negative and when the median stock
return is below 30 percent (Opler and Titman, 1994, p.1372, Gopalan and Xie, 2011).
In relation to leverage, assessing differences between industries is important. The degree of leverage is
acceptable for one industry, but may not be suitable for another industry. Industry characteristics are key in
explaining capital (Campello, 2006; Muradoğlu and Sivaprasad, 2012). Each company is defined by its context,
namely the industry (Arend, 2009). Chen and Wei (1993) and Islam and Khandaker (2015) state that mining
industry are more risky than other industries in this regard.
Ofek (1993) provides empirical evidence that there is a positive relationship between leverage and the
possibility of operational activities experiencing distress. The higher the debt funding, the lower the condition
of the company during the crisis (Alfaro et al., 2019; Männasoo et al., 2017). Capital affects performance in
times of crisis but the magnitude of influence varies between types of crises that occurred (Berger and
Bouwman, 2013; Ashraf et al., 2020). High leverage is the main source of corporate financial difficulties,
especially in bad industrial conditions (Andrade and Kaplan, 1998; Opler and Titman, 1994). In addition to
analyzing crises as a whole, an analysis of individual crises was also carried out. Based on the theory and
previous research, the formulation of the research hypothesis of the influence of leverage on potential
vulnerability in the context of the occurrence of financial crises is as follows:
H2: Firms with higher leverage who experience a period of industry crisis tend to be vulnerable.
METHODOLOGY
This study surveyed companies listed on the Indonesia, Korea, and Malaysia Stock Exchange, except in the
financial sector. Those countries are the three highest percentage of the firm in distress in Asian financial crisis
(Pomerleano, 1998). The exclusion of financial sector is related to the different characteristics compared to other
164
International Journal of Economics and Management
sectors. Financial obligations required by banking and insurance companies cannot be compared to non-
financial companies (Rajan and Zingales, 1995).
This study focuses on the crises that occurred between 2007 and 2019. The year 2007 is the global
financial crisis period, while 2019 is the pre-COVID-19 pandemic. They include global financial crisis, industry
crisis, and when both crises occurred simultaneously. Because the pre-crisis is considered to determined
vulnerability in the crisis period, the data in 2006 is used as well. Companies in the different sectors experienced
a different period of industry crisis. Data were analyzed using STATA.
The industry or sector classification in this study refers to The North American Industry Classification
System (NAICS). NAICS classification was used because it provides classification of a new industries or
industries that are starting to develop such as wireless telecommunications, and internet publishing that
illustrates the current economic direction.
Research model
This study uses unbalanced panel data to test the effect of leverage to firms’ vulnerability. Using logistic
regression the research model is:
𝑙𝑜𝑔 (𝑃𝑟𝑜𝑏(𝑉𝑈𝐿𝑁𝑖,𝑡)
1 − 𝑃𝑟𝑜𝑏(𝑉𝑈𝐿𝑁𝑖,𝑡))
= 𝛼 + 𝑏1𝐷𝐸𝑅𝑖,𝑡−1 + 𝑏2 𝑆𝐼𝑍𝐸𝑖,𝑡−1 + 𝑏3 𝑇𝐴𝑁𝐺𝑖,𝑡−1 + 𝑏4 𝐴𝐺𝐸𝑖,𝑡−1 + 𝑏5 𝐷𝐼𝑉𝐸𝑅𝑆𝑖,𝑡−1
+ 𝑏6 𝐼𝑁𝑇𝐸𝑅𝑖,𝑡−1 + 𝑏7 𝐵𝐺𝑅𝑂𝑈𝑃𝑖,𝑡−1 + 𝑒
(1)
Where VULN measures the probability of the firm being in a vulnerable condition. VULN is a dummy
that equals one if the firm is vulnerable, and zero otherwise. DER is leverage, proxied by debt to equity ratio.
Control variable SIZE is a firm size that is measured by Ln total asset; TANG is calculated as fixed asset divided
by total asset. AGE is natural logarithm number of year since the firm established to observation year, and
INTER is a dummy one for export oriented firm, zero otherwise. BGROUP is dummy one for the firm as a
member of conglomeration or business group, zero otherwise. Lagged leverage and control variable are used as
Berger and Bouwman (2013).
Variable definition
Leverage shows the degree of indebtness, i.e. the amount of debt to other accounts that is significant in the
statement of financial position (Gitman and Zutter, 2012). The debt to equity ratio is one ratio that is the center
of attention of creditors related to the high ratio that puts their loans at the risk of not being paid. This ratio
shows the amount of debt used to finance assets relative to equity. The measurement of this ratio is Debt to
Equity.
Vulnerability is measured by dummy variable, one for vulnerable, zero for other. A firm is vulnerable if
the Altman Emerging Market Score (EMS) is in the safe area in the pre-crisis period, then decreasing in the
crisis period. Altman EMS is a choice among several other measurements such as financial ratios, Altman Z-
Score (Altman, 1968), and credit rating. This score is said to have conformity with a trusted rating agency
(Alfaro et al., 2019; Altman, 2005). The Altman Z-score has a very good performance over the market model
(Chen et al., 2018). This is supported by research related to the use of this Z-score (Alfaro et al., 2019; Altman
et al., 2017; Citron and Taffler, 2004).
The crises in this study include the global financial crisis and industry crisis. Instead of using the whole
year, the duration of crises from the first year, second, and third year is used. Furthermore, additional analysis
will be provided by analyzing the effect of leverage on vulnerability in the industry crisis that is preceded by
the global crisis. Industry is said to be distressed when the median sales growth is negative. In the research of
Opler and Titman (1994) and Gopalan and Xie (2011), industries experience distress if the median sales growth
is negative and when the median stock return is below 30 percent. To adjust to the character of developing
markets, the criteria related to capital markets are ignored in this study (Eldomiaty, 2008; Ramjee and Gwatidzo,
2012). Previous research uses 2007-2009 as the context or year of the financial crisis (Burzala, 2016; Görg and
Spaliara, 2018; Kacperczyk and Schnabl, 2010). The crisis that year was different from the previous crisis,
namely the 1997-1998 Asian financial crisis. The 2007-2009 crisis originated from the largest and most
165
Leverage and Firms’ Vulnerability: Do Crises and Industry Matter?
influential economy, namely the United States, and brought the influence of this crisis to other countries in the
global market (Wang, 2014).
EMPIRICAL RESULTS
Descriptive statistics
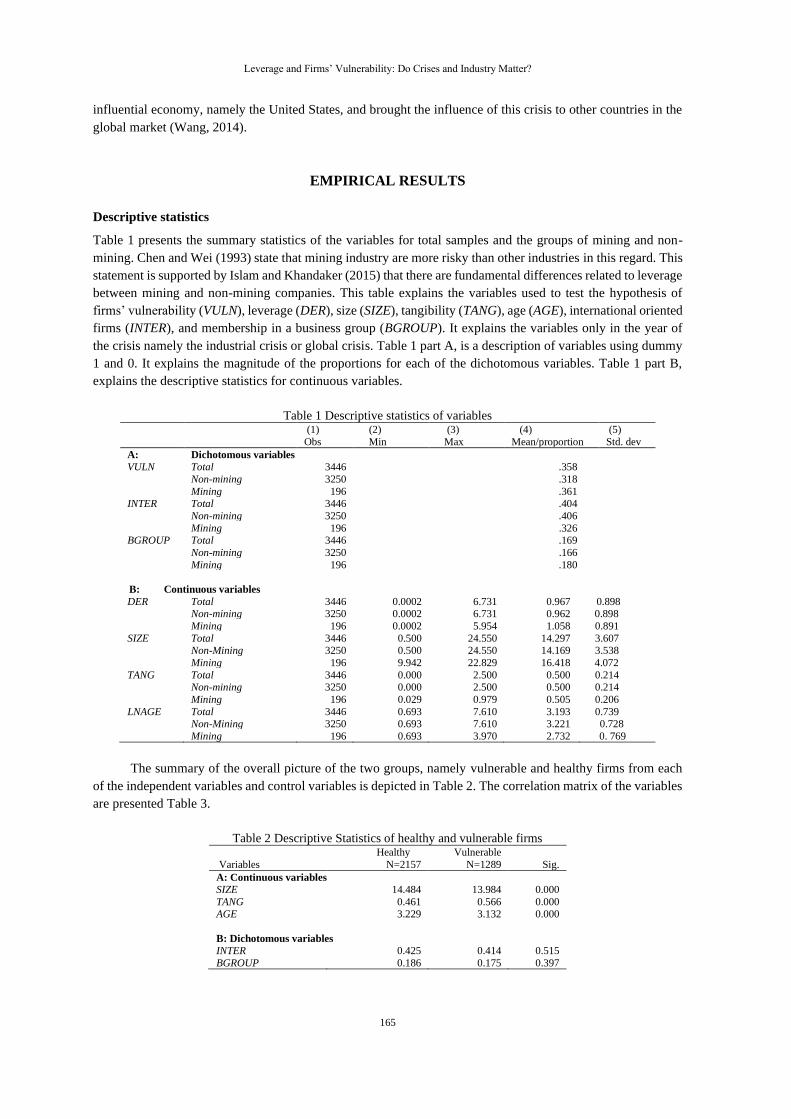
Table 1 presents the summary statistics of the variables for total samples and the groups of mining and non-
mining. Chen and Wei (1993) state that mining industry are more risky than other industries in this regard. This
statement is supported by Islam and Khandaker (2015) that there are fundamental differences related to leverage
between mining and non-mining companies. This table explains the variables used to test the hypothesis of
firms’ vulnerability (VULN), leverage (DER), size (SIZE), tangibility (TANG), age (AGE), international oriented
firms (INTER), and membership in a business group (BGROUP). It explains the variables only in the year of
the crisis namely the industrial crisis or global crisis. Table 1 part A, is a description of variables using dummy
1 and 0. It explains the magnitude of the proportions for each of the dichotomous variables. Table 1 part B,
explains the descriptive statistics for continuous variables.
Table 1 Descriptive statistics of variables (1) (2) (3) (4) (5)
Obs Min Max Mean/proportion Std. dev
A: Dichotomous variables
VULN Total 3446 .358
Non-mining 3250 .318
Mining 196 .361 INTER Total 3446 .404
Non-mining 3250 .406
Mining 196 .326 BGROUP Total 3446 .169
Non-mining 3250 .166
Mining 196 .180
B: Continuous variables
DER Total 3446 0.0002 6.731 0.967 0.898 Non-mining 3250 0.0002 6.731 0.962 0.898
Mining 196 0.0002 5.954 1.058 0.891
SIZE Total 3446 0.500 24.550 14.297 3.607 Non-Mining 3250 0.500 24.550 14.169 3.538
Mining 196 9.942 22.829 16.418 4.072
TANG Total 3446 0.000 2.500 0.500 0.214 Non-mining 3250 0.000 2.500 0.500 0.214
Mining 196 0.029 0.979 0.505 0.206
LNAGE Total 3446 0.693 7.610 3.193 0.739 Non-Mining 3250 0.693 7.610 3.221 0.728
Mining 196 0.693 3.970 2.732 0. 769
The summary of the overall picture of the two groups, namely vulnerable and healthy firms from each
of the independent variables and control variables is depicted in Table 2. The correlation matrix of the variables
are presented Table 3.
Table 2 Descriptive Statistics of healthy and vulnerable firms Healthy Vulnerable
Variables N=2157 N=1289 Sig.
A: Continuous variables
SIZE 14.484 13.984 0.000
TANG 0.461 0.566 0.000 AGE 3.229 3.132 0.000
B: Dichotomous variables INTER 0.425 0.414 0.515
BGROUP 0.186 0.175 0.397
166
International Journal of Economics and Management
Table 3 Variable Correlation FRAG DER SIZE TANG AGE INTER BGROUP
FRAG 1.0000
DER 0.3647 1.0000 SIZE -0.0670 0.1600 1.0000
TANG 0.2380 -0.1162 0.0558 1.0000
AGE -0.0634 -0.0259 0.1367 0.1269 1.0000 INTER -0.0111 -0.0997 -0.1410 -0.0579 0.0766 1.0000
BGROUP -0.0144 0.0788 0.3056 0.0953 0.0439 0.0791 1.0000
Table 2 illustrates the number of companies that in a period of crisis remained in good condition (2157
firm-year data), and 1289 firm-year data for companies in crisis experienced vulnerability. Part A is the average
description of each continuous variable and B is the description of the proportions for the dichotomous variable.
This proportion is the number of internationally oriented companies (INTER) to the total companies in each
healthy or vulnerable group. Likewise, the proportion of companies included in the business group (BGROUP)
to the total number of each healthy and vulnerable group. Part A shows that the average DER for the healthy
companies group is 0.714 while vulnerable firms are higher with an average of 1.391. The DER or leverage test
shows a significant difference between the two groups. The correlation of variables is presented in Table 3. In
general, the result shows a low correlation. The VIF has a low score at the value of 1.09 on average.
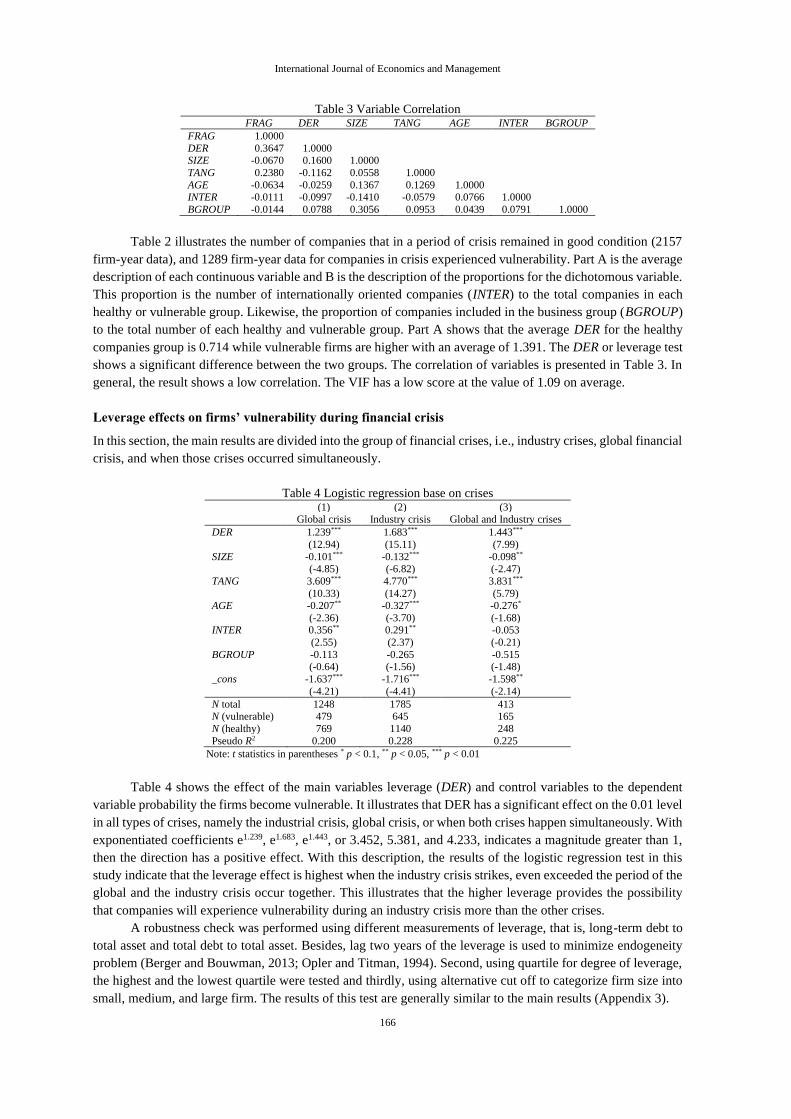
Leverage effects on firms’ vulnerability during financial crisis
In this section, the main results are divided into the group of financial crises, i.e., industry crises, global financial
crisis, and when those crises occurred simultaneously.
Table 4 Logistic regression base on crises (1) (2) (3) Global crisis Industry crisis Global and Industry crises
DER 1.239*** 1.683*** 1.443***
(12.94) (15.11) (7.99)
SIZE -0.101*** -0.132*** -0.098** (-4.85) (-6.82) (-2.47)
TANG 3.609*** 4.770*** 3.831***
(10.33) (14.27) (5.79) AGE -0.207** -0.327*** -0.276*
(-2.36) (-3.70) (-1.68) INTER 0.356** 0.291** -0.053
(2.55) (2.37) (-0.21)
BGROUP -0.113 -0.265 -0.515 (-0.64) (-1.56) (-1.48)
_cons -1.637*** -1.716*** -1.598**
(-4.21) (-4.41) (-2.14)
N total N (vulnerable)
N (healthy)
1248 479
769
1785 645
1140
413 165
248
Pseudo R2 0.200 0.228 0.225
Note: t statistics in parentheses * p < 0.1, ** p < 0.05, *** p < 0.01
Table 4 shows the effect of the main variables leverage (DER) and control variables to the dependent
variable probability the firms become vulnerable. It illustrates that DER has a significant effect on the 0.01 level
in all types of crises, namely the industrial crisis, global crisis, or when both crises happen simultaneously. With
exponentiated coefficients e1.239, e1.683, e1.443, or 3.452, 5.381, and 4.233, indicates a magnitude greater than 1,
then the direction has a positive effect. With this description, the results of the logistic regression test in this
study indicate that the leverage effect is highest when the industry crisis strikes, even exceeded the period of the
global and the industry crisis occur together. This illustrates that the higher leverage provides the possibility
that companies will experience vulnerability during an industry crisis more than the other crises.
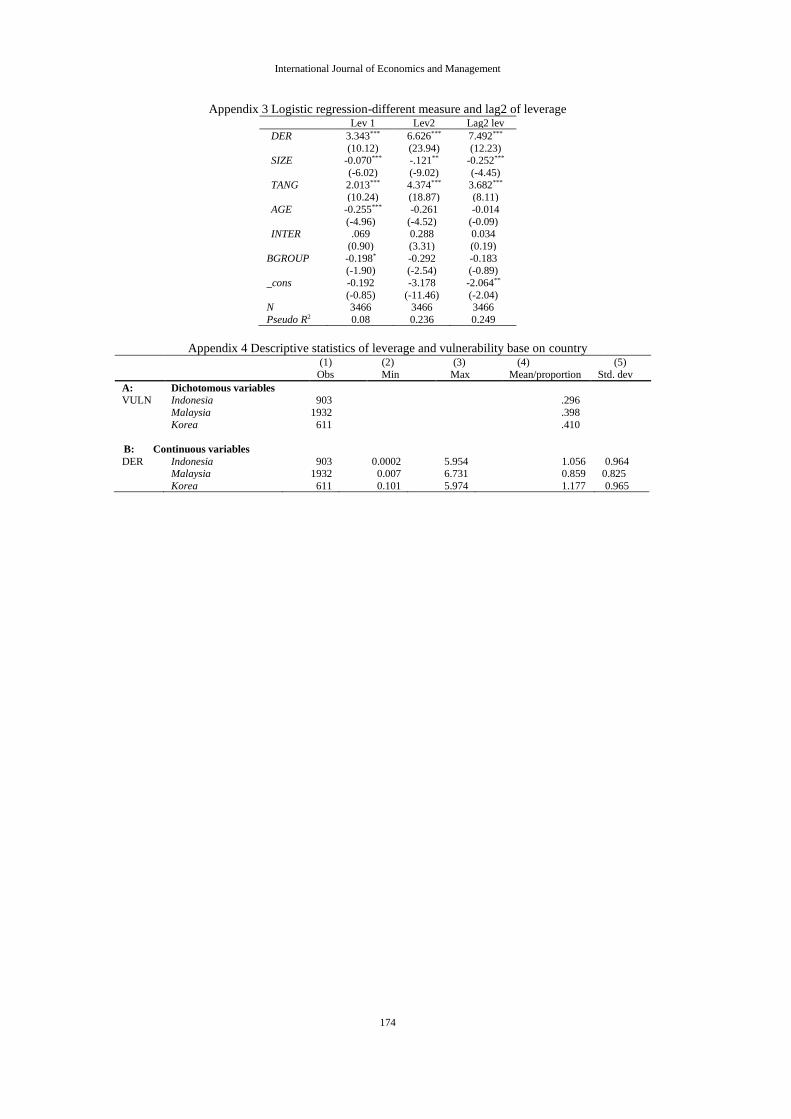
A robustness check was performed using different measurements of leverage, that is, long-term debt to
total asset and total debt to total asset. Besides, lag two years of the leverage is used to minimize endogeneity
problem (Berger and Bouwman, 2013; Opler and Titman, 1994). Second, using quartile for degree of leverage,
the highest and the lowest quartile were tested and thirdly, using alternative cut off to categorize firm size into
small, medium, and large firm. The results of this test are generally similar to the main results (Appendix 3).
167
Leverage and Firms’ Vulnerability: Do Crises and Industry Matter?
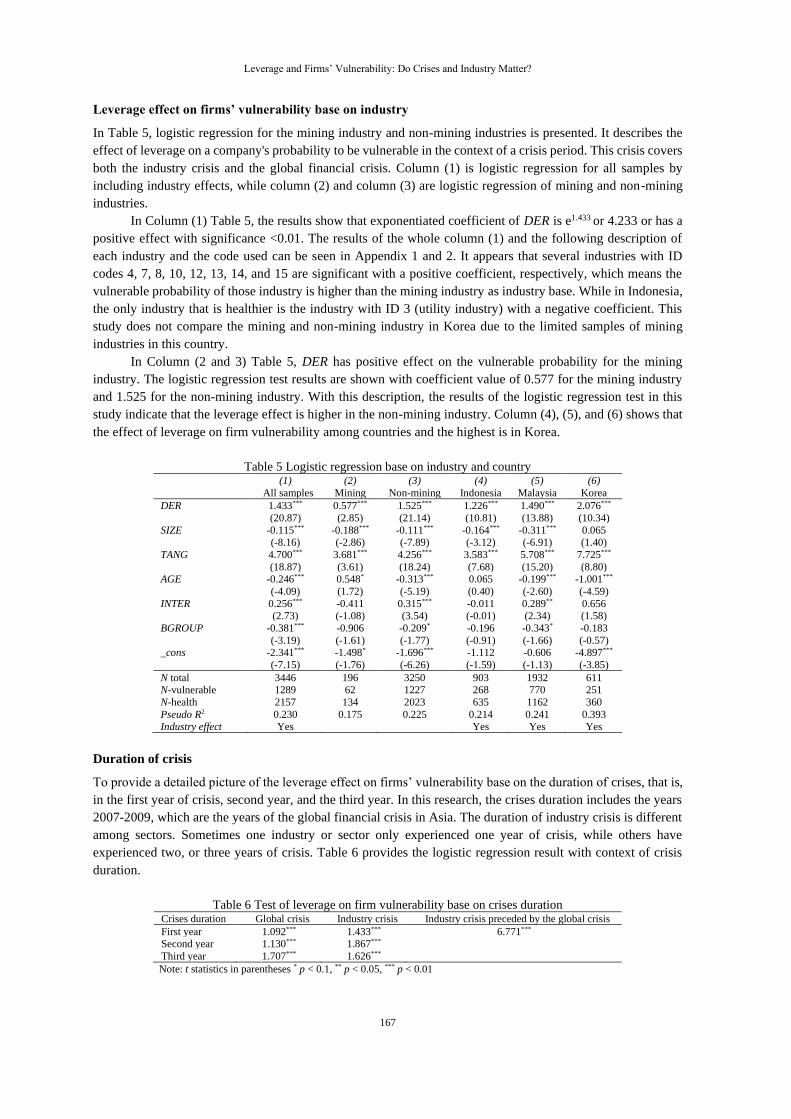
Leverage effect on firms’ vulnerability base on industry
In Table 5, logistic regression for the mining industry and non-mining industries is presented. It describes the
effect of leverage on a company's probability to be vulnerable in the context of a crisis period. This crisis covers
both the industry crisis and the global financial crisis. Column (1) is logistic regression for all samples by
including industry effects, while column (2) and column (3) are logistic regression of mining and non-mining
industries.
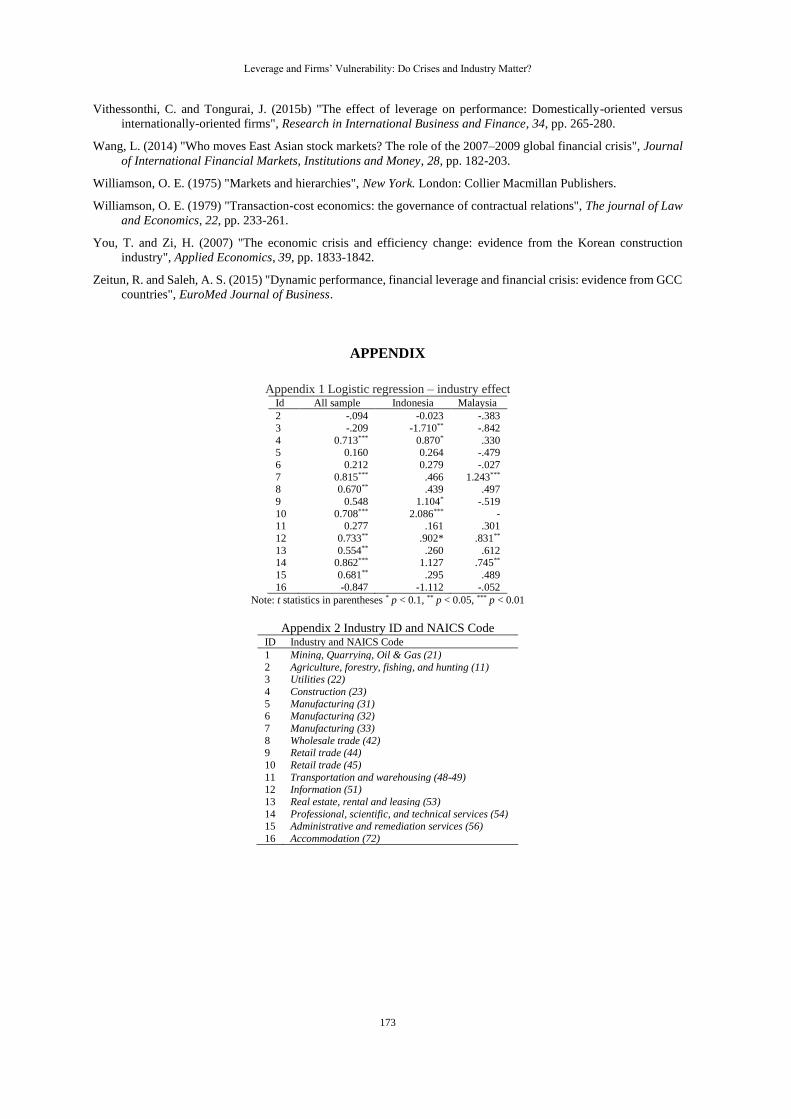
In Column (1) Table 5, the results show that exponentiated coefficient of DER is e1.433 or 4.233 or has a
positive effect with significance <0.01. The results of the whole column (1) and the following description of
each industry and the code used can be seen in Appendix 1 and 2. It appears that several industries with ID
codes 4, 7, 8, 10, 12, 13, 14, and 15 are significant with a positive coefficient, respectively, which means the
vulnerable probability of those industry is higher than the mining industry as industry base. While in Indonesia,
the only industry that is healthier is the industry with ID 3 (utility industry) with a negative coefficient. This
study does not compare the mining and non-mining industry in Korea due to the limited samples of mining
industries in this country.
In Column (2 and 3) Table 5, DER has positive effect on the vulnerable probability for the mining
industry. The logistic regression test results are shown with coefficient value of 0.577 for the mining industry
and 1.525 for the non-mining industry. With this description, the results of the logistic regression test in this
study indicate that the leverage effect is higher in the non-mining industry. Column (4), (5), and (6) shows that
the effect of leverage on firm vulnerability among countries and the highest is in Korea.
Table 5 Logistic regression base on industry and country (1) (2) (3) (4) (5) (6)
All samples Mining Non-mining Indonesia Malaysia Korea
DER 1.433*** 0.577*** 1.525*** 1.226*** 1.490*** 2.076***
(20.87) (2.85) (21.14) (10.81) (13.88) (10.34)
SIZE -0.115*** -0.188*** -0.111*** -0.164*** -0.311*** 0.065 (-8.16) (-2.86) (-7.89) (-3.12) (-6.91) (1.40)
TANG 4.700*** 3.681*** 4.256*** 3.583*** 5.708*** 7.725***
(18.87) (3.61) (18.24) (7.68) (15.20) (8.80) AGE -0.246*** 0.548* -0.313*** 0.065 -0.199*** -1.001***
(-4.09) (1.72) (-5.19) (0.40) (-2.60) (-4.59)
INTER 0.256*** -0.411 0.315*** -0.011 0.289** 0.656 (2.73) (-1.08) (3.54) (-0.01) (2.34) (1.58)
BGROUP -0.381*** -0.906 -0.209* -0.196 -0.343* -0.183
(-3.19) (-1.61) (-1.77) (-0.91) (-1.66) (-0.57) _cons -2.341*** -1.498* -1.696*** -1.112 -0.606 -4.897***
(-7.15) (-1.76) (-6.26) (-1.59) (-1.13) (-3.85)
N total N-vulnerable
N-health
3446 1289
2157
196 62
134
3250 1227
2023
903 268
635
1932 770
1162
611 251
360
Pseudo R2 Industry effect
0.230 Yes
0.175
0.225
0.214 Yes
0.241 Yes
0.393 Yes
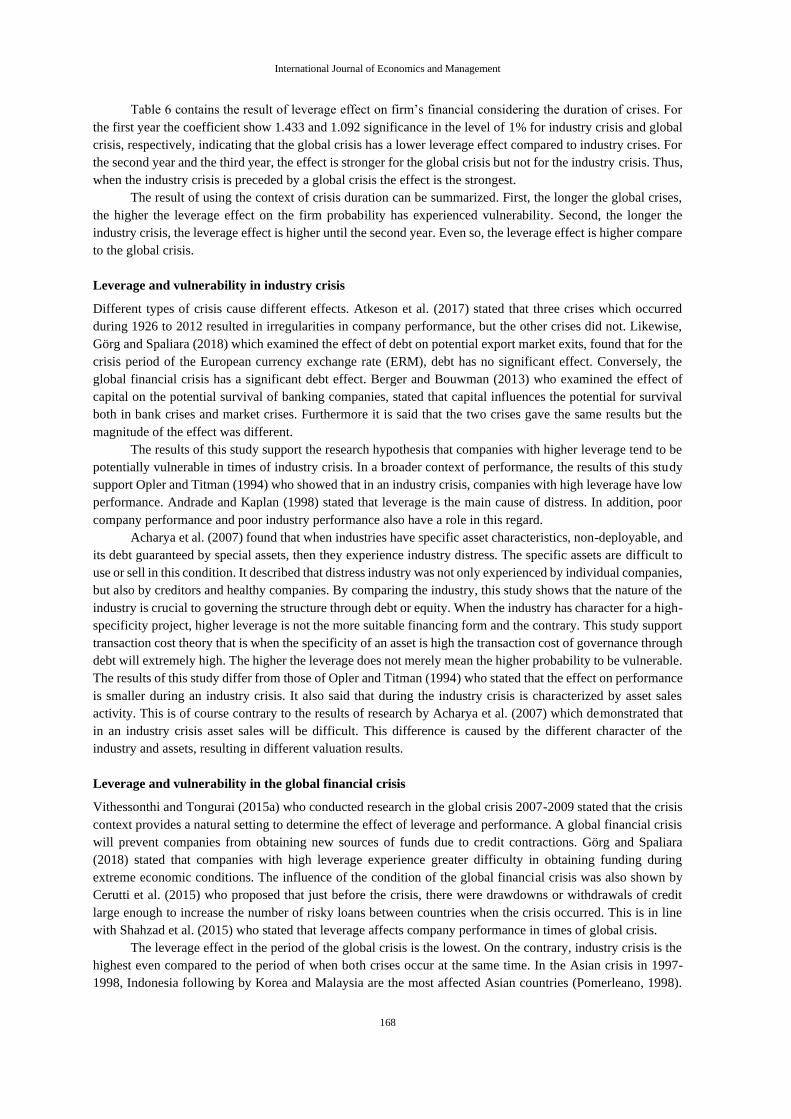
Duration of crisis
To provide a detailed picture of the leverage effect on firms’ vulnerability base on the duration of crises, that is,
in the first year of crisis, second year, and the third year. In this research, the crises duration includes the years
2007-2009, which are the years of the global financial crisis in Asia. The duration of industry crisis is different
among sectors. Sometimes one industry or sector only experienced one year of crisis, while others have
experienced two, or three years of crisis. Table 6 provides the logistic regression result with context of crisis
duration.
Table 6 Test of leverage on firm vulnerability base on crises duration Crises duration Global crisis Industry crisis Industry crisis preceded by the global crisis
First year 1.092*** 1.433*** 6.771*** Second year 1.130*** 1.867***
Third year 1.707*** 1.626***
Note: t statistics in parentheses * p < 0.1, ** p < 0.05, *** p < 0.01
168
International Journal of Economics and Management
Table 6 contains the result of leverage effect on firm’s financial considering the duration of crises. For
the first year the coefficient show 1.433 and 1.092 significance in the level of 1% for industry crisis and global
crisis, respectively, indicating that the global crisis has a lower leverage effect compared to industry crises. For
the second year and the third year, the effect is stronger for the global crisis but not for the industry crisis. Thus,
when the industry crisis is preceded by a global crisis the effect is the strongest.
The result of using the context of crisis duration can be summarized. First, the longer the global crises,
the higher the leverage effect on the firm probability has experienced vulnerability. Second, the longer the
industry crisis, the leverage effect is higher until the second year. Even so, the leverage effect is higher compare
to the global crisis.
Leverage and vulnerability in industry crisis
Different types of crisis cause different effects. Atkeson et al. (2017) stated that three crises which occurred
during 1926 to 2012 resulted in irregularities in company performance, but the other crises did not. Likewise,
Görg and Spaliara (2018) which examined the effect of debt on potential export market exits, found that for the
crisis period of the European currency exchange rate (ERM), debt has no significant effect. Conversely, the
global financial crisis has a significant debt effect. Berger and Bouwman (2013) who examined the effect of
capital on the potential survival of banking companies, stated that capital influences the potential for survival
both in bank crises and market crises. Furthermore it is said that the two crises gave the same results but the
magnitude of the effect was different.
The results of this study support the research hypothesis that companies with higher leverage tend to be
potentially vulnerable in times of industry crisis. In a broader context of performance, the results of this study
support Opler and Titman (1994) who showed that in an industry crisis, companies with high leverage have low
performance. Andrade and Kaplan (1998) stated that leverage is the main cause of distress. In addition, poor
company performance and poor industry performance also have a role in this regard.
Acharya et al. (2007) found that when industries have specific asset characteristics, non-deployable, and
its debt guaranteed by special assets, then they experience industry distress. The specific assets are difficult to
use or sell in this condition. It described that distress industry was not only experienced by individual companies,
but also by creditors and healthy companies. By comparing the industry, this study shows that the nature of the
industry is crucial to governing the structure through debt or equity. When the industry has character for a high-
specificity project, higher leverage is not the more suitable financing form and the contrary. This study support
transaction cost theory that is when the specificity of an asset is high the transaction cost of governance through
debt will extremely high. The higher the leverage does not merely mean the higher probability to be vulnerable.
The results of this study differ from those of Opler and Titman (1994) who stated that the effect on performance
is smaller during an industry crisis. It also said that during the industry crisis is characterized by asset sales
activity. This is of course contrary to the results of research by Acharya et al. (2007) which demonstrated that
in an industry crisis asset sales will be difficult. This difference is caused by the different character of the
industry and assets, resulting in different valuation results.
Leverage and vulnerability in the global financial crisis
Vithessonthi and Tongurai (2015a) who conducted research in the global crisis 2007-2009 stated that the crisis
context provides a natural setting to determine the effect of leverage and performance. A global financial crisis
will prevent companies from obtaining new sources of funds due to credit contractions. Görg and Spaliara
(2018) stated that companies with high leverage experience greater difficulty in obtaining funding during
extreme economic conditions. The influence of the condition of the global financial crisis was also shown by
Cerutti et al. (2015) who proposed that just before the crisis, there were drawdowns or withdrawals of credit
large enough to increase the number of risky loans between countries when the crisis occurred. This is in line
with Shahzad et al. (2015) who stated that leverage affects company performance in times of global crisis.
The leverage effect in the period of the global crisis is the lowest. On the contrary, industry crisis is the
highest even compared to the period of when both crises occur at the same time. In the Asian crisis in 1997-
1998, Indonesia following by Korea and Malaysia are the most affected Asian countries (Pomerleano, 1998).
169
Leverage and Firms’ Vulnerability: Do Crises and Industry Matter?
Learning from this experience, several developing countries began to prepare themselves to face the crisis
including international portfolio reserves to anticipate the cessation of foreign funding (Forbes et al., 2012).
During the global crisis, the Indonesian economy was affected by the global economic turmoil, but
overall it was still able to show performance that was nearly equal to the previous year (Indonesia, 2008).
Indonesia's economy spatially began to diversify in 2009. The manufacturing sector in Java grew quite high,
thereby reducing the impact of the recession on the weakening of the economic sector outside Java (Indonesia,
2009). Basri and Rahardja (2010) stated that the impact of the global crisis was relatively smaller compared to
Malaysia and Thailand. In this study, the effect of leverage on vulnerability is Indonesia is the lowest among
Malaysia and Korea. After falling into a recession in 1997/1998 and a country with the highest number of
companies experiencing financial difficulties among other Asian countries, Indonesia was prepared for this
global crisis, especially in the financial sector include regulation of leverage through fiscal policy. It regulates
deductible interest expense related to the composition of debt to equity. The regulation has already considered
the nature of the industry. Unfortunately, the rapid changing of technology and consumption pattern, have to
consider the new and emerging industries is needed. This study shows that most of those industries relatively
vulnerable compare to the mining industry.
Leverage and vulnerability in the non-mining industry
Generally, a higher average level of leverage in the non-mining sector has a higher chance of experiencing
vulnerability than the mining industry. In the case of Indonesia, the utility industry tends to have lower
vulnerability than the mining industry, even though the average leverage in this industry is higher. Roberts and
Zurawski (2016) state that leverage in this industry tends to be higher than in other industries. The characteristics
of products in this industry tend to be important community needs. This condition allows consumers not to
reduce consumption or change consumption patterns in times of crisis. This industry is also said to have a stable
income level (Alves Amaral-Baptista et al., 2011), while the research of Acharya et al. (2007) stated that the
utilities industry has a high recovery rate after facing a crisis.
Some industries show a higher potential for vulnerability than the industry used as a basis for testing,
namely the mining industry. The retail industry both stores and non-stores as well as the information industry,
the potential for corporate vulnerability is higher than the mining industry. For the retail industry, the average
degree of leverage is also higher than the mining industry. Such conditions certainly encourage the potential for
vulnerability in this industry to be even higher. The retail industry is greatly affected by the shift in consumption
patterns. In this sector there is migration from physical to online or possibly in the future switching to superstores
or supercenter (Hortaçsu and Syverson, 2015).
For the information industry, which is dominated by companies engaged in communication, media and
TV, it is also said to be sensitive to change. Doyle (2016) stated that this industry is highly influenced by
technological change. Internet-based technology not only causes evolution but also becomes a confounding
factor in existing conditions. When viewed from the crisis that occurred, in fact the three industries did not go
through the number of industrial crises more than the mining industry. Empirical evidence of this study states
that the character of the industry allows for higher potential vulnerabilities than the mining industry.
The construction and professional industries also have the potential to be more vulnerable than the
mining industry. The construction industry is said to be quite difficult to achieve efficiency in times of crisis.
The industry also has problems in choosing input compositions that are able to minimize long-term costs
(Kapelko et al., 2014; You and Zi, 2007). In non-tradable sectors such as the construction industry, increasing
leverage is very important (Alfaro et al., 2019).
Professional industries have a similar character to the information industry that is innovative and
technology-based. This makes it possible to have a fairly high cost of research and provide the same possibilities
when facing a crisis. Dekoulou and Trivellas (2014) stated that industries engaged in advertising and media
such as professional industries, face high competition, financial instability combined with rapid technological
evolution, and endless diversification of consumers. Such conditions certainly require investment in human
resources and new technologies on an ongoing basis. Miao (2005) claimed that companies tend to have a lower
level of leverage if the industry is associated with high technology. These industry characteristics are more
exposed to high transaction costs, which of course will have lower risk if funded with a larger share of equity.
170
International Journal of Economics and Management
CONCLUSION
This research empirically addresses the following results. First, the companies with higher leverage who
experience both global and industry crises tend to experience financial vulnerability. Second, in the industry
crisis, the effect of leverage on vulnerability is higher. A further concern of the industry characteristic is needed
particularly when it is highly dominated by changes in consumption patterns, innovation, and technology such
as retail, information, and professional industries. On the contrary, a specific industry with higher leverage
needed by the wider community does not experience changes in consumption, innovation, or technology, less
vulnerable in times of crises. The results of this study support the theory of Transaction Cost Economics. When
the specificity of assets of the industry is high, the transaction cost of governance through debt will be extremely
high.
Arising from the measurement of vulnerability, which considers pre-crisis financial conditions, it is
possible to differentiate the vulnerable firms from those of the long-term inefficient firms. This study may assist
regulators in crafting or evaluating the fiscal policy relate to leverage or other treatment for these different types
of firms and industries. Further research needs to pay attention to differentiate vulnerable firms with long-term
inefficient firms that might need distinct determinants.
ACKNOWLEDGMENT
The authors thank the anonymous referee, Andry Irwanto, as a supervisor in this study. This study was supported
by Airlangga University (Faculty Research Grant scheme).
REFERENCES
Acharya, V. V., Bharath, S. T. and Srinivasan, A. (2007) "Does industry-wide distress affect defaulted firms?
Evidence from creditor recoveries", Journal of Financial Economics, 85, pp. 787-821.
Alfaro, L., Asis, G., Chari, A. and Panizza, U. (2019) "Corporate debt, firm size and financial fragility in emerging
markets", Journal of International Economics, pp. 118, 1-19.
Altman, E. I. (1968) "Financial ratios, discriminant analysis and the prediction of corporate bankruptcy", The Journal
of Finance, 23, pp. 589-609.
Altman, E. I. (2005) "An emerging market credit scoring system for corporate bonds", Emerging Markets Review, 6,
pp. 311-323.
Altman, E. I., Iwanicz Drozdowska, M., Laitinen, E. K. and Suvas, A. (2017) "Financial distress prediction in an
international context: A review and empirical analysis of Altman's Z-Score Model", Journal of International
Financial Management & Accounting, 28, pp. 131-171.
Alves Amaral-Baptista, M., Cabús Klotzle, M. and Campelo De Melo, M. A. (2011) "CEO duality and firm
performance in Brazil: evidence from 2008", Revista Pensamento Contemporâneo em Administração, 5.
Andrade, G. and Kaplan, S. N. (1998) "How costly is financial (not economic) distress? Evidence from highly
leveraged transactions that became distressed", The Journal of Finance, 53, pp. 1443-1493.
Arend, R. J. (2009) "Industry effects and firm effects: No effect is an island", Journal of Business Research, 62, pp.
651-659.
Ashraf, B. N., Zheng, C., Jiang, C. and Qian, N. (2020) "Capital regulation, deposit insurance and bank risk:
International evidence from normal and crisis periods", Research in International Business and Finance, 52, p.
101188.
Atkeson, A. G., Eisfeldt, A. L. and Weill, P.-O. (2017) "Measuring the financial soundness of US firms, 1926–2012",
Research in Economics, 71, pp. 613-635.
171
Leverage and Firms’ Vulnerability: Do Crises and Industry Matter?
Balakrishnan, S. and Fox, I. (1993) "Asset specificity, firm heterogeneity and capital structure", Strategic
Management Journal, 14, pp. 3-16.
Basri, M. C. and Rahardja, S. (2010) "The Indonesian Economy amidst the Global Crisis: Good Policy and Good
Luck", ASEAN Economic Bulletin, 27, pp. 77-97.
Berger, A. and Bouwman, C. H. S. (2013) "How does capital affect bank performance during financial crises?",
Journal of Financial Economics, 109, pp. 146-176.
Burzala, M. M. (2016) "Contagion effects in selected European capital markets during the financial crisis of 2007–
2009", Research in International Business and Finance, 37, pp. 556-571.
Calandro Jr, J. (2007) "Considering the utility of Altman's Z-score as a strategic assessment and performance
management tool", Strategy & Leadership, 35, pp. 37-43.
Campello, M. (2006) "Capital structure and product markets interactions: evidence from business cycles", Journal of
Financial Economics, 68, pp. 353-378.
Cerutti, E., Hale, G. and Minoiu, C. (2015) "Financial crises and the composition of cross-border lending", Journal
of International Money and Finance, 52, pp. 60-81.
Chen, J., De Cesari, A., Hill, P. and Ozkan, N. (2018) "Initial compensation contracts for new executives and financial
distress risk: An empirical investigation of UK firms", Journal of Corporate Finance, 48, pp. 292-313.
Chen, K. C. and Wei, K. J. (1993) "Creditors' decisions to waive violations of accounting-based debt covenants",
Accounting review, pp. 218-232.
Citron, D. B. and Taffler, R. J. (2004) "The comparative impact of an audit report standard and an audit going-concern
standard on going-concern disclosure rates". Auditing: A Journal of Practice & Theory, 23, pp. 119-130.
Claessens, S. and Kose, M. A. (2013) "Financial Crises Explanations, Types, and Implications", International
Monetary Fund.
Claessens, S., Djankov, S. and Klapper, L. (2000) "The role and functioning of business groups in east Asia and
Chile", Revista Abante, 3, pp. 97-107.
Coase, R. H. (1937) "The nature of the firm", Economica, 4, pp. 386-405.
Dekoulou, P. and Trivellas, P. (2014) "Learning Organization in Greek Advertising and Media Industry: A way to
face crisis and gain sustainable competitive advantage", Procedia-Social and Behavioral Sciences, 148, pp. 338-
347.
Dodd, O., Kalimipalli, M. and Chan, W. (2021) "Evaluating corporate credit risks in emerging markets", International
Review of Financial Analysis, 73, p. 101610.
Doyle, G. (2016) "Digitization and changing windowing strategies in the television industry: negotiating new
windows on the world", Television & new media, 17, pp. 629-645.
Eldomiaty, T. I. (2008) "Determinants of corporate capital structure: evidence from an emerging economy",
International Journal of Commerce and Management, 17, pp. 25-43.
Forbes, K., Frankel, J. and Engel, C. (2012) "Introduction to special issue on the global financial crisis", Journal of
International Economics, 2, pp. 215-218.
Fosu, S., Danso, A., Ahmad, W. and Coffie, W. (2016) "Information asymmetry, leverage and firm value: Do crisis
and growth matter?", International Review of Financial Analysis, 46, pp. 140-150.
Gitman, L. J. and Zutter, C. J. (2012) "Principles of managerial finance", Prentice Hall.
Gopalan, R. and Xie, K. (2011) "Conglomerates and industry distress", Review of Financial Studies, hhr060.
Görg, H. and Spaliara, M.-E. (2018).= "Export market exit and financial health in crises periods", Journal of Banking
& Finance, 87, pp. 150-163.
Haron, R. and Haron, R. (2016) "Do Indonesian firms practice target capital structure? A dynamic approach", Journal
of Asia Business Studies, 10, pp. 318-334.
Hill, H. and Shiraishi, T. (2007) "Indonesia after the Asian crisis". Asian Economic Policy Review, 2, pp, 123-141.
Hortaçsu, A. and Syverson, C. (2015) "The ongoing evolution of US retail: A format tug-of-war", Journal of
Economic Perspectives, 29, pp. 89-112.
Hossain, A. T. and Nguyen, D. X. (2016) "Capital structure, firm performance and the recent financial crisis", Journal
of Accounting and Finance, 16, p.76.
172
International Journal of Economics and Management
Indonesia, B. (2008) "Indonesia Bank Annual Report", Bank Indonesia.
Indonesia, B. (2009) "Annual Indonesia Economics Report", Bank Indonesia.
Islam, S. Z. and Khandaker, S. (2015) "Firm leverage decisions: Does industry matter?", The North American Journal
of Economics and Finance, 31, pp. 94-107.
Kacperczyk, M. and Schnabl, P. (2010) "When safe proved risky: commercial paper during the financial crisis of
2007–2009", The Journal of economic perspectives, 24, pp. 29-50.
Kapelko, M., Oude Lansink, A. and Stefanou, S. E. (2014) "Assessing dynamic inefficiency of the Spanish
construction sector pre- and post-financial crisis", European Journal of Operational Research, 237, pp. 349-
357.
Kochhar, R. (1996) "Explaining firm capital structure: The role of agency theory vs. transaction cost economics",
Strategic Management Journal, pp. 713-728.
Le, T. P. V. and Phan, T. B. N. (2017) "Capital structure and firm performance: Empirical evidence from a small
transition country", Research in International Business and Finance, 42, pp. 710-726.
Männasoo, K., Maripuu, P. and Hazak, A. (2017) "Investments, Credit, and Corporate Financial Distress: Evidence
from Central and Eastern Europe", Emerging Markets Finance and Trade.
Margaritis, D. and Psillaki, M. (2007) "Capital structure and firm efficiency", Journal of Business Finance &
Accounting, 34, pp. 1447-1469.
Matsumoto, Y. (2007) "Financial Fragility and Instability in Indonesia", Oxon: outledge
Miao, J. (2005) "Optimal capital structure and industry dynamics", The Journal of Finance, 60, pp. 2621-2659.
Molina, C. A. (2005) "Are firms underleveraged? An examination of the effect of leverage on default probabilities",
The Journal of Finance, 60, pp. 1427-1459.
Moosa, I. and Li, L. (2012) "Firm-specific factors as determinants of capital structure: evidence from Indonesia",
Review of Pacific Basin Financial Markets and Policies, 15, p. 1150007.
Muradoğlu, Y. G. and Sivaprasad, S. (2012) "Capital structure and abnormal returns", International Business Review,
21, pp. 328-341.
O'brien, J. P., David, P., Yoshikawa, T. and Delios, A. (2014) "How capital structure influences diversification
performance: A transaction cost perspective", Strategic Management Journal, 35, pp. 1013-1031.
Ofek, E. (1993) "Capital structure and firm response to poor performance: An empirical analysis", Journal of
Financial Economics, 34, pp. 3-30.
Olaniyi, Elelu and Abdulsalam (2015) "Impact of Capital Structure on Corporate Performance: A Pre and Post Crisis
Evaluation of Selected Companies in US", International Journal of Accounting Research, 2, pp. 1-20.
Opler, T. C. and Titman, S. (1994) "Financial distress and corporate performance", The Journal of Finance, 49, pp.
1015-1040.
Pomerleano, M. (1998) "The East Asia crisis and corporate finances: The untold micro story", World Bank
Publications.
Rajan, R. G. and Zingales, L. (1995) "What do we know about capital structure? Some evidence from international
data", The Journal of Finance, 50, pp. 1421-1460.
Ramjee, A. and Gwatidzo, T. (2012) "Dynamics in capital structure determinants in South Africa", Meditari
Accountancy Research, 20, pp. 52-67.
Roberts, I. and Zurawski, A. (2016) "12. changing patterns of corporate leverage in China: evidence from listed
companies", China’s New Sources of Economic Growth, 271.
Salim, M. and Yadav, R. (2012) "Capital structure and firm performance: Evidence from Malaysian listed companies",
Procedia-Social and Behavioral Sciences, 65, pp. 156-166.
Shahzad, S. J. H., Ali, P., Ahmad, T. and Ali, S. (2015) "Financial leverage and corporate performance: Does financial
crisis owe an explanation?", Pakistan Journal of Statistics and Operation Research, 11, pp. 67-90.
Singhal, R. and Zhu, Y. E. (2013) "Bankruptcy risk, costs and corporate diversification", Journal of Banking &
Finance, 37, pp. 1475-1489.
Vithessonthi, C. and Tongurai, J. (2015a) "The effect of firm size on the leverage–performance relationship during
the financial crisis of 2007–2009", Journal of Multinational Financial Management, 29, pp.1-29.
173
Leverage and Firms’ Vulnerability: Do Crises and Industry Matter?
Vithessonthi, C. and Tongurai, J. (2015b) "The effect of leverage on performance: Domestically-oriented versus
internationally-oriented firms", Research in International Business and Finance, 34, pp. 265-280.
Wang, L. (2014) "Who moves East Asian stock markets? The role of the 2007–2009 global financial crisis", Journal
of International Financial Markets, Institutions and Money, 28, pp. 182-203.
Williamson, O. E. (1975) "Markets and hierarchies", New York. London: Collier Macmillan Publishers.
Williamson, O. E. (1979) "Transaction-cost economics: the governance of contractual relations", The journal of Law
and Economics, 22, pp. 233-261.
You, T. and Zi, H. (2007) "The economic crisis and efficiency change: evidence from the Korean construction
industry", Applied Economics, 39, pp. 1833-1842.
Zeitun, R. and Saleh, A. S. (2015) "Dynamic performance, financial leverage and financial crisis: evidence from GCC
countries", EuroMed Journal of Business.
APPENDIX
Appendix 1 Logistic regression – industry effect Id All sample Indonesia Malaysia
2 -.094 -0.023 -.383
3 -.209 -1.710** -.842
4 0.713*** 0.870* .330 5 0.160 0.264 -.479
6 0.212 0.279 -.027
7 0.815*** .466 1.243*** 8 0.670** .439 .497
9 0.548 1.104* -.519
10 0.708*** 2.086*** - 11
12
0.277
0.733**
.161
.902*
.301
.831**
13 14
15
16
0.554** 0.862***
0.681**
-0.847
.260 1.127
.295
-1.112
.612 .745**
.489
-.052
Note: t statistics in parentheses * p < 0.1, ** p < 0.05, *** p < 0.01
Appendix 2 Industry ID and NAICS Code ID Industry and NAICS Code
1 Mining, Quarrying, Oil & Gas (21)
2 Agriculture, forestry, fishing, and hunting (11) 3 Utilities (22)
4 Construction (23)
5 Manufacturing (31) 6 Manufacturing (32)
7 Manufacturing (33)
8 Wholesale trade (42) 9 Retail trade (44)
10 Retail trade (45)
11 Transportation and warehousing (48-49) 12 Information (51)
13 Real estate, rental and leasing (53)
14 Professional, scientific, and technical services (54)
15 Administrative and remediation services (56)
16 Accommodation (72)
174
International Journal of Economics and Management
Appendix 3 Logistic regression-different measure and lag2 of leverage Lev 1 Lev2 Lag2 lev
DER 3.343*** 6.626*** 7.492***
(10.12) (23.94) (12.23) SIZE -0.070*** -.121** -0.252***
(-6.02) (-9.02) (-4.45)
TANG 2.013*** 4.374*** 3.682*** (10.24) (18.87) (8.11)
AGE -0.255*** -0.261 -0.014
(-4.96) (-4.52) (-0.09) INTER .069 0.288 0.034
(0.90) (3.31) (0.19)
BGROUP -0.198* -0.292 -0.183 (-1.90) (-2.54) (-0.89)
_cons -0.192 -3.178 -2.064**
N
Pseudo R2
(-0.85) 3466
0.08
(-11.46) 3466
0.236
(-2.04) 3466
0.249
Appendix 4 Descriptive statistics of leverage and vulnerability base on country (1) (2) (3) (4) (5)
Obs Min Max Mean/proportion Std. dev
A: Dichotomous variables
VULN Indonesia 903 .296
Malaysia 1932 .398
Korea 611 .410
B: Continuous variables
DER Indonesia 903 0.0002 5.954 1.056 0.964 Malaysia 1932 0.007 6.731 0.859 0.825
Korea 611 0.101 5.974 1.177 0.965