d l , Thompson - Stanford University
257
U.S. Agricu The 2007 F
Transcript of d l , Thompson - Stanford University

Edito
rs: K
aush
Arh
a, T
im Jo
sling
, Dan
iel A
. Sum
ner,
and
Barto
n H
. Tho
mps
on
U.S
. Agr
icul
tura
l Pol
icy
and
The
200
7 Fa
rm B
ill
WO
OD
S IN
STIT
UT
E F
OR T
HE E
NV
IRO
NM
EN
T
EN
CIN
A M
OD
UL
AR
C,
429
AR
GU
EL
LO
WA
Y,
ST
AN
FO
RD
, C
A 9
4305
-603
0

U.S. Agricultural Policy and the 2007 Farm Bill
Kaush Arha, Tim Josling, Daniel A. Sumner, & Barton H. Thompson

ii WOODS INSTITUTE FOR THE ENVIRONMENT | STANFORD UNIVERSITY

U.S. Agricultural Policy and the 2007 Farm Bill iii
TO MY GRANDFATHER—KESRI SINGH, A GENTLEMAN FARMER, WHO INSTILLED IN ME
A LOVE OF FARMING AND NATURE.
—KAUSH ARHA

iv WOODS INSTITUTE FOR THE ENVIRONMENT | STANFORD UNIVERSITY
ACKNOWLEDGMENTS
In 2006, the Stanford Law School and the Woods Institute for the Environment at Stanford University convened a National Forum to discuss U.S. Agricultural Policy and the 2007 Farm Bill. The School of Environmental Studies at Yale University and the American Farmland Trust joined Stanford as co-sponsors. The topic of the Forum was defined as “conserving ecological integrity and economic resilience of American Farmlands.” The Forum chose to focus on farm commodity payments and conservation policies. Three workshops were convened that brought together eminent scholars and practitioners in the field of U.S. and world agricultural policy. The purpose was to have a spirited debate on the pressing topics and provide reasoned background information to policy makers and interested members of the general public on the salient issues. This volume represents the papers that were written for the workshops and then later improved by the workshop discussions. The views expressed in this book represent the opinions of the authors alone and not of the sponsoring organizations or the Forum participants.
The Forum would not have been successful without the considerable commitment and enthusiasm of its participants. The rich give and take in a cordial atmosphere at the Forum was made possible by the professional and constructive manner in which the volunteer presenters, commentators, and facilitators steered the discussion. The participants’ names are listed below, and we extend our sincere gratitude to all.
The Forum greatly benefited from its partnership with the American Farmland Trust and the support of its President, Ralph Grossi. Financial support for the Forum was provided by the William and Flora Hewlett Foundation and the U.S. Department of Agriculture. The Altria Group, The Boone & Crockett Club, and the Wine Institute graciously hosted receptions in conjunction with the third workshop of the Forum.
In addition to the authors who wrote the chapters in this book, we are indebted to the following individuals who played key roles through the Forum and were generous with their time and comments on the manuscript: Mark Rey, Tom Dorr, Joe Glauber, Neil Conklin, John Hardin, Ron Warfield, Al Montna, Greg Schilwachter, Rob Johnson, Edwin Young, A.G. Kawamura, Roger Claasen, and David Zilberman.
The success of the Forum owed much to the dexterous logistical assistance of Trish Gertridge and her staff at Stanford Law School and William Kuckuck and his staff at American Farmland Trust. In particular, Ilan Gutherz of American Farmland Trust provided valuable service. The publication of this book would not have been possible without the able guidance, support and skills of Patty Rosewater and her staff at the Woods Institute for the Environment, Susan Wels, and Annabelle Ison. To all those who contributed to the Forum and the publication of this book, we offer heartfelt gratitude.
Kaush ArhaTim Josling Daniel A. SumnerBarton H. Thompson
U.S. Agricultural Policy and the 2007 Farm Bill v
NATIONAL FORUM ON U.S. AGRICULTURAL POLICY AND THE FARM BILL: CONSERVING THE ECOLOGICAL INTEGRITY AND ECONOMIC RESILIENCE OF AMERICAN WORKING LANDS
Participants in Forum Workshops1
Kym Anderson World BankKaush Arha Stanford UniversityRoberto Azevado Ministerio das Relacoes Exteriores, BrasilDavid Baldock The Institute for European Environmental PolicyJohn Beghin Iowa State UniversityDavid Blandford Pennsylvania State UniversityMary Bohman USDA—Economic Research Service Jim Boyd Resources For the FutureMike Chrisman California Resources AgencyPoul Christoffersen European CommissionNeilson Conklin USDA—Economic Research Service Joseph Cooper White House Council of Economic AdvisorsDarren Coppock National Association of Wheat GrowersCraig Cox Soil and Water Conservation SocietyGretchen Daily Stanford University Flavio S. Damico Ministerio das Relacoes Exteriores, BrasilOtto Doering Purdue UniversityThomas Dorr USDA—Rural DevelopmentMark Eigenraam Department of Primary Industries, VictoriaJeff Eisenberg National Cattlemen’s and Beef Producers AssociationDaniel Esty Yale UniversityJohn Etchepare Wyoming Department of Agriculture Scott Faber Environmental DefenseFranz Fischler Fischler Associates Cornelius Gallagher Bank of AmericaBruce Gardner University of MarylandMichael Gifford International Food and Agriculture Trade Policy CouncilJoseph Glauber USDA—Office of the Chief Economist Suzie Greenlaugh World Resources InstituteDan Griswold Cato Institute Ralph Grossi American Farmland TrustJim Grueff Decision Leaders, LLCMichael Hammell European Commission Anastassios Haniotis European Commission Krysta Harden National Association of Conservation DistrictsJohn Hardin Hardin Farms
1 Those listed participated in at least one of the three workshops. They participated as individuals, and their affiliation is given for means of identification only.
vi WOODS INSTITUTE FOR THE ENVIRONMENT | STANFORD UNIVERSITY
Louise Jackson University of California, DavisBart James The Ducks Unlimited Carol Jett USDA—Natural Resource Conservation Service Allan Johnson U.S. Dept. of Agriculture—Rural DevelopmentRobbin Johnson Cargill, Inc. Timothy Josling Stanford UniversityA.G. Kawamura California Department of Food and AgricultureJohn Keeling National Potato CouncilDavid Kleijn Wageningen University, the Netherlands William Kuckuck American Farmland TrustReece Langley USA Rice FederationDouglas Lawrence USDA—Natural Resources Conservation ServiceWilfrid Legg Organization for Economic Cooperation & Development Larry Martin E&J Gallo WineryGary Mast USDA—Natural Resources Conservation ServiceStephanie Mercier Senate Agriculture CommitteeAlfred Montna Montna FarmsAndrew Morton Senate Agriculture CommitteeJennifer Mock International Association of Fish & Wildlife AgenciesThomas Nassif Western Growers AssociationJay Noel California Institute for the Study of Specialty CropsJoe O’Mara O’Mara & AssociatesDave Orden International Food Policy Research InstituteMechel Paggi CSU-Fresno, Center for Agri-BusinessStefan Pagiola The World BankJames Salzman Duke University Jimmie Powell The Nature ConservancyMark Rey USDA—Natural Resource Conservation Steve Riley Nebraska Game & Parks CommissionRich Rominger American Farmland TrustGreg Schildwachter White House Council on Environmental QualityRandall Schnepf Congressional Research ServiceAnn Sorensen American Farmland TrustDaniel Sumner University of California, DavisAlan Swinbank The University of ReadingDel Tinsley Director Rural Development, WyomingLinwood Tipton International Dairy Foods AssociationBarton H. Thompson Stanford Law SchoolRobert Thompson University of Illinois, Urbana ChampagneJean-Marc Trarieux European CommissionMichael Treacy Irish Farmers’ AssociationRobert Tse California Department of Food and AgricultureAnn M. Tutwiler The William and Flora Hewlett FoundationRon Warfield University of Illinois, Urbana ChampagneMarca Weinberg USDA—Economic Research ServiceWilliam White Missouri Department of Conservation Sam Willett National Corn Growers AssociationBob Young American Farm Bureau FederationJoe Zanger Casa de Fruta
U.S. Agricultural Policy and the 2007 Farm Bill vii
ContributorsKaush Arha practices law at Latham & Watkins in Washington, D.C. He served as the director of the National Forum on U.S. Agricultural Policy and the 2007 Farm Bill: Conserving Ecological Integrity and Preserving Economic Resilience of American Farmlands. From 1997 to 2002 he administered the Wyoming Private Lands/Public Wildlife Conservation Program, advancing wildlife conservation on private lands. Later he developed a Wyoming state strategy for conserving threatened and endangered species. In 2005 he directed a National Forum on the Endangered Species Act and Federalism: Effective Species Conservation through Greater State Commitment. He received his M.Sc. in Agricultural and Resource Economics and his Ph.D. in Wildland Resource Science from the University of California at Berkeley and his J.D. from Stanford University.
David Blandford is a professor and former head of the Department of Agricultural Economics and Rural Sociology at the Pennsylvania State University. Born and educated in the United Kingdom, he was formerly a division director at the Organization for Economic Cooperation and Development in Paris and a professor at Cornell University. He has twice served as chair of the International Agricultural Trade Research Consortium—an organization composed of researchers from government, academia, and industry. He teaches courses in agribusiness at Penn State and conducts research into food, agricultural and environmental policy, and international trade.
Craig Cox is executive director of the Soil and Water Conservation Society—a professional organization dedicated to promoting the art and science of natural resource conservation. He has devoted his working life to natural resource conservation since 1977, when he joined the Minnesota Department of Natural Resources as a field biologist. Since that time, he has served as senior staff officer with the Board on Agriculture of the National Academy of Sciences; professional staff member of the Senate Committee on Agriculture, Nutrition and Forestry; special assistant to the Chief of USDA’s Natural Resource Conservation Service; and briefly as acting deputy undersecretary for Natural Resources and Environment at USDA.
Gretchen Daily is director of the Tropical Research Program at the Center for Conservation Biology; director of the Interdisciplinary Program on Environment and Resources; co-director of the Natural Capital Project; senior fellow at the Freeman-Spogli Institute for International Studies; professor of Biological Sciences; and senior fellow at the Woods Institute for the Environment at Stanford University. Dr. Daily is working to develop a scientific basis, and political and institutional support, for making conservation mainstream. Her scientific research is on quantifying the value of agricultural and natural landscapes, for conserving both biodiversity and ecosystem services (such as water purification and crop pollination). She aims to develop innovative policy and finance approaches that make conservation economically attractive and commonplace worldwide. Her lab group works in Africa, Asia, Latin America, and the United States.
Flavio Soares Damico has served as head of Brazil’s Agriculture and Commodities Division since 2003. As a diplomat, Mr. Damico has held a number of positions in Brasília, among them adviser to the Undersecretary-General for Administration (1991) and deputy head of the Division for United Nations Affairs (1998–1999). His assignments abroad include Permanent Mission of Brazil to the United Nations in New York (1992–1995), Brazilian Embassy to Montevideo (1995–1998) and Permanent Mission of Brazil to the United Nations and Other International Organizations in Geneva (2001–03). In 2000, the Brazilian Government seconded Mr. Damico to the United Nations Transitional Authority in East Timor (UNTAET), where he performed as Deputy Head for Political Affairs and Secretary of the National Consultative Council (2000). In his most recent assignments, Mr. Damico has been involved with WTO Agricultural Negotiations, since the beginning of the Doha Round. Throughout this period, he has provided Secretariat support to the G-20 grouping of developing countries with
viii WOODS INSTITUTE FOR THE ENVIRONMENT | STANFORD UNIVERSITY
particular interest in agriculture, created in August 2003. Mr. Damico also served as secretary of the Informal Technical Group, a coordination group composed of Brazilian government officials and private stakeholders—such as agribusiness organizations and family farmer confederations—and research institutes in charge of providing input to the Brazilian government decision-making process regarding agricultural negotiations.
Franz Fischler leads a consulting company Franz Fischler Consult GmbH. From 1995 to 2004 Dr. Fischler was the E.U. commissioner for Agriculture and oversaw the 2003 E.U. Common Agricultural Policy Reform. From 1999 to 2005 he also oversaw Fisheries in E.U. During his tenure as Commissioner he oversaw major reform in Agriculture and Fisheries, including Agenda 2000, Reform 2003, and the first reform of European fisheries policies. Prior to that he was Austria’s Minister of Agriculture and Forestry from 1989 to 1994. He played an integral role in Austria’s negotiation for accession to the E.U. He started his career as a farmer on his family farm in Tyrol. After receiving his doctorate in soil science in Vienna he became a management assistant at the Tyrol Chamber of Agriculture and its director in 1985.
Rebecca L. Goldman is a Ph.D. candidate at Stanford University in the Interdisciplinary Program in Environment and Resources. Her research focuses on the interface between human welfare issues and conservation. She is motivated by advancing government and non-government incentives and policies both in the United States and worldwide to develop new strategies for approaching conservation on working landscapes. She is particularly interested in designing landscape-scale incentives to encourage the provision of ecosystem services from agricultural lands. She has a B.A. from the University of Virginia (2003), where she studied biology and environmental sciences.
Michael Hammell is the head of the Agriculture, Forestry and Soil Unit in the Directorate General for Environment at the European Commission. The unit is responsible for environmental integration issues with respect to both the market and rural development pillars of the reformed E.U. Common Agricultural Policy, for the implementation of legislation governing the relationship between agriculture and water protection, for E.U. related forest and environment issues, and for the development of the Commission’s soil strategy. He has worked at the D.G. Environment since 1997. From 1983 to 1997 he worked for D.G. Agriculture in the “Beef and Sheep” Markets Division, with responsibilities for sheep policy and trade issues and for technical assistance in beef production. Prior to his tenure with the European Commission, he worked for 10 years as a farm manager, lecturer, and specialist agricultural adviser with the Irish Department of Agriculture. He holds a Masters Degree in Agricultural Science (Soil) from University College Dublin.
Anastassios (Tassos) Haniotis is head of the Agricultural Policy Analysis and Perspectives Unit in the Directorate General for Agriculture of the European Commission. He previously held posts as head of the Agricultural Trade Policy Analysis unit in the same Directorate General, member and subsequently deputy head of the Cabinet of former European Commissioner for Agriculture Franz Fischler (responsible, respectively, for the preparation of the 2003 reform of the Common Agricultural Policy, the agricultural chapter of the Doha WTO Round, and the E.U.-Mercosur negotiations). He also served as Agricultural Counsellor of the European Commission’s Delegation in the United States. He holds Ph.D. (1987) and M.S. (1984) degrees in Agricultural Economics from the University of Georgia, U.S.A., and a B.A. (1980) in Economics from the Athens School of Economics and Business Science, in his native Greece.
Tim Josling is professor emeritus at the Food Research Institute, Stanford University, and a senior fellow in the Freeman Spogli Institute for International Studies at Stanford. He holds a visiting professorship at Imperial College at Wye, in the United Kingdom, and is currently president of the U.K. Agricultural Economics Association. He previously taught at the London School of Economics and the University of Reading, England. Dr. Josling’s research interests center on industrial country agricultural policies, international trade in agricultural products, and the process of economic integration. He is currently involved in studies of the regulation of biotechnology in the

U.S. Agricultural Policy and the 2007 Farm Bill ix
U.S. and the E.U.; trade conflicts over food safety and animal health regulations; reform of the agricultural trading system in the WTO, including the progress in the current round of negotiations; the treatment of agriculture in free trade areas such as NAFTA and MERCOSUR; and the changes in the Common Agricultural Policy of the European Union. Dr. Josling is a member of the International Policy Council on Food and a fellow of the American Agricultural Economics Association. At Stanford, Dr. Josling teaches a course on the Economics and Political Economy of the Multilateral Trade System.
Wilfrid Legg is head of the Agricultural Policies and Environment Division in the OECD Trade and Agriculture Directorate, where he has worked since 1981, following a research fellowship at Sussex University where he co-authored New Limits on European Agriculture (1985). His main areas of expertise are in agricultural and environmental policy analysis and the measurement and evaluation of agricultural policies, using the internationally recognized measures of support to agriculture (the Producer and Consumer Support Estimates) that he helped develop. He was educated at the Universities of London, Leicester, and Reading and has served as president of the Agricultural Economics Society (AES).
Andre M. Nassar has been general manager, Institute for International Trade Negotiations (ICONE) since July 2003. His main fields of work at ICONE include multilateral, regional, and bilateral trade negotiations; modeling of quantitative scenarios and supply & demand long run projections of agricultural products; agricultural trade policies in developed and developing countries; and World Trade Organization challenges. He previously served as an expert in projections and international market analysis for sugar and ethanol for COPERSUCAR (2002–2003) and performed consulting and research projects with the Inter-American Development Bank, the World Bank, FAO, UNDP, and other international organizations. In addition, he was an Active Member of the Global Alliance for Sugar Reform from 2002–2003, a SADIA S.A. Advisor of the Administrative Council from 2001–2002, a visiting scholar at the School of Foreign Service, Georgetown University, Washington DC. in 2001, an associate faculty member at the Agribusiness Studies Program (PENSA), University of São Paulo from 1999–2002, and a senior researcher at the Economic Research Foundation of the University of São Paulo (FIPE) from 1999–2002. He is a member of the Brazilian Technical Group for Doha Round agricultural negotiations, coordinated by the Ministries of External Relations and Agriculture of the Brazilian Government, and a collaborator for the G-20 as an expert in agricultural world markets, at the request of the Brazilian Government. He earned his B.Sc. in Agronomy at the “Luiz de Queiroz” School of Agriculture—USP/ESALQ in 1994 and his M.Sc. and Ph.D. at the School of Economics and Business of the University of São Paulo, Brazil, USP/FEA in 2004 .
J. B. Penn is chief economist, Deere & Co. Before joining the company in August 2006, he served as Under Secretary for Farm and Foreign Agricultural Services in the United States Department of Agriculture for more than five years. He began his career with the USDA where he held several increasingly responsible positions, including deputy administrator for economics in the Economics and Statistics Service. He also served as senior staff economist in the President’s Council of Economic Advisers. Following his work in the federal government, Dr. Penn moved to the private sector for more than two decades. He was a founding principal and president of Economic Perspectives, Inc., a firm of economic and food consultants that was acquired by Sparks Companies, Inc., a larger firm in the same field, where he served as senior vice president and head of the Washington office from 1988 until 2001. He is a member of the Farm Foundation Board of Trustees and a Fellow of the American Agricultural Economics Association. He is a native of Arkansas and holds an undergraduate degree from Arkansas State University, an M.S. from Louisiana State University, and a Ph.D. from Purdue University.
Steven Riley is chief of the Habitat Partners Section of the Nebraska Game and Parks Commission in Lincoln. He previously worked for the South Dakota Game, Fish and Parks Department in Pierre as section chief of the Private Lands and upland game programs. While in that position and in his current role, he has had continuous dealings

x WOODS INSTITUTE FOR THE ENVIRONMENT | STANFORD UNIVERSITY
with Farm Bill policy for the last 20 years. He has served on the Ag-Conservation Committee of the Association of Fish and Wildlife Agencies for nearly 20 years and has been involved with the Midwest Private Lands Working Group of the Midwest Association of Fish and Wildlife Agencies since its inception in 1989. He helped start the Western Association of Fish and Wildlife Agencies’ Private Lands Access and Conservation Committee in the late ‘90s and has been an active participant since that time. Having lived most of his life in the Plains states, he attended college at South Dakota State University, where he received a Bachelors Degree in Wildlife and Fisheries Sciences and a Masters Degree in Biology, with emphasis in ecology and a minor in Wildlife Biology.
Daniel A. Sumner is the director of the University of California Agricultural Issues Center and the Frank H. Buck, Jr., Chair Professor, Department of Agricultural and Resource Economics, University of California, Davis where he has been since 1993. Before moving to the University of California, Sumner was senior economist at the President’s Council of Economic Advisers and assistant secretary for economics at the United States Department of Agriculture. At USDA, he supervised the Department’s economic and statistical work and provided policy advice to the Secretary and other officials regarding GATT negotiations, the 1990 Farm Bill and other issues. At U.C. Davis, Sumner engages in teaching, research, and outreach on topics in agricultural economics, focusing on international trade and policy. He is a fellow of the American Agricultural Economic Association and has served as chair of the International Agricultural Trade Research Consortium.
Barton H. “Buzz” Thompson is the Robert E. Paradise Professor of Natural Resources Law at Stanford University, founding director of the law school’s Environmental and Natural Resources Program, co-director of and a senior scholar at the Woods Institute for the Environment, and a senior fellow at the Freeman-Spogli Institute for International Studies. Professor Thompson is chairman of the Natural Heritage Institute and a board member of the Nature Conservancy of California, the American Farmland Trust, the Resources Legacy Fund, and the Resources Legacy Fund Foundation. He is also on the Environmental Water Account Technical Review Panel for the CALFED Bay Delta Authority and the EPA Science Advisory Board. Before joining the Stanford Law School faculty in 1986, Professor Thompson was a partner at O’Melveny & Myers in Los Angeles and a lecturer at the University of California at Los Angeles School of Law. He was a law clerk to the late Chief Justice William H. Rehnquist of the U.S. Supreme Court and Judge Joseph T. Sneed of the U.S. Court of Appeals for the Ninth Circuit. Professor Thompson’s research focuses on the sustainable use of natural resources and the effective reform of regulatory institutions.
William “Bill” White is Private Land Program supervisor with the Missouri Department of Conservation, a position he has held since 2004. He coordinates Department activities with the Farm Bill and USDA at the state and national levels. Prior to 2004, he worked for 16 years as an Area Biologist assigned to a USDA Natural Resource Conservation Service Area Office, providing training and technical assistance to USDA offices on Farm Bill programs. He graduated from the University of Nebraska with a B.S. in Agriculture.
U.S. Agricultural Policy and the 2007 Farm Bill xi
TABLE OF CONTENTS
Acknowledgments . . . . . . . . . . . . . . . . . . . . . . . . . . . . . . . . . . . . . . . . . . . . . . . . . . . . . . . . . . . . . . . . . . . . . . . . . . . . . . . . . . . . . . . . . . . . . . . . . . . . . . . . . . . . . iv
List of Participants in Forum Workshops . . . . . . . . . . . . . . . . . . . . . . . . . . . . . . . . . . . . . . . . . . . . . . . . . . . . . . . . . . . . . . . . . . . . . . . . v
List of Contributors . . . . . . . . . . . . . . . . . . . . . . . . . . . . . . . . . . . . . . . . . . . . . . . . . . . . . . . . . . . . . . . . . . . . . . . . . . . . . . . . . . . . . . . . . . . . . . . . . . . . . . . . . vii
Foreword by J. B. Penn . . . . . . . . . . . . . . . . . . . . . . . . . . . . . . . . . . . . . . . . . . . . . . . . . . . . . . . . . . . . . . . . . . . . . . . . . . . . . . . . . . . . . . . . . . . . . . . . . . . . . xiii
Foreword by Franz Fischler . . . . . . . . . . . . . . . . . . . . . . . . . . . . . . . . . . . . . . . . . . . . . . . . . . . . . . . . . . . . . . . . . . . . . . . . . . . . . . . . . . . . . . . . . . . . . . . .xv
Introduction by Kaush Arha, Tim Josling, Daniel A. Sumner, and Barton H. Thompson . . . . . . . . . . . . . . . . . . . . . . . . . . . . . . . . . . . . . . . . . . . . . . . . . . . . . . . . . . . . . . . . . . . . . . . . . . . . . . . . . . . . . . . . . . . . . . . . . . . . . . . . . . . . 1
Farm Commodity Support and U.S. Agricultural Policy . . . . . . . . . . . . . . . . . . . . . . . . . . . . . . . . . . . . . . . . . . . . . . 5
1. Commodity Policy and the 2007 Farm Bill Daniel A. Sumner, Kaush Arha, and Tim Josling. . . . . . . . . . . . . . . . . . . . . . . . . . . . . . . . . . . . . . . . . . . . . . . . . . . . . . . . . . . . . . . . . . . . . . . . . . . . 5
2. U.S. Commodity Programs and WTO Commitments Tim Josling, David Blandford, Kaush Arha, and Daniel A. Sumner . . . . . . . . . . . . . . . . . . . . . . . . . . . . . . . . . . . . . . . . . . . . . . . . . . 25
3. The 2003 Reform of the European Union’s Common Agricultural Policy and Its Relevance to the U.S. Farm Policy Debate Tassos Haniotis . . . . . . . . . . . . . . . . . . . . . . . . . . . . . . . . . . . . . . . . . . . . . . . . . . . . . . . . . . . . . . . . . . . . . . . . . . . . . . . . . . . . . . . . . . . . . . . . . . . . . . . . . . . . . . . . . . . . 53
4. Agricultural Expansion and Policies in Brazil Flavio Soares Damico and Andre Meloni Nassar . . . . . . . . . . . . . . . . . . . . . . . . . . . . . . . . . . . . . . . . . . . . . . . . . . . . . . . . . . . . . . . . . . . . . . . . . . 75
Conservation and U.S. Agricultural Policy . . . . . . . . . . . . . . . . . . . . . . . . . . . . . . . . . . . . . . . . . . . . . . . . . . . . . . . . . . . . . . . . . . . . 97
1. Managing for Ecosystem Services on U.S. Agricultural Lands Rebecca L. Goldman, Barton H. Thompson, and Gretchen C. Daily . . . . . . . . . . . . . . . . . . . . . . . . . . . . . . . . . . . . . . . . . . . . . . . . . . 97
2. U.S. Agriculture Conservation Policy & Programs: History, Trends, and Implications Craig Cox . . . . . . . . . . . . . . . . . . . . . . . . . . . . . . . . . . . . . . . . . . . . . . . . . . . . . . . . . . . . . . . . . . . . . . . . . . . . . . . . . . . . . . . . . . . . . . . . . . . . . . . . . . . . . . . . . . . . . . . . 113
3. Environmental Integration into Agricultural Policy in the European Union Michael Hammell . . . . . . . . . . . . . . . . . . . . . . . . . . . . . . . . . . . . . . . . . . . . . . . . . . . . . . . . . . . . . . . . . . . . . . . . . . . . . . . . . . . . . . . . . . . . . . . . . . . . . . . . . . . . . . .147
4. Agri-Environmental Programs in OECD Countries Wilfrid Legg . . . . . . . . . . . . . . . . . . . . . . . . . . . . . . . . . . . . . . . . . . . . . . . . . . . . . . . . . . . . . . . . . . . . . . . . . . . . . . . . . . . . . . . . . . . . . . . . . . . . . . . . . . . . . . . . . . . . . 153
5. U.S. Environmental Programs and Their Compatibility with Green Box Provisions under the WTO Agreement on Agriculture David Blandford, Tim Josling, and Kaush Arha . . . . . . . . . . . . . . . . . . . . . . . . . . . . . . . . . . . . . . . . . . . . . . . . . . . . . . . . . . . . . . . . . . . . . . . . . 175
6. Coordinated State and Federal Ag-Conservation Efforts: The Case of Missouri and Nebraska Kaush Arha, Steven P. Riley, and William White . . . . . . . . . . . . . . . . . . . . . . . . . . . . . . . . . . . . . . . . . . . . . . . . . . . . . . . . . . . . . . . . . . . . . . . . 189
7. Conserving Ecosystem Services across Agrarian Landscapes Kaush Arha, Tim Josling, Daniel A. Sumner, and Barton H. Thompson . . . . . . . . . . . . . . . . . . . . . . . . . . . . . . . . . . . . . . . . . . . .207
Conclusion by Kaush Arha, Tim Josling, Daniel A. Sumner, and Barton H. Thompson . . . . . . . . . . . . . . . . . . . . . . . . . . . . . . . . . . . . . . . . . . . . . . . . . . . . . . . . . . . . . . . . . . . . . . . . . . . . . . . . . . . . . . . . . . . . . . . . . . . . . . . . . 231

xii WOODS INSTITUTE FOR THE ENVIRONMENT | STANFORD UNIVERSITY

U.S. Agricultural Policy and the 2007 Farm Bill xiii
FOREWORD
by J. B. Penn
The U.S. Congress is once again engaged in the review and reauthorization of our more than seven-decade-old farm programs, plus a hodge-podge of others that have accreted over the years into what is collectively known as the “Farm Bill.”
Both social conditions and farm economics have evolved over time and today are far, far different from those that the legislation initially was intended to address. At the height of the Great Depression in the 1930s, 40 percent of the population lived in rural America and fully 25 percent of the population resided on farms. Today, only a quarter of the population lives in rural areas, and the farm population has grown so small that the Census Bureau stopped counting it in the early 1990s (it comprises less than 1 percent of the population today).
Nevertheless, these massive programs continue to reflect many of the agricultural interests that were their original focus—even though they are now competing with many other powerful, national groups, most notably those advocating conservation, nutrition and important commodities and products.
Today, these other entities are pressing for the opportunity to participate in the reauthorization of the legislation. They argue that economic and social circumstances warrant a thoroughgoing review of support for the sector and that agricultural policies have consequences that extend well beyond the farm sector, even to our international relations and responsibilities. This development—the emergence of new stakeholders and claimants—together with today’s unprecedented political and economic circumstances and international scrutiny of what were once solely domestic considerations, promise to make the renewal of the current law, the Farm Security and Rural Investment Act of 2002, among the most important ever.
An unknown factor in the process is the recent shift in control of both Houses of the Congress. While history suggests that leadership shifts are of little moment to the direction of farm policy, they do introduce new personalities who can effect some change in emphasis. And, while this change has elevated a national issue that has the capacity to overshadow all others in the competition for resources, it does not guarantee that pledges of fiscal prudence made during the campaigns will be honored. Clearly, the fiscal situation today is far different than in 2002 when large surpluses were expected indefinitely—in sharp contrast to today’s mounting concern with the deficit. And, the controversy surrounding the Iraq war now spills over into virtually every public policy area, often with considerable potential ancillary effect.
Certainly the economic reality and the outlook for the farm sector are more positive than in recent memory. Strong worldwide economic growth is boosting food consumption dramatically, especially in those countries that are moving large segments of their populations into the market economy (frequently referred to as the emerging middle class). Food trade has expanded for American farmers, with ever-increasing export sales recorded every year—recently to a record $69 billion in 2006 and now forecast for $78 billion this year. With strong foreign sales (accounting for almost one-third of total receipts) on top of a robust domestic food market, product prices and cash incomes have been strong for several years. This, along with the program support, has produced persistently rising farmland prices all across the country. With land the largest agricultural asset by far, the sector’s financial balance sheet has never been stronger.

xiv WOODS INSTITUTE FOR THE ENVIRONMENT | STANFORD UNIVERSITY
This already favorable business environment has suddenly been augmented with yet more demand for some commodities as feedstock for renewable fuels. A convergence of factors in the latter part of last year, including interruptions in supply that pushed petroleum prices sharply higher, ignited the ethanol industry and again boosted farm commodity prices to near-record levels. Strong renewable fuel demand, along with the already strong underlying food market, is expected to persist for the foreseeable future. Thus, strong prices and incomes and a strong balance sheet, with a favorable near-term outlook, present a most unusual economic environment in which to be reviewing the height and scope of a safety net for a segment of the farm sector.
This year’s Farm Bill renewal also comes just when the structure of the major commodity programs is being increasingly scrutinized under World Trade Organization rules. And the WTO Doha Development Agenda, under negotiation since 2001, is now at a critical and perhaps conclusive point, a time when a strong new agreement could have far-reaching effects on both the form and amount of support allowable for the farm sector.
This environment, along with the myriad considerations addressed in the papers and discussed in a series of well-attended workshops, are presented in this volume. The papers are very timely, up-to-date and prepared by internationally known and well-regarded authors. They provide a very thorough discussion of the many aspects of the issues, proposals, and considerations that will be addressed as the debate on new farm legislation proceeds. This volume should prove an invaluable contribution to a more fully informed discussion.

U.S. Agricultural Policy and the 2007 Farm Bill xv
FOREWORD by Franz Fischler
In an increasingly globalized world, all agricultural sectors are facing big challenges. But they also face great opportunities. The authors of this book address the opportunities and challenges facing U.S. agricultural policy, given the influences of the international agricultural trade, budget disciplines, consumer demand for high-quality, healthy food at reasonable prices, and citizen interest in a clean environment and preserving the inherited agrarian landscapes.
In 2003 the European Union undertook a thorough reform of its Common Agricultural Policy (CAP). The aim was to help European farmers and the agricultural industry reconcile the needs of modernization and restructuring with their community function and responsiblity. The CAP reform also recognized the positive externalities generated by agriculture, rural activities, and open spaces. The E.U. acted with the conviction that it needed to maintain a strong, competitive, and sustainable agricultural sector, for its own as well as for the world’s sake, while conserving and renewing Europe’s rural communities and landscapes. It was necessary to change the image of European agriculture—as a major surplus producer and often an environmental polluter jeopardizing its own long-term sustainability—into that of a competitive and sustainable sector, notably as regards food quality and traceability.
European public opinion would no longer tolerate CAP rules as sacrosanct, particularly when European farmers got a pass on environmental regulations. Therefore, the reformed CAP specified that farmers had to follow the “polluter-pays“ principle, whereby a farmer who fails to respect specific environmental, animal welfare rules or good farming practices will loose public payments. The reform also introduced other new ideas such as decoupling farm support from production, transferring funds from farm support to rural development programs, and adhering to a strict financial discipline mechanism. The reform stressed the functions of farm families as suppliers not only of agricultural products, but also of public services to society.
The U.S., along with other developed countries, also faces the opportunity to redesign and redirect its agricultural policies. The aim of the 2007 Farm Bill must be to better serve the needs of all U.S. citizens; to take into account all U.S. agriculture; to enhance its competitiveness in an increasingly global market; to fully utilize the opportunities for rural renewable energy; to instill fiscal discpline; to encourage sustainable rural development; and to improve environmental quality across the whole range of American agricultural landscapes. In so doing, the U.S. can strengthen its position in a global world by maintaining its role as the champion of international agricultural trade and by being able to better defend its farm programs and policies from challenges in the World Trade Organization.
The U.S. would serve its citizens and farmers well by acting now. To that end, the reasoned analysis on agricultural support and ag-conservation presented in the following chapters offers valuable information and forward-looking recommendations to policy makers, scientists, and interested parties engaged in charting the future course of U.S. agriculture.

xvi WOODS INSTITUTE FOR THE ENVIRONMENT | STANFORD UNIVERSITY

U.S. Agricultural Policy and the 2007 Farm Bill 1
CHAPTER I—INTRODUCTION
Kaush Arha,Tim Josling, Daniel A. Sumner, and Barton H. Thompson
Politicians, agricultural groups and other interested parties are once again in the midst of an important reexamination of American agricultural policy and its future direction. In anticipation of the 2007 Farm Bill, the issues are being discussed in the media and in numerous meetings. The need to renew farm support legislation every few years gives an opportunity to rethink the rationale for a Farm Bill and the focus of such a bill. This edited volume contributes to this unfolding process.
The policy debate before a Farm Bill involves an intricate dance between conflicting interests. The legislation itself is an omnibus bill with a number of titles. Thus the crafters of the bill must balance the numerous demands for funding to support desirable programs with the limits imposed by the budget process. The current debate leading up to the 2007 Farm Bill is similar in nature to earlier farm bill discussions, but with one important caveat. The global effects of decisions made in Washington with respect to farm policy are now more clearly recognized. The impacts of continuing current commodity support programs on world prices and more generally on trade relations are increasingly becoming apparent. But this implies that the benefits of modifications to these programs could be heightened by their international importance. The U.S. could regain the leadership in improving the conditions under which farm products are traded around the world.
The U.S. has traditionally enjoyed remarkable competitive advantage in agriculture due to its natural resource base, farm production technology, physical and financial infrastructures, and public investment in agricultural research and extension services. This advantage is in danger of being eroded by policies that short-change research and discourage innovation. The conditions for private investment are determined by the economic climate influenced by the Farm Bill. So a coherent approach to increasing U.S. competitiveness and opening markets could provide the best environment for investment and innovation and keep U.S. agriculture atop the ladder.
The domestic context of the 2007 Farm Bill is also pivotal. The debate surrounding the bill highlights the policy choice between preserving current farm support payments for a select minority of crops or redirecting federal funds towards an agricultural policy aimed at meeting the needs of all parts of U.S. agriculture. Commodity support programs for select agricultural crops have remained the mainstay of U.S. agricultural policy. Strong political support for such programs for the last seven decades has been effective in warding off major changes. There is a growing uneasiness in the rest of U.S. agriculture that their interests may again take a back seat to the incomes of producers of program crops, just when they feel the need for assistance in maintaining competitiveness. Such an inequity may be politically unsustainable.
The domestic debate also poses the question of how much emphasis is to be put on investing in public goods emanating from that sector, and reducing the negative impacts of intensive production on rural ecologies. An important start was made in the 2002 Farm Bill to extend incentives to improve conservation on working lands and encourage sustainable farm practices. But funding for these programs has been inadequate, and the new bill gives the opportunity to build such widely supported initiatives into the core of farm support legislation.
U.S. agriculture and rural America have changed substantially since present support programs were first implemented. The chance of updating the domestic programs to reflect the new realities would make a thorough review necessary, even if there were no international considerations to take into account. The combination of these

2 WOODS INSTITUTE FOR THE ENVIRONMENT | STANFORD UNIVERSITY
changes and the substantial benefits that could come from more open international markets makes the current debate among the most important of the postwar era.
There are an increasing number of players involved in the farm policy debate on this occasion. Developments in U.S. farm policy affect farmers, agri-processors, consumers, rural residents, conservation groups, and the nation’s citizenry as a whole. Traditionally, producer groups and some environmental interests have dominated the discussion. The nontraditional players that are engaging in the debate including policy think tanks, newspapers, and food processing and energy companies. This broader participation opens up the possibilities for new coalitions and new solutions to problems.
One constraint hangs over all the discussions of future farm policy. The projections of federal budget deficits indicate that Congress will certainly require cuts in future federal spending on farm policy. The Farm Bill will have to be set within the limits given by these budget projections; agreement on increased spending relative to the baseline will be particularly difficult to achieve.
All these political forces portend change—as well as an opportunity to preserve the best in U.S. agricultural policies and build upon those elements to benefit all U.S. agriculture and rural America. But the U.S. is not alone in facing these challenges. The European Union has been in a similar position and has made considerable strides in the reform of its agricultural policies. In the E.U., budget constraints, enlargement challenges, consumer demands, and WTO obligations were the main catalysts in transforming the Common Agricultural Policy. Though still giving a high degree of support, the CAP has made a commendable shift to the use of less trade-distorting payments. Similar challenges have also been faced by Australia, New Zealand, and Canada, each of which has brought its farm policies
“up to date.” U.S. leadership could encourage others such as India and China to turn away from high levels of protection before they burden themselves with agricultural sectors that cannot compete on world markets. The U.S. has historically been in the forefront of liberalizing agricultural policies. Its leadership was instrumental in the successful completion of Uruguay Round and formation of rules that disciplined agricultural policies in the WTO. However, today it finds itself in the unfamiliar position of defending against and deflecting accusations of not living up to positions it so often forcefully recommended to the rest of the world.
In 2006 the Stanford Law School and the Woods Institute for the Environment at Stanford University convened a National Forum to discuss U.S. Agricultural Policy and the 2007 Farm Bill. The School of Environmental Studies at Yale and the American Farmland Trust joined Stanford as co-sponsors. The topic of the Forum was defined as
“conserving ecological integrity and economic resilience of American Farmlands.” The Forum chose to focus on farm commodity payments and conservation policies. Three workshops were convened that brought together eminent scholars and practitioners in the field of U.S. and world agricultural policy. The purpose was to have a spirited debate on the pressing topics and provide reasoned background information to policy makers and interested members of the general public on the issues.
This volume represents the papers that were written for the workshops and then later improved by the workshop discussions. The book is organized in four parts. The first part contains a brief introduction on the new political environment for the debates regarding the 2007 Farm Bill. The second part of the book examines the historical rationale, international trade context, and future options for the agricultural commodity support policies and programs. Kaush Arha, Tim Josling, and Daniel A. Sumner examine the often-stated objectives and reasons for commodity support in the U.S. and the programs’ performance in meeting those objectives. Tim Josling, David Blandford, and Daniel A. Sumner offer an analysis of the major provisions of the Uruguay Round Agreement on Agriculture, the outstanding agricultural issues to be negotiated under the Doha Round, and what effect they may have on U.S. agricultural policies. This part also discusses the evolution of agricultural policies in the European

U.S. Agricultural Policy and the 2007 Farm Bill 3
Union and Brazil as they help to provide the international context in which U.S. policy now operates. Tassos Haniotis examines the political and economic drivers that led to major reform in the E.U.’s agricultural policies in 2003 and explains the broad lessons learned in the process. Flavio Damico and Andre Nassar evaluate the agricultural policies and economic conditions that have resulted in Brazil’s emergence as an agricultural powerhouse in international trade. The workshop participants are listed on page vii.
Conservation and U.S. agricultural policy is the subject of Part Three, with chapters on ecosystem services from agricultural lands, historical trends, and future implications for agricultural conservation programs in the U.S. Rebecca Goldman, Barton Thompson, and Gretchen Daily identify the major ecosystem services provided by farmlands and suggest actions that better account for such services. Craig Cox reviews the past performance and future needs of agricultural conservation programs authorized by the Farm Bill. In addition, this part includes two papers analyzing the environmental policies affecting agriculture in the European Union (Michael Hammell) and examining the major characteristics of the agri-environmental programs in OECD countries (Wilfrid Legg). David Blandford, Tim Josling, and Kaush Arha discuss existing U.S. agricultural conservation programs and their adherence to WTO obligations. They also identify key characteristics that such programs should integrate to meet the U.S.’s obligations under WTO rules. Steven P. Riley, William White, and Kaush Arha analyze the linkages between federal conservation programs and those operated at the state level. The section finishes with the discussion of a new paradigm for U.S. agricultural conservation program across all agricultural landscapes in the country. Kaush Arha, Tim Josling, Daniel A. Sumner, and Barton H. Thompson examine the range of conditions where agricultural conservation programs may be applied. They offer a comprehensive, watershed-based strategy to coordinate agricultural conservation programs across all agricultural landscapes, in order to address local conservation priorities and measure performance. The final part draws from and builds upon the previous chapters and the proposals of other groups to suggest actions that policy makers may consider as they take part in the debate on the 2007 Farm Bill.
Among the key themes that came out of the Forum discussions were that U.S. agricultural policies should address all of U.S. agriculture, in other words be more equitable; that it should be anchored on the objectives of keeping American agricultural competitive, of improving conservation across American farmlands, and promoting thriving rural communities; and that it should be consistent with broader aims of U.S. foreign policy, including promotion of development overseas, opening up markets abroad, and maintaining a stable trade system.
We hope that the analysis, discussion, and proposals presented in this volume shed valuable light on the pressing policy issues to be addressed in the upcoming Farm Bill and that the debate of which it is a part results in more informed policy-making.

4 WOODS INSTITUTE FOR THE ENVIRONMENT | STANFORD UNIVERSITY

U.S. Agricultural Policy and the 2007 Farm Bill 5
CHAPTER II-1
Commodity Policy and the 2007 Farm BillDaniel A. Sumner, Kaush Arha, and Tim Josling
I. IntroductionFarm bills deal with topics far broader than farm commodity subsidies. Over the years, the laws have become ever more comprehensive and complex (see Jones, Hanrahan, and Womack). The many separate titles deal with such diverse topics as food assistance for the domestic poor, research and extension, food safety, and aid to rural communities for sewage treatment or electricity. Farm programs include environmentally based land reserves, subsidies for some farm environmental improvements, and selected commodity marketing regulations. In the international arena, recent farm bills have included authorization of export price subsidies, subsidies for international promotion, food aid, and export credit guarantee programs (Westcott, Young, and Price; ERS, USDA website). Here we leave aside many topics that are important to the overall Farm Bill in order to focus on farm commodity programs. However, because they are so important, we will discuss some environmental features of the legislation, some risk management concerns and approaches, and some international trade issues that have not been a part of the Farm Bill.
We discuss international implications of U.S. farm commodity programs for several reasons. First, the United States is a major producer, consumer, exporter and importer of many agricultural commodities, and producers, consumers, and marketing firms in the United States influence world markets. U.S. policies thus have the potential to affect prices expectations and price realizations in major commodity markets around the world. Second, for almost six decades, the United States government has played a major role in international trade negotiations, including at the World Trade Organization (Johnson, 1950). Because its provisions may affect trade and because trade agreements may discipline U.S. policy, U.S. farm programs affect the negotiating positions of the United States and the positions of other countries. In this way, U.S. farm programs may affect international trade rules and these, in turn, influence policies in other countries and international commodity markets. In addition, U.S farm programs may conflict with existing international agreements and lead to international disputes. Such disputes affect markets, affect trade negotiations, and may affect the pace of global policy change.
This paper covers an array of topics, but deals with none of them in great depth. We attempt to review the historical background to current programs, highlight the main features of important commodity programs and discuss some of their implications. We then turn to suggested rationales for the programs and discuss the correspondence of those rationales with the current facts of American agriculture and actual commodity program structure and impacts. Finally, we consider forces likely to affect the 2007 Farm Bill.1
We draw on a number of recent government publications, including Chapter 8 of the Economic Report of the President and the 2007 Farm Bill theme papers released by USDA.
1 We do not deal with crop insurance policy in this paper. Crop insurance is a growing feature in commodity support, and some have argued for replacing some part of commodity programs with expanded revenue insurance products. But crop insurance has typically been dealt with in separate ad hoc legislation from the period farm bills (Glauber; USDA, May 2006).

6 WOODS INSTITUTE FOR THE ENVIRONMENT | STANFORD UNIVERSITY
CURRENT COMMODITY PROGRAMS IN HISTORICAL CONTEXT
Overall government programs for farms and rural regions range from investments in public goods to price supports and income transfers. Government support of research and extension and general services to the rural infrastructure have raised productivity and efficiency. Until the 1920s, the public good aspects of rural policy dominated, and early initiatives to raise prices and control production were minor aberrations (Effland). (U.S. and foreign tariff policies did represent the major market distortions over two centuries.) But the relative emphasis on investment and infrastructure changed gradually in the 1920s and rapidly in the 1930s (Benedict).
The main commodity programs in the United States date back to the New Deal of the 1930s, when supply control and price and income supports were introduced to attempt to correct for the collapse of commodity prices and farm incomes. The 1930s saw the introduction of a variety of programs and revisions to deal with constitutional problems of the original schemes.
Results of the New Deal programs for agriculture were mixed. Low prices were themselves a consequence of the supply and demand conditions that grew out of the global depression, and the New Deal policies typically made the situation worse. Higher supported prices led to more quantity supplied and lower quantity demanded, with the government taking the surplus its policies created. Thus, while providing some relief for farmers, these measures also tended to exacerbate the conditions that perpetuated the “over-supply” problems. Despite the massive government intervention, it took World War II to bring cash farm income back to the (already depressed) 1929 level. (See Bowers, Rasmussen, and Baker; Effland; Rasmussen and Baker; and Olmstead and Sumner for more discussion of this history.)
The Agricultural Act of 1949, which remains the “permanent” farm legislation, essentially continued the Depression-era programs. The 32-year period from 1949 through 1981 saw a few periods of high market prices, when programs had relatively little influence. In periods of low prices, stockpiles grew, creating pressure to enact supply controls. By 1960, about 60 million acres of cropland were removed from production under annual commodity programs, and several million acres were idled under long-term land bank programs. The commodity price boom of the early 1970s eliminated government stocks and allowed a brief period of low stocks and full production. When prices collapsed again, massive stock accumulation, deficiency payments and land idling again took hold. The result was one of the largest acreage reduction programs in U.S. history, idling 20 percent of U.S. cropland. Overall, the four-decade period following WWII was one of numerous adjustments, but relatively little change in the basic structure of U.S. farm commodity programs (Bowers et al.).
The modern period of farm policy began with the Food Security Act of 1985, which recognized that lower price supports were necessary to reduce the accumulation of stocks and increase American export competitiveness. The gradual reduction of support prices and increased planting flexibility signaled a change in policy direction, including large income support payments in lieu of market price supports and government stock accumulation. The 1985 Act also required program participant to meet conservation objectives and forego adding environmentally sensitive land to the program base. A new, long-term Conservation Reserve Program also paid landlords to remove from production erodible cropland for a 10-year period. In most of the years since 1986, about 35 million acres have been idled under this program. The 1990 Farm Bill continued the path established in 1985, but budget concerns led to lower payments, lower loan rates for price support, and more planting flexibility.
As the 1990 farm legislation neared expiration in 1995, some farmers continued to note that the programs limited planting and market flexibility. In addition, budget pressures continued. Then, after official budget projections had been made, prices of program crops began to rise dramatically (Gardner, 1999, and Orden et al., 1999). This last

U.S. Agricultural Policy and the 2007 Farm Bill 7
point turned out to be crucial, causing the FAIR Act of 1996 to replace deficiency payments linked to market prices with fixed “contract” payments so that farmers would get payments even when prices were high (Young and Westcott, 1996). Despite reports at the time, the FAIR Act did not schedule a phase-out of farm subsidy programs. Rather, it was an extension of the policy path of the previous decade. Nonetheless, by reinforcing and consolidating previous changes, the FAIR Act changed the form of crop programs by further moderating or eliminating planting requirements, land set-asides, price supports, and government stockpiles. It also added to environmental programs with a consolidated cost-share program for environmental improvements, the Environmental Quality Improvement Program (EQIP).
The FAIR Act set contract payments in advance for seven years. However, when prices fell and remained depressed, ad hoc legislation raised payments by 50 percent in 1998 and doubled payments for 1999, 2000 and 2001. In all, subsidies jumped from about $4.6 billion in fiscal year 1996 to $19.2 billion in fiscal year 1999 and $32.2 billion in fiscal year 2000. The attempt to limit farm subsidies in times of low farm prices proved politically unsustainable. The policy clout of farmers remained powerful entering the new century.
The currently applicable “Farm Bill,” the Farm Security and Rural Investment Act of 2002 (FSRIA), regularized the ad hoc payments under the new name of counter-cyclical payments and tied them to specific crop prices. In a further reversal of the spirit of the 1996 Act, Congress extended direct and counter-cyclical payments to additional crops, including soybeans and other oilseeds, and allowed farmers to update their historical acreage and yields information.
The simplest and most widely used aggregate measure of farm commodity programs is expenditures. Table 1 shows total annual expenditure under the programs from fiscal year (FY) 1996 to projections for FY2006, which ends September 30, 2006. Expenditures in FY1996 were mainly attributable to programs authorized in the 1990 Farm Bill, with expenditures in FY1997 through 2002 attributable to the FAIR Act and annual ad hoc legislation that began in 1998. Expenditures in fiscal year 2003 through projected expenditures in 2006 are attributable to the FSRI Act. However, given the nature of the marketing loan program and the counter-cyclical program, expenditures vary from year to year largely in response to prices of grains, oilseeds, and cotton.
Table 1: Total U.S. CCC Net Outlays, Fiscal Years 1996–20061
YEAR TOTAL EXPENDITURE (MILLIONS OF DOLLARS)
1996 4,6461997 7,2561998 10,1431999 19,2232000 32,2652001 22,1052002 15,6802003 17,4252004 10,5752005 20,18720061 21,257
Source: USDA Farm Service Agency USDA Economic Research Service (for 1996 and 1997 figures).
1 2006 data are estimates.
8 WOODS INSTITUTE FOR THE ENVIRONMENT | STANFORD UNIVERSITY
While U.S. commodity programs have remained, U.S. agriculture has naturally changed substantially in the past seven decades (Dimitri, Effland, and Conklin). Agriculture has become a much smaller share of the total economy, down to about 1 percent of gross domestic product (GDP). This is true in part because the prices of farm output have fallen relative to the prices of non-farm products. The share of the consumer budget for food that returns to the farm has fallen substantially, as more value added past the farm gate has been supplied by the marketing system. Within agriculture, the share of farms deriving most of their income from farming has fallen as the size of these commercial farms has grown. Both the small part-time farms and the commercial farms have also become more specialized. One of the most telling changes is that commercial farm operators now have higher incomes than non-farm people and substantially more wealth. Finally, international trade is even more important for agriculture, with both imports and exports growing relative to the 1930s. This handful of facts may support an informed discussion of farm policy options.
DISTRIBUTION OF FARM COMMODITY PROGRAM BENEFITS
While U.S. agriculture is large and diverse, about 90 percent of all farm program payments, which are the traditional focus of farm bill debates, are provided to a small range of commodities. This commodity focus has been a hallmark of agricultural support since the 1930s (Dimitri et al., 2005). For the most part, crop price and income support programs authorized under the 2002 Farm Bill cover feed grains (corn, sorghum, barley, and oats), wheat, oilseeds (soybeans, sunflower seed, canola, flaxseed, mustard, rapeseed, safflower, crambe, and sesame), upland cotton, rice, and peanuts. A participating farmer with base acres under one of these program crops is eligible for direct and counter-cyclical payments and marketing assistance loan programs.
Several minor or specialty commodities such as honey and wool have also received substantial payments relative to the size of the industries. Dairy has been supported by trade barriers, a small export subsidy program, relatively minor direct payments and a complex set of marketing regulations that allows price discrimination within the United States. A few other commodities, for example sugar and frozen concentrated orange juice, have significant trade barriers. But, despite crop insurance subsidies, disaster aids, marketing regulations, and occasional ad hoc programs, government subsidy or protection for most of the rest of U.S. agriculture is quite low. In particular, meats, fruits and tree nuts, vegetables and melons, ornamental crops and hay crops together receive almost no program payments and relatively little support of any sort. Table 2 shows the distribution across commodity of farm commodity program payment in recent years and, for comparison, the distribution in value of production across these same commodity groupings. The differences are stark. In discussing commodity programs, we should not lose sight of which commodities are included and which are not.

U.S. Agricultural Policy and the 2007 Farm Bill 9
Table 2: U.S. Cash Receipts and Program Payments1, Shares of Selected Agricultural Commodities, Crop Year 2002–2005 Average
SHARE OF TOTAL VALUE OF PRODUCTION
SHARE OF INDIVIDUAL COMMODITY PAYMENTS IN TOTAL OUTLAYS
Upland Cotton 1.9% 22.3%
Rice 0.6% 7.3%
Wheat 3.0% 9.5%
Corn 8.7% 43.5%
Soybeans 7.2% 5.5%
Other Grains/Oilseeds2 1.3% 4.2%
Horticultural Crops3 21.3% ~0.0%5
Meat Animals4 37.8% ~0.0%5
Dairy 10.8% 5.1%6
Other Commodities7 7.4% 2.5%
Total 100.0% 100.0%
Source: U.S. Cash Receipt data are available from the USDA Economic Research Service, Farm Income Data, accessible at: http://www.ers.usda.gov/Data/FarmIncome/finfidmu.htm
The commodity payment data is available from the USDA’s Farm Service Agency, Budget Division, “Commodity Estimates Book for FY 2007 President’s Budget” (for crop year 2002 and 2003 data and available at http://www.fsa.usda.gov/dam/bud/CCC%20Estimates%20Book/estimatesbook_PresBud.htm) and the “Commodity Estimates Book Material for FY 2007 Mid-Session Review” for crop years 2004 and 2005 and available at http://www.fsa.usda.gov/dam/bud/CCC%20Estimates%20Book/estimatesbook_MSR.htm.
1 Included in the total are Production Flexibility Contract Payments, Direct Payment, Counter-Cyclical Payments, Loan Deficiency Payments, Marketing Loan Gains, and Certificate Exchange Gains. For the dairy sector the figure consists of payments under the Milk Income Loss Contract (MILC) Program.
2 Includes barley, oats, sorghum, millet, flaxseed, peanuts, sunflowers, safflower, and miscellaneous oil seeds.
3 Includes fruits, tree nuts, vegetables, melons, and greenhouse/nursery.
4 Includes, cattle/calves, hogs, sheep, lambs and poultry/eggs.
5 Program Payments for the meat animal and dairy sector are very small and given here as approximately zero.
6 The data for the Milk Income Loss Contract Payment is only available by Fiscal Year. The share given is based on the average payment budgeted during fiscal years 2003–06.
7 Includes figures for tobacco, sugar, honey, wool and mohair.
Table 3 provides data from the Organization for Economic Cooperation and Development (OECD) on Producer Support Estimates (PSEs) for some major commodities for the United States and the E.U. Besides the commodity programs being discussed here, the PSEs include support provided by border measures and general support, such as public R&D funding that is not attached to a specific commodity. These data also show substantial support for the included program crops and little support for livestock products. As noted in the footnote to the table, OECD provides no PSE calculations for fruits or vegetables or cotton.

10 WOODS INSTITUTE FOR THE ENVIRONMENT | STANFORD UNIVERSITY
Table 3: Agricultural PSEs, by Commodity, 2004.
COMMODITY
2004
OECD EUROPEAN UNION
UNITED STATES
Wheat 33 39 32
Maize 31 43 27
Other Grains 43 48 39
Rice 75 39 18
Oilseeds 27 35 24
Sugar (refined equiv.) 58 65 56
Milk 36 30 39
Beef and Veal 34 68 4
Pig meat 21 24 4
Poultry 20 46 4
Eggs 9 2 4
All Included Commodities* 30 33 18
Source: OECD, PSE/CSE database 2005.
Notes: PSE is the percentage of producers’ gross income coming from government intervention. The OECD has recently discontinued reporting commodity PSEs because of difficulty associating payments to specific commodities. Table 3 and Figure 1 report the data from OECD that uses their long-standing methods for associating payments to commodities associated with historical base.
* The OECD data do not include cotton, which is highly supported in both the E.U. and the United States. They also exclude fruit, vegetables and tree nuts and other horticultural crops, none of which have significant support in the United States, but which tend to be highly supported in the E.U..
The distribution of commodity program benefits across states and regions follows the commodity distribution. In those states and regions that concentrate on producing program crops, the share of farm revenue from program payments are large. Those states with higher shares of farm output from livestock or horticultural crops have a smaller share of farm revenue from payments. The crescent-shaped band starting with Texas and moving through the Delta region and up through the Corn Belt to the northern plains states and into Montana are in the top tier of states that depend on farm commodity payments for a large share of farm revenue. California, which has the highest farm revenue in the nation, is the only major agricultural state in the bottom quartile of states in terms of dependence on farm commodity payments (USDA, May 2006). The differences are large. For North Dakota and Mississippi, government payments are about 20 percent of gross cash receipts, whereas in California, payments are only about 2 percent of cash receipts (USDA, ERS U.S., and State Farm Income Data).
The distribution of farm commodity payments by farm size and revenue class also follows the pattern of production of program crops. About 57 percent of farms in the United States are small operations with farm sales of less than $10,000. They account for only 1.6 percent of farm value of production and receive only about 1.3 percent of farm government commodity payments. Small operations with sales between $10,000 and $99,999 account for about 11.3 percent of value of production and receive about 17.1 percent of government commodity payments. At the other end of the scale, the larger farms with sales of more than $500,000 and the non-family farms account for about 58.4 percent of value of production and receive about 34.5 percent of government commodity payments (Hoppe and Banker).

U.S. Agricultural Policy and the 2007 Farm Bill 11
Clearly, the great bulk of farms in the United States produce very little farm output and receive almost nothing in commodity payments. Payments are skewed towards the mid-sized farms relative to farm output, and this reflects the nature of program crop production relative to livestock or horticultural crops.
OVERVIEW OF MAIN COMMODITY PROGRAMS
The market context for the 2002 Farm Bill included low farm prices in the United States and a perception on the part of some farm groups that the FAIR Act and the 1994 Uruguay Round WTO deal did not create the farm prosperity that had been promised. This perception of policy failure, together with a budget surplus, was enough to ensure that farm spending would not be reduced from the recent amounts. Early projections indicated that the FSRIA would spend far more than the FAIR Act, but many of those comparisons ignored the ad hoc adjustments of 1998 through 2002. In fact, the FSRIA spending was lower than spending had been in the previous years when ad hoc payments are counted. Because of more favorable crop prices, outlays under the 2002 Act will be substantially less than had been projected in 2002.
The FSRIA maintained the Market Assistance Loan program (commonly called the marketing loan program). Compared to the 1996 FAIR Act, the 2002 Act raised marketing loan rates for corn and wheat and lowered loan rates for soybeans, but made no change for rice and cotton. Marketing loan provisions are extended to peanuts, wool, mohair, honey, small chickpeas, lentils, and dry peas. These “loan rates” are used to determine the magnitude of marketing loan benefit rates, which are defined as the (positive) difference between the loan rates and loan repayment rates. The government no longer props up market prices or accumulates stocks. The loan rates vary by region, type, class, and quality, and loan repayment rates vary weekly, linked to either local prices (for feed grains, wheat, and oilseeds) or international market prices (for rice and cotton). The marketing loan benefits are payments made either at the time of harvest or later when the crop is removed from loan and marketed. Because they apply to all production of the program crop on eligible farms, the marketing loan program provides a clear incentive to increase or maintain production of the program crop.
Direct payment rates are roughly equal to those that applied in 2001, except that now farms with a history of soybean, peanuts, or other oilseed production are eligible. Direct payments apply to the program base area times the program base yield. In 2002, farmers were allowed to update the base area (and, of course, farms growing oilseeds had to establish a base for those newly eligible crops). Farmers may exercise considerable flexibility in their land use while still maintaining eligibility for direct payments, but they forgo payments or lose eligibility for payments if the base area is shifted out of agriculture altogether or used for fruits, tree nuts, vegetables, melons, or wild rice.
The counter-cyclical payment (CCP) program uses a target-price framework, with payments tied to historical bases and limited flexibility in ways that are similar to the direct payment program. Under the CCP program, when the national average price for a commodity falls below the target price, a complex formula triggers payments. Thus, while the program does not require farmers to plant base land to the program crop, it does provide payments that offset low prices of the specific program crop.
The first impact of these programs is to transfer considerable revenue from taxpayers to the eligible farms. Payment recipients include both farm operators and share-rent landlords. However, cash rent landlords also benefit from the programs because land rents tend to adjust in response to payments expected on program base land (Gardner 2003). Indeed a farm operator who rents all the land used may receive large payments but would retain little of the benefit of the program if rents were adjusted fully. The economic literature on how much and how soon cropland rents adjust to payments remains unsettled, but the best recent estimates suggest that much of the payment is not reflected in rents, at least in the short run.

12 WOODS INSTITUTE FOR THE ENVIRONMENT | STANFORD UNIVERSITY
COMMODITY PROGRAM IMPACT ON MARKETS
There is considerable debate in academic and trade policy circles about the supply incentives built into current farm programs. Issues related to supply effects of so-called “decoupled” subsidies and effects of planting restrictions, price connections, and base updating or expected base updating are central to the discussion. It is also important to assess how the programs themselves condition supply response estimates (McDonald and Sumner).
An interesting change in the FSRIA compared to the prior law was the updating of base areas and base yields from those in the FAIR Act and prior programs. Voluntary updating to the recent period caused more of the payments to flow to those farms that had grown more of the program crops recently. But, more important for market effects and WTO considerations, updating naturally causes growers to raise the probability of future updating. Planting decisions in one year affect the present value of future payments. If growers now anticipate another opportunity to update their payment base and, especially, if they believe that base yield updates may be tied to base area updates, growers will plant more of the program crop now to build, or maintain, a program base for the future (Sumner, 2003, and Young et al.).
Much attention has been devoted to and some evidence has been generated about the supply effects of farm commodity programs in the United States (Gardner, 2003; Sumner, 2005a). USDA economists have written extensively on the topic (see for example, Young and Westcott; Westcott and Young; Key, Lubowski, and Roberts; Goodwin and Mishra, 2005 and 2006). It is generally accepted that marketing loans stimulate production at least as much as would direct market revenue and that counter-cyclical payments also have significant production incentives. The analysis and evidence suggest smaller effects for direct payments.
The dairy program has three main features in addition to import barriers. Unlike crop programs, the dairy industry continues to have a price-support program under which the USDA stands ready to purchase cheese, butter, or non-fat dry milk at government-set support minimum prices. However, with few exceptions, the support prices are consistently well below the market prices, and the amount of support afforded by this program is small. Federal milk marketing orders also regulated markets for dairy produces, especially fluid milk, but the effect on the overall level of returns to dairy farmers is quite small.
The Milk Income Loss Contract (MILC) Program authorized by the FSRIA provides a deficiency payment that distributes payments when prices are low. Payments under the program are equivalent to between 5 and 10 percent of total milk revenue for fully eligible dairy farms. The MILC payment rate varies monthly depending on the difference between a government-set minimum and an index market price in that month. However, payments are limited to a maximum of 2.4 million pounds per operation in a year. This limit affects a smaller share of total production in New England or the Upper Midwest. But, almost all producers in the West find their payments limited to the maximum in low price periods. For the larger farms, which produce about 70 percent of the milk in the United States, the program is equivalent to direct payment where the size of the payment is inversely related to the price of milk but does not vary with production. For smaller farms, which produce about 30 percent of milk in the United States, the program adds about 10 percent to expected revenue per unit. This calculation suggests a supply increase of a few percent. The U.S price of milk is therefore lower by a few percentage points because of the MILC program.
WHY HAVE FARM COMMODITY PROGRAMS AT ALL?
Over the years, many concerns have been cited as rationales for the creation and maintenance of farm commodity programs. The following list contains thirteen concerns or problems that government programs may be supposed to address in agriculture. There are more, but this list is representative. In the 1950s, Johnson (1958) considered

U.S. Agricultural Policy and the 2007 Farm Bill 13
rationales for government support for agriculture and, in addition to some on our list, focused on some issues that were relevant then (national defense and smoothing of macroeconomic fluctuations) that seem less relevant now. Thompson recently considered a subset of our list. We phrase each item as a problem that does exist now or would exist, if farm programs were not in place.
1. Low farm prices
2. High price variability
3. Farm and rural poverty
4. High income variability
5. Low rates of return on farm investments
6. Rural asset values would be too low
7. Slow rural development, dwindling rural populations
8. Low environmental quality of rural landscape and spillovers outside rural areas
9. Imbalance of power favoring commercial buyers of farm goods
10. Food prices for Americans would be too high
11. Food supply for Americans would be insecure
12. Government regulations lower farm returns
13. International competitors are subsidized.
In the rest of this section we discuss each of these issues and explain the concern in more detail. We then consider two questions about each. First, is this a serious public problem (not solely a problem for farms, firms, and industries, which they respond to, appropriately, in their own private capacity) that occurs in U.S. agriculture, or would it occur in absence of commodity programs? And, second do current commodity programs adequately address this problem?
Without farm programs, we would face low farm prices, high price variability, high farm and rural poverty rates, high income variability, and low rates of return on farm investments
The first set of five concerns refers to what was historically called the “Farm Problem” (Gardner, 1992). These were among the issues on which New Deal farm commodity programs focused. Those that stress these concerns argue that markets simply do not function properly for agricultural commodities. The argument is that supply-and-demand conditions often cause farm prices to be lower than advocates prefer or cause prices to be overly variable. Johnson (1947) presented a well-articulated case for a government-run forward price scheme to mitigate adverse effects of market price fluctuations without raising average prices. His analysis did not fully consider how the government could effectively operate forward prices without resorting to price support.
Of course producers would almost always like higher prices and sometimes benefit from less variability. The challenge is to explain why the prices that result from market forces are too low and variable, when interests of consumers, producers, and taxpayers are all taken into account, and why markets for other goods in our economy, including those for most farm commodities, do not require such price regulation. For the most part, current farm programs no longer regulate market prices; instead the marketing loan and counter-cyclical payment programs use government payments to top-up market prices for producers and thereby contribute to more production and more farm income. Ironically, by supporting producer returns these programs contribute to reduced market prices.

14 WOODS INSTITUTE FOR THE ENVIRONMENT | STANFORD UNIVERSITY
There is no question that rural poverty is a major concern in the United States. Data assembled by the USDA Economic Research Service documents the extent and characteristics of rural poverty (USDA, ERS Rural Income, Poverty Welfare Briefing Room). However, the argument for supporting farm incomes in order to remedy farm poverty is no longer a viable argument, if it ever was. As noted above, because they are roughly proportional to production of program crops, farm commodity payments flow largely to individuals who are relatively wealthy compared to the national average. This income transfer is real, and removing it would cause a loss. Even strong program advocates no longer claim a significant link to poverty reduction. The USDA data shows conclusively that whatever poverty remains among farm operators and landlords, farm commodity programs cannot be used to remedy this concern.
The argument for attempting to smooth income variability is stronger. The question that remains, however, is what defines a socially unacceptable amount of variability, especially when the farmers involved chose farming as an occupation or investment, usually have above-average incomes, and can respond to variability with market mechanisms, such as off-farm work and investments, diversification, hedging, and saving or lines of credit. All farms use one or more of these risk management tools, and among the larger farms that receive the large majority of farm payments, sophistication in use of risk management tools is high. It is certainly not an argument for continued government support that farmers operating businesses with gross revenues of several hundred thousand dollars are not aware of the risks they face or are not competent enough to use available tools to manage those risks. Since most small farms earn only a very small part (or more likely a negative part) of their family income from farming, risk management for them is a much smaller issue, and they receive only a small share of benefits from the programs in any case (USDA, May 2006).
Even if smoothing farm income variability were accepted as a reasonable rationale for government programs in agriculture, the question that remains is, why would farm subsidies be required for only a handful of program crops, when most of agriculture also faces variability and does not require subsidies. Finally, for many years analysts have pointed out that income stabilization does not require subsidy and, if income subsidy were not involved, could be operated at very low costs. There is little or no support among program advocates for this zero-budget approach.
Many arguments have been advanced over the years for why rates of return to investments in farm assets might be low. Past arguments include a shrinking overall size of the farm economy (in absolute terms, not as a share). The economic reasoning was that excess resources in agriculture and a steady flow of resources out of agriculture implied that returns were lower in farming than in other investments. Data support this idea for farm human capital through the 1960s, but no longer. Some also argue that farmers are willing to accept low rates of return on farm investments in order to continue farming. However, it seems odd to argue that farmers need subsidies because they like to farm. Furthermore, expected government payment may raise the price of assets tied to those payments, but such payments cannot raise the flow rate of return unless they are unanticipated and therefore do not raise the asset prices.
Without farm programs, rural asset values would be too low.
There is no question that farm payments raise the prices of land and perhaps other assets, including human capital, to which payments are linked economically. This is just the long-run or capital market manifestation of the income gains noted earlier. If payments were reduced or eliminated, prices of farmland with program base, and of other farm assets, would decline. A wide range of potential declines range from a few percentage points to 20 percent or more in some regions where payments are large and much farmland is tied to production of program crops. This loss of asset values represents the capitalized value of the expected benefits to the farm asset owners. Offsetting this loss, of course, is the gain to consumers and, especially, taxpayers. Most standard economic models would show that the loss to the

U.S. Agricultural Policy and the 2007 Farm Bill 15
farm asset owners is smaller than the gain to taxpayers and consumers, but that is not to recognize the significant loss to a clearly identifiable part of the economy. Of course, higher farm asset values, while positive for existing owners, are not positive for those wanting to enter farming or those who operate farms without owning the asset base. (About 60 percent of U.S. farm land is operated by tenants.) That means that by supporting incomes and asset values, farm programs make financing the entry into farming by young and beginning farmers more difficult.
Without farm commodity programs, we would face slower rural development and dwindling rural populations.
Number seven on our list deals with vulnerable rural communities. Rural areas in many regions of the country are experiencing population declines. This may lead to concerns such as the lack of viable community sizes for local provision of medical, educational, shopping and other services (ERS Population Briefing Room). However, all available evidence indicates that, with relatively few local exceptions, farm commodity programs have little role in rural population and development issues. The main reason is that farm population and income is a very small share of rural population and income. That is, almost all rural communities rely on non-farm sources for their economic viability. Sometimes the non-farm occupations rely on farmers as customers, but increasingly farm inputs and marketing services are not purchased from local rural suppliers. Furthermore, farm payments are not targeted to vulnerable rural communities or even to rural residents. Thus, whatever impact farm commodity programs have on rural community viability are indirect at best. Spending on farm commodity programs is an inherently ineffective tool for dealing with rural development.
Farm programs improve the environmental quality of rural landscape and reduce spillovers outside rural areas.
Concerns about rural environmental spillovers have been important since at least the 1985 Farm Bill. To the extent that farmers and landowners have limited private incentives to provide an appropriate amount of environmental management or services, government regulation or support can play a positive role. However, commodity programs are not designed to play this role. At best commodity programs can be configured to contribute less environmental damage. But it takes other types of programs—those tied directly to environmental outcomes, not those tied to commodity production—to effectively deal with the rural environment. Indeed many of the most vocal advocates for more support or regulation to deal with environmental issues are also advocates for redesigning or eliminating commodity programs (for example see the Environmental Working Group).
Farm commodity programs address the imbalance of market power favoring commercial buyers of farm goods.
A longstanding concern of farm advocates is that businesses that sell to or buy from farmers are able to take unfair advantage of their market power relative to farmers, who because they are many, have no market power. The recognition of this concern in the 1920s, before farm commodity programs were begun, led to government efforts to encourage farmer cooperatives and allow them to exercise market power that would be illegal if undertaken by other firms or cartels. Antitrust laws against exercise of market power already limit the behavior of agribusiness firms, so the first policy response to damaging behavior by commodity buyers is to enforce the restrictions already enacted. Commodity programs do not deal directly with market power by commodity buyers, although if prices are unfairly depressed, then payments can offset these low prices. Of course, if this is a major rationale for farm payments, the current programs are extremely blunt instruments. The current programs are in no way targeted to those commodities or regions where market power is most evident and no evidence of market
16 WOODS INSTITUTE FOR THE ENVIRONMENT | STANFORD UNIVERSITY
power is required for setting subsidy levels. It is remarkable that the highest subsidy rates are in rice and cotton, where much of the commodity buying and marketing is handled by farm cooperatives.
Without farm commodity programs, food prices for Americans would be too high and food supply for Americans would be insecure.
Concerns 10 and 11 deal with the price and security of the American food supply. These concerns are raised regularly in discussing farm commodity programs. For example, as recently as September 15, 2006, USA Rice Federation President Al Montna stated, “that the Farm Bill benefits American consumers is apparent in every trip to a grocery, where costs of the highest-quality foods are among the lowest in the world on a per capita basis.” And USA Rice Producers Group Chairman Paul T. Combs said that “the Farm Bill represents fiscally responsible farm policy that provides support in a consistent and predictable manner, helping in a large measure to create a stable, low-cost food supply for American consumers.” These statements are consistent with the observation that farm commodity programs stimulate production of program crops and hence lower market prices for these commodities. However, two further questions arise. First, why would it be appropriate to use tax funds to lower the market prices of selected commodities rather than allow food prices to be determined by market forces? Food stamps and other food assistance programs respond to concerns of consumption of the poor. Second, given the very small share of farm commodity prices in retail food costs and the small share of all of agriculture covered by farm commodity programs, the effect of these programs on food budgets is small. Analysis suggests that commodity programs lower prices of the grain and oilseed commodities by 10 percent or less, and the share of farm price of supported commodities in the retail price of food is well less than 10 percent. Multiplying the price impact times the share results in an impact on food prices that is far less than one percent. Clearly this is not enough to claim that farm commodity programs have any significant effect on retail food prices or the share of income spent on food by U.S. consumers. Furthermore, the commodities subsidized are those that are exported from the United States. Wheat, soybeans, rice, and cotton all have export shares in excess of 30 percent, while the export share for corn has recently dropped to just under 20 percent because of the increase in the share of corn entering the energy market (Table 4). Reduced production of these crops caused by lower subsidies may mean smaller export shares, but could not make food consumption in the United States vulnerable.
Farm programs may compensate for government regulations that lower farm returns and offset subsidies by international competitors.
As with other business, farms face environmental and business regulations that are costly. Even if these regulations may have benefits for the society as a whole, part of the costs are borne by farms, and those costs reduce the bottom-line returns to farm production. Subsidies may be used to compensate for these added costs of compliance. Assuming that compensation is appropriate implies that farms have a prior right to be free of regulation; therefore, if regulations restrict use of farm inputs or use of land, farmers should be reimbursed for any added costs or reduced revenues. This approach is not generally followed in environmental or other business regulation, but one could argue that farms are a special case. What is harder to argue is that only farms that grow a handful of selected commodities are the special case that does not apply to growers of other commodities that are at least equally regulated.
The United States is certainly not the only nation that provides support to agriculture. Norway, Switzerland, Korea, and Japan all provide higher subsidies to farmers (Table 3). Even after the implementation of the 2002 Farm Bill, the E.U. still provides more support for agriculture (relative to market value of production) than does the United States. E.U. subsidies are higher for all commodities (except dairy in 2004), with large differences for beef, pig meat, poultry, oilseeds, corn, and other grains. To a lesser extent, the E.U. also subsidizes many fruits, vegetables, and tree nuts.

U.S. Agricultural Policy and the 2007 Farm Bill 17
Calculations based in recent data suggests a U.S. PSE for cotton of about 50 percent in 2004, with the figure in the E.U. being significantly higher, but the E.U. cotton production is small (Sumner, 2005b).
So let us accept that other countries also use commodity subsidies and trade barriers. Does that imply positive social benefits to farm programs in the United States? That is, do foreign subsidies and trade barriers for farm products imply that the United States should also subsidize those crops? Certainly, foreign subsidies may seem unfair and that may seem to be justification enough for U.S. subsidies. However, in many cases foreign policies have long been part of the global conditions in a market, like transport costs or climate. Subsidies by U.S. taxpayers and consumers still cost the U.S. economy and draw resources into an industry. And, of course, the current programs are not calibrated to countervail important subsidies by trading partners. In some cases the most important global competitors have little subsidy of their own, and the United States is the most important subsidized participant in the market; in other cases, as with many fruits and vegetables, the United States has no subsidy, while competitor products are heavily subsidized or protected.
Summary
To summarize, a few points resonate through all the economic rationales for commodity programs. First, none of the arguments for subsidy programs account for the current distribution of support across commodities. Second, even if they suggest some government involvement in markets, none of the arguments account for the form of commodity programs we now use in the United States. Third, neither commodity programs nor arguments for them suggest that a goal is long-term productivity or long-term health of the industry. In fact, there is no evidence that the subsidized commodity industries are more innovative or successful on any dimension than those parts of agriculture with little or no subsidy. There is no evidence that the cotton industry is stronger or more successful than the almond industry or that the wheat industry has a better record of productivity than the alfalfa hay industry. Thus, whatever the appropriate rationale for commodity programs, it is hard to claim that they solve any long-run problems of farm commodity industries.
So, why do we have the familiar farm commodity programs? The strongest rationale may be that we have farm programs because we have had them for three of four generations. For the supported commodities, the programs have been so thoroughly imbedded into all aspects of the industry that producers and others find it hard to imagine how the industry would adjust to a market without the programs. Adjustment is complex, and when support has been a part of an industry for more than three generations, it is not surprising that there would be resistance to change. Furthermore, removing or radically changing farm commodity programs would reduce the income support available to current recipients and thus reduce asset values. This may be an appropriate move for consumers, taxpayers, non-subsidized producers and the economy as a whole, but it is unlikely to be positive, at least in the short run, for those who currently receive benefits. Change is hard, and it is doubly hard when it is likely to reduce income flowing to the industry.
FORCES DRIVING THE CURRENT FARM PROGRAM DIALOG
The previous section reviews more than a dozen rationales for maintaining farm commodity programs. That review found that many do not seem to fit the current facts of U.S. agriculture or fail to make a compelling case for why the programs are in the interest of the nation as a whole rather than in the interest of beneficiaries involved in the production of a handful of program crops. It is clear why those with a base in the program commodities would support some variant of the status quo. This section moves to the more current question: given the long history of the commodity programs, what are the forces for change?

18 WOODS INSTITUTE FOR THE ENVIRONMENT | STANFORD UNIVERSITY
Debate and positioning for the Farm Bill expected in 2007 is by now well underway. Many farm organizations and other groups have begun to stake out positions, with a number of commodity organizations suggesting that the FSRIA should simply be extended for as many years as possible. Congressional committees and their staffs have begun to develop background information to help members understand the legislative options (Monke), and the USDA is releasing relevant data and analysis in the form of commodity “Backgrounders” and “Theme Papers.”
A number of forces have been driving the Farm Bill debate, and these may be reviewed briefly as we consider the prospects for thorough changes (this section is adapted from Alston and Sumner; see also Thompson). But before considering prospects for fundamental change, we should note that the forces for the status quo have been remarkably successful for about seven decades. Furthermore, in 1996, Farm Bill changes were actually supported by mainstream commodity groups that expected high market prices to mean that the price-based subsidies would be of little value in the short run. With somewhat more open international markets, these groups also saw less value to land set-asides and government stock activities. Thus, to these groups it seemed sensible to exchange price-dependent deficiency payments that required land idling for guaranteed payments. It became an even better trade-off when, as soon as prices declined, Congress initiated ad hoc payments to offset losses. Both the direct payments that arrive even when prices are high, and the counter-cyclical payments, which do not require that land be idled, were institutionalized by the 2002 Act to join the marketing loans that pay on all production when market prices are low. It is not surprising that this package is popular with many program crop producers.
Several stimuli for market-oriented changes in farm subsidy programs may be identified and discussed briefly in turn. First, and perhaps most important, the U.S. budget deficit is projected to exceed $300 billion in FY2006 and to remain high, in the range of $270 billion in 2007 (Congressional Budget Office, 2006). Over the past two decades, farm subsidies have declined when budget deficit pressures were high. And farm subsidies increased in 2002 when the budget was temporarily in surplus. Budget deficit pressure was credited for moderating the inclusion of massive farm disaster payments in emergency legislation in June 2006 (Wolf, 2006). But budget pressures needs to be put in perspective. With farm subsidy outlays of perhaps $20 billion per year, everyone realizes that farm programs will not be a major contributor to budget reduction. Unless there is a non-budget case for deeper reforms, cuts in farm programs would be a small part of a broad-based cut in outlays, perhaps in the range of 5 percent to 10 percent. So, while budget pressures may moderate outlays and reduce some market effects of subsidies, they are unlikely to cause program elimination or other major policy shifts.
The revised estimates of commodity program budget costs under the 2002 Act that were released in August 2006 are lower because projected market prices for major program crops are higher. The budget projections for 2008 to 2013 under the current farm projects are now very low relative to the past because commodity prices are projected to be high for the next five years. This means, even under current law, projected outlays for the marketing loan program and the counter-cyclical payment program are expected to zero for several major commodities. Those who favor extension of the 2002 Act argue that the lower projections show that the spending under the current programs is moderate and pressures from the budget deficit should be discounted. At the same time, if the benefits of the current programs are likely to be small in the next few years, producer groups may opt, as they did in 1996, to accept guaranteed benefits rather than the current programs that only make major payments when prices are relatively low.
Second, environmental groups and their allies have long argued for farm program changes. These groups were successful over the past few decades in attaching environmental provisions to commodity programs in previous farm legislation. The current thrust is to replace commodity subsidies with support for conservation and environmental services that may be provided on-farm. The Conservation Security Program created by the 2002 Act was a small and awkward step in that direction that tied some payments to approved practices on farms. Those with a particular interest in the “Conservation”

U.S. Agricultural Policy and the 2007 Farm Bill 19
title of the Farm Bill have now focused aggressively on using funds, which might otherwise have gone for commodity programs, for subsidies attached to practices that supporters hope will provide environmental benefits. These forces have the support of the mainstream media that typically have opposed farm subsidies.
Third, urban newspapers and those who want to shift farm subsidies to other purposes have long pointed out that most farm payments are associated with relatively large farms, and that a small share of total farms receives the bulk of farm payments. Given that most of the payments are roughly proportional to current or historical production, payment programs that support commodities must distribute most payments to those who produce a significant amount of commodity output. That is, the distribution of payments is inherent in the program’s structure; larger farms and wealthier individuals do not receive the bulk of payments because of loopholes or legislative accidents, as is sometimes implied. Farm subsidy payments never were, and cannot be, effective welfare programs for the poor (Sumner, 1991). It is no secret, and no mistake, that most farm program payments go to a comparatively small number of relatively wealthy farm owners. Nonetheless, pointing out this truism is a perennial topic of the urban press that usually comes to full blossom when the Farm Bill season approaches. The argument is now even easier to make because detailed data from the Environmental Working Group (www.ewg.org) are well known and available in an easy-to-use format.
Fourth, growers of non-supported crops are more active in the current Farm Bill debate than ever before. Many observers have commented on the distribution of farm program payments to a handful of field crops plus dairy farms. Growers of non-supported crops have begun to argue for more support for research, marketing programs including nutrition education, protection from invasive species, and opening international markets. These groups have directly challenged spending such a high proportion of the agriculture budget on income transfers that do little to improve productivity or competitiveness.
Growers of non-payment crops have pointed to their lack of direct support as one rationale for restricting production of wild rice, fruits, vegetables, melons, and tree nuts on land that receives direct payments. They have argued that allowing direct payment recipients to shift to the restricted crops would flood their markets and drive down prices, because total acreages of the restricted crops tends to be small relative to acreage of program crops and because demand is inelastic. Furthermore, they have argued that there was something inherently unfair about growers that were subsidized based on production of one crop being free to compete in production of another crop with growers who have never been eligible for subsidy.
The effect of commodity programs on non-program commodities is complex. When subsidized crops compete with non-program crops for the same land and other resources, acreage of non-program crops is lower and prices are higher than otherwise. However, program crops may also compete on the demand side, and lower program crop market prices may cause lower market prices—of hay, for example. Subsidies for grains and oilseeds reduce livestock feed prices. Lower feed prices increase the price of feeder stock (which are economic complements for feed) and lower finished livestock prices. Other effects on non-program crops are channeled through policy influences.
By dominating the agricultural budget and policy attention, program crop subsidies hinder attention to interests of unsubsidized commodities. On the budget side, spending on crop subsidies uses budget dollars that might otherwise go for investments in public goods that would improve agricultural productivity or enhance demand for farm products. Expenditures on research, protection from invasive species, nutrition information and infrastructure investments may be crowded out by outlays on commodity programs. More generally, with federal agricultural attention focused on subsidy issues, there is simply less attention to issues that could improve the economic and environmental sustainability of agriculture. In international negotiations, protection of farm subsidies is a central pillar of the United States. The U.S. reluctance to reduce subsidies more substantially was a major factor in the collapse of the July 2006 Doha Round WTO negotiations that had the potential to improve market access of non-program commodities. Certainly that is the perception of negotiating partners who simply do not trust the United States to really cut subsidies. One consequence of

20 WOODS INSTITUTE FOR THE ENVIRONMENT | STANFORD UNIVERSITY
this situation is that other countries, such as those in the E.U., are less willing to open their markets, which harms U.S. export-oriented industries such as tree nuts, tree fruits, processing tomatoes, and others.
Groups such as Western Growers successfully pushed for the Specialty Crops competitiveness Act of 2004 to redress some of these problems, not by subsidy programs for specialty crops, but by demanding promotion, research, and other efforts to improve productivity. Their current goal is a title in the 2007 Farm Bill that would address concerns of non-subsidized crops (Western Growers).
Fifth, WTO negotiations have highlighted how growers and policy makers in other countries are offended by U.S. domestic farm subsidies. In formal proposals and informal negotiations, the United States has emphasized that it sees gains in agricultural market access as a quid pro quo for reducing and reforming U.S. commodity subsidies. A WTO deal with meaningful market access would likely require substantial cuts in U.S. “trade-distorting” domestic support. Hence, commodity interests and others who see benefits to U.S. agriculture from greater international market access have successfully urged the inclusion of farm subsidy cuts in the U.S. WTO proposals. If the Doha Round is able to get back on track for a substantial agricultural deal sometime in 2007, it could be a significant force in the 2007 Farm Bill debate (Thompson). If the Doha Round continues to be unresolved, this motive for farm subsidy changes in the United States will be put on hold. Furthermore, failure in the Doha WTO Round may strengthen the position of those who argue that farm subsidies are needed to compensate for subsidies and barriers in other countries or to keep a bargaining chip for the next set of negotiations.
Sixth, the core existing WTO agreement has implications for U.S. farm subsidies and is an active force for farm program reform. The results of the WTO dispute over the U.S. upland cotton program suggest that several other U.S. farm programs also may be vulnerable to WTO challenges (Sumner, 2005a). This point has been made repeatedly by Congressional leadership and the Secretary of Agriculture. Two features of the cotton ruling have particular importance for commodity programs. First, subsidy programs are vulnerable to challenges if they depress or suppress market prices or if they unfairly reduce the production in other countries and thereby harm the interests of commodity producers in other WTO member states. Other commodity program challenges will not necessarily follow the model of the cotton case, and we can envision, for example, cases that focused on specific foreign markets rather than the whole world market. Furthermore, in another case, with a different set of facts, challenges based on the price-depressing effects of crop insurance or direct payments could be successful when that argument was not relied upon in the cotton case. Second, the ruling that crop insurance, counter-cyclical payments, and direct payments all counted towards support for upland cotton suggests that the WTO Appellate Body has a broad view of what constitutes support. In the cotton case, the Panel and Appellate Body referenced the list of crops disallowed under the “direct payment” program, and this provision, at a minimum, is now likely to change. But U.S. programs are vulnerable for inclusion in the “Amber Box” and even in the commodity-specific AMS for other reasons as well.
Seventh and finally, economists and those who use economic evidence have continued to point out serious negative consequences of farm subsidy programs for resource allocation, among other concerns. Economists have pointed out that benefiting one commodity may harm others, that benefits tend to accrue to owners of land and similar resources, and that many of the most dynamic, innovative, and successful agricultural industries are found among those that are not encumbered by subsidy programs. These economic arguments are not new, and economists have not been notably effective in getting their views accepted (Gardner 1992, 1996).

U.S. Agricultural Policy and the 2007 Farm Bill 21
CONCLUDING OBSERVATIONS ON ALTERNATIVES TO THE CURRENT COMMODITY PROGRAMS
Farm commodity programs have been a part of the American agricultural landscape for many decades and they continue to garner strong support from program recipients. Most of the programs now focus more directly on income transfers from taxpayers rather than transfers from consumers through supply control and price supports. But the thrust of the programs remains in place. This background paper has explored the extent to which the current commodity programs continue to fit with the realities of modern American agriculture and how they correspond to rationales offered for their continuation. We also considered some forces for program modifications in the 2007 Farm Bill. The question remains, if commodity programs as now configured were eliminated, what, if anything, would replace them.
One option, favored by some economists and advocates for smaller government in general, is to simply eliminate commodity programs as rapidly as possible (Cato). Other programs affecting rural affairs would then be considered on their individual merits. Others suggest that the commodity programs be downscaled, so that funds can be reallocated within agriculture to focus more directly on objectives that they favor. Farm commodity program supporters often accept the importance of these goals, but object to reducing support for current programs in order to fund new programs.
One key objective receiving attention is long-term productivity growth and competitiveness of all of U.S. agriculture. The idea here is that some broad public goods and industry collective goods will not be supplied appropriately without some government involvement and perhaps funding. Examples include agricultural research and development, information services, negotiation of more open global markets, control of harmful invasive species and improved rural infrastructure. Added government support for these areas is tied to changes in commodity programs because, it is argued, federal policy attention and funds are now so concentrated on financial support of a few commodities that other more important long-run concerns are crowded out. The USDA Farm Bill theme paper on the future of agriculture deals with some of these issues.
A second objective is improvements in the rural environment and reduction in negative environmental spillovers from agriculture. Here again, there is widespread support for the goals. The advocates for this objective point to the relatively small share of the agricultural budget allocated to conservation and the environment, especially for working lands, compared to commodity programs. The argument is that a substantial reallocation of funds is necessary to achieve a whole host of environmental objectives through incentives and compensation rather than mandatory regulation. Many groups have urged this sort of shift, including, for example, the American Farmland Trust. A third uncontroversial objective is to enhance rural economic growth and development, encompassing development of broad economic activities and support for rural services. The notion here is to attack directly the loss of population in some rural areas and the growth in poverty in other areas. USDA lists a whole host of projects and proposals for rural communities in its recent theme paper on rural development (July 2006).
Proposals for major changes in farm commodity programs are a perennial of farm policy analysis and debate. That said, the 2007 Farm Bill is being developed during a period of particular attention to the problems of the current programs and unmet goals that could be addressed by alternatives. This paper is an attempt to provide some context to a broad-ranging discussion.

22 WOODS INSTITUTE FOR THE ENVIRONMENT | STANFORD UNIVERSITY
Alston, Julian M. and Daniel A. Sumner. “Perspectives on Farm Policy Reform.” Keynote Guest Address Western Agricultural Economics Association Annual Meeting, Anchorage, Alaska, June 28–30, 2006
American Farmland Trust. Farm Policy Campaign. Website. http://www.farmland.org/programs/campaign/default.asp
Benedict, Murray R. Farm Policies of the United States, 1790–1950: A Study of Their Origins and Development (New York: The Twentieth Century Fund, 1953).
Bowers, Douglas E., Wayne D. Rasmussen, and Gladys L. Baker. History of Agricultural Price-Support and Adjustment Programs, 1933–84, Background for 1985 Farm Legislation. Agricultural Information Bulletin No. 485 (Economic Research Service, USDA: 1984).
Cato Institute. “Agricultural Policy,” Chapter 30, Cato Handbook for Congress: Policy Recommendations for the 108th Congress, (2003) http://www.cato.org/pubs/handbook/hb108/hb108-30.pdf.
Congressional Budget Office. “The Budget and Economic Outlook, Fiscal Years 2007 to 2016.” Congressional Budget Office, Congress of the United States, Washington DC, January 2006. http://www.cbo.gov/ftpdocs/70xx/doc7027/01-26-BudgetOutlook.pdf (accessed June 20, 2006).
Dimitri, C., A.B.W. Effland, and N. Conklin. “The 20th Century Transformation of U.S. Agriculture and Farm Policy.” Economic Information Bulletin No. 3 (EIB3) 17 pp, June 2005.
Effland, Anne B.W. “U.S. Farm Policy: The First 200 Years,” in Agricultural Outlook (Economic Research Service, USDA: March 2000).
Gardner, Bruce L. “Changing Economic Perspectives on the Farm Problem,” Journal of Economic Literature, 30:1 (March 1992).
Gardner, Bruce L. “Why experts on the Economics of Agriculture Have Changed Their Policy Tune.” The Economics of Agriculture, Volume 2: Papers in Honor of D. Gale Johnson, John M. Antle and Daniel A. Sumner, eds. Chicago: University of Chicago Press, 1996, pp. 225–243.
Gardner, Bruce L. “Agricultural Relief Legislation in 1998: The Bell Tolls for Reform.” The Cato Review of Business and Government Regulation 22(1)(1999): 31–34.
Gardner, Bruce L. “U.S. Agricultural Policies Since 1995, with a Focus on Market Effects in Grains and Oilseeds,” Working Paper 03–14, Department of Agricultural and Resource Economics, University of Maryland, 2003.
Glauber, Joseph W. “Crop Insurance Reconsidered.” American Journal of Agricultural Economics 86(5)(December 2004): 1179–1195.
Goodwin, Barry K. and Ashok K. Mishra. “Another Look at Decoupling: Additional Evidence on the Production Effects of Direct Payments.” American Journal of Agricultural Economics 87(5), December 2005.
Goodwin, Barry K. and Ashok K. Mishra. “Are Decoupled Farm Payments Really Decoupled? An Empirical Evaluation.” American Journal of Agricultural Economics 88(1), February 2006.
Hoppe, Robert A. and David E. Banker “Structure and Finances of U.S. Farms: 2005 Family Farm Report” Economic Information Bulletin No. (EIB-12) 51 pp, May 2006
Johnson, D. Gale. Forward Prices for Agriculture. Chicago: University of Chicago Press, 1947 (Re-issued with new forward, New York: Arno Press, 1976).
Johnson, D. Gale. Trade and Agriculture: A Study of Inconsistent Policies. New York: John Wiley and Son, 1950.
Johnson, D. Gale. “Government and Agriculture: Is Agriculture a Special Case,” Journal of Law and Economics, 1958, reprinted in, The Economics of Agriculture: Volume 1: Selected papers of D. Gale Johnson, J.M. Antle and D.A. Sumner ed. U. of Chicago Press, 1996, pp. 142–156.
Jones, J.Y., C.E. Hanrahan and J. Womach. “What Is A Farm Bill?” Congressional Research Service Report, Order Code RL30956 May 5, 2001.
Key, Nigel, Ruben N. Lubowski, and Michael J. Roberts. “Farm-Level Production Effects from Participation in Government Commodity Programs: Did the 1996 Federal Agricultural Improvement and Reform Act Make a Difference?” American Journal of Agricultural Economics 87(5), December 2005.
McDonald, Jeffrey D. and Daniel A. Sumner. “The Influence of Commodity Programs on Acreage Response to Market Price: With an Illustration concerning Rice Policy in the United States.” American Journal of Agricultural Economics, (85), 4 (November 2003): 857–871.
Monke, Jim. Farm Commodity Policy: Programs and Issues for Congress Congressional Research Service Report, Order Code RS21999, Updated February 21, 2006.
References

U.S. Agricultural Policy and the 2007 Farm Bill 23
Olmstead, Alan and Daniel A. Sumner, “Farm Policy,” in S. Carter, S. Gartner, M. Haines, A. Olmstead, R. Sutch, and G. Wright, eds, Historical Statistics of the United States-Millennial Edition Cambridge: Cambridge University Press, 2006, pp. 4–31 to 4–38.
Orden, David, Richard Paarlberg, and Terry. Roe. Policy Reform in American Agriculture: Analysis and Prognosis. Chicago: The University of Chicago Press, 1999.
Organization for Economic Cooperation and Development. “Producer and Consumer Support Estimates, OECD Database 1986–2005”. Available at: http://www.oecd.org/LongAbstract/0,2546,en_2825_494504_37036160_1_1_1_1,00.html
President’s Council of Economic Advisers. “The U.S. Agricultural Sector,” Chapter 8, Economic Report of the President, 2006. GPO, Washington DC.
Rasmussen, Wayne and Gladys L. Baker. Price-Support and Adjustment Programs from 1933 through 1978: A Short History, U.S. Economic Research Service (Washington DC: GPO, 1979).
Sumner, Daniel A. “Targeting Farm Programs.” Contemporary Policy Issues, Vol. IX (January 1991): 93–106.
Sumner, Daniel A. (2003a) “Implications of the USA Farm Bill of 2002 for Agricultural Trade and Trade Negotiations.” Australian Journal of Agricultural and Resource Economics, 46, 3 (March 2003): 117–140.
Sumner, Daniel A. “Boxed In: Conflicts between U.S. Farm Policies and WTO Obligations.” 30pp. Cato Institute Trade Policy Analysis, No. 32 (December 2005a). http://www.freetrade.org/pubs/pas/pas.html.
Sumner, Daniel A. “Reducing Cotton Subsidies: The DDA Cotton Initiative.” In Agricultural Trade Reform and the DOHA Development Agenda. Will Martin and Kym Anderson, eds. Washington, D.C.: The World Bank (2005b): 271–294.
Thompson, Robert. “Prospects for Reform of U.S. Agricultural Policy—With or Without Doha.” Presentation at the Cato Foundation, August 31, 2006.
USA Rice Federation, Press release, Arlington, Virginia, September 15, 2006.
United States Department of Agriculture. “2007 Farm Bill Theme Paper: Strengthening the Foundation for Future Growth in U.S. Agriculture.” September 2006. http://www.usda.gov/documents/FarmBill07foundationsf.doc
United States Department of Agriculture. “2007 Farm Bill Theme Paper: Risk Management.” May 2006. http://www.usda.gov/documents/Farmbill07riskmgmtrev.doc
United States Department of Agriculture. “2007 Farm Bill Theme Paper: Rural Development.” July 2006. http://www.usda.gov/documents/Farmbill07ruraldevelopment.doc
United States Department of Agriculture, Economic Research Service. Rural Income Poverty and Welfare, online Briefing Room. http://www.ers.usda.gov/Briefing/IncomePovertyWelfare/
United States Department of Agriculture, Economic Research Service. Rural Population and Migration, online Briefing Room. http://www.ers.usda.gov/Briefing/Population/
United States Department of Agriculture, Economic Research Service. U.S. and State Farm Income Data Farm Cash Receipts, 1924–2004. Available at http://www.ers.usda.gov/Data/FarmIncome/finfidmu.htm
United States Department of Agriculture, Farm Service Agency. Budget Division. Table 35, CCC Net Outlays by Commodity and Function, Available at: http://www.fsa.usda.gov/dam/bud/bud1.htm
United States Department of Agriculture. Farm Bill 2002 website. http://www.usda.gov/farmbill.
Westcott, Paul C. and C. Edwin Young. “U.S. Farm Program Benefits: Links to Planting Decisions & Agricultural Markets,” Agricultural Outlook, AGO-275, October 2000, pp. 10–14.
Westcott, Paul, C. Edwin Young, and J. Michael Price, USDA, ERS, The 2002 Farm Act, Provisions and Implications for Commodity Markets, Economic Research Service, November 2002.
Western Growers. Website. http://www.wga.com.
Wolf, R. “Fat Days May be Over for Farm Subsidies.” USA Today. June 8, 2006.
Young, C. Edwin, David W. Skully, Paul C. Westcott and Lynn Hoffman. Economic Analysis of Base Acre and Payment Yield Designations under the 2002 U.S. Farm Act. Economic Research Report No. (ERR12), United States Department of Agriculture, Economic Research Service, Washington DC: September 2005.
Young, C. Edwin. and Paul C. Westcott. “The 1996 Farm Act Increases Market Orientation.” Agricultural Information Bulletin No. 726, Economic Research Service, USDA, Washington, D.C. 1996.
Young, C. Edwin and Paul C. Westcott (2000). “How Decoupled is U.S. Agricultural Support for Major Crops?” American Journal of Agricultural Economics 82 (August).

24 WOODS INSTITUTE FOR THE ENVIRONMENT | STANFORD UNIVERSITY

U.S. Agricultural Policy and the 2007 Farm Bill 25
CHAPTER II-2
U.S. Commodity Programs and WTO CommitmentsTim Josling, David Blandford, Kaush Arha, and Daniel A. Sumner
The 2007 Farm Bill, to a much greater extent than its predecessors, will be embedded in a set of multilateral trade rules and obligations. The U.S. actively supported the greater disciplines on domestic farm policies that have been negotiated within the Word Trade Organization (WTO), in particular in the Uruguay Round of negotiations that took force in 1994. The Agreement on Agriculture was designed to reduce the use of policy instruments that had more than minimal impacts on trade. The main elements of this agreement obliged countries to lower tariffs and remove non-tariff barriers, reduce existing export subsidies, abstain from new export subsidies, and phase down instruments of domestic support that stimulated output or were tied to price.
The 1996 Farm Bill eliminated market management and seemed to reduce effects of U.S. subsidies, but ad hoc programs that were implemented when prices declined in 1998 reversed this course. The 2002 Farm Bill, by making permanent the emergency payments granted by Congress in 1998–2001, has brought the U.S. programs much closer to the limits laid down in the U.S. WTO schedules, at least during low-price years. Hence, the effect of further constraints, if eventually negotiated in the Doha Round, will affect future legislation, at least if a return to low commodity prices is anticipated. The slack has largely been removed, and the U.S. must reduce support if it is to fulfill its goal of gaining market access to and eliminating export subsidies by other trading countries.
The need to include the external obligations in setting policy in the next Farm Bill has been accentuated by the recent WTO Dispute Panel findings, particularly in the case brought by Brazil against U.S. cotton subsidies—the
“U.S.-Cotton” case. The Panel ruled that several key aspects of U.S. policies were in violation of WTO articles and obligations. In particular, they found that Market Loss Assistance (MLA), Counter-Cyclical Payments (CCP), Marketing Loan (ML) payments, and Step 2 payments contributed to “significant price suppression” on the world market for cotton, and the U.S. was requested to take steps to remove the adverse effects or withdraw the subsidy. In addition, the Step 2 payments on cotton used by U.S. mills were found to be a prohibited domestic content subsidy. Moreover, the Step 2 payments paid on exported cotton and the export credit guarantees were found to be prohibited export subsidies, as they had not been included in the U.S. schedule of subsidies. These prohibited subsidies were to be removed without delay.
This chapter will briefly review the constraints on U.S. farm policy as a result of the Uruguay Round Agreement on Agriculture and summarize the current situation in the WTO Doha Round of trade negotiations. It will also review the outcome of the recent WTO cases brought against the U.S. and the E.U. On the basis of these influences, the chapter will conclude with some possible constraints on the commodity chapter of the 2007 Farm Bill.
A: U.S. Notifications and Conformity with WTO AgreementsThe impact of the WTO URAA on U.S. policy is both elusive and pervasive. On the one hand, the Blair House pact with the E.U. in November 1992, at which the agricultural modalities were agreed to, was intended in large part to shelter existing U.S. policy instruments from the influence of the WTO rules. The Blue Box and the Peace
26 WOODS INSTITUTE FOR THE ENVIRONMENT | STANFORD UNIVERSITY
Clause were introduced, at that time, as a way of ensuring that constraints on domestic policy did not unduly force policy changes.1 On the other hand, the U.S. gave up the use of Section 22 quotas and agreed to tariffication in sensitive sugar, meat, and dairy sectors. In addition, the restraints on export subsidies have had an impact, though high prices in the first few years of the agreement made such restraints less binding. Some of this impact has come as a result of litigation in the WTO, where any subsidy to exports not included in the schedule has been found to be a violation of subsidy rules. Even the limits on domestic support have been internalized fully into farm policy discussions. And the form and substance of the debate on the 2007 Farm Bill, to a much greater extent that the 1996 and 2002 Bills, has been shaped by the question of WTO compliance.
WTO constraints on policy are quantitative as well as qualitative. Certain types of policy instruments are prohibited, but those that are allowed can still be subject to quantitative limits. These quantitative constraints are built into schedules that were agreed to in the Uruguay Round. Policy developments are monitored: violations of constraints can be subject to the dispute settlement regime, and thus may entail considerable political and financial costs. Economic costs could also mount if a dispute was not resolved and countries were allowed to “withdraw concessions” by raising tariffs in retaliation. The monitoring is implemented through the Agriculture Committee of the WTO and is based on “notifications” by members. On the face of it, there has been essentially full compliance with the quantitative constraints built into the schedules agreed to in the U.R., both by the U.S. and other OECD countries. Early notifications were somewhat slow, impairing the usefulness of the Committee as a place for timely challenges and the exchange of information. Since the agricultural negations started in 2000, and particularly after the Doha ministerial that launched the Doha Round in November 2001, notifications have virtually halted.2
The constraints on policies related to market access are relatively easily monitored. Tariff schedules are the most transparent means of protection, and it is rare that countries violate their obligations in this regard. Tariff rate quotas and the use of the special safeguard mechanism are somewhat more difficult to track, but have not been the subject of great controversy. The United States converted many quantitative trade restrictions, in particular the quotas that had been authorized by Section 22, as mentioned above. The Meat Import Laws that had given rise to
“voluntary” export restraints on meat from New Zealand and Australia also were modified, and tariffs replaced these import arrangements. The U.S. has resorted to the Special Safeguard (SSG) provisions of the WTO Agreement on Agriculture on several of the products that underwent tariffication. In 1999, under the SSG, price-based duties were assessed on certain products (including fresh and frozen beef, sweetened milk, milk fats and oils, milk-based drinks, cheeses, sugar, and peanuts); no volume-based actions were taken during that period.3 No SSG measures were applied in 2000 (WTO, US TPR, 2001).
Somewhat less transparent, but nevertheless monitorable, are the constraints on export competition, in particular the quantitative limits to export subsidies. Both the expenditure on export subsidies and the volume of goods that could be exported with the aid of those subsidies were limited in the schedules. The U.S. notified 13 export subsidy commitments, and spending on such subsidies fell somewhat as prices on world markets rose in 1995–97, but jumped to $147 million in 1998 before falling back to $15 million by 2000. The products that were favored by subsidies included coarse grains and wheat, oilseeds, milk, beef, pork, and poultry, as well as fruits and vegetables on an occasional basis. But export subsidies are no longer a significant aspect of U.S. policy, and the economic impact
1 During the Uruguay Round, the mantra had been that farm policy was made in Washington, not Geneva.
2 A less formal monitoring process is carried out for the OECD countries through the annual Monitoring and Evaluation process. The OECD has remained the preferred location for debate about agricultural policy changes, in part because the OECD process has no binding commitments or direct legal implications.
3 WTO document G/AG/N/USA/33 of 15 September 2000.

U.S. Agricultural Policy and the 2007 Farm Bill 27
of the residual spending on such subsidies is trivial. However, there are other export enhancement devices that have caused some concern among trade partners: until recently, export credit guarantees have been given frequently to sellers of U.S. commodities to underwrite the commercial risks that would otherwise inhibit exports.
The U.S., along with some thirty other countries, committed themselves to scheduled reductions of trade-distorting support from 1995 to 2000. WTO members accepted an obligation to notify annually the payments made on domestic support under the Agreement on Agriculture. Countries are required to notify expenditure under several categories of domestic support, including payments that are in the Green Box and the Blue Box, as well as those which are subject to reduction commitments (AMS, or Amber Box).4
Table 1 shows the U.S. notifications from 1995 to 2001. The U.S. constraint on the total Aggregate Measurement of Support (AMS) since 2000 has been US $19.1 billion. In the first two years, there was little or no pressure from the negotiated constraints on domestic support on the conduct of U.S. farm policy. The 1996 FAIR Act in essence removed many of these constraints, at least temporarily, by moving much of the direct payments from the Blue to the Green Box. However, this was soon offset by the marketing loans and emergency payments of 1998–2001 that increased payments notified under the Amber Box and de minimis categories. The WTO constraints became even more of an issue in the debate over the 2002 Farm Bill. Passage of that Bill raised the question as to whether the U.S. might indeed exceed its “Amber Box” constraints in the future. Firmer commodity prices delayed such an eventuality, but the margin for additional coupled payments was much smaller.
Table 1. U.S. Domestic Support Notifications, 1995–2001 (billion dollars)
AMS ceiling 23.083 22.287 21.491 20.695 19.899 19.103 19.103
Actual AMS 6.214 5.898 6.238 10.392 16.862 16.803 14.413
Percentage “used” 27% 26% 29% 50% 85% 88% 75%
PS de minimis 0.099 0.061 0.244 0.166 0.029 0.063 0.216
NPS de minimis 1.543 1.113 0.242 4.584 7.406 7.278 6.828
Total Amber Box 7.856 7.072 6.726 15.142 24.297 24.144 21.457
Blue 7.030 0 0 0 0 0 0
Green 46.041 51.825 51.249 49.82 49.749 50.057 50.672
Source: Calculated from U.S. notifications to WTO.
Details of the links between commodity programs and WTO notifications is given in Annex Table 1. Whereas direct payments are usually considered “Green,” those that are tied to current prices fall in the Amber Box. The loan
4 Total Domestic Support is made up of Green Box (minimally trade-distorting), Blue Box (subject to supply control), Article 6.2 support (special category for developing countries) and Amber Box (price- or input-related). Amber box support in turn includes the AMS, which is subject to reduction, and the de minimis support that is not. The AMS and the de minimis are further divided into product-specific and non-product-specific payments.

28 WOODS INSTITUTE FOR THE ENVIRONMENT | STANFORD UNIVERSITY
rate, for instance, provides incentives to continue planting when prices fall, through the compensation provided by the marketing loan program. For this reason, the United States has notified these loan programs, as in the “Amber Box,” under the WTO Agreement on Agriculture. Marketing loans can link the economic incentive for production decisions to a government-determined price, thus introducing market distortions.
Annex Table 1: United States domestic support and support reduction commitments by policy category, 1986–88 average and 1995–2001
POLICY CATEGORY 1 1986–88
AVERAGE 1995 1996 1997 1998 1999 2000 2001
$ MILLION
1. Market price support 2 6,956.0 6,213.3 5,919.3 5,815.9 5,775.6 5,920.7 5,840.3 5,825.6
Dairy 5,409.4 4,693.2 4,674.0 4,455.2 4,332.3 4,437.3 4,377.5 4,483.2
Sugar 1,041.3 1,107.8 937.2 1,045.5 1,093.3 1,180.2 1,132.8 1,031.7
Peanuts 347.2 412.3 308.1 315.3 350.0 303.1 330.0 310.6
Beef 3 158.1 0.0 0.0 0.0 0.0 0.0 0.0 0.0
2. Non-exempt direct payments 4
12,392.7 88.3 6.6 578.4 4,437.1 10,403.4 10,567.5 8,434.7
Loan deficiency, mar-keting-loan, and certifi-cate-exchange gains
443.3 0.0 0.0 164.0 3,823.9 8,070.9 7,624.4 8,178.265
Deficiency payments (pre-1996) 5
9,705.7 0.0 0.0 0.0 0.0 0.0 0.0 0.0
Other non-exempt payments
2,243.6 88.3 6.6 414.3 613.2 2,332.4 2,943.0 256.424
3. Total other support (product-specific only)
1,994.7 9.6 11.5 80.4 337.6 567.3 457.5 367.4
Storage payments (cot-ton and farmer-owned reserve payments)
572.9 4.1 0.0 23.7 78.1 143.9 43.3 62.1
Interest subsidies (com-modity loan related)
1,598.6 115.0 78.1 141.1 343.8 442.7 465.599 366.9
Northeast dairy com-pact benefits (net cash flow to producers)
0.0 0.0 0.0 0.0 28.0 54.9 20.3 0.0
Fees and assessments paid by producers
(176.8) (109.5) (66.6) (84.3) (112.3) (74.3) (71.7) (61.6)
4. Product-specific totals (1 + 2 + 3)
21,343.4 6,311.2 5,937.5 6,474.7 10,550.2 16,891.3 16,865.2 14,627.6
5. Non-product-specific support
901.5 1,543.5 1,113.4 567.6 4,583.9 7,405.5 7,278.0 6,828.2
Irrigation subsidies in Western States (Bureau of Reclamation estimate)
543.3 543.3 381.4 348.5 348.5 315.7 315.7 300.0

U.S. Agricultural Policy and the 2007 Farm Bill 29
POLICY CATEGORY 1 1986–88
AVERAGE 1995 1996 1997 1998 1999 2000 2001
$ MILLION
Grazing program net outlays (grazing on public lands)
25.8 45.0 50.4 50.8 51.0 54.9 51.5 65.4
Crop insurance in-demnities, less pro-ducer premiums paid
289.1 906.3 632.8 119.5 747.0 1,514.1 1,395.8 1,770.4
Credit program benefits from State programs
43.3 48.8 48.8 48.8 48.8 48.8 48.8 48.8
Crop market loss payments (emergency assistance)
0.0 0.0 0.0 0.0 2,811.3 5,467.7 5,463.5 4,639.8
Crop multi-year crop disaster payments (emergency assistance)
0.0 0.0 0.0 0.0 577.3 0.0 0.0 0.0
Storage facility loan program
0.0 0.0 0.0 0.0 0.0 1.4 2.8 3.7
Seed producer's loan program
0.0 0.0 0.0 0.0 0.0 2.9 0.0 0.0
Value of production 142,929.9 190,109.7 205,701.3 203,883.7 190,886.0 184,734.6 189,520.3 198,502.7
5. percent of value of production 6
7,146.5 9,505.5 10,285.1 10,194.2 9,544.3 9,236.7 9,476.0 9,925.1
6. Total before exemptions and additions (4 + 5)
22,244.9 7,854.7 7,050.9 7,042.3 15,134.1 24,296.9 24,143.3 21,455.8
7. Exemptions (-) and additions (+)
(1,634.3) (1,640.8) (1,153.2) (803.9) (4,742.2) (7,434.6) (7,340.7) (7,053.7)
Non-product-specific de minimis 6/
(901.5) (1,543.5) (1,113.4) (567.6) (4,583.9) (7,405.5) (7,278.0) (6,828.2)
Product-specific de minimis 6
(691.8) (97.3) (39.8) (236.3) (158.3) (29.1) (62.7) (225.5)
Credit in base period for prior reductions (addition) 7
3,227.5 0.0 0.0 0.0 0.0 0.0 0.0 0.0
8. Current total AMS (6 + 7)
23,879.1 6,213.9 5,897.7 6,238.4 10,391.9 16,862.3 16,802.6 14,413.1
9. WTO commitment ceiling 8
23,879.1 23,083.1 22,287.2 21,491.2 20,695.2 19,899.3 19,103.3 19,103.3
1 Categories correspond to those in official domestic support notifications to the World Trade Organization (WTO), as shown in WTO supporting tables DS: 4, 5, 6, 7, and 9. Domestic support is measured by WTO index called the “aggregate measurement of support,” or “AMS.”
2 Market price support is total eligible production times the difference between the current administered price and the fixed, 1986–88 world reference price.
3 The United States also notified the value of beef purchases made to offset the effect of the dairy herd buy-out program. No fixed world reference price was used.
4 See http://www.ers.usda.gov/briefing/FarmPolicy/data/NonExempt.xls for details on non-exempt direct payments.

30 WOODS INSTITUTE FOR THE ENVIRONMENT | STANFORD UNIVERSITY
5 Support in the 1986–88 base period was defined to include payments related to production reduction programs. Such payments were exempt (excluded) from the AMS reduction commitments after the base period and were notified in supporting table ds:3 (blue box). U.S. deficiency payments included in the blue box wer re-calculated using a fixed, 1986–88 reference price. The 1995 value in the Blue Box was $7,030 million. This payment was eliminated after 1995 by the 1996 Farm Act.
6 If the calculated individual product support level or the non-product-specific total is not larger than 5 percent of its respective total value of production, the support does not have to be included in the current total AMS, under the de minimis provision.
7 For the 1986–88 base period only, countries could increase their AMS by using the higher of the 1986 value or the 1986–88 value. The U.S. increased its AMS by $3,227 million. This was done to give credit for reductions in support already accomplished during the first 3 years of the Uruguay Round.
8 The AMS ceiling was derived as the 1986–88 base value minus 3.3 percent per year during 1995 through 2000. The final ceiling level is 20 percent of the base value (20 percent divided by 6 years = 3.33333 percent). Source: World Trade Organization and Economic Research Service. http://www.ers.usda.gov/briefing/FarmPolicy/
A number of other federal government programs act to reduce the financial consequences of uncertainties in weather, yields, prices, government policies, global markets, and other factors (WTO, US TPR, 2001).5 These insurance programs have been notified to the WTO as Amber Box, but they are excluded from AMS reduction under de minimis provisions because it has been claimed that they are non-product-specific, and the total of such support is less than 5 percent of the total value of U.S. agricultural output. Crop insurance is delivered through the private sector, with premiums subsidized by the government at a cost of about US $1.5 billion per year. Almost US $30 billion in risk protection is provided on about 190 million acres, which is about 70 percent of the country’s insurable acreage. The historical average indemnity payout is US $1.40 for every dollar in farmer-paid premium. This subsidization increases revenue and reduces its variance, and thus encourages planting. According to one estimate, crop insurance subsidies overall have contributed to an estimated 900-thousand-acre increase in planted area, with wheat and cotton showing the largest percentage gains.
Crop insurance programs underwent changes during the second half of the 1990s, notably following the falls in farm incomes after 1997. In particular, the Agricultural Risk Protection Act, a US $15.3 billion package for fiscal years 2001 to 2005, expanded crop insurance funding by more than 80 percent. The crop insurance schemes have been notified so far as Amber Box, as they are in conflict with the definitions of allowable subsidies under the Green Box.
Figures 1 and 2 include estimates by the authors that extend the analysis of domestic support based on U.S. government definitions and procedures to include the years since the last notification.6 Under this methodology, the U.S. has stayed within its domestic support commitment, and indeed has more “unused” AMS than in the years 1999 and 2000.7 However, the variability of counter-cyclical payments, and marketing loans in particular, makes the conformity to the schedule subject to favorable weather and crop price outcomes. An examination of the share of the actual total AMS for 1999–2001 by commodity group shows that roughly 47 percent of the total was due to price support programs for grains and oilseeds, about 30 percent was contributed by dairy products, and most of the remainder of the support went to cotton and sugar.
5 Crop insurance and revenue insurance aim to protect farmers against price declines. Premiums for catastrophic production losses are fully paid for by the Government, which also partly subsidizes coverage against noncatastrophic events such as price declines.
6 See Sumner 2005 for an alternative set of calculations, based on the result from the U.S. cotton dispute, which indicated that the categorization of programs by the United States may have been inappropriate and, in particular, that the direct payment program should not be placed in the Green Box.
7 Note, however, that this assumes that the payments were correctly notified. Later in the paper we discuss the implications of the possible misnotification of direct payments and the impact that this would have had on the gap between WTO commitments and actual expenditure.

U.S. Agricultural Policy and the 2007 Farm Bill 31
Source: WTO notifications 1995–2001 and author’s calculations, 2002–2006
Source: WTO notifications 1995–2001 and author’s calculations, 2002–2006 (Note: Amber Box notifications in this figure include de minimis payments)
Green Box policies are dominated by expenditures under the Food Stamp program and other food assistance policies. Conservation policies are a relatively small part of the Green Box payments (see Blandford, Josling, and Arha, this volume). The Blue Box, having fulfilled its function of sheltering the pre-1996 direct payments from reduction (as they were tied to acreage control programs), has become vacant since the 1996 Farm Bill fully decoupled such payments. However, as discussed below, the “new” Blue Box under discussion in the Doha Round would offer a home for the counter-cyclical payments under the 2002 Farm Bill.
32 WOODS INSTITUTE FOR THE ENVIRONMENT | STANFORD UNIVERSITY
B. Status of WTO Negotiations on AgricultureDiscussions in the WTO about further reform of the agricultural trade system are both a follow-up to the Uruguay Round and an attempt to respond to the demands for changes to encourage and facilitate development and, if possible, remove some of the impacts of asymmetry in the operation of the trade system. The Doha Round includes talks on agriculture, services, and non-agricultural market access (NAMA), as well as on trade facilitation. Progress in all areas is needed for a successful conclusion, and the slow pace of the agricultural component has prevented agreement in the other areas. This note presents the timeframe for the talks, the main issues that have been agreed to, the remaining issues that are currently being discussed in the WTO agricultural talks, and the positions of the main groups of countries.
THE TIMELINE
One timeline of the negotiations is shown in the table below. The early phase of the talks was marked by a number of submissions on the way in which the agricultural talks might be focused, as well as specific comments on particular items of interest. The incorporation of the agricultural talks in the Doha Round increased the scope for trade-off and for an ambitious outcome. The Doha Ministerial was followed by a period of more intense negotiation, but not an agreed-on framework. Such a framework eventually emerged in July 2004 and led to an attempt to agree on modalities by the time of the Sixth Ministerial in Hong Kong.
The Hong Kong Ministerial defined a timetable that would allow the Round to be concluded with expedition. Modalities were to be agreed to by 30 April 2006 to allow for compilation of draft schedules of tariff and subsidy reductions. Members aimed to reach final agreement on the modalities and schedules by 31 July 2006, so as to complete the Round before the U.S. Trade Promotion Authority expires in June 2007. However, both deadlines were missed, and in July 2006 the talks were “suspended” without an agreement on the modalities. Although negotiations recommenced in 2007, they have yet (as of April 2007) to produce any meaningful resolution to the problem of agriculture.
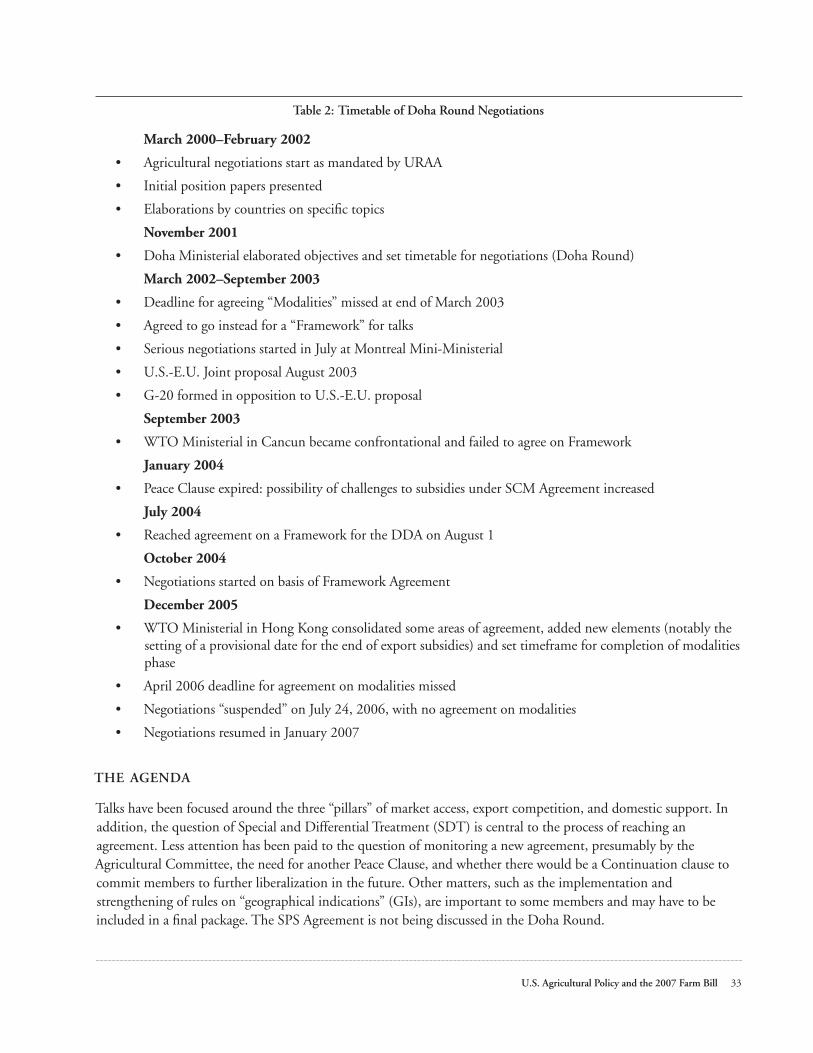
U.S. Agricultural Policy and the 2007 Farm Bill 33
Table 2: Timetable of Doha Round Negotiations
March 2000–February 2002
• Agricultural negotiations start as mandated by URAA
• Initial position papers presented
• Elaborations by countries on specific topics
November 2001
• Doha Ministerial elaborated objectives and set timetable for negotiations (Doha Round)
March 2002–September 2003
• Deadline for agreeing “Modalities” missed at end of March 2003
• Agreed to go instead for a “Framework” for talks
• Serious negotiations started in July at Montreal Mini-Ministerial
• U.S.-E.U. Joint proposal August 2003
• G-20 formed in opposition to U.S.-E.U. proposal
September 2003
• WTO Ministerial in Cancun became confrontational and failed to agree on Framework
January 2004
• Peace Clause expired: possibility of challenges to subsidies under SCM Agreement increased
July 2004
• Reached agreement on a Framework for the DDA on August 1
October 2004
• Negotiations started on basis of Framework Agreement
December 2005
• WTO Ministerial in Hong Kong consolidated some areas of agreement, added new elements (notably the setting of a provisional date for the end of export subsidies) and set timeframe for completion of modalities phase
• April 2006 deadline for agreement on modalities missed
• Negotiations “suspended” on July 24, 2006, with no agreement on modalities
• Negotiations resumed in January 2007
THE AGENDA
Talks have been focused around the three “pillars” of market access, export competition, and domestic support. In addition, the question of Special and Differential Treatment (SDT) is central to the process of reaching an agreement. Less attention has been paid to the question of monitoring a new agreement, presumably by the Agricultural Committee, the need for another Peace Clause, and whether there would be a Continuation clause to commit members to further liberalization in the future. Other matters, such as the implementation and strengthening of rules on “geographical indications” (GIs), are important to some members and may have to be included in a final package. The SPS Agreement is not being discussed in the Doha Round.

34 WOODS INSTITUTE FOR THE ENVIRONMENT | STANFORD UNIVERSITY
Improved Market Access
Market Access is the most difficult issue in the talks, as it impacts all countries. The “July” Framework Agreement gave some guidance as to what the modalities would be. The Hong Kong Ministerial made relatively little headway in resolving the major issues, and much remains to be done before the modalities are settled and the talks can conclude. The following is a synopsis of the points agreed to and yet to be decided on (as of April 2007).
The outline for an agreement on market access modalities was becoming clear when the talks were suspended. Items agreed included the following:
• Reduce tariffs by means of a tiered approach, with greater linear reductions for higher tariffs.
• Identify four bands for developed and developing countries, based on the agreed on method of calculating “ad valorem equivalents” (AVEs) for specific and complex tariffs.
• Specify a small number of “sensitive products” and expand their markets with a combination of tariff cuts and TRQs.
• Establish a Special Products category for developing countries for products vital to food security, livelihood security, and rural development. These products would be self-designated, but based on agreed indicators.
• Create a Special Safeguard Mechanism (SSM) that would have both a price and a quantity trigger and be available to developing countries for an unspecified range of goods.
However, several key issues remained to be resolved:
• Thresholds for the four bands are not yet agreed, though there was some convergence to the bands, suggested by the G-20, of zero to 20 percent, 20 to 50 percent, 50 to 75 percent, and 75 percent and above.
• Level of tariff reductions within the bands have still not been decided. The G-20 cuts of 45, 55, 65, and 75 percent for the four bands appeared to be a point of convergence, though the U.S. maintained that it wanted to have greater cuts than the G-20 proposal, and the E.U. could not agree to cuts as high as the G-20 suggestion.
• The scope of the Sensitive Products (SePs) exception is still to be decided, along with the treatment of these products. Countries are still wide apart on the percent of tariff lines that could be covered by the SePs category, with suggestions ranging from 1 to 15 percent. The lower the number of tariff lines, the more flexibility will be demanded by those countries identifying SePs. A combination of TRQ increases and tariff cuts for these commodities will have to be negotiated to the satisfaction of negotiating partners.
• The indicators for the definition of Special Products (SP) still have to be decided, as well as the treatment of these products. The scope of these products could be expressed as a percent of tariff lines or a specific number of products.
• Details of the Special Safeguard Mechanism (SSM) for developing countries are still under negotiation, though the main sticking points are the number of products that are covered by such a mechanism.
• The establishment and level of a tariff cap has still to be negotiated, with suggestions focusing on 75 or 100 percent for developed countries and 150 percent for developing countries. The issue of whether the tariff caps would apply to SePs and SPs is also unresolved.
• The future of the SSG still unclear, with some countries arguing that it should be continued, albeit with a reduction in the number of tariff lines to which it could apply.
• Ways to reduce tariff escalation have yet to be agreed, and any special preference reduction measures that need to be taken, through cuts in MFN tariffs, have not been settled.
U.S. Agricultural Policy and the 2007 Farm Bill 35
Fairer Export Competition
Export competition issues are probably the least problematic of the pillars. Relatively few countries make use of such subsidies, and the level has been on the decline since the URAA. The tension is between those exporters that still use export subsidies (primarily the E.U.) and those that have other ways of promoting exports (food aid in kind, export credit guarantees, state trading exporting agencies). This involves the U.S., Canada, and, to a lesser extent, Australia and New Zealand. The July Framework set the agenda as eliminating the use of export subsidies and the indirect assistance to exports through export credits, food aid, and subsidies to state traders. A significant milestone was reached in Hong Kong, when Ministers agreed to the year 2013 as the date for the end of all export subsidies and parallel measures.
Despite this agreement, there are still some issues on the table. Among the key agreements up to now have been measures to:
• Eliminate all forms of export subsidies by 2013, with a substantial part of the reductions achieved by 2010
• Eliminate export credits extended for more than 180 days and constrain those that extend for less than 180 days to be self-financing
• Eliminate commercial displacement by food aid, but create a “safe box” for emergency food aid
• Eliminate trade-distorting subsidies given through State Trading Enterprises and discipline further use of monopoly power by such agencies
• Allow developing countries to make use of Article 9.4 provisions (subsidies on transport for exports) until 2018.
Still to be resolved are these questions:
• What should be the nature of food aid in the future? Some countries wish to phase out in-kind food aid and prevent monetization of such aid. Others consider such a move would reduce the amount and effectiveness of food aid.
• What disciplines should be put on the use of monopoly power by state trading exporters? The extent to which single-desk selling is prohibited or phased out in the current Round has been more difficult to agree on than the concept that subsidies inherent in the operation of such bodies should be ended.
Reduced Domestic Support
Further reduction in domestic support is seen as necessary to reach an agreement. Such reductions are sought by low-cost exporters, to improve conditions of competition and demanded by developing countries, to avoid price suppression on world markets for exporters and unfair competition for domestic farmers in the case of importers. The July Framework Agreement provided the outline of the ways that domestic support would be curbed, through restricting the total amount of trade distorting support as well as individual components. The Hong Kong Ministerial clarified somewhat the framework for this part of the negotiations. It indicated that agreement among the limited number of countries that provide domestic support could be reached quickly once other aspects are in place. However, some thorny issues remain before this aspect of the modalities can be agreed upon.
Agreement has been reached on the following steps:
• Establish three bands for categorizing countries for the sake of disciplines on domestic support. The top band would include the E.U., the second band would include the U.S. and Japan, and the third band would comprise all other countries that have notified levels of domestic support.
• Cut overall trade-distorting domestic support (OTDS), defined as Total AMS (Amber Box) plus Blue Box plus de minimis support, requiring more reductions for countries in higher bands.

36 WOODS INSTITUTE FOR THE ENVIRONMENT | STANFORD UNIVERSITY
• Reduce the OTDS by 20 percent (“down-payment”) in the first year.
• Reduce Total AMS also by use of the three-bands formula; cap Product-specific AMS at historical averages; and reduce de minimis levels.
• Redefine the Blue Box to include payments based on fixed acres and yields as well as those based on acreage (and headage) limitations.
• Cap Blue Box payments at 5 percent of the value of agricultural production at the start of the implementation period
• “Review and Clarify” Green Box criteria, including its application to developing countries
• Improve monitoring and surveillance of domestic support.
However, the following issues have yet to be resolved:
• The level of the cuts in OTDS and AMS within the bands still have to be agreed on. The U.S. has stayed with its proposal of a 60 percent cut in AMS, on the condition that the E.U. cuts a greater amount. Other countries, particularly those in the G-20, have argued that the U.S. should improve its offer.
• Details of a product-specific AMS cap and extent of the de minimis reductions still need to be negotiated, including the cut for developing countries.
• How to clarify the Green Box criteria without undermining its role in policy reform and yet giving trading partners the confidence that such policies are truly minimally trade-distorting.
• Constraints on Blue Box, including the issues of whether the cap should be reduced (to 2.5 percent, as suggested by the U.S.) and whether there should be separate constraints on “new” Blue Box policies (to which the U.S. is opposed).
At a more fundamental level, there is still widespread disagreement over what impact negotiated support cuts will have on actual programs.
OTHER ISSUES
Cotton
The impact of cotton support policies in developed countries on the world market for cotton—and hence on the price received by exporters such as those in West Africa—has become a key issue for the Doha Round. In effect, willingness of the U.S. and the E.U. to reduce cotton subsidies has become an important test of the political will to assist developing countries through trade. The Hong Kong ministerial reinforced the importance of this issue, already addressed at Cancún and in the July Framework. In addition, the panel ruling on cotton will need to be fully reflected in the package that emerges at the end of the talks.
There was an agreement at Hong Kong to deal with cotton “ambitiously, expeditiously and specifically.” In addition, it was agreed that export subsidies on cotton would be eliminated in 2006 and that cotton trade-distorting subsidies would have to be cut as a priority and over a shorter transition. Duty- and quota-free entry was to be afforded to all Least Developed Countries from about 2008. In addition, development assistance for stimulating cotton productivity and export capacity would be given priority. The way in which these modalities would be implemented was yet to be finalized when the talks were suspended. The fate of the cotton arrangements is uncertain, as cotton producers that benefit from subsidies will not wish to be treated differently from other subsidized producers. The African Group will be concerned to keep this issue in the forefront of the negotiations, should they be revived.

U.S. Agricultural Policy and the 2007 Farm Bill 37
Geographical Indications
Negotiations have been ongoing in the Trade-Related Intellectual Property (TRIPS) Council, as mandated in the Uruguay Round, on the establishment of a multilateral register for wines and spirits. The E.U. has insisted on a link between these talks and the agricultural negotiations and has indicated that it needs some concessions in this area before agreeing to a broader deal. The U.S., Australia, and Canada are however, opposed to the concept of a mandatory register but willing to agree to a voluntary list of GIs that countries can refer to when setting domestic regulations. Discussions have stalled on the other GI issue—that of extending the “enhanced” protection given in the TRIPS to wines and spirits to other food products. There is no agreement whether indeed these talks are mandated by the Doha Agenda. In this case, some developing countries have supported the E.U. in arguing for such an extension of protection.
Peace Clause
There is no mention of the Peace Clause in the Framework Agreement; no agreement was reached in the run-up to Hong Kong and there was no mention in the Ministerial declaration. But the Peace Clause in some form (perhaps relating only to Green Box measures) may turn out to be essential for a “final package” at the end of the Round. It may also turn out to be an agreement killer for some members. So far, only the U.S. has argued for its revival, while the E.U. has been silent on the matter. The G-20 is generally against a new peace clause, and developing countries in general have not indicated any strong preferences on the matter.
Summary
In summary, the conditions for a successful conclusion are now clear, though the willingness of countries to embrace them is still elusive. These conditions include:
• Market access. Substantial improvements in access to developed and emerging markets are needed in order for U.S. and the E.U. governments to retain domestic support for the deal.
• Domestic support. Real cuts in domestic support are required by the U.S. and E.U. that have to be credible to developing countries.
• Export subsidies. All forms of export aids need to be eliminated in parallel, as conditionally agreed upon. The prospect of losing this concession is a significant pressure to complete a deal.
• Balancing issues. Some progress is needed in these areas, such as GIs, in order to “sweeten the pot” for those who would otherwise be seen to be making the largest concessions. By the same token, a new Peace Clause could be necessary or could be an agreement killer if it shielded too much.
• An equal level of “ambition” in other areas of the talks, particularly Non Agricultural Market Access (NAMA) and Services, so that a broad package can be put together.
So far, the right combination of these elements has not been found. When and if it is, the talks can move toward completion. Of course, having an agreement does not assure that the package would be accepted by member governments. In particular, in the United States, it is not clear that the Congress that was elected in 2006 would be willing to pass implementing legislation for any WTO deal that was acceptable to other members.

38 WOODS INSTITUTE FOR THE ENVIRONMENT | STANFORD UNIVERSITY
C: Implications of Possible New WTO Subsidy Limits for U.S. Farm Policy There are a number of issues directly related to conformity with the possible new Domestic Support constraints. As in the Uruguay Round Agreement, reductions in allowable support are likely to be phased in over a number of years. The issues to be addressed include the choice of the base period for establishing commitments (e.g., for the OTDS and the Blue Box cap). The Blue Box criteria are likely to be broadened to allow the inclusion of payments that vary with prices but not with production volumes (this modification was included in the WTO Framework document). That would permit counter-cyclical payments (CCPs) under the current U.S. Farm Act to be counted as Blue rather than Amber.8
Various proposals have been made for bindings and reductions in allowable levels of support. Figure 3 illustrates the implications for the United States of its own proposal. The first bar of each element denotes the binding or maximum allowable amount for the OTDS and each of its respective components. In calculating these, averages of 1999–2001 have been used as a base, since this includes the most recent U.S. notifications and is one of the proposed base periods in the negotiations. The total AMS value of $19.1 billion is binding under the Uruguay Round Agreement. The $9.6 billion caps for the PS and NPS de minimis, and Blue Box payments are derived from the application of 5 percent of the total value of agricultural production in the base period. The OTDS maximum of $47.8 billion is the sum of these individual components. The second bar in the figure shows the actual values for each of the elements in the base period.
Source: Calculated from WTO notifications and U.S. WTO Proposal. OTDS is the Overall Trade Distorting Support (Amber plus Blue Boxes, including de minimis payments); AMS is the Aggregate Measure of Support as currently defined; PSDM and NPSDM are the product-specific and non-product-specific de minimis payments respectively; and Blue is the redefined Blue Box that allows Counter Cyclical Payments to be so classified.
8 This provision was a part of the Framework Agreement of August 2004. However, until the final package is agreed upon, interim decisions can still be modified in the negotiations.

U.S. Agricultural Policy and the 2007 Farm Bill 39
The United States has proposed that its permitted OTDS be reduced by 53 percent. This would cut the allowable amount from $47.8 billion to $22.4 billion. The bound total AMS would be reduced by 60 percent, from $19.1 billion to $7.6 billion. The de minimis exemptions and Blue Box allowance would be reduced by 50 percent (from 5 percent to 2.5 percent of the value of production). This would translate into a reduction from $9.6 billion to $4.8 billion, using figures for the 1999–2001 base period.
It is difficult to determine the extent to which reductions of these magnitudes would actually constrain expenditures under U.S. farm programs. If the United States were to face effective limitations on the amount of Amber Box support it could provide, it is clear that price support programs for these commodities would have to be modified. Price support levels would have to be reduced in order to keep within the total AMS limit when market prices are low; CCPs might have to be subject to limitations (perhaps through the application of a circuit breaker) to stay within the Blue Box limit.
The ability of the United States to operate some of its farm programs may also be affected by other components of a final agreement—in particular, those dealing with market access. Price support programs for certain commodities, most notably dairy and sugar, rely on the ability to control competing imports. Currently, this is done through a combination of quotas and tariffs. If imports were to increase significantly under a new agreement, the ability of the United States to provide historical levels of Amber Box payments might be constrained by import competition, regardless of any separately agreed upon limits on those payments.”
D: Recent WTO Panel Rulings on Agricultural Subsidies9
The WTO dispute settlement mechanism is designed primarily for resolving differences in interpretation of current agreements and dissuading member countries from taking actions that contravene multilateral trade rules. As such, it is an essential part of a well-functioning multilateral trade system. But a member state’s decision to submit a complaint before the WTO dispute settlement mechanism is increasingly seen as an effective means to apply pressure on other members to change policies. Such pressure can be effective when potential rule violations are involved. It is also possible to file complaints when it is clear that no violation exists, but it is hard to see how such complaints would apply any pressure for policy change. Iindeed, they would have exactly the opposite effect when the policies at issue are vindicated in the dispute resolution process. That, plus the fact the WTO has no enforcement mechanism to compel policy change, makes using litigation rather than negotiation a questionable strategy. The initiation of complaints leading to litigation is clearly a political decision to pursue trade objectives through the legal instruments of the WTO. The consultation process at the WTO is designed to resolve issues before a panel is formed, but when parties differ in the interpretation of agreements, and if the differences are important enough to be worth the efforts of a full litigation, that is the only way to settle such differences.
The WTO litigation process has been used recently to deal with interpretation of agricultural subsidies and other central aspects of farm policies. The link between the legal and the political aspects of the dispute settlement process is highlighted by these actions. The recent U.S.-cotton and E.U.-sugar cases in particular demonstrate the close links between negotiations, litigation and changes in domestic farm programs. Other significant cases from several years ago, such as those relating to Chilean price bands and Canadian dairy export subsidies, further represent cases whereby the scope for domestic agricultural policies is becoming defined through interpretation of the Uruguay Round rather than through the new, as yet unsuccessful multilateral negotiations. WTO members are beginning to realize that the agreement to bring agriculture fully within the WTO rules has consequences for how they pursue agricultural policy.
9 This section draws on a forthcoming paper written for the IPC entitled Implications of WTO Litigation for the WTO Agricultural Negotiations, by Tim Josling, Longyue Zhao, Jeronimo Carcelen, and Kaush Arha

40 WOODS INSTITUTE FOR THE ENVIRONMENT | STANFORD UNIVERSITY
TRADE LITIGATION AND AGRICULTURE
The Uruguay Round, by strengthening the legal structure of the multilateral trade system, increased the benefits of litigation. It is no longer possible to block the selection of a dispute panel, the disputes cannot be protracted, and panel decisions can no longer be blocked by the unsuccessful parties.10 The cost of bringing a dispute is still a deterrent, particularly for small countries, but the Dispute Settlement Understanding (DSU) is considered to be an essential part of the credibility of the new WTO.
Agricultural disputes are conducted and resolved under the same framework as those relating to other goods, services and intellectual property. By most accounts, and most measures, the operation of the dispute settlement system in the WTO has been a success. A recent high-level report concluded that WTO members appear to find it useful as a tool for enhancing their trade diplomacy and securing solid and reasonably timely responses to practical trade problems.11 By the end of 2004, Members had brought a total of 324 complaints to the WTO. Compared to the less than 300 cases submitted to GATT dispute settlement in 47 years, suggesting that the new system is proving quite useful to Members.
Agricultural disputes were naturally among those that were referred to the new machinery. The UR Agreement on Agriculture (URAA) constituted a negotiated solution to several trade issues in agriculture. The URAA mandated the removal of non-tariff border measures and the binding of most tariffs. It introduced the Special Safeguard for Agriculture (SSG) as a new safeguard mechanism and Tariff-rate Quotas (TRQs) to maintain access in cases where non-tariff measures were converted to tariffs. It circumscribed the use of export subsidies, and introduced a classification of domestic support instruments that attempted to limit the use of trade-distorting subsidies. The URAA also implemented notification procedures for agricultural policies, as well as improved notification commitments for State Trading activities. But each of these issues left room for interpretation and were grist for the litigation mill.
Consultation is the first step in dispute resolution. Among the Members’ consultation requests, there were fifty-five complaints filed under the URAA. These agricultural disputes have had an important impact on the interpretation and practice of the WTO agreements. Many of these related to the conformity of government actions with the disciplines reflected in the schedules agreed to as part of the Uruguay Round outcome. Commitments on subsidy levels are treaty provisions, and the commitments in a Member’s Schedule are “an integral part” of the URAA and other WTO agreements (WT/DS265/R, paragraph 7.128). Conformity with scheduled commitments is a necessary, but not a sufficient, condition for escaping challenge. Panels have made clear that compliance with a Domestic Support commitment in a Member’s Schedule does not in itself preempt or exclude the operation of other WTO obligations (WT/DS267/R, paras. 7.1066–7.1067).
It is perhaps surprising that, with all the new rules incorporated in the URAA, so few major agricultural cases have been brought. This is not wholly a reflection of the careful drafting of the Agreement and the meticulous compliance with its provisions by all members. Ambiguities were not entirely absent, and even major countries have slipped from grace on occasions. The lack of testing of the new rules may reflect the importance of the schedules in increasing transparency, as well as the usefulness of the Agricultural Committee and its system of notifications. There may also have been a marked reluctance to use panels to attack government action in agriculture, for fear of tit-for-tat action. In addition, the poor record of success in pre-WTO cases involving agriculture may have deterred
10 A panel report, as amended by the Appellate Body, can only be rejected by a unanimous decision by the Dispute Settlement Board.
11 The Future of the WTO: Addressing Institutional Challenges in the New Millennium, Report by the Consultative Board to the Director-General Supachai Panitchpakdi, 2004, WTO. (The Sutherland Report).

U.S. Agricultural Policy and the 2007 Farm Bill 41
members from using the DSU. Under the GATT, few cases had been successful in curbing subsidies. One exception was the oilseed case brought by the U.S. against the E.U. Resolution of that case had unlocked the door for the agreement on agriculture in the Uruguay Round (Josling and Tangermann, 2003). And, until the end of 2003, the Peace Clause had an impact, specifically sheltering some subsidies from the impact of the SCM Agreement (Steinberg and Josling, 2004).
Though few cases challenged key aspects of developed country policies, several involved related issues, such as the use of sanitary and phytosanitary measures (the E.U. hormones restriction, Australian salmon, and the Japanese fruit testing cases, for example). In each of these cases, the panels found for the plaintiffs (Josling, Roberts, and Orden, 2004) and set a strict judicial standard for compliance with the WTO rules (in these cases the Sanitary and Phytosanitary Agreement). This may itself have emboldened members to initiate actions, as they recognized a more assertive judiciary that was seemingly unimpressed with the political implications of their decisions.
The apparent “moratorium” on significant challenges to key agricultural policy provisions changed radically in 2003, with the cotton and sugar cases following quickly on one another. A number of factors seem to have been at work. Note the cotton case was initiated before the expiration of the Peace Clause, and Brazil was required to show that U.S. cotton support in the later years exceeded support for 1992. However, lack of progress in the Doha Round and a seeming lack of political commitment for further reform encouraged the settlement of issues under the existing WTO agreements. Moreover, developing countries were also growing more confident over the use of the WTO dispute settlement processes. In addition, groundbreaking case law in WTO disputes—including most notably the first case that directly challenged a member’s domestic policy, the objection by New Zealand and the U.S. to Canadian dairy policy—led directly to the E.U. sugar case, discussed in detail below.
AGRICULTURAL SUBSIDY CASES
Most agricultural cases since the Uruguay Round have been about market access, rather than the more sensitive aspects of domestic or export subsidies. This emphasis may change over time, as subsidy cases become more significant. There were a total of twenty-three cases involving agricultural products that resulted in the establishment of panels since the start of 2002.12 Seven of these involve import measures, another three are disputes over customs classification, and a further five involve antidumping or countervailing duty (CVD) actions. In addition, two more are about import licenses and excise duties. But though the cases that actually involve subsidies (domestic and export) are only a small fraction of the total agricultural conflicts, they have the most significance for rule changes through negotiations. Four such subsidy cases are listed in the table, but there are only two distinct cases, U.S.-Cotton and E.U.-Sugar, as the challenge to E.U. sugar policy is listed as three disputes.13 Nevertheless there is no doubt that these two cases are the most important of the agricultural disputes in the last few years. Together with that of the earlier Canada-Dairy case, it is these two disputes that are redefining the concept of a subsidy and the usefulness of the “boxes” of the URAA. A brief account of each of these cases is given below.
12 There were 83 such panels altogether, so agricultural products featured in about a quarter of these. This is way beyond the share of agricultural goods in trade, but reflects the significance of such conflicts in trade relations and the extensive policy involvement in agricultural markets.
13 Another case, US-FSC/ETI, also considered agricultural subsidies as part of its terms of reference, but has less direct implications for agricultural policy.

42 WOODS INSTITUTE FOR THE ENVIRONMENT | STANFORD UNIVERSITY
The Canadian Dairy Case
In the aftermath of the Uruguay Round, the Government of Canada instituted a new policy designed to assist exporters of dairy products (mainly cheese) made with expensive domestic milk. A separate “export” class of milk was defined which could be sold at a price lower than that for domestic use.14 The architects of the policy no doubt assumed that, as no government funds were involved, such a scheme would not be seen by trading partners as an export subsidy.
New Zealand, supported by the U.S., took issue with the policy and, after the requisite consultations, it became the subject of a WTO dispute.15 The panel ruled that the program did indeed constitute a subsidy to exports as it resulted from government action, even though no funds were involved.16 The Canadian policy was changed to reduce the role of the government, leaving it up to the private sector to negotiate sales of the milk for processing and sale to export destinations.17 New Zealand and the U.S. were not convinced that this had solved the problem. The panel was asked to rule on the new policy, and again found it to be in violation of Canada’s export subsidy commitments, on the grounds that the price of domestic milk was controlled by the government, and that this in itself could be enough to subsidize exports.18 Importantly, the Appellate Body, in ruling on the second case, directed the panel to use the test of whether the cost of the milk to the export processors was less than the cost of production incurred by the farmers. The panel reconvened and decided that, as most farmers produced for both the domestic and the foreign market, that they in effect sold the milk surplus to their domestic allotment at a “subsidized” price.
The case was settled when the Canadian provinces abolished their CEM programs. Changes in the federal programs are ongoing. New Zealand and the U.S. have withdrawn their request for sanctions and argued that the outcome vindicated the working of the dispute settlement machinery. But the significance of the outcome of the challenge by New Zealand and the United States to the Canadian dairy policy was soon obvious to export interests in other countries. If selling farm products for exporting (or processing for export) at a price less than the cost of production was indeed regarded as an export subsidy, then any situation where high, administered domestic prices coexisted with exports might be shown to be contrary to the WTO—or at least would need to be counted against the export subsidy commitments. Sugar and dairy policies in the E.U. were obvious targets (see below), but other cases will soon emerge.
In the present context, this outcome has another implication. The WTO rules and commitments are based on the notional separation of domestic support from market access and export competition. These aspects are clearly linked economically and politically, but it was assumed that they were at least possible to separate in administrative terms. But if an administered price can grant a subsidy on exports then the link between domestic support and export competition is exposed. In other words, the legal avenue has made obvious what the pillars of the URAA had attempted
14 Prior to 1995, the Canadian Dairy Commission, the federal body charged with the management of the dairy market and the co-ordination of the Provincial Milk Marketing Boards through the National Milk Marketing Plan, assisted exports through levies paid by dairy farmers. The new regulation at issue established five Special Milk Classes (Classes 5(a) through 5(e)) for milk and dairy products not exclusively for the domestic market. This Class 5 milk is sold at negotiated prices or set by formula based on U.S. industrial milk. The Special Milk Classes 5(d) and (e) were the focus of the dispute and covered exports of cheese and dried milk mainly to the U.S. and the U.K., as well as surplus milk from the domestic market.
15 The dispute also included a complaint about the administration of Canadian dairy import regulations, but that raised different issues and will not be discussed here.
16 The panel report on the U.S. case is to be found in WTO (1999), Canada—Measures Affecting the Importation of Milk and the Exportation of dairy Products (WT/DS103/R). The parallel New Zealand case has the WTO dispute number DS113.
17 Canada abolished the Special Milk Class 9(e) and restricted sales under Class 5(d) to conform to its export subsidy commitments. A new milk category of Commercial Export Milk (CEM) was established.
18 The challenge to Canadian dairy policy was not covered by the Peace Clause as it charged that the export subsidy commitments had been violated.

U.S. Agricultural Policy and the 2007 Farm Bill 43
to conceal: that the root cause of trade problems is high domestic prices set by farm policy and that these have not been effectively reduced by the constraints imposed on the “at the border” instruments or on domestic subsidies.
The U.S. Cotton Case
The case against U.S. cotton subsidies involved many issues, including export subsidies and national treatment. But, the serious prejudice part of the case dealt, to a significant extent, with the degree to which complex subsidy programs affected production incentives or were otherwise considered trade-distorting under WTO rules.19 The rulings of the panel may be summarized by considering the nine elements of the U.S. programs that were the subject of the challenge by Brazil (see Table 3). Five of these elements (direct payments, production flexibility contract payments, market loss assistance payments, counter-cyclical payments, and marketing loan payments) relate to the major instruments of farm policy adopted for the “program crops” in the Farm Bills that cover the period 1999–2003.20 Two more are specific to cotton (Step 2 subsidies and cottonseed payments), and the other two are of more general application (crop insurance and export credit guarantees). The panel ruled basically on two issues: whether these subsidies were prohibited and whether they caused “serious prejudice” to the interests of Brazil.
The two subsidies that were not price-related (and which had therefore been notified by the U.S. as being in the Green Box) were found not to be the cause of “price suppression” in world markets. They were, however, found to contain provisions that made them classified as contributing to support for cotton: specifically the restrictions on the alternative crops that farmers could grow on cotton land. The panel pointed to explicit language in the agriculture agreement that stated that such provisions precluded classifying such programs as no more than minimally trade-distorting. The panel decided that programs with such provisions could keep more acres in that crop than totally “decoupled” payments would have done. The panel also ruled that crop insurance subsidies contributed to support for cotton, but did not contribute to price suppression. The four subsidies that were price-related were found to have caused price suppression, through their impact on keeping cotton production high in the U.S. at a time of low world prices.21
The panel ruled that the Step 2 subsidies paid to domestic users were prohibited under the Subsidies and Countervailing Measures Agreement (SCM) and that the Step 2 subsidies available to export users were prohibited because they were not included in the U.S. schedule of subsidies. Moreover, the Step 2 subsidies also caused significant price suppression in world markets. Cottonseed subsidies and crop insurance payments were deemed not to have caused price suppression, and were not prohibited subsidies.
The final aspect of the U.S. programs on which the panel ruled was the set of export credit guarantees that are available to U.S. firms when they sell into overseas markets where credit risks are a factor. The finding in this case was that the export credit guarantees given to cotton producers, and for several other major commodities, constituted an export subsidy, and since no such subsidy had been included in the U.S. schedule it was in effect prohibited.22
19 Brazil requested consultations with the United States on September 27, 2002. After three abortive discussions, a panel was established on May 19, 2003 and issued a report on June 18, 2004. This ruling was appealed by the United States, and the Appellate Body issued its report on March 3, 2005. The report as amended was adopted on March 21, 2005.
20 The two Farm Bills in question are the 1996 FAIR Act and 2002 FSRI Act. Production flexibility contract payments were authorized under the FAIR Act, and marketing loss assistance payments were added as emergency measures in 1998–2001. The FSRI Act replaced these with direct payments and counter-cyclical payments. Marketing loans for cotton have been in place since 1986 and Step 2 subsidies since 1990. The cottonseed payments are emergency payments authorized by the ARP Act in 2000. Crop insurance is authorized by separate legislation, the Federal Crop Insurance Act.
21 The panel rejected the U.S. argument that the low world prices were from other causes and that the high U.S. exports were an exception rather than the rule.
22 The ruling also declared the export credit guarantees for rice exceeded its allowed export subsidy limit, but did not find fault with other aspects of the program.
44 WOODS INSTITUTE FOR THE ENVIRONMENT | STANFORD UNIVERSITY
The panel ruling required the U.S. to end the prohibited subsidies within six months of the adoption of the report, or by July 1, 2005 at the latest. This ruling applied to the Step 2 payments, to both domestic and export users, and to the export credit guarantees for cotton. The U.S. decided that it could make these changes in legislation without having to await the next Farm Bill, expected in 2007. The Administration urged Congress to scrap the Step 2 payments, and these ended in August 2006. The USDA has also proposed changes to the export credit arrangements by eliminating the 1 percent cap on the fees that are charged for borrowing through the GSM-102 program, and by terminating the GSM-103 program that provides for longer repayment periods. The Congress did not accept Administration suggestions for legislation on the GSM programs, and these programs were not changed to the satisfaction of Brazil.
More problematic for the U.S. is how to adjust the programs that the panel found to cause significant price suppression. Withdrawing the marketing loan and counter-cyclical payments would require major changes in the U.S. legislation. Taking other steps to remove the adverse impacts on Brazil might seem easier to achieve, but any attempt to restrict U.S. cotton exports could prove difficult. Compensation to Brazil for lost exports would also seem politically implausible, and a deal to boost Brazilian exports of other commodities would be similarly unpopular. So the prospect is for no change in these aspects of U.S. policy at least until the 2007 Farm Bill—at which time the policies may in any case need to be modified as a result of the Doha Round. The U.S. has claimed that it did all that was required by the original panel, and Brazil challenged the U.S. failure to implement. The panel considering the implementation case is scheduled to report in late spring 2007, so any final WTO ruling will be consistent with the timing of the 2007 Farm Bill, even if Brazil prevails in the implementation case.
An interesting side issue raised by the panel report is the conclusion that the direct payments and production flexibility contract payments are likely not eligible for the Green Box. This would seem to indicate that countries might ask the U.S. to resubmit notifications of domestic support for the years in question. This would likely put the U.S. in excess of its Amber Box limits in some year and raise serious problems with trading partners. Were this to be resolved by litigation (an easier task since no serious prejudice issues would be relevant), then the U.S. would have to make major changes to its farm policy. Canada has initiated just such a claim in the WTO, but again, the chances are that these issues will be resolved in the context of the 2007 Farm Bill.
The signal importance of the cotton case for WTO jurisprudence is that it clarifies several aspects of the application of WTO rules to agricultural subsidies, and indeed to subsidies in general. The Peace Clause effectively dissuaded members from challenging agricultural subsidies under the SCM before 2004. The panel ruled that the Peace Clause did not provide shelter for the U.S. subsidies in question because U.S. cotton subsidies had risen since the base period. The consistency of agricultural subsidies with the provisions of the SCM is a fertile ground for consideration. But the panel indicates that, at least in this case, these restrictions are both onerous and comprehensive. Though the ruling on serious prejudice was based on the impact of U.S. subsidies on world cotton prices, the same provision of the SCM also includes the effect of subsidies in impeding exporters in domestic and third-country markets, as well as the impact on market shares. Moreover, though it was not found germane to this case, the SCM has provisions for cases where the “threat” of serious prejudice exists.
The case has not ushered in a flurry of similar litigation. Such cases depend crucially on the facts of each commodity and each market and with generally high commodity prices cases are less likely (Sumner 2005). But the panel report certainly gives encouragement to countries that have refrained from making challenges because they felt that panels would have difficulties in finding evidence of serious prejudice. In markets where there are many factors contributing to the export performance of particular countries, establishing causal relationships is problematic. But the panel seemed to be unphased by the conflicting opinions of expert witnesses on the magnitude of the impact of U.S. subsidies on world cotton prices. They made their ruling, on the basis of a preponderance of evidence from

U.S. Agricultural Policy and the 2007 Farm Bill 45
economic studies, that production of cotton in the U.S. has a significant impact on the world market price. Though they avoided linking their decision to any particular study, they certainly paid more attention to such evidence than many previous panels. So the cotton panel continues the trend toward rulings based on economic reasoning and quantification as a way of bringing precision to terms such as “substantial” and “significant” that pepper the rules on the trade impacts of subsidies. The cotton case is likely to be cited in many panel reports in future years.
The E.U. Sugar Case
The impact of the Canadian dairy case on the approach taken by exporters toward farm policies in other countries can be seen in the challenge brought by Brazil, Australia, and Thailand against the E.U. sugar subsidies.23 Complaints about E.U. sugar policy are not new. Australia had challenged the E.U. sugar regime in 1979 in the GATT, and Brazil followed in 1980, but these were complicated by the fact that there was an International Sugar Agreement (to which the E.U. was not a signatory) that restricted exports. Under such circumstances, the panels were unable to determine the extent of injury that the plaintiffs had suffered and the policies continued unchecked (Tangermann and Josling, 2003). The U.S. also challenged the CAP sugar policy in the GATT in 1982, but no panel was established. The E.U. indicated its willingness to join the ISA and proceeded in turn to challenge the U.S. sugar regime.
One of the contentions of these sugar exporters in the recent WTO case was that the E.U. grants de facto export subsidies by means of the high price paid for sugar used on the domestic market. The domestic market price is maintained for sugar produced under two quotas (the “A” and “B” quotas): production over those quotas (usually called “C” sugar) cannot be sold on the domestic market and receives no direct subsidy. At issue is whether the “C” sugar benefits indirectly, as farmers can cover their fixed costs from returns from the high-price quotas. The analogy with the exported milk products from Canada is close, if not exact. The complainants maintain that if such subsides were included, the E.U. would be in breach of its export subsidy commitments under the URAA.
A second contention was that the E.U. exports the equivalent of the 1.4 million tons of sugar that is imported under preferential agreements enshrined in the Cotonou Agreement with former colonies. This sugar is sold to the E.U. at the internal price, but re-exported at the world price. This was not notified as a part of the E.U.’s schedule of exports that benefit from subsidies: it was explicitly excluded in a footnote.
The panel found, and the Appellate Body agreed, that the E.U. was in breech in both respects. The exports of C sugar did benefit from the high price of A and B quotas awarded to the same farms. As the C sugar was solely destined for exports, the effect was to cross-subsidize.24 By implication, if C sugar were sold on the internal market to any extent, the argument would have required a further stage of showing that the exports were harming other exporters. But as the implicit financial benefits to producers of C sugar were not notified as export subsidies they were de facto prohibited, regardless of their market impact. Similarly, the panel found that the re-export of the ACP (and Indian) sugar was prohibited as it did not appear in the E.U. schedule. Thus the E.U.-sugar case differs from that of U.S. cotton in that is centers primarily on the notification of export subsidies. The fact that these notifications were not challenged at the time raises questions about how the activities of the Agriculture Committee might be linked more usefully to the issue of the nature of these policies.
23 The Australian and Brazilian challenges were initiated in September 2002 and Thailand joined the complaint in March 2003. The dispute numbers are DS265, DS266 and DS283, respectively. The panel report was presented on October 15, 2004 and was appealed. The Appellate Body gave their opinion on April 28, 2005, and the DSB accepted the report as modified.
24 Investigations of subsidies in non-agricultural markets often explore the possibility of cross-subsidization within firms. The economics of cross-subsidization is not as well accepted as the accounting conventions.
46 WOODS INSTITUTE FOR THE ENVIRONMENT | STANFORD UNIVERSITY
The sugar case is complicated by an additional element. If the E.U. cannot either re-export the ACP imports or sell C sugar on the world market, then the domestic price has to be reduced and/or the quotas have to be reduced. The E.U. Commission realized this link with reform of the E.U. sugar regime, and used the argument effectively to persuade member states of the need for policy change. The political decision was made by the E.U.’s Council of Ministers on November 22, 2005, to undertake a reform that cut the sugar price support level by 36 percent and compensated farmers with “decoupled” payments. Though the support price will stay significantly above the world price level, the incentive to produce for export (over and above the quota volume) will be significantly reduced. If the output falls as expected, the E.U. will come into compliance with the Panel ruling: cross-subsidized production will not find its way into export markets, and the ACP sugar will be absorbed largely in the domestic market.
CONCLUSION
The use of the legal process of the WTO has attractions, particularly for farm commodity exporters who feel frustrated by the ability of importers to stall and resist trade reform. So far, this effort to test the WTO compliance of U.S. and E.U. policies has been remarkably successful in terms of panel reports that have not shied away from clear decisions. The lesson that other countries have learned is that a sound case can have results that would not seem possible from negotiations alone. But reliance on the dispute settlement process for forcing policy change in developed country policy carries with it dangers, as it pits the legal remedies in the WTO against the political process of negotiating domestic farm policy. This could seriously compromise the political acceptance of the multilateral trade rules and institutions that are currently in place. In other words, even if it may be useful to expose domestic support to the rigors of judicial decision, it may first be necessary for the politicians to accept the need for more restrictive trade rules. That would be a useful contribution of the Doha Round. If that political acceptance is missing then the attempts to restrict domestic farm policy by enforcing WTO trade rules will lead to continued conflict and ultimately failure. At the same time, an agreement that is not enforced is worthless; the credibility of the WTO among developing countries, in particular, hinges on their ability to believe that the large, rich countries will play by the rules that they accepted in the agreements. The issue of the trade impact of developed-country subsidies may create as many headaches for the judicial as for the political processes of the WTO.
E: Implications of Litigation for U.S. Farm PolicyThe U.S.-Cotton case came as a sharp reminder of the extent that domestic farm policies are now constrained by the agreed rules of the WTO, both the Agreement on Agriculture and other provisions such as the Agreement on Subsidies and Countervailing Measures. If countries are making more use of the Dispute Settlement process in the WTO to resolve grievances, then it is necessary in framing the Farm Bill to consider carefully the extent to which domestic actions can be challenged in the WTO. Sumner (2005) comments that
“The importance of ensuring consistency with WTO rules has not escaped Congress’ attention. Senator Saxby Chambliss (R-GA), Chair of the Senate Committee on Agriculture, recently assessed factors affecting the upcoming 2007 Farm Bill. After mentioning the role of budget deficits, he noted that a recent WTO ruling concerning U.S. upland cotton subsidies is important for all commodities in the farm bill. ‘Every commodity has to look at this case and make decisions as to what changes we need to make within the particular titles to meet WTO requirements,” Chambliss stated. ‘WTO is a great organization that has served us well to this point. We must be sure we’re WTO-compliant in this next Farm Bill.’”

U.S. Agricultural Policy and the 2007 Farm Bill 47
The implications for U.S. farm policy of the litigation mentioned above have been explored by Sumner (2005), and a discussion of the vulnerability of both U.S. and E.U. farm programs to challenge in the WTO was highlighted in an Oxfam publication (Oxfam, 2005). The two publications paint much the same picture. More significant is a 2006 analysis by Schnepf and Womack of the U.S. Congressional Research Service, which used and reinforced the analysis from these other sources, including Josling and Steinberg (2004).
Sumner extends the impact of the cotton ruling beyond the elimination of Step 2 and export guarantees to the issue of removing the causes of serious prejudice, specifically the impact on world prices and hence export earnings of price-linked subsidies (as discussed above). As these policies are used in support of all program crops, including corn, wheat, soybeans, and rice, the cotton ruling gives a clear indication as to the likely focus of other challenges.
Two separate issues can be distinguished: that of “correct” notification of subsidies to the WTO Agriculture Committee and the extent to which other countries may claim that U.S. policies are causing serious prejudice to their economic interests. The first can be approached as one of recalculating the notification already made and anticipating that which will have to be made for future years. Once the rules for allocating particular subsidies are agreed to the notification is an accounting problem. Sumner has projected the U.S. notification under Domestic Support using the conventions as understood by the U.S. Administration (Table 2) and then “renotified” the AMS on the basis that the PFC and Direct Payments would not qualify as Green Box measures (Table 3). This shows clearly that the U.S. is exceeding its AMS limits under the revised rules.
Challenges to the notifications for past years may not be high on the list of priorities for other countries. However the revised base does have potential significance for the extent to which programs will have to be trimmed in future.
The second issue is the challenge of policies regardless of the color of the box into which they are put on notification, if they cause serious prejudice. Though estimates of world market impacts vary, Sumner suggests that the depressing impact of U.S. programs on world price may be in the range of 9–10 percent for corn, 6–8 percent for wheat, and 4–6 percent for rice. Such magnitudes would translate into millions of dollars’ loss to competing exporters. Oxfam points to corn, rice, and sorghum payments, where the U.S. programs are vulnerable. For corn, this conclusion is based on a calculation that U.S. corn production could be 15 percent lower without marketing loans and counter-cyclical payments, and with the sharp reduction of U.S. corn exports, world prices would be 7 percent higher. This could result in $4 billion in additional exports to countries such as Argentina, Paraguay, and South Africa. Moreover, importing countries could also claim serious prejudice as a result of subsidized U.S. production, although they might benefit as a whole from lower prices. For rice, the Oxfam report indicates that competing exporters might be losing $1.2 billion in exports as a result of a 5 percent reduction in world prices. In all, the Oxfam report suggests that overseas exporters are losing nearly $8 billion in sales as a result of U.S. programs. Cases over such a significant export loss would be larger than any current dispute: the FSC/ETI case revolved around a $4 billion reduction in E.U. exporters as a result of U.S. policies. Note that these studies used baseline figures prior to the recent jump in prices of corn and other program crops.
F: ConclusionsThe impacts of the WTO constraints on the U.S. Farm Bill are of three kinds.
First is the need to bring current policies into conformity with the WTO ruling in the cotton case, by removing any remaining illegal export subsidies, by making changes that remove the serious prejudice (presumably to Brazil’s satisfaction or the case will be prolonged), and by changing the conditions under which direct payments are made

48 WOODS INSTITUTE FOR THE ENVIRONMENT | STANFORD UNIVERSITY
to make them fully consistent with the Green Box definition. These changes are needed regardless of whether there is a Doha Round outcome or any new cases. Though it is tempting to conclude that the 2007 Farm Bill will settle all these issues, the process of domestic legislation is subject to different pressures and constraints than that of the WTO dispute settlement system.
Second, the changes agreed to in a Doha Round package will have to be phased in over a period of years. So long as the main parameters are known before the Farm Bill is drafted, this could be built into the legislation. Policy changes could be introduced on a schedule that corresponded to the new obligations under the WTO. This would prevent trade tensions from rising if the Farm Bill was expected to generate payments in the future that would exceed WTO commitments. A Farm Bill drafted before the Doha package is agreed to would of course have to have flexibility built in or be revised as part of the implementing legislation.
Third, the Farm Bill needs to consider the possibility of challenge by other countries, on the assumption that there is no revived Peace Clause to shelter domestic programs from challenge. In the absence of a Peace Clause, it would be worthwhile being proactive, attempting to identify those policies that were in danger of violating WTO rules. This could be combined with similar examination of the policies of other countries making extensive use of domestic support. The benefit would be to give farmers and traders more confidence that the rules that have been set up with the encouragement of the U.S. are not being violated deliberately or inadvertently, to the detriment of the broader aims of opening up markets.
But so what if the Farm Bill is not in conformity with WTO constraints? Obviously there could be a period of litigation. But would that matter? It is not clear that the sanctions that others could bring would necessarily cause changes to be made to U.S. policy. The main reason is not to avoid conflict but to preserve the integrity of a system of trade rules that benefits the U.S. (including U.S. agriculture) out of all proportion to the discomfort of making domestic policy changes. And it is generally true that these policy changes are, in any case, in the best interest of the U.S. So the constraints are leading the U.S. farm policy in a direction in which it should go. So long as the domestic and the trade pressures are complementary, there should be no hesitation to adjust to WTO rules, and to insist that others do the same.
AnnexDescription of Subsidy and Countervailing Measures constraints on subsidies (from Sumner 2005).
The Agreement on Subsidies and Countervailing Measures (SCM) defines subsidies and classifies them variously as prohibited, actionable, or non-actionable (see Figure). The SCM Agreement applies to all trade in goods, not just agricultural trade, and explicitly notes where agricultural trade is an exception to the general rules.
Article 3 of the SCM Agreement defines prohibited subsidies to include: (a) export subsidies, except where they are explicitly listed for gradual reduction under the provisions in the Agriculture Agreement; and (b) subsidies conditional on the use of domestic goods rather than imported goods. WTO members are obligated not to grant or maintain such subsidies regardless of their size or effect on trade.
Actionable subsidies, as defined by Articles 5 and 6 of the SCM Agreement, are ones that, although not prohibited per se, cause “adverse effects” to the interests of other WTO members. Such adverse effects include injury to a domestic industry, nullification or impairment of benefits under the WTO agreements, and serious prejudice to the interests of another WTO member. Nullification and impairment in this context occurs when a subsidy has the effect of countering trade benefits that a WTO member had reason to expect from tariff reductions or other market-opening measures.

U.S. Agricultural Policy and the 2007 Farm Bill 49
Article 6 defines serious prejudice and is especially important for agricultural subsidies. In particular, a serious prejudice claim may arise when imports into the subsidized home market are displaced or impeded, exports to a third market are displaced or impeded, the subsidy causes significant price suppression or depression or lost sales for the complaining WTO member, or the subsidy causes an increase in the subsidizing member’s world market share over a defined period.
The SCM Agreement provides for separate remedies for complaints by WTO members about other members’ prohibited and actionable subsidies. WTO members found to provide prohibited subsidies are obligated to withdraw those subsidies expeditiously. Those found to provide actionable subsidies that cause serious prejudice must either withdraw the subsidy or otherwise remove the adverse effects of the subsidy.
Until 2004, the SCM Agreement’s applicability to farm subsidies was limited by the so-called “peace clause.” According to Article 13 of the Agriculture Agreement, domestic farm supports that met all the requirements of the Agriculture Agreement could not be challenged as actionable subsidies under the SCM Agreement—provided that they did not grant support to a specific commodity in excess of that decided during the base year of 1992 (the most recent year for which data were available at the time the Uruguay Round was concluded). The Article 13 peace clause was in effect only for [three years beyond] the “implementation period” of the Agriculture Agreement, [in effect] … a nine-year period beginning in 1995. Accordingly, the peace clause has now expired.
Subsidies notified in the Amber and Blue boxes under the URAA are actionable even when consistent with country schedules. Green Box policies can also be actionable when specific (see Annex Figure), though many Green Box policies are unlikely to be regarded as “specific” to any firm or industry.
Annex Figure: Relationship between Subsidy Categories in URAA and SCM

50 WOODS INSTITUTE FOR THE ENVIRONMENT | STANFORD UNIVERSITY
References:
Table 3: U.S. Cotton Programs and main elements in the Cotton Panel Ruling
PROGRAM PANEL RULING REMEDY
Direct Payments (DP) Not eligible for Green Box because of restrictions on use of land
Do not cause significant price suppression on world markets
By implication, re-notify domestic support for past years
Production Flexibility Contract payments (PFC)
Not eligible for Green Box because of restrictions on use of land
Do not cause significant price suppression on world markets
By implication, re-notify domestic support for past years
Market Loss Assistance payments (MLA)
Caused significant price suppression on world market Take steps to remove the adverse effects or withdraw the subsidy
Counter-Cyclical Payments (CCP)
Caused significant price suppression on world market Take steps to remove the adverse effects or withdraw the subsidy
Marketing Loan payments (ML)
Caused significant price suppression on world market Take steps to remove the adverse effects or withdraw the subsidy
Step 2 payments Caused significant price suppression on world market
For domestic users, payments were import substitution subsidy
For export users, payments were export subsidies not included in U.S. schedule
Take steps to remove the adverse effects or withdraw the subsidy; remove prohibited import substitutions and export subsidies by July 2005
Cottonseed payments Do not cause significant price suppression on world markets No action implied
Crop Insurance Does not cause significant price suppression on world markets No action implied
Export Credit guarantees
Credit guarantees for cotton (and several other products) were export subsidies and were not included in U.S. schedule. (Rice export subsidy exceeded its scheduled level)
Remove prohibited export subsidies by July 2005
Source: Authors, based on WTO Panel Report
Barton, John H., Judith Goldstein, Tim Josling and Richard H. Steinberg. 2006. The Evolution of the Trade Regime: Politics, Law and Economics of the GATT and WTO, Princeton University Press
Blandford, David, Tim Josling and Kaush Arha. 2007. “ U.S. Environmental Programs and their Compatibility with Green Box Provisions under the WTO Agreement on Agriculture” (this volume)
Oxfam, 2005. Truth and Consequences Why the EU and the USA must reform their subsidies, or pay the price, Briefing Paper No. 81
Schnepf, Randy and Jasper Womach. 2006. “Potential Challenges to U.S. Farm Subsidies in the WTO.” Congressional Research Service, Report for Congress, RL33697 October 25.
Steinberg, Richard H. and Timothy E. Josling, 2003. “When the Peace Ends: The Vulnerability of EC and U.S. Agricultural Subsidies to WTO Legal Challenge,” Journal of International Economic Law, Vol. 6(2), pp. 369–417.
Sumner, Daniel A. 2005. Boxed In: Conflicts between U.S. Farm Policies and WTO Obligations, Cato Institute, Washington, D.C.
WTO, 1994. Agreement on Subsidies and Countervailing Measures
WTO, 1998. EC—Measures Concerning Meat and Meat Products (Hormones), WTO/DS26 & 48/AB/R (Feb. 13).
WTO, 2001. Canada—Measures Affecting the Importation of Milk and the Exportation of Dairy Products, Report of the Appellate Body, WT/DS103&113/AB/RW (adopted Dec. 18).
WTO, 2004. European Communities—Export Subsidies on Sugar, Reports of the Panels, WT/DS265/R, WT/DS266/R, & WT/DS283/R (Oct. 15)
WTO, 2004. United States—Subsidies on Upland Cotton, Report of the Panel, WT/DS267/R (Sept. 8),
WTO, 2005. European Communities—Export Subsidies on Sugar, Report of the Appellate Body, WT/DS265/AB/R, WT/DS266/AD/R, & WT/DS283/AB/R (Apr. 28).
WTO, 2005. United States—Subsidies on Upland Cotton, Reports of the Appellate Body, WT/DS265/AB/R, WT/DS266/AB/R, & WT/DS267/AB/R (adopted Mar. 21)

U.S. Agricultural Policy and the 2007 Farm Bill 51
Annex Table 2: AMS calculations for 2000 through 2006 based on the 2000 and 2001 U.S. notifications to WTO
MEASURE TYPE 2000 2001 2002 2003 2004 2005 2006
Green Box in U.S. Notification ($millions)
General services 8,554 9,214
Domestic food aid and public stockholding for food security
32,377 33,916
Income supports (PFC and direct payments) 5,068 4,100 3,968 3,857 5,278 5,287 5,237
Payments for relief from natural disasters 2,141 1,421
Structural adjustment (resource, retirement or investment)
1,608 1,730
Environmental payments 309 291
Total Green Box 50,057 50,672
Product-Specific AMS
Loan deficiency payments 6,273 5,592 5,380 693 461 4,411 5,124
Marketing loan gains 733 610 642 190 114 293 596
Cotton user payments 237 182 182 456 304 441 389
Certificate exchange gains 664 1,975 2,000 998 268 1,447 408
Other commodity payments1 2,660 76 5 1,321 9 990 970
Total commodity payments 10,567 8,435 8,209 3,658 1,156 7,582 7,487
Other product-specific support2 457 367 412 412 412 412 412
Market price support (dairy, sugar, peanuts3) 5,840 5,825 5,515 5,515 5,515 5,515 5,515
Total product specific AMS 16,864 14,627 14,136 9,585 7,083 13,509 13,414
Total Product-Specific AMS (after de minimis)4 16,802 14,413 14,007 9,497 7,018 13,385 13,291
Non-Product-Specific AMS
Crop insurance indemnities not covered by premiums
1,396 1,770 2,892 1,869 1,481 1,481 1,481
Market loss assistance/counter cyclical payments
5,463 4,640 0 3,705 1,027 2,513 5,913
Other non-product-specific AMS5 419 418 419 419 419 419 419
Total Non-Product-Specific AMS 7,278 6,828 3,311 5,993 2,927 4,413 7,813
U.S. value of agricultural production6 189,520 198,502 194,984 216,592 241,241 239,600 240,400
Share in % (de minimis = 5%) 3.8% 3.4% 1.7% 2.8% 1.2% 1.8% 3.2%
Total Non-Product-Specific AMS (after de minimis)
0 0 0 0 0 0 0
Total AMS 16,082 14,413 14,007 9,497 7,018 13,385 13,291
Source: 2000 and 2001 U.S. Domestic Support Notification to WTO; Estimates of the FY 2006 President’s Budget; Farm Service Agency’s Budget Division; Risk Management Agency; Economic Research U.S. Farm Income Forecasts

52 WOODS INSTITUTE FOR THE ENVIRONMENT | STANFORD UNIVERSITY
Notes to Annex Table 2:
1 Other commodity payments include oilseed payments, deficiency payments, tobacco payments, peanut payments, peanut quota compensation payments, seed cotton payments, wool and mohair payments and others.
2 Other product specific support includes storage payments and the commodity loan interest subsidy. The figures for 2002 to 2006 are based on the simple average of the 2000 and 2001 figures as reported by the United States to the WTO.
3 In 2004 peanuts no longer have market price support
4 The de minimis deduction for 2002–2006 is based on the ratio of the simple average of the AMS after the de minimis deduction in 2000 and 2001 and the simple average of the total product-specific AMS as reported by the United States to the WTO for 2000 and 2001.
5 Other non-product-specific AMS includes water subsidies, grazing fees, crop disaster payments, state credit programs and farm storage facility loan program. 2000 and 2001 figures are based on the WTO notification, for later years we apply the simple average of the 2000 and 2001 figures.
6 The value of production figures are based on ERS reports on farm cash receipts and its forecast for 2005. The 2006 figure is the simple average of U.S. agricultural cash receipts for 2004 and the estimate for 2005. Only if U.S. value of production were to reach over $261 billion, would non-product-specific support be exempt under the de minimis rule.

U.S. Agricultural Policy and the 2007 Farm Bill 53
CHAPTER II-3
The 2003 Reform of the European Union’s Common Agricultural Policy and Its Relevance to the U.S. Farm Policy Debate
Tassos Haniotis
The 2003 CAP Reform
THE PARADOX: CAP REFORM WITHOUT BUDGET, WTO OR FOOD SAFETY CRISIS
A generation of farm policy analysts, experts and practitioners of all kind took for a fact, well-established in past experience, that every reform of the Common Agricultural Policy (CAP) necessarily involves two things. First, a crisis of some sort related to the E.U. budget, to a GATT/WTO agreement or panel, or to some food safety disaster. Second, the ritual of endless negotiations between the European Commission and the member states of the European Union (E.U.) that, assisted by the necessary drama of sleepless Council meetings and closed door sessions, results in an early morning compromise.
The 2003 reform of the CAP had all of the drama of the E.U. decision-making ritual (including an Agriculture Council that formally lasted three weeks). It also involved, at one stage or another during the preparation of the reform, a budgetary decision, the launching of a new WTO Round, and not one, but two, food safety crises. Yet by the time E.U. farm ministers voted almost unanimously in favour of what was universally considered the most fundamental reform in the history of the CAP, all of the usual reasons or excuses for reform were gone.
The E.U. budget for the bulk of agricultural programmes (except for rural development) was fixed by heads of state to last until 2013. The Doha Round was drifting to unknown territory after the 2002 U.S farm Bill. And the E.U.’s beef sector had survived its second (and deepest) B.S.E. crisis in a decade and an unprecedented outbreak of foot-and-mouth disease in the U.K. with E.U. beef consumption not just recovering, but increasing with respect to its levels before the crises.
From the traditional point of view of CAP reform causality, the 2003 reform should have never happened, since the usual reform drivers were gone. Yet it did and thus raised some interesting questions about the why and the how of the 2003 CAP reform. Shedding some light on this paradox, and its potential relevance for the U.S. farm policy debate, will be the focus of this paper, which covers in some detail the process of CAP reform and parallel developments in U.S. farm policies.
Although it identifies areas of similar challenges, linked to budgetary, trade and food safety reasons, the paper concludes that policy responses in the E.U. and the U.S. are quite different due to differences in the institutional setting of both transatlantic partners.

54 WOODS INSTITUTE FOR THE ENVIRONMENT | STANFORD UNIVERSITY
THE CAP REFORM IN CONTEXT
CAP and E.U. agriculture at a glance
When the founding six member states established, among others, the predecessor of the E.U., the European Economic Community (E.E.C.) with the Treaty of Rome in 1957, the principle of a common agricultural policy was part of it from the start. Implemented since 1962, the CAP was based on three central principles—common market organisation, common financing, and community preference. The practical consequence of this system is well known and extensively covered in literature—high domestic support prices that required high border protection, and financial support for the commodities covered in the form of either intervention costs or export subsidies.
As with every public policy, the CAP reflected from its inception certain compromises among conflicting interests. Domestically, the initial CAP compensated the uncompetitive farm structure of one member state (Germany) with high support prices. By doing so, it shelved the alternative option of allowing the then competitive farm structure of another member state (France) to determine the E.E.C. farm price level close to world market prices and provide direct support to compensate uncompetitive farmers. The advantage of the option chosen, in the context of a completely different set of conditions, was clear. The cost of such a policy passed to consumers, instead of taxpayers. It would take another three decades before its disadvantages were fully realized and started being reversed with the 1992 CAP reform.1
Internationally, high support prices for E.U. grains inevitably hampered U.S. exports and led to another compromise, which guaranteed free access for U.S. oilseeds. The consequences of this fundamental imbalance in E.U. feed costs became evident with the gradual decline in the demand for E.U. grains and the subsequent increase in U.S. oilseed exports. It was corrected with the process of CAP reforms initiated after 1992, which led to the reversal of this decline at the expense of U.S. oilseeds.
Thus almost half a century after its inception, the CAP has fundamentally changed not just in its policy instruments but also in its structure, turning more and more into a farmer-support instead of a commodity-support policy. This change, which is clearly not in tandem with the direction of still widely held public perceptions about the CAP, is a reflection of the present role of E.U. agriculture in the world.
Today the E.U. ranks as the top exporter and importer of agricultural products in the world, with close to 60 percent of its imports coming from the developing world. Details can be found elsewhere, but the important point of relevance to the process of CAP reform is that the E.U. export position is not due to E.U. bulk commodities, but to high value food products.2 It is revealing in this respect to compare how E.U. and U.S. agricultural trade developed during the last decade (Figure 1). While both E.U. agricultural exports and imports are increasing at similar pace (exaggerated in the graph due to the recent weakness of the dollar), U.S. imports are growing much faster than U.S. exports. As a result, a reversal in the trade position of the two major players, with the E.U. becoming a net exporter and the U.S. a net importer of agricultural products, may be around the corner.
1 The purpose of this paragraph is not explain the history of the CAP, for which ample literature exists, but to link the main elements of its pastThe purpose of this paragraph is not explain the history of the CAP, for which ample literature exists, but to link the main elements of its past with its most recent reforms. Reforms of the CAP also took place in the mid-1980s, and already reflected the realisation that the CAP was creating problems of excess supply and excessive budgetary costs. But these reforms did not alter the fundamental philosophy of a policy still based on product-specific support, but only tried to constrain its effects.
2 For details on E.U. agricultural trade seeFor details on E.U. agricultural trade see http://ec.europa.eu:8082/agriculture/agrista/tradestats/index_en.htm.
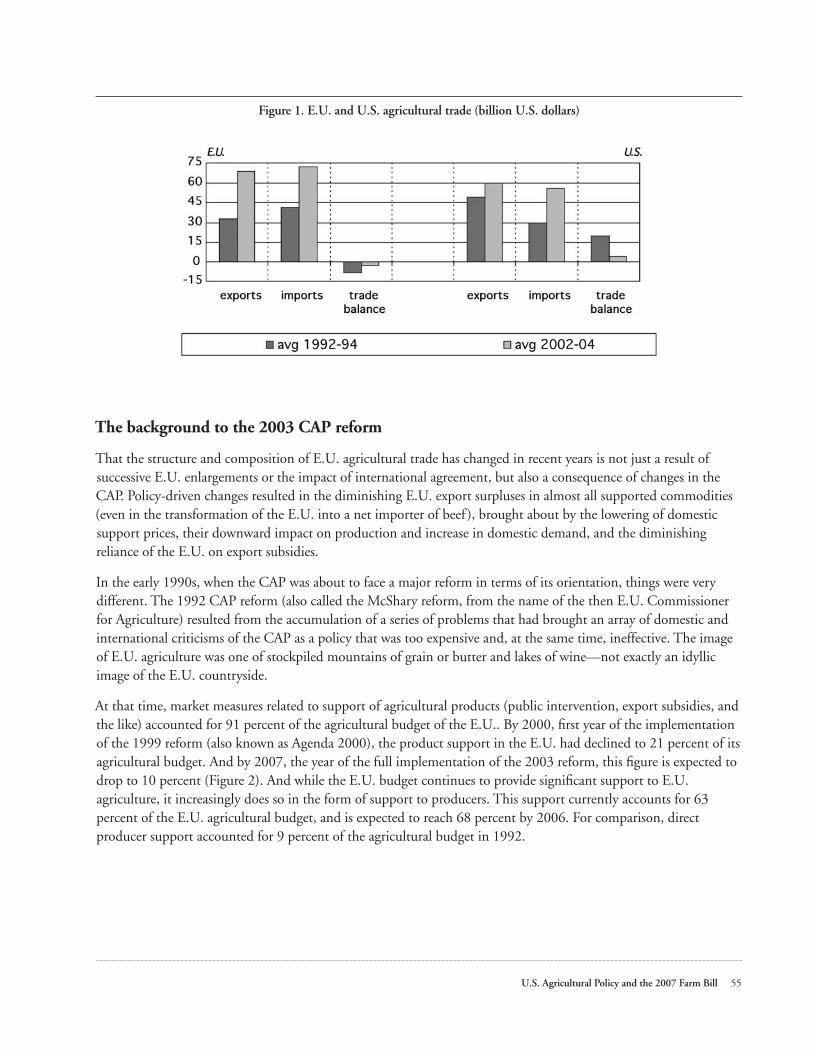
U.S. Agricultural Policy and the 2007 Farm Bill 55
Figure 1. E.U. and U.S. agricultural trade (billion U.S. dollars)
The background to the 2003 CAP reform
That the structure and composition of E.U. agricultural trade has changed in recent years is not just a result of successive E.U. enlargements or the impact of international agreement, but also a consequence of changes in the CAP. Policy-driven changes resulted in the diminishing E.U. export surpluses in almost all supported commodities (even in the transformation of the E.U. into a net importer of beef ), brought about by the lowering of domestic support prices, their downward impact on production and increase in domestic demand, and the diminishing reliance of the E.U. on export subsidies.
In the early 1990s, when the CAP was about to face a major reform in terms of its orientation, things were very different. The 1992 CAP reform (also called the McShary reform, from the name of the then E.U. Commissioner for Agriculture) resulted from the accumulation of a series of problems that had brought an array of domestic and international criticisms of the CAP as a policy that was too expensive and, at the same time, ineffective. The image of E.U. agriculture was one of stockpiled mountains of grain or butter and lakes of wine—not exactly an idyllic image of the E.U. countryside.
At that time, market measures related to support of agricultural products (public intervention, export subsidies, and the like) accounted for 91 percent of the agricultural budget of the E.U.. By 2000, first year of the implementation of the 1999 reform (also known as Agenda 2000), the product support in the E.U. had declined to 21 percent of its agricultural budget. And by 2007, the year of the full implementation of the 2003 reform, this figure is expected to drop to 10 percent (Figure 2). And while the E.U. budget continues to provide significant support to E.U. agriculture, it increasingly does so in the form of support to producers. This support currently accounts for 63 percent of the E.U. agricultural budget, and is expected to reach 68 percent by 2006. For comparison, direct producer support accounted for 9 percent of the agricultural budget in 1992.
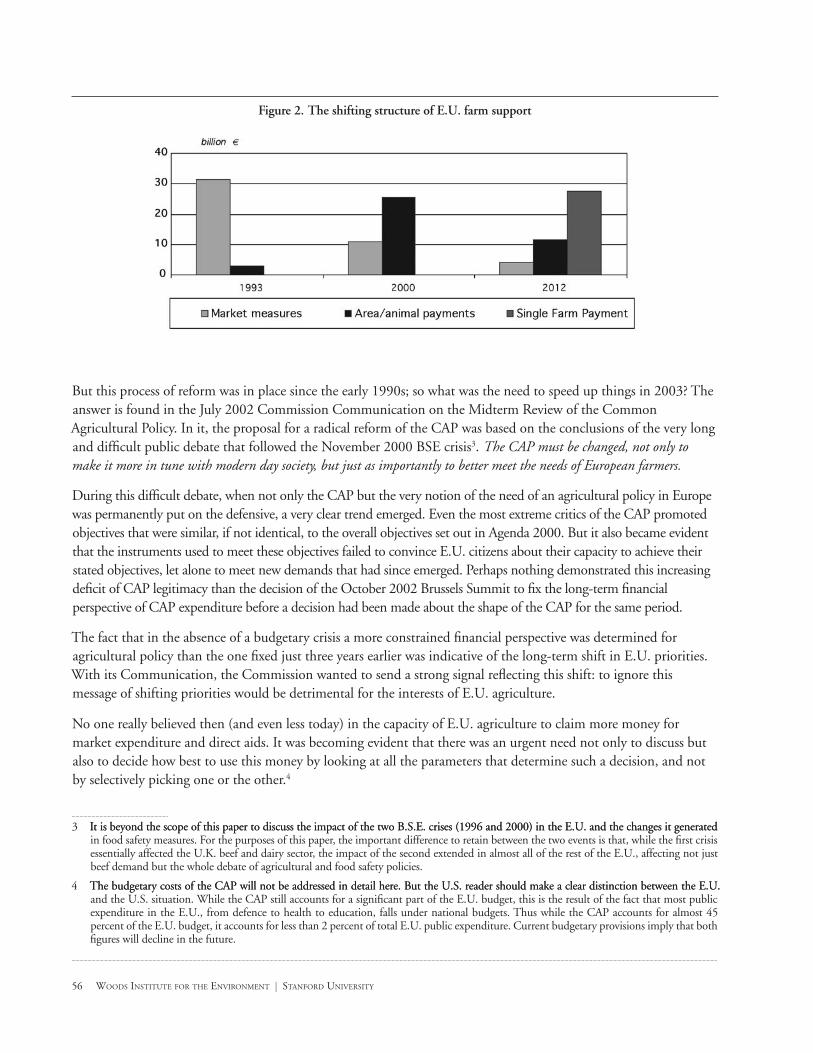
56 WOODS INSTITUTE FOR THE ENVIRONMENT | STANFORD UNIVERSITY
Figure 2. The shifting structure of E.U. farm support
But this process of reform was in place since the early 1990s; so what was the need to speed up things in 2003? The answer is found in the July 2002 Commission Communication on the Midterm Review of the Common Agricultural Policy. In it, the proposal for a radical reform of the CAP was based on the conclusions of the very long and difficult public debate that followed the November 2000 BSE crisis3. The CAP must be changed, not only to make it more in tune with modern day society, but just as importantly to better meet the needs of European farmers.
During this difficult debate, when not only the CAP but the very notion of the need of an agricultural policy in Europe was permanently put on the defensive, a very clear trend emerged. Even the most extreme critics of the CAP promoted objectives that were similar, if not identical, to the overall objectives set out in Agenda 2000. But it also became evident that the instruments used to meet these objectives failed to convince E.U. citizens about their capacity to achieve their stated objectives, let alone to meet new demands that had since emerged. Perhaps nothing demonstrated this increasing deficit of CAP legitimacy than the decision of the October 2002 Brussels Summit to fix the long-term financial perspective of CAP expenditure before a decision had been made about the shape of the CAP for the same period.
The fact that in the absence of a budgetary crisis a more constrained financial perspective was determined for agricultural policy than the one fixed just three years earlier was indicative of the long-term shift in E.U. priorities. With its Communication, the Commission wanted to send a strong signal reflecting this shift: to ignore this message of shifting priorities would be detrimental for the interests of E.U. agriculture.
No one really believed then (and even less today) in the capacity of E.U. agriculture to claim more money for market expenditure and direct aids. It was becoming evident that there was an urgent need not only to discuss but also to decide how best to use this money by looking at all the parameters that determine such a decision, and not by selectively picking one or the other.4
3 It is beyond the scope of this paper to discuss the impact of the two B.S.E. crises (1996 and 2000) in the E.U. and the changes it generatedIt is beyond the scope of this paper to discuss the impact of the two B.S.E. crises (1996 and 2000) in the E.U. and the changes it generated in food safety measures. For the purposes of this paper, the important difference to retain between the two events is that, while the first crisis essentially affected the U.K. beef and dairy sector, the impact of the second extended in almost all of the rest of the E.U., affecting not just beef demand but the whole debate of agricultural and food safety policies.
4 The budgetary costs of the CAP will not be addressed in detail here. But the U.S. reader should make a clear distinction between the E.U.The budgetary costs of the CAP will not be addressed in detail here. But the U.S. reader should make a clear distinction between the E.U. and the U.S. situation. While the CAP still accounts for a significant part of the E.U. budget, this is the result of the fact that most public expenditure in the E.U., from defence to health to education, falls under national budgets. Thus while the CAP accounts for almost 45 percent of the E.U. budget, it accounts for less than 2 percent of total E.U. public expenditure. Current budgetary provisions imply that both figures will decline in the future.

U.S. Agricultural Policy and the 2007 Farm Bill 57
In E.U. jargon, these parameters were expressed in four brief names related to the conclusions of four E.U. Summits: Berlin, Göteborg, Brussels, and Copenhagen. Some would add Doha, but in reality this was only the side effect, because the fundamental reason for reform of the CAP was internal. Berlin (1999) set the stage for a (midterm) review of the 1999 reform; Göteborg (2001) introduced the requirement to evaluate all E.U. policies from the point of view of its sustainability; Brussels (2002) fixed the funds available to E.U. agriculture; Copenhagen (2002) addressed the enlargement of the E.U. from 15 to 25 members.
Some of these Summits would actually alter previous conclusions. For example, the budgetary framework set in Berlin would be tighter after Brussels. Funds initially available to finance the dairy reform agreed in 1999 were curtailed, while savings not foreseen in Berlin were available before 2006 and the financial horizon of the first pillar of the CAP was extended to 2013.
Thus the Commission had to modify the ideas embodied in its original proposal on the redistribution of support between the two pillars of the CAP (markets and direct payments, and rural development), with less funds saved by reducing aid shifting to rural development, and more used to finance the dairy reform. More importantly, however, the Commission would have to find a radically new approach to farm policy. This it did by proposing the decoupling of direct payments and the introduction of the Single Farm Payment.
The reasons behind decoupling and the Single Farm Payment
The main elements of the Single Farm Payment scheme were the following. All direct payments were to be converted into a single payment per farm, which was determined by the level of support a farmer received in the 2000–2002 period for the support schemes in question. All parameters that generated this support during the reference period (area payments, payments based on the number of animals, payments based on quantities) were taken into account.
To facilitate the transfer of payment entitlements, the value of each entitlement per unit would be determined by dividing the level of payment by the size of area that generated it (including area linked to animal premiums). Unlike what is often claimed, this is not a linkage of decoupling to land. Farmers were free to use any eligible area (including area set aside), keeping their entitlement as long as this area was equivalent to the one used during the reference period.
But these payments would be conditional upon the respect of environmental, food safety, animal health and welfare, occupational safety standards, and the definition of good agricultural practices (cross-compliance in E.U. jargon). Sanctions would apply for non-respect of these criteria, while a farm advisory system would provide farmers with an incentive to improve their practices.
The reason the Commission opted for the above approach was to guarantee the neutrality of the impact of transfer of entitlement on land values by reflecting the actual level of subsidy per area in the entitlement. Otherwise, land values would be affected by a redistribution of support. The very different contractual relations among landowners and tenants among member states required that the implementation of the transfer of entitlements be done in a flexible manner, provided that clearly defined criteria were met. It would be up to the member states to adjust this scheme on a regional basis, based on these criteria, to account for unintended impacts on production or on land values.
The other two objectives of this proposal were simplification (as often is the case in a Union of many sovereign states, diluted to some extent with the final compromise) and the shift of these payments into the Green Box of domestic support of the WTO agriculture agreement.

58 WOODS INSTITUTE FOR THE ENVIRONMENT | STANFORD UNIVERSITY
Reactions to decoupling and alternatives suggested
It is a fact that proposals for the 2003 reform of market measures never received support from E.U. farmers, especially from their representative organisations5. This is only natural, as the instinctive response of a farmer is to associate a drop in price support with a drop in market revenue, despite the evidence that reforms since 1992 improved income in the reformed sectors, driven by improvements in structural market imbalances. But it was not on market measures, but on the proposal to complete the shift from product support towards producer support via the introduction of the Single Farm Payment, that most of the criticism of the CAP reform proposal focused and covered all three of the above stated objectives.
What was becoming evident with this proposal was that E.U. producers could not in the future expect to have their cake and eat it too. If supporting farm income remained a main objective, a lower level but higher quality of production may be the way to do it! It may have come as a surprise to some, but E.U. beef producers were realizing through successive crises that they could not achieve this as long as their income depended on producing more via the existing system of aids: the more animals they had, the higher the aid they received.
Of course, those who saw a direct link between their income and the quantity of beef handled were to lose. But the alternative—higher intervention stocks, higher budgetary expenditure for export subsidies and lower beef prices—was neither acceptable nor sustainable anymore. Gradually it was becoming evident to farmers through the traumatic experience of food safety crises, that lower quantities can translate into higher value if quality and the image of the product were to improve.
But while the need for quality was evident to all, what was less evident and led to a common criticism of the proposal, especially outside the farm sectors, was that decoupling of payments from production required a historical reference. Wouldn’t this freeze current distortions? It would, because in terms of levels of support, the Commission proposal opted explicitly not to use decoupling as an instrument of redistribution of support. Alternative proposals, favored especially by those who saw the opportunity to redistribute CAP support, including some who wanted to
“go further” and equalise the per unit level support, were abandoned.
Although recognising the distributional problems of the CAP, Commissioner Fischler considered that following this latter approach to decoupling would lead to more distortions rather than less. Affecting the level of support in an abrupt manner would have a disrupting impact on land values, affect farm wealth in a discriminatory manner, and disrupt production by forcing farmers to adjust production not based on market signals, but based on a new, artificial pattern of support.
Differences in support were viewed to some extent as inevitable since they reflected different agronomic, climatic, or historical patterns of productions and were politically difficult to alter, since for every winner there would be a loser. This is why Fischler preferred the introduction of a certain element of redistribution, not via elements of the previous market support, but through modulation.6 That is, by redistributing part of the payments after their historical level was determined in a manner that was both transparent and consistent with cohesion criteria and with the level of support farmers received.7
5 As is often the case, ex-post reactions to reform differ from ex-ante ones, and once the 2003 reform was put in place, support among E.U.As is often the case, ex-post reactions to reform differ from ex-ante ones, and once the 2003 reform was put in place, support among E.U. farmers grew significantly.
6 In CAP reform jargon, “modulation” refers to the cut in direct payments to farmers, which after the full implementation of the 2003 In CAP reform jargon, “modulation” refers to the cut in direct payments to farmers, which after the full implementation of the 2003 reform will equal 5 percent of all payments above 5000�¼, and its subsequent shift of the money thus collected from the 1st pillar of the CAP, market price support, to the 2nd pillar, Rural Development measures.
7 At this stage of the debate, what was also proposed was to apply “degressivity,” another CAP-jargon term implying that the higher the At this stage of the debate, what was also proposed was to apply “degressivity,” another CAP-jargon term implying that the higher the payment, the higher the cut in the payment in order to finance rural development measures.

U.S. Agricultural Policy and the 2007 Farm Bill 59
But decoupling was facing criticisms not only for not going far enough in terms of redistribution of support, but also for going too far in terms of its potential impact on production. Another proposed alternative to the Single Farm Payment was the so-called “partial decoupling,” that is, the mix of a certain level of decoupled support with the continuation of direct payments that were based on production requirements in all sectors.
The Commission proposal was not in itself a proposal about full decoupling everywhere. In sectors where clear risks of production abandonment were identified (durum wheat, rice, starch potatoes, protein crops), elements of coupled payments were retained. But a “partial decoupling” across the board was considered as not meeting any of the identified objectives—market orientation, simplification, “Green Box” compatibility within the WTO Agreement on Agriculture. It would not result in more market orientation, since producer decisions would continue to respond mainly to the coupled payment signals. It would be more complex to administer because two systems would run in parallel. It would diminish any benefits from a WTO point of view, since the shift of support towards the Green Box would be marginal.
But criticisms of decoupling and its linkage to WTO negotiations had another twist. Few seemed to dispute the fact that the Commission proposal would strengthen the E.U. negotiating position in the Doha Round, especially with respect to domestic support. Decoupling and the proposal to ban the use of de minimis clause of domestic support for developed countries was putting the E.U. on the offensive vis a vis its great partner and competitor, the U.S.
But many considered WTO negotiations “more as a card than as a strategy game” and claimed the E.U. needed to keep its cards hidden till the end. Fischler’s reply to this was that “in the presence of clear trade rules, the E.U. cards were not as close to its chest as some tended to believe and, worse, they are not as good, thus the risk of changing them is worth taking if this were a card game!”8 Whether the E.U. proposal was a gamble, as some still consider, or a calculated risk aimed at avoiding the doubling of what the E.U. would pay in domestic support will be debated for years to come. But one thing was clear: the E.U. move on domestic support could not be achieved without a lot of preparation.9
THE MIDTERM REVIEW (MTR) PROCESS—IMPACT ON CAP REFORM
The first Commission Seminar on the MTR (April 2001)
Assessments of reforms inevitably tend to explain how things evolved based on ex-post knowledge of the final outcome, with arbitrary assumptions often filling the knowledge gap of external observers. Yet the process of the MTR is not a mystery—it can easily be traced back to the numerous public interventions of the Agriculture Commissioner of the time, including interventions in the Commission. Two such interventions of Franz Fischler to the Commission, in April 2001 and April 2002, are publicly available, and highlight the evolution in the thinking process that led to the June 2002 proposal of CAP reform.10
8 Speech by Franz Fischler to the Committee for Agriculture of the European Parliament in Brussels on “CAP Reform: A long term perspective Speech by Franz Fischler to the Committee for Agriculture of the European Parliament in Brussels on “CAP Reform: A long term perspective for sustainable agriculture,” 22 January 2003. For this and all other speeches, see http://ec.europa.eu/archives/commission_1999_2004/fischler/cont_en.htm.
9 It is important to keep in mind that while this preparation was mainly focusing on “domestic” E.U. issues and priorities, it coincided withIt is important to keep in mind that while this preparation was mainly focusing on “domestic” E.U. issues and priorities, it coincided with an unexpected backtracking of farm policy reform on the U.S. side. While this development will be discussed in section 4, the relevant point here is that it rendered the move towards decoupling in the E.U. even more difficult.
10 All quotes in sections 3.1 and 3.2 are taken from the intervention of Franz Fischler in two internal Seminars of the European Commission onAll quotes in sections 3.1 and 3.2 are taken from the intervention of Franz Fischler in two internal Seminars of the European Commission on the mid-term review of the CAP. The full texts and accompanying graphs are available in http://ec.europa.eu/agriculture/capreform/archive/index_en.htm. The same site includes other background documents related to the 2003 reform.

60 WOODS INSTITUTE FOR THE ENVIRONMENT | STANFORD UNIVERSITY
The first of these Seminars was rather more defensive and focused on explaining the gap between what CAP reform had achieved so far and what was (not) known about it.11 Coming in its immediate aftermath, its starting point had to be the (ongoing) B.S.E. crisis and its impact on E.U. perceptions about farm policies. In attempting to explain this gap, Fischler focused on the emerging, predominantly non-agricultural, priorities of developed societies and drew attention to the fact that increasingly in Europe farm issues tended to relate to real or perceived threats that agricultural practices posed to public health. Often, such issues would potentially impact on trade as a result of applications of a technology pertinent to agriculture (from growth hormones to biotechnology). More infrequently, a traditional trade policy friction will also grasp the headlines—bananas being the most infamous, example. But the fact that societies of the developed world had the tendency to take food and the processes that produce it for granted had its consequences for policy priorities related to the production of food and for the manner by which they were dealt with.
In the E.U. context, these policy priorities were developing in the context of perceptions that still viewed agriculture as different from any other sector, thus leading to a potential conflict between the old and the new realities facing agriculture. The old realities were based on the belief that agriculture is fundamentally different from other economic sectors because the interaction of demand and supply affects agricultural markets in a unique way. Demand for food is continuous, as its availability on a daily basis is indispensable. Total demand for food is also income and price inelastic. The supply of food, on the other hand, is discontinuous, and is characterised by some really unique features: land and farm labor fixed in time and space, weather-induced uncertainties, biological cycles in production that render short-term adjustments to shifts in demand impossible, and unexpected supply shocks, to name few.
The new realities were (and continue to be) quite different. On the demand side, the food sector is characterized by an increased emphasis on food safety and precaution. Risks and benefits in the sector are assessed and weighed with almost zero tolerance by a large part of the population. Environmental concerns are almost as important, and a negative image of agriculture’s contribution prevails. Finally, the methods of production receive increased attention, as is widely demonstrated by animal welfare considerations.
The uncertainties associated with the demand-driven pressures threatened to substantially enhance agricultural production costs. Given the uncertain long-term horizon, producers were less concerned about the implemented policy reforms and more about what was perceived as an endless reform process. On top of this, the direct interaction between producers and consumers of agricultural produce was becoming more difficult, with increased food chain bottlenecks.
It is interesting to note that the distinction between the “old” and the “new” CAP was drawn in this Seminar before the orientation of decoupling was decided. Instead of focusing on the specific policy instruments that were still in the early stages of consideration, this Seminar put the emphasis on the objectives that should characterise the “new” CAP:
1. a competitive agricultural sector, which can gradually face up to world markets without being oversubsidized;
2. production methods which are sound and environmentally friendly, able to supply quality products that the public wants;
3. diversity in the forms of agriculture, which maintain visual amenities and support rural communities;
4. simplicity in agricultural policy, and sharing of responsibilities between the European Commission and E.U. member-states;
5. justification of support through the provision of services that the public expects farmers to provide.
11 SeeSee http://ec.europa.eu/agriculture/capreform/comsem1.pdf.
U.S. Agricultural Policy and the 2007 Farm Bill 61
The last three of these objectives were “internal” to the E.U. But the first two posed a wider policy dilemma that would become central to the 2003 reform. In fact, it is in the April 2001 Seminar that Fischler raised for the first time the conflicting trend between the requirements of a competitive agricultural sector and those of a quality-based sector in an international context.
The consequences of the first objective, to develop a competitive agricultural sector, could only be met if the sector were to strive for production efficiency and lower costs and prices; the consequences of the second objective, to meet the highest production standards, could be met by a focus on product quality, which generates additional production costs that render price competitiveness very difficult to achieve.
Reality is more complex than the schematic dilemma introduced here, but in a policy context, quantity matters in a supply-driven agriculture, quality matters in a demand-driven agriculture. That Europe had moved into the domain of a quality-driven agriculture, not just in terms of final product but in terms of requirements throughout the whole production process, was evident with the then-ongoing B.S.E. and the soon to come foot-and-mouth crisis.
The priority set to resolve this dilemma was clear already in 2001. The E.U. needed a farm policy, but a new one. As was put by Fischler in the April 2001 Seminar and in numerous speeches, “the question is not if but how to support agriculture.” But there were, at that stage, more questions than answers. These questions did not deal with the policy objectives, as these seemed to meet the general agreement of even the opponents of the CAP. They rather focused on the policy instruments used to achieve these objectives and their consistency both domestically (in terms of efficiency, distributional impact, and budgetary costs) and internationally (in terms of their compatibility with WTO rules and their impact on trade).
The second Commission Seminar on the MTR (April 2002)
Exactly one year separates the first from the second Fischler presentation to the Commission. During this period, an intensive debate took place in the member states about the future orientation of the CAP, with hardly a day passing, especially in 2001, without a strong focus of the media on the issue.
Part of this debate included a series of Seminars organized by the Commission in all of the then member states (15), where the two responsible Commissioners for the issues at stake (Fischler for agricultural policy and Byrne for food safety) participated, and where all stakeholders (from producers to industry to consumers to environmental groups) responded to the same set of prepared questions about the future of the CAP. The conclusions of this public debate were the basis for the second Fischler presentation to the Commission.12 Proposals for reform were not yet formulated, but the emerging orientation was becoming evident.
For the first time in this presentation it is stated that, as a result of this public debate, a significant reform proposal was imminent. “...What was mostly expected to be sort of a routine exercise in the context of the Midterm Review related to the review of developments in the cereals, oilseeds, beef and dairy sector, is now, more often than not, considered as a new all-encompassing agricultural reform effort, just two years after Agenda 2000 entered into force.”
Further, it confirmed that supporters and most critics of the CAP tended to agree that the general policy objectives of the CAP remained entirely valid, but all raised serious questions about how to best achieve these objectives. A method of responding to these questions was also outlined, with explicit reference to the difference between the
12 SeeSee http://ec.europa.eu/agriculture/capreform/comsem2.pdf.

62 WOODS INSTITUTE FOR THE ENVIRONMENT | STANFORD UNIVERSITY
E.U. and the U.S. experience: “In the E.U. we focus on improving our policy tools under budgetary constraints, notably on restoring the link between farmers and markets. In the U.S. they focus on maximising budgetary outlays with fixed policy tools (or even contemplating returning to old, more trade distorting policy tools).”
The policy dilemma of how to promote simultaneously a competitive and a quality-based agriculture is once more identified: “…we cannot ask for both high quality and low price in the E.U. without at the same time making it clear that somebody has to pay for the additional costs of food safety and quality.” Finally, the different approaches that aim to respond to this dilemma were discussed, and a clear position is taken between the two extreme approaches.
For the more radical approach, the “scrap the CAP” camp as it was termed from the title of the report of the U.K. consumers association, the relevant policy question was (and continues to be) when to stop all support of agriculture. This camp included critics of the E.U., and its policies as such, who want to reduce the size and relevance of the Union with the aim of slashing the E.U. budget and Community competence, and thereby reducing the contribution of net-payers to the Community budget. On the other extreme, Fischler identified the eternal “wait and see” camp, whose approach he termed as a “policy Nirvana” since the relevant policy question does not exist, at least in public, based on the assertion that “CAP is fine as it is,” at least until 2006.
Both camps failed to respond, for different reasons, to the relevant issue of how to support agriculture in Europe. To respond to this “how” during the 2002 Seminar, Fischler articulated and identified in the form of open questions, and in considerable more detail than in the 2001 Commission Seminar, the main elements of the midterm review, market support and rural development.
In cereals, these questions were linked to a further drop in cereal intervention price (left open from the Agenda 2000), to the potential impact of such reform on the E.U.’s uneven border protection, to the need for rye intervention (where two-thirds of production went straight to intervention), and to the level of durum wheat aid. In the beef sector, the market situation was rapidly improving, and the market support price and public intervention were to be phased out by July 2002. But the direct aid scheme was too complex. Thus it is in the context of beef and of simplification that the question of decoupling was first raised. “Is decoupling the way to do so, or do other ways of simplification exist?”
In dairy the issue was more on available options for the milk regime after 2008, but still the question about “short term adjustments in the structure of support prices” was asked. Finally, other sectors where policy options were considered were also mentioned; mainly rice (where a linkage of possible reform with the EBA decision was made), but also dried fodder, and “a series of sectors where proposals have to be submitted in 2003 (cotton, tobacco, olive oil—and possibly wine and fruit and vegetables).”
Thus the market menu of the Midterm Review (the first pillar of the CAP, in Commission jargon) was becoming rather full, but viable policy options remained sparse. So were options for the second pillar of the CAP, rural development, where things were more open because the budget question remained open. Here the central issue was how to find a way to transfer funds from the first to the second pillar. Again questions set the stage for what was to follow: “modulation or degressivity” as a way of shifting money among pillars, the possibility of shifting existing measures among pillars, and the always present issue of a ceiling on payments. But also the question of the scope for additional measures and the rules for co-financing (and therefore potentially increasing) rural development funds by member states. The requirements that farmers need to meet in order to receive aid were also introduced, and the distinction was drawn between the respect of mandatory standards, “best dealt with by cross-compliance as a condition for direct aids, and incentives to exceed these requirements, which is best dealt within rural development.” Demands to expand cross-compliance by including food safety or animal welfare obligations, quality promotion, and even traceability were part of the question menu.

U.S. Agricultural Policy and the 2007 Farm Bill 63
But the most crucial question of this presentation, on what turned out the core element of the 2003 reform, was left for the end. Since it allows us in retrospect to evaluate the thinking process that led to the proposal for CAP reform, it is worth quoting it in full.
“Finally, there is the issue of decoupling, which is receiving more attention in the present debate. What objective(s) is decoupling meant to achieve? Is there only one way of decoupling, as some tend to assume by focusing only on an aid per hectare? And how is decoupling linked to obligations of cross-compliance? The latter question becomes pertinent because, while responding to demands from our citizens, we should also be aware of the potential contradictions in areas where we have little experience so far.
Cross-compliance implies imposing obligations related to the method of production. Decoupling, on the other hand, implies waiving any requirements related to production. Unless we succeed in installing the proper balance in policy measures, we risk undermining both of these central elements in our strategy.
In my view, the MTR is not a “pro forma” paper-exercise. Nor is it formally a new reform. But it must and, if you and the member-states agree, will be a fully-fledged “aggiornamento” which substantially reshapes the CAP within the context of our ongoing reform process.
The CAP is not linked to just the production of food, feed and fibre, but is also expected to contribute to such legitimate policy objectives as the preservation of the rural environment and landscape, animal welfare, or the viability of rural areas. These objectives can neither be achieved without a policy, nor can they be reached with 15 (or more) competing policies.
CAP instruments need to be adjusted based on factual analysis of what is needed to best meet these objectives, always bearing in mind we will not throw the baby away with the bath water! This is in my view the purpose of the MTR, which we should conduct with alacrity despite the substantial opposition that I expect. I believe we must try and do so by the end of this year.”13
Enlargement and the budget
Although answers to the above questions were being formulated internally in the Commission, their finalization would only come after the Brussels Summit determined the E.U.’s agricultural spending for the markets and direct payments (the equivalent of the U.S. commodity programs) in October 2002.
This agreement was linked to the financing of enlargement, and marked a major step in this by opening the way for the final agreement in the negotiations with the then-candidate countries, which was decided in the Copenhagen Summit in December of the same year. But in the end, the question to which this agreement responded was not linked so much to concerns about the perceived costs of the enlargement, but more to concerns about the sharing of the costs of the Community budget.
With it, almost 70 percent of the direct aids to the farmers of the new members and two-thirds of the compensatory payments foreseen in the dairy reforms of Agenda 2000 would be financed from the E.U. budget, fixed at the level of spending of 2006. The same budget ceiling would also determine the financing of future reforms.
This decision gave arguments to those who wanted to block any reform by clarifying that the issue was not how much would be available for the CAP. In fact, in a manner that indicates a significant difference between the E.U. and U.S. farm policies, the E.U. budget is fixed and annually constrained. By reducing and also determining this ceiling until 2013, the Heads of State in the E.U. gave a message in 2002 that the available funds would not change until 2013.
13 See page 6 of document inSee page 6 of document in http://ec.europa.eu/agriculture/capreform/comsem2.pdf.

64 WOODS INSTITUTE FOR THE ENVIRONMENT | STANFORD UNIVERSITY
But at the same time, by determining in very clear terms the “how much” of the agricultural budget for the next financial perspective, the Heads of State enabled the debate on the future of the Common Agricultural Policy (CAP) to shift back to the fundamental questions that E.U. citizens had repeatedly posed about the CAP, questions about whether and how to support E.U. agriculture.
And although the general expectation was that the reform of the CAP would have to wait since the budgetary pressure was off (as was the food safety or the WTO at that time), Fischler was of the view that the debate about CAP reform could and should start in earnest because, for a change, such a debate should take place exactly without such pressures.
The June 2003 Luxembourg decision to reform the CAP
The period between January 2003 (when the legal texts of the CAP reform proposal were introduced) and June 2003 (when the Agriculture Council formally decided the reform) is admittedly very short. This is what led most experts to believe (as easily evidenced from a look into the reporting of all the specialised press of the time) that the reform proposal would fail.
Yet the formal proposal was but the last stage of a process of posing policy questions that prepared public opinion about the need to do something with the CAP that was relevant to their own priorities. And survey after survey of E.U. citizens indicated a public whose worries were not essentially of a quantitative nature (including the quantitative aspects of the budget debate), but of a deeply qualitative nature. Were they getting their money’s worth in both private and public goods from E.U. agriculture?
This question had also reached the ears of the most market oriented E.U. farmers; including those that resisted reform for fear that they saw no end of this process in sight. Therefore, when the time for a decision by the Agriculture Ministers came, public opinion took it for granted that a fundamental reform of the CAP was necessary, with even those against reform having to argue now mainly about its timing. In the end, and considering the initial almost generally negative reactions, what was decided was very close to what was proposed.14 The most important element was of course decoupling and the introduction of the Single Farm Payment.
The proposal for a Single Farm Payment aimed at merging all direct payments to farmers based on 2000–2002 averages in one single payment, and replacing the requirement to produce with the requirement to respect cross-compliance. The available option left to member states would have involved a certain degree of coupled support, in the form of payments that would fall under Blue Box criteria, and thus left open for some time the question about the degree of decoupling. But by the time the dust had settled, the level of decoupled support exceeded all expectations, approaching 90 percent of all direct farm support by the time of the full implementation of the 2003 and 2004 reforms.
On market issues, the further 5 percent drop in the intervention price for cereals was the only element not agreed to (and this may come to haunt those that opposed it since any future move here will probably be without compensation). But the abolition in rye intervention and declines in rice price support and in durum wheat aid were agreed. The dairy reform was also advanced in time, with a further cut in support prices and limitations in intervention to better reflect world market developments.
14 For a very useful comparison of the CAP as it existed before the 2003 reform, as it was proposed to change under the two stages of CommissionFor a very useful comparison of the CAP as it existed before the 2003 reform, as it was proposed to change under the two stages of Commission proposals (Communication and legal texts), and the end result of the Luxemburg compromise, see http://ec.europa.eu/agriculture/capreform/avap_en.pdf.
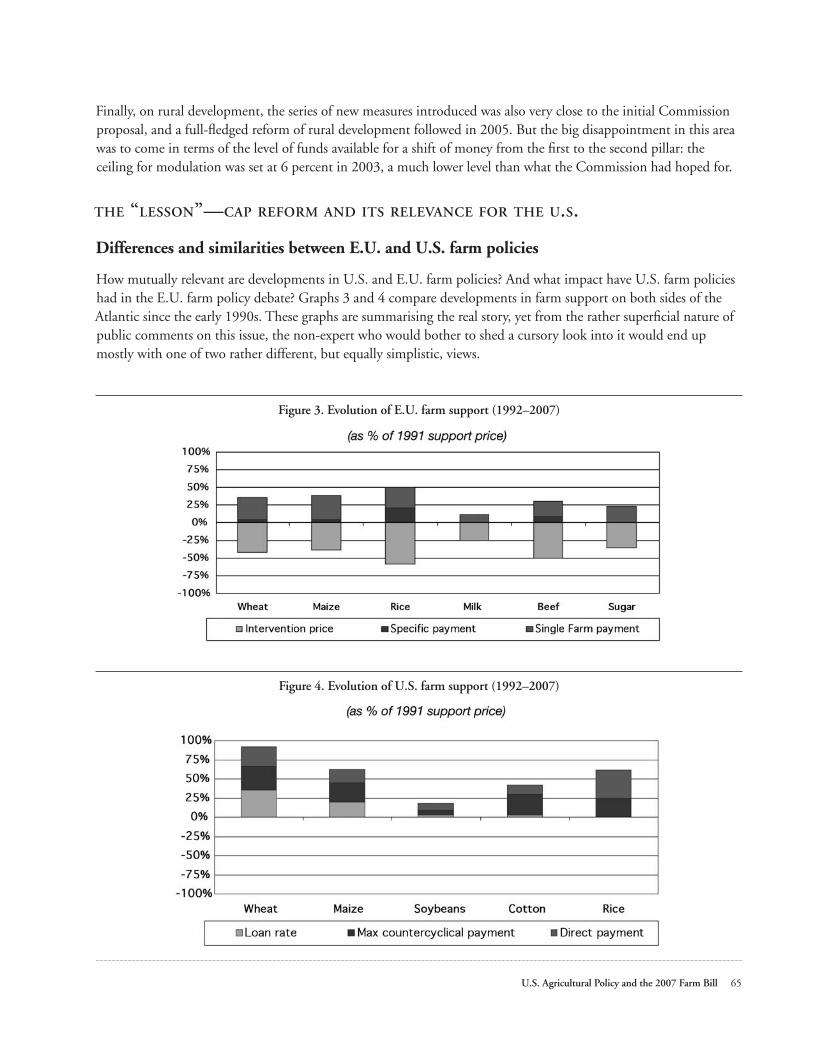
U.S. Agricultural Policy and the 2007 Farm Bill 65
Finally, on rural development, the series of new measures introduced was also very close to the initial Commission proposal, and a full-fledged reform of rural development followed in 2005. But the big disappointment in this area was to come in terms of the level of funds available for a shift of money from the first to the second pillar: the ceiling for modulation was set at 6 percent in 2003, a much lower level than what the Commission had hoped for.
THE “LESSON”—CAP REFORM AND ITS RELEVANCE FOR THE U.S.
Differences and similarities between E.U. and U.S. farm policies
How mutually relevant are developments in U.S. and E.U. farm policies? And what impact have U.S. farm policies had in the E.U. farm policy debate? Graphs 3 and 4 compare developments in farm support on both sides of the Atlantic since the early 1990s. These graphs are summarising the real story, yet from the rather superficial nature of public comments on this issue, the non-expert who would bother to shed a cursory look into it would end up mostly with one of two rather different, but equally simplistic, views.
Figure 3. Evolution of E.U. farm support (1992–2007)
Figure 4. Evolution of U.S. farm support (1992–2007)

66 WOODS INSTITUTE FOR THE ENVIRONMENT | STANFORD UNIVERSITY
One view holds that the farm support policies of E.U. and U.S., the two elephants of the developed world, by their very existence spell continued doom for agriculture in the developing countries. This is very popular in the E.U. and mainly driven by the discourse of development-NGOs.
An alternative view, “Blame the CAP”, which puts the blame squarely on the CAP even for evident faults in U.S. farm policies, dominates U.S. perceptions, particularly the halls of Congress and U.S. farm lobby gatherings, with enthusiastic supporters among U.S. allies in the Cairns group. This view holds E.U. farm policies as the raison d’être of anything bad in U.S. farm policies, despite the fact that the CAP was introduced after U.S. farm policies and after the exclusion of agriculture from the rules establishing the then GATT at U.S. insistence.
Yet for anything positive to emerge, the debate on the comparative features of U.S. and E.U. farm policies should move away from its current Manichean state. Good or bad is not just in the eye of the beholder, but depends also on facts, and in the evaluation of such policies with respect to their concrete impact linked to specific objectives. Evidence from farm policy developments on both sides of the Atlantic since the mid-1990s sheds light both on their impact, and on their mutual relevance.
From the 1996 FAIR Act…
One often forgotten difference between E.U. and U.S. farm policies is their perceived legitimacy. Unlike in the E.U., where conflicting member-state interests lead to different positions on farm support, the long tradition of U.S. bipartisan support for traditional commodity programs is well established and has led to a rather constant stance on farm support.
While more market-oriented adjustments were made with the 1985 and 1990 Farm Bills, the fundamental structure of U.S. farm policies, established in 1933 and reconfirmed with the 1949 Farm Act, remained unchanged until 1996. A counter-cyclical price support system based on deficiency payments was the core of support for specific crops (wheat, feed grains, cotton, rice), while high domestic price support and/or supply control measures characterized the four sectors of high tariff protection (dairy, sugar, peanuts, tobacco).
But the November 1994 elections and the new majority in the U.S. Congress set as its priority the balancing of the federal budget, thus constraining the debate on the future U.S. Farm Bill by the fact that, unless the Senate and House Agriculture Committees succeeded in drafting commodity legislation that would cut budget outlays by $13.4 billion over a seven-year period, the Budget Committees would take over (with no guarantee that the interests of various commodity constituencies would be met).15
The diverging paths and objectives of the then two Chairmen of the Senate and House Agriculture Committees became evident from the start. Senate Ag Committee Chairman Lugar introduced a series of questions that implied a concrete proposal for a gradual abolition of commodity programs. House Agriculture Committee Chairman Roberts introduced the “Freedom to Farm” (production flexibility) concept as a radical departure. But this was in no way perceived as an abolition of past farm policies.
Roberts’s approach provided the means that would guarantee continuation of payments to recipients of the traditional commodity programs in an environment of rising prices. Although all three alternative House bills were initially defeated when first introduced in the House Agriculture Committee, it was finally Roberts who won the day.
15 One of the first to raise the question about the continuation of the FAIR Act direction in the future if U.S. prices turned south was D. OrdenOne of the first to raise the question about the continuation of the FAIR Act direction in the future if U.S. prices turned south was D. Orden in “The 1996 Farm Bill: What happened? Why did it happen? Will it last?” in a November 1996 Special Report of Virginia’s Rural Economic Analysis Program, Dept. of Agricultural and Applied Economics, Virginia Tech.

U.S. Agricultural Policy and the 2007 Farm Bill 67
Thus, the Freedom to Farm concept of fixed (gradually declining) payments survived intact throughout the debate in Congress and became the core element of the commodity section of the FAIR Act. As a result, the 1996 FAIR Act did not bring significant changes to the above features of U.S. farm policies because of a generalized criticism of the available policy instruments, but as a result of domestic budgetary constraints.
It is interesting to compare in this context the concept and application of the Production Flexibility Contract of the 1996 Farm Bill to the Single Farm Payment concept of the 2003 CAP reform. Despite differences in their application, the design of both concepts is very similar.
A fixed level of support, determined on past payments, allows farmers to freely take their production decisions by decoupling them from the level of or type of their production, provided they respect a series of conditions (a feature not just of E.U. support, but also of U.S. support).
The only, albeit very significant, difference was in the driving force of both policy reforms. In the E.U., it was the need to legitimize farm support by allowing farmers to look for market signals under a fixed budgetary constraint. In the U.S. it was the need to maximize budgetary outlays that were being threatened as a result of positive market development.
In the process of its passage, the FAIR Act clarified some of the doubts expressed about the future of U.S. farm policies. The bipartisan nature of farm legislation was reconfirmed (almost half of Senate Democrats and 60 percent of House Democrats voted for the FAIR Act). Traditional commodity interests finished better off, with production flexibility and fixed payments, than they would have under the previous programmes. The loan marketing program remained intact. Proposals to abolish support for dairy, sugar, peanuts, and permanent legislation (the 1949 Bill) were defeated. Environmental and federal food stamp provisions were strengthened.
All these were the result of a shrewd calculation that these payments guaranteed a higher level of support to farmers than the alternative of traditional payments, given the overly optimistic baseline of increasing prices and expected minimal budget outlays under the continuation of previous policies. In the end, the new policy feature, decoupled payments, was adopted by a very close vote and became the choice of Congress because the particular bill appeared to maximize budgetary outlays to farmers under the then outlook of world markets and prices.
At the time, this move towards decoupled support, embodied in the Federal Agriculture Improvement and Reform (FAIR) Act of 1996, in U.S. agricultural policies seemed to set the stage for what many considered an exemplary policy structure with respect to market orientation, one that many in Europe, especially outside its farming sector, would have liked to see the CAP following. And although admittedly such a policy direction did find unanimous support among the U.S. farming community, from the point of view of the wider public, the FAIR Act was an innovation.
…to the 2002 FSRI Act16
That the 2002 Farm Bill marks a clear reversal of the above policy direction is not disputed. What is disputed is the impact of this reversal for the prospects of farm policy reform, especially since the 2002 Farm Bill raised many questions on both sides of the Atlantic about the long-term viability of a more market-oriented and less trade-distorting farm policy direction on both sides of the Atlantic.
16 This part draws from a presentation I made at a roundtable discussion on the 2002 Farm Bill at the 78This part draws from a presentation I made at a roundtable discussion on the 2002 Farm Bill at the 78th Conference of the French Wheat Growers Association in Blois, on June 6, 2002. It can be found on the following site: http://ec.europa.eu/agriculture/external/wto/usfarmbill/tassos.pdf.

68 WOODS INSTITUTE FOR THE ENVIRONMENT | STANFORD UNIVERSITY
This reversal in U.S. farm policy and the shift towards the reintroduction of policy tools that only six years previously had been abandoned as having failed to meet their objectives was both driven and assisted by an additional important element of the FAIR Act, the commitment of the House leadership to reopen the issue of transfers to agriculture if the sector were to enter in trouble. Action of the U.S. Congress through the ad-hoc relief packages of 1998 to 2001 confirmed this commitment. This commitment was further strengthened by the cementing of ad-hoc payments as counter-cyclical payments in the 2002 Farm Bill.
Expectations about market developments played a big part in this reversal of U.S. policies. When Republicans won the 1994 election, the price of corn received by U.S. farmers, expressed in metric units, was 80 dollars per ton. It had jumped to 140 dollars when the FAIR Act was voted in Congress and over 150 dollars when it was signed into law 15 months later. This situation was expected to reflect a sustained growth in world demand, and prospects for U.S. farm exports seemed as bright as ever. The return of world market prices to what many experts believed were their normal levels very soon challenged such expectations, and U.S. crop prices, after reaching exceptional levels in 1995–96, started rapidly declining just one year after the implementation of the FAIR Act.
The deterioration of the outlook for U.S. farm exports resulted from both demand (Southeast Asian crisis) and supply factors (the emergence of new competitors of the U.S. from the Southern Hemisphere) and led to increasing calls for “relief” for U.S. farmers.
That such calls were also accompanied by the perception of an emerging “farm crisis” and criticism of the “freedom to fail” bill is to be expected in the political process. Whether or not the particularly tense U.S. political environment of 1998 also contributed to the implementation of the first “emergency relief” package in November 1998 is now irrelevant.
What is relevant is that this package compensated U.S. farmers, not so much for their “income loss” with respect to previous levels of average income, but more for “losses” of an expected stream of future income that was based on an unrealistic market outlook. This outlook was the result more of a technicality than of a realistic assessment of market prospects. The very high crop prices of 1996 and 1997, as a result mainly of supply factors, generated a series of overly optimistic forecasts driven by perceived demand factors. With supply coming back to normal, the S.E. Asian crisis that followed led to the opposite extreme in terms of market expectations. What followed was the natural consequence of this first step. Successive farm relief packages have become an annual ritual ever since, and the $13.4 billion of budgetary savings expected under the FAIR Act were lost in just three years.
This situation influenced the U.S. farm policy debate in a way that rendered a continuation of the 1996 farm policy direction impossible. The relevant policy question in the U.S. gradually became how to exhaust available budgetary outlays to support farmers especially in an environment of federal budget surpluses and a strong overall economy. In such an environment, the reintroduction of some of the most trade-distorting measures of domestic support seemed inevitable.
In essence, this was the result of a policy dilemma with significant long-term implications. The provision to farmers of payments in excess of what was foreseen and expected resulted in first retaining, then increasing land values to artificially high levels. In fact, if anything, it is land values that have been “decoupled” from market developments in U.S. agriculture. In addition, these high payments also generate production levels that are higher than what current market prices would generate, thus leading to further downward pressures on prices. The result is a continuing price crisis.
Yet if Congress were to decide to limit the availability of funds to U.S. farmers, thus allowing some adjustment in production to take place adhering to the tested but forgotten “low prices are the best cure for low prices” dictum, then
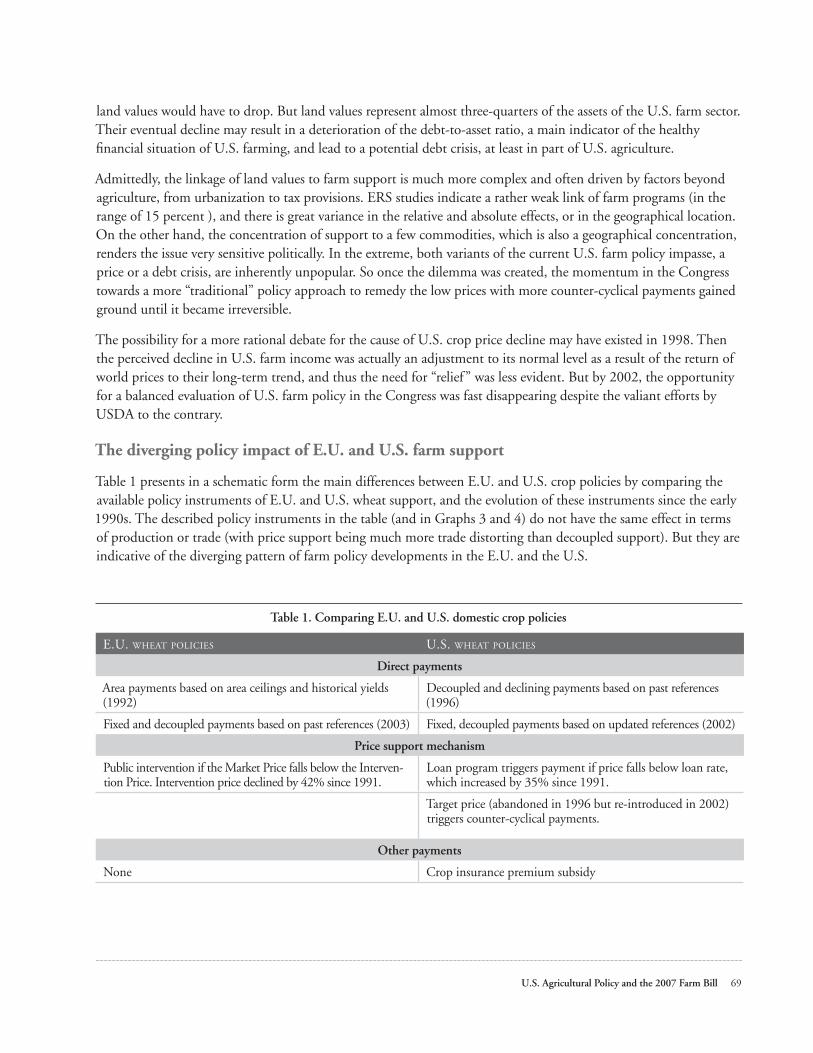
U.S. Agricultural Policy and the 2007 Farm Bill 69
land values would have to drop. But land values represent almost three-quarters of the assets of the U.S. farm sector. Their eventual decline may result in a deterioration of the debt-to-asset ratio, a main indicator of the healthy financial situation of U.S. farming, and lead to a potential debt crisis, at least in part of U.S. agriculture.
Admittedly, the linkage of land values to farm support is much more complex and often driven by factors beyond agriculture, from urbanization to tax provisions. ERS studies indicate a rather weak link of farm programs (in the range of 15 percent ), and there is great variance in the relative and absolute effects, or in the geographical location. On the other hand, the concentration of support to a few commodities, which is also a geographical concentration, renders the issue very sensitive politically. In the extreme, both variants of the current U.S. farm policy impasse, a price or a debt crisis, are inherently unpopular. So once the dilemma was created, the momentum in the Congress towards a more “traditional” policy approach to remedy the low prices with more counter-cyclical payments gained ground until it became irreversible.
The possibility for a more rational debate for the cause of U.S. crop price decline may have existed in 1998. Then the perceived decline in U.S. farm income was actually an adjustment to its normal level as a result of the return of world prices to their long-term trend, and thus the need for “relief” was less evident. But by 2002, the opportunity for a balanced evaluation of U.S. farm policy in the Congress was fast disappearing despite the valiant efforts by USDA to the contrary.
The diverging policy impact of E.U. and U.S. farm support
Table 1 presents in a schematic form the main differences between E.U. and U.S. crop policies by comparing the available policy instruments of E.U. and U.S. wheat support, and the evolution of these instruments since the early 1990s. The described policy instruments in the table (and in Graphs 3 and 4) do not have the same effect in terms of production or trade (with price support being much more trade distorting than decoupled support). But they are indicative of the diverging pattern of farm policy developments in the E.U. and the U.S.
Table 1. Comparing E.U. and U.S. domestic crop policies
E.U. WHEAT POLICIES U.S. WHEAT POLICIES
Direct payments
Area payments based on area ceilings and historical yields (1992)
Decoupled and declining payments based on past references (1996)
Fixed and decoupled payments based on past references (2003) Fixed, decoupled payments based on updated references (2002)
Price support mechanism
Public intervention if the Market Price falls below the Interven-tion Price. Intervention price declined by 42% since 1991.
Loan program triggers payment if price falls below loan rate, which increased by 35% since 1991.
Target price (abandoned in 1996 but re-introduced in 2002) triggers counter-cyclical payments.
Other payments
None Crop insurance premium subsidy

70 WOODS INSTITUTE FOR THE ENVIRONMENT | STANFORD UNIVERSITY
The direction of policy reform is clear. Interestingly enough, developments on either side of the Atlantic do not only lead to comparisons of their market price support mechanisms, where conclusions are rather self-evident. They often lead to comparisons of results of their experience with decoupling, which is also very different.
Questions that have been raised with respect to decoupling in the E.U. and the U.S. relate to the expectations created for farmers about future farm policy, to the “wealth effect” such policies have, and to their impact on risk reduction. These are valid questions, and the answers are often in the affirmative, albeit to differing degrees.
But here one must draw from the start a distinction between the experience in the U.S. and that in the E.U. if one wants to avoid conclusions that are often superficial or deceptive. Part of the reason of improper comparisons is the previously explained logic of the 1996 Farm Bill for a shift towards decoupling, not because the U.S. Congress necessarily loved this policy, but rather due to the very concrete understanding of Congress that, unless the money was going to be put in a rather fixed pot, it was very likely that it could soon diminish.
Price forecasts in the mid-1990s price indicating an increasing level of commodity prices for the foreseeable period never materialized. Instead, what materialized was the very concrete response of the U.S. Congress to the farmers’ call for more support when prices dropped initially to simply more normal levels. From the moment Congress moved in this direction, it became clear that the 1996 U.S. Farm Bill was becoming more of a parenthesis than a change in the direction of U.S. farm policies. The proof for that simply had to wait until the new Farm Bill was introduced in 2002.
Thus when looking into the structure and the concrete dollar amount of U.S. support, it is not decoupled support that characterises it, but on the contrary, a support coupled to specific crop prices. Counter-cyclical is not just the name of the new payments introduced in 2002, but the overall philosophy of U.S. farm policies. Whether one looks into the loan program, into the counter-cyclical payment program, or even into crop insurance, the bulk of U.S. commodity support is driven by supply concerns and by an attempt to insulate farmers from the markets.
What relevance does this bring to the European debate? In Europe, farm policy is just entering its decoupling phase, and very soon almost 90 percent of E.U. direct farm support will be given in the form of payments that are totally decoupled from any production decision. This would be done in the context of an increasing number of farmers because of enlargement, and within a fixed budget whose level can only move in one direction, downwards, as even a cursory inspection of newspaper headlines would indicate. Therefore, the “expectations” about the future direction of farm policy and the impact on the risk farmers have to take has to be seen in this context. It all happens in a direction that is exactly the opposite of what is taking place in the U.S.
In the context of the E.U., the fact that the historical level of support remains the same implies that when it comes to land values, and therefore to their impact on farmer’s wealth via their asset values, the whole design of E.U. reform is to keep a certain degree of neutrality with respect to the impact of decoupling. And although regional variations in this approach could have an impact in some member states, it is hard to see how the move from the more trade-distorting type of support to the less trade-distorting type of support would have a positive wealth effect. It simply does not have a negative one—it was meant to be neutral!

U.S. Agricultural Policy and the 2007 Farm Bill 71
The external dimension of CAP reform
The E.U. and the developing world
The European Union has for years made the special treatment of developing countries a central component of its development policy. In the context of the current WTO negotiations especially, this stance played a major role in christening this Round as the Doha Development Agenda.
This stance is often treated with surprise and even more often with criticism on the west side of the North Atlantic. What gains would the E.U. get from treating in such a manner even the most advanced of the developing countries, some of which are for all practical reasons fully developed in agriculture? The issue can also be seen from a different angle, especially since the experience of Cancun (and to some extent the creation of the G20) demonstrated that attempts to differentiate the developing world are treated by the latter as attempts to divide it.
Opinions differ on the reasons behind the E.U. position, ranging from explanations that emphasize the guilt from Europe’s colonial past as generating a true solidarity with the developing world all the way to petty calculations of further squeezing the legitimacy of the CAP in the eyes of E.U. citizens. But as these benefits, initially available to the African, Caribbean, and Pacific (ACP) group of former colonies, expand to more developing countries, such as the group of least developed economies for the moment, or potentially to other more advanced developing countries in the future, the debate shifts more to the substance.
Whatever place on this opinion spectrum one occupies, the fact is that E.U. formal positions reflect the importance that the E.U. assigns in linking its policy priorities to developing country interests. This is after all only logical given the whole set of trade and development policies that have rendered the E.U. by far the largest importer of agricultural products from developing countries. The relationship of CAP reform to this process, which is anything but straightforward, will be the focus of this section with respect to both its multilateral dimension (WTO) and its bilateral versions (EBA, Mercosur).
The multilateral dimension—WTO and Doha
Significant differences exist between this and previous WTO rounds with respect to agriculture. During the Uruguay Round negotiations, agriculture lagged significantly behind other sectors. In fact, at a certain moment negotiations on agriculture stalled, putting at risk the successful outcome of the entire Round. On the other hand in the Doha Round, perhaps to the surprise of some, negotiations in agriculture are far more advanced both in technical details and in substance.
Of course, this is a sector that has more distance to cover towards trade liberalization than others. Nonetheless, the framework agreement on agriculture is much more detailed than in other areas, and other sectors would still need to catch up if a successful outcome is to be expected from this Round.
This assertion may come as a surprise given the difficulties encountered exactly in agriculture (this part of the book is being finalized just days after the suspension of the negotiations in July 2006). But a simple comparison between what is already on the table in agriculture and other issues (including those already abandoned) should suffice as evidence. In fact, whenever this Round is finally settled, the challenge will be to prove that a similar level of ambition has been achieved in sectors other than agriculture when measured against real new trade flows.
The second key difference between this Round and previous ones is the relationship between the CAP and the WTO negotiations. In the case of the Uruguay Round, success in agriculture was achieved only after the CAP was reformed. This time, however, the CAP reforms the E.U. has undertaken on its own initiative have boosted the chances of success in this Round, principally because they allowed the European Union to commit itself to reductions in trade-

72 WOODS INSTITUTE FOR THE ENVIRONMENT | STANFORD UNIVERSITY
distorting domestic support that went way above the levels achieved in the previous Round, allowing the E.U. to accept the abolition of export subsidies, something that has long been considered its sacred cow, and even put on the table a market access proposal that, when judged against numbers, cuts the E.U. average tariff by more than half.
It is exactly this consistency in the direction of CAP reform that rendered the experience from the new U.S. Farm Bill so relevant to E.U. agriculture. Previously the E.U. tended generally to be on the defensive with respect to the U.S. in all three pillars of the agricultural negotiations (domestic support, market access, and export subsidies). The 2002 Farm Bill allowed the E.U. to compare developments on both sides of the Atlantic. Thus the E.U. approach to farm policy reform, that of a gradual shift away from product support towards support to producer, and towards policy instruments that are more demand-driven than supply-driven, turned into a previously unexpected asset for the E.U., especially after the 2003 reform was agreed.
Of course, that the CAP and the E.U. would loom big in agricultural negotiations was to be expected. The E.U. has, after all, the highest ceiling of domestic support and is by far the biggest user of export subsidies. The surprise came in the fact that it was in these two pillars of the agriculture negotiations that the E.U. has been in the previously unusual position of having an offensive rather than a defensive interest in agriculture.
On export competition, with E.U. export subsidies considered as disappearing at the end of the round, the pressure is on disciplines, including elimination of other trade-distorting export competition instruments. And although the end result is anything but certain, the burden of proof regarding non-trade-distorting practices is on export credits, the supply-driven forms of food aid, and how the remaining instruments of export support (export credits, single-desk export monopolies) will be disciplined.
On domestic support, especially where the most trade-distorting domestic support is concerned—the measures covered by the Amber Box—the impact of successive reforms of the CAP has enabled the E.U. to commit to a level of reduction that could be higher, not just more than any other party involved (going up to 75 percent if the U.S. were to increase its own offer), but above expectations when the Round was initiated. Even in the Blue Box, E.U. measures fall under present rules but their significance has diminished, thus allowing the E.U. to accept a lower ceiling than the one required when the 2003 reform was decided.
As a result, U.S. measures such as counter-cyclical payments, which require a redefinition of the Blue Box, have come under pressure since they create an urgent need for the U.S. to find a new way of classifying policies that was unavailable at the start of the Round.
Finally, CAP reform had its impact on the available margin of the E.U. on market access. However, one of the paradoxes of the public market access debate is that it has focused almost exclusively on the exceptions from the formula tariff cuts (sensitive or special products), ignoring in the process any serious focus on specific markets and concrete trade flows, where the winners and losers from this process and realistic expectations for further market access can be assessed.
The bilateral dimension and the Everything But Arms agreement
The bilateral agreements of the E.U. are also reflections of its development priorities and have a long history whose scope is beyond this chapter. However one of them has been a linkage to the process of CAP reform, and deserves here a brief mention. The Everything But Arms (EBA) agreement, and its impact on the 2006 sugar reform, was another indication of the ever increasing linkage between domestic, multilateral, and bilateral agendas. The EBA agreement reflects the rather simple and straightforward approach of granting full (100 percent ) market access to the 50 poorest developing countries for all products except arms.
U.S. Agricultural Policy and the 2007 Farm Bill 73
In the context of DDA, the E.U. had asked other developed and advanced developing countries to follow (with only partial success, as the Hong Kong declaration only involves 97 percent of trade). The absolute level of such concessions is rather small when compared to the overall agricultural trade of the developed countries, but could be very significant when compared to the level of trade or even the GDP of the developing countries involved. But what is of relevance here is the potential impact of such agreements for the policies of the developed countries.
For the E.U. in particular, the EBA had complications for the three sectors for which a transitional period was granted—sugar, rice, and bananas. The latter product requires a book (at least) on its own, but the reasons have nothing to do with domestic policies and everything to do with quota rents. The first two products, however, had a direct impact on CAP reform—rice was in fact part of the 2003 reform, while the sugar reform of 2005 (based on a revised version of the last Fischler proposal in the summer of 2004), was the first reform of a commodity adopted by an E.U. of 25 members. (The internal debate on cotton reform, also linked to developing countries, focused mainly on domestic support measures since the import of cotton to the E.U. is duty-free).
The relevant CAP feature of the above reforms is the linkage between various policy instruments and their relationship to the three pillars of the Uruguay Round agriculture agreement. The legacy of the old CAP, high domestic support prices, high border protection, and the reliance on export subsidies to cover the gap between domestic and world market prices, could not be sustained in the face of agreements of the type of EBA.
For rice, things were easier, on paper at least, although the political complexities of the inevitable E.U. Council trade-offs should not be underestimated, especially when the E.U. producer members affected (Italy, Spain, Greece, and Portugal) were asked to reform other crucial sectors at roughly the same time.17
But E.U. sugar policies were anything but simple. Not only was the E.U. characterized by surplus sugar production, with exports supported by export subsidies (at twice a heavily distorted world market price), but part of this surplus was the direct result of E.U. concessions to developing countries, its ACP partners. In such conditions, opening the E.U. market to EBA countries implied the potential for substantially more E.U. imports, and rendered the long term viability of the system impossible. The E.U. was not just a major importer with significant support prices and high tariffs (much like the U.S.), but also a major exporter. It faced therefore the inevitability of reform; in the absence of reform its sugar regime risked polluting all the credit the E.U. wanted to get from CAP reform for a sector representing only 2 percent of the value of its agricultural production.
The WTO panel brought by Brazil, Australia, and Thailand, and lost by the E.U., did not affect the proposal for reform, but made the final Council choice inevitable.18 With the E.U. found to have exceeded its export subsidies commitments, the only possible solution was a deep reform, the eventual withdrawal of the E.U. from the world export market, and a significant negative impact on those developing countries whose preferences would be affected (despite the claims of the plaintiffs).
Interestingly enough, U.S. sugar policies face a challenge from the full implementation of the NAFTA agreement similar to that the E.U. faced with EBA. But once more, similar policy problems led (so far) to diverse policy responses.
17 Durum wheat in parallel with rice in 2003, olive oil, cotton, and tobacco were to follow in 2004. In addition, a proposal on wine reform,Durum wheat in parallel with rice in 2003, olive oil, cotton, and tobacco were to follow in 2004. In addition, a proposal on wine reform, currently debated in Council, and the reform of fruit and vegetables which is waiting around the corner, were also expected to face future reform during the EBA debate.
18 The initial proposal to radically reform the E.U. sugar sector based on a price drop, and a cut in the sugar quota was made F. Fischler in JulyThe initial proposal to radically reform the E.U. sugar sector based on a price drop, and a cut in the sugar quota was made F. Fischler in July 2004. While similar in orientation, the final decision, based on a modified proposal by the current Commissioner Fisher-Boel was finally approved by the Council in February 2006.

74 WOODS INSTITUTE FOR THE ENVIRONMENT | STANFORD UNIVERSITY
CONCLUSIONS
This paper covered in some detail the process of CAP reform and parallel developments in U.S. farm policies, and identified areas of similarities but of main differences, especially with respect to the policy responses that the E.U. and the U.S. gave to similar challenges. All three main causes of farm policy reform in Europe—budget, trade and food safety—can be traced as common determinants of policy choices also in the U.S. Why then have policy responses to similar causes been so different? Part of the answer has to be found in the significant differences in the institutional setting of both transatlantic partners.
On budgetary issues, the common element of similar pressures on both sides of the Atlantic relates to the distributional impact of farm support, but attempts to deal with it on both sides have had very limited impact so far. But when it comes to the overall level of support, the setting is very different. The budget allocated to E.U. farm policies is much less significant than generally thought and constantly declining in both real and relative terms. But what is reflected in it is a constant battle for the allocation of limited funds to an ever growing Union of member states. This constraint that the CAP is facing is permanent, and acts more and more as an incentive to focus on the efficiency of the manner by which its limited funds are used.
On the other hand, in the U.S., budgetary pressures on agriculture are part of an overall budgetary debate which follows a policy cycle very much influenced by the state of the overall economy. In addition, the rather small part of farm spending in overall spending and the significant weight of rural interests in the U.S. political system (a result of the disproportionate representation of rural interests in the Senate) renders an effective budgetary constraint more difficult.
On trade issues, a major transformation is in process in the relative role of the E.U. and the U.S., although its impact is yet to be realised. The distinction between an E.U. mainly with defensive interests, reflected in high support prices, high border protection, and reliance on export subsidies, and a U.S. with mainly offensive export interests and high commodity support only as a response to E.U. policies, still very popular in many quarters, is increasingly failing to match simple trade facts.
CAP reform may not be over yet, but its direction is irreversible, while the direction of U.S. farm policy reform is yet to be decided. In the meantime, the E.U. continues to trade both as a net importer, being both the largest exporter and the largest importer of agricultural products with an increasing focus on high value exports and a balanced trade among commodities and products in imports. The U.S. on the other hand, while continuing a strong export performance, in part due to the strong support of a few commodities, is gradually turning into a major importer of all sort of products, including high value products where the U.S. should normally had a more competitive position. Sooner or later, the impact of the type of farm support on the U.S. export position would become evident, especially when its alleged justification is no more in place.
Finally, while food safety issues loomed big in determining the direction of E.U. farm policy, their impact in the U.S. has been much lower. But the recent problems of U.S. beef exports, as a result of incidents that are not even comparable in terms of magnitude with respect to the E.U. are indicative of the fact that demand-driven concerns are not a domestic issue to an economy, let alone to the largest economy of the world.
Yet if the above explain to a large extent the different policy responses in the E.U. and the U.S., they do not tell the full story. As the 2003 CAP has demonstrated, a reform process is not determined by external pressures and constraints; it is influenced by them. In the end of the day, it is the manner by which policy players assume their role as actors, and not observers of this process, that would determine whether policy choices that may seem necessary, albeit impossible, at one stage are rendered policy reality soon after.

U.S. Agricultural Policy and the 2007 Farm Bill 75
CHAPTER II-4
Agricultural Expansion and Policies in BrazilFlavio Soares Damico and Andre Meloni Nassar
1. IntroductionThe recent and very rapid emergence of Brazil as an agricultural powerhouse in the first years of the 21st century is as astonishing as it is misunderstood. Vested interests in importing or competing countries were more than eager to point out evidence related to environmental degradation, disrespect for workers’ rights, and hidden subsidies as possible explanations for the ease with which Brazil has overtaken other, more traditional players in order to become the country with the largest trade surplus in agricultural products. Some have even pointed out that the immense Brazilian natural resources should best be saved to feed the world population in the next centuries... but not now! (Berthélot, 2005) The Brazilian experience can serve as an example to other developing countries of how to increaseBerthélot, 2005) The Brazilian experience can serve as an example to other developing countries of how to increase The Brazilian experience can serve as an example to other developing countries of how to increase their presence in the international trade arena in a shorter time span by investing less resources than, for example, they would otherwise need to in manufacturing or services.
For the reasons above, it is more than opportune to compile some of the evidence on the reform process of Brazilian agriculture in the mid-1990s. This undertaking will place emphasis not only on the many successes, but will also try to look in a critical way at some of the problematic areas, particularly on social and environmental issues, and draw lessons from it. Of course, for the American public the relevance of this study lies not in whether the Brazilian path can be replicated in this country, but whether less interventionist public policies in agriculture could translate into a more competitive and vibrant agricultural sector as compared to the alternative of “farmers farming for the government.” This is a very pertinent debate at a time when the U.S. Congress is about to initiate the decisive phase of the drafting of the 2007 Farm Bill.
We should not also lose sight of the fact that U.S. agricultural law will be a decisive factor in the Doha Round negotiations. It constitutes the de facto mandate for American negotiators. Indeed, as U.S. domestic support levels are geared towards stabilizing farmers’ receipts, unless government payments are really decoupled from production, American negotiators will be compelled to link support levels to market access. Consequently, instead of carrying out farm policy reform for its own sake, America seeks full compensation from WTO partners for actually implementing policies that will be beneficial for its own agriculture competitiveness.
Unfortunately, this is not an unprecedented situation. Early encounters between American farm law and trade negotiations have curtailed the possibilities of the negotiations, but, more importantly, they have also undermined the long-term export interests of rural America (Goldstein, 1993).
To what extent is Brazilian agricultural reform of interest to the U.S.A.? Indeed, the extremely complicated macroeconomic environment that prompted Brazil to abandon subsidized credit policies, which until the early ‘90s provided generous support to farmers, would hardly be replicated in a developed country. The External debt and balance-of-payment crisis, fiscal deficits, high levels of inflation, and currency depreciation were so overwhelming that the Brazilian government did not decide to reform agriculture per se. It was the lack of options that imposed a
76 WOODS INSTITUTE FOR THE ENVIRONMENT | STANFORD UNIVERSITY
reform agenda into the country. Therefore, as it was not a policy of choice, very few, if any, lessons can be drawn from the circumstances surrounding the Brazilian reform that severely curtailed the distorting funds available to farmers. Nevertheless, the fact that Brazilian reform took place simultaneously with the implementation of the Agreement on Agriculture of the Uruguay Round provided a litmus test as to whether or not multilateral disciplines are antithetical to increased competitiveness. Furthermore, the fact that these reforms resulted in an enormous expansion of Brazilian export capacity, with its farm products showing increasing presence in markets once dominated by the U.S.A., provides a powerful incentive for a reappraisal of the current policies of the U.S.A., and the possible gains in reshaping them with a clearer market orientation.
The paper is organized as follows: the next section discusses the expansion of the Brazilian agricultural sector during different periods between the 1970s and today; section three analyzes the objectives of Brazilian agricultural policy; section four discusses three aspects of Brazilian agriculture that are prone to misunderstandings—level of subsidies, environmental concerns, and social dumping; and section five is an overview of a huge sector of Brazilian agriculture: family farming. A conclusion is developed in section six.
2. The Four Phases of Brazilian Agricultural Sector Reform: From Subsidized Production to International ExpansionThe increased importance of Brazilian agribusiness, to the point of positioning Brazil as one of the most competitive countries in the production of agricultural commodities, derives from a number of factors. As a matter of fact, Brazil is nowadays capable of expanding supply both horizontally and vertically, particularly in view of previous investments in technology and research. Moreover, other factors were equally important in the current configuration of the agricultural sector, among them the reduction of government intervention by market deregulation; the opening of markets to foreign competition; and the stabilization of the economy.
With 65 million hectares of planted area (permanent and annual crops) and 230 million hectares of pastures, Brazil has, estimates indicate, between 60 and 100 million hectares of available land for agricultural production. However, more important than finding a precise number is the fact that all estimates take into account the Brazilian Environmental Preservation Law, which requires farmers to keep in its natural state a share of their plots of land: 20 percent in the Atlantic Rainforest and Cerrados region, 35 percent in the Cerrados of the Amazonian Region, and 80 percent in the Amazon Rainforest. Few countries have such stringent environmental regulations affecting the agricultural sector.
It is worth stressing the importance of investment in technology. Studies by the Instituto de Pesquisa Econômica Aplicada (Gasques et al. 2004) have shown that, in Brazil, an increase of 1 percent in research expenditures induces an increase of 0.17 percent in the Total Factor Productivity (TFP)—labor, capital, and land. In accordance with the same study, research expenditures play a greater role than rural credit in explaining the increased productivity levels of the three factors of production. Indeed, between 1990 and 1999, land productivity increased by 6.5 percent, while labor grew by 3.2 percent, and capital, by 3.1 percent. In the following period, 2000 to 2002, in view of the expansion of the agricultural frontier, land productivity fell while the productivity of labor and capital doubled.
When comparing internationally the importance of investment in research in Brazil during the 1990s, it suffices to mention that the TFP has increased 1.5 percent in the U.S.A. in that period, while in Brazil it soared to 4.9 percent. In a more recent period, this indicator has reached a growth of 6 percent (Gasques et al. 2004).
In order to better understand the current Brazilian scenario, it would be useful to revisit the past and examine the evolution of agribusiness in the last four decades.

U.S. Agricultural Policy and the 2007 Farm Bill 77
A) S AND S: TECHNOLOGICAL DEVELOPMENT AND PRODUCTION EXPANSION
During the 1970s and ‘80s, official credits were abundant and cheap, the total amount of which reached a record level of US $20 billion in 1978. Consequently, production and investment grew. The 1970s saw the inauguration of the Brazilian agricultural export model. The country’s exports were diversified: from being a provider of tropical products (coffee, sugar, and cocoa), Brazil started to export temperate-climate products particularly soybeans, competing with developed country providers. Soybean production has extended its reach from Rio Grande do Sul to the Central-Western region, thanks to research carried out by EMBRAPA that has introduced new varieties adapted to the tropical climate of the region.
This two-decade period, therefore, constitutes a landmark in terms of the diversification of exports. At that time, Brazilian economic literature still differentiated between export products—soybeans and oranges—and domestic market products—rice, beans, dairy, and manioc. Nowadays, such a distinction has become irrelevant, as the
“export” items are also consumed in large quantities domestically.
In this period, the first important expansion of the agricultural frontier took place: producers migrated from Rio Grande do Sul to Mato Grosso, Mato Grosso do Sul, Goiás, and West of Bahia (Figure 1). Abundant and cheap rural credit made this expansion possible by increasing import-substitution production and, in parallel, assisted in implementing minimum-price policies linked to regulating stock formation. In brief, the 1970s witnessed a major production shock due to government intervention.
B) – PERIOD: EFFICIENCY SHOCK
In the period 1990–94, Brazil continued its process of integration into international markets and consolidated the trend of increasing competitiveness and expanding production. The agricultural frontier also continued to be enlarged from Goiás, Mato Grosso, and Mato Grosso do Sul, reaching Rondônia, Tocantins, Pará, Maranhão, Bahia, and Piauí (Figure 1).
Figure 1. Cerrados: The Agricultural Frontier
78 WOODS INSTITUTE FOR THE ENVIRONMENT | STANFORD UNIVERSITY
In contrast with the previous decade, subsidized rural credit shrank and producers were compelled to resort to self-financing and to selling production in advance to traders. This system was first used in the case of soybeans. This system succeeded and inspired the creation of new agricultural policy instruments to promote the commercialization of other crops. By selling their production in advance to processors, traders or exporters, farmers had access to financial resources at competitive costs in comparison to bank rates and were, thus, in a position to fund planting and harvesting. Consequently, soybean expansion was based on private credits not requiring government subsidies, regulatory stocks, and other artificial price-setting mechanism, as was the case in other commodities.
During the Administration of Fernando Collor de Mello/Itamar Franco (1990–1994), trade liberalization was carried out. Subsidies were eliminated and markets deregulated with the closure of the government institutions in charge of alcohol, sugar, and coffee—Instituto do Açúcar e do Álcool and Instituto Brasileiro do Café—and bodies in charge of price control—Conselho Interministerial de Preços (CIP). Agricultural production continued to soar without the expansion of the agricultural frontier. Exports also continued to increase, as did the importance of the agricultural sector, since the Brazilian economy was in recession.
The purchase of tractors reached around 40,000 units in 1994, which is roughly equal to the levels prevailing both in 1987 and in 2003. The demand for tractors was sustained by government programs like MODERFROTA, as well as through a Fund established under the Constitution—Fundo Constitucional do Centro-Oeste (FCO). Input use was also on the rise, particularly in part in view of the fact that import tariffs were subject to cuts, thus bringing down the costs of imported production inputs. Greater usage of fertilizers was translated into increased production levels.
As for the meat sector, production and per capita domestic consumption of poultry and beef have been recording steady growth, maintaining the trend dating back to the 1980s. Pork production remained stagnant between 1980 and 1994, but it started to grow again by the mid-‘90s due to growth in domestic demand, particularly for processed pork products. Regarding arable crops, the products that recorded the largest expansion were soybeans and maize.
To summarize, the period 1990–94 was marked by adjustments amidst various economic shocks—deregulation, dramatic curtailment of official subsidized credits, trade liberalization, recession, and high inflation rates. In 1994, when stabilization was initiated through Plano Real, the agricultural sector was prepared for further growth and had already invested heavily in machinery. Apparently, all conditions were set for a new cycle of expansion.
C) – PERIOD: COMPETITIVENESS SHOCK
From 1994 to 1999, nevertheless, Brazilian agriculture went through a period that can be aptly described as “competitiveness shock,“ deriving from the fact that selling prices were not able to match the increase in producers´ financial costs. Moreover, farmers were faced with declining revenues, as the exchange rate was overvalued and interest rates were raised. On top of that, competitive imports were coming in as a result of the trade liberalization. This combination of factors prompted farmers to become more competitive in order to survive. Consequently, when Plano Real—the stabilization policy initiated in 1994—was launched, farm product prices were low and, thus, agriculture contributed significantly to reduce macroeconomic instability. Since farmers were already carrying a burdensome indebtedness from the inflationary period, the lack of adjustment in prices increased their debt in relation to their capacity to pay. The severity of the situation was summarized by the OECD (2005) as follows: “In August 1995 the value of non-performing loans reached 30 percent of total outstanding rural credit and new bank lending had virtually stopped.”
In response to farmers’ requests regarding their debt crisis, Congress passed, in 1994, a law that entered into force in 1998 regarding securitization of liabilities and debt restructuring.

U.S. Agricultural Policy and the 2007 Farm Bill 79
After lengthy negotiations that finally managed to sort out the question of rural debt, the overvalued exchange rate remained as the last obstacle for a rapid increase in rural incomes. The 1999 devaluation greatly improved the situation by substantially increasing the value of Brazilian exports denominated in national currency, inaugurating a
“golden age” for agribusiness in Brazil.
It is interesting to question precisely why 1999 was the turning point for Brazil. In order to respond to that, it is worth first considering the developments in international agricultural trade. From 1995 to 1997, the prices of agricultural commodities were high, but the overvalued exchange rate basically cancelled out the promising external scenario. On the other hand, 1997–99 was the worst period, during which low international prices were coupled with a strong Real. From 1999 onwards, bonanza for Brazilian farmers arrived in the form of strong demand for agricultural products from China and the Russian Federation that have become very significant importers, substantially increasing their share as Brazilian export destinations.
D) FROM ONWARDS: SUSTAINING INTERNATIONAL COMPETITIVENESS
As of 2000, sustained growth became a permanent fixture of the Brazilian agricultural sector. Grain production jumped from 80 million to 120 million tons. The domestic market boomed, and China started to buy huge quantities of food and feed stuffs. Chinese imports continue to make it the largest single importer of soybeans from Brazil, although the E.C., as a bloc, continues to be Brazil’s largest client.
Nevertheless, despite its many positive circumstances, the period after 2000 had its own downside that became increasingly apparent after 2005: (1) the national currency has again appreciated against the dollar; (2) production costs increased from the higher cost of controlling diseases; (3) transportation and logistics costs soared; and (4) new cases of foot-and-mouth disease emerged in areas that had been previously certified by the IOE as “free from FMD with vaccination.”
From the 1990s onwards, Brazilian agricultural expansion was based on efficiency gains—productivity and scale—competitiveness, and strong demand. This scenario results from the elimination of subsidies and price controls, trade opening, greater integration within MERCOSUR, and greater macroeconomic stabilization. Government action in that period was targeted to renegotiate rural debts and set up income support programs through commercialization schemes. During this period, Brazil was able to consolidate its position as a global agricultural player and to further enhance this position with new opportunities for ethanol and bio-fuels. Table 1 illustrates the increase in Brazilian agricultural exports.

80 WOODS INSTITUTE FOR THE ENVIRONMENT | STANFORD UNIVERSITY
Table 1. Brazilian Agricultural Exports (US$ Million)
1996 1997 1998 1999 2000 2001 2002 2003 2004 2005
Soybean Complex 4,434 5,729 4,761 3,733 4,149 5,218 5,964 8,125 10,042 9,477
Sugar and Ethanol 1,715 1,839 1,991 1,991 1,238 2,379 2,280 2,316 3,153 4,699
Chicken Meat 840 876 739 875 806 1,292 1,335 1,710 2,494 3,324
Beef 438 436 587 784 786 1,022 1,107 1,545 2,487 3,014
Coffee 2,135 3,134 2,606 2,464 1,784 1,417 1,385 1,546 2,058 2,929
Tobacco 1,515 1,665 1,559 961 841 944 1,008 1,090 1,426 1,707
Pork Meat 142 167 173 134 183 375 486 551 774 1,163
Orange Juice 1,397 1,007 1,266 1,239 1,034 845 1,041 1,193 1,058 1,110
Fruits (including nuts) 292 295 285 318 368 346 369 501 530 603
Cotton 3 1 5 6 33 157 98 194 422 457
Turkey Meat 41 42 36 46 74 104 104 152 212 168
Dairy 20 11 11 9 17 30 42 58 114 151
Corn 76 57 15 8 10 500 269 375 598 121
Rice 5 3 4 14 7 6 6 5 8 57
Others 1,475 1,363 1,309 1,391 1,561 1,632 1,535 1,847 2,410 2,673
Total 14,529 16,623 15,348 13,973 12,890 16,266 17,028 21,209 27,788 31,653
Source: SECEX/MDIC
Developed countries were the main destinations of Brazilian agricultural products, but since 2004, more than 50 percent of agricultural exports have been destined for developing countries and other non-traditional export destinations (figure 2).
Figure 2. Brazilian Agribusiness Exports: Main Destinations
Source: SECEX and ICONE.

U.S. Agricultural Policy and the 2007 Farm Bill 81
Another source of concern for Brazilian farmers was that they have become increasingly aware of the effect of subsidies in global agricultural markets. Between 1997 and 2001, Brazilian producers felt the impact of U.S.A. agricultural subsidies on prices. While Brazilian exports of agricultural products reached US $15 billion in 1997, between 1998 and 2000 the average export revenue was brought down to US $12 billion. The fall in prices can be partially attributed to the decline in demand from the Asian markets, but they were further depressed by substantially higher levels of U.S. government transfers to farmers in the form of marketing loans, marketing loss assistance and counter-cyclical payments. These transfers insulated American farmers from price dynamics, resulting in production levels virtually unaffected by price variations. The logic behind all these payments is that they are inversely correlated to prices, thus generating counter-cyclical effects with a view to stabilizing the prices received by farmers and, thus, impeding adjustment via reducing production.
Two great challenges remain for Brazilian agriculture: trade negotiations and transport infrastructure. As Brazil is a global player, with its trade flux roughly evenly distributed among various importers, trade negotiations are a major issue for Brazil, particularly in view of the fact that trade barriers and distortions in agriculture are much greater than in manufactured products. Commodities that depend, to a great extent, on negotiating genuine new market access compose 90 percent of agribusiness exports. Brazil is now engaged in an unprecedented effort of negotiating on three major fronts: WTO, MERCOSUR-European Union, and the Free Trade Area of the Americas.
Most of the items exported by Brazil are subject to high trade barriers. Sugar and ethanol are heavily subsidized, and their tariffs are high in most developed and developing country markets. Other commodities face more targeted protection, as in the case of arable crops and cotton in the U.S.A. that are also heavily subsidized.
Regarding meats, the protection levels vary. The European Union has a number of tariff peaks in beef, Japan in pork, Canada and Mexico on poultry, while Switzerland, Norway, and Iceland are protectionist in all three meat types. Even in those countries where the tariffs are lower, such as the U.S.A. (on all meats) and Canada (beef and pork), market access is hindered by costly sanitary barriers. Tariff-rate quotas and safeguards further complicate the access for Brazilian products.
Basic products like soybeans, non-roasted coffee, and cocoa powder face very low tariffs, but their processed products—soy meal and soy oil, roasted coffee and soluble coffee, chocolate and other preparations—face steep tariff escalation.
Inasmuch as trade talks open markets, basic transportation infrastructure—ports, waterways, roads, and railroads—is of paramount importance, as these costs are still very high in proportion to the final price of the commodity. Logistics is key to agribusiness, as it is the condition permitting all upstream investments in research, mechanization, expansion of agricultural frontier, and other efforts to come to fruition.

82 WOODS INSTITUTE FOR THE ENVIRONMENT | STANFORD UNIVERSITY
Box 1: Soy Logistics: An Example of Brazilian Weakness
The continuation of the expansionist trend of Brazilian agribusiness rests fundamentally on two factors: infrastructure and logistics. Roads, railways, waterways, and ports all face major deficiencies. Logistics—transportation, storage, and ports—is one of the weak links of Brazilian agribusiness. The remaining outstanding issues are bio-technological development and the improvement of public policies.
A study by seven agribusiness organizations, “Transportation—Challenge to the Development of Brazilian Agribusiness,” concluded that the Brazilian expansion potential has reached its limits in view of the lack of infrastructure to transport production.1
Soybeans account for 66 percent of Brazilian agricultural exports, and it is expected that it will reach 74 percent in 2007. Railways and waterways should be the means of transportation of choice for bulk commodities. Nevertheless, their usage is quite limited in Brazil to the Tietê-Paraná system. Soybeans are mostly transported by railways, while railways provide only one-third of all transportation needs. It is anticipated that grain production will increase to 180 million tons in a period of eight years. It is estimated that maize will be responsible for 20 million tons, soybeans 25 million tons, and other grains 10 million tons.2
Exports of soybeans are processed through 10 export corridors: Itacoatiara (AM), Santarém (PA), São Luís (MA), Ilhéus (BA), Corumbá (MS), Vitória (ES), Santos (SP), Paranaguá (PR), São Francisco do Sul (SC), and Rio Grande (RS).
The ports of Paranaguá, Santos, and Rio Grande, where the bulk of the exports are shipped abroad, processed almost 80 percent of all soybeans exports in 2003. It is to be noted that railways serve only the ports of São Luís, Vitória, Santos, Paranaguá, São Francisco do Sul, and Rio Grande.
The main producing areas in Brazil are the Central-Western and Southern regions. The Central-Western region is responsible for 60 percent of all Brazilian exports and is forced to resort to the ports of Santos, Paranaguá, and Vitória, all of them very distant from production areas. This logistical difficulty hinders competitiveness, as the ports are frequently crowded. A possible alternative for the Central-Western region’s production is to use the port of Santarém, but the roads leading to it are impassable during eight months of the year.
1 “Transporte—Desafio ao Crescimento do Agronegócio Brasileiro”. The organizations that have co-authored the report are: Associação Brasileira de Agribusiness (ABAG), Associação Brasileira de Óleos Vegetais (ABIOVE), Associação Brasileira da Indústria do Trigo (ABITRIGO), Associação Nacional para Difusão de Adubos (ANDA), Associação Nacional dos Exportadores de Cereais (ANEC), Associação Nacional dos Usuários do Transporte de Carga (ANUT) and União da Agroindústria Canavieira de São Paulo (ÚNICA). The report was hand delivered to the Minister of Agriculture on 12 April 2004. Available at www.anda.org.br/boletins/resumo_trab_min_agricultura_080404.pdf.
2 “Transporte—Desafio ao Crescimento do Agronegócio Brasileiro, op.cit.

U.S. Agricultural Policy and the 2007 Farm Bill 83
3. Brazilian Agricultural Policy: Strategies and GoalsBrazilian policies for the agricultural sector became more complex after the reforms promulgated during the 1990s. Trade liberalization and the foreign debt crisis forced Brazil to reform its price-based policies and to adopt market-oriented policies. Lack of resources has led the Brazilian government to make more rational decisions regarding agricultural subsidies and to end discriminatory policies against agricultural exports. New mechanisms, less market-distorting and more target-oriented, have been developed in line with the limitations imposed by macroeconomic and fiscal policies. As a result, when compared to OECD countries, Brazil is among the countries with lower support levels.
Agriculture is now among the most dynamic sectors in the Brazilian economy and globally. Grain production doubled from 58 to 120 million metric tons, and meat production surged from 7.5 to 20.7 million metric tons between 1990 and 2005. The exports almost tripled from 1990 to 2005, reaching more than US $30 billion and making Brazil the third largest agricultural exporter in the world, following the European Union and United States, and the country with largest agricultural trade surplus. Brazilian agriculture is largely, but not exclusively, for export, which accounts for 31 percent of agricultural production.
If one can state that agricultural policies are a key determinant of the agricultural output and competitiveness of the United States and European Union, the same statement is not as obvious in the case of Brazil. While we focus in this section on proactive competitiveness policies, rural development policies are also discussed, although they are geared towards different objectives.
Agricultural policy in Brazil comprises the following groups of policies: (1) rural credit policies, focused on marketing, working capital and investment; (2) agrarian organization policies, comprising policies oriented exclusively for family producers (PRONAF policies)3; (3) new initiatives on rural insurance; and (4) policies focused on the provision of public goods, including research & development as well as sanitary and phytosanitary programs. Additionally, another three types of policies, outside the scope of agricultural policies, exert important influence on the performance of the agricultural sector, namely: (1) macroeconomic policies, particularly with respect to exchange rates; (2) infrastructure for transportation; and (3) trade policies.
The objectives of Brazilian agricultural policy are not explicitly defined. In order to assess them, it is necessary to look at the programs in conjunction with the expenditures of the Federal Government. Agricultural policies in Brazil are mainly operated by the Federal Government, and the legislative bodies pressurize the executive in periods of crisis. That was the case of the rural debt securitization started in 1995, when Law 9.138/95 was sanctioned by the Brazilian Congress. From the perspective of the producers and farmers, when they intend to influence the design of agricultural policies strategies, the lobbying activity is more focused on the Administration than on Congress.
The Brazilian agricultural policy is built on the following strategies and objectives:
3 Some authors refer to agrarian organization policies, including policies for family farming and land reform policies (Gasques, 2006 and Chaddad et al 2006). This type of classification has been used to analyze the expenditures of the Federal Government with the rural sector. For this paper, however, the Brazilian agricultural policy comprises policies for family farming, including agrarian reform settlers, and for non-family farming. Land reform policy and agricultural policy are separated bodies, with distinct logic and objectives.
84 WOODS INSTITUTE FOR THE ENVIRONMENT | STANFORD UNIVERSITY
3.1 The Provision of Working Capital and Investment Credit with Costs Appropriate to the Agricultural Sector
Given that Brazilian interest rates are among the highest in the world, a crucial objective of the agricultural policy is to provide credit at competitive costs and interest rates lower than market rates. The interest rates for farmers are subsidized in two ways: (1) the fixed interest rates are lower than the reference rates, which are SELIC for working capital and marketing loans and TJLP for investment loans4; and (2) the interest rate equalization, which is the compensation to the lenders—or to the fund that provides the resources for the loans—for the interest foregone due to interest rate control. There is no disbursement in the first case, given that it is measured as the opportunity cost of rural credit. The second is covered by the government and, in terms of subsidy calculation, is added to the implicit cost of the first type of subsidy.
Only the credits covered by the National Rural Credit System are subject to controlled interest rates. The basic interest rate for commercial farming is fixed at 8.75 percent a year for most of the programs. In the case of loans for machinery acquisitions (Moderfrota and Finame Especial), interest rates are fixed at 10.75 percent and 12.35 percent p.a. For family farming, interest rates range from 1 percent to 7.25 percent p.a., depending on the classification of the farmer on different PRONAF groups (Marques, 2006).
Although the availability of the credit and the level of interest rates are different for commercial and family producers, the strategy is the same: to bring the cost of money down, making it more compatible with the return on capital of agricultural production. According to Gasques et al (2006), 2005 governmental expenditures in interest rates equalization, for official loans for working capital and investment under the PRONAF, were BRL 1.8 million, and under the programs for commercial farmers they were BRL 593,000. The numbers show the Brazilian agricultural credit is well-defined in terms of targets: small farmers receive a higher level of subsidization in comparison to commercial farmers. As shown previously, subsidization for commercial farmers is limited, to a great extent, to debt rescheduling policies.
Due to the scarcity of funds, working capital with subsidized interest rates is constrained for commercial producers. Credit is limited per farmer and according to crop. Some examples are: BRL 300,000 a year (roughly US $150.000) per farmer for a soybean producer; BRL 500,000 a year per farmer for a cotton producer; BRL 400,000 a year per farmer for a corn producer and BRL 200,000 a year per farmer for a sugar-cane producer.
Although the availability of resources for subsidized credit is increasing slowly over time, lack of funding is still the main constraint for official credit. The Brazilian government’s objective for the 2006/07 marketing year is to make BRL 60 billion available for credit policies, with BRL 10 billion exclusively for PRONAF. The supply of subsidized credit for commercial farmers is well below the demand. According to MAPA estimates, in 2003 the agricultural credit covered by the National Rural Credit System, which is the credit subjected to interest rates equalization, was responsible for only 28 percent of the “needs” identified by the agricultural sector. The remaining 72 percent is provided through non-bank private credit offered by domestic agro-business and international lenders (OECD, 2005).
Resources for credit for commercial farmers originate in the banking system’s obligatory funds. The National Rural Credit System provides that 25 percent of the banks cash deposits must be allocated for credit to agricultural sector. PRONAF funds come from contributions originated in the Unemployment Insurance Fund (Fundo de Amparo do Trabalhador—FAT). Other available sources of funding are the federal budget; rural savings accounts of co-
4 SELIC is the reference rate for short-term government securities, and is commonly accepted as an average rate on loans between commercial banks. TJLP is the reference for long-term interest rate set by the National Monetary Council and used as a base rate for BNDES investment loans (OECD, 2005)
U.S. Agricultural Policy and the 2007 Farm Bill 85
operative banks; Constitutional Funds for Regional Financing; and funds from BNDES (Brazilian National Bank for Economic and Social Development).
Distinguishing among sources of funding is important, because credit conditions for producers depend on the cost of money, which is different in accordance with its source (OECD, 2005). Some sources, the federal budget resources, the banking system’s obligatory funds, and the Constitutional Funds, are not eligible for interest foregone, or interest rate equalization. Those three sources are allocated almost exclusively for commercial farmer’s repayment. Compensation of interest foregone applies to credit drawing on contributions from FAT, rural savings banks, and, partly, from the BNDES.
3.2 Income support programs
There are two types of income support programs in Brazil: (1) programs based on federal government purchases with guaranteed prices and (2) programs oriented to marketing and supported by the government through direct subsidies, also based on guaranteed prices but without direct acquisition by the government.
All policies based on guaranteed prices are under the Minimum Guaranteed Price Policy (PGPM). During the 1970s and 1980s, PGPM became the mainstay of a fundamental objective of Brazilian agricultural policy at that time: food security. Indeed, at a time of rapid industrialization and urbanization, agriculture was not equipped to provide foodstuffs at the quantity, timing, and prices required. Before the 1990s reform, the PGPM performed two objectives concurrently: first, it provided subsidized working capital and secondly, guaranteed marketing with intervention prices and official purchases. The PGPM was responsible for providing support to production and sustained farmers’ income.
PGPM was created during the 1960s with the objective of guaranteeing food supply to Brazilian society. Guaranteed prices were fixed annually based on domestic production costs. Due to the fact that Brazil was a closed economy, the policies were implemented without any relation to world prices or world supply and demand. High tariffs kept the domestic market protected and acted as a back up for the PGPM. Decisions regarding import tariff reduction were taken when the domestic production was not capable of supplying the market, thus compromising food security. After the trade liberalization in the 1990s, particularly in relation to MERCOSUR, reform of the PGPM was mandatory, otherwise the Brazilian government would have ended up financing producers from the other members of the customs union.
PGPM is implemented through two mechanisms: the Federal Government Purchase (AGF—Aquisições do Governo Federal) and the Federal Government Loans (EGF—Empréstimos do Governo Federal). Through the first mechanism, the government purchases agricultural products with prices (minimum guaranteed prices) higher than the market prices. In the past, the government used intervention stocks to regulate the market supply. If prices were high, the government started to sell stocks. AGF was a governmental acquisition mechanism used to regulate the market if prices were low.
This mechanism has not undergone significant changes over time in terms of its operation, but its objectives have changed completely. The current system is focused on family farming income support intervention and on stock management for social programs and food distributions. Today the AGF covers a smaller number of crops and quantities purchased and, as a result, intervention levels have been dramatically reduced. During the 1980s, official purchases reached 8 million tons of grains (mainly corn, wheat, rice, drybeans) and more than 15 percent of total production in some crops. In 2004, for example, CONAB purchased only 195,000 tons of grains from farmers.

86 WOODS INSTITUTE FOR THE ENVIRONMENT | STANFORD UNIVERSITY
A second important change is that, since 2004, the AGF is used mainly for purchasing from family producers. From 1.7 million tons of AGF operations in 2005, almost all of them were family producers. Clearly, the current AGF system indicates a change in Brazilian agricultural policy: the objective of promoting food security has been shifted to promoting income support for family producers (Chaddad and Jank, 2006).
The second mechanism of the PGPM, the EGF, is a federal government loan, which provides short-term preferential credit to agricultural producers and co-operatives, allowing them to withhold the sale of a product for a certain period in anticipation of a higher market price. The EGF is, therefore, a marketing loan with subsidized interest rates. Prior to 1996, EGF operated as an AGF: borrowers had the choice to cede the pledged product in repayment of the loan (i.e. the EGF with a sell option, or EGF-COV). However, following the experience of the mid-1990s, when government carried large stocks as a result of massive commodity forfeits, the EGF-COV is no longer applied (OECD, 2005). The EGF is still part of the PGPM because the loan size is determined as a function of the amount of product pledged times the respective minimum price.
There is a set of new mechanisms focused on income support through marketing operations under development since the mid-1990s, with the objective of replacing direct government intervention in the market. The main goal is to guarantee a certain price for the producer, usually the minimum price, when the products are sold. The origin of the current mechanisms can be credited, to a certain extent, to the Rural Product Note (CPR—Cédula de Produto Rural). The CPR enabled agricultural producers to receive cash or inputs in advance from the buyer, through forward sale of their output. The CPR, however, cannot be considered as part of official agricultural policy, since the government did not participate in these operations. The government role on the CPR is limited to certifying its existence through a federal law.
Since the creation of the CPR in 1994, the following mechanisms were developed: the Government Sell Option Contracts (Contrato de Opções); the Premium for Commercial Buyers (PEP—Premio de Escoamento de Produto); and the Product Delivery Value (VEP—Valor de Escoamento de Produto). More recently, these mechanisms were improved and adapted for more specific situations. These new mechanisms—the Private Sell Option Contract (PROP—Prêmio de Risco para Aquisição de Produto Agrícola oriundo de Contrato Privado de Opção de Venda); the Equalizer Prize paid to the Producer (PEPRO—Prêmio Equalizador Pago ao Produtor); and the Soybean Equalization Prize (PESoja—Prêmio de Equalização da Soja)—were developed mainly during the 2004/05 agricultural crisis.
Those mechanisms have been created to allow the participation of the government in marketing operations, offering subsidies based on reference prices, without resulting in official stockpiling. The basic thinking behind all those mechanisms is that the government organizes auctions to offer premiums (PEP, PEP, PROP, PEPRO, PESoja) or options contracts (the Option Contract). Using the premiums and the options contracts, the government guarantees a certain reference price for the producer. The level of subsidies is determined ex-post because it depends on the price of the premium. A very competitive auction tends to lead to a lower level of subsidies.
Option contracts are auctioned at the start of the crop season. The mechanism guarantees the holder a future sale at a fixed “execution” price. If the holder decides to exercise the option, this tends to occur when the market price is below the execution price. The government may buy back or transfer its obligation to purchase the product before the expiry of the option contract though recourse to redemption or transfer to private agents. More recently, the government introduced the PROP, which differs only by the fact that it is a private agent who acts as the purchasing agent rather than the government. The subsidy, or “risk premium,” is provided only if the market price falls below the option execution price. Due to fact that government option contracts may lead to physical official stocks accumulation, the government has reduced its use of the instrument and option contracts have been mainly taken place through the Private Sell Option Contract. However, stockpiling from option contracts has reduced relevance
U.S. Agricultural Policy and the 2007 Farm Bill 87
for the market. In 2003, for example, the government purchased only 1.4 million tons of corn, which is 3 percent of the total production.
PEP, PEPRO, and PESoja are instruments used for harvested products deposited in warehouses. In the case of PEP, the government offers commercial buyers of agricultural commodities a premium, which covers the difference between the minimum-guaranteed price and the price the buyer is willing to pay. In the case of PEPRO, the premium is offered to producers and co-operatives. PESoja is the PEPRO adapted to the conditions of soybean market, especially with respect of sales through advance purchases, which are common procedures in the soybean market. The subsidy component of those products is basically the level of the premium paid by the government.
In general, those mechanisms are used with specific goals in mind, focusing on regions and products. Decisions regarding regions and products are based on regional variables such as prices, stocks, and production. In the case of corn, of 760,000 tons marketed in 2005 using the PEP, operations for Mato Grosso State accounted for 407,500 tons. In the case of wheat, almost 100 percent of 1,192,250 tons of PEP operations were concentrated in Rio Grande do Sul and Parana Sates. In the case of PROP, operations with rice were concentrated in Rio Grande do Sul State, while cotton was focused in Mato Grosso State.
3.3 Rural Development and Family Farming Support
Before the adoption of PRONAF (the Program for Strengthening of Family Agriculture), rural development policies were understood as being related only to agrarian reform and land settlement programs. In the past, rural development, as conceived by the government, was a strategy for reducing inequitable land distribution. PRONAF, nevertheless, has an all-inclusive view of rural development aiming at creating favorable conditions to keep low-income producers, including agrarian reform settlers, in rural areas.
As discussed earlier, PRONAF includes income supporting activities and subsidized credit mechanisms. The rural development component of PRONAF focuses on low-income producers without access to either credit or to markets. The program is predicated on the assumption that the market is not capable of remunerating production as well as providing inputs, capital, and infrastructure compatible to the needs of low-income producers5.
PRONAF´s mechanisms are operated based on categories of beneficiary groups. Agrarian reform settlers are in Group A. Producers, e.g. persons exploiting land and living in rural areas, from Groups B to E are differentiated according to the following criteria: share of the agriculture income on the family income; number of hired labor (zero to two workers); and size of family annual income (from BRL 2,000 to BRL 60,000). With additional subsidized credit programs (working capital, investment credit, micro-credit, and special-purpose credit) and income support mechanisms, PRONAF includes supports to infrastructure and rural extension.
PRONAF funds have boomed in recent years during the Lula administration (2003 to 2006). Federal government expenditures on agrarian organization programs increased from 6 percent during the Sarney Administration (1985 to 1989) to 45 percent of total expenditures on farm programs in the Lula administration (Chaddad and Jank, 2006).
The main concern regarding PRONAF is that even low-income producers must be evaluated in terms of credit worthiness, since resources for the agricultural sector are scarce in Brazil. Therefore, they must be spent in accordance with objective criteria. Such assessments are especially necessary due to the fact that PRONAF policies are implemented at the level of municipalities.
5 With respect to family farming, it is preferable to refer to its integrants using the denomination producers rather than farmer due to the fact that there are many family producers that have no ownership of the cultivated land.

88 WOODS INSTITUTE FOR THE ENVIRONMENT | STANFORD UNIVERSITY
3.4 Debt rescheduling and management
Released from the debt burden, after the negotiation of the debt rescheduling program, Brazilian grain production started to increase again in the 1998/99 crop season. The impact of the debt burden in the Brazilian agriculture is easily recognizable through the evolution of grain production during the period of 1993/94 and 1997/98 that was kept stable at 80 million tons. The growth of grain production since 1999 also coincided with the abandonment of the fixed exchange rate regime in January of 1999.
With the macroeconomic stabilization promoted by Real Plan in 1994, the debt rescheduling of officially sponsored credits became an objective of the Brazilian agricultural policy. With the stabilization, it has become clear that there was an incompatibility between the interest rates applied to adjust the outstanding debt and those used to calculate minimum prices (Wedekin, 2005). The first plan, also known as rural debt securitization, targeted overdue debts not exceeding BRL 200 000 (USD 205 233 at the January 1996 exchange rate), totalling BRL 8.1 billion (USD 8.4 billion). The second plan, Program of Financial Assets Rehabilitation (PESA), addressed loans over BRL 200,000, and was initiated in 1998 (OECD, 2005).
The debt rescheduling programs adopted in Brazil followed a very atypical negotiating process. Instead of negotiating directly with the Central Government, agricultural lobbies decided to act directly through the Congress. The two programs mentioned were enforced by law. Recently, government granted additional concessions for debtors reducing the interest rate for payers with good repayment records.
Family producer credit also went through a rescheduling program. The main targets were the PRONAF working capital and investment credit and the PROCERA program, effective between 1986 and 1999, providing loans to agrarian reform settlers. After the launching of PRONAF in 1995 and the increasing amount of resources channeled to family producers, debt rescheduling became an issue also to non-commercial farmers. It is clear today that debt rescheduling became increasingly politicized and clearly affected by macroeconomic imbalances rather than by the profitability of agricultural enterprises.
Debt restructuring programs have two implications. The positive implication is that the agricultural sector was compelled to find innovative ways to finance production using private channels. Given that a sizeable share of the resources for interest rate equalization was channeled through debt rescheduling programs, and that the availability of subsidized money for credit was decreasing sharply, producers, input firms, trading companies, and processing companies started to develop private funding instruments. New credit instruments, such as the Rural Product Note (CPR—Cedula de Produto Rural) or even private arrangements as Soja Verde, enabled agricultural producers to receive cash or inputs in advance from the buyer, through forward sale of their output.
The downside is that, in spite of debt rescheduling programs, agricultural debt kept growing. In 2000, debt was around 25 percent of Gross Agricultural Product. In 2005 it was estimated to be 40 percent. Two reasons explain the increased debt observed in recent years: the agricultural crisis of 2004–2006—caused by draught and appreciation of the national currency—and the increasing share of credit being allocated to family producers. Without a clear and strong insurance policy, covering revenue and climate-related losses, Brazil will not be able to rationalize the increasing indebtedness of the agricultural sector. Insurance policy is, beyond any doubt, the first priority in terms of agricultural policy objectives.

U.S. Agricultural Policy and the 2007 Farm Bill 89
Box 2: Understanding the Role of Two Ministries on the Formulation and Implementation of the Brazilian Agricultural Policy
Prior to discussing the strategies and goals of the Brazilian agricultural policy, it should be noted that Brazil has a peculiar institutional arrangement in terms of decision making and design of agricultural policy. By virtue of its importance within Brazilian society, a prominent role has been assigned to agrarian reform, while traditional agriculture policy has been oriented towards the needs and interests of large-scale producers. Therefore, there is a fault line separating the interests of commercial and family producers, although in many aspects both sectors interact and work together. This distinction became more important after the 1995/96 Agricultural Census provided more accurate information regarding the two groups. The Census offered the information necessary for launching a set of agricultural policies oriented to family producers. The definition of family producers comprises small farmers, subsistence farmers, and farmers without hired labor and income coming mostly from the rural sector activities. As it would be expected, the different interests are reflected by the respective lobbying organizations: the Confederação Nacional da Agricultura (National Agricultural Federation) representing commercial and large farmers, and the Confederação Nacional dos Trabalhadores Rurais (National Federation of Rural Workers)—CONTAG—representing workers and small farmers. Although family producers do not constitute a homogenous group, politically their leadership tends to be closer to the Landless Movement than to commercial farmers. Therefore, CONTAG sides with the claims for land reform and related programs. That situation was crystallized with President Fernando Henrique Cardoso´s 2000 decision to set up a new ministry in charge of running programs targeted to family producers and land reform—the Ministry of Agrarian Development (MDA). Programs oriented to commercial farmers were kept under the Ministry of Agriculture, Livestock and Supply (MAPA). Upon the creation of MDA, its area of competence was extended to include not only land reform programs (farm settlements) and genuinely agrarian policies, but also the new programs developed for family producers, under the scope of PRONAF (Programa Nacional de Fortalecimento da Agricultura Familiar—National Program for the Strengthening of Family Farming).
Consequently, the current atypical situation is such that the Brazilian agricultural policy is run jointly by two government agencies, MAPA and MDA, competing for the same funding. There are many interfaces in terms of how programs work. The funding for the programs comes from the same source, and the operationalization of the financing and commercialization programs for both agencies are managed by the Companhia Nacional de Abastecimento (National Food Supply Company).
Given that both PRONAF and commercial farmers’ programs are, in essence, similar, based on the same instruments and with the same objectives—interest rates equalization and income support mechanism—it is questionable whether having two agencies is the most efficient means to run agricultural policy. It would be desirable to have these identical policies assessed by common criteria in terms of goals achievement, results, and resources optimization.
This is not the case with some agricultural programs in Brazil, especially when expenditures are compared with programs oriented to provide public goods, such as research and development, sanitary improvement, and infrastructure (Chaddad and Jank, 2006).
4. Assessment of the Criticism Regarding Brazilian Agricultural GrowthThe previous sections have dealt with the recent evolution of Brazilian agricultural policy and the Brazilian economic environment in that period and have indicated that the exceptional performance of the agricultural sector was mainly due to market deregulation, market opening, and lack of fiscal capacity by the Brazilian government to continue previous distorting policies. All these circumstances acting in tandem have prompted a response by farmers to enhance their competitiveness. Consequently, production has soared, which, together with the stagnation of agricultural imports, has resulted in the agricultural trade surplus skyrocketing.
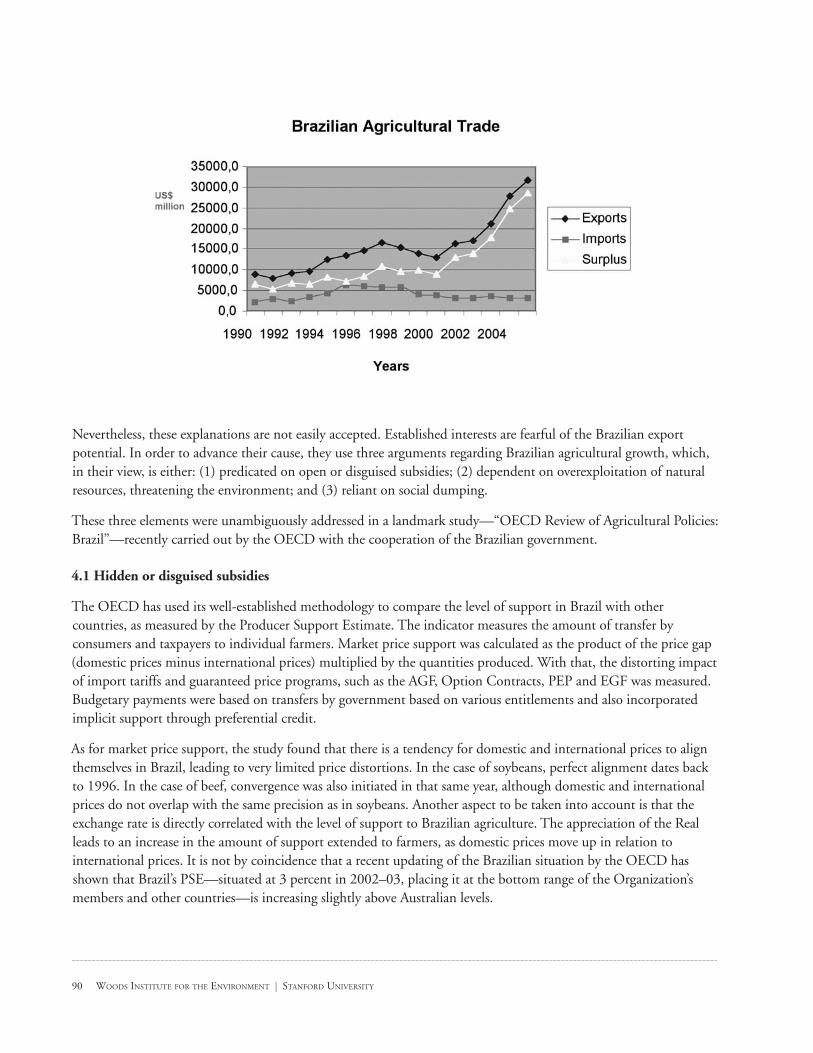
90 WOODS INSTITUTE FOR THE ENVIRONMENT | STANFORD UNIVERSITY
Nevertheless, these explanations are not easily accepted. Established interests are fearful of the Brazilian export potential. In order to advance their cause, they use three arguments regarding Brazilian agricultural growth, which, in their view, is either: (1) predicated on open or disguised subsidies; (2) dependent on overexploitation of natural resources, threatening the environment; and (3) reliant on social dumping.
These three elements were unambiguously addressed in a landmark study—“OECD Review of Agricultural Policies: Brazil”—recently carried out by the OECD with the cooperation of the Brazilian government.
4.1 Hidden or disguised subsidies
The OECD has used its well-established methodology to compare the level of support in Brazil with other countries, as measured by the Producer Support Estimate. The indicator measures the amount of transfer by consumers and taxpayers to individual farmers. Market price support was calculated as the product of the price gap (domestic prices minus international prices) multiplied by the quantities produced. With that, the distorting impact of import tariffs and guaranteed price programs, such as the AGF, Option Contracts, PEP and EGF was measured. Budgetary payments were based on transfers by government based on various entitlements and also incorporated implicit support through preferential credit.
As for market price support, the study found that there is a tendency for domestic and international prices to align themselves in Brazil, leading to very limited price distortions. In the case of soybeans, perfect alignment dates back to 1996. In the case of beef, convergence was also initiated in that same year, although domestic and international prices do not overlap with the same precision as in soybeans. Another aspect to be taken into account is that the exchange rate is directly correlated with the level of support to Brazilian agriculture. The appreciation of the Real leads to an increase in the amount of support extended to farmers, as domestic prices move up in relation to international prices. It is not by coincidence that a recent updating of the Brazilian situation by the OECD has shown that Brazil’s PSE—situated at 3 percent in 2002–03, placing it at the bottom range of the Organization’s members and other countries—is increasing slightly above Australian levels.

U.S. Agricultural Policy and the 2007 Farm Bill 91
Source: OECD (2005)
In conclusion, other than the limited price support to farmers, the study indicates a very small role played by government via direct transfers in view of sizeable budgetary constraints. As for the transfers to farmers, one-third is due to debt rescheduling. This finding is very important and worrisome, as support for public goods lies precisely at the heart of Brazilian agricultural growth. Future growth of Brazilian agriculture is endangered because agricultural research, infrastructure expenditures, and implementation of sanitary and phytosanitary measures are being crowded out by transfers to settle producers’ cash flow problems. Indeed, their financial difficulties derive from the fact that the financial solvency of Brazilian producers is dependent on the vagaries of the exchange rate. As a rule, in the last three years, all costs were contracted at a higher exchange rate than the one prevailing at the harvest and commercialization of the crop. Should Brazil keep the tendency of favoring emergency trade-distorting support, although in modest volumes, instead of investing in Green Box policies, the very basis of the expansion of the Brazilian agricultural sector will be undermined, and thus its competitiveness.
As a spin-off of the OECD study, Brazil had the opportunity to update its WTO notifications up to the 2002–2003 marketing year. It is noteworthy that neither the E.C. nor the U.S.A. have submitted notifications to the WTO beyond the same period covering, respectively, the effects of the Fischler Reform or the 2002 Farm Bill. Although not exactly similar in their methodologies, WTO notifications and OECD figures converge and show that Brazil is particularly well-placed in terms of fulfillment of its reduction commitments in domestic support.

92 WOODS INSTITUTE FOR THE ENVIRONMENT | STANFORD UNIVERSITY
Table 2—Brazil’s notified level of domestic support, WTO, 1999–2003, in US$ million
1999 2000 2001 2002 2003
PS AMS* (1) 409,0 230,0 236,0 212,0 249,0
NPS AMS*(2) 838,0 823,0 740,0 803,0 1.069,0
S & D (Art. 6.2) (3) 156,0 310,0 332,0 393,0 495,0
AMS + S & D (4)= (1)+(2)+(3) 994,0 1,133,0 1,072,0 1.196,0 1.564,0
Total Production Value (5) 39,725.0 42,910.0 38,409.0 37,277.0 44,940.0
(4)/(5) 2.5% 2.6% 2.8% 3.2% 3.5%
* Below de minimis level—notified as zero
Source: WTO, G/AG/N/BRA/ 22, June 2005.
Therefore, Brazil’s trade-distorting support levels are consistently below de minimis levels and represent a very minor share of its total production level. In the case of the U.S.A., in its years of highest support levels, from 1999 to 2001, the U.S.A. had as much as three times more support (13.1 percent for 1999, 12.7 percent for 2000, and, 10.7 percent for 2001).
As for Green Box support levels, confirming by the OECD’s analysis, Brazil’s expenditures were subject to sharp reductions of almost 50 percent in the period 1999–2003. General services programs linked to infrastructure were the hardest hit, with their share reduced to almost one-third of their original level.
Table 3—Brazil´s notified level of domestic support, WTO, Green Box, 1999–2003, in US$ million
MEASURE TYPE MONETARY VALUE OF THE MEASURE (US$ 1,000,000)
1999 2000 2001 2002 2003
GREEN BOX 1,567.9 1,486.8 1,462.0 892.6 820.1
1) General Services 1,213.7 856.4 959.9 553.1 446.1
2) Public Stockholdings for Food Security Purposes 140.6 40.8 71.7 45.0 6.0
3) Domestic Food Aid 185.8 589.3 430.1 293.7 355.4
4) Government Agricultural Insurance Program 27.8 0.4 0.3 0.8 12.7
5) Regional Development Programs 0,0 0,0 0,0 0,0 0,0
Source: Notification G/AG/N/BRA/22, June 2005.
Another source of misunderstanding regarding the alleged hidden Brazilian subsidies is the exemption of raw materials and semi-processed products destined for exportation from the tax on goods and services transactions—ICMS—approved in 1996 and known as the Kandir Law. Indeed, as indicated by OECD (2005), this measure
“was one of the factors contributing to expansion of Brazilian agri-food exports.” Nevertheless, the measure in

U.S. Agricultural Policy and the 2007 Farm Bill 93
question was aimed at correcting a discrimination against the agricultural sector, since manufactured goods exports have been benefiting from a similar exemption since 1988. Therefore, as it is a measure applied to all sectors, it cannot be considered as a subsidy.
4.2 Overexploitation of natural resources, environmental threats
It is true that there is a human pressure on the fringes of the Amazon rainforest that has led to a faster pace of deforestation, which, according to the Brazilian National Space Research Institute (INPE), reached 60 million hectares in 2001, up from 15.2 million hectares in 1978 (OECD, 2005). Local threats, such as slash-and-burnECD, 2005). Local threats, such as slash-and-burn. Local threats, such as slash-and-burn farming by the low-income population living in the region and illegal logging, account for a share of the deforestation. Cattle-rearing at the fringes of the rainforest is also impacting the region. There are, therefore, reasons for concern in relation to the forest, but commercial export farming is not the main culprit.
Between 1990/91 and 2005/06, grain production increased by 109 percent, while the total cultivated area only increased by 24 percent, thus indicating that most of the gains were derived from enhanced productivity. With respect to export crops, it is noteworthy that most of the expansion of sugar cane took place in São Paulo state, where tropical agriculture has been well established for over three centuries.
With respect to soybeans, its expansion in the Central-Western region took place predominantly in the Central-Western Cerrado. Indeed, the soybean production area in all five states of the Amazon region—Roraima, Rondonia, Acre, Amazonas, Amapá and Pará—comprises only 0.86 percent of Brazilian total planted area and this area has expanded in the last four years at very modest rates (only 0.22 percent). Moreover, a small fraction of Brazilian soybean exports originates from the Amazon region. Notwithstanding this, European NGOs, such as Greenpeace, are carrying campaigns out against Brazilian imported soybeans and threatening boycotts to processors that resort to commodities originated in Brazil. In response to these initiatives, Brazilian exporters have decided to set up a moratorium on all purchases of soybeans originated from the Amazon region. Furthermore, the Brazilian private sector is taking steps in the direction of implementing self-regulatory mechanisms and export certification.
As for the activities of the Brazilian government, there are numerous initiatives, laws and regulations in place. Brazilian conservation policies are very strict. In the Amazon region, farmers are required to leave 80 percent of their property untouched with original forest coverage, without receiving any compensation from the government.
Some positive results of government actions—such as the Action Plan for the Prevention and Control of Amazon Deforestation, launched in March 2004—are beginning to be felt. The main challenge to government action in the region is precisely to enhance the enforcement of forest law in view of the large area to be controlled and monitored.
4.3 Social dumping
Criticism of agricultural expansion also focuses on the many social imbalances in Brazil. Like in the environmental area, there is a wide recognition, including by the Brazilian government, that much remains to be done in order to better labor conditions for workers, particularly in the rural sector. Notwithstanding this, Brazil is a signatory of most ILO Conventions. Labor rights are part of the Brazilian 1988 Constitution with ample respect for individual rights, as well as collective rights of association and to strike. Work legislation for rural activities is enshrined in Law 5.889/73 and Decree 73.636/74.
The Brazilian government acknowledges that there are instances of forced labor in the country and considers these as very serious violations of basic human rights and of Brazilian labor legislation. Nevertheless, the Comissão
94 WOODS INSTITUTE FOR THE ENVIRONMENT | STANFORD UNIVERSITY
Pastoral da Terra, a well-known and respected Non-Governmental Organization, concurs that such violations are very limited in number and confined to regions in which the agricultural frontier is being expanded.
Concerted action has been undertaken in order to repress forced labor and child labor since 1995, such that the ILO has considered the Brazilian programs very advanced and has decided to launch its latest initiative in the area of forced labor in Brazil as a tribute to the efforts carried out in the country, considered an international reference in terms of mobilization against this practice.
Nevertheless, the argument that the recent Brazilian agricultural development is due to overexploitation of workers does not withstand scrutiny. This can be countered by the basic fact that even if there had been no progress in labor relations in the last few years, this fact would not suffice to explain the current surge in Brazilian production. Actually, the opposite is happening. As exports grow, salary and work conditions are improving for workers employed in agricultural production. Central-Western towns heavily engaged in soybeans production tend to have much better UNDP Human Development Indexes than areas that are not linked to production for international markets. Likewise, sugar-cane workers in São Paulo enjoy better incomes and salaries than half of manufacturing and services workers.
5. Family Farming and ProducersSo much attention is dedicated to the prowess of agribusiness in Brazil that little importance is assigned to the family farming segment in Brazil. Indeed, as is the case in many developing countries, as well as in Brazil, farming by families is responsible for a sizeable share of the production, particularly for the domestic market. Based upon data made available by the 1995 Census, the number of farms belonging to the segment of family farming is 4.1 million, out of a total of 4.8 million (92 percent). In terms of area, family farming is responsible for 30.5 percent of the area and 37.8 percent of the total value of production.
In accordance with Brazilian law that defines the conditions for eligibility for credits destined for family producers, the main criterion to be met is that the number of hours of labor provided to the farm by the family is greater than that provided by hired personnel.
The segment of family farming is very diversified with different degrees of integration into the market and very differentiated financial capacity. We can identify two basic types of producer—subsistence family producers and those who are integrated into the markets, “integrated” family producers. The subsistence farming segment is basically dedicated to a few products, such as manioc and black beans, which are non-tradable goods. As a result, they are basic suppliers to the domestic market, and their concerns should be best advanced via compensatory social policies, such as micro-credit and income-guaranteeing policies, like governmental purchases.
As for integrated farmers, who represent around 34.4 percent of the farmers, and that commercialize over 50 percent of their production, their share of the production of agricultural products is very significant: 47.2 percent of pork, 41.3 percent of milk products, 35 percent of maize, 31.1 percent of poultry, 21.8 percent of rice. Since they produce the very same commodities as agribusiness, their fortunes follow the fate of Brazilian exports.
Therefore, it is not surprising that the simulations carried out by OECD (2005) with its GETAPEM model have found increases in the welfare of all segments of the Brazilian population, including commercial and family producers. These results derive from the fact that “commercial and family producers are on balance net sellers of exported products whose prices will rise. Second, the potential losses to farms in import-competing sectors have in fact already been incurred by opening up trade with MERCOSUR, so no decline in domestic prices is expected.
U.S. Agricultural Policy and the 2007 Farm Bill 95
Third, non-agricultural households will on balance gain from higher agricultural prices, as the effects of higher profits and wages in the agro-food sector will outweigh the impacts of higher food prices.”
Nevertheless, even though multilateral trade reform will produce gains for all sectors of the Brazilian economy and, in particular, agriculture, these positive effects will not generate less inequality in terms of income distribution.
During the 1990s, rural poverty declined, but the decline was greater in the South, Southeast and Central-Western regions, while it was stable in the Northeast and increased in the North, indicating that poor people fared better in regions better integrated into international trade. Notwithstanding this, there is a large scope for compensatory and targeted public policies to address a number of important challenges to Brazilian development, particularly in relation to access to education and health services.
6. Conclusion The world agricultural market has been full of novelties in the last few years. Domestic demand is increasing in many developing countries, leading to an expansion of agricultural trade. Demand in developed countries, although more stable, is for higher quality and safer products, thereby opening new opportunities for food suppliers. Recent years show that Brazil has proved to be a country with a strong capacity to respond to the increasing demand in terms of volume and quality.
Even more important, the growth of Brazilian agriculture has been built with a strong market orientation, rather than by government intervention. Brazil has undertaken major reforms of its agricultural policies during the 1990s, and the productive sector has reacted swiftly, to become more efficient and competitive. Brazil is a real example that policies based on high trade barriers can compensate some farmers but help to keep the overall level of efficiency and the competitiveness of the agricultural sector low. Since the beginning of the 1990s, trade barriers have not been used as an instrument of agricultural policy in Brazil. Targeted support, with fewer resources and oriented mainly to small scale and subsistence producers, have proved to be much more efficient in terms of costs to society, resource allocation, and competitiveness.
Many countries from South America, Asia, and East Europe are able to provide agri-food products in response to the increasing demand in regions such as East and North Asia, the Middle East, and African countries. However, few countries are global traders like Brazil, providing a large range of commodities and processed products to a large range of countries. Restrained demand, graduation effect, urbanization, economic growth—mainly in Asian countries—indicate that the growth of consumption of agri-food is far from stabilizing. Availability of land, water scarcity, low productivity and protectionist policies, on the other hand, signal that developed and developing countries will necessarily resort to the world market to guarantee food security for their urban populations by procuring agri-food products at reasonable prices for the domestic consumer. Brazil is a central variable in that equation.
The Brazilian agricultural sector is also paying the price of being market-oriented. The sector is being affected by an overvalued exchange rate; lack of investments in infrastructure; reduction of expenditure in research and development; and low priority of attributed to sanitary policies, not only to meet importers’ standards, but also to protect domestic production against unsafe imported products.
Protectionist countries, especially the developed, continue to impose high costs on Brazilian agriculture. In the past, at least those costs were associated with trade-distorting subsidies, high trade barriers, and unscientifically justified sanitary measures. These were old-style policies. The new challenges ahead are costs associated to environmental

96 WOODS INSTITUTE FOR THE ENVIRONMENT | STANFORD UNIVERSITY
and social restrictions. The good news is that the sustainability of agricultural production is a priority in Brazil. The Brazilian government and private sector are working seriously on these issues, not only to clear up the misunderstandings but, even more important, to develop standards and practices that will serve as a reference for the rest of world. Brazilian agriculture is part of the solution rather than a problem on the issue of sustainability. The use of ethanol as a fuel is only one example of the Brazilian commitment to the sustainability of agriculture.
With the developments of bio-energy, agriculture is becoming a more complex economic and social activity. Old mechanisms such as trade-distorting subsidies, intervention prices, and production quotas, although still in use, tend to lose sense as feed and energy markets converge. Agricultural production will be completely transformed in the future, and Brazil is a major candidate to play a central role on this process.
It is, therefore, no coincidence that Brazil has been playing a very active role in the Doha Development Agenda negotiations. Having to face simultaneously the challenge of being a large commercial exporter of agricultural commodities and also having a very large family producer sector, the country is in an enviable position to serve as a bridge between developed and developing countries. With these credentials, as coordinator of the G-20, which consists of developing countries from three continents; being the country with the largest trade surplus in agriculture; and having had to reform its own agricultural policies, Brazil is particularly well-placed to continue to influence the pace of the reform of agriculture.
7. ReferencesBerthelot, J. (2005). La vanité de la stratégie agro-
exportatrice du Brésil pour rembourser sa dette externe. Rencontre des Organisations paysannes de l’Union européenne et du Mercosul. (available at http://solidarite.asso.fr/actions/Agriculture.htm).
Chaddad, F. R.; Jank, M. S. (2006). The Evolution of Agricultural Policies and Agribusiness Development in Brazil. Choices, 2nd Quarter 21(2). American Agricultural Economics Association.
Gasques, J. G.; Bastos, E. T., Bachi, M. P. R.; Conceição, J. C. P. R. (2004). Condicionantes da Produtividade Agropecuária Brasileira. Textos para Discussão 1017, Brasilia, IPEA.
Gasques, J. G.; Verde, C. M. V.; Bastos, E. T. (2006). Gasto Publico em Agricultura: Retrospectiva e Prioridades. Textos para Discussão 1225, Brasilia, IPEA.
Goldstein, J. (1993). Creating the GATT Rules: Politics, Institutions and American Policy in Ruggie, J. (ed). Multilateralism Matters: the theory and praxis of an institutional form. Columbia University Press.
Marques, V. A. (2006). The Policy Report on Main Policy Developments in Brazil (2005–2006). Paper prepared for discussion at the Organisation for Economic Co-operation and Development.
OECD (2005). Review of Agricultural Policies: Brazil. Paris, Organisation for Economic Co-operation and Development.
Wedekin, I. (2005). Issues on Brazil Agricultural Policy. Revista de Politica Agricola, Special Edition, October, Brasilia.

U.S. Agricultural Policy and the 2007 Farm Bill 97
CHAPTER III-1
Managing for Ecosystem Services on U.S. Agricultural Lands
Rebecca L. Goldman, Barton H. Thompson, Gretchen C. Daily1
IntroductionThe 2007 United States (U.S.) Farm Bill offers an opportunity to invest in new conservation methodologies and ideologies on private, agricultural lands offering programs that incorporate available science into effective, beneficial reward schemes. Ecosystem services, created by the interaction of organisms and their environment, are the benefits accrued from services naturally provided by the environment from which both human beings and all other organisms benefit. They are “the conditions and processes through which natural ecosystems, and the species that make them up, sustain and fulfill human life” (Daily 1997) (3) by “purifying air and water, detoxifying and decomposing waste, renewing soil fertility, regulating climate, mitigating droughts and floods, controlling pests, and pollinating plants” (Salzman et al. 2001)(310). The recent release of the Millennium Ecosystem Assessment (MA) has further promoted the significance and importance of such services by linking them directly to human health. Ecosystem service provision depends on working landscapes throughout the world and heavily on agricultural lands in the U.S.
Ecological agriculture, agriculture that supports biodiversity and provides ecosystem services, is possible and necessary. Instead of farm- or field-based management techniques, broad scale, landscape vision and management is needed (Westphal et al. 2003; Goldman et al. in press). Rewards for services rather than just food and fiber are essential (Robertson et al. 2004). Governments, non-government organizations, and local citizens around the world are beginning to recognize this need, and there is widespread acceptance that more should be done to enhance levels of biodiversity and ecosystem services on agricultural land. Sustainable resource management is becoming more common on farms throughout the world (Firbank 2005), but this management needs to grow in scale and capacity. The 2007 Farm Bill is a chance to increase the scale and to reward the provision of ecosystem services.
Many studies indicate that agricultural lands can and do provide valuable ecosystem services and/or biodiversity, yet there is no clear linkage established between what ecosystem services might be provided and the management techniques that would enhance them. Studies indicate that agriculture can provide services such as biodiversity (wildlife habitat), water and air purification, disease suppression, carbon storage and mitigation of global climate change, pollination, pest management, flood control, soil fertility, and aesthetic services (Kremen et al. 2002; Ricketts 2004; Robertson et al. 2004; Firbank 2005; Lal 2005; Robertson and Swinton 2005; Shuler et al. 2005). Other studies have suggested management techniques to minimize degradation of agricultural lands (Tilman 1999; Tilman et al. 2001; Ricketts 2004; Firbank 2005; Lal 2005; Moore and Palmer 2005; Tscharntke et al. 2005). Few to no studies, however, link the available science concerning ecosystem services production, the biophysical features that promote the services, and appropriate management techniques to promote those biophysical factors.
1 The Woods Institute for the Environment, Stanford University
98 WOODS INSTITUTE FOR THE ENVIRONMENT | STANFORD UNIVERSITY
As such, we seek to answer several crucial questions in this assessment. First, is it even necessary to target ecosystem services on agricultural lands or are the services already being provided? Second, can agricultural lands be managed to promote ecosystem services and if so, how? Third, how can money invested in conservation incentive programs most effectively target ecosystem services on agricultural lands? Fourth, what are the advantages both for the farmer and for the broader community of managing for ecosystem services? Finally, what research still needs to be done to make management for ecosystem services fully effective?
Status of U.S. FarmlandsQuestions: How big is the need to focus on ecosystem services on agricultural lands in the U.S.? Are there some services that are already being promoted, and if so, which ones and how? How are the majority of U.S. agricultural lands being managed presently?
The easy answer to these questions is that, in general, U.S. farmlands are in great need of managing for ecosystem services as the vast majority of farmers do not appear to include ecosystem service provision as a top management priority. The U.S. Department of Agriculture (USDA) Economic Research Service (ERS) conducts many different studies into the state of U.S. farmlands. One such series is the “Agricultural Resources and Environmental Indicators,” most recently published in 2003,2 that reports on trends in land, water, and biological resources and commercial input use, as well as the condition of natural resources in agriculture and the public policies addressing such issues. This report provides a valuable overview of U.S. agriculture.
There is sparse usage of ecological/ecosystem service management techniques. Only about 10 percent of the total number of corn farms (the top U.S. field crop) used some type of precision farming in 1996. Precision farming (see Appendix A) involves applying new technology and high levels of management to minimize commercial inputs and make use of natural processes to sustain agricultural lands. The use of precision farming is equally low for other crops. The use of organic farming, a method of farming that uses renewable resources and virtually no synthetic chemicals, was <0.5 percent of harvested cropland acres in 1997. In terms of tillage (see Appendix A), no-till agriculture has been rising, but still only reached 17 percent of planted crop acreage in 2000. Conservation tillage accounted for 19 percent of planted acreage.
Rotational cropping (see Appendix A) can be important for pest and disease control, can help replenish soil nutrients, and can help reduce erosion, depending on the rotation. Rotation interrupts pest cycles by planting a non-host crop right after a susceptible crop, decreasing the need to use insecticides (except on wheat, since planting wheat with row crops actually increases the growth of weeds). Rotating crops with nitrogen-fixing legumes, such as soybeans, helps return nitrogen to the soil without applying synthetic fertilizers. Row crop rotations (where all crops rotated are row crops such as corn, soybeans, cotton, or peanuts) are not as effective at replenishing soil fertility and improving water use and nutrient cycles. Rotating with small grains or meadows improves soil quality and helps promote ecosystem services. Unfortunately, in 1999, only 4–8 percent of corn, soybean, cotton, or peanut acreage was rotated with these crops.
Managing lands using crop residues is highly advantageous for soil fertility and reduction of soil erosion, as discussed previously. About 58 percent of U.S. farmers used crop residue management of some form on their lands in 2000. This figure includes both conservation and no-till systems. Cotton is the crop that is using the least amount of conservation tillage—only 12 percent of cotton acreage in 2000 used conservation tillage, whereas over
2 For access to this report see: http://www.ers.usda.gov/publications/arei/ah722/.
U.S. Agricultural Policy and the 2007 Farm Bill 99
50 percent of soybean acreage used it, 36 percent of corn, and 30 percent of small grains. Statistics have shown a rise in crop productivity through using conservation or no-till systems, though there is often an associated rise in pest and weed populations. Additionally, there are certain soil types and climatic conditions in which conservation tillage has not proved to be consistently economically attractive. Finally, the risk associated with the unknown and the switch from traditional methods makes farmers apprehensive. These concerns limit the use of conservation or no-tillage by many farmers in the U.S.
Pesticide use more than doubled in just over 30 years on about 70 percent of current cropland acreage. In 1964, farmers used 215 million pounds of insecticides on the major crops. By 1997, that number rose to 588 million pounds and use continues to rise. Pesticides include herbicides, insecticides, fungicides, and several other pesticides including soil fumigants, growth regulators, desiccants, and harvest aids. The vast majority of pesticides are synthetic chemicals. The market for biologically based products is extremely small, only 1.3 to 2.4 percent of the total market for all pest products, in 1995. Using beneficial insects as a means of pest control is also very small. In the early 1990s, only 3 percent and 19 percent of surveyed vegetable and fruit acreage, respectively, used beneficial insects. Organic farms make greater use of this tool—almost 46 percent of organic vegetable growers and 20 percent of organic fruit growers used these insects.
Commercial fertilizers are prevalent on many U.S. farms. In just over 20 years, nitrogen fertilizer use increased 335 percent ; over 12 million nutrient tons were being used in 1998. Nitrogen, phosphate, and potash use in fertilizers was over 12 million nutrient tons in 1998. The dominant form of fertilizers today is direct application materials in which the fertilizer has primarily one nutrient rather than being mixed. Fertilizer use varies by crop. Almost every acre in corn, fall potatoes, and rice and 75 percent of cotton and wheat receive some form of commercial fertilizer, whereas less than 40 percent of acres with soybeans, a nitrogen fixer, receive fertilizers.
From this assessment, it is clear that U.S. agricultural systems, for the most part, are not being managed for ecosystem services. Farmers appear to be improving their tillage methods, and some are diminishing the use of synthetic inputs, but for the most part, U.S. agricultural lands suffer from management techniques that do not promote ecosystem services. At the same time, managing for ecosystem services can often increase the productivity of agricultural lands creating a win-win scenario for farmers and for conservation. The difficulty is understanding what these win-win situations are, how they are generated, and how farmers can benefit from them.
Ecosystem Services and AgricultureQuestion: What are the biophysical features that promote ecosystem services, and how can farmers manage for these features?
To answer this question, this section outlines various ecosystem services that scientific literature suggest agriculture can provide. For each service, we outline the mechanisms by which agriculture has historically degraded the service or influenced the service. Then, we explore what science demonstrates are the biophysical features that promote each ecosystem service. Finally, for each service, we explore possible management techniques that will generate the service. These management techniques include both biological mechanisms as well as more practice-based mechanisms. All results are summarized in Table 1.
100 WOODS INSTITUTE FOR THE ENVIRONMENT | STANFORD UNIVERSITY
WATER PURIFICATION
Agriculture significantly influences water quality through pollution, erosion, and drainage issues. Pollution is a result of physical loading of water with inorganic and organic sediments and particulates resulting from the use of pesticides, insecticides, and fertilizers (MA 2005). Nutrient loading of nitrogen and phosphorus is common in agricultural systems. Fertilizers raise the natural levels of these nutrients in the soil system, and many of the nutrients are washed away with runoff from the system. These nutrients then pollute nearby waterways, and, since they are often limiting nutrients in such systems, large algal blooms result, causing eutrophication. Eutrophication involves oxygen depletion in water bodies which suffocates fish.
Pesticides and insecticides can have consequences for human heath by polluting goods humans consume. Runoff from agriculture pollutes both groundwater and surface water as pesticides and insecticides dissolve in the water (Sumelius et al. 2005). Insecticides and pesticides can also enter into fish and cause indirect human health problems through fish consumption. Finally, many remain on fruits and vegetables which, if not washed properly, then enter into human systems (MA 2005).
Agricultural lands often have erosion and drainage problems that contribute to water quality issues. Erosion leads to sedimentation and runoff of particulate matter. Again, this contributes to pollution of waterways as well as the pollution of surface water. Erosion destabilizes soil, rendering previously productive lands marginal, thereby threatening economic and ecological productivity. Drainage concerns involve salinization and waterlogging. Poor irrigation management can lead to high levels of salinity on agricultural fields, again rendering previously productive land relatively useless. Water logging occurs with inadequate draining and can lead to human health problems by breeding diseases (MA 2005).
Thus, the problems agriculture causes for water quality are numerous, but well-managed agricultural lands can serve to provide a natural water purification system rather than a water degradation system. Agricultural systems can be managed to provide biophysical controls that will promote water purification services. Biophysically, water quality is enhanced by stable soils and natural filtration systems that result from cover crops and grasses. Buffering riparian areas (see Appendix A) is especially important, as this provides a filter for agricultural runoff directly at the point in which water pollution occurs. Shelterbelts (see Appendix A) and meadows are biogeochemical filters, filtering chemicals out of groundwater (Ryszkowski 1995). To control pesticides biophysically, farmers must manage for pest predators. Agricultural systems that promote a variety of insect predators will control for pests without the excessive use of pesticides that then leads to water quality degradation.
There are a variety of agricultural management techniques that can target the biophysical controls on water purification services. First, one control on water quality is filtration systems, which both filter out sediments caused by erosion as well as nutrients added by fertilizers. Riparian forest cover has been shown to directly improve stream health (Moore and Palmer 2005). Cover crops act as a natural filtration system that removes pollutants from water that runs off agricultural landscapes. Cover crops have an additional bonus of stabilizing soils and reducing erosion caused by water and wind, and they help cycle nutrients to soils enhancing soil fertility. Filter strips (see Appendix A) filter out nutrients and sediments that are attached to soil particles by slowing runoff which causes larger particles to settle out of the runoff. This diminishes pollution of water bodies (Benham et al. 2005). The effectiveness of filter strips is influenced by farming practices above them. They are more effective below less steep grades with good cover cropping, as this diminishes flow and flow rate.
Stable soils control soil erosion, a direct cause of impure water from agricultural systems, as particulates can pollute and clog waterways. Besides cover crops, biophysical controls on soil erosion include leaving crop residues on

U.S. Agricultural Policy and the 2007 Farm Bill 101
agricultural fields after harvest. Using residues as mulch maintains plant cover on the soils and protects them from both wind and water erosion (MA 2005). Additionally, crop residues help intercept nutrients and chemicals near the soil surface, keeping them out of soil runoff, thereby helping maintain clean water (Magleby 2003).
Farmers can control pests through managing for biophysical controls in agricultural systems. One means is through promoting pest predators, usually encouraged by avoiding monocultures and providing a variety of plant species. Plant diversity offers food sources to different phytophagous insect predators. Integrated Pest Management (IPM) involves cultural, biological, chemical, physical, mechanical, and genetic techniques to reduce the use of pesticides in cultivation. This technique involves knowing the various pests and pest predators for crop species, how to control for pests, and how to promote pest predators. Geographic Information Systems (GIS) are making it possible to use precision agriculture techniques that involve highly site-specific crop management, like those used for IPM but incorporating more than just pest management. Precision agriculture offers a way to avoid categorically applying the same growth techniques to all crops in the landscape (MA 2005).
Aside from providing water purification services through natural biophysical mechanisms, there are also methodological, practice-based adjustments to farming practices that can improve agricultural techniques and provide water purification services. Rotational grazing, manure storage, contour farming, and no-till farming are examples of practice-based management techniques to enhance water purification services (Moore and Palmer 2005). Rotational grazing ensures not all areas become completely denuded of cover crops. Manure storage uses nutrients naturally stored in manure to fertilize fields, thereby reducing the need to apply external nutrients that can pollute waterways. Contour farming slows runoff allowing more time for filtration of nutrients and pesticides (Benham et al. 2005). Increasing the use of precision agriculture can decrease the need for nitrogen and phosphorus inputs through fertilizers (Tilman et al. 2001). Precision agriculture increases the efficiency of fertilizer use (Tilman 1999). Finally, no-tillage or conservation tillage helps reduce soil erosion (MA 2005).
POLLINATION
Pollination services are essential to agricultural lands. Many food crops require pollination in order to fruit, and agricultural lands can encourage pollinator activity if well managed (Shuler et al. 2005). About 66 percent of the world’s crop species either benefit from or require animal pollination and most of this pollination is via bees (O’Toole 1993; Roubik 1995; Ricketts 2004; Morandin and Winston 2005). In the developed world, about one-third of human food requires fruit production from pollination (O’Toole 1993; Morandin and Winston 2005). Farms are more productive with good pollination services. Farms nearer to forest fragments had a 14.6 percent increase in production that can be related to pollination services (De Marco and Coelho 2004). The value of pollination services to a coffee plantation in Costa Rica was estimated to be about $62,000 per year (Ricketts et al. 2004).
Many farms use managed bee populations for pollination services, but for a number of reasons, it is best to have a supply of native pollinators. Wild populations can pollinate crops as effectively or more effectively, and using wild populations reduces the cost of importing and managing non-native bee populations. Native pollinators have been shown to increase the quantity and quality of coffee in Costa Rica (Ricketts et al. 2004). This improvement is probably due to several reasons. First, native pollinators have a higher rate of outcrossing among plants which leads to larger and more robust fruits. Second, native bees might have a higher frequency of movement between plants leading to cross-pollination (honey bees tend to focus on one branch). Third, some native bees can actually deposit more pollen on stigmas in one visit than honeybees can increase the efficiency of pollination. Finally, having a greater diversity of pollinators, in general, leads to a more resilient system (Ricketts 2004).

102 WOODS INSTITUTE FOR THE ENVIRONMENT | STANFORD UNIVERSITY
Pollination services are heavily dependent on bee diversity and, sometimes, bee abundance. Bees depend upon plant diversity. The problem is that agricultural systems tend to degrade native plant diversity and, in the case of highly intensive agriculture, create monocultures. Intensification of the entire landscape can severely disrupt pollination services (Tscharntke et al. 2005) as native patches of vegetation or non-agricultural production become sparse (Wilson et al. 2005).
Thus, as described, the biophysical features that promote pollination services are bee and bird diversity and, in some cases, abundance. Birds and bees require plant diversity and structural diversity to provide viable refuges and nesting areas. Native bees are dependent on native ecosystems and forests for survival (Ricketts 2004). This dependence may be due to the fact that uncultivated lands provide a continuity of pollen and nectar needed for bee diversity. Plant diversity also provides proper food supply for bee pollinators. One study demonstrated that mass flowering crops actually enhance bumblebee densities due to the great rewards in nectar from these crops (Westphal et al. 2003). Additionally, plant diversity is good for oligolectic solitary bees (Morandin and Winston 2005).
Ideally, then, management would target the biophysical factors that promote bee and bird diversity to provide pollination services from agricultural lands. Pollination services often come from nearby nonagricultural ecosystems (Carpenter et al. 1998; Tilman 1999; Tilman et al. 2002) that maintain significant levels of plant richness. Studies show that farming practices and proximity to native habitat has dramatic effects on wild bee populations (Calabuig 2000; Kremen et al. 2002; Ricketts 2004; Kremen et al. 2004; Shuler et al. 2005; Morandin and Winston 2005). Native bee richness, overall plant visitation rates, and pollen deposition rates were significantly greater in coffee plantations in Costa Rica in agricultural plantations within 100 meters of forest fragments as compared to those farther away (Ricketts 2004). Many of the above relationships are equally true for birds and bird pollination services. Greater bird diversity tends to occur when there is greater diversity of habitat near to agricultural landscapes so that birds can use the resources from this native habitat (Hughes et al. 2002; Daily et al. 2003; Brontons et al. 2005).
For management purposes, pollination services require a landscape-scale approach that incorporates patches of native vegetation throughout agricultural patches. Agricultural lands that best promote pollinator services are a mosaic of agro and non-agro ecosystems, especially where the non-agro ecosystems include forest cover (Goldman et al. in press). Managing at a field- or site-based scale would be inappropriate to incorporate the needs of pollinators. In terms of local level management techniques, one possibility would be to incorporate more crops that are known to be invaluable nectar providers for pollinators such as was demonstrated with mass flowering crops.
SOIL FERTILITY
Agriculture causes the physical, chemical, and biological degradation of soils. Loss of soil fertility leads to declines in yields and in the sustainability of agriculture through time. Physically, it can lead to erosion and soil compaction (decreased levels of porosity and permeability). Chemically, agriculture causes the loss of soil nutrients and the accumulation of heavy metals and other toxics (Sumelius et al. 2005). Soil organic carbon (SOC), which is much lower in agricultural soils than in natural soils, is an indicator of soil quality and resilience. Agricultural soils are less able to filter pollutants, are more likely to erode, and they emit greater concentrations of greenhouse gases (Lal 2005). Soils lose nutrients as crops are harvested and nutrients stored in the vegetation are not returned to the soils. As such, external sources of nutrients, especially nitrogen and phosphorus, are applied via fertilizers. External fertilizers, however, are not absorbed well by the crops, let alone by the soils. Today, only 30–50 percent of applied nitrogen ends up in crops and only 45 percent of phosphorus (Tilman et al. 2002). Biologically, agriculture lowers organic matter and carbon biomass in soils (Sumelius et al. 2005).

U.S. Agricultural Policy and the 2007 Farm Bill 103
Thus, agricultural systems can provide soil fertility services by controlling the physical, chemical, and biological degradation of soils, biophysically. The biophysical control of erosion, discussed earlier, is vegetative cover and crop rotation (MA 2005). Chemically, nutrient cycling is critical for soil fertility. Nutrient cycles are controlled using shifting cultivation, allowing fields to go fallow for periods while growing cover crops that return nutrients to the soil. Planting dual-purpose crops such as legumes (e.g. soybeans), which can be sold for economic profit and yet fix nitrogen, are a win-win management technique. Managing for soil organic matter and for microbial communities will lower nutrient leaching (Tilman et al. 2001). Finally, using crop residues, livestock manure, and human wastes improve soil fertility. Returning crop residues and roots to the field post harvest will replace many nutrients in store in the vegetation. Burning of crop residues on the field when they are fallow has a similar effect (MA 2005). Wastes, animal and human, have many nutrients making them sustainable, organic fertilizers (Tilman 1999). Biologically, soil biodiversity helps stabilize soils (Lal 2005). Managing for soil biodiversity involves increasing the richness of microbial communities (Tilman et al. 2001). This can be done using mulch farming, integrated nutrient management and manuring, and pest management. These techniques also decrease the decline of SOC (Lal 2005).
Like the other services, farmers can manage for soil fertility using more practice-based controls. Physically, erosion generally results from non-contour plowing, overstocking of livestock or crops, poor crop management, and larger agricultural field sizes. Thus, managing livestock, reducing field size, and using contour plowing can reduce erosion. In addition, using conservation or no-till agriculture can minimize surface damage (MA 2005). Soil compaction usually results from the use of heavy machinery and subsequent cropping practices common with agricultural intensification (Sumelius et al. 2005). Reduction in the use of heavy machinery will help combat soil compaction. Conservation tillage and mixed farming systems are practiced-based management techniques to manage for soil biodiversity and diminish the loss of soil organic carbon (Lal 2005).
GREENHOUSE GASES
Agricultural lands significantly contribute to the amount of carbon dioxide, nitrous oxide, and methane, three greenhouse gases, in the atmosphere. Methane and nitrous oxide contributions are especially high, 70 percent and 50 percent, respectively. Cropping intensification, the use of high-yielding crops, and wide scale application of fertilizers increase organic matter for crops and are often used to produce greater yields, but most of these techniques do not actually enhance soil carbon sequestration, as most of the nutrients are not returned to the soil. Instead, carbon dioxide is released into the atmosphere, and agricultural productivity is diminished (Post et al. 2004).
Agriculture has the potential to provide carbon sequestration, but the scale and significance of the sequestration remains in question and is still being explored (Desjardins et al. 2005; Bernacchi et al. 2005). The major biophysical control on carbon storage is maintaining soil organic carbon which is lost via erosion (Vagen et al. 2005). Erosion is a major cause of loss of all soil organic matter (Post et al. 2004; Vagen et al. 2005). Erosion disrupts aggregates of minerals and causes loss of particulates.
Beyond the biophysical management techniques for erosion (cover crops, conversion to grasslands, crop rotations) that have been previously discussed, there a number of suggested practice-based management techniques that may enhance sequestration of greenhouse gases in agricultural soils (Desjardins et al. 2005). Tillage and crop residue management affect soil carbon content for a number of reasons (Post et al. 2004; Boody et al. 2005; Vagen et al. 2005). No-till or conservation tillage agricultural systems reduce wind and water erosion which enhances sequestration potential (Post et al. 2004; Desjardins et al. 2005). Additionally, tilling agricultural fields causes the mechanical disruption of soil aggregates; the alteration of the soil structure diminishes soil organic matter. Soil structure helps protect organic matter from microbial access and breakdown. No-till agriculture and/or perennial vegetation increase fungal-dominated

104 WOODS INSTITUTE FOR THE ENVIRONMENT | STANFORD UNIVERSITY
pathways. These pathways increase the residence time of microbial residues, which can lead to a build up of soil organic matter. Perennial vegetation confers many of the same advantages as no-till agriculture (Post et al. 2004). Use of crop residues and/or manure returns nutrients to the soils more effectively than applying fertilizers.
Carbon is also sequestered through reforestation and afforestation, mulching, management of nutrients, and increased biodiversity (Lal 2004). Better agricultural management allowing for fallow fields and some reforestation can maintain and enhance soil carbon levels (Vagen et al. 2005). The problem with sequestering carbon in soils is that soils reach a saturation point, at which point the focus becomes ensuring that the carbon does not escape from the soil. In addition, the amount of carbon sequestered over time depends on climatic conditions (Desjardins et al. 2005).
Methane also has the potential to be sequestered in soils and occurs more readily in undisturbed soils. Practices such as fertilization, tillage, and the use of insecticides and/or herbicides have been shown to inhibit soil methane uptake, thereby diminishing soil-sequestering abilities (Suwanwaree and Robertson 2005).
There are tradeoffs involved in all management choices. This is especially true when managing for greenhouse gas sequestration, as one technique may sequester one gas, only to emit another. No-till agriculture may decrease carbon dioxide emissions, but it can increase nitrous oxide emissions. Deforestation and drainage of peat lands for agriculture is associated with rises in nitrous oxide and carbon dioxide emissions. However, both are associated with decreases in methane production (Smith and Conen 2004). In contrast, some agricultural techniques have multiple benefits. Both reduced tillage and reduced summer fallow sequester carbon and reduce soil erosion. Reduced erosion leads to improved soil productivity and profitability of farming systems since productive, fertile solids increase crop production and carbon sequestration. In all management choices, it is necessary to consider all consequences of the land use choice.
FLOOD MITIGATION
Deforestation often occurs to allow more space for agriculture. Trees provide natural flood mitigation, and as such, their removal can contribute to floods (Cederwall and Brandt 2002). Watershed deforestation has been shown to increase rates of erosion, runoff, and unseasonable downstream flooding (Woods 2004). Agriculture intensification and simplification increases vulnerability to flooding (Ryszkowski 1995). Planting crops reduces infiltration of the soil and causes increased runoff. There is less vegetation on the ground, which means less water is absorbed and any sudden influx of water can have serious consequences. Land clearing for agriculture can change underlying hydrological and hydrogeological processes such as rising groundwater levels, increased flooding, and salinization (Hatton et al. 2003).
The situation is not hopeless, however, as agriculture can be altered to help mitigate flooding problems. The biophysical control on flooding is well-rooted stable plant systems that can reduce the quantity and slow the rate of runoff from agricultural systems. Models show that decreasing runoff in agricultural landscapes by 10 percent within a watershed can reduce flood peaks with a 2- to 5-year return by 25 percent to 50 percent and may reduce a 100-year flood by as much as 10 percent (USACE 1995; Boody et al. 2005). Flow rates and runoff can be reduced by land conversion to grasses. Grasses increase infiltration and the water storage capacity of the soils (Boody et al. 2005). Deep-rooted plants that are perennial, especially in areas with a dry season, also improve water cycling in agricultural systems (Hatton et al. 2003).
Other agricultural techniques can also diminish overland, surface flow. Riparian buffers help absorb water before it enters the stream; wetland restoration can reduce flood flow volumes (Boody et al. 2005). Thus, to manage for the biophysical controls to provide flood mitigation services, farmers should focus on cover crops and grasses and intersperse agricultural plots with areas of perennial plants and well-rooted vegetation.
U.S. Agricultural Policy and the 2007 Farm Bill 105
BIODIVERSITY
The biggest problem concerning biodiversity and wildlife habitat as pertains to agriculture is the conversion of native, diverse habitat to less diverse monocultures. Birds rely on vertical diversity that is harmed by agricultural intensification. The variable crop structure helps conceal birds from predators, helps protect them from extreme weather, and helps increase the diversity, abundance, and accessibility of food (Wilson et al. 2005). Carabid beetles, beetles with a large potential role in crop pest control, require a connected network of permanent landscape elements (Aviron et al. 2005). Species abundance and richness of ants, snails, millipedes, and centipedes is greatly limited in cultivated systems. Intensive agriculture damages many communities of insect taxa. Tillage disrupts insect larvae communities (Ryszkowski 1995). Studies in Costa Rica demonstrate that working, agricultural landscapes can and do support native biodiversity, but this survival is positively correlated with having patches of native vegetation near agricultural plots ((Ricketts et al. 2001, Daily et al. 2001, Hughes et al. 2002, Horner-Devine et al. 2003, Daily et al. 2003, Mayfield and Daily 2003).
Biophysical features that promote biodiversity include habitat diversity and maintenance of habitat connectivity. Monocultures and no structural diversity limits breeding habitats, refuges from predators, food sources, shelter, and other essential requirements for wildlife. For organisms such as the carabid beetles, hedgerows, corridors, and refuges are essential for survival.
Managing for habitat diversity requires a landscape vision in which a mosaic of crop plots is interweaved with plots of more diverse habitat. To enhance wildlife habitat farmers can convert non-farmed areas into habitat such as field and roadside borders and equipment yards. This conversion would supply habitat for native bees and other beneficial insects (Kremen et al. 2004). Low diversity landscapes need to be managed to support any diversity for that field and the field beyond. In complex landscapes, extensive/low impact agriculture, there is a species pool that can colonize new habitats. This facilitates population exchange due to the existence of source populations. Currently, agri-environment schemes do not target landscape management (Tscharntke et al. 2005).
One other management technique found to have positive benefits for biodiversity is organic farming. Organic farms are those that do not use any artificial pesticides and herbicides or inorganic fertilizers. Usually they use more diverse crop rotation systems than non-organic agriculture. One meta-analysis showed that bird, insect, and plant species richness was greater in organic farms as compared to non-organic (Bengtsson et al. 2005). On average, organisms are 50 percent more abundant in organic farming systems, though this depends on intensity of the non-organic system. The benefits from organic farming to biodiversity probably result from the increase richness in plant diversity in the system, having more plants in field margins, and the diversity of agricultural habitats (Bengtsson et al. 2005).
Summary of Critical Management TechniquesAs emphasized, each ecosystem service is provided by biophysical features upon which various management techniques, both biological and practice-based, act (this information is summarized in Table 1). Several management techniques target multiple ecosystem services (see Table 1) and, as such, represent the “biggest bang for the buck” in terms of management techniques to promote ecosystem services on U.S. agricultural lands. The three management techniques that have the most significant impact are switching from conventional tillage to no-tillage or conservation tillage, managing at a landscape scale for mosaic agricultural systems, and switching from non-contour to contour farming.

106 WOODS INSTITUTE FOR THE ENVIRONMENT | STANFORD UNIVERSITY
Table 1. Summary of Ecosystem Services, their controls, and management techniques to promote them.
Conventional tillage causes severe disruption of the soil as high levels of cultivation and plowing occur; so no-till or conservation tillage systems promote stable soils less prone to erosion, a key characteristic for the promotion of water purification, soil fertility, and mitigation of global climate change services. Tillage is the process of preparing

U.S. Agricultural Policy and the 2007 Farm Bill 107
soils for seeding and usually includes two steps one in which the soil is loosened and mixed with fertilizers and the second in which the soils are disturbed again to create finer grains. Conservation tillage uses minimal cultivation of the soil which means that the majority of the crop residues remain on the soil surface rather than being plowed under as in conventional tillage. No-till systems still involve some opening of the soil, but disturbance is limited. The majority of the soil remains covered by crop residues. In conservation tillage, at least 30 percent of the soil surface maintains crop residues. Switching from conventional tillage is especially beneficial on fields subject to erosion. Conservation or no-till systems use water more efficiently and save money on fertilizers. The possible disadvantages are compaction, drainage problems, and pest infestations.
A second major management technique that targets multiple ecosystem services, including flood mitigation, biodiversity conservation, water purification, and pollination, is looking at the agricultural system as a landscape. Landscape level approaches require looking at patches of native vegetation in a matrix of non-native or “human-altered” landscapes. Because of this view, the patch-corridor-matrix model developed (Forman 1995; Hobbs 2005) allowing biotic movement between patches of native vegetation. These corridors are now often included in conservation management. Population persistence depends on factors including amount of habitat available, the distribution of patch sizes, and the connectivity of the matrix (Wiens 1996; Hobbs 2005). Landscape vision can enhance services without compromising yield by maintaining semi-permanent landscape elements such as maintenance of hedgerows, woodlands, or permanent grasslands in the landscape matrix.
Pollination services (Carpenter et al. 1998; Tilman 1999; Tilman et al. 2002), biocontrol agents, and diversity of insects, birds, and bats, and flood mitigation services often come from forests, wetlands, and other native vegetation near agricultural systems. As such, agricultural systems should be viewed as one system that includes areas of non-cultivated fields, shelterbelt, meadows, and small waterways. Mosaic agriculture provides natural biocontrol agents in the form of parasites and pests of herbivorous insects providing a natural means of pest control (Ryszkowski 1995). There are complications to this technique, concerning the size of native patches and how large corridors have to be to perpetuate biodiversity and ecosystem services (Ricketts 2004), but at least a landscape approach brings agricultural systems one step closer to sustainable systems. The next step is to manage the crop plots to be as hospitable to a wide array of species as possible. If agriculture plots are hostile to species, then having patches of native vegetation may not provide significant levels of services (Brontons et al. 2005).
Finally, a third management techniques that promotes a number of ecosystem services including fertile soils, water purification, and flood mitigation, is contour farming. Contour farming reduces the rate of runoff from agricultural systems by growing crops at 90-degree angles to the water flow. Crop rows follow the angle of the slope rather than running linearly. Slowing flow reduces erosion and slows the flow of runoff allowing for greater filtration of particulates.
Advantages to Ecosystem Service ManagementManaging for ecosystem services on agricultural lands is advantageous to individual landowners as well as to a broader community and to the globe (Table 2). For the individual farmer, managing for ecosystem services can reduce the need to use pesticides, herbicides, and fertilizers all products whose use requires both money and time. Managing for pollination and soil fertility services can actually enhance yield. Additionally, numerous ecosystem services require stable soils, and stable soils result in enhanced yield. Thus, farmers can benefit economically from managing for ecosystem services. More broadly, ecosystem services provide the basic requirements for healthy, human life. Clean water, stable climate, food production, and recreation are only some of the many advantages to humans from ecosystem service management on agricultural lands (Table 2).
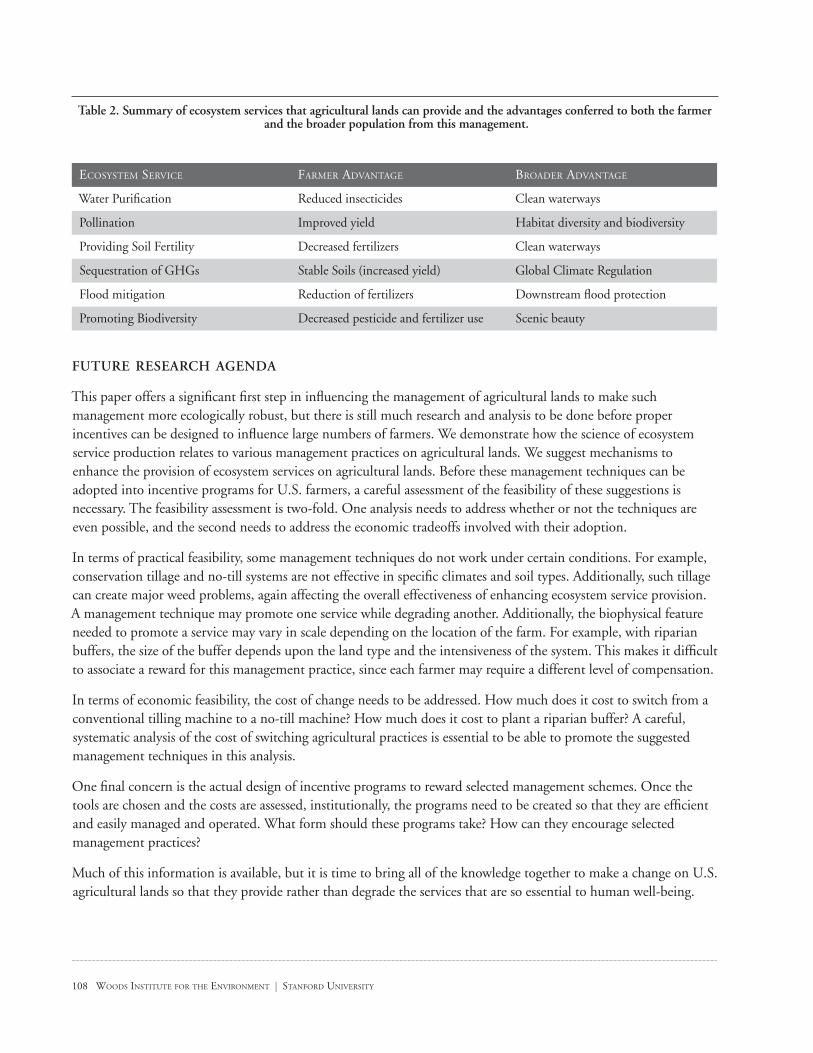
108 WOODS INSTITUTE FOR THE ENVIRONMENT | STANFORD UNIVERSITY
Table 2. Summary of ecosystem services that agricultural lands can provide and the advantages conferred to both the farmer and the broader population from this management.
ECOSYSTEM SERVICE FARMER ADVANTAGE BROADER ADVANTAGE
Water Purification Reduced insecticides Clean waterways
Pollination Improved yield Habitat diversity and biodiversity
Providing Soil Fertility Decreased fertilizers Clean waterways
Sequestration of GHGs Stable Soils (increased yield) Global Climate Regulation
Flood mitigation Reduction of fertilizers Downstream flood protection
Promoting Biodiversity Decreased pesticide and fertilizer use Scenic beauty
FUTURE RESEARCH AGENDA
This paper offers a significant first step in influencing the management of agricultural lands to make such management more ecologically robust, but there is still much research and analysis to be done before proper incentives can be designed to influence large numbers of farmers. We demonstrate how the science of ecosystem service production relates to various management practices on agricultural lands. We suggest mechanisms to enhance the provision of ecosystem services on agricultural lands. Before these management techniques can be adopted into incentive programs for U.S. farmers, a careful assessment of the feasibility of these suggestions is necessary. The feasibility assessment is two-fold. One analysis needs to address whether or not the techniques are even possible, and the second needs to address the economic tradeoffs involved with their adoption.
In terms of practical feasibility, some management techniques do not work under certain conditions. For example, conservation tillage and no-till systems are not effective in specific climates and soil types. Additionally, such tillage can create major weed problems, again affecting the overall effectiveness of enhancing ecosystem service provision. A management technique may promote one service while degrading another. Additionally, the biophysical feature needed to promote a service may vary in scale depending on the location of the farm. For example, with riparian buffers, the size of the buffer depends upon the land type and the intensiveness of the system. This makes it difficult to associate a reward for this management practice, since each farmer may require a different level of compensation.
In terms of economic feasibility, the cost of change needs to be addressed. How much does it cost to switch from a conventional tilling machine to a no-till machine? How much does it cost to plant a riparian buffer? A careful, systematic analysis of the cost of switching agricultural practices is essential to be able to promote the suggested management techniques in this analysis.
One final concern is the actual design of incentive programs to reward selected management schemes. Once the tools are chosen and the costs are assessed, institutionally, the programs need to be created so that they are efficient and easily managed and operated. What form should these programs take? How can they encourage selected management practices?
Much of this information is available, but it is time to bring all of the knowledge together to make a change on U.S. agricultural lands so that they provide rather than degrade the services that are so essential to human well-being.

U.S. Agricultural Policy and the 2007 Farm Bill 109
ReferencesAviron, S., F. Burel, J. Baudry, and N. Schermann. 2005.
Carabid assemblages in agricultural landscapes: impacts of habitat features, landscape context at different spatial scales and farming intensity. Agriculture Ecosystems & Environment 108:205–217.
Bengtsson, J., J. Ahnstrom, and A. C. Weibull. 2005. The effects of organic agriculture on biodiversity and abundance: a meta-analysis. Journal of Applied Ecology 42:261–269.
Benham, B. L., J. H. Robbins, K. M. Brannan, S. Mostaghimi, T. A. Dillaha, J. W. Pease, and E. P. Smith. 2005. Development of survey-like assessment toots to assess agricultural best management practice performance potential. Journal of Soil and Water Conservation 60:251–259.
Bernacchi, C. J., S. E. Hollinger, and T. Meyers. 2005. The conversion of the corn/soybean ecosystem to no-till agriculture may result in a carbon sink. Global Change Biology 11:1867–1872.
Boody, G., B. Vondracek, D. A. Andow, M. Krinke, J. Westra, J. Zimmerman, and P. Welle. 2005. Multifunctional agriculture in the United States. Bioscience 55:27–38.
Brotons, L., A. Wolff, G. Paulus, and J. L. Martin. 2005. Effect of adjacent agricultural habitat on the distribution of passerines in natural grasslands. Biological Conservation 124:407–414.
Calabuig, I. 2000. Solitary bees and bumble bees in a Danish agricultural landscape. Dissertation. University of Copenhagen, Zoological Institute, Denmark. ‹www.zmuc.dk/EntoWeb/staff/ICalabuig/PhD_thesis_Isabel_Calabuig.pdf›.
Carpenter, S. R., N. F. Caraco, D. L. Correll, R. W. Howarth, A. N. Sharpley, and V. H. Smith. 1998. Nonpoint pollution of surface waters with phosphorus and nitrogen. Ecological Applications 8:559–568.
Cederwall, K., and M. Brandt. 2002. Workshop 6 (synthesis): linking between flood risks and land use changes. Water Science and Technology 45:181–182.
Daily, G. 1997. What are Ecosystem Services? Page 392 in G. Daily, editor. Nature’s Services—Societal Dependence on Natural Ecosystems. Island Press, Washington, D.C.
Daily, G. C., P. R. Ehrlich, and G. A. Sanchez-Azofeifa. 2001. Countryside biogeography: Use of human-dominated habitats by the avifauna of southern Costa Rica. Ecological Applications 11:1–13.
Daily, G. C., G. Ceballos, J. Pacheco, G. Suzan, and A. Sanchez-Azofeifa. 2003. Countryside biogeography of neotropical mammals: Conservation opportunities in agricultural landscapes of Costa Rica. Conservation Biology 17:1814–1826.
De Marco, P., and F. M. Coelho. 2004. Services performed by the ecosystem: forest remnants influence agricultural cultures’ pollination and production. Biodiversity and Conservation 13:1245–1255.
Desjardins, R. L., W. Smith, B. Grant, C. Campbell, and R. Riznek. 2005. Management strategies to sequester carbon in agricultural soils and to mitigate greenhouse gas emissions. Climatic Change 70:283–297.
Goldman, R. L., B. H. Thompson, and G. C. Daily. in press. Institutional incentives for managing the landscape: inducing cooperation for the production of ecosystem services. Ecological Economics.
Firbank, L. G. 2005. Striking a new balance between agricultural production and biodiversity. Annals of Applied Biology 146:163–175.
Forman, R. T. T. 1995. Some General-Principles of Landscape and Regional Ecology. Landscape Ecology 10:133–142.
Hatton, T. J., J. Ruprecht, and R. J. George. 2003. Preclearing hydrology of the Western Australia wheatbelt: Target for the future? Plant and Soil 257:341–356.
Hobbs, R. J. 2005. Landscapes, ecology and wildlife management in highly modified environments—an Australian perspective. Wildlife Research 32:389–398.
Horner-Devine, M. C., G. C. Daily, P. R. Ehrlich, and C. L. Boggs. 2003. Countryside biogeography of tropical butterflies. Conservation Biology 17:168–177.
Hughes, J. B., G. C. Daily, and P. R. Ehrlich. 2002. Conservation of tropical forest birds in countryside habitats. Ecology Letters 5:121–129.
Kremen, C., N. M. Williams, and R. W. Thorp. 2002. Crop pollination from native bees at risk from agricultural intensification. Proceedings of the National Academy of Sciences of the United States of America 99:16812–16816.
Kremen, C., N. M. Williams, R. L. Bugg, J. P. Fay, and R. W. Thorp. 2004. The area requirements of an ecosystem service: crop pollination by native bee communities in California. Ecology Letters 7:1109–1119.

110 WOODS INSTITUTE FOR THE ENVIRONMENT | STANFORD UNIVERSITY
Lal, R. 2004. Agricultural activities and the global carbon cycle. Nutrient Cycling in Agroecosystems 70:103–116.
MA (Millennium Ecosystem Assessment). 2005. Ecosystems and Human well being: Current State and Trends, volume 1. Island Press, Washington D.C.
Mayfield, M. M., and G. C. Daily. 2005. Countryside biogeography of neotropical herbaceous and shrubby plants. Ecological Applications 15:423–439.
Moore, A. A., and M. A. Palmer. 2005. Invertebrate biodiversity in agricultural and urban headwater streams: Implications for conservation and management. Ecological Applications 15:1169–1177.
Morandin, L. A., and M. L. Winston. 2005. Wild bee abundance and seed production in conventional, organic, and genetically modified canola. Ecological Applications 15:871–881.
O’Toole, C. 1993. Diversity of native bees and agroecosystems. Pages 169–196 in J. La Salle and I. D. Gould, editors. Hymenoptera and biodiversity. CAB International, London, UK.
Post, W. M., R. C. Izaurralde, J. D. Jastrow, B. A. McCarl, J. E. Amonette, V. L. Bailey, P. M. Jardine, T. O. West, and J. Z. Zhou. 2004. Enhancement of carbon sequestration in U.S. soils. Bioscience 54:895–908.
Ricketts, T. H., G. C. Daily, P. R. Ehrlich, and J. P. Fay. 2004. Countryside biogeography of moths in a fragmented landscape: Biodiversity in native and agricultural habitats. Conservation Biology 15:378–388.
Ricketts, T. H. 2004. Tropical forest fragments enhance pollinator activity in nearby coffee crops. Conservation Biology 18:1262–1271.
Robertson, G. P., J. C. Broome, E. A. Chornesky, J. R. Frankenberger, P. Johnson, M. Lipson, J. A. Miranowski, E. D. Owens, D. Pimentel, and L. A. Thrupp. 2004. Rethinking the vision for environmental research in U.S. agriculture. Bioscience 54:61–65.
Robertson, G. P., and S. M. Swinton. 2005. Reconciling agricultural productivity and environmental integrity: a grand challenge for agriculture. Frontiers in Ecology and the Environment 3:38–46.
Roubik, D. W., D. Yanega, M. Aluja, S. L. Buchmann, and D. W. Inouye. 1995. On Optimal Nectar Foraging by Some Tropical Bees (Hymenoptera, Apidae). Apidologie 26:197–211.
Ryszkowski, L. 1995. Managing ecosystem services in agricultural landscapes. Nature & Resources 31:27–36.
Salzman, J., B. Thompson, and G. Daily. 2001. Protecting Ecosystem Services: Science,
Economics, and Law. Stanford Environmental Law Journal 20:309–332.
Shuler, R. E., T. H. Roulston, and G. E. Farris. 2005. Farming practices influence wild pollinator populations on squash and pumpkin. Journal of Economic Entomology 98:790–795.
Smith, K. A., and F. Conen. 2004. Impacts of land management on fluxes of trace greenhouse gases. Soil Use and Management 20:255–263.
Sumelius, J., S. Backman, and T. Sipilainen. 2005. Agri-environment problems before and during transition. Sociologia Ruralis 45:153-+.
Suwanwaree, P., and G. P. Robertson. 2005. Methane oxidation in forest, successional, and no-till agricultural ecosystems: Effects of nitrogen and soil disturbance. Soil Science Society of America Journal 69:1722–1729.
Tilman, D. 1999. Global environmental impacts of agricultural expansion: The need for sustainable and efficient practices. Proceedings of the National Academy of Sciences of the United States of America 96:5995–6000.
Tilman, D., J. Fargione, B. Wolff, C. D’Antonio, A. Dobson, R. Howarth, D. Schindler, W. H. Schlesinger, D. Simberloff, and D. Swackhamer. 2001. Forecasting agriculturally driven global environmental change. Science 292:281–284.
Tilman, D., K. G. Cassman, P. A. Matson, R. Naylor, and S. Polasky. 2002. Agricultural sustainability and intensive production practices. Nature 418:671–677.
Tscharntke, T., A. M. Klein, A. Kruess, I. Steffan-Dewenter, and C. Thies. 2005. Landscape perspectives on agricultural intensification and biodiversity—ecosystem service management. Ecology Letters 8:857–874.
U.S. Army Corp of Engineers. 1995. Floodplain Management Assessment of the Upper Mississippi River and Lower Missouri Rivers and Tributaries, vol. 6 Washington (DC): USACE
Vagen, T. E., R. Lal, and B. R. singh. 2005. Soil carbon sequestration in sub-Saharan Africa: A review. Land degradation and development 16:53–71.
Weins, J. J. 1995. Polymorphic characters in phylogenetic systematics. Systematic Biology 44:482–500.
Westphal, C., I. Steffan-Dewenter, and T. Tscharntke. 2003. Mass flowering crops enhance pollinator densities at a landscape scale. Ecology Letters 6:961–965.
Woods, W. I. 2004. Population nucleation, intensive agriculture, and environmental degradation: The Cahokia example. Agriculture and Human Values 21:255–261.
U.S. Agricultural Policy and the 2007 Farm Bill 111
Appendix A—DefinitionsContour plowing—method of plowing that creates rows of crops around the sides of a hall rather than up and down. This plowing method means keeping right angles to the direction of the slope, which is a bit harder and possibly more dangerous than the old up and down techniques. The major benefits include slowing runoff and slowing erosion.
Filter strips—vegetative growth, planted or indigenous, that lies between a potential pollutant-source area and a surface-water body that received runoff (same as buffer strip). Such strips trap sediments, plant nutrients, and chemicals in runoff. Best vegetation has dense top-growth and stable, fibrous roots.
Precision agriculture—farming that uses the best available technologies such as GPS, sensors, and satellites to incorporate very detailed and precise management techniques. Technology is used to collect information that will help define each field’s greatest needs based on biological conditions.
Riparian buffer—this is the area of land next to a stream and includes both its banks and its floodplain. This is an area that is especially valuable to reforest or to plant riparian strips, as it is critical for purifying waterways.
Riparian Strip—riparian strips are areas of trees, shrubs, and vegetative growth located at the boundary of land and water. They are especially useful in areas of high erosion to help stabilize shorelines.
Rotational cropping—varying crops in a landscape in order to maintain soil fertility, increase crop yields, and eradicate weeds, insects, and plant diseases.
Shelter belts—wind barriers achieved by planting trees. The distance between trees and the general layout of the belt depends on the type of slope and type of crop that is planted. Growing shelter belts requires careful planning and management, but such belts have multiple benefits, including habitat diversity, erosion reduction, and increases in crop productivity.
Tillage—cultivation of soil by plowing and sowing to prepare the soil for seeding. Primary tillage loosens the soil and mixes in fertilizers. Secondary tillage makes a finer soil and can shape rows.
Conservation tillage—tillage that leaves plant residues on the soil surface that help with erosion control and moisture conservation. Generally, at least 30 percent of the soil surface must remain covered with residue to classify as conservation tillage.

112 WOODS INSTITUTE FOR THE ENVIRONMENT | STANFORD UNIVERSITY
U.S. Agricultural Policy and the 2007 Farm Bill 113
CHAPTER III-2
U.S. Agriculture Conservation Policy & Programs: History, Trends, and Implications
Craig Cox
IntroductionThe environmental implications of U.S. agricultural conservation policy, programs, and institutions are enormous. Cropland, pasture, and rangeland make up more than 50 percent of the land area in the continental United States. Nearly all of that land is held in private ownership by millions of individuals whose decisions determine whether their land is a source of environmental problems or a force for environmental improvement.
The U.S. Farm Bill—and the resulting policy, programs, and institutions under the purview of the U.S. Department of Agriculture (USDA)—have tremendous influence on the decisions private landowners make about agricultural landscapes. The 2002 Farm Bill increased spending on USDA conservation and environmental programs to over $4 billion a year, far outstripping any other federal funding source for conservation on private land. The arcane U.S. system of crop and farm income subsidies spends between $10 and $20 billion a year. This complex and often conflicting mix of policy, programs, and institutions is the most direct federal intervention—for good or ill—on the private agricultural landscape in the United States.
This chapter deals with the conservation and environmental policy, programs, and institutions shaped by U.S. Farm Bills and USDA. It covers three main topics: (1) early and recent history of USDA conservation policy and programs, (2) current status of and trends in those policies and programs, and (3) implications of current status and trends for future conservation policy and programs.
U.S. agricultural policy has its roots in the New Deal—a time of turmoil and innovation in federal policy. U.S. agricultural policy is now experiencing another period of turmoil as it adjusts to major shifts in the structure of the agricultural sector, globalization, trade, and the demographics of the U.S. population. Agricultural conservation policy is also in turmoil as it struggles to adapt to a daunting new challenge—managing the off-farm, environmental effects of modern farming and ranching systems. The new conservation funding and authorities in the 2002 Farm Bill created an historic opportunity for rapid progress in improving environmental quality in agricultural landscapes. The 2002 Farm Bill also increased the turmoil in agricultural conservation policy by revealing weaknesses in the conservation programs and institutions responsible for using and implementing new funding and authorities. The author hopes this chapter will help make the current period of turmoil a period of innovation as well.

114 WOODS INSTITUTE FOR THE ENVIRONMENT | STANFORD UNIVERSITY
Early History U.S. agricultural conservation policy, programs, and institutions were formed in the 1930s, during the wave of policy and institutional innovation that marked the New Deal. In 1928, Hugh Hammond Bennett—a USDA soil scientist who was to become the prime mover behind agricultural conservation policy and programs—published a USDA circular entitled “Soil Erosion a National Menace.” He argued that soil erosion and soil degradation threatened not only the livelihoods of individual farmers, but the future of the nation as well. In his circular he argued that soil degradation from erosion is “a loss to posterity, and there are indications that our increasing population may feel acutely the evil effects of this scourge of the land, now largely unrestrained” (Rasmussen 1982).
In 1930, a line item inserted into the agriculture appropriations act at the urging of Bennett provided funds to study the causes of soil erosion and methods for its control. Bennett was put in charge of the USDA Bureau of Chemistry and Soils and established 10 regional soil erosion experiment stations. The New Deal National Industrial Recovery Act of June 16, 1933 authorized soil erosion control work as a means of unemployment relief through the Civilian Conservation Corps. Later that year, the Soil Erosion Service was created in the Department of Interior on an emergency basis. Bennett and several USDA technical experts were given leaves from USDA to run the new agency (Rasmussen 1982).
SOIL CONSERVATION ACT
In April 1935, driven by drought, dust storms, and Bennett’s advocacy, Congress passed the Soil Conservation Act that established the Soil Conservation Service (SCS) as a permanent agency of the federal government and housed it in USDA. The new agency shifted the focus of soil conservation work from research and demonstration projects to direct assistance to farmers. Local soil conservation districts were envisioned as the means by which technical experts would reach farms and ranches across the country. The creation of these novel institutions was fostered through model state legislation distributed to all states by President Roosevelt in 1937. Forty-one states passed model legislation by 1941 and all states had acted by 1947 (Rasmussen 1982).
SCS plus the newly formed conservation districts combined to build the technical and outreach infrastructure to deliver technical assistance on soil conservation and farm management in nearly every county in the United States. This new infrastructure, led by Hugh Hammond Bennett, focused on an integrated approach to soil conservation that combined vegetative, engineering, and crop and livestock management measures to control erosion. Strip cropping, terracing, drainage, crop rotation, contouring, pasture improvement, controlled grazing, tree planting and other measures became part of farm conservation plans. Assessment, planning, technical assistance and education were used to develop and implement farm conservation plans. There was no financial assistance to farmers to “share-the-cost” of implementation and maintenance of plans.
Financial assistance for conservation evolved along an entirely different pathway. In 1933—even as SCS was being formed as a permanent agency with a specific program and approach based on the delivery of technical services—the U.S. Supreme Court was reviewing the Agricultural Adjustment Act of 1933. That act created a combination of supply control and price support mechanisms to reduce crop surpluses and enhance farm income. In 1936, the U.S. Supreme Court ruled that the Agricultural Adjustment Act was unconstitutional, stating that that Act was “a statutory plan to regulate and control agricultural production, a matter beyond the power delegated to the federal government” (Rasmussen 1972 as cited by Rasumssen 1982). Policymakers looked for other means to provide economic support to farmers they thought the Court would bless. Soil conservation became that means (Rasmussen 1982).
U.S. Agricultural Policy and the 2007 Farm Bill 115
SOIL CONSERVATION & DOMESTIC ALLOTMENT ACT
In February 1936, less than a year after creating the SCS, Congress passed the Soil Conservation and Domestic Allotment Act. That act provided payments to farmers to shift acreage from “surplus” crops to soil-conserving legumes and grasses. In addition, payments could also be made for “soil building” and productivity-enhancing practices on land that remained in production. The combination of land retirement and enhanced productivity was intended support farm income by raising prices and increasing yields. The program—known as the Agricultural Conservation Program (ACP)—was implemented through “agricultural adjustment committees,” another county-based institution that was separate and different from the conservation districts that were also being formed. The law provided such financial aid only as a temporary emergency measure. Beginning in 1938, The Secretary of Agriculture was to make grants to states to carry out comparable programs. But Congress repeatedly extended federal control of the program and eliminated the state administration authority in 1962 (Rasmussen 1982).
In less than one year, then, Congress created the federal Soil Conservation Service, with county-based conservation districts as local counterparts, and created the Agricultural Adjustment Administration, with county-based agricultural adjustment committees as local counterparts—the bifurcated and often conflicting set of institutions, policies, and programs that has characterized agricultural conservation for nearly seven decades. Financial assistance for conservation—largely as a means to manage supply, raise prices and increase profitability—moved through one set of institutions and policy. Technology development and transfer designed to support soil conservation through education and technical assistance moved through a different set of institutions and policy.
Recent HistoryThe environmental movement began in the late 1960s in the United States, but environmentalism did not really enter farm policy and politics until 1985. However, there were indications of what was to come later. For decades, the Agricultural Conservation Program (ACP) had provided cost-share assistance to farmers to undertake
“conservation” measures that bolstered the productivity of their farms and ranches. The program provided covered 50 percent or more of the cost of implementing practices with minimal or even negative environmental effects such as land-leveling for irrigation, application of lime and fertilizer, construction of ponds to store water for irrigation or livestock, construction of drainage ditches, and eliminating sagebrush on rangelands. The Food and Agriculture Act of 1977, however, specified that eligibility for assistance under ACP should be based on whether there was an environmental problem on the farm that either reduced the productive capacity of land and water resource or caused environmental degradation. The Act went on to specify that the Secretary, in developing the ACP, should consider the need to control erosion and sedimentation, to conserve water resources, to control pollution from animal wastes, to encourage voluntary compliance in solving environmental problems, and to consider the degree to which ACP assistance would contribute to a continuous supply of food and fiber and to improved water quality in rural America (Rasmussen 1982).
The 1985 Farm Bill accelerated the introduction of environmental concerns into agricultural policy and marked the beginning of what has become the most important development in agricultural conservation policy and programs since the New Deal—the transition from a focus on productivity-enhancing, agricultural-resource conservation with large “on-farm” benefits to environmental management and improvement with large “off-farm” benefits.

116 WOODS INSTITUTE FOR THE ENVIRONMENT | STANFORD UNIVERSITY
The 1936 Soil Conservation and Domestic Allotment Act set out the following purposes and priorities for agricultural conservation:
• Preservation and improvement of soil fertility
• Promotion of economic use and conservation of land
• Diminution of exploitation and wasteful and unscientific use of national soil resources
• Protection of navigability of rivers and harbors and flood prevention
• Restoration of parity in purchasing power of net farm and non-farm income.
This productivity-oriented conception of conservation, referred to in this chapter as agricultural resource conservation, worked very well in the early years of the conservation movement. Consider that during the New Deal, half of the U.S. population lived in rural areas and over 20 percent of the U.S. workforce was employed on farms. About 8 percent of U.S. gross domestic product was from farming, and only about 30 percent of farmers worked off farm for an average of 100 days. In addition, farm household income was much lower than national household income (Dimitri et al. 2005). Increasing the productivity of agriculture could and did have big impacts on farm household income and the overall economy.
At the outset, then, there was a large and useful overlap between private and public goods produced by agricultural resource conservation policy and programs that emphasized on-farm benefits such as improved productivity and profitability. That overlap shrunk in succeeding decades as the demographics and structure of farming changed and with the advent of the environmental movement in the United States.
Today (2002) less than 25 percent of the U.S. population lives in rural areas, and less than 2 percent of U.S. households are on farms. Only 1.9 percent of the U.S. workforce is employed in farming, and the farming share of U.S. gross domestic product is 0.7 percent. Ninety-three percent of farm households had off-farm income, and mean farm household income is generally greater than mean U.S. household income (Dimitri et al. 2005). The policy rationale for linking productivity-enhancing resource conservation and farm household income, rural community vitality, or the overall U.S. economy is much weaker today than it was in the 1930s. The overlap between public and private goods produced by agricultural resource conservation has shrunk proportionally.
That overlap has shrunk further as the public began looking to conservation less for productivity enhancement and more for clean water, clean air, and wildlife habitat. The recent history of U.S. conservation policy and programs is largely a story of attempts to reorient policy and programs from agricultural resource conservation to agricultural environmental management—managing the “off-farm” environmental effects of agriculture such as clean water, clean air, biodiversity, and a host of other ecological goods and services.

U.S. Agricultural Policy and the 2007 Farm Bill 117
Summary of conservation initiatives in recent Farm Bills
FARM BILL MAJOR INITIATIVES
1985 Food Security Act
Conservation compliance that required erosion control on highly erodible land and prohibited draining wetlands in return for receiving crop subsidies.
Created the Conservation Reserve Program to control supply of surplus crops and to take highly erodible land out of production.
1990 Food, Agriculture, Conservation and Trade Act
Created Wetlands Reserve Program to acquire permanent easements to restore wetlands on agricultural land.
Created the Water Quality Incentives Program to assist producers implement pollution prevention measures on farms and ranches.
Farmland Protection Act requiring USDA to monitor loss of farmland to development and to assess the impact of federal policy on rates of farmland loss.
1996 Food and Agriculture Improvement Act
Created the Environmental Quality Incentives Program to assist producers in meeting federal, state, and local environmental regulations and to prevent the need for expanded regulatory measures by meeting environmental standards through voluntary incentives.
Funded conservation programs through the Commodity Credit Corporation—the same mandatory funding mechanism used to fund crop subsidies and income support programs.
Created the Farmland Protection Program providing federal funds to local entities to purchase development rights to preserve farmland.
2002 Farm Security and Rural Investment Act
Provided a six-fold increase in funding for the Environmental Quality Incentives Program (from $200 million to $1.3 billion annually), and nearly doubled total conservation program funding.
Created the Conservation Security Program—an attempt to provide a stewardship-based alternative to crop subsidies as a means of supporting farm income.
Created the Technical Service Provider initiative to facilitate using private sector, NGO, and other nonfederal sources of technical assistance to implement conservation programs.
FOOD SECURITY ACT
The Food Security Act of 1985 was a turning point in agricultural conservation policy. The Act included major innovations that tied receipt of federal crop subsidies to measures of environmental and conservation performance and brought large land reserves back into agricultural policy:
• Conservation Compliance required that producers growing subsidized crops on highly erodible land do so using soil conservation measures that resulted in significant reduction in soil erosion.
• Sodbuster required that producers that converted grassland to cropland to produce subsidized crops must do so under a soil conservation measures that reduced erosion to a “tolerable” level.
• Wetland Conservation (Swampbuster) provision threatened producers with a loss in crop subsidies if they drained wetlands to produce subsidized crops.
• Conservation Reserve Program provided annual rental payments to producers who converted highly erodible or otherwise environmentally sensitive lands to permanent vegetative cover.
In the case of Conservation Compliance and Sodbuster, the enemy was the same one that had guided agricultural conservation policy since the 1930s—soil erosion and land degradation. The reason to fight the enemy was different, however. In 1985, sediment in streams was more important than soil productivity. The off-site environmental cost of erosion rather than the on-site damage to agricultural production was the rationale for action.

118 WOODS INSTITUTE FOR THE ENVIRONMENT | STANFORD UNIVERSITY
The Conservation Reserve Program (CRP) was similar, initially, to earlier efforts to marry soil erosion concerns with reducing the production of surplus crops. The targeting criteria used in early sign-ups to ensure only the most highly-erodible cropland was enrolled were quickly relaxed to ensure supply control objectives were met.
Swampbuster was the clearest indication of the advent of environmentalism. Farm subsidies were now denied for doing what we had once used conservation programs to encourage—draining wetlands to improve soil productivity. It was no surprise, then, that the Swampbuster provisions were the most controversial of the compliance provisions.
FOOD, AGRICULTURE, CONSERVATION AND TRADE ACT
The 1990 Farm Bill continued to reorient agricultural conservation programs from agricultural resource conservation to agricultural environmental management. The Wetlands Reserve Program (WRP) took Swampbuster one step further by creating a major federal program to restore wetlands. The 1990 Act created the Water Quality Incentives Program (WQIP) that signaled the emergence of water quality as a primary environmental objective of agricultural conservation programs. The program, eventually implemented as a subset of the venerable ACP, proved to be a precursor of the Environmental Quality Incentives Program (EQIP) that would replace ACP in the next Farm Bill. In addition, the 1990 Act included provisions known as the Farmland Protection Act that created a federal role in tracking the loss of farmland in the United States.
In 1994, an Act reorganizing USDA changed the name of the Soil Conservation Service to the Natural Resources Conservation Service (NRCS). This name change, at first glance merely semantic, was driven by a serious policy debate between those who saw an expanded role for the agency in addressing agriculture’s broad environmental agenda and those who preferred—and still prefer—a more narrow traditional focus on enhancing agricultural productivity.
FEDERAL AGRICULTURE IMPROVEMENT AND REFORM ACT
By 1996, when the “1995 Farm Bill” was passed, the environmental agenda had gained greater weight in agricultural policy. The 1996 Act replaced ACP, the Agricultural Conservation Program with EQIP, the Environmental Quality Incentives Program by de-authorizing, consolidating, and expanding the purposes and authorities of ACP, the Water Quality Incentives Program, the Great Plains Conservation Program, and the Colorado River Salinity Control Program. Conservation compliance provisions were weakened, or made more flexible depending on one’s point of view, by creating additional criteria for granting waivers to producers who otherwise would lose crop subsidy payments. In addition, the 1996 Act created the Farmland Protection Program (FPP) and accelerated the transformation of CRP into a program dominated by environmental rather than supply control objectives. The 1996 Act led to administrative innovation, creating the continuous-CRP program (C-CRP) and the Conservation Reserve Enhancement Program (CREP)—important and ongoing initiatives that targeted CRP acres to the most environmental sensitive lands. The greater emphasis on environmental quality achieved in the 1996 Farm Bill was driven by three factors: (1) growing recognition among agricultural interest that environmental quality was an increasingly important determinant of long-term commercial viability of agriculture, (2) aggressive involvement by components of agriculture, particularly livestock producers, that do not benefit from crop subsidies but do benefit from conservation programs and that confronted serious environmental challenges, and (3) much broader involvement of national environmental groups that made farm bill legislation one of their top priorities.
More important, the 1996 Act shifted conservation funding to the Commodity Credit Corporation (CCC)—the “bank” used to fund crop subsidies. This action moved conservation funding from discretionary budget accounts under the control of annual appropriations committees to mandatory budget accounts under the control of

U.S. Agricultural Policy and the 2007 Farm Bill 119
authorizing committees. The change in budget account protected conservation programs, at least initially, from the growing pressure to reduce discretionary spending as the proportion of the federal budget taken up by mandatory entitlement spending grew at unprecedented rates. More important, the change in budget account set the stage for the large increases in conservation funding that would occur in 2002 and signaled early discussion of a transformation of crop subsidies into “green payments.” Moving conservation programs into the same budget account as crop subsidies made it easier to shift funding from crop subsidies to “green payments.” The significance of including conservation programs in the CCC was magnified because the 1996 Act also mandated a phase-out of crop subsidies. The 1996 Act introduced “direct payments” that “decoupled” subsidies from “counter-cyclical” measures that tied subsides to the price and yield of subsidized commodities. Moreover, direct payments were scheduled to gradually decline over the life of the 1996 Act to make a transition from subsidies to the free market. Steep declines in market prices of subsidized commodities, however, in the years following passage of the 1996 Act led to use of annual “disaster” programs to make up for the loss in counter-cyclical payments. The phase-out of direct payments and other subsidies never occurred.
FARM SECURITY AND RURAL INVESTMENT ACT
The environmental agenda came to the fore in the 2002 Farm Bill. The 2002 Act explicitly tied the purposes of financial assistance programs to environmental objectives. The statutory objectives of EQIP—the largest land management program—couldn’t be more different than those listed earlier for ACP. EQIP is intended to harmonize agriculture and the environment by:
• Assisting producers complying with local, state, and national regulatory requirements
• Avoiding the need for resource and regulatory programs by assisting producers in meeting environmental quality criteria established by federal, state, tribal, and local agencies
• Providing flexible assistance to producers to enhance soil, water, and related natural resources (including grazing land and wetland) and wildlife while sustaining production of food and fiber
• Assisting producers to make beneficial, cost-effective changes to cropping systems, grazing management, and nutrient management associated with livestock, pest, or irrigation management
• Consolidating and streamlining conservation planning and regulatory compliance processes to reduce administrative burdens on producers and the cost of achieving environmental goals.
In a little more than 15 years (1985 to 2002), then, the stated objectives of conservation activities within USDA have been fundamentally transformed. The objectives of conservation policy have shifted from a focus on productivity-enhancing, agricultural-resource conservation, with large “on-farm” benefits, to environmental management and improvement, with large “off-farm” benefits such as clean water, clean air, biodiversity, and a host of other ecological goods and services.
The Farm Security and Rural Investment Act of 2002 reinforced this fundamental change in purpose with historic increases in funding for the new agenda. Funding for conservation programs was increased 80 percent. Currently, EQIP is funded at $1.0 billion—over 25 times more funding than was scheduled for ACP only ten years ago.
Most important, the 2002 Act directed most of the new conservation funding to programs intended to improve the environmental performance of working farms and ranches rather than to programs such as CRP that take land out of agricultural production. Prior to 2002, the only major program tool available to deal with agriculture’s environmental agenda was CRP. That meant, in practice, that the major environmental solution we could offer agricultural producers was to quit farming. The limitations of this “solution” are obvious, especially since the
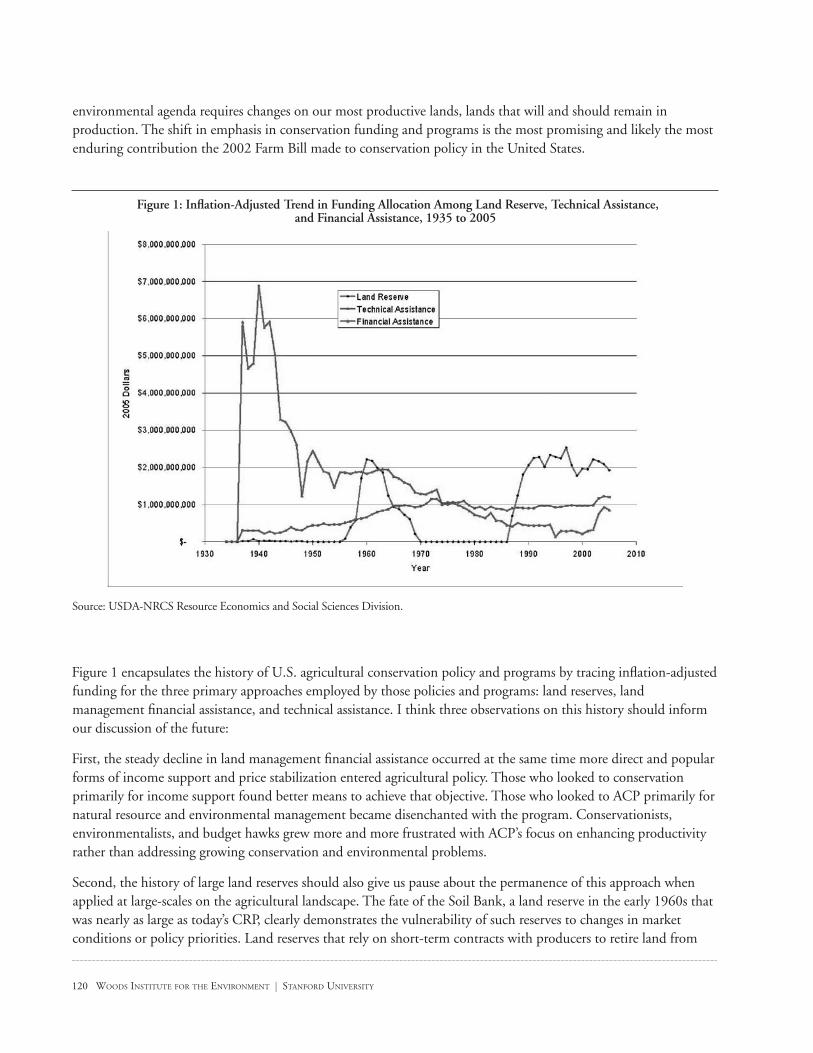
120 WOODS INSTITUTE FOR THE ENVIRONMENT | STANFORD UNIVERSITY
environmental agenda requires changes on our most productive lands, lands that will and should remain in production. The shift in emphasis in conservation funding and programs is the most promising and likely the most enduring contribution the 2002 Farm Bill made to conservation policy in the United States.
Figure 1: Inflation-Adjusted Trend in Funding Allocation Among Land Reserve, Technical Assistance, and Financial Assistance, 1935 to 2005
Source: USDA-NRCS Resource Economics and Social Sciences Division.
Figure 1 encapsulates the history of U.S. agricultural conservation policy and programs by tracing inflation-adjusted funding for the three primary approaches employed by those policies and programs: land reserves, land management financial assistance, and technical assistance. I think three observations on this history should inform our discussion of the future:
First, the steady decline in land management financial assistance occurred at the same time more direct and popular forms of income support and price stabilization entered agricultural policy. Those who looked to conservation primarily for income support found better means to achieve that objective. Those who looked to ACP primarily for natural resource and environmental management became disenchanted with the program. Conservationists, environmentalists, and budget hawks grew more and more frustrated with ACP’s focus on enhancing productivity rather than addressing growing conservation and environmental problems.
Second, the history of large land reserves should also give us pause about the permanence of this approach when applied at large-scales on the agricultural landscape. The fate of the Soil Bank, a land reserve in the early 1960s that was nearly as large as today’s CRP, clearly demonstrates the vulnerability of such reserves to changes in market conditions or policy priorities. Land reserves that rely on short-term contracts with producers to retire land from

U.S. Agricultural Policy and the 2007 Farm Bill 121
production can quickly disappear as concerns about high costs of ongoing annual rental payments grow and/or commodity prices rise.
Finally, the lack of investment in technical assistance is the single most troubling trend in Figure 1, and the trend that should receive the most attention as we consider the future of USDA conservation policy and programs. Inflation-adjusted funding for technical assistance has been flat since 1970, even as funding for conservation programs increased dramatically after 1985. This lack of investment in the conservation technical infrastructure is emerging as the most important constraint to progress on environmental management in agriculture. Unless we solve this problem, we will not be able to support any large-scale transition to green box measures to ensure the ecologic integrity of U.S. farmland.
I will discuss these and other implications for the future of USDA conservation policy and programs at the end of this paper.
Current Status and Trends Current USDA conservation policy and programs are characterized by (1) a multiplication of individual conservation programs, (2) a recent large increase in funding for those programs, and (3) the re-emergence of farm and ranch management programs as the major force affecting the agricultural landscape.
CURRENT FARM BILL CONSERVATION TITLE PROGRAMS
Table 1 briefly describes the 10 major USDA conservation programs that are currently active on the agricultural landscape. There are several more “minor” programs, including a handful of programs that have been deauthorized but still have active contracts in place with landowners. In 1985, there were less than five USDA conservation programs; today there are more than 25 major and minor programs. The creation of single-purpose programs has become a form of earmarking—a way to carve out a stream of federal funding to meet the needs and desires of a particular constituency and create legacies for particular members of Congress.
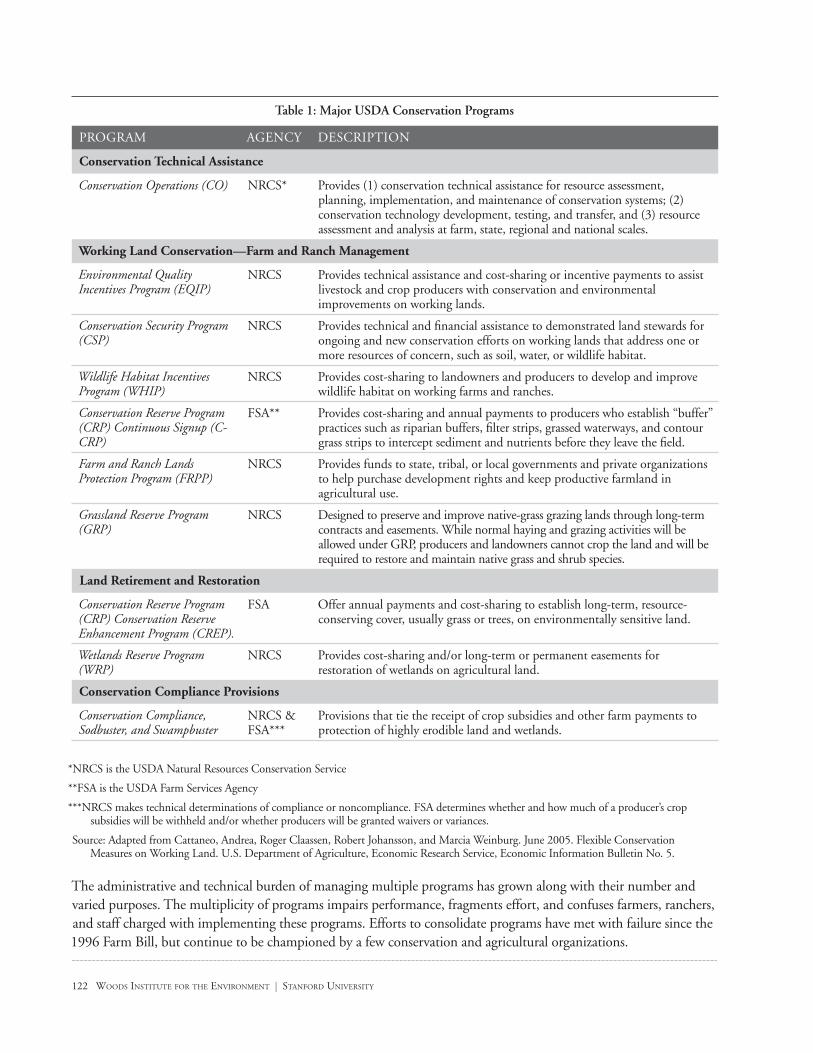
122 WOODS INSTITUTE FOR THE ENVIRONMENT | STANFORD UNIVERSITY
Table 1: Major USDA Conservation Programs
PROGRAM AGENCY DESCRIPTION
Conservation Technical Assistance
Conservation Operations (CO) NRCS* Provides (1) conservation technical assistance for resource assessment, planning, implementation, and maintenance of conservation systems; (2) conservation technology development, testing, and transfer, and (3) resource assessment and analysis at farm, state, regional and national scales.
Working Land Conservation—Farm and Ranch Management
Environmental Quality Incentives Program (EQIP)
NRCS Provides technical assistance and cost-sharing or incentive payments to assist livestock and crop producers with conservation and environmental improvements on working lands.
Conservation Security Program (CSP)
NRCS Provides technical and financial assistance to demonstrated land stewards for ongoing and new conservation efforts on working lands that address one or more resources of concern, such as soil, water, or wildlife habitat.
Wildlife Habitat Incentives Program (WHIP)
NRCS Provides cost-sharing to landowners and producers to develop and improve wildlife habitat on working farms and ranches.
Conservation Reserve Program (CRP) Continuous Signup (C-CRP)
FSA** Provides cost-sharing and annual payments to producers who establish “buffer” practices such as riparian buffers, filter strips, grassed waterways, and contour grass strips to intercept sediment and nutrients before they leave the field.
Farm and Ranch Lands Protection Program (FRPP)
NRCS Provides funds to state, tribal, or local governments and private organizations to help purchase development rights and keep productive farmland in agricultural use.
Grassland Reserve Program (GRP)
NRCS Designed to preserve and improve native-grass grazing lands through long-term contracts and easements. While normal haying and grazing activities will be allowed under GRP, producers and landowners cannot crop the land and will be required to restore and maintain native grass and shrub species.
Land Retirement and Restoration
Conservation Reserve Program (CRP) Conservation Reserve Enhancement Program (CREP).
FSA Offer annual payments and cost-sharing to establish long-term, resource-conserving cover, usually grass or trees, on environmentally sensitive land.
Wetlands Reserve Program (WRP)
NRCS Provides cost-sharing and/or long-term or permanent easements for restoration of wetlands on agricultural land.
Conservation Compliance Provisions
Conservation Compliance, Sodbuster, and Swampbuster
NRCS & FSA***
Provisions that tie the receipt of crop subsidies and other farm payments to protection of highly erodible land and wetlands.
*NRCS is the USDA Natural Resources Conservation Service
**FSA is the USDA Farm Services Agency
***NRCS makes technical determinations of compliance or noncompliance. FSA determines whether and how much of a producer’s crop subsidies will be withheld and/or whether producers will be granted waivers or variances.
Source: Adapted from Cattaneo, Andrea, Roger Claassen, Robert Johansson, and Marcia Weinburg. June 2005. Flexible Conservation Measures on Working Land. U.S. Department of Agriculture, Economic Research Service, Economic Information Bulletin No. 5.
The administrative and technical burden of managing multiple programs has grown along with their number and varied purposes. The multiplicity of programs impairs performance, fragments effort, and confuses farmers, ranchers, and staff charged with implementing these programs. Efforts to consolidate programs have met with failure since the 1996 Farm Bill, but continue to be championed by a few conservation and agricultural organizations.
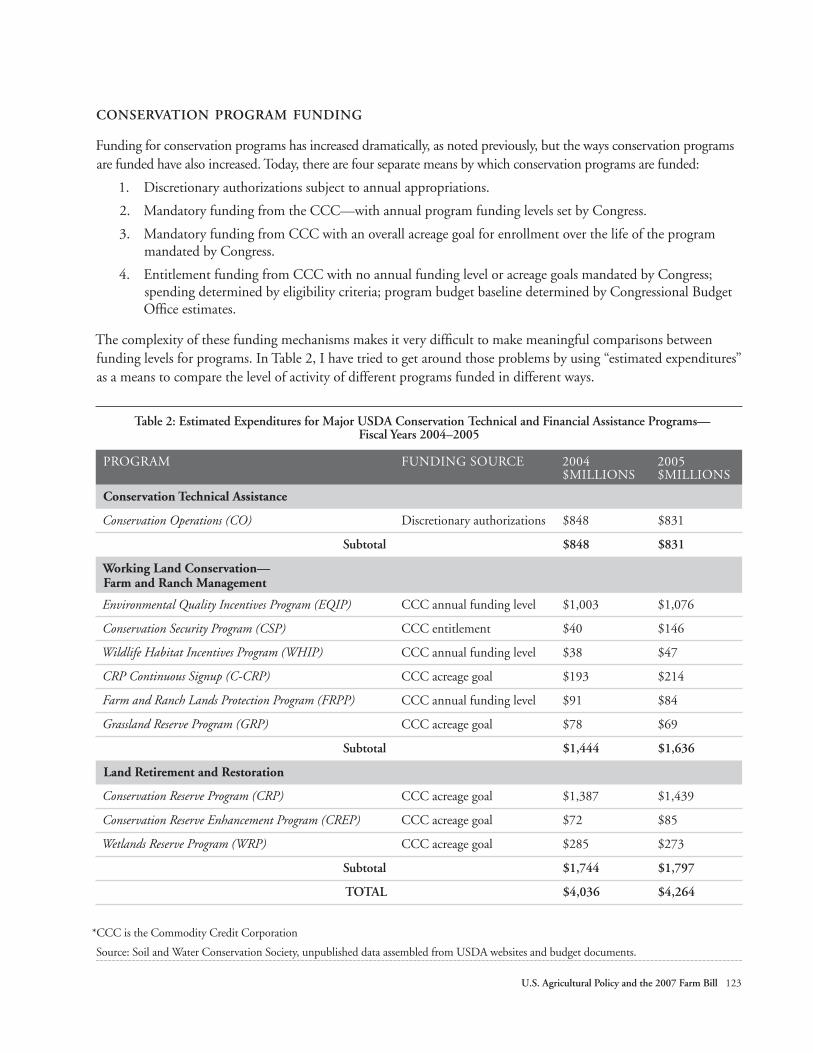
U.S. Agricultural Policy and the 2007 Farm Bill 123
CONSERVATION PROGRAM FUNDING
Funding for conservation programs has increased dramatically, as noted previously, but the ways conservation programs are funded have also increased. Today, there are four separate means by which conservation programs are funded:
1. Discretionary authorizations subject to annual appropriations.
2. Mandatory funding from the CCC—with annual program funding levels set by Congress.
3. Mandatory funding from CCC with an overall acreage goal for enrollment over the life of the program mandated by Congress.
4. Entitlement funding from CCC with no annual funding level or acreage goals mandated by Congress; spending determined by eligibility criteria; program budget baseline determined by Congressional Budget Office estimates.
The complexity of these funding mechanisms makes it very difficult to make meaningful comparisons between funding levels for programs. In Table 2, I have tried to get around those problems by using “estimated expenditures” as a means to compare the level of activity of different programs funded in different ways.
Table 2: Estimated Expenditures for Major USDA Conservation Technical and Financial Assistance Programs— Fiscal Years 2004–2005
PROGRAM FUNDING SOURCE 2004 $MILLIONS
2005 $MILLIONS
Conservation Technical Assistance
Conservation Operations (CO) Discretionary authorizations $848 $831
Subtotal $848 $831
Working Land Conservation— Farm and Ranch Management
Environmental Quality Incentives Program (EQIP) CCC annual funding level $1,003 $1,076
Conservation Security Program (CSP) CCC entitlement $40 $146
Wildlife Habitat Incentives Program (WHIP) CCC annual funding level $38 $47
CRP Continuous Signup (C-CRP) CCC acreage goal $193 $214
Farm and Ranch Lands Protection Program (FRPP) CCC annual funding level $91 $84
Grassland Reserve Program (GRP) CCC acreage goal $78 $69
Subtotal $1,444 $1,636
Land Retirement and Restoration
Conservation Reserve Program (CRP) CCC acreage goal $1,387 $1,439
Conservation Reserve Enhancement Program (CREP) CCC acreage goal $72 $85
Wetlands Reserve Program (WRP) CCC acreage goal $285 $273
Subtotal $1,744 $1,797
TOTAL $4,036 $4,264
*CCC is the Commodity Credit Corporation
Source: Soil and Water Conservation Society, unpublished data assembled from USDA websites and budget documents.

124 WOODS INSTITUTE FOR THE ENVIRONMENT | STANFORD UNIVERSITY
Note that three programs dominate the conservation budget—Conservation Operations and EQIP (managed by the Natural Resources Conservation Service, NRCS) and CRP (managed by the Farm Service Agency, FSA). Taken together, these three programs account for over 80 percent of the conservation budget.
Note also that the annual USDA conservation budget is over $4 billion. That budget dwarfs—by an order of magnitude—other budgets of other federal agencies related to conservation and environmental management on private land in the United States. The Soil and Water Conservation Society (SWCS), for example, is undertaking an analysis of potential sources of federal funding for water quality, water conservation, and watershed restoration projects. Figure 2 shows our results to date.
Figure 2: Sources of Federal Funding for Water Quality and Conservation
Source: Soil and Water Conservation Society unpublished data.
USDA-NRCS alone accounts for nearly half of the funding available for water quality, conservation, and watershed restoration. The annual funding for CRP, if used solely for such projects would contribute 39 percent of the federal total. Taken together, USDA programs under the purview of the Farm Bill provide 86 percent of the total federal funding potentially available for water quality, conservation, and watershed restoration projects. The Environmental Protection Agency (EPA) budgets under the purview of the Clean Water Act potentially provide 10 percent of the total federal funding. All other federal sources under the purview of various federal laws are less than 5 percent of the total.
USDA has emerged as the leading federal department, and USDA-NRCS the leading federal agency for conservation and environmental management on private land in the United States, at least as measured by the size of agency budgets.
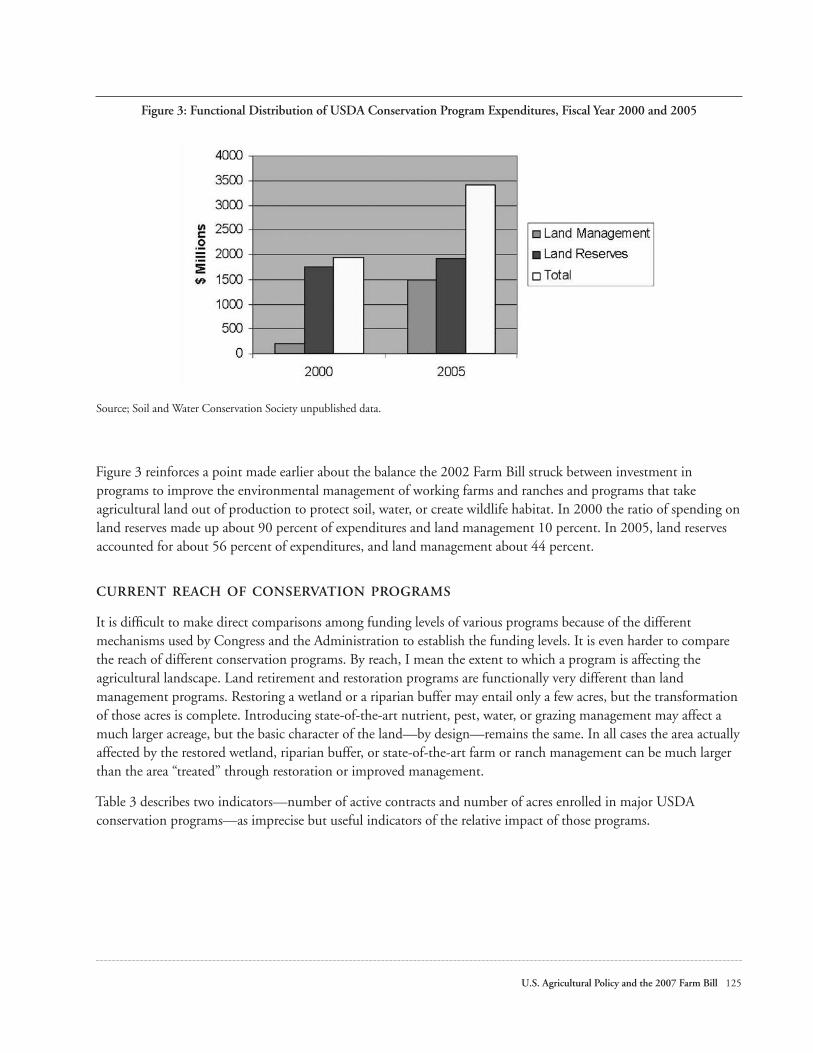
U.S. Agricultural Policy and the 2007 Farm Bill 125
Figure 3: Functional Distribution of USDA Conservation Program Expenditures, Fiscal Year 2000 and 2005
Source; Soil and Water Conservation Society unpublished data.
Figure 3 reinforces a point made earlier about the balance the 2002 Farm Bill struck between investment in programs to improve the environmental management of working farms and ranches and programs that take agricultural land out of production to protect soil, water, or create wildlife habitat. In 2000 the ratio of spending on land reserves made up about 90 percent of expenditures and land management 10 percent. In 2005, land reserves accounted for about 56 percent of expenditures, and land management about 44 percent.
CURRENT REACH OF CONSERVATION PROGRAMS
It is difficult to make direct comparisons among funding levels of various programs because of the different mechanisms used by Congress and the Administration to establish the funding levels. It is even harder to compare the reach of different conservation programs. By reach, I mean the extent to which a program is affecting the agricultural landscape. Land retirement and restoration programs are functionally very different than land management programs. Restoring a wetland or a riparian buffer may entail only a few acres, but the transformation of those acres is complete. Introducing state-of-the-art nutrient, pest, water, or grazing management may affect a much larger acreage, but the basic character of the land—by design—remains the same. In all cases the area actually affected by the restored wetland, riparian buffer, or state-of-the-art farm or ranch management can be much larger than the area “treated” through restoration or improved management.
Table 3 describes two indicators—number of active contracts and number of acres enrolled in major USDA conservation programs—as imprecise but useful indicators of the relative impact of those programs.
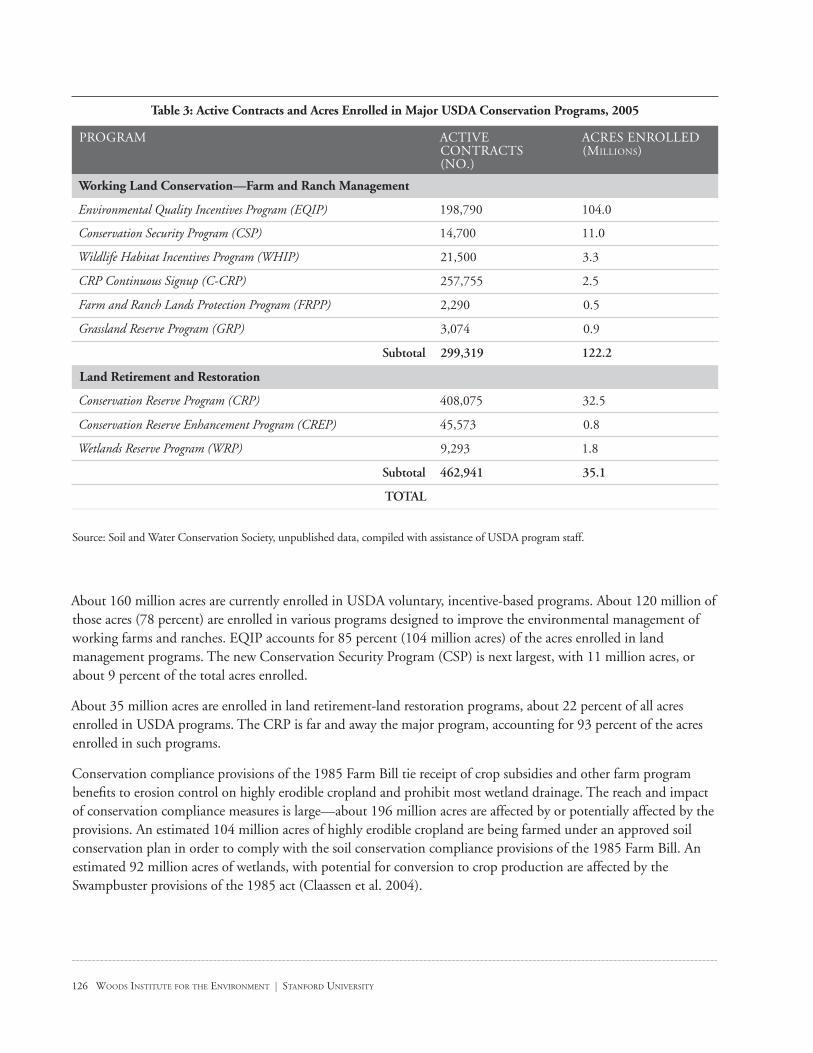
126 WOODS INSTITUTE FOR THE ENVIRONMENT | STANFORD UNIVERSITY
Table 3: Active Contracts and Acres Enrolled in Major USDA Conservation Programs, 2005
PROGRAM ACTIVE CONTRACTS (NO.)
ACRES ENROLLED (MILLIONS)
Working Land Conservation—Farm and Ranch Management
Environmental Quality Incentives Program (EQIP) 198,790 104.0
Conservation Security Program (CSP) 14,700 11.0
Wildlife Habitat Incentives Program (WHIP) 21,500 3.3
CRP Continuous Signup (C-CRP) 257,755 2.5
Farm and Ranch Lands Protection Program (FRPP) 2,290 0.5
Grassland Reserve Program (GRP) 3,074 0.9
Subtotal 299,319 122.2
Land Retirement and Restoration
Conservation Reserve Program (CRP) 408,075 32.5
Conservation Reserve Enhancement Program (CREP) 45,573 0.8
Wetlands Reserve Program (WRP) 9,293 1.8
Subtotal 462,941 35.1
TOTAL
Source: Soil and Water Conservation Society, unpublished data, compiled with assistance of USDA program staff.
About 160 million acres are currently enrolled in USDA voluntary, incentive-based programs. About 120 million of those acres (78 percent) are enrolled in various programs designed to improve the environmental management of working farms and ranches. EQIP accounts for 85 percent (104 million acres) of the acres enrolled in land management programs. The new Conservation Security Program (CSP) is next largest, with 11 million acres, or about 9 percent of the total acres enrolled.
About 35 million acres are enrolled in land retirement-land restoration programs, about 22 percent of all acres enrolled in USDA programs. The CRP is far and away the major program, accounting for 93 percent of the acres enrolled in such programs.
Conservation compliance provisions of the 1985 Farm Bill tie receipt of crop subsidies and other farm program benefits to erosion control on highly erodible cropland and prohibit most wetland drainage. The reach and impact of conservation compliance measures is large—about 196 million acres are affected by or potentially affected by the provisions. An estimated 104 million acres of highly erodible cropland are being farmed under an approved soil conservation plan in order to comply with the soil conservation compliance provisions of the 1985 Farm Bill. An estimated 92 million acres of wetlands, with potential for conversion to crop production are affected by the Swampbuster provisions of the 1985 act (Claassen et al. 2004).

U.S. Agricultural Policy and the 2007 Farm Bill 127
Table 4: Acres Affected by Conservation Compliance Provisions
COMPLIANCE PROVISION ACRES AFFECTED (MILLIONS)
Highly Erodible Land Conservation* 104
Wetland Conservation (Swampbuster)** 92
TOTAL 196
Source: Claassen et al. 2004.
EXPECTED ENVIRONMENTAL BENEFITS OF CONSERVATION PROGRAMS
Efforts to directly monitor the effect of USDA conservation programs on environmental outcomes are few. Because the CRP has been in existence for over 20 years, it has been studied more than any other conservation program. The terrestrial wildlife benefits of CRP have been a particular focus of attention. The results of those studies have shown that CRP has produced great benefits to wildlife populations—particularly grassland nesting birds and migratory waterfowl.
USDA is currently undertaking renewed efforts under the banner of the Conservation Effects Assessment Project (CEAP) to quantify the environmental effects of conservation practices and systems. CEAP is a broad-based effort encompassing research, model building, and data collection that is expected to begin producing estimates of environmental effects later this year. The effect estimates will all be based on model simulations of the effect of conservation programs on soil quality, water quality, and water conservation, using the National Resource Inventory sample frame and information about practices funding by conservation programs to simulate the expected effects of those programs.
Figures 4, 5, 6, and 7 present a coarse picture of the emphasis of various USDA conservation programs on various environmental outcomes.
Figure 4: Environmental Quality Incentives Program—Resource Concerns Addressed, 2002–2005
Source: USDA Natural Resources Conservation Service
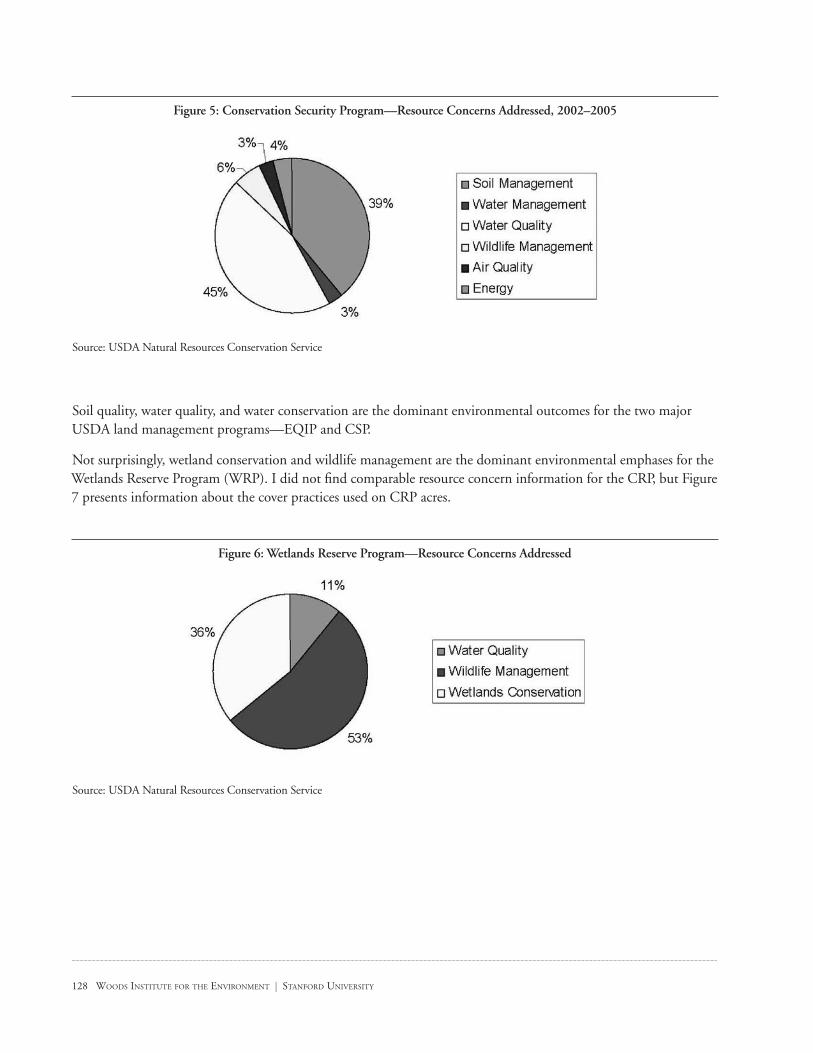
128 WOODS INSTITUTE FOR THE ENVIRONMENT | STANFORD UNIVERSITY
Figure 5: Conservation Security Program—Resource Concerns Addressed, 2002–2005
Source: USDA Natural Resources Conservation Service
Soil quality, water quality, and water conservation are the dominant environmental outcomes for the two major USDA land management programs—EQIP and CSP.
Not surprisingly, wetland conservation and wildlife management are the dominant environmental emphases for the Wetlands Reserve Program (WRP). I did not find comparable resource concern information for the CRP, but Figure 7 presents information about the cover practices used on CRP acres.
Figure 6: Wetlands Reserve Program—Resource Concerns Addressed
Source: USDA Natural Resources Conservation Service

U.S. Agricultural Policy and the 2007 Farm Bill 129
Figure 7: Conservation Reserve Program Cover Practices
Source: USDA Farm Service Agency
Compliance provisions have had more impact on the agricultural landscape than any other single policy innovation. Between 1982 and 1997, erosion on cropland in the United States was reduced by 40 percent. About 25 percent of that reduction can be directly attributed to the soil conservation compliance provisions, according to a recent analysis by the USDA Economic Research Service. Moreover, the soil conservation compliance provision may well have catalyzed much larger reductions in erosion as producers applied new tillage and cropping systems—required to meet compliance standards—to all or most of their cropped acres. In addition, the analysis estimated that between 7 to 14 million acres of highly erodible land and/or wetlands would likely be farmed profitably in the absence of soil conservation compliance provisions and Swampbuster. Compliance provisions appear to be effectively preventing the conversion of environmentally sensitive land to cropland (Claassen et al 20050.
Such provisions, although very effective, are unpopular with many producers and many field staff charged with implementing them. The soil conservation provisions have been more widely accepted in the agricultural community, in part because producers had great flexibility in choosing the measures they would implement to achieve the erosion reduction standards, and in part because soil conservation was widely accepted within the agricultural community as a legitimate and important objective. Wetland conservation provisions have been the most controversial.
Implications for the Future The future offers two major opportunities to ramp up the reach and impact of USDA conservation policy and programs.
1. Retool conservation programs and institutions for environmental management and enhance the environmental performance of the conservation programs we already have in place.
2. “Green” crop subsidy, insurance, and related programs designed to support income, stabilize price, or manage risk.
Both opportunities are promising and achievable, but face serious barriers. Retooling conservation programs and institutions for environmental management, accompanied by strategic increases in funding for those programs is the most urgent priority.

130 WOODS INSTITUTE FOR THE ENVIRONMENT | STANFORD UNIVERSITY
“Greening” crop subsidies is a more daunting political and technical task and may require changes in current World Trade Organization (WTO) rules to realize the full potential of “green payments” as alternatives to current subsidies. The probability that the 2007 Farm Bill—or any single Farm Bill—could completely transform crop subsidies is low. It is more likely that such a transformation, assuming it occurs, would take place step-by-step in response to the Farm Bill, the WTO dispute resolution system, and perhaps annual budget reconciliation measures. The benefits that could flow to producers, taxpayers, and the environment from such a transformation are compelling, however. The technical, institutional, and political challenges we face in designing a “green payments” program that successfully marries “income support” with credible and meaningful environmental improvement are large. The pay-off from such a transformation is equally large.
The rest of this paper briefly describes the issues that must be addressed to pursue these two options for reform of U.S. agricultural conservation programs.
RETOOL FOR ENVIRONMENTAL MANAGEMENT
The shift in focus of agricultural conservation policy and programs from agricultural resource conservation to agricultural environmental management—outlined earlier in this paper—is the most important policy change since their inception in the 1930s. Agricultural resource conservation and agricultural environmental management are compatible and complementary, but they are different. Environmental management puts a premium on (1) working at watershed or landscape scales versus individual farm or ranch scales, (2) precise targeting of programs and activities within those watersheds or landscapes, (3) joint action among groups of producers versus individual action of self-selected “cooperators,” (4) permanence of changes in land use and management, and (5) a much more robust technical services infrastructure—research, technology development, technology transfer, education, and direct technical assistance. The retooling agenda must address all four of these objectives.
Retooling agricultural conservation policy and programs for environmental management is urgent because the 2002 Farm Bill produced a historic opportunity for rapid and broad-based improvement in environmental quality in agricultural landscapes. The balanced funding between land management and land retirement programs, stressed earlier in this paper, makes possible a balanced, on-the-ground conservation effort. We can now use land retirement and restoration programs to repair key landscape functions (hydrology and habitat) while simultaneously improving the environmental performance of working farms and ranches (nutrient, water, soil, grazing, crop and livestock management). A glance back at Figure 1 shows that the opportunities to pursue such a balanced effort have been rare over the 70-year history of agricultural conservation programs in the United States.
More encouraging is that our balanced toolbox appears at a time when rapid advances are being made in our ability to understand and map spatial and temporal variability within agricultural watersheds and landscapes. Science and technology are coming together in what I will call “precision conservation.” Precision conservation makes it possible to more effectively get the right practices, in the right places, at the right time, and at the right scale.
The payoff from precision conservation is particularly apparent and documented for pollution prevention. Watershed studies are revealing the disproportionate contribution of pollutants from small portions of agricultural watersheds—a disproportionality caused by the intersection of environmentally sensitive areas and producer behavior. In the Great Lakes, for example, a soon-to-be-published analysis indicates that 5 percent of the cropland in the basin is responsible for about 40 percent of the sediment load (Personal Communication, Dr. John Bartholic, Michigan State University Water Resources Institute). Lake surveys in the Midwest are indicating that 10 to 20 percent of landscape is responsible for 60 to 80 percent of loadings of sediment and nutrients.

U.S. Agricultural Policy and the 2007 Farm Bill 131
These advances in understanding are transforming nonpoint pollution into multiple point pollution, with exciting implications for much faster progress, at much lower cost, than we previously thought possible. Applying these same approaches to efforts to enhance terrestrial and aquatic habitat, soil quality, air quality, and other environmental outcomes would likely create similar opportunities for rapid progress at lower cost.
There are barriers, however, that currently constrain our ability to take full advantage of the opportunity the 2002 Farm Bill and precision conservation has created. Those barriers are:
1) Focus on traditional soil and water conservation programs on single farms and ranches and self-selected cooperators.
2) Tension in design and application of conservation programs among solving environmental problems, ensuring equitable access to program benefits, and maintaining status quo distribution of farm subsidies.
3) The traditional “cost-share” model of financial incentives is ill-suited for addressing off-farm environmental benefits.
4) Permanence of changes in land use and management achieved is uncertain.
5) Fraying technical services infrastructure.
Each of these barriers is briefly discussed with suggestions for ways to overcome them. The last barrier—fraying technical infrastructure—is the most important and offers the greatest opportunity. Its discussion is left to the last to give it more emphasis and space.
INDIVIDUAL VERSUS JOINT EFFORT
The traditional unit of management in conservation programs is the individual farm or ranch. Program benefits and financial incentives flow directly from the federal government to individual farmers and ranchers. Selection of participants in programs is based first on those who volunteer, and second on program-specific “ranking criteria” or
“environmental benefit indices” that attempt to evaluate the relative benefits of accepting one application for participation over another.
This approach makes it difficult to take advantage of cumulative and joint effects at watershed and landscape scales. Farm- and ranch-based ranking criteria or indices can disperse rather than focus effort, especially if those criteria and indices give great weight to applications that appear to provide “multiple environmental benefits.” The traditional approach encourages stove-piping of programs and the fragmentation of conservation effort. Finally, the focus on individual farms and ranches makes it nearly impossible to apply precision conservation at watershed or landscape scales—the scale at which the benefits of precision conservation are greatest.
A promising solution to this barrier is to direct program funding to projects, rather than producers. Intermediaries—such as producer organizations, nongovernmental organizations, local units of government, watershed councils, conservation districts, land trusts, and a wide range of other potential entities—rather than individual farmers, would apply for funding through their choice of one or more conservation programs to implement watershed or landscape-scale projects designed to produce well-defined and place-based improvement in environmental quality. Applications from such entities would be evaluated under a number of criteria, including leveraging of funding from other sources, quality of project plan, methods proposed for monitoring and evaluating results, and other criteria that would increase the potential for success.
The recent White House Conference on Cooperative Conservation highlighted the advantages of this approach. The conference also demonstrated the range of entities and projects already on the landscape that would benefit from using

132 WOODS INSTITUTE FOR THE ENVIRONMENT | STANFORD UNIVERSITY
conservation programs to fund proposals for existing or new “cooperative conservation projects.” Models for taking such an approach to implementing USDA conservation programs already exist—the Conservation Partnership Initiative and the Conservation Reserve Enhancement Program, for example. The 2007 Farm Bill could and should expand on these models to direct a major portion—SWCS has recommended 30 percent of USDA conservation program funding—through a competitive process to cooperative conservation projects (Soil and Water Conservation Society, 2004).
Redirecting a substantial portion of conservation funding through cooperative conservation projects is perhaps the most feasible and compelling opportunity to both increase the environmental performance of programs and build effective and committed political support for continuing to increase the prominence of conservation policy and programs in agricultural policy.
PERFORMANCE VERSUS EQUITY
The tension within conservation programs between performance and equity is real. Conservationists understand that precision conservation and joint effort are keys to getting the results agriculture needs and taxpayers want. Unless individual actions add up, good work at the farm and ranch level often fall short of their potential, and heroic efforts by award-winning farmers do not pay off in improving the environment at the landscape level. Yet, the same conservationists believe all producers should have a chance to share in the benefits of public programs, bad actors shouldn’t be rewarded, and the stewardship ethic should be universally encouraged.
These two legitimate sets of values collide when decisions are being made about allocating conservation program dollars among potential participants and purposes. The more recent history of ACP and EQIP strongly suggest that long-term political support for conservation programs requires striking an explicit balance between these two sets of values. A “targeted” program cannot survive without a “base” program, and a “base” program cannot survive without a “targeted” program.
The solution is to explicitly manage conservation programs as a portfolio. Table 4 presents one vision of what such a portfolio might look like—balanced (1) between a broadly available base effort and a more focused, project-based effort, and (2) among investments in management-intensive, capital-intensive, and land restoration activities.
Table 4: USDA Conservation Program Portfolio
MANAGEMENT INTENSIVE SYSTEMS
CAPITAL INTENSIVE SYSTEMS
LAND RETIREMENT & RESTORATION
Base Effort
Diffuse environmental objectives
CSP
“Green Payments”
C-CRP
Cooperative Conservation Projects
Geographically specific environmental objectives
Precision conservation
EQIP EQIP CRP
CREP
WRP
WHIP
FRPP
GRP
Source: Soil and Water Conservation Society. 2004. Realizing the Promise of the Farm Security and Rural Investment Act of 2002, How Implementation of the Conservation Provisions Measures Up. Soil and Water Conservation Society, Ankeny, Iowa.

U.S. Agricultural Policy and the 2007 Farm Bill 133
The most direct path to such a balanced portfolio would be to consolidate the multiple USDA conservation programs along the rows and/or columns of Table 4. The advantages of such consolidation are large, and proposals for consolidation have been made repeatedly. Political forces—mostly the growth of strong, single-program constituencies—have blunted efforts to consolidate programs since the creation of EQIP in 1996. In the absence of legislative action to consolidate programs, administrative action could be taken to gain at least some of the benefits of consolidation and portfolio management of conservation programs.
COST-SHARE MODEL AND ON-FARM ENVIRONMENTAL BENEFITS
The cost-share model of financial assistance, under which a producer is paid some percentage of the cost of implementing a conservation system or practice, has been and continues to be the dominant model for providing financial incentives to improve farm and ranch management. Land retirement and restoration programs essentially follow the same model, paying 100 percent of the opportunity cost of taking land out of production.
The cost-share model worked very well for traditional resource conservation purposes when a large share of the benefits of improving productivity and operability went directly to producers. The cost-share model, however, is not as effective when applied to environmental management when most of the benefits flow off the farm to taxpayers. In addition, risk, rather than the cost of implementation, is usually the more important barrier to use of the management-intensive conservation systems so critical to agriculture’s environmental agenda. Cost-sharing is an ineffective and often expensive way to deal with such risk. Moreover, the cost-share model reinforces inefficiencies and lack of innovation that accompanies practice-based approaches. Finally, and most important, the cost of implementing practices or retiring land is only indirectly related to the value of the environmental or ecological goods and services produced by those practices or retired land.
The solution is to revamp the way financial incentives are established by paying more for performance and less for practices. The ultimate goal would be to pay for the value of environmental goods and services, not for the cost of producing those goods and services. The ultimate result would be to make conservation pay for producers rather than simply cost less—the most important way toward effective green payments discussed later.
The Conservation Security Program (CSP), authorized in the 2002 Farm Bill, has taken steps toward tying payments to performance rather than to the cost of practices. The innovations tested in CSP could and should be applied to conservation programs generally, focusing first on those outcomes and/or conservation systems where links between practice and outcome are best understood and most readily quantified.
PERMANENCE
The permanence of the changes in the land use taxpayers fund is a critical determinant of the value they receive for their investment. The permanence of land reserves is particularly important. Taking land out of production to restore critical portions of the landscape are profoundly important, but also very expensive measures. Currently, most of our land reserves are created through 10-year contracts that provide annual rental payments for the land taken out of production. As noted previously, such land reserves are highly vulnerable to changes in market conditions, budget pressures, and policy priorities.
Additional options to increase the permanence of land reserves should be created in the 2007 Farm Bill. Those options could and should include creating long-term or permanent easement options for the most sensitive land currently enrolled in CRP and wider use of easement options that purchase only subsets of use rights on agricultural

134 WOODS INSTITUTE FOR THE ENVIRONMENT | STANFORD UNIVERSITY
land. Most important should be efforts to provide economic opportunities that would sustain and support long-term changes in land use to more environmentally appropriate uses in critical locations. The permanence of changes in land management systems is also important.
FRAYING TECHNICAL SERVICES INFRASTRUCTURE
The quality and robustness of our technical services infrastructure—research, technology development, technology transfer, education, and direct technical services—is far and away the most important factor affecting environmental performance and, unfortunately, the most prone to neglect and underinvestment. Building a stronger technical services infrastructure is the most effective and essential step toward Green Box measures to conserve the ecological integrity and economic resilience of U.S. farmland.
The environmental agenda demands a dense and rich knowledge base. Environmental management know-how is complex. Management-intensive systems are knowledge-based and are keys to agriculture’s environmental agenda, and precision conservation demands more information and more sophisticated assistance at farm, ranch, and watershed scales. Most important, technical assistance can be a more cost-effective and lasting way to improve farm and ranch management than financial assistance.
Figure 8 compares the inflation-adjusted investment in one major component of the technical services infrastructure—USDA-NRCS technical assistance—to investment in financial assistance for producers. Investment in technical assistance has been essentially flat—with a small increase since 2002—while financial assistance funding has nearly tripled. Figure 9 shows the effect of this investment path on staff levels within USDA-NRCS. Staff levels in 2005 are 7 percent below levels in 1985, despite a dramatic increase in the number and size of conservation programs. Similar trends could be illustrated for other agencies and other components of the technical services infrastructure.
Agriculture’s environmental agenda—in the absence of dramatic increases in program levels—should have been met with substantial new investment to build the rich and dense technical services infrastructure. The recent major expansion of program levels has multiplied the problem.
As a result, our current technical infrastructure is fraying. We know much more than we are using on-the-ground, innovation is stifled, precision conservation is stifled, and performance is impaired.

U.S. Agricultural Policy and the 2007 Farm Bill 135
Figure 8: Trend in Inflation-Adjusted Funding for Financial and Technical Assistance
Figure 9: Trend in USDA-NRCS Staff Years, 1984–2000
By allowing our technical infrastructure to fray, we are not only erecting a barrier to the ecologic integrity and economic resilience of U.S. farmland, we are missing a major opportunity for cost-effective and lasting change. Much, if not most, of the conservation effort on private land is undertaken by landowners who are not receiving payments for those efforts under public programs. A recent study from the USDA Economic Research Service, for example, reported survey results indicating that most of the investment in structural and vegetative conservation practices on farms was accomplished without financial support from conservation programs. Land management practices, such as grass waterways and filter strips, were particularly likely to be installed at the landowners cost (Lambert et al. 2006).
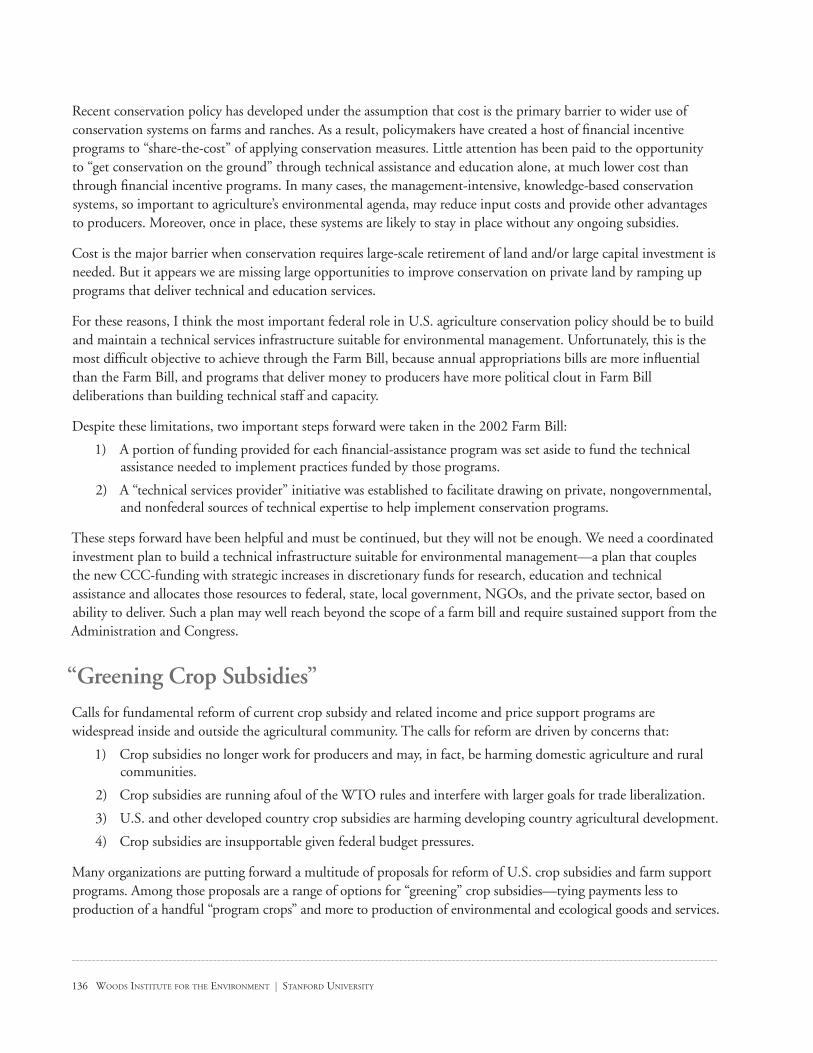
136 WOODS INSTITUTE FOR THE ENVIRONMENT | STANFORD UNIVERSITY
Recent conservation policy has developed under the assumption that cost is the primary barrier to wider use of conservation systems on farms and ranches. As a result, policymakers have created a host of financial incentive programs to “share-the-cost” of applying conservation measures. Little attention has been paid to the opportunity to “get conservation on the ground” through technical assistance and education alone, at much lower cost than through financial incentive programs. In many cases, the management-intensive, knowledge-based conservation systems, so important to agriculture’s environmental agenda, may reduce input costs and provide other advantages to producers. Moreover, once in place, these systems are likely to stay in place without any ongoing subsidies.
Cost is the major barrier when conservation requires large-scale retirement of land and/or large capital investment is needed. But it appears we are missing large opportunities to improve conservation on private land by ramping up programs that deliver technical and education services.
For these reasons, I think the most important federal role in U.S. agriculture conservation policy should be to build and maintain a technical services infrastructure suitable for environmental management. Unfortunately, this is the most difficult objective to achieve through the Farm Bill, because annual appropriations bills are more influential than the Farm Bill, and programs that deliver money to producers have more political clout in Farm Bill deliberations than building technical staff and capacity.
Despite these limitations, two important steps forward were taken in the 2002 Farm Bill:
1) A portion of funding provided for each financial-assistance program was set aside to fund the technical assistance needed to implement practices funded by those programs.
2) A “technical services provider” initiative was established to facilitate drawing on private, nongovernmental, and nonfederal sources of technical expertise to help implement conservation programs.
These steps forward have been helpful and must be continued, but they will not be enough. We need a coordinated investment plan to build a technical infrastructure suitable for environmental management—a plan that couples the new CCC-funding with strategic increases in discretionary funds for research, education and technical assistance and allocates those resources to federal, state, local government, NGOs, and the private sector, based on ability to deliver. Such a plan may well reach beyond the scope of a farm bill and require sustained support from the Administration and Congress.
“Greening Crop Subsidies” Calls for fundamental reform of current crop subsidy and related income and price support programs are widespread inside and outside the agricultural community. The calls for reform are driven by concerns that:
1) Crop subsidies no longer work for producers and may, in fact, be harming domestic agriculture and rural communities.
2) Crop subsidies are running afoul of the WTO rules and interfere with larger goals for trade liberalization.
3) U.S. and other developed country crop subsidies are harming developing country agricultural development.
4) Crop subsidies are insupportable given federal budget pressures.
Many organizations are putting forward a multitude of proposals for reform of U.S. crop subsidies and farm support programs. Among those proposals are a range of options for “greening” crop subsidies—tying payments less to production of a handful “program crops” and more to production of environmental and ecological goods and services.
U.S. Agricultural Policy and the 2007 Farm Bill 137
The range of proposals can be broken down into three groups:
1) Cut funding for crop subsidies and use the savings to increase funding for existing (and reformed?) conservation programs.
2) Expand and strengthen conservation compliance provisions.
3) Transform crop subsidies into “green payments” that marry income support and environmental performance.
The first two groups of proposals do not seek to reform crop subsidies, but rather to use their funding or leverage to spur conservation efforts. The third group of proposals seeks to fundamentally reform and redirect the basis for public support of farms and ranches.
CUT FUNDING
Simply cutting funding for crop subsidies and using the savings to increase funding for existing conservation programs represents the minimalist approach to increasing Green Box measures to ensure the ecologic integrity and economic resilience of U.S. farmland. It is also the agenda with the most widespread support among conservation advocates and with the clearest and simplest political strategy. Among farm policy “realists,” it is the option most urgently recommended, if accompanied by the kinds of reforms to conservation programs outlined above.
EXPAND COMPLIANCE PROVISIONS
Existing compliance provisions could be expanded by (1) tying the provisions to more farm support programs, particularly crop insurance, (2) expanding the land uses covered by compliance beyond highly erodible land and wetlands, and/or (3) expanding the objectives of compliance beyond soil conservation and wetland protection to include water quality, water conservation, soil quality, air quality, wildlife habitat, or other environmental objectives.
Advocates of this approach cite the profound impact of past compliance provisions. They also suggest that gradually tightening and expanding compliance provisions could be an effective way to make a transition to “green payments.” Expanded compliance provisions, though likely effective, would be limited to current producers of “program crops” and do nothing to address the other concerns about ill-effects of crop subsidies.
TRANSFORM CROP SUBSIDIES INTO GREEN PAYMENTS
Transforming crop subsidies into green payments is the most compelling, most widely discussed, most difficult, and currently most vague proposal for reform of agricultural policy. The political difficulties of achieving such reform are enormous, and the technical difficulties of designing a new program that effectively supports income and improves the environment are daunting. Effective and efficient environmental management requires targeting programs at those producers and geographic locations that contribute most to the environmental problem the program is seeking to solve. Income support programs, however, either seek to provide benefits to a broad cross-section of producers or to direct benefits to limited resource farmers, beginning farmers, or some other socio-economic sector of agriculture. The overlap between producers and regions targeted by environmental programs and income support programs can be small. Attempting to achieve both objectives in a single green payments program can lead to substantial inefficiencies and conflict.

138 WOODS INSTITUTE FOR THE ENVIRONMENT | STANFORD UNIVERSITY
Moreover, sketching out a transition path from current crop subsidies to green payments that ameliorates some of the decrease in land values and shocks to agricultural financing that are expected to accompany such a shift is also a difficult task. Most observers suggest the primary effect of eliminating crop subsidies would be a reduction in agricultural land values on cropland producing currently subsidized crops. Reductions of as much as 30 percent have been predicted. Such reductions in asset values could produce serious financial management problems for highly leveraged producers, who depend on their asset values as collateral for annual operating loans.
Despite the difficulties, the advantages of such a transformation are compelling. Table 5 illustrates the demographic and structural complexity of U.S. agriculture today (Note: Table 6 provides definitions of the farm typology used in Table 5).
Table 5: Distribution of Agricultural Resources, Farm Programs, and Conservation Programs by Farm Type
USDA ECONOMIC RESEARCH SERVICE FARM TYPOLOGY
LIMITED RESOURCE
RETIREMENT RESIDENTIAL LIFESTYLE
FARMING OCCUPATION
LARGE VERY LARGE
NON FAMILY
RESOURCE PROGRAM
LOWER SALES
HIGHER SALES
No. of Farms 9% 16% 40% 19% 6% 4% 3% 2%
Acres Operated
3% 7% 14% 16% 16% 15% 23% 6%
Crop Sales 1% 2% 5% 5% 11% 18% 44% 15%
Livestock Sales
1% 3% 7% 6% 11% 10% 44% 18%
Crop Subsidies
2% 5% 10% 10% 17% 21% 31% 3%
CRP 7% 21% 28% 20% 10% 5% 5% 3%
EQIP 11% 1% 4% 7% 32% 6% 29% 10%
Source: USDA Economic Research Service, Agricultural Resources and Management Survey.
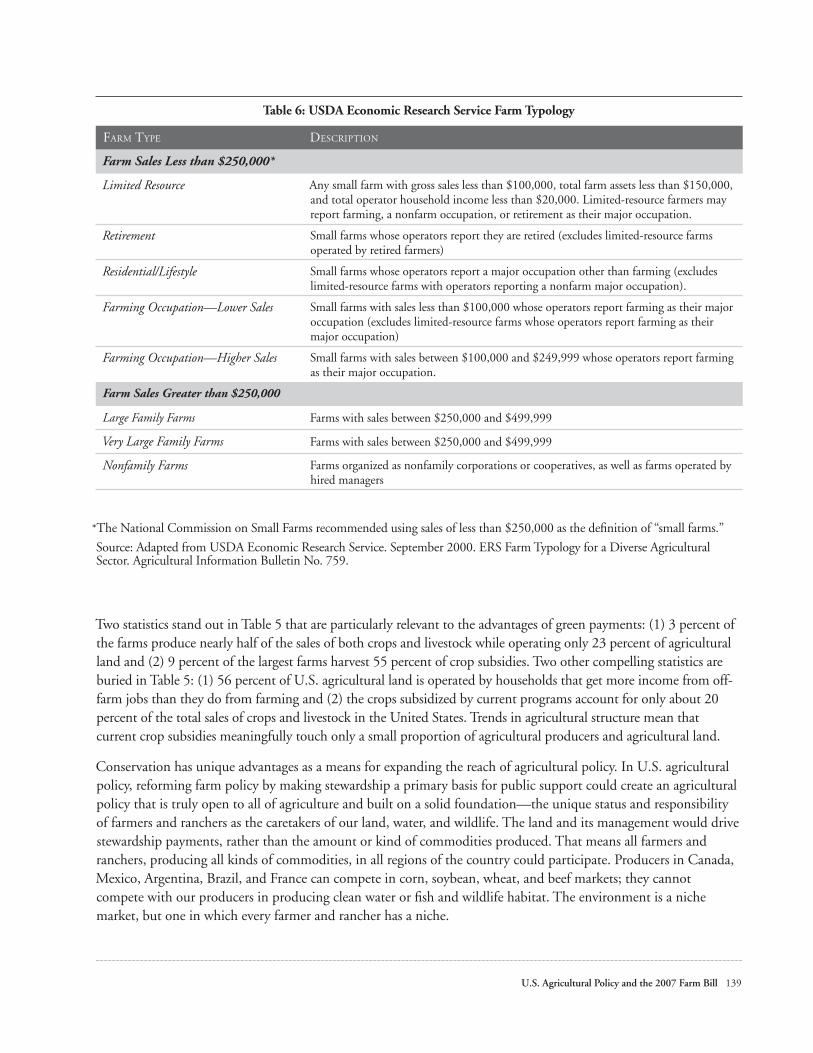
U.S. Agricultural Policy and the 2007 Farm Bill 139
Table 6: USDA Economic Research Service Farm Typology
FARM TYPE DESCRIPTION
Farm Sales Less than $250,000*
Limited Resource Any small farm with gross sales less than $100,000, total farm assets less than $150,000, and total operator household income less than $20,000. Limited-resource farmers may report farming, a nonfarm occupation, or retirement as their major occupation.
Retirement Small farms whose operators report they are retired (excludes limited-resource farms operated by retired farmers)
Residential/Lifestyle Small farms whose operators report a major occupation other than farming (excludes limited-resource farms with operators reporting a nonfarm major occupation).
Farming Occupation—Lower Sales Small farms with sales less than $100,000 whose operators report farming as their major occupation (excludes limited-resource farms whose operators report farming as their major occupation)
Farming Occupation—Higher Sales Small farms with sales between $100,000 and $249,999 whose operators report farming as their major occupation.
Farm Sales Greater than $250,000
Large Family Farms Farms with sales between $250,000 and $499,999
Very Large Family Farms Farms with sales between $250,000 and $499,999
Nonfamily Farms Farms organized as nonfamily corporations or cooperatives, as well as farms operated by hired managers
*The National Commission on Small Farms recommended using sales of less than $250,000 as the definition of “small farms.”
Source: Adapted from USDA Economic Research Service. September 2000. ERS Farm Typology for a Diverse Agricultural Sector. Agricultural Information Bulletin No. 759.
Two statistics stand out in Table 5 that are particularly relevant to the advantages of green payments: (1) 3 percent of the farms produce nearly half of the sales of both crops and livestock while operating only 23 percent of agricultural land and (2) 9 percent of the largest farms harvest 55 percent of crop subsidies. Two other compelling statistics are buried in Table 5: (1) 56 percent of U.S. agricultural land is operated by households that get more income from off-farm jobs than they do from farming and (2) the crops subsidized by current programs account for only about 20 percent of the total sales of crops and livestock in the United States. Trends in agricultural structure mean that current crop subsidies meaningfully touch only a small proportion of agricultural producers and agricultural land.
Conservation has unique advantages as a means for expanding the reach of agricultural policy. In U.S. agricultural policy, reforming farm policy by making stewardship a primary basis for public support could create an agricultural policy that is truly open to all of agriculture and built on a solid foundation—the unique status and responsibility of farmers and ranchers as the caretakers of our land, water, and wildlife. The land and its management would drive stewardship payments, rather than the amount or kind of commodities produced. That means all farmers and ranchers, producing all kinds of commodities, in all regions of the country could participate. Producers in Canada, Mexico, Argentina, Brazil, and France can compete in corn, soybean, wheat, and beef markets; they cannot compete with our producers in producing clean water or fish and wildlife habitat. The environment is a niche market, but one in which every farmer and rancher has a niche.

140 WOODS INSTITUTE FOR THE ENVIRONMENT | STANFORD UNIVERSITY
Conservation also has unique advantages because—if properly designed—green payments could produce real and compelling benefits for taxpayers and the environment. Production of environmental goods and services would provide a more sustainable basis for public support of farmers and ranchers in the United States.
The history of ACP, however, indicates that using conservation as a means to support income poses problems. If green payments are to support income they must make conservation pay, not just cost less. In the past, that was accomplished by funding improvements in farms and ranches that increased productivity, operability, and profitability. In the future, that must be accomplished by tying payments to the value of the ecological goods and services produced on the farm.
The scientific and technical means to tie payments to the value of ecological goods and services is advancing rapidly. In some cases, “prices” for ecological good and services are already being revealed in “markets” such a trading carbon sequestration credits. Proxies for such prices could be constructed to serve as the basis for a credible green payments program, where other options don’t exist.
Building a green payments program that ties payments to the value of goods and services produced rather than to the cost of practices is the key to a successful marriage of income support and environmental improvement. It also, however, runs afoul of current WTO rules that restrict “green payments” to no more than the cost of the practices employed. A full-scale move to green payments will require changes to those rules, changes that will have to be part of larger trade negotiations.
Finally, a transformation of crop subsidies to green payments would entail design and implementation of a program operating at a scale that is unprecedented in U.S. history. The weakness in our technical infrastructure has already been noted as a serious constraint to improving the performance of current conservation programs. The infrastructure is completely inadequate for implementing a green payments program of the reach and scale that would result from a successful transformation of crop subsidies to green payments.
References Cited Cattaneo, Andrea, Roger Claassen, Robert Johansson, and
Marcia Weinburg. June 2005. Flexible Conservation Measures on Working Land. U.S. Department of Agriculture, Economic Research Service, Economic Information Bulletin No. 5.
Claassen, Roger, Vince Breneman, Shawn Bucholtz, Andrea Cattaneo, Robert Johansson, and Mitch Morehart. June 2004. Environmental Compliance in U.S. Agricultural Policy Past Performance and Future Potential. USDA Economic Research Service, Agricultural Economic Report No. 832.
Dimitri, Carolyn, Anne Effland, and Neilson Conklin. June 2005. The 20th Century Transformation of U.S. Agriculture and Farm Policy. U.S. Department of Agriculture, Economic Research Service, Economic Information Bulletin No. 3.
Lambert, Dayton, Patrick Sullivan, Roger Claassen, and Linda Forman. 2006. Conservation Compatible Practices and Programs: Who Participates? U.S.
Department of Agriculture, Economic Research Service, Economic Research Report No. 14. February 2006.
Rasmussen, Wayne D. 1982. History of Soil Conservation, Institutions and Incentives. In: Soil Conservation Policies, Institutions, and Incentives, Halcrow, H.G., E.O Heady, and M.L. Cotner editors. Soil Conservation Society of America, Ankeny, Iowa.
Rasmussen, Wayne D and Gladys Baker. 1972. The Department of Agriculture. Praeger Press, New York, New York. 257 p.
Soil and Water Conservation Society. 2004. Realizing the Promise of the Farm Security and Rural Investment Act of 2002, How Implementation of the Conservation Provisions Measures Up. Soil and Water Conservation Society, Ankeny, Iowa.
USDA Economic Research Service. September 2000. ERS Farm Typology for a Diverse Agricultural Sector. Agricultural Information Bulletin No. 759.

U.S. Agricultural Policy and the 2007 Farm Bill 141
CONSERVATION TECHNICAL ASSISTANCE (CTA)
The Conservation Technical Assistance (CTA) Program, administered by USDA Natural Resources Conservation Service, provides technical assistance supported by science-based technology and tools to help people conserve, maintain, and improve their natural resources. The CTA Program provides the technical capability, including direct conservation planning, design, and implementation assistance, that helps people plan and apply conservation on the land. This assistance is provided to individuals, groups, and communities who make natural resource management decisions on private, tribal, and other non-federal lands. NRCS, through the CTA Program, provides conservation technical assistance that addresses natural resource conservation issues at the local level that are of State and national concern.
Objectives of the program are to:
• Provide conservation technical assistance to individuals or groups of decision makers, communities, conservation districts, units of state and local government, tribes, and others to voluntarily conserve, maintain, and improve natural resources.
• Provide community, watershed, and area-wide technical assistance in collaboration with units of government, to develop and implement resource management plans that conserve, maintain, and improve natural resources.
• Provide conservation technical assistance to agricultural producers to comply with the Highly Erodible Land (HEL) and Wetland (Swampbuster) Conservation Compliance Provisions of the l985 Food Security Act, as amended.
• Provide conservation technical assistance to decision makers to assist them to comply with federal, state, tribal, and local environmental regulations and related requirements, and to prepare them to become eligible to participate in other federal, state, and local conservation programs.
• Provide soils information and interpretation to individuals or groups of decision makers, communities, states, and others to aid sound decision making in the wise use and management of soil resources.
• Collect, analyze, interpret, display, and disseminate information about the status, condition, and trend of soil, water, and related natural resources so that people can make informed decisions for natural resource use and management.
• Assess the effects of conservation practices and systems on the condition of natural resources.
• Develop, adapt, and transfer effective science-based technologies and tools for assessment, management, and conservation of natural resources.
The CTA Program provides the local delivery system and the foundation technical expertise for other NRCS programs and for other federal, tribal, state, and local conservation programs.
Source: USDA Natural Resources Conservation Service
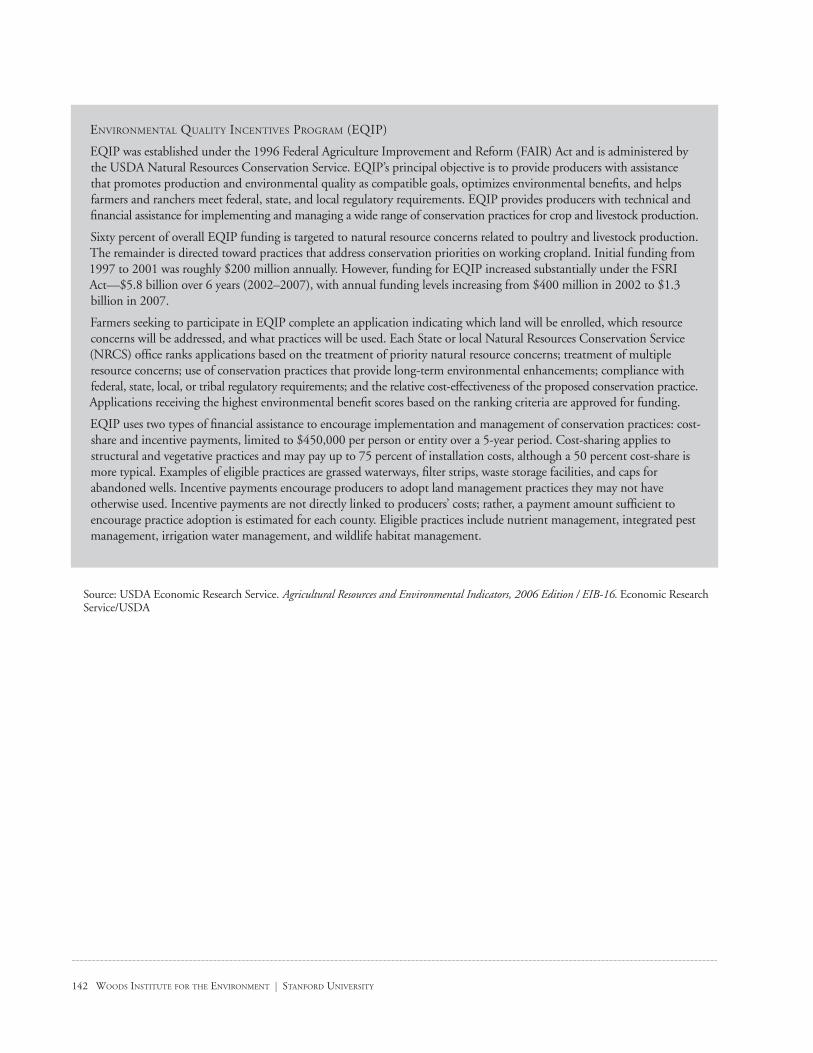
142 WOODS INSTITUTE FOR THE ENVIRONMENT | STANFORD UNIVERSITY
ENVIRONMENTAL QUALITY INCENTIVES PROGRAM (EQIP)
EQIP was established under the 1996 Federal Agriculture Improvement and Reform (FAIR) Act and is administered by the USDA Natural Resources Conservation Service. EQIP’s principal objective is to provide producers with assistance that promotes production and environmental quality as compatible goals, optimizes environmental benefits, and helps farmers and ranchers meet federal, state, and local regulatory requirements. EQIP provides producers with technical and financial assistance for implementing and managing a wide range of conservation practices for crop and livestock production.
Sixty percent of overall EQIP funding is targeted to natural resource concerns related to poultry and livestock production. The remainder is directed toward practices that address conservation priorities on working cropland. Initial funding from 1997 to 2001 was roughly $200 million annually. However, funding for EQIP increased substantially under the FSRI Act—$5.8 billion over 6 years (2002–2007), with annual funding levels increasing from $400 million in 2002 to $1.3 billion in 2007.
Farmers seeking to participate in EQIP complete an application indicating which land will be enrolled, which resource concerns will be addressed, and what practices will be used. Each State or local Natural Resources Conservation Service (NRCS) office ranks applications based on the treatment of priority natural resource concerns; treatment of multiple resource concerns; use of conservation practices that provide long-term environmental enhancements; compliance with federal, state, local, or tribal regulatory requirements; and the relative cost-effectiveness of the proposed conservation practice. Applications receiving the highest environmental benefit scores based on the ranking criteria are approved for funding.
EQIP uses two types of financial assistance to encourage implementation and management of conservation practices: cost-share and incentive payments, limited to $450,000 per person or entity over a 5-year period. Cost-sharing applies to structural and vegetative practices and may pay up to 75 percent of installation costs, although a 50 percent cost-share is more typical. Examples of eligible practices are grassed waterways, filter strips, waste storage facilities, and caps for abandoned wells. Incentive payments encourage producers to adopt land management practices they may not have otherwise used. Incentive payments are not directly linked to producers’ costs; rather, a payment amount sufficient to encourage practice adoption is estimated for each county. Eligible practices include nutrient management, integrated pest management, irrigation water management, and wildlife habitat management.
Source: USDA Economic Research Service. Agricultural Resources and Environmental Indicators, 2006 Edition / EIB-16. Economic Research Service/USDA
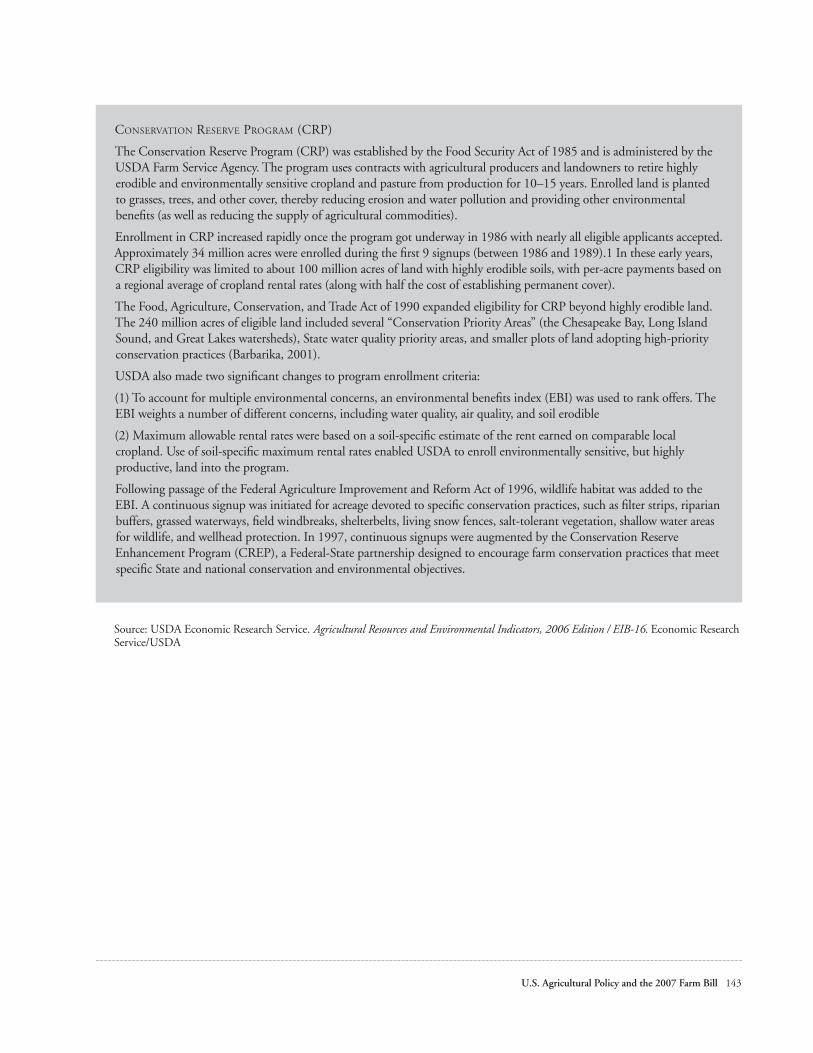
U.S. Agricultural Policy and the 2007 Farm Bill 143
CONSERVATION RESERVE PROGRAM (CRP)
The Conservation Reserve Program (CRP) was established by the Food Security Act of 1985 and is administered by the USDA Farm Service Agency. The program uses contracts with agricultural producers and landowners to retire highly erodible and environmentally sensitive cropland and pasture from production for 10–15 years. Enrolled land is planted to grasses, trees, and other cover, thereby reducing erosion and water pollution and providing other environmental benefits (as well as reducing the supply of agricultural commodities).
Enrollment in CRP increased rapidly once the program got underway in 1986 with nearly all eligible applicants accepted. Approximately 34 million acres were enrolled during the first 9 signups (between 1986 and 1989).1 In these early years, CRP eligibility was limited to about 100 million acres of land with highly erodible soils, with per-acre payments based on a regional average of cropland rental rates (along with half the cost of establishing permanent cover).
The Food, Agriculture, Conservation, and Trade Act of 1990 expanded eligibility for CRP beyond highly erodible land. The 240 million acres of eligible land included several “Conservation Priority Areas” (the Chesapeake Bay, Long Island Sound, and Great Lakes watersheds), State water quality priority areas, and smaller plots of land adopting high-priority conservation practices (Barbarika, 2001).
USDA also made two significant changes to program enrollment criteria:
(1) To account for multiple environmental concerns, an environmental benefits index (EBI) was used to rank offers. The EBI weights a number of different concerns, including water quality, air quality, and soil erodible
(2) Maximum allowable rental rates were based on a soil-specific estimate of the rent earned on comparable local cropland. Use of soil-specific maximum rental rates enabled USDA to enroll environmentally sensitive, but highly productive, land into the program.
Following passage of the Federal Agriculture Improvement and Reform Act of 1996, wildlife habitat was added to the EBI. A continuous signup was initiated for acreage devoted to specific conservation practices, such as filter strips, riparian buffers, grassed waterways, field windbreaks, shelterbelts, living snow fences, salt-tolerant vegetation, shallow water areas for wildlife, and wellhead protection. In 1997, continuous signups were augmented by the Conservation Reserve Enhancement Program (CREP), a Federal-State partnership designed to encourage farm conservation practices that meet specific State and national conservation and environmental objectives.
Source: USDA Economic Research Service. Agricultural Resources and Environmental Indicators, 2006 Edition / EIB-16. Economic Research Service/USDA

144 WOODS INSTITUTE FOR THE ENVIRONMENT | STANFORD UNIVERSITY
CONSERVATION SECURITY PROGRAM (CSP)
CSP was introduced under the 2002 FSRI Act and is administered by the USDA Natural Resources Conservation Service. The program began in 2004 with a budget of $41 million. CSP addresses familiar conservation issues, but departs from traditional conservation programs in three areas: program eligibility, participation incentives, and selection criteria.
CSP narrows eligibility to focus on already “good stewards” and provides payments for the maintenance of pre-existing conservation practices as well as encouraging producers to adopt new practices to qualify for additional payments. Producers are eligible if they are treating nationally significant resource concerns—soil quality and water quality—using appropriate conservation practices on at least a part of their farm. Depending on the extent to which they have addressed these and other resource concerns, producers may enroll in one of three CSP “tiers.” In tier I, producers may enroll only the portion of their farm on which soil and water quality concerns have been addressed by best management practices. Producers who have addressed soil and water quality concerns throughout their farm and agree to address at least one additional resource concern over the life of the contract (5–10 years) are eligible for tier II. Tier III participants must have treated all identified resource concerns—not just soil quality and water quality—with conservation practices before CSP enrollment.
While CSP is intended to be a national program, eligibility for any given signup has been limited to specific watersheds because of limited funding. For the initial CSP signup, in July 2004, producers in 18 watersheds were eligible. An additional 202 watersheds became eligible for enrollment in 2005. Only 60 watersheds were open for enrollment in 2006.
CSP offers several types of payments which reward producers for their “benchmark” or status quo level of conservation effort at the time they enroll in the program. Producers can, but are not required to, plan to add new conservation practices over the life of the CSP contract (5–10 years). “Stewardship” and “existing practice” payments are based, roughly, on a percentage of the county average rental rate for the specific type of land involved. Practices that are subject to any other maintenance requirement, such as conservation compliance plans, are not eligible for existing practice payments. Implementation of new practices can be cost-shared at a rate of up to 50 percent, 65 percent for limited-resource and beginning farmers. “Enhancement payments” reward producers who are implementing practices that improve or enhance resource quality beyond the minimum (quality criteria) standard. In a number of cases, these payments are be based on environmental performance rather than cost. Environmental indices, such as the soil condition index, serve as proxies for environmental performance.
Source: Adapted and updated from USDA Economic Research Service. Agricultural Resources and Environmental Indicators, 2006 Edition / EIB-16. Economic Research Service/USDA
U.S. Agricultural Policy and the 2007 Farm Bill 145
WETLANDS RESERVE PROGRAM (WRP)
The Wetlands Reserve Program (WRP) was established by the Food, Agriculture, Conservation, and Trade Act of 1990 and is administered by the USDA Natural Resources Conservation Service. WRP goals are the restoration of high-risk agricultural land located in, or adjacent to, floodprone areas. The stated emphasis of WRP is to protect, restore, and enhance the functions and values of wetland ecosystems to attain:
• Habitat for migratory birds and wetland-dependent wildlife, including threatened and endangered species
• Protection and improvement of water quality
• Attenuation of water flows due to flooding
• Recharge of ground water
• Protection and enhancement of open space and aesthetic quality
• Protection of native flora and fauna contributing to the Nation’s
• Natural heritage
• Contribution to educational and scientific scholarship.
WRP enrollment began in 1992, with steady increases in subsequent years. When the initial enrollment cap of 1 million acres was met in 2001, the Farm Security and Rural Investment Act of 2002 reauthorized the WRP, increasing the cap to 2.275 million acres.
The WRP uses three enrollment schemes: permanent easements, 30-year easements, and 10-year cost-share agreements. The initial 2 years of enrollment consisted of pilot programs in a limited number of states. WRP has since sought the greatest wetland functions and values, along with optimum wildlife habitat, on every acre enrolled.
In pursuing these goals, WRP has undergone some changes. Most importantly, in the earlier years a “walk away” strategy was often used: parcels were allowed to return to their wetland condition with no other intervention. However, this strategy led to poor wetland function. So, a “full restoration” strategy was adopted in the late 1990s. Full restoration implies considerably more site preparation (for example, undoing land leveling). At least 70 percent of each project must be restored to the original natural condition (to the extent practicable). The remaining 30 percent can be restored to
“other than natural” conditions.
Source: USDA Economic Research Service. Agricultural Resources and Environmental Indicators, 2006 Edition / EIB-16. Economic Research Service/USDA

146 WOODS INSTITUTE FOR THE ENVIRONMENT | STANFORD UNIVERSITY

U.S. Agricultural Policy and the 2007 Farm Bill 147
CHAPTER III-3
Environmental Integration into Agricultural Policy in the European Union
Michael Hammell
IntroductionIn Europe, land is generally privately owned, and a very high proportion of it is used for farming and forestry. There is little public land, in contrast to the American situation. Farming has played an important part in shaping the natural environment, and traditional farming methods are generally seen as environmentally beneficial. European biodiversity has grown up with farming.
The emergence of more intensive farming gradually over the past century and particularly since the 1950s has, however, presented a set of pressures on the environment. Increases in fertilizer and plant protection product use, in water for irrigation and in energy use as farms mechanized, together with some regional concentration of production and specialization at farm level, mean that the benign and beneficial relationship between the farm and its surroundings has come under increasing environmental challenge. This challenge, however, is not confined to the more intensive agricultural regions of Europe as marginalization, the gradual run down of farming activities, another feature of European land use especially in less productive and remote areas, threatens the delicate biodiversity relationships with farming built up over many centuries.
Environmental Policy DevelopmentEnvironmental policy is rather younger in E.U. terms than the Common Agricultural Policy (CAP), which in effect has meant environmental concerns were not built into the CAP from the outset. The emerging environmental concerns of the late 1960s onwards regarding water pollution and biodiversity loss related to agriculture therefore found a late response in environmental legislation. Indeed, worldwide it is the emergence of environmental problems that generally has triggered policy responses, as the prior knowledge of a few experts is generally disregarded by the many in pursuit of more easily understood economic goals. This remains true today, as instanced by climate change and its causes. The need for the protection of soil, driven in the U.S. by the 1930s dustbowl, has only recently become a widespread issue in Europe, as concerns grow for the protection of the soil’s functions, both within and outside agriculture. In practice, environmental policy has always played catch-up on other areas and, therefore, agricultural policy and practice worldwide has not really been flanked early enough by safeguards, to avoid environmental problems. An important milestone for the environment in Europe was the introduction in the mid-1990s of a requirement in the E.U. Treaty to integrate environmental concerns into other policy areas including agriculture, thus establishing, as a right, a seat at the table for the environment in their development.

148 WOODS INSTITUTE FOR THE ENVIRONMENT | STANFORD UNIVERSITY
E.U. ENVIRONMENTAL LEGISLATION RELEVANT TO AGRICULTURE
Concerns about water pollution caused by farming emerged in the late 1970s and 80s, driven to a large extent by the eutrophication of the Baltic and North Seas.
It became clear that agriculture was the main source of this pollution, although urban and industrial waste waters also made a significant contribution to the extent of accounting for about 30 percent of it. Within agriculture, both point sources such as farm yards and diffuse pollution through seepage of nutrients from fields to ground and surface water contribute to pollution. In addition, ammonia deposition arising from agriculture is an important contributor to eutrophication particularly in the Baltic Sea.
The legislative response to water pollution was two-fold, building often on efforts already made by some member states with respect to urban wastewater treatment and better nutrient handling and use at farm level. In 1991, legislation dealing with pollution from agriculture—the nitrates directive—was agreed to alongside legislation dealing with urban wastewater. The nitrates directive requires the monitoring of waters by member states to determine the extent of pollution problems, the designation of zones where the problems exist, and the preparation of codes of good agricultural practice to apply voluntarily across each member state. It also requires the preparation and application of obligatory action programmes in designated vulnerable zones or across entire territories, where the member state decides on such an approach in order to afford full protection to its water. Several member states, among them Germany, Denmark, Netherlands, Finland, and Ireland, have taken a whole territory approach to water protection, but all member states have designated at least some of their territories.
It is worthwhile to dwell on the basic contents of the codes of good agricultural practice under the nitrates directive. They contain provisions, to be established in detail by each member state, related to periods when the land application of fertilizers is inappropriate, the protection of water courses, the capacity and construction of storage vessels for livestock manures, the methods for the land application of inorganic fertilizers and organic manures. They may also include elements such as the establishment of fertilizer plans by farmers and minimum crop cover to avoid or reduce nitrate pollution of water, especially in winter. These measures are essentially toughened within action programmes, with particular provisions related to the land application of fertilizers related to crop needs. The measures listed above all have a background in common sense as well as research results. A consistent application of them in countries, such as Denmark, with an intensive agricultural history is leading to very considerable reductions in fertilizer use and greater efficiency in manure use without significant reductions in crop yields. Greater efficiency in manure management is an important goal in the implementation of the nitrates directive and should be worldwide not just as a contribution to protecting water quality, but also as a means of reducing greenhouse gas emissions and of conserving natural resources for the future.
Water protection legislation has been strengthened further in the E.U. since 1991, notably by the Water Framework directive in 2000, which establishes the goal of clean water in qualitative terms by 2015, through the preparation and implementation of river basin management plans applying from 2010. While this legislation is much broader in scope than the nitrates directive, its successful implementation will depend largely on the success of efforts made under the nitrates and urban wastewater directives. A huge volume of work is currently underway in the preparation of the management plans.
The legislative basis for nature protection is contained in directives related to Wild Birds (1979) and Habitats (1992). Their background is concern about declining bird and other populations and habitats which have many causes, including changes in agricultural practice, fragmentation of land parcels due to urbanization and road construction and predation by rising populations of feral ex-domestic cats. These directives have both a general aim

U.S. Agricultural Policy and the 2007 Farm Bill 149
of protection and a more specific aim of the establishment and management of sites of importance for birds and for habitats within the so-called NATURA 2000 complex. Therefore, they apply to land management generally and very specifically also within and around the sites of importance. These sites, about 25,000 in total, account for about 18 percent of the total land and immediate coastal area of the E.U. divided equally among farmland, forestry, coastal, and marine areas. The farmland involved is overwhelmingly in private ownership, and its management brings the farmers involved into a direct daily relationship with nature conservation.
In recent years, E.U. environmental legislation related to agriculture has been gradually strengthened through directives dealing with plant protection products (1991), with further moves now towards integrated crop management and air quality and emissions (notably with respect to reducing ammonia) (1999 and 2001). On air, there is a current debate on Commission proposals to reduce ammonia emissions by almost 30 percent by 2020 over 2000 with the aim of simultaneously contributing to addressing air, climate, and water protection issues. The effort on air should be seen in the context of the Convention on Long-Term Transboundary Pollution, comprising some 50 European and North American parties. Soil degradation is a significant problem both in terms of areas subject to wind or water erosion and low levels of organic matter, with serious concerns about reported declines in organic matter in a number of member states. The Commission has recently made proposals for soil protection which are being debated in the European Council and Parliament.
In summary, today there is a considerable volume of environmental legislation in place, or in the process of being put in place, to flank agricultural practice. Because of the extent of farming and the number of farmers—6 million in E.U. 15 and approximately 4 to 5 million in the new member states, including Bulgaria and Romania—implementation presents a challenge. Nevertheless, there is increasingly better application by member states, and this trend is likely to continue as the value of the legislation is recognized by both society and farmers. There are, in Europe as in the United States, environmentalists who claim the legislation doesn’t go far enough and farmers who claim it is burdensome, unnecessary and threatening their freedom to farm and compete. But there are also a large and growing number of farmers very interested in going in the direction of integrated farming—which involves developing best practice across a range of environmental topic areas—as a means of convincing environmentalists and consumers of the overall safety of their produce and their long-term commitment to the environment.
THE EMERGENCE OF AGRI-ENVIRONMENT IN THE CAP
During the 1980s, some member states of the E.U. and the European Commission began to develop concepts and very limited practice encouraging farmers to deliver, on a contractual basis, environmental services to society. These services were built on top of general concepts of good farm practice, encompassing legislative and non-legislative requirements mainly related to water protection and land management. The 1992 reform of the CAP introduced for the first time across the E.U. a specific agri-environment measure, dealing with the delivery of environmental services going beyond good farm practice. The measure was obligatory for member states to offer to farmers, but voluntary for farmers themselves to take up or not as they saw fit. It was agreed that all member states would set up their own agri-environment programmes designed to maintain and generally enrich the environment and, subject to Commission approval, to ensure that they did indeed go beyond the baseline of good farming practice and did provide payment levels related only to income foregone, costs incurred, and transaction costs.
Several, but not all, member states took up the challenge of agri-environment wholeheartedly, and in the period 1993–1999 set up a very wide range of measures related to their environmental priorities. The content of the different programmes varied enormously: organic farming, plant and animal breed preservation, river bank enrichment, hedgerow preservation and enhancement, wetland preservation, habitat enrichment, farming methods

150 WOODS INSTITUTE FOR THE ENVIRONMENT | STANFORD UNIVERSITY
designed to preserve threatened bird species, and so on. Different member states took different approaches. Some set up whole farm approaches, backed by a range of tasks to be completed by the farmer dealing with enhanced nutrient management, farm and farmyard maintenance and enhancement, water, and especially river bank and wetland protection. Others favoured approaches targeted at the local or regional level, often dealing with habitat preservation. Most gave high prominence to organic farming uptake. In all, several hundred different sub-measures were introduced within the different programmes, involving about 18 percent of the E.U. 15’s utilized agricultural area and about the same percentage of farmers. Uptake was highest in member states with a longstanding tradition of relatively extensive agriculture and lowest in those with either very intensive agriculture or with a lesser administrative capacity. It is worth dwelling a moment on this. It seems that the incentive to enter agri-environment schemes is not sufficiently high in intensive farming areas. On the other hand, it has to be acknowledged that, at least in the early stages, the administrative effort to ensure good schemes on the ground is considerable as designers, farmers and controllers all require training and have to learn by doing. Despite this, it has to be acknowledged that farmers, when given the opportunity, have shown themselves very willing to deliver agri-environment services to society when the carrot of payments to do so is held before them. A lesson learned on agri-environment over the years is the value of establishing indicators to measure and help improve environmental performance.
CONDITIONALITY FOR CAP PAYMENTS
In the 1992 CAP reform, the conditionality of direct income support payments to farmers to the respect for environmental requirements was introduced for a few market sectors (arable, beef, and sheep), as an option which could be applied by member states. Uptake of the option was very limited and confined largely to combatting overgrazing by sheep in hill areas, which was hardly the nub point of the relationship between the environment and agriculture. Conditionality was strengthened and broadened in the 1999 reform, in that member states were obliged to take appropriate measures where problems arose. While progress in the implementation of this approach was underway, the debate on the concepts for the 2003 reform overtook it. The translation of these concepts into legislation applying progressively since 2005 is cross-compliance, as applied within the CAP today.
Direct support payments to farmers, decoupled from any obligation to produce (decoupled support), are now the norm within the CAP for most land-using production sectors. A main condition to be fulfilled by those in receipt of direct payments is that they respect key legislation in the areas of public, plant and animal health, animal welfare, and environment and also respect requirements established by each member state regarding the maintenance of farmland in good agricultural and environmental condition. This is cross-compliance. Where farmers do not respect its requirements, they are subject to a reduction or indeed eventually a cancellation of direct payments. In terms of understanding, it is useful to stress that while farmers receive support in the E.U. in a wider policy frame, cross-compliance is a condition to be fulfilled, but it is not the reason for support. Farmers, in any event, have, like the rest of society, to respect legislation and are fined for breaches thereof. Therefore, a farmer not respecting legislation within the cross-compliance framework can face both the reduction or cancellation of his direct payments for non-respect of this condition and a fine for breaching the legislation. The environmental legislation involved includes that already indicated relating to wild birds, habitats, nitrates, and pesticides, as well as groundwater and sewage sludge. The content of this legislation, and requirements related to the maintenance of land in good agricultural and environmental condition covered by cross-compliance, equates largely to good farm practice, but is much more formally defined.
In practical terms, there is very strong emphasis on nutrient and pesticide management, the use of sewage sludge (very limited in Europe), and the protection of habitats. Additionally, basic protection of soil (erosion, organic matter, and structure) is required, as well as of permanent pasture and landscape features. These aspects, broadened

U.S. Agricultural Policy and the 2007 Farm Bill 151
to include the other domains, provide reassurance to society that farmers in receipt of direct support payments are respecting basic requirements and, in particular, are not causing pollution, which society would have to clean up. The farmer also is in a better position, as he can point to the conditions he is obliged to respect and thus build consumer and environmentalists’ confidence in him.
As cross-compliance has been in place only since the beginning of 2005, there have been some teething problems, linked mainly to the clarity of obligations on farmers and the control of these obligations. This is hardly surprising, but it is encouraging that, where there is a long history of rigorous enforcement of legislation and where clarity has been a feature of implementation, problems are very much less. It is important that farmers are fully aware of what is expected from them and that the E.U. has within its rural development policy a strong training and advisory arm designed to achieve this awareness.
AGRI-ENVIRONMENT IN THE WILDER CONTEXT OF RURAL DEVELOPMENT
As part of the 1999 CAP reform, a new second pillar was introduced dealing with Rural Development, not just to complement the more familiar pillar of market support and management, but to address more broadly the wider issues of the countryside related to and even beyond agriculture and forestry.
The measures included in rural development concern the modernization of agriculture, including supporting the installation of young and retirement of older farmers, training to face the challenges of sustainable farming, the modernization of farms and the processing of agriculture and forest produce. It also includes agri-environment, the afforestation of agricultural land, the protection of forests and, more widely, the improvement of aspects of rural life, with a strong emphasis on local development driven by local concerns and ambitions.
Within E.U. financial arrangements, the first rural development programme runs for a period of seven years up to the end of 2006. Member states at National or Regional level design programmes subject to Commission approval, financed partially from E.U. and partially from national funds. In the programmes of most member states, agri-environment measures played a key role with the result that now, at the end of the current end programming period, agri-environment extends to about 25 percent of the E.U. 15’s utilized agricultural land, with a growing interest and uptake in the new member states that joined in 2004. The measures do not differ significantly from those of 1993–1999, but in most instances, the base line of good farm practice has been sharpened on the basis of improving implementation of environment legislation. Additionally, improvements in the design of the various sub-measures have been introduced, responding not just to experience gained in 1993–1999, but also through various pilot projects supported by the E.U. notably in the context of sites designated under Natura 2000.
A strong emphasis was put on the development of agri-environment indicators, not just on physical measurements of uptake such as area and number of farmers involved, but, more critically, on the effectiveness of the measures. Is the water getting cleaner? What is the effect on habitat quality? Are specific species actually being protected and enhanced? As the programming period 2000–2006 is not yet finished, and the results of evaluation therefore not yet complete, these questions await answer. But it is important that they be answered in due time, so that improvements can be introduced if necessary, the environment is improved, and the taxpayer gets full value for his investment.
For the period 2007–2013, a second round of rural development programmes is foreseen, and work is now underway on the details. A range of measures covering the development of competitive agriculture, the environment, and the quality of rural life are available to member states, with agri-enviroment again as a sole obligatory measure. For this period, the environmental emphasis stems from the E.U. commitment to reverse the trend in biodiversity decline by 2010, the extra protection of water, and a contribution to the mitigation of and

152 WOODS INSTITUTE FOR THE ENVIRONMENT | STANFORD UNIVERSITY
adaptation to climate change. This is a huge agenda, mostly drawn from international commitments and shared in ambition, if not detail, by the USA. In addition, member states will have their own agendas on improving air quality and soil protection.
An interesting issue has emerged in the development of agri-environment, and particularly with respect to the specific measures on the Natura directives and, in future, under the Water framework directive. These may require that farmers take certain actions, going far beyond normal good farm practices, in order to enhance the protection of certain habitats of species or to protect water at levels above the various E.U. standards. This could involve a very significant change in management practices or, at the extreme, a change in land use from, say, arable farming to grassland or even forestry. In such limited situations, where the farmer is obliged to take actions going beyond reasonable good practices, he should be supported, and this is foreseen on the basis of income foregone and costs incurred.
SOME CONCLUSIONS
This paper has been prepared to provide insights on the interrelationships between environment and agriculture, including in policy terms in the E.U. The belated arrival of environment legislation to flank changes in farming has, of course, led to some friction between environmentalists and farmers. But as understanding of the issues involved has grown, a better relationship should emerge, especially as the implementation of environmental legislation improves. The conditions for the direct support to farmers under the CAP include a strong environment “volet” under the cross-compliance mechanism. The payment for services going beyond this baseline under agri-environment is well established, and farmers are responding positively to it.
So what of the future? The chief vocation of farming is the production of food, and we ignore this at our peril, but there is also far greater recognition today of environmental services needing to be provided. We need to work further to understand and shape the services farming can provide on water, biodiversity, air, and soil protection, in contributing to energy supply and climate change adaptation, to tourism and to maintaining a balance between rural and urban economies. Rigor is needed to ensure that agriculture and the environment return to or remain in harmony, but it is unreasonable to expect farmers to maintain and, especially, enhance the environment without support. It has not been easy to reach the present policy equilibrium, and it needs continuing support in future to fully achieve its ambitions. That’s a challenge to be faced in the E.U. but also in the U.S.A., even if the detailed policy shapes may be slightly different.
U.S. Agricultural Policy and the 2007 Farm Bill 153
CHAPTER III-4
Agri-Environmental Programs in OECD CountriesWilfrid Legg
IntroductionAgriculture has a major impact on the environment in OECD countries. It accounts for around 40 percent of total OECD land use and nearly 45 percent of water use and, in many countries, dominates and shapes the landscape. All OECD countries share the goal of moving toward a path of long term sustainability in which improving the environmental performance of agriculture has become a high policy priority. However, the intentions are not always matched by corresponding policy actions.
Agriculture is integrally connected with the environment, exerting pressure on natural resources, especially land and water; a source of environmental damage, such as water pollution, soil erosion and reduction of biodiversity; but also of environmental benefits, such as the provision of landscape features, flood control, biodiversity, and carbon sequestration. However, these environmental effects (externalities) are not always reflected in market prices, and thus the market alone will not lead to an economically and environmentally efficient allocation of resources.
Output-linked support measures based on commodities produced or inputs used remain dominant and only a small share of program support can be identified as directly targeted at environmental improvement. Nevertheless, other payment programs are often conditional on farmers adopting environmentally friendly practices (cross-compliance); services available to farmers, such as research, education, training, and information, often have a high environmental content; and agriculture is subject to environmental regulations (polluter pays principle) on, for example nutrient loading in water courses or pesticide residues in food. Although effective agri-environmental policies reduce environmental degradation and conserve natural resources, they can also alter relative prices and thus affect production and trade patterns.
At the risk of overgeneralization, in the past agri-environmental policies in OECD European (and Asian) countries adopted policies that tended to give a high priority to enhancing or conserving environmental benefits provided on working farms, whereas those in the United States tended to give a high priority to reducing or containing environmental harm by idling sensitive agricultural land off working farms. Policies in Europe would be characterized as rewarding farmers for the benefits they provide to the environment in the process of using resources in farming, while in the United States policies would be characterized as rewarding farmers for the benefits they provide to the environment in the process of retiring resources from farming. In Australia and New Zealand the tendency has been for agriculture to be subject to economy-wide regulations—with few specific measures for the agricultural sector alone. In all countries agriculture is expected to comply with broad environmental regulations—with greater or lesser applicability, partly dependant on property rights accorded to farmers—and varying degrees of enforcement to limit or reduce environmental harm.
In OECD European and Asian countries, support provided to producers from government policies is significantly higher than in the United States, Canada, and Australasia. But this is changing in terms of some apparent

154 WOODS INSTITUTE FOR THE ENVIRONMENT | STANFORD UNIVERSITY
convergence of policy objectives, types of measures used and support provided—although not yet in overall levels of producer support as measured by the OECD’s Producer Support Estimate (PSE)1.
Types of Agri-Environmental Programs in OECD Countries2
ECONOMIC INSTRUMENTS
Agri-environmental payments
Many OECD countries have made payments available to farmers, on a voluntary basis, to encourage them to implement more environmentally-friendly farming practices. The European Union, Norway, Switzerland, and the United States in particular, have substantially increased the use of agri-environmental payments. An expansion in these measures started in the mid-1980s and has continued. More recently, other countries, including Korea and Japan, have also begun to make greater use of these measures. Agri-environmental payments typically represent a modest, albeit rising, share of overall budgetary support to agriculture in these countries.
CATEGORIES OF AGRI-ENVIRONMENTAL POLICY MEASURES
Economic instruments affect costs and benefits of alternative actions open to farmers, with the intended effect of influencing behavior in a way that improves environmental outcomes. They include monetary transfers—payments and charges/taxes—and the creation of new markets, i.e. tradable rights relating to the use of natural resources or pollution.
Command-and-control measures impose requirements on producers to achieve specific levels of environmental performance. They primarily consist of mandatory regulatory requirements, such as environmental restrictions, permit requirements, and maximum rights or minimum obligations, which are enforced through the legal system. Cross-compliance mechanisms require farmers to meet specific environmental conditions in order to be eligible for agricultural support programs. In cases where support payments are relatively high, cross-compliance measures effectively serve as de facto regulations for most farms that are eligible for payments, as the potential sanction of losing that support provides strong incentives for farmers to meet the specified environmental conditions.
Information and advisory measures include measures to improve information flows to promote environmental objectives, from the creation of knowledge to its application—for example, research, extension services, and product information.
Many agri-environmental policy measures have been introduced in response to domestic, regional, or local environmental issues. However, international pressures also look likely to continue to exert a growing influence over agri-environmental policy. These pressures include commitments relating to a range of international environmental
1 The PSE calculations undertaken by the OECD are the internationally recognized measures of transfers to agricultural producers arising from agricultural policies. The results are published annually in Agricultural Policies in OECD Countries: Monitoring and Evaluation and in Agricultural Policies in Non-OECD Countries: Monitoring and Evaluation, where further details of the concept and definitions may be found. Readers are advised that the classification of the categories of PSE policy measures will change as from the 2007 report on Agricultural Policies in OECD Countries: Monitoring and Evaluation.
2 This is based on and updates material presented in Agricultural Policies in OECD Countries—Monitoring and Evaluation 2003) and on Inventory of Policy Measures Addressing Environmental Issues in Agriculture for selected countries, which is available on the OECD Internet website at: http://www.oecd.org/countrylist/0,2578,en_2649_33791_34691514_1_1_1_1,00.html

U.S. Agricultural Policy and the 2007 Farm Bill 155
agreements to address trans-boundary environmental issues, such the 1997 Kyoto Protocol, which specifies greenhouse gas (GHG) emission targets for 2008 to 2012, and the International Convention on Biological Diversity (CBD), which requires signatory countries to develop national strategies for the conservation and biological diversity.
The diversity of programmes across OECD countries and regions is vast. Some notable trends include payments to support the adoption and maintenance of low-intensity farming systems, particularly organic farming. Also common are land retirement payments to promote environmental objectives; payments linked to specific habitat or landscape management requirements; and transitional payments to assist farmers meeting the structural costs of complying with new environmental regulations. A range of payment programmes has also emerged in some countries to address issues of climate change; for example, promoting the planting of shelterbelts for the sequestration of greenhouse gas emissions and biomass crops for bio energy production.
Payments are typically provided annually to farmers under fixed-term management agreements, with the amount paid being linked to the area of farmland covered, rather than specific environmental outcomes. The intention is generally to reimburse farmer compliance costs on the principle of profit forgone, sometimes with the addition of an incentive element. Some programmes also include the provision of training and technical advice to assist farmers in carrying out the targeted activities.
Many programmes have attracted high rates of participation. For example, coverage under agri-environmental payment contracts reached almost 20 percent of European Union farmland by the end of the 1990s. The growing prominence of these measures has invited increasing scrutiny. A number of studies point to evidence of environmental improvements generated by these programmes for example, they have been variously credited in Europe and the United States with reducing soil erosion, limiting pressures from input use, constraining pollution and overgrazing, and contributing to maintaining valued cultural landscapes and habitats.
Yet in certain cases, significant shortcomings have also been identified in their design and implementation. For example, some payments have not been well targeted and have been implemented without an overall evaluation of the associated costs in relation to the environmental benefits; e.g., payments have been made available to farmers uniformly at a national level, yet the benefits have been concentrated locally or have been site-specific. The effectiveness of payments has been compromised where they have been implemented together with more production-linked support policies, encouraging farming practices associated with environmental problems.
Organic agriculture is expanding in all OECD countries to meet increasing consumer demand, although it still only accounts for a relatively small share of agricultural production and food consumption. Organic agricultural practices are generally more environmentally friendly than conventional agriculture, particularly with regard to lower pesticide residues, a richer biodiversity and greater resilience to drought. Organic farming systems also hold the potential to lower nutrient run-off and reduce greenhouse gas emissions. However, there are situations where intensive management within organic farming regimes can impoverish biodiversity, and animal manure can be applied in excess of requirements. More land may also be needed, in some countries, to produce a given level of output, which has an alternative value in terms of its potential use as, for example, nature areas, depending on its current and historical use.
In many OECD countries, financial support is specifically provided to organic farmers, usually on a per hectare basis. This support is provided on short-term basis to help offset the costs of conversion or on a continual basis as payment for the provision of environmental benefits. Over recent years, the number of countries introducing such measures has been increasing, particularly in Europe.

156 WOODS INSTITUTE FOR THE ENVIRONMENT | STANFORD UNIVERSITY
Coordination of policy approaches to organic agriculture, particularly when a number of different measures are being used, is reflected, for example, in the development of integrated action plans for organic farming. While organic producers can benefit from traditional agricultural support policies such as price support, such policies are likely to discourage the development of the organic sector. This is because such policies provide incentives to adopt farming practices that increase production (quantity) rather than those, like organics, which stress quality. Moves to reduce the dominance of these forms of support will be of benefit to organic producers and reduce the need for continual payments for organic production.
It has also been observed that some payments have ended up subsidizing basic environmental maintenance activities which, consistent with the polluter-pays-principle, should properly be carried out by farmers at their own expense. Payments in such cases tend to bestow a competitive advantage on the farmers who receive them, and thereby risk distorting agricultural production and trade.
A number of agri-environmental payment programmes have been improved over time in the light of experience and improved information. For example, since 1990 enrolments in the major environmental land retirement payment programme in the United States—the Conservation Reserve Programme (CRP)—have been targeted according to the Environmental Benefits Index (EBI), which scores estimated environmental benefits relative to costs. Further improvements were made to this system in 1996. The European Union’s agri-environmental payments are included in the “Second Pillar” of the CAP, together with structural adjustment measures, less-favoured area payments, and various rural development policies. Member states can choose, among a long list of agri-environmental measures, those adapted to their problems and priorities, as required under the comprehensive monitoring and evaluation procedures for programmes over the 2000–06 period. Member states have recently produced a midterm evaluation of these programmes, which has been used to design the next generation of pillar II programmes for 2007–2013. A minimum share of payments is now imposed on Axis 2 (land management), which includes mainly agri-environmental, animal welfare, Natura 2000, afforestation, and less-favored-area payments.
Charges and taxes
There still appears to be only limited application of charges or taxes based on the environmental damage caused by agriculture, notwithstanding the endorsement by OECD countries of the polluter-pays principle. This is in contrast to other sectors, where environmental taxes and charges are more common. The relatively rare application of pollution taxes in agriculture is commonly attributed to identification and measurement problems. Unlike a factory where pollution can normally be monitored at “point,” pollution from agriculture is often more dispersed, originating from many different farms and in varying intensities.
Nonetheless, some examples of these policy measures do exist. Since 1998 the Netherlands has tackled the measurement problem by introducing a range of levies on estimated off-farm emissions of nutrients above set limits. Since 2006 the system directly regulates the maximum amount of fertilizers (animal manure plus maximum amounts of nitrate and phosphate) that may be used on the farm. The former system (MINAS) regulated emissions, not usage, to comply with the E.U. nitrate directive. More commonly, environmental taxes are applied on farm inputs. For example, various taxes and charges are currently levied on pesticides in Belgium, Denmark, Finland, Norway, and Sweden, while fertilizer levies are applied in some OECD countries, including Sweden. Input-based taxes are generally inexpensive to administer, but may be less effective than a tax on pollution itself, as they do not discriminate on the basis of actual loading on the environment.

U.S. Agricultural Policy and the 2007 Farm Bill 157
Tradable rights
Tradable rights based on environmental quotas, permits, and restrictions also do not appear to play a significant role in agri-environmental policy, despite the growing use of such measures for environmental policy in other sectors (there is already experience with tradable CO2 permits within the energy sector). However, in the past decade, thehere is already experience with tradable CO2 permits within the energy sector). However, in the past decade, theHowever, in the past decade, the Netherlands has implemented systems of tradable permits in relation to the volume of manure produced by farms.
There are also examples of tradable schemes that are applied across a number of sectors, including agriculture. These include tradable rights for the development of wetlands (“Wetland Mitigation Banks”) in the United States and tradable water extraction rights, which have been implemented on a state/regional basis in the United States and Australia. Australia is developing a more market-based system for water, including the introduction of the trading of water across State boundaries.
COMMAND-AND-CONTROL MEASURES
Regulatory requirements
Regulatory requirements play a role in addressing environmental issues in agriculture in all OECD countries. Some of these requirements are specific only to agriculture, while others are part of broader national environmental legislation affecting many sectors, including agriculture. Regulatory requirements tend to be less flexible than economic instruments, as they do not allow producers the freedom to determine for themselves the most appropriate way of meeting environmental objectives. However, they also tend to minimize risk and uncertainty, and therefore constitute a vital element of environmental policy in most OECD countries, particularly with respect to acute environmental problems.
All OECD countries have applied legislative requirements to deal with problems relating to pollution and the degradation and depletion of natural resources. The main categories include requirements relating to the availability of certain inputs to farmers, (for example, through the registration of pesticides and other agrochemicals); farm practices, (for example, the setting of limits on the spreading of manure and stocking limits); and the application of mandatory procedures, (for example, planning or consent processes relating to land use, water extraction, and the construction of livestock facilities). Regulatory requirements are also common to protect specific valuable wildlife and habitats, and to protect agriculture and the environment from damage from invasive species and new organisms.
Over the past two decades, the trend has been towards more regulation and binding constraints, but not always uniformly across the whole sector—such as for large animal units in the United States, but not for small ones. A significant proportion of requirements imposed in OECD countries are applied at local and regional level. For example, in the European Union, standards are developed at a range of levels, stretching from the Union itself down to individual regions in member states. Regulatory requirements are often applied under the framework of over-arching legislation at the national, federal (or E.U.-wide) level; (for example, New Zealand’s Resource Management Act (1991) tasks Regional Councils with responsibility for environmental resource use policy). However, while the E.U. Nitrate Directive, which sets a benchmark limit on nitrate levels, is associated with the application of manure in the European Union, it leaves member states free to determine their own action programmes with respect to designated Nitrate Vulnerable Zones.
Overall, the degree of restrictiveness of environmental regulations varies substantially among OECD countries and regions. It is difficult to quantify whether differences in compliance costs have had a significant impact on farm competitiveness and the pattern of trade and location of agricultural production. Nevertheless, a recent OECD

158 WOODS INSTITUTE FOR THE ENVIRONMENT | STANFORD UNIVERSITY
study into linkages between environment and trade in the pig sector concluded that differences in compliance costs arising from the regulation of manure use tended to have much less of an effect on the international competitiveness of pig farms than other factors, including producer support, wage levels, land rents, and capital costs. Moreover, while most new regulatory requirements are perceived to increase costs, this is not always the case. In particular, there is evidence that the introduction of tougher environmental standards can sometimes improve on-farm efficiency; for example, through better use of nutrients on the farm, which can cut costs and increase gross margins.
Cross-compliance
In the past two decades, many OECD countries have made general support programmes, providing payments to agricultural producers, conditional on the respect of certain environmental constraints or the achievement of a particular environmental outcome. Such cross-compliance conditions are a significant part of agri-environmental policy in the United States, where an estimated 44 million hectares of highly erodible cropland and 31 million hectares of wetlands are subject to cross-compliance provisions, reflecting the high participation rate in general farmer support programmes.
Since the late 1990s, most general direct payments offered to farmers in Switzerland, including area and headage payments and payments based on historical entitlements, have also been made conditional on farmer compliance with environmental standards and farm-management practice requirements. Norway offers various forms of area-based payments and headage support for livestock on the condition that farmers meet environmental requirements. Environmental cross-compliance conditions have also become important in some European Union member states, following the inclusion of such conditions as an option in the implementation of direct payments, as part of the Agenda 2000 CAP reform package. Cross-compliance conditions, including for the environment, have been extended to most payments received by farmers following the 2003 CAP reform.
While cross-compliance measures are seen in some countries as an important means to integrate environmental objectives into general support measures, a note of caution is warranted. In particular, the effectiveness of such measures may be limited where they are tied to production-linked forms of support that continue to provide farmers with incentives to engage in environmentally damaging activities. Moreover, farmers will only participate where the benefits are sufficiently large that they still have a financial incentive to comply with the restrictions; this can make the attainment of environmental objectives effectively a hostage to ongoing support. Cross-compliance may not be best suited to addressing environmental issues that are of a more local nature.
INFORMATION AND ADVISORY MEASURES
Research
Many OECD countries have directed greater attention towards improving the knowledge base relating to environmental issues in agriculture in the past two decades, through increased spending on agri-environmental research, often undertaken in cooperation with private-sector interests. One notable trend in the past decade has been the development of agri-environmental indicators to improve the monitoring of the environmental performance of agriculture in countries such as Australia, Canada, Denmark, Finland, France, New Zealand, the Netherlands, Switzerland, the United Kingdom, and the United States, as well as regional initiatives carried out by E.U. institutions and under the North American Free Trade Agreement (NAFTA).

U.S. Agricultural Policy and the 2007 Farm Bill 159
Enhanced agri-environmental monitoring is now beginning to be utilized in the development and evaluation of policy. For example, in the United States, agri-environmental indicators have been used in the design of the Environmental Benefits Index (EBI) for targeting payments under the CRP, while agri-environmental indicators are also to be used to evaluate the implementation of environmental policies under Canada’s Agriculture Policy Framework, implemented as from 2003.
Technical assistance/extension
Increased agri-environmental research has often been complemented by greater emphasis on communicating advice directly to farmers on environmental issues, in order to induce voluntary changes in farming practices to improve environmental outcomes. Most governments have general advisory services and employ extension agents to work with farmers on technology development and transfer. Advice is commonly in the form of codes of good agricultural practice, such as recommended maximum rates of application of pesticides and fertiliser.
In the past decade, new communication tools have been introduced, including the Internet and the use of demonstration or “model” farms. Over time, the provision of information has also tended to encompass an increasingly comprehensive range of information; for example, Environmental Farm Plans in Canada, which focus on developing risk-management strategies for farmers, or Australia’s Environmental Management Systems, which integrate individual environmental farm objectives with regional targets.
In some countries—Australia, Canada, and New Zealand—government-led information policies are supplemented by the growing use of community-based approaches promoting the exchange and transfer of information, variously known as landcare groups or conservation clubs. These approaches make use of local expertise in solving environmental problems and rely upon farmers’ self interest in environmental conservation. Such groups seem especially well suited to addressing issues that are local in nature, but which extend beyond the borders of a single farm. Some of these groups receive administrative or financial support from central or regional authorities, while others are entirely self-financed and independent.
Product information
In the past decade, greater attention has also been directed at providing information on the environmental attributes of commodity outputs, in order to meet the demands of an increasingly well-informed and discriminating public. In particular, standards for “eco-labels” have been established in many OECD countries, backed-up by certification processes to verify their authenticity, in order to assist customers in distinguishing commodities grown without chemical fertilizers or pesticides from conventionally produced agricultural commodities. Products from such commodities tend to command discernible price premiums in many markets.
Some of these eco-labelling schemes are entirely market-based, often introduced by producer groups at the behest of supermarkets or other retailers. Others are government backed. For example, a large number of OECD countries—including Australia, the European Union, Canada, Norway, the United States, and Switzerland—have introduced government-enforced national organic labeling standards.

160 WOODS INSTITUTE FOR THE ENVIRONMENT | STANFORD UNIVERSITY
Environmental Payments in the Green Box of the URAAThe preamble to the Marrakech Agreement, establishing the WTO, states that sustainable development, environmental protection and conservation of scarce resources are explicit objectives and an integral part of the multilateral trading system. For agriculture, the domestic support provisions of the multilateral trade negotiations in the Uruguay Round Agreement on Agriculture (URAA), agreed to in 1994 and implemented since 1995, recognize the legitimacy of pursuing domestic policy objectives, including the need to protect the environment and conserve natural resources. The trade negotiations launched in Doha in 2001, for the first time in the WTO, include a significant programme of negotiations on trade and environment covering the relationships between WTO rules and multilateral environmental agreements and the reduction or elimination of trade barriers to environmental goods and services.
The URAA Green Box identifies domestic support measures that are exempt from reduction commitments and includes a variety of programmes related directly or indirectly to environmental protection. The Green Box comprises a wide range of measures such as general services (e.g. research, inspection, training, and extension), domestic food aid, decoupled income support, natural disaster relief, insurance and income safety net programmes, environmental programmes, structural adjustment assistance programmes, and regional assistance.
To be eligible for inclusion in the Green Box exemption, environmental policies must not act as an effective price support, must “have no, or at most minimal, trade-distorting effects or effects on production” and must be financed by the government. In addition to these basic criteria, there are two policy-specific criteria for agri-environmental payments, namely: (i) establishment of clearly defined environmental and natural resource objectives; and (ii) limitation of payments to only the extra cost or loss of income incurred by compliance with the government programme. Further, under structural adjustment assistance provided through resource retirement programmes, resource retirement programmes must retire land for a minimum of three years and must not link payments to prices or production that apply to land not retired.
Green Box exemptions are available to both developed and developing countries, although very few developing countries make use of Green Box exemptions for environmental policies. Among OECD countries only Mexico, Poland and Turkey (which does not have domestic support reduction commitments) have not notified any environmental payments in their Green Box exemptions. Of the 19 non-OECD developing countries (as classified in WTO) that submitted supporting tables relating to commitments on domestic support, only four (Argentina, India, Slovenia, and South Africa) claimed direct environmental programmes, with those for soil conservation being the most frequently cited.
Green Box payments constitute the main category of domestic support in many OECD countries, but their share varies considerably across countries/regions. The European Union, Japan, and the United States are by far the largest providers of Green Box payments in absolute terms, accounting for almost 80 percent of the base period total Aggregate Measurement of Support (AMS) for OECD countries. In Australia, New Zealand, Poland and the United States, Green Box measures accounted for more than 80 percent of total domestic support as measured in WTO since 1995. While support from policies assumed to have the greatest effects on production and trade has declined in many countries, support by OECD countries from Green Box policies has increased in the implementation period, as compared to the 1986-88 base period. Of the 14 OECD countries reporting Green Box spending, all have notified an increase in Green Box expenditures. Most of this increase was concentrated in three countries/regions—the United States, the European Union, and Japan. In the United States Green Box expenditure was greater than the totals reported for the AMS since 1995 and in Japan since 1998 (following the abolition of administrative price for rice).

U.S. Agricultural Policy and the 2007 Farm Bill 161
On average, most of the expenditures on Green Box policies by OECD countries were made for domestic food aid and general services. Domestic food aid was the single largest category of green support, most of which was spent by the United States. Expenditures on environmental programmes are not the dominant category in any OECD country. However, it should be kept in mind that the level of environmental payments in the Green Box does not necessarily reflect the importance that governments accord to environmental protection and conservation of natural resources, as other agricultural policies are related directly or indirectly to the environment (e.g. natural disaster, general services, regional assistance, etc.), while environmental regulations affecting agriculture are significant in most OECD countries. (See Tables 1 and 2).
Table 1: Classification of agri-environmental payments by OECD
1995 1998 2000
MILLION USD
SHARE (%)
MILLION USD
SHARE (%) MILLION USD
SHARE (%)
AREA/HEADAGE 363 8 502 7 465 8
INPUT USE 1,172 27 1,743 26 1,755 29
INPUT CONSTRAINT 2,707 62 4,314 63 3,665 60
HISTORICAL 41 1 89 1 87 1
GENERAL SERVICES 74 2 186 3 168 3
TOTAL 4,357 100 6,835 100 6,140 100
TOTAL SUPPORT ESTIMATE (TSE) 368,587 334,440 310,820
SHARE IN TSE (%) 1.2 2.0 2.0
Notes to Table 1
Total Support Estimate:
The monetary transfers to the sector as a whole arising from agricultural policies. Turkey is excluded from the TSE estimates shown above.
Transfers:
Area/headage: based on current plantings or animal numbers
Input use: based on use of specific fixed or variable inputs
Input constraint: based on limiting the use of specific fixed or variable inputs
Historical: based on historical support, area, animal numbers or production
General services: transfers to agriculture as a whole, such as research, infrastructure, inspection, and marketing and promotion
Source: Calculations are based on OECD TSE data and country notifications on domestic support to WTO. OECD TSE data are available at: SOURCE MISSING

162 WOODS INSTITUTE FOR THE ENVIRONMENT | STANFORD UNIVERSITY
Table 2: Classification of the main environmental policies in the Green Box and OECD PSE data base
COUNTRY NAME AND DESCRIPTION OF MEASURES
YEAR AMOUNT (MIL. USD)
CLASSIFICATION IN OECD PSE
CLASSIFICATION IN OECD GSSE
Australia 2000
National Landcare 47.9 Infrastructure
Bushcare 52.9 Infrastructure
National Rivercare Programme 13.6 Infrastructure
Murray-Darling Basin Initiative 83.1 Infrastructure
Environmental services for agricultural industries (Western Australia)
14.0 Infrastructure
Canada Prime Vert; Farm Environmental Stewarship Program (New Brunswick)
1999 18.9 Payments on constraints on fixed inputs
Czech Republic
Support for bee keeping 2000 2.1 Payments on unlimited area
Support for Ecological Agriculture 2.3 Payments on constraints on variable inputs
Maintenance of agricultural land 86.5 Payments on historical support
Support for cattle, sheep, goat and horse farming on permanent grasslands
15.2 Payments on limited area or headage
European Union
Protection of environment and preservation of the countryside, control of soil erosion, extensification, aid for environmentally sensitive areas; support and protection of organic production by creating conditions of fair competition; aid for forestry measures in agriculture; conservation of genetic resources in agriculture.
1999 5819.5 Payments based on area/headage (7%); payments based on input use (25%); payments based on input constraints (68%)
Hungary Assistance to the protection of arable land
1998 7.0 Payments on fixed inputs (50%)
Research (50%)
Assistance to the establishment of environmentally friendly crop structure
2.1 Payments on constraints on a set of inputs
Iceland Environmental programmes; afforestation
1999 2.9 Payments on constraints on fixed inputs

U.S. Agricultural Policy and the 2007 Farm Bill 163
Classification of the main environmental policies in the Green Box and OECD PSE data base (cont’d)
COUNTRY NAME AND DESCRIPTION OF MEASURES
YEAR AMOUNT(MIL. USD)
CLASSIFICATION IN OECD PSE
CLASSIFICATION IN OECD GSSE
Japan Payments for conversion from rice production: payments for maintaining paddy fields in environmentally good condition through growing any plants other than rice or other appropriate management.
1999 1024.6 Payments on constraints on fixed inputs
Support programmes for reduction of environmental burden due to dairy farming: payments to dairy farmers who practice appropriate management to tackle environmental problems
58.8 Payments on fixed inputs
Korea Payments for the prevention of soil erosion, soil acidification (soil conservation)
1999 0.07 Payments on variable inputs
Management of livestock wastes (purification of livestock excretions for prevention of water pollution)
1999 0.1 Payments on constraints on fixed inputs
Direct payments for environmentally friendly farming practices
1999 0.03 Payments based on area or headage
New Zealand Soil conservation 2000 4.3 Payments on constraints on fixed inputs (50%)
Inspection (25%); Infrastructure (25%)
Norway Subsidy to Ecological Production. Subsidy to research on, and to farmers changing to, ecological production methods
2000 4.8 Research
Subsidy to producers who refrain from field work on areas exposed to erosion in autumn.
17.0 Payments on constraints on a set of inputs
Subsidy to Summer Dairy Operations in Mountainous Regions
2.4 Payments on constraints on fixed inputs
Subsidy to Production on Steep Areas
4.0 Payments on fixed inputs
Fixed Area Support to Ecological Production
1.8 Payments on constraints on a set of inputs

164 WOODS INSTITUTE FOR THE ENVIRONMENT | STANFORD UNIVERSITY
Classification of the main environmental policies in the Green Box and OECD PSE data base (cont’d)
COUNTRY NAME AND DESCRIPTION OF MEASURES
YEAR AMOUNT (MILL. USD)
CLASSIFICATION IN OECD PSE
CLASSIFICATION IN OECD GSSE
Switzerland Payments for special ecological services
1998 517.2 Payments on constraints on a set of inputs
Payments for summer pasturing 46.1 Payments on unlimited area
Payments for set aside pasture land and renewable raw materials
12.9 Payments on limited area
Payments for extensive cereal production
29.8 Payments on unlimited area
United States Agricultural Conservation Program 1998 23.0 Payments on constraints on a set of inputs
Emergency Conservation Program 26.0 Payments on fixed inputs
Wetland Reserve Program (also see NRCS part)
121.0 Payments on constraints on fixed inputs
Wildlife Habitat Incentives Program
5.0 Payments on farm services
Conservation Programme Technical Assistance
41.0 Payments on farm services
Environmental Quality Incentives Programme
61.0 Payments on farm services; payments on constraints on a set of inputs
PSE is the Producer Support Estimate. It measures the monetary transfers to farmers arising from agricultural policies. GSSE refers to General Service Support Estimate (see notes to Table 1).
Expenditures on agri-environmental programs have increased rapidly in most OECD countries since the mid-1990s. In Australia the share of environmental programmes in total Green Box expenditure increased from 13 percent in 1995 to 29 percent in 2000, in the E.U. from 15 percent to 26 percent, and for the OECD area as a whole from 4.5 percent to over 7 percent over the same period. For the United States, the share of environmental programs in total Green Box expenditure remained constant at around a half percent.
In 2000, total monetary transfers to the agricultural sector as a whole—measured as the total support estimate (TSE) for OECD countries—amounted to US $321 billion and the producer support estimate (PSE) amounted to US $243 billion. In comparison, total expenditure on policies notified by OECD countries for the WTO’s “Green Box” amounted to US $7.7 billion, of which about 6 percent was for environmental programmes. In 2000, environmental payments (as reported in the Green Box) accounted for 29 percent of the PSE in Australia, 20 percent in the Czech Republic, 6 percent in the European Union, 3 percent in Japan, 1 percent in Canada, 1 percent in Korea, 9 percent in New Zealand, 7 percent in Switzerland, 1 percent in the United States, and 3 percent for the OECD as a whole. (see Figure 1).

U.S. Agricultural Policy and the 2007 Farm Bill 165
Figure 1. Share of environmental payments in the URAA green box, 2000
Notes to Figure 1:
The share for the Czech Republic is off the scale, at 63 percent (and mainly includes a large category, “maintenance of agricultural land”)
In the United States the Conservation Reserve Program is not included above, as it is classified under the Green Box category “structural adjustment through retirement”; the dominant category in the Green Box classification is domestic food aid
The high shares of agri-environmental payments in Australia, the Czech Republic, and the E.U. is accounted for by the absence or relatively low payments in other Green Box categories

166 WOODS INSTITUTE FOR THE ENVIRONMENT | STANFORD UNIVERSITY
Figure 2. Evolution of green box environmental payments (mill. US $)

U.S. Agricultural Policy and the 2007 Farm Bill 167
As measured by the PSE, payments to farmers for addressing environmental issues in agriculture have increased since the mid-1980s from 1 percent to around 4 percent of OECD support to producers, as measured by the PSE—which is dominated by market price support policies provided through trade measures—but would account for around 20 percent of support if only government budgetary transfers are considered. Moreover, these figures do not include agri-environmental spending in other areas, such as research, training, advice; or costs associated with regulatory measures; or payments to which environmental “cross compliance” conditions are attached.
There is a great diversity of agri-environmental payments across OECD countries and regions. In practice, agri-environmental payments tend to be linked to on-farm practices associated with certain environmental outcomes. Payments directly based on environmental outputs such as “improved landscape” or “more diversity” is rare. In particular, many European countries and the United States greatly increased the use of these measures since the 1990s. Some notable trends include the growing use of payments to support the adoption of less-intensive farming practices; land retirement payments to promote environmental objectives; and transitional payments to assist farmers in implementing structural changes intended to benefit the environment. By contrast, in some countries, including Australia, payments are made through community-based schemes involving local governments and other community groups.
Measures providing payments based on farming practices are prominent and include support to farmers adopting low-intensity farming systems, including organic production systems and other less input-intensive forms of production. Two types of payments can be distinguished that encourage organic farming: transitional per-hectare payment tailored to any income loss as a result of converting to organic production, and continuing payments based on area and headage to stimulate organic farming after the transition period. Such payments are particularly important in the European Union, Norway and Switzerland.
Most of the agri-environmental payments in the Green Box are linked to area planted, livestock numbers, or input use. Several agri-environmental policies that are placed in the WTO’s Green Box are classified in the OECD PSE calculations as those that are production- and trade-distorting (e.g. payments for organic production, payments for conversion from rice production in Japan). In OECD countries, on average, only 3 percent of total agri-environmental payments reported in the Green Box are provided to the sector collectively (i.e. not to individual producers). Whether environmental programmes have trade effects depends, firstly, on the production effects of a programme and, secondly, on whether the commodities involved are either traded directly or act as a substitute for a traded commodity.
Production and Trade Impacts of Environmental Payments in the Green BoxThe production impact of agri-environmental programmes depends on the design of a particular measure as well as the programme coverage and the amount of payment. However, the effects are ambiguous. They can be either positive or negative. For example, the assertion is often made that agri-environmental measures aiming at extensification of existing production processes result in reduced output. However, if farmers spend a substantial share of the received payments for purchases of operating and capital inputs, then a positive production effect is possible. Thus, the individual production impacts will depend on the technical and response relationships between the agricultural and environmental outputs, which vary across regions and over time. Moreover, the incentives to increase agricultural production induced by agri-environmental payments could be offset or even reversed when the provision of such payments is subject to specific constraints on farming practices. For example, an

168 WOODS INSTITUTE FOR THE ENVIRONMENT | STANFORD UNIVERSITY
agri-environmental payment might be provided to farmers to maintain agricultural activities and associated landscape benefits in marginal production areas, under the condition that farmers comply with constraints on the use of pesticides or livestock densities that reduce the risk of surface and groundwater pollution.
An agri-environmental payment in conjunction with an input/output constraint will have a production and trade impact, but as these effects work in opposite directions, the combination of the two measures can result in an outcome that is largely production- and trade-neutral. Hence, the production and trade impacts of measures that are implemented jointly have to be assessed for the entire bundle, rather than for the individual measures.
The results of statistical analysis in the OECD show that agri-environmental policy measures are important determinants of agricultural production in OECD countries. However, their impacts are smaller than those for inputs. The analysis suggests that if agri-environmental payments are increased by 50 percent , production, on average, would increase by 2.1 percent .
Assessing whether an agri-environmental policy might be trade-distorting is to test for possible trade effects as a result of policy. This essentially amounts to an empirical check on potential jointness of commodity and environmental outputs, and on international spill-overs from domestic policy measures. The jointness of agricultural production and environmental outputs from agricultural activities is central to the issue of trade effects and distortions associated with agri-environmental policies. Joint production of agricultural and environmental outputs implies that even an optimally designed and targeted agri-environmental policy aimed at internalizing domestic externalities may affect trade flows and may impose burdens on a country’s trading partners. Thus the issue is to what extent and under which conditions environmental payments should be allowed in the Green Box and how they can be evaluated with a view to limiting negative effects on both trade and the environment. In cases where producers are unable to switch to a different production system (i.e., technically fixed output-proportions) according to changing economic incentives, agri-environmental policies will directly affect the level of commodity production.
On the hand, when commodity and environmental outputs can be provided independently of each other, the standard policy approach would be to let market demand and supply determine the output of private goods, and to use targeted and decoupled policy measures to ensure the supply of environmental outputs by farmers and non-agricultural producers according to societal preferences. Agri-environmental policies then have merely indirect effects on the production of agricultural products, through their impact on wealth, liquidity, and income risk. Agri-environmental payments for the planting and maintenance of hedgerows or the rebuilding of stonewalls as means of enhancing the aesthetic value of the cultural landscape are examples of a weak link between agricultural and environmental outputs. In contrast, measures such as land set-aside programmes or support to organic farm production involve a more direct link between environmental objectives and agricultural output.
The notion of “non- or minimally trade-distorting policies” could be operationalized by requiring that notifying countries prove that the proposed policy is the least trade-distorting of the alternatives that allow them to achieve a certain environmental outcome. Indicators such as rates of soil erosion or pesticide and nitrate concentrations in ground water may be useful yardsticks. Thus, the onus will be on governments submitting agri-environmental policies to WTO to demonstrate that such payments are legitimate and do not represent the Polluter-Pays-Principle. In addition, agri-environmental programmes must, inter alia, be transparent, have clearly defined and, as far as possible, quantifiable objectives. Disaggregated, sectoral, empirical case studies could be useful in identifying such policies. In our view, the empirical approach used in this paper could provide a useful framework for analyzing the production and trade effects of different types of environmental policy measures, such as quantitative restrictions on inputs, payments, or cross-compliance programmes.

U.S. Agricultural Policy and the 2007 Farm Bill 169
Summary• Agri-environmental policies, as measured by payments granted, generally account for a very small share of
support to producers and “Green Box” payments—but they are growing.
• There appears to be some convergence in policy objectives and instruments used across OECD countries but there is a greater incentive to explore market-based solutions to agri-environmental concerns in countries with lower levels of production-linked support.
• Countries with high levels of production-linked support emphasize the joint provision of commodity and non-commodity outputs; the policy focus is on supporting the “input” and “farm practice” side of the production activity, rather than on the environmental “outcome.”
• Cross-compliance is finding favor. It is a potentially effective way to get farmers to improve environmental performance (which public opinion likes) while they continue to receive payments (which farmers like) and acts as a lever to enforce environmental targets within budgets (which policy makers like), but it is not necessarily the most efficient approach.
• Many agri-environmental programs do not have clearly defined objectives (outcomes to be achieved, the period of time implied, and the farmers targeted to adopt the appropriate farm practices) and little evaluation of policies, particularly ex post, in terms of net environmental benefits, farm incomes, and government budget outlays.
• Markets for agri-environmental goods and services, or quasi-market approaches to address agri-environmental issue are at a very early stage of development but are potentially important (such as in trading of carbon credits or paying for biodiversity or aesthetic landscape provision).
• The property rights accorded to farmers in terms of defining the “reference level” that distinguishes between the conditions under which farmers should pay (for environmental damage caused) and be paid (for the environmental goods and services they provide) vary across countries and time; the polluter-pays principle is often weakly enforced in agriculture, due to the non-point source nature of many emissions
• The results of statistical analysis in the OECD show that while agri-environmental policy measures are important determinants of agricultural production in OECD countries, the analysis suggests that if agri-environmental payments are increased by 50 percent, production, on average, would increase by 2.1 percent.

170 WOODS INSTITUTE FOR THE ENVIRONMENT | STANFORD UNIVERSITY
Annex I: Agri-Environmental Policies by Country
AUSTRALIA
A range of policies have been implemented to address agri-environmental concerns. The National Landcare programme, in which about 40 percent of farmers participate, provides funding for community-based approaches, with nearly AUD 160 (USD 117) million over 2004–08, through promoting the exchange and transfer of information. Landholders can claim a tax deduction for expenditure relating to Landcare operations and water storage. Funding of AUD 18 (USD 13) million is available under the Environmental Management Systems programme to improve farm management.
Agriculture is affected by a range of environmental policies. The National Strategy for Ecologically Sustainable Development provides the framework for most environmental and natural resource policies, and funding to states/territories to enact legislation supporting national strategies. The National Action Plan for Salinity and Water Quality aims to reverse salinity and water quality problems, with funding of AUD 1.4 (USD 1.0) billion over 2000–08, while The Natural Heritage Trust, focuses on biodiversity and sustainable natural resource management, with funds of AUD 1.3 (AUD 0.9) billion over 2004–08. Under the National Water Initiative, funding of AUD 2 (USD 2.5) billion is provided for programmes, which include irrigators, to move toward full cost recovery for water, expand trade in water, improve access entitlements, plan for environmental needs, and enhance water management. Farmers are provided rebates for on-farm diesel use, equal in 2005 to AUD 660 (USD 500) million of budget revenue foregone, while biofuels are subject to lower taxes than fossil based fuels. The Greenhouse Challenge Agricultural Strategy is a voluntary farmer-based initiative aiming to reduce greenhouse gas emissions. Farming is affected by Australia’s commitment under the Montreal Protocol to eliminate, by 2005, methyl bromide use, an ozone depleting substance.
CANADA
The key agricultural policy legislation in Canada is the federal-provincial-territorial Agricultural Policy Framework (APF). This five-year policy (2003–2008) has five pillars: food safety and quality, science and research, sector renewal and skills development, risk management, and environment. For environment, the objective is to accelerate efforts to reduce agricultural risks and provide environmental benefits, supported by on-farm action and measured against established clear and measurable agri-environmental targets, using agri-environmental indicators.
Measures aimed specifically at agri-environmental concerns vary considerably and include, regulations, financial incentives, voluntary measures and research. Through the APF, there are various programmes such as the Environmental Farm Planning Program, the National Farm Stewardship Program, the Greencover Canada Program, and the National Water Supply Expansion Program. In addition, tools are being developed to help farmers make better land-use management decisions through, for example, the National Land and Water Information Service.
The main environmental policies affecting agriculture include legislative and regulatory measures through such federal acts as the Canadian Environmental Protection Act; the Canadian Environmental Assessment Act; the Species at Risk Act; and the Pest Control Products Act. In general, the objectives of these laws are to conserve Canada’s environmental resources and minimize public health risks caused by environmental degradation and pollution. Agricultural practice is also regulated at the provincial and municipal level.

U.S. Agricultural Policy and the 2007 Farm Bill 171
FRANCE
Expenditure on agri-environmental programmes increased over the 1990s and now accounts for 15 percent of total national agricultural expenditure. Since 2000, agri-environmental programmes have covered the whole country and most farmers, aiming to promote diversified cropping patterns, crop rotation, and sustainable farming practices. The programmes provide payments over 2000–2006, such as for hedge maintenance and converting arable land to grassland. Also, support is provided for integrated farm management and conversion payments for organic farming, which occupies less than 1 percent of agricultural land. Eco-food labels are also promoted.
Subsidies and taxes address agricultural pollution. A programme to control agricultural water pollution covers 60 percent of the costs of constructing manure and slurry storage facilities for 50,000 farmers and amounts to EUR 1.28 billion over 2000-06, a nine-fold increase since the early 1990s. Pollution taxes are levied on phosphates for all farmers and on nitrates for large livestock producers, based on emission estimates. Some herbicides are banned, and a pesticide tax, introduced in 2000, levied relative to toxicity, involves pesticide producers paying EUR 40 million annually. Voluntary initiatives, such as Ferti-Mieux, encourage improved farm nutrient management.
Farming is subject to economy-wide environmental measures. A biofuel production scheme from 2005 aims to raise the share of biofuels in transport fuels to nearly 6 percent by 2010 through production support and fuel tax reductions, while biomass and animal waste used for energy generation benefit from higher tariffs into the national grid. A diesel tax concession (about one seventh of the normal rate) is provided to farmers involving about EUR 950 million annually of budget revenue foregone. Irrigation is supported, both infrastructure costs (up to 65 percent and water charges (about one-fifteenth of household charges). Commitments under international environmental agreements—such as lowering nutrient loadings (into Lake Geneva, the Rhine, and North Sea), ammonia emissions (Gothenburg Protocol), and methyl bromide use (Montreal Protocol)—affect farming.
GERMANY
Expenditure on agri-environmental programmes in Germany has risen substantially and is largely administered at the Länder level. Currently spending on agri-environmental measures is about 13 percent of total farm expenditure. This expenditure is largely aimed at providing payments to farmers for environmentally friendly farming practices (e.g. to reduce water pollution and enhance biodiversity conservation, and organic farming). Also, there are regulatory measures that enforce certain environmental farming practices, such as on fertilizer application and livestock densities; while the 1998 Federal Soil Protection Act requires farmers to adopt soil conservation practices. Organic farming is also encouraged through the Federal Organic Farming Scheme. Organic farming accounts for over 4 percent of farmland in 2003, and the aim is to increase this to a share of 20 percent by 2010.
Agriculture is affected by a number of economy-wide environmental measures. Farmland in nature conservation areas is exempt from property tax. Farmers are also provided an 80 percent exemption on the standard rate of tax on fuels, although this exemption will be reduced to 40 percent in 2005. Under the Renewable Energy Sources Act, grid operators are obliged to buy electricity using a differentiated feed-in tariff. Biofuels have tax exemptions, and biomass installations for heat production are supported by the government. Farming is also affected by commitments under international environmental agreements—in particular, the reduction of nitrate pollution into the Northeast Atlantic (OSPAR Convention) and the Baltic Sea (HELCOM Convention) and ammonia emissions under the Gothenburg Protocol.

172 WOODS INSTITUTE FOR THE ENVIRONMENT | STANFORD UNIVERSITY
ITALY
Expenditure on agri-environmental programmes has risen substantially, accounting for 10 percent of total agricultural payments in 2002, of which over 80 percent was E.U, co-financed, with 90 percent provided to farmers in central and northern Italy and 10 percent for the south. About 90 percent of payments were provided for conversion to organic farming, adoption of integrated farming, and grassland management. Other measures aim to reduce erosion, limit water use, and enhance biodiversity conservation, such as payments of EUR 202/head for endangered cattle species.
Agriculture is affected by a number of economy-wide environmental measures. The 1992 Hunting Act requires that 20–30 percent of agricultural and forestry land should be devoted to fauna protection. Water abstraction charges were introduced in 1994 under the Galli Act at very low rates for farmers of EUR 36/100 litres/second compared to EUR 1,550 for households and EUR 11,362 for industry in 2001, while subsidies are also provided for irrigation capital and operational costs. A pesticide tax, introduced in 1999, is 2 percent of the retail price; and a reduction of 22 percent of the full fuel tax is provided for agriculture, estimated to cut variable costs by about 14 percent. Incentives for biofuels are provided, mainly for biodiesel, through exemptions on excise duties amounting to EUR 300 million over the period 2002–2005. Farming is also affected by commitments under international environmental agreements, such as lowering ammonia emissions (Gothenburg Protocol) and methyl bromide use (Montreal Protocol) and addressing desertification (UN Convention to Combat Desertification).
JAPAN
Japan relies mainly on budgetary payments to address agri-environmental issues. Expenditure on agri-environmental programmes more than doubled over the 1990s, but represents only 10 percent of total payments to farmers. Adoption of sustainable agricultural practices is encouraged by concessionary loans, tax relief, and payments to farmers’ groups to help reduce fertilizer and pesticide use, as well as a mandatory code of practices for pesticide application. Payments to mountain farmers aim to prevent conversion of farmland to other uses and maintain a range of ecosystem services associated with farming in these areas. Irrigation and drainage infrastructure is also financed from the national budget.
Tax exemptions, low-interest loans, regulatory standards and other policy instruments are also used to address agri-environmental issues. Farmers, and some other users, are exempt from water charges, as well as energy and fuel taxes. In 1999 measures where introduced to enhance livestock manure management, including the use of subsidies, low-interest loans and credits, and regulatory standards for manure storage. Some Prefectures (local governments) finance facilities that recycle farm waste, such as manure, and others set targets to reduce farm nutrient pollution of water. Regulations under the 1970 Water Pollution Control Law set upper limits for agricultural pollution, such as from pig and cattle units, and the 1972 Offensive Odor Control Lawffensive Odor Control Law covers livestock.
MEXICO
Policies addressing agri-environmental are limited. Agri-environmental payments are possible under PROCAMPO, for soil and water conservation, although farmer uptake of these payments has been limited to date. A number of programmes support forestry, but only one aims at the reforestation of farmland, and eco-certification of shade-grown coffee plantations is being developed. Budget transfers to the National Water Commission reduce farmers’ irrigation costs, while an energy subsidy also reduces farmers’ power costs for pumping water.

U.S. Agricultural Policy and the 2007 Farm Bill 173
Economy-wide environmental policies also affect agriculture. Under the Federal Law on Water Taxes (1982), a system of water abstraction charges was established, but farmers were exempt from these charges up to 2003, although they are liable for water pollution charges introduced in 1992 under the same law. The International Boundary and Water Commission resolves water issues at the Mexican-United States border, including sharing water resources for irrigation, while the North American Commission for Environmental Cooperation, established under NAFTA in 1994, addresses regional environmental issues, for example, transgenic maize. The National Environment Programme also provides a framework for biodiversity and natural resource conservation.
NEW ZEALAND
Regulation is the main policy measure used to achieve agri-environmental objectives. Two nationwide, overarching policies address environmental concerns: the Resource Management Act (RMA, 1991) and the Hazardous Substances and New Organisms Act (HSNO, 1996). The RMA integrates measures governing resource management, and its key themes are: sustaining the potential of natural resources; safeguarding the quality of soil, water, air, and ecosystems; and avoiding, remedying or mitigating adverse effects on the environment. The HSNO aims to protect the environment by preventing and managing the adverse effects of hazardous substances, including pesticides and new organisms—any animal, plant, or microbe—not currently present in New Zealand.
The environmental policy framework affecting agriculture is characterized by decentralization of decision-making and devolution of responsibility. The RMA and HSNO are implemented by 74 territorial local authorities, which are empowered to determine their own priorities for managing the environment. The local authorities charge farmers in order to recover costs associated with programmes and applications, while responsibility for resource management is with farmers.
UNITED KINGDOM
Expenditure on agri-environmental programmes increased five-fold over the period 1993–2004, rising to GBP 245 (EUR 360) million. Following the government’s 2002 Strategy for Sustainable Farming and Food, together with the Rural White Paper and CAP reforms, agri-environmental programmes are being developed to encourage sustainable practices across all farms and to continue with conservation of high-priority habitats and landscapes. Support is also provided for conversion to organic farming, while voluntary Codes of Good Agricultural Practice (soil, water, air) encourage farmers to minimize water pollution.
Agriculture needs to respect national and international environmental policies. The Bioenergy Infrastructure Scheme provides farmers grants to expand biomass and bioenergy production, linked to consumer tax reductions for biodiesel and bioethanol. Diesel fuel tax is reduced by nearly 90 percent for farmers, involving around GBP 180 (EUR 265) million annually of budget revenue foregone. National agricultural targets are included under the Biodiversity Action Plan, such as reversing the decline in farmland birds by 2020. Farming is affected by commitments under international environmental agreements, including lowering: nutrient loadings into the North Sea (OSPAR Convention), ammonia emissions (Gothenburg Protocol), and methyl bromide use (Montreal Protocol).
UNITED STATES
Agri-environmental programs form a growing dimension of agricultural policy. The Conservation Reserve Program (CRP) aims to remove from production highly erodible cropland (HEL) and the Wetlands Reserve Program

174 WOODS INSTITUTE FOR THE ENVIRONMENT | STANFORD UNIVERSITY
(WRP) seek to reconvert farmland to wetlands. Both the CRP and WRP retire land for periods varying from 10 to 30 years in return for annual payments. Under the Environmental Quality Incentives Program (EQIP) and the Wildlife Habitat Incentives Program (WHIP) payments defray costs for respectively adopting sustainable farming practices, such as for soil and water quality conservation, and providing wildlife habitat. The Farmland Protection Program (FPP) aims to avoid farmland being converted into urban use by purchasing development rights to farm properties. Cross-compliance provisions also require that to receive payments under commodity programs farmers must not cultivate HEL (sodbuster) or drain wetlands (swampbuster).
The 2002 Farm Act substantially increases funding for agri-environmental policies. For the period 2002–07, funding will be USD 3.5 billion annually, a 75 percent increase over the annual spending for 2000–02 of USD 2 billion annually, which was 8 percent of budgetary payments. The Farm Act expands the CRP and WRP but its emphasis shifts to supporting conservation practices, especially under EQIP. Two new measures, the Conservation Security Program, pays farmers to adopt or maintain practices to improve soil and water quality or wildlife habitat; and the Grassland Reserve Program aims to preserve and improve native grass species. The Farm Act also supports technical advice and research to promote sustainable farming. Of the nearly USD 17 billion irrigation construction expenditure considered reimbursable by the Federal government, irrigators have been allocated USD 3.5 billion to repay over 50 years at zero interest. Water charges are considerably lower than those paid by industrial and urban users. The International Boundary and Water Commission resolves water resource allocation issues, including for irrigation, at the U.S.-Mexican border.
Economy-wide environmental policies also impact agriculture. Between 1994 and 1998, seven agencies provided USD 3 billion annually to address non-point source pollution. The Clean Water Act (CWA) has responsibility for reducing water pollution, but non-point sources of pollution such as agriculture are not directly covered by the CWA, although large confined animal feeding operations require pollution permits and implement comprehensive nutrient management plans. Policies affecting agricultural water pollution are mainly implemented at the state level, using a mix of measures which vary across states, such as restrictions and taxes on fertilizer and pesticide use and payments for adoption of best management practices. Some federal agri-environmental measures directly (e.g. EQIP) and indirectly (e.g. CRP, WRP) affect water quality, as adoption of soil and water conservation practices can help to reduce off-farm flows of soils, nutrients, and pesticides into water bodies. Also the Great Lakes Water Quality Agreement between the U.S. and Canada addresses concerns related to agricultural water pollution. To reduce urban vehicle carbon monoxide pollution, the Clean Air Act requires the use of oxygenates in about a third of national petrol use, which has increased the demand for ethanol, mainly produced from maize and already used as a fuel extender and octane enhancer. A tax exemption is provided for the use of ethanol and assistance granted to develop ethanol production facilities, while there are exemptions on federal fuel taxes for on-farm machines and vehicles. The U.S. is a signatory to the Montreal Protocol, which provides a phase-out period for the ozone-depleting methyl bromide pesticide, and the Gothenburg Protocol on long-range transboundary air pollution, which includes ammonia.

U.S. Agricultural Policy and the 2007 Farm Bill 175
CHAPTER III-5
U.S. Environmental Programs and Their Compatibility with Green Box Provisions under the WTO Agreement on Agriculture
David Blandford, Tim Josling, and Kaush Arha
SummaryThis paper focuses on the compatibility of U.S. agri-environmental programs with the Green Box provisions of the Uruguay Round Agreement on Agriculture (URAA). If a new WTO agreement is concluded under the current Doha Round of negotiations, it is likely that the amount of payments that can be provided to farmers in the more trade distorting ways will be reduced. As a result, greater attention will be directed to the use of the Green Box, which is unlikely to be subject to any such reductions.
Payments under the Green Box are supposed to generate no or minimal distortions in production or trade. Those made under environmental programs are allowed if they provide compensation for the additional costs incurred or income foregone in meeting program standards or conditions. However, payments that are designed to provide incentives for producers to participate in environmental programs are not specifically covered and appear potentially subject to legal challenge. A recent WTO panel ruling appears to imply that a strict interpretation of production distortion could be applied to Green Box payments. Income support payments that are shown to be linked even indirectly to production or land use decisions could be found ineligible for inclusion in the Green Box. These factors imply that care will be needed to design WTO-compatible programs that result in the appropriate supply of environmental attributes while not being linked to the volume of agricultural production or specific land use.
If Green Box payments are to be used to achieve environmental objectives, current criteria may eventually have to be modified. The difficulty is how to achieve this without the risk that environmental programs will themselves become a mechanism for providing production and trade distorting subsidies to farmers. Several modifications to existing Green Box criteria may help to avoid this. These include requirements for transparency, explicit (measurable) program criteria, and limits on incentive payments. Enhanced monitoring and surveillance could help to minimize abuse. These changes would impose some constraints on the design of environmental programs in the United States and other countries. However, the clarification of Green Box criteria would be in the long-term interests of those who would like to see the further development of agri-environmental programs, while limiting the potential for international trade distortions.

176 WOODS INSTITUTE FOR THE ENVIRONMENT | STANFORD UNIVERSITY
U.S. Environmental Programs and Green Box Provisions under the WTO Agreement on AgricultureThe Uruguay Round Agreement that resulted in the creation of the World Trade Organization (WTO) in 1995 was the first international agreement to place limitations on the amount of government support to agriculture. Under the Agreement on Agriculture a cap was imposed on the total value of subsidies considered to be most trade-distorting—the so-called total Aggregate Measure of Support (AMS), often referred to as the Amber Box—and this cap was reduced progressively by an agreed amount. For the United States, an initial AMS limit of $23.1 billion was cut to $19.1 billion over a six-year period, 1995–2000, and has stayed at that level since that time (see Table 1).
Agricultural support is on the agenda of the current Doha Round of WTO negotiations launched in 2001. The focus is on the three “pillars” of the URAA—domestic support, market access and export competition. The aim is to reduce trade-distorting domestic support further, cut agricultural tariffs, and eliminate export subsidies. Reductions in allowable domestic support (and increased access for imports) could necessitate changes in current agricultural programs in order to conform to a new WTO agreement (see Chapter II-2 in this book).
The URAA identified a number of types of payments to agriculture exempt from scheduled reductions. Chief among these are Green Box payments, those that are supposed to have a minimal impact on production and international trade. Payments classified as Green Box have become increasingly important for a number of countries, including the United States. They promise to gain greater significance if a new WTO agreement requires significant cuts in other types of payments.
The Green Box includes a wide range of measures, including certain types of environmental payments and those used to retire resources, including land, from agricultural production. The United States reported between $46 and $51 billion in annual Green Box payments to the WTO for the period 1995–2001 (see Table 1); the largest component of which was for food and nutrition programs ($34 billion in 2001), followed by “General Services” at $9 billion. Government expenditures under a range of U.S. environmental programs are currently included under the Green Box category or are likely to be so in the future, but only account for less than one percent of the Blue Box payments notified.1
In this paper we examine the conformity of those payments with Green Box criteria. One conclusion is that some of those criteria could make the legality of payments under existing programs subject to challenge. Careful crafting of the legislation is needed to avoid such problems. A second conclusion is that the Green Box criteria themselves may need to be clarified in the future to accommodate the most effective agri-environmental programs. But this will have to be done in a way that does not open up environmental payments to potential abuse as production-related subsidies. Some suggestions are made on ways in which this possibility might be reduced.
1 The United States has not notified payments under the 2002 Farm Act to the WTO. We assume here that those made under the environmental provisions of the Act would be notified as Green Box by the United States.
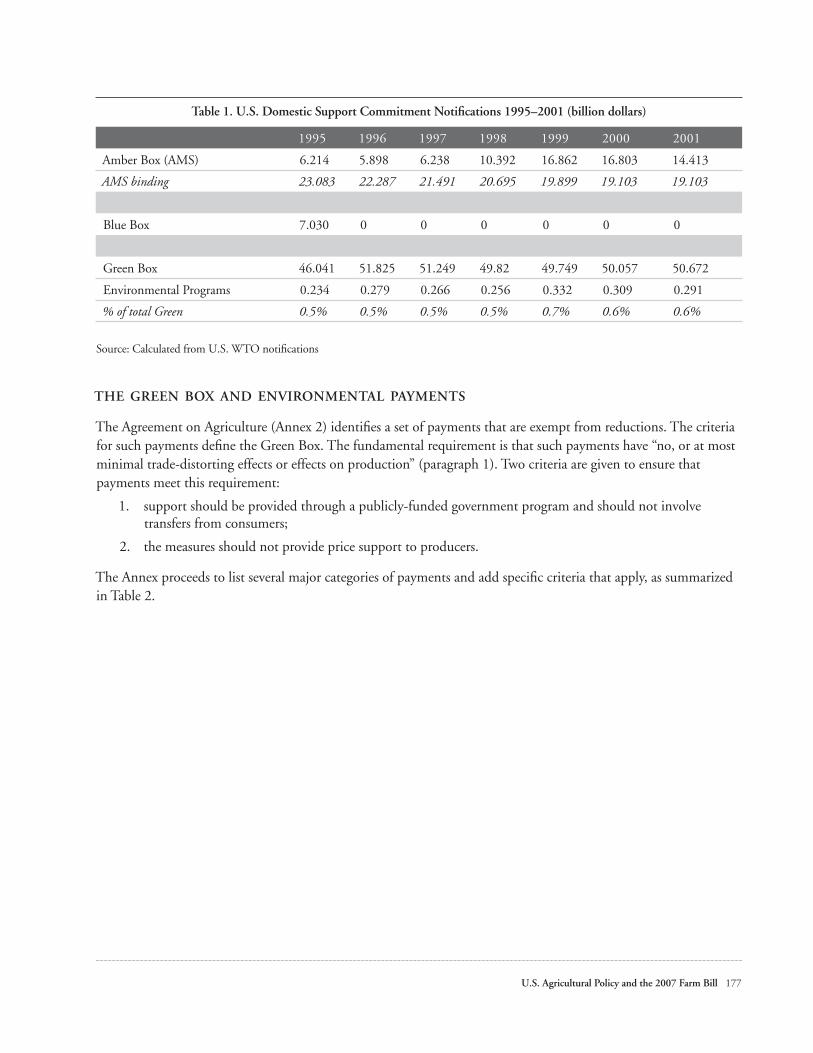
U.S. Agricultural Policy and the 2007 Farm Bill 177
Table 1. U.S. Domestic Support Commitment Notifications 1995–2001 (billion dollars)
1995 1996 1997 1998 1999 2000 2001
Amber Box (AMS) 6.214 5.898 6.238 10.392 16.862 16.803 14.413
AMS binding 23.083 22.287 21.491 20.695 19.899 19.103 19.103
Blue Box 7.030 0 0 0 0 0 0
Green Box 46.041 51.825 51.249 49.82 49.749 50.057 50.672
Environmental Programs 0.234 0.279 0.266 0.256 0.332 0.309 0.291
% of total Green 0.5% 0.5% 0.5% 0.5% 0.7% 0.6% 0.6%
Source: Calculated from U.S. WTO notifications
THE GREEN BOX AND ENVIRONMENTAL PAYMENTS
The Agreement on Agriculture (Annex 2) identifies a set of payments that are exempt from reductions. The criteria for such payments define the Green Box. The fundamental requirement is that such payments have “no, or at most minimal trade-distorting effects or effects on production” (paragraph 1). Two criteria are given to ensure that payments meet this requirement:
1. support should be provided through a publicly-funded government program and should not involve transfers from consumers;
2. the measures should not provide price support to producers.
The Annex proceeds to list several major categories of payments and add specific criteria that apply, as summarized in Table 2.

178 WOODS INSTITUTE FOR THE ENVIRONMENT | STANFORD UNIVERSITY
Table 2. Summary of Types of Allowable Green Box Measures
TYPE OF MEASURE CHARACTERISTICS
General Services Must not involve direct payments to producers or processors
Public stockholding Volumes governed by legislated food security targets, financial transparency, purchase, and sale at current market prices
Domestic food aid Clearly defined eligibility criteria based on nutritional objectives, financial transparency, purchase, and sale at current market prices
Decoupled income support
Clearly defined eligibility criteria for a fixed base period, payments not related to the volume of production, prices, or factors of production in any year after the base period, no requirement to produce to receive payments
Income insurance and income safety nets
Eligibility based on income loss >30 percent of average gross income for the previous three-year period or three-year average excluding high/low from a five-year period, compensation less than 70 percent of the income loss; no linkage to production, prices or factors of production
Disaster payments Production loss >30 percent of the average for the previous three year period or three year average excluding high/low from a five-year period, only for loss of income, livestock, land and other production factors; no more than replacement cost and not linked to requirements for future production; if during a disaster, no more than that required to alleviate further loss
Producer retirement schemes
Clearly defined eligibility criteria to facilitate retirement or switch to non-agricultural activities, conditional upon total and permanent retirement from marketable agricultural production
Resource retirement schemes
Clearly defined eligibility criteria to remove land or other resources from marketable agricultural production; land retirement for a minimum of three years; slaughter or definitive permanent disposal of livestock, no required alternative use for marketable agricultural production; payments not related to volume of production or other resources remaining in production
Investment aids Clearly defined eligibility criteria to assist financial or physical restructuring for objectively demonstrated structural disadvantages, payments not based on production or prices in any year after a base period; provided for a fixed period of time; no mandate for future production (except no production); and limited to the amount to compensate for structural disadvantage
Environmental payments
Part of clearly defined environmental or conservation program linked to production methods or inputs; payment limited to extra costs or loss of income caused by compliance
Regional assistance Limited to producers in objectively identified disadvantaged regions; payments not based on production in any year after a base period (other than to reduce production) or prices; available to all producers in eligible regions; limited to extra costs of loss of income related to undertaking agricultural production in the prescribed area
The range of government programs that fall under the Green Box can be grouped under three major categories:
1. the provision of general services for agriculture, such as research and extension, pest and disease control, product inspection, and technical assistance and training for producers;
2. various types of direct payments to producers, for income support, income insurance and disaster relief, as well as payments designed to promote structural adjustment and the supply of environmental services;
3. expenditures on domestic food security and assistance.
Annex 2 of the URAA contains several references to the exemption of government expenditures associated with environmental programs. These are:
1. research connected with environmental programs, under the general services exemption (expenditures on extension or training activities associated with the provision of environmental services would by implication also be exempt under the general exemption for such activities);
U.S. Agricultural Policy and the 2007 Farm Bill 179
2. infrastructural works associated with environmental programs, but only for capital expenditures, not the subsidization of on-farm facilities or use of inputs (such as irrigation water);
3. payments under environmental programs that are exempt, providing that they are part of a clearly-defined government environmental or conservation program, dependent on the fulfillment of specific conditions, including those relating to production methods or inputs, and subject to the condition that the amount of payment is limited to the extra costs or income foregone involved in complying with these conditions.
There are some other provisions that might apply to certain types of environmental programs and activities. In particular:
1. various payments (decoupled income support, income insurance and income safety-net payments) are permitted only if these are not linked to the volume of production or factors of production employed in any year after the base period;
2. payments to remove land from production must require removal for a minimum period of three years, and the land involved must not be used for the production of marketable agricultural products;
3. payments made under regional assistance programs (limited to disadvantaged regions) cannot be related to production, other than to reduce the volume of production; must be available to all producers within a region, where links to production factors must be made at a degressive rate above a threshold level of the factor concerned; and must be limited to the extra costs or loss of income involved in undertaking agricultural production in the disadvantaged area.
There are three important points to note about these provisions. First, they are heavily influenced by the aim that payments should not act to increase agricultural production or keep resources employed in agriculture that would otherwise exit the industry.2 The underlying assumption is that any program that leads to an increase in production or holds resources in production creates an economic distortion. A further assumption appears to be that there are no market failures (missing markets or unpriced outputs), so that the set of prices that would obtain under free trade would lead to a socially optimal allocation of resources. In terms of the design of programs that will qualify as Green Box, the implication is that programs that lead to the maintenance of resources in agriculture or could be interpreted as being linked to production decisions are potentially subject to challenge.
Second, the conditions attached to decoupled income support (paragraph 6 of Annex 2 of the URAA) are quite strict. They indicate that payments should not be linked to either the volume of production in any year after the base year upon which payments are based or the factors of production employed in any year after the base period. And they specify that no production shall be required in order to receive the payments. These conditions have implications for the use of cross-compliance—the linkage of environmental conditions to the receipt of income support payments. Cross-compliance can take various forms. A relatively weak requirement might be that land be kept in good agricultural condition. This does not specify that the land be used in a particular way, but it is difficult to envision how the requirement could be satisfied unless the land continues to be used for some agricultural purpose. A stronger cross-compliance requirement might be that land upon which payments are based be kept in a particular use (e.g., pasture). This presumably implies that the land will be used to graze livestock or to produce forage. In either case, as a minimum, it could be argued that eligibility for income support is linked to factor (land) use in years after the base period. If more stringent conditions on land use are attached to the payment, it might be argued that there is a direct linkage to production after the base period or that production is required in order to receive payments. For these reasons, the Green Box compatibility of income support payments that have environmental cross-compliance conditions could also be subject to challenge.
2 The emphasis is on avoiding subsidized competition and its consequent depressing effect on prices in world markets, i.e., protecting the interests of non-subsidizing exporters. Agri-environmental measures that involve explicit or implicit taxes or encourage the retirement of resources could lead to higher market prices. It is at least a logical possibility that such measures could be challenged by importing countries on that basis.

180 WOODS INSTITUTE FOR THE ENVIRONMENT | STANFORD UNIVERSITY
Third, to the extent that the rules acknowledge that some non-priced outputs may exist (for example, environmental goods or services associated with agricultural activities) Green Box conditions limit government expenditures to compensating producers solely for the costs they incur, or the income they forego, in complying with a set of environmental standards or conditions. This only allows for payments that offset the private costs of meeting such standards; it does not allow for payments that reflect the social value of an agricultural activity (when social benefits and private costs differ). The implication appears to be that in designing Green Box programs, the government cannot correct for a missing market by offering a payment that reflects the valuation society would place on an environmental output. Only in the special case where it is possible to set a standard that leads to a socially optimal output of an unpriced attribute will a payment that compensates producers for the costs of meeting the standard be consistent with both optimal domestic environmental policy and Green Box criteria. The implication is that Green Box rules place strict limits on what governments can do to ensure the supply of environmental services from agriculture.
CURRENT U.S. PROGRAMS AND THE GREEN BOX
As noted earlier, the adoption of significant reduction commitments in the cap on Amber and Blue Box support could mean that the Green Box could become a major avenue for support for U.S. agriculture in the future. For this reason, it is appropriate to examine in more detail the Green Box status of current specific U.S. agri-environmental programs.
There has been a gradual expansion in the number and scope of U.S. agri-environmental programs since the mid-1980s. The current legislation (2002 Farm Act) reflects an important development in the evolution of such programs in at least two important respects. First, greater emphasis is placed on reducing environmental damage (increasing environmental benefits) associated with working land, rather than on simply retiring environmentally sensitive land from production. Second, greater emphasis is placed on land protection or preservation (keeping land in agriculture). Given the current conditions that apply to Green Box payments, and the recent ruling in the cotton case, a further shift of emphasis in these directions needs to be done with care to avoid issues of Green Box compatibility.
The United States has a number of environmental programs that are candidates for inclusion in the Green Box. The principal approaches, and their relationship to Green Box requirements, can be illustrated by three examples—the Conservation Reserve Program (CRP), Conservation Security Program (CSP), and the Environmental Quality Incentives Program (EQIP).
The CRP provides annual payments and cost-share assistance to producers who establish long-term, resource-conserving cover on cropland that is considered to be environmentally sensitive. Under the general sign-up provisions, producers offer land for inclusion in the program through a competitive bidding process during designated sign-up periods. Offers are ranked according to an Environmental Benefits Index (EBI). The index takes into account likely benefits in terms of wildlife habitat, air and water quality, on-farm reduction of erosion, the likely duration of benefits, and costs. There is also a continuous sign-up provision that does not involve competitive bidding. The cost-share component is set at a maximum of 50 percent of the total costs of establishing approved practices. Maximum rental rates are established in advance of the sign-up period and are based on the relative productivity of soils in a given county and the average dryland cash rent or cash rent equivalent. Producers may offer to enroll their land at less than the maximum rental rate in order to increase the likelihood that their bids will be accepted. The annual rental payment can be augmented by up to 20 percent to provide a financial incentive for the establishment of certain practices (e.g., creation of field windbreaks or riparian buffers) and by an additional 10 percent for land located in wellhead protection areas. A per acre payment may also be added for the maintenance of eligible practices.
U.S. Agricultural Policy and the 2007 Farm Bill 181
From the perspective of the Green Box, a significant modification to the CRP was introduced with the 2002 Farm Act. Prior to the new legislation, land in the CRP could not be hayed or grazed except under emergency authority. The 2002 Act added a permanent exception for managed harvesting and grazing, including the managed harvesting of biomass (USDA 2003).
The CSP, introduced in 2002, rewards producers for ongoing environmental stewardship on working lands. It also provides incentives for producers to adopt additional conservation practices on their farms. Producers undertake to maintain these practices for 5 to 10 years. Eligibility is limited to specific watersheds, though the number of such areas has grown sharply since 2004. The CSP has not yet been notified to the WTO, but one assumes that it would be put in the Green Box. The CSP offers four separate payments, with differing obligations. The stewardship payments could be claimed as decoupled, as they are based on a fixed number of hectares in a land use category and on payments unrelated to price. But currently payments increase over the period of the contract, raising problems for their compatibility. Additional payments for adoption of enhanced conservation practices could qualify if they were based on costs. Any payment above the costs (or income forgone) would need to qualify under the heading of a decoupled payment rather than a conservation program.
The EQIP, originally introduced under the 1996 Farm Act, provides for technical assistance and cost-sharing of investments for conservation practices and financial incentives to encourage producers to undertake certain management practices. The legislation lists a number of criteria to be applied in determining cost share and incentive payments. The criteria are primarily benefit-related—for example, the contribution that a particular practice will make to improving air and water quality or to the habitat of an at-risk species. While the cost share payments will inevitably be linked to the costs incurred by producers in adopting a particular practice (and the share is limited to a maximum of 90 percent), there is no explicit requirement that the level of incentive payments should be linked to the income foregone by adopting a practice. The emphasis is on providing remuneration for the provision of services that would not otherwise be provided. The legislation specifically states that “incentive payments will be made in an amount and level necessary to encourage a participant to perform a land management practice or develop a Comprehensive Nutrient Management Plan that would not otherwise be initiated without assistance.” (NCRS Conservation Programs Manual, section 515.101).
These U.S. programs have several noteworthy characteristics in relation to Green Box conditions. They are:
1. The Green Box status of certain programs, in particular the CRP, could be judged with respect to either the environmental program provisions or the resource retirement provisions of the Green Box.
2. The cost-sharing conditions of U.S. environmental programs such as EQIP (less than 100 percent of the total cost of any investment in an environmental practice) appear to be consistent with Green Box criteria for environmental payments.
3. The use of a competitive bidding process for the CRP and the CSP could be interpreted as being consistent with the Green Box requirement that the payment level under environmental programs should equal income foregone. The rationale would be that producers would be expected to base their bids on the opportunity cost of the land offered to the program, e.g., the net revenue foregone from taking the land out of production.
4. The use of a land rental rate to establish the maximum base payment for the CRP strengthens the argument that the level of the payment is linked directly to the opportunity cost of achieving environmental objectives, since this reflects the revenue foregone by not renting the land out for production. The economic assumption would be that the rental rate would approximate the net returns to land and that the maximum bid price is therefore limited to the opportunity costs of the land concerned.

182 WOODS INSTITUTE FOR THE ENVIRONMENT | STANFORD UNIVERSITY
5. The grazing (or biomass production) provisions under the current version of the CRP appear to remove its eligibility for consideration under the resource removal (land retirement) provisions of the Green Box. They make the program potentially subject to legal challenge through the linkage between the use of the land and marketable production. If exemption is claimed under the environmental program provisions, it would presumably need to be demonstrated that grazing or biomass production is indispensable to the supply of the environmental benefits for which CRP payments are made. Otherwise the payments could be interpreted as production-enhancing subsidies (for livestock or other marketable products, such as biofuels).3
6. The legality of additional payments that provide a financial incentive to participate in programs (as in the CRP, CSP, or EQIP as noted above) could be challenged. The Green Box conditions do not appear to allow for additional remuneration linked to the social value of an environmental practice. In the case of the additional payment of 20 percent under the CRP, for the adoption of certain practices, the Green Box compatibility of the payment might be challenged unless it could be demonstrated that that the size of the payment is equivalent to the additional costs incurred or income foregone through the adoption of a given practice required to achieve an environmental objective.
7. However, incentive payments over and above compliance costs could qualify as direct income payments, subject to criteria for those payments (paragraph 6 of Annex 2). This would require them to be paid at a fixed rate on a fixed base.
In addition to programs like the CRP, CSP, and EQIP there has been an expansion of other programs that focus on land preservation in the United States. The aim of these is to keep land in agriculture rather than converting it to other uses. In many other countries, to the extent that an increased return to farming activities associated with price and income supports has not been sufficient to keep land in agriculture, the land retention issue has primarily been addressed through legal restrictions on the uses of land. The United States has tended to avoid a regulatory approach, adopting other mechanisms to try to keep land in farming. These mechanisms are not covered explicitly in the Green Box but their consistency with Green Box criteria merits examination.
Farmland preservation is addressed through the purchase of development rights or easements. Thus land which might otherwise have exited agriculture is kept in production. The funding of farmland preservation can be achieved through a variety of financial mechanisms, including transfers at the federal, state, and local levels. It can be achieved through the use of current taxation revenue or bond issues. However, programs are ultimately funded by taxpayers and potentially fall under the Green Box. Farmland preservation programs typically involve payments of limited duration (lump-sum or time-limited), rather than a continuous stream. However, such payments could be interpreted as affecting agricultural production if the payment is conditional on keeping land in agriculture (rather than simply as open space); Green Box compatibility could be open to challenge on that basis.
Other U.S. agri-environmental programs have aspects that may be inconsistent with Green Box criteria. A brief review is provided in Table 3. For the most part, the critical issue appears to be the compatibility of incentive components of programs with current Green Box criteria. It is that component of payments that seems to pose the greatest risk of opening programs to challenge on the grounds of their consistency with current international law.
3 Although outside the scope of this paper, it should be noted that the WTO status of various types of programs that seek to promote the production of bio-fuels in agriculture is unclear. To the extent that these provide subsidies to encourage the domestic production of tradable commodities or substitutes for these, they might be judged to be Amber Box.

U.S. Agricultural Policy and the 2007 Farm Bill 183
Table 3. Green Box Compatibility Issues Associated with U.S. Environmental Policies and Program
PROGRAM ISSUES
Conservation Reserve Program Ability to graze or produce biomass on land placed under the program could be challenged in terms of compatibility with the provisions for land retirement. Payments that are designed to provide a financial incentive to adopt specific practices and additional payments for land located in wellhead areas could be challenged under the conditions applying to environmental payments.
Conservation Security Program Contract payments made on the basis of stewardship, or the introduction and maintenance of practices could be challenged, if these have a production effect and payments exceed additional costs incurred or income foregone.
Environmental Quality Improvement Program
Incentive payments to encourage land management practices or develop a Comprehensive Nutrient Management Plan could be challenged under the conditions applicable to environmental payments.
Farmland Protection Program and Related State and Local Programs
Purchase of easements to keep land in agricultural production (limit non-agricultural uses) could be challenged on the basis of a production linkage.
Wetlands Reserve Program Payments linked to the retirement of marginal land from agriculture should qualify under the resource retirement provisions. Cost-sharing on restoration should qualify under the environmental program provisions.
Wildlife Habitat Incentives Program Program only has a cost-share component and should be Green Box-compatible.
Regulatory Programs (e.g., Clean Water Act)
Typically impose additional costs on producers rather than provide subsidies and should not be subject to challenge.
WTO LITIGATION
Much of the discussion of the compatibility of environmental programs with the Green Box is by nature speculative. There has been no WTO dispute panel ruling specifically on Green Box compatibility. No government has challenged the Green Box notification of others. In the one case where the green box notification was questioned by a Panel (the U.S.-cotton case, see below) no country has demanded that the U.S. re-notify past domestic support (AMS) totals.4
Lack of successful challenges so far does not mean that none are possible in the future. One such challenge could be on the basis that a payment for environmental services may have a non-trivial impact on output. As such, it may be actionable under the SCM. The U.S. has argued for a renewal of the Peace Clause in part to avoid such challenges. But this may only be effective if the policies were Green Box-compatible. The chance of establishing a Peace Clause that covered AMS payments is more remote. So the possibility of such a challenge remains. Legislation needs to be crafted with this in mind. In particular the payments should not be restricted to specific farms, though they can be regionally based.
The more serious challenge is not that of “serious prejudice” under the SCM but of non-compliance with the definition of the Green Box in the Agreement on Agriculture. Payments for environmental services would clearly meet the general conditions of not being tied to production or prices. The specific conditions are more problematic. One might argue that rewards for ecosystem services from the farm are payments above and beyond the costs of
4 This may of course be a result of the delay in notification, which makes retrospective challenges less plausible, or the fact that countries are currently negotiating in the WTO.

184 WOODS INSTITUTE FOR THE ENVIRONMENT | STANFORD UNIVERSITY
complying with existing government program. However, this may depend on the way in which the regulation is formulated. If the farmer has a choice between joining the environmental stewardship program or keeping eligibility for current farm income payments (direct payments, counter-cyclicals, etc.) then income forgone includes the amount of those payments. And if the payments are calculated with the cost to the farmer in mind then it would be difficult to argue that such payments were not the “extra costs” involved with complying with the program.5 So all or most of the stewardship payments might with relative safety be notified as Green Box payments.6
The legality of certain Green Box payments has recently been called into question as a result of a WTO ruling on a dispute between Brazil and the United States over U.S. upland cotton programs. The essence of the case was that a wide range of U.S. domestic subsidies, as well as some export programs, had caused serious prejudice to Brazil by depressing world cotton prices and increasing the U.S. share of world exports. The domestic programs challenged included some notified as Amber Box support (including marketing loans), some Green Box payments (including direct payments), and some not yet notified but potentially includable in an expanded Blue Box (counter-cyclical payments). The United States disputed these allegations, arguing that the Peace Clause sheltered many of these programs from challenge under the subsidies rules, and that in any case serious prejudice had not been the result of U.S. programs. The WTP Panel found that the export programs were in breach of U.S. limits for such subsidies and that many of the domestic programs did in fact cause serious prejudice.
As the panel was considering the extent to which direct payments were correctly notified as in the Green Box, they concluded that some of the payments declared to be Green Box by the United States do not satisfy the fundamental requirement, as they were linked to production. In the judgment of the panel this linkage was created by limitations on planting flexibility for land upon which the payments are based. Producers who wished to receive payments cannot plant fruits and vegetables on eligible land. This was interpreted to mean that there is, in fact, a linkage between payments and production and that, consequently, they may not qualify for the Green Box. This judgment is highly significant for the design of programs that countries wish to be exempt from reduction commitments—since it appears to imply that any direct linkage that can be established between payments and production decisions would make their Green Box status potentially open to challenge.
One solution could be to eliminate any conditions on the use of land upon which payments are based. Farmers who receive direct payments would be free to plant that land to any crop, including fruit and vegetables. This might make it possible for the United States to continue to provide direct income support to farmers that is not linked to current prices or production. As noted above, the need to avoid a linkage to production or factor use may make it difficult to use direct income support payments to achieve environmental objectives.
POSSIBLE GREEN BOX CLARIFICATIONS
The Green Box has not escaped criticism, even from those who applaud its basic rationale. The notion of “decoupling” from price and output is not a perfect fit for all situations (Josling, 2004). It was not specifically intended, for instance, to deal with the variety of rural subsidies that have emerged for a range of different purposes. As a consequence, the core of the debate over the Green Box needs to be shifted to another set of issues, including:
5 Even if the payments were to be calculated as the amount needed to encourage adequate participation (e.g. by distributing payment entitlements equal to the benefits from the system), this could still be interpreted as “the extra cost … involved in complying with the government program” as with lower costs there would be less compliance.
6 The precedent exists for a country to notify a part of the payments for a program as Green Box compatible, leaving other parts of the payment to be added into the Current Total AMS.
U.S. Agricultural Policy and the 2007 Farm Bill 185
• Does the Green Box adequately address the provision of public goods? Though they are apparently sheltered, there remains the problem of the joint production of public goods (environmental services) and private goods (farm products). Does the decoupling of payments from output and price of necessity result in the most appropriate conservation policy? If payments for environmental services increase output, would they still be Green Box-compliant?
• Does the Green Box condone the output effects of apparently decoupled farm income payments, through the impact on wealth, the removal of capital constraints, the expectation of future base acre changes, and the removal of some price uncertainty? Should one restrict the method of payments to farmers so as to avoid the output effect? Should one establish a separate category of Green Box payments for income payments and subject them to some additional disciplines?
Both of these issues have relevance for U.S. policy changes. Environmental payments need to be firmly in the Green Box if they are to be a satisfactory alternative to current programs. Those payments that are not for ecological services need to be safe from challenge and monitored to ensure that the basic notion of moving to less trade-distorting policies is not compromised.
In recognition of the fact that payments under environmental programs are likely to be linked to production to some degree, the Green Box attempts to place limits on the size of those payments. It does this by restricting them to compensating for costs incurred or income foregone through compliance. From the point of view of designing effective environmental programs, there is a serious weakness with such limitations. If the maximum that can be offered to producers is an amount equivalent to additional costs or income foregone, what inducement (apart from altruism) is there for producers to participate voluntarily in programs? Given the transactions costs involved, it is unlikely that individuals who base their decisions solely on economic rationality would ever choose to participate in a program if the additional returns from participation are negative.7 Furthermore, if no additional remuneration for the supply of environmental services is provided, producers may choose not to participate in programs.
As a result, current WTO rules, if they are strictly applied, may severely limit the ability of countries to develop and use environmental programs based on incentives. For this reason, it seems that some changes in the Green Box criteria are needed if countries are to design environmental programs that are not based on a regulatory approach and will be cost-effective in achieving desired outcomes. In the current negotiations, some countries have proposed that limitations be placed on the amount of payments that can be provided under the Green Box. The Framework document indicates that Green Box criteria will be “reviewed and clarified” to ensure that measures have “at most minimal, trade-distorting effects or effects on production” (WTO 2004a, p. A-3) but there is no indication that payment limitations will be introduced. It is unclear what exactly the clarification would entail, and how much modification can be made to the criteria without exceeding the limits of clarification and interpretation and venturing into the realm of renegotiation of the Green Box itself.
One approach would simply be to relax (or ignore) WTO constraints on environmental payments. This would be extremely attractive to those who simply want to use payments under environmental programs as an alternative mechanism for providing income support to producers. While this might have some attractions from a domestic political perspective in the United States by garnering support for program expansion, the same freedom would also be extended to other countries, many of which compete with the United States in global agricultural markets. The conditions agreed to in the URAA were clearly aimed at preventing countries from using environmental programs or environmental provisions attached to other programs to maintain or increase agricultural production above the
7 Transactions costs might be includable as a cost of compliance with environmental programs. However, a generous interpretation of the components or magnitude of such costs would probably increase the likelihood that payments under those environmental programs would be challenged.

186 WOODS INSTITUTE FOR THE ENVIRONMENT | STANFORD UNIVERSITY
level that would otherwise obtain. The challenge is to design a set of criteria for environmental payments that would allow countries to implement programs that yield the “right” level of environmental benefits, but limit their ability to provide subsidies that create an unfair competitive advantage.
Current U.S. agri-environmental programs, particularly the CRP, provide three key pointers in this regard. These are:
1. The use of a competitive bidding process that provides a transparent mechanism for matching private costs to public payments.
2. The establishment and use of explicit (measurable) program criteria in the form of an Environmental Benefits Index that can be used to evaluate the worth of different parcels of land relative to the costs of including these in a program.
3. The use of explicit limits on the incentive component of payments, where dollar amounts are largely linked to private opportunity costs.
One possibility would be to enshrine principals such as these in a revised set of Green Box criteria for environmental payments. A further improvement would be to strengthen the monitoring and surveillance of environmental programs. Currently, countries are supposed to notify programs under the Green Box to the WTO but there is no requirement to demonstrate that these satisfy Green Box criteria. The introduction of an ex ante program review mechanism and the associated development of a set of principles to be applied in the design of new programs, rather than reliance on an ex post dispute settlement procedure, could go a long way to improving both the design of agri-environmental programs and the efficiency with which the WTO functions.
CONCLUSIONS
The Green Box, those payments that conform to the conditions spelled out in Annex 2 of the Agreement on Agriculture, has both an economic and a political rationale. The constraints on domestic support were primarily designed with the notion of restraining farm support payments given through subsidies and deficiency payments on output and subsidies on inputs. As a result, the focus was on curbing the use of payments that stimulated output through means other than the restrictions on imports and the encouragement of exports. The notion of the Green Box as a “safe haven” for subsidies that were “decoupled” from current price or output was an important step in the process of introducing disciplines on domestic farm programs. It moved countries along a path that was in line with domestic notions of policy reform: the better targeting of payments and the shifting focus of support away from commodities toward farmers. Though some countries are still skeptical of the extent and consequence of this shift, most observers conclude that it is a move in the direction of better policies.
The United States and other countries include expenditures under environmental programs for agriculture in the Green Box. However, the conditions applying to these payments in the WTO Agreement on Agriculture are quite restrictive. They appear to limit the ability of countries to provide incentives for farmers to participate in environmental programs. The limitations are made more important by recent interpretations of the incompatibility of certain types of direct payments with the Green Box because of their linkage to production. Some of the payments made under current environmental programs by the United States (and by other countries) or income support payments that involve environmental cross-compliance may not qualify for inclusion under the Green Box.
Thus, in the absence of clear legal findings on point, it is best to define and adhere to the underlying rationale for Green Box exemptions—i.e. no, or at most minimal, trade-distorting effect on agricultural production. Well-designed farm conservation programs and policies should adhere to the spirit of the Green Box by clearly defining the criteria for farm enrollment in government conservation programs and payments based on meeting the stated

U.S. Agricultural Policy and the 2007 Farm Bill 187
specifications. This position is supported by current negotiating history. The E.U. in its early submissions to the Agriculture Committee argued that it wanted assurance that payments for compliance with environmental regulations be allowed, but indicated that these should be through Green Box measures. The issue has not been raised in recent proposals or in the various negotiating texts. The implication may be taken that no fundamental disagreement exists in the negotiation with the proposition that correctly-specified environmental programs are firmly in the Green Box.
The presumptive aspirations and official pronouncements of the major agricultural producing and trading nations support the proposition that a WTO challenge of well-defined payments for ecosystem services that are not blatant cover to channel otherwise restricted domestic support is unlikely. Both U.S. and E.U. are keen to see payments of ecosystem services to be eligible as Green Box measures. One would assume that most of the members of the Cairns group may well have similar aspirations or no specific objections as long as the payments are not trade distorting in a major way. Also most of the developing nations such as India, China, and Brazil are on the road to developing federal farm conservation measures to meet the growing environmental challenges facing these nations. Thus, at least at this time in WTO deliberations, it is difficult to identify a possible litigant that would take exception to member nations’ domestic support measures that include payments for ecosystem services to farmers as Green Box measures.
In order to allow the development of cost-effective environmental programs that rely on incentives and voluntary participation (the essence of the approach adopted by the United States), some modification of the basic criteria for environmental payments in the Green Box may be required. The difficulty will be to achieve this in such a way that environmental programs are minimally distorting and do not become merely an alternative device for providing production-related subsidies to agricultural producers.
ReferencesBlandford, D., R.N. Boisvert and L. Fulponi (2003). “Non-
trade Concerns: Reconciling Domestic Policy Objectives with Freer Trade in Agricultural Products”. American Journal of Agricultural Economics 85:668–673.
Blandford, D. (2005). Disciplines on Domestic Support in the Doha Round. IATRC Trade Policy Issues Paper 1. July 2005. http://agecon.lib.umn.edu/iatrc/ip050001.pdf
General Agreement on Tariffs and Trade (1994). The Uruguay Round Agreements. http://www.wto.org/english/docs_e/legal_e/legal_e.htm#ag
Josling, Tim (2004) “Domestic Farm Policies and the WTO Negotiations on Domestic Support” in Anania, Bohman, Carter and McCalla (eds) Agricultural Policy Reform and the WTO: Where are we heading?, Edward Elgar
U.S. Department of Agriculture (2003). “2002 Farm Bill—Conservation Reserve Program—Long-term Policy; Interim Rule.” Federal Register Vol. 68, No. 89:24830–24845. May 8.
USDA (2006). “2007 Farm Bill Theme Papers: Conservation and the Environment,” Economic Research Service, Washington, DC. June 2006
World Trade Organization (2004a). Doha Work Program: Decision Adopted by the General Council on 1 August 2004. WT/L/579. August 2.
World Trade Organization (2004b). United States—Subsidies on Upland Cotton. Report of the Panel. WT/DS267/R. September 8.

188 WOODS INSTITUTE FOR THE ENVIRONMENT | STANFORD UNIVERSITY

U.S. Agricultural Policy and the 2007 Farm Bill 189
CHAPTER III-6
Coordinated State and Federal Farm Ag-Conservation Efforts: The Case of Missouri and Nebraska
Kaush Arha, Steven P. Riley, and William White
I. IntroductionPrivate farm, ranch, and forest lands are essential to the success of any effective effort to conserve our America’s biodiversity and wildlife habitats. About two-thirds of the nation’s lands are under private ownership and harbor some of the most productive natural habitats, e.g. almost 80 percent of America’s wetlands are on private lands. An overwhelming portion of these private lands is comprised of working farm lands that simultaneously sustain the rural economy and offer a rich array of ecosystem services unmatched in scope and effect. Farmlands, the defining physical feature of the Midwest states along the Missouri-Mississippi river systems, sustain a rich array of biodiversity and wildlife populations associated with grassland, riverine and woodland ecosystems.
Federal ag-conservation programs authorized in the Farm Bill arguably represent the largest conservation imprint on the nation’s agricultural landscapes. Most federal ag-conservation programs have historically focused their application on Midwest farmlands. Over the last two decades, parallel with the growth in federal ag-conservation programs, the Midwestern states have experienced a proliferation of state, local and private efforts directed to farmland conservation. The broad smorgasbord of federal, state, local, and private conservation efforts harbor enormous synergies heretofore only marginally realized.
Federal ag-conservation programs are numerous and often complex to administer. Nevertheless, they frequently form the foundation upon which most state, local and private farmland conservation efforts arrange themselves, particularly in the Midwest. This chapter analyzes the interrelationship between state and federal farm conservation programs in two states: Missouri and Nebraska. It evaluates how state farmland conservation programs have evolved in their scope and sophistication to complement the implementation of federal ag-conservation programs and forge partnership with private conservation organizations.
The paper is organized are two parts. The first briefly assesses the private land initiatives administered in Missouri and Nebraska. The second analyzes the synergies that exist between state and federal farm conservation programs. The chapters concludes with brief suggestion of the range of policy actions that can be employed to more effectively instill tenets of cooperative federalism in delivery of federal ag-conservation programs.
II. State Initiatives to Advance Farmland Conservation Several state wildlife and resource agencies in the Midwest have developed specific programs to advance conservation on working farm lands within their states. These state initiatives have evolved to take advantage of and steer the application of the federal ag-conservation programs. The early defining feature of state and federal farm conservation programs was that of marrying federal funds to state technical assistance. Subsequently state programs

190 WOODS INSTITUTE FOR THE ENVIRONMENT | STANFORD UNIVERSITY
grew to supplement federal farm conservation programs not only with technical assistance, but also with incentive payments to farmers, strategic conservation planning to target conservation efforts at a landscape level, and coordinate the application of various federal, state and private farm conservation programs. In the course of doing so the Midwestern state wildlife and resource agencies grew to be a potent political force in influencing the design and application of federal ag-conservation programs. Missouri and Nebraska have been leaders in this effort.
. MISSOURI DEPARTMENT OF CONSERVATION & USDA NATURAL RESOURCE CONSERVATION SERVICE PARTNERSHIP
Over 93 percent of Missouri land base is in private ownership. Consequently, Missouri Department of Conservation (MDC) focuses much of its efforts on restoring critical habitats and landscapes on private land. A primary focus of those efforts is to assist U.S. Department of Agriculture (USDA) in the delivery and implementation of federal ag-conservation programs. MDC has established a strong strategic partnership with USDA Natural Resource Conservation Service’s (“NRCS”) state office to strategically implement federal ag-conservation programs to address conservation priorities within the state. This partnership enabled Missouri to boast one of the most successful implementation of federal Conservation Security Program (CSP) in the nation.
Missouri Department of Conservation and NRCS began their partnership through a pilot program in 1981, whereby four MDC wildlife biologists were assigned to Soil Conservation Service (as NRCS was then referred to) offices to assist with improving wildlife benefits in application of federal ag-conservation programs. Since 1981, the partnership between the state and federal agency strengthened, with increasing number of state field employees posted in NRCS offices to wildlife conservation priorities in the area and target federal ag-conservation programs to address them.
Today, MDC has approximately 55 field biologists collocated in NRCS state, area, and field offices (Table 1-1). In Missouri, NRCS Field Offices are located in 100 out 114 counties in the state. These Field Offices are staffed with a supervisor, farm planners, and technicians. The scope of conservation issues within a county determine the number of staff in a NRCS Field Office, which ranges between one to eight individuals. County Soil and Water Conservation Districts (SWCD) are also located in NRCS Field Offices. SWCD staff may include clerks, technicians, special project managers, and education specialists depending on the range of conservation issues present in the county and available funding. MDC has 40 Private Land Conservationists (PLC) collocated within 40 NRCS Field Offices. Each PLC is assigned up to four counties.
Table 1-1. Number & Location of MDC Staff Collocated in NRCS Offices. 2005
# OF NRCS OFFICES IN MO
NRCS OFFICE DESIGNATION # NRCS STAFF # COLLOCATED MDC STAFF
1 NRCS State Office 72 1
5 NRCS Area Office 24 5
100 NRCS Field Office 275 45
4 Wetland Office 20 4
20 All Other NRCS Offices 60 0

U.S. Agricultural Policy and the 2007 Farm Bill 191
NRCS Area Offices supervise the 100 Field Offices largely by providing technical assistance. The Area Office is led by an Area Conservationist and staffed with a team of technical experts in agronomy, engineering, and soils. MDC Biologists are located in the Area Offices to contribute wildlife expertise to the Area Team. The state NRCS Office, centrally located in Columbia, provides technical leadership and administrative services to all Missouri NRCS staff. In addition, NRCS has several specialized offices located throughout Missouri offering specialized services in wetlands, irrigation systems, soil surveys, watershed projects etc.
The responsibilities of the three categories of MDC field biologists working with NRCS differ slightly.
• Area Biologists serve as technical experts to NRCS for interpreting federal farm conservation policy, standards, and program rules as they relate to forest, fish, and wildlife resources. They provide training to field office staff. Area biologists assist NRCS with the development of state policies and ranking procedures related to farm bill programs. They develop technical information guides and tools to help NRCS implement programs or practices. Area Biologists encouraged the use of native grasses in NRCS day-to-day planning efforts. Several NRCS Area Conservationists hold MDC area biologists as indispensable to their application of farm conservation programs. Many NRCS State Office staff rely on Area Biologists input prior to making decisions on program policy or direction related to the fish and wildlife resources.
• Wetland Biologists serve as biology experts on wetland teams made up of NRCS engineers, technicians, and soil scientists. They provide assistance in working with landowners to implement Wetland Reserve Program (WRP) and other wetland-related practices in federal ag-conservation programs. The synergy created by the assignment of wetland biologists to NRCS Offices is demonstrated by Missouri being one of five states in the nation with more than 100,000 acres enrolled in WRP. The teamwork between MDC and NRCS in wetland conservation has led to new and innovative techniques, such as creative borrowing,1 to restore the geomorphology in riverine wetland developments.
• Private Land Conservationists (“PLCs”) are MDC’s primary conduit for landowner services. They utilize a toolbox of cost-share and incentive programs, which include the USDA ag-conservation programs. PLCs address landowner requests that either come directly to them or through NRCS. Many NRCS field staff feel that the PLCs bring new customers to USDA ag-conservation programs. Likewise, many PLCs feel that the relationship with NRCS allows them to contact a larger number of agricultural producers than they would otherwise.
The longstanding and growing partnership between MDC and NRCS has yielded innovations in habitat restoration and improved customer service, leading to several conservation accomplishments. MDC and NRCS have been able to collaboratively fund special Wildlife Habitat Incentive Program (WHIP) and Environmental Quality Incentives Program (EQIP) projects that focus on declining habitats and at risk species. In 2001–2003, MDC matched a total of $362,000 in EQIP and WHIP funding to impact 16,700 acres of forest land management in the Headwaters Conservation Priority Area in southeast Missouri to improve the market value of the forest stands and enhance water quality and wildlife habitat. MDC actively participates in many of the grant opportunities provided through NRCS, such as the Conservation Partnership Initiative Grant and the Conservation Innovation Grant. In addition, MDC has two Technical Service Provider agreements with USDA. One reimburses MDC for up to 50 percent of the time spent assisting with federal ag-conservation programs and another reimburses MDC for 50 percent of the costs associated with an intensive WRP monitoring program. However, the biggest showcase of MDC and NRCS partnership is the effective application of Conservation Security Program in Missouri.
1 Creative borrowing is a wetland restoration technique developed to restore historic riverine floodplain topography. It involves using mechanical equipment to recreate oxbows , chutes and other remnant stream meanders. Spoil from the borrow is used to recreate high mounds as they may have occurred historically in the floodplain. Creative borrowing creates a highly diverse plant and water landscape compared to typical wetland restorations.
192 WOODS INSTITUTE FOR THE ENVIRONMENT | STANFORD UNIVERSITY
The Missouri Conservation Security Program (CSP)
The Conservation Security Program was first offered in the 2002 Farm Bill with an avowed goal to “reward(s) the best and motivate(s) the rest” through a complex system of stewardship and enhancement payments. CSP is implemented in select watersheds each year to reward participants for ongoing care of natural resources on their fields and offer incentive payments to implement additional conservation practices. To receive payments, each CSP participant must enter into a conservation stewardship contract and comply with its provisions. Total payments are determined by the tier of participation, conservation treatments completed, and the acres enrolled. To qualify for Tier I a participant must address soil and water quality issues on part of the farm. Tier I contracts are for five years with maximum payment of $20,000 per year. Tier II requires a participant to address soil and water issues plus an additional conservation issue, across the whole agricultural operation. Tier II contracts are for 5 to 10 years with maximum payment of $35,000 per year. Tier III is for farmers who address all resource concerns across their entire agricultural operation. Tier III contracts are for 5 to10 years with maximum payment of $45,000 per year.
The implementation of CSP demands a great deal of technical expertise and administrative resources on the part of NRCS. The complex, tiered payments structure under CSP is based on several site specific resources assessments. NRCS staff across the country are often undermanned and under-equipped to meet the information demands of an effective CSP application. Consequently, CSP application and performance across the nation has been uneven at best. Missouri is an exception, in large measure due to the close collaboration between MDC and NRCS to develop needed technical assessments for CSP application.
MDC, through its partnership with NRCS, was intricately involved in the development and implementation of CSP in Missouri. MDC biologists actively participated in planning, implementation, and monitoring of the CSP program. As a result of MDC involvement, wildlife was considered as the resource concern that in addition to soil and water issues enabled a participant to graduate from Tier I to Tier II. The NRCS state biologist requested the assistance of the 5 MDC Area Biologists to develop wildlife criteria for CSP. NRCS and MDC worked as a team to develop the habitat assessments2, wildlife enhancements,3 enhancement rates,4 and descriptions5 called for in CSP. MDC was able to modify and build upon general habitat assessments that it had developed in 1998 for WHIP participants.
Wildlife enhancements activities were structured in a manner that maximized wildlife benefits and payment options to the farmers. When payment caps within a Tier are reached, the participant has the option to enroll in other ag-conservation programs to install additional practices to graduate to a higher Tier. For instance, to establish the field borders with permanent grass or shrub cover, the landowner may enroll in the Continuous CRP or EQIP to qualify for the CSP enhancement and Tier payments. Keeping this option in mind, several incentives in the Missouri EQIP have been designed to help producers meet the CSP wildlife criteria. A typical example of such a CSP practice is explained in Box 1-1.
2 Habitat assessments are used to determine the habitat value of a CSP application and the relative habitat value of planned wildlife enhancements. Habitat assessments score between 0 and 1.0. A planned habitat value above 0.5 will qualify the applicant for a higher Tier payment.
3 Wildlife enhancements are incentive based wildlife practices that an applicant can chose to raise the habitat assessment score and qualify for a higher Tier payment.
4 Enhancement rates are the amount of incentive payment assigned to each wildlife enhancement practice.
5 Enhancement descriptions were developed to guide staff and landowners to properly install each enhancement. Descriptions are one-to-two page documents describing how to install a practice properly in order to qualify for the enhancement payment.

U.S. Agricultural Policy and the 2007 Farm Bill 193
Box 1-1. CSP Cropland Example
Habitat Assessment Existing Score = 0.35 g Habitat Assessment Planned Score = 0.87 40 acre of crop with existing shrubby cover adjacent to the field.
Enhancements— Quail Bundle— 36 acres x $10.00 = $360.00 Assessment Score 0.8— 36 acres x $15.00 = $540.00 CRP— 4 acres x $65.00* = $260.00 $1,160.00 / yr
OR $290.00 /acre on the 4 acres out of production Continue to crop 36 acres
* Payment may varyNOTE: The figures above are estimates and should not be considered actual payment dollars awarded through the CSP Program
MDC biologists were actively involved in all phases of CSP administration. Prior to the sign-up periods, Area Biologists as part of local watershed CSP Teams provided biological guidance in carrying out local signups and developing local enhancements criteria. The Area Biologists provided training to local NRCS staff on how to use wildlife enhancements to qualify an applicant for Tier 2 or 3. During the signup period, Area Biologists provided follow-up training to NRCS field staff, helped with habitat assessments and tested the accuracy of habitat assessments undertaken, then made recommendations for the best wildlife enhancements to meet Tier 2 or 3 requirements. One Area Biologist recruited a team of 6 MDC and NRCS staff with biology backgrounds to conduct all habitat assessments within a watershed and make enhancement recommendations to applicants. Thenceforth, the team approach to watershed habitat assessment is followed in administering CSP.

194 WOODS INSTITUTE FOR THE ENVIRONMENT | STANFORD UNIVERSITY
The Missouri CSP has produced impressive habitat accomplishments on some of the state’s most intensively farmed landscapes. An estimated 15 million linear feet of native grass field borders and buffers have been installed, and an estimated 50,000 acres of cropland re-flooding in rice fields has occurred. The wildlife conservation accomplishments of the Black River Watershed CSP in Saline County exemplify the success of Missouri CSP. Black River CSP participants chose to apply a set of habitat practices to improve bobwhite quail populations referred, to as the “quail bundle” enhancement. The quail bundle enhancement requires the producer to plant up to 10 percent of their croplands to native grass and wildflower field borders and provide shrubby cover, if it is not already present. The applicant receives $10/year of the contract for every acre of cropland meeting the quail bundle enhancement requirements. Most applicants in the watershed chose to meet the quail bundle requirements by utilizing Continuous CRP grass buffer practices, such as filter strips or habitat buffers (Figures 1-1 and 1-2).
Figure 1-1. Blackwater Watershed in Saline County, Missouri
Figure 1-2. CSP applications with buffers in Saline County

U.S. Agricultural Policy and the 2007 Farm Bill 195
Figure 1-2 illustrates the spatial distribution of lands enrolled in Blackwater Watershed CSP in Saline County, Missouri. All the cropland identified in Figure 1-2 includes up to 10 percent of the farm acres committed to vegetative buffers with a mixture of native grass and forbs. Because landowners can use a variety of programs to install these buffers, it is difficult to ascertain the exact acreage of buffers that will be installed. Approximately 4,000 acres of native grass buffers will be installed in Saline County alone. Because of CSP, Saline County currently has the largest sign-up in the Continuous CRP field borders practice of any county in Missouri.
Conservation Lessons from the Missouri CSP
The successful application of CSP in Missouri offers three important lessons for application of ag-conservation programs in general and additional specific suggestions to improve CSP administration.
First, the watershed approach to conservation enshrined in CSP has proven to be most effective in identifying conservation priorities and strategically applying conservation measures to address identified priorities. A watershed approach is well-suited to adaptive management in the face of changing conservation priorities and fluctuating funding. Watersheds are nature’s boundaries. They represent a common sense way to group together producers’ conservation activities and asses their effect on the environment. The watershed application of CSP allows the state and NRCS to assess and report on environmental progress within the watershed in ways not available from working along county or state lines.
Second, Missouri CSP is testament to the immense possibilities that arise from a strong complementary working relationship between a state wildlife or resource conservation agency and the state offices of NRCS. The success of Missouri CSP was due in large measure to close collaboration between state and federal agencies, sharing key information and personnel to mutually identify conservation priorities and strategically apply conservation actions. NRCS lacks the personnel and resources to conduct required environmental assessments for effective application of CSP in particular and ag-conservation programs in general. NRCS, as administering agency for CSP, is limited by statute to restrict its technical assistance costs below 15 percent of the funds expended in that fiscal year for CSP. Any effective and strategic application of federal ag-conservation programs requires a close coordination between NRCS and state resources agency as demonstrated in the Missouri by the NRCS-MDC partnership.
Third, CSP application in Missouri presents an example of how different ag-conservation programs can effectively be used to complement each other. The watershed approach of CSP allows it to use programs such as Continuous CRP, EQIP, WHIP, WRP, and others to address both resource and farmer needs in an effective and comprehensive manner. Coordinated delivery of ag-conservation programs holds great promise for improving overall conservation effectiveness of these programs. Watershed-based CSP offers a workable structure to facilitate coordinated delivery of ag-conservation programs.
Improvements in CSP Application
A GAO Report on CSP found that wildlife improvements under CSP were applied inconsistently across the nation, and consequently the on-ground wildlife benefits were not being observed. (GAO 06-312, 2006). Missouri presents a notable exception, boasting the best results in wildlife improvements under CSP in the country. Based on the Missouri experience, key improvements in CSP administration can improve wildlife benefits under the program nationally.
It is essential to the success of the wildlife aspects of the CSP to have the state wildlife agency involved in the development and adaptations of wildlife assessments used in the program. State wildlife agencies, in many instances, have already developed habitat relationships and guidelines for various habitat types found in the state. For example,

196 WOODS INSTITUTE FOR THE ENVIRONMENT | STANFORD UNIVERSITY
several states have a wildlife habitat relationships database for the state. Moreover, all states now have a wildlife action plan for the state pursuant to U.S. Department of Interior grants for comprehensive state wildlife conservation strategies. Information in the State Action Plans should be readily used in developing appropriate wildlife habitat improvements for given watersheds where CSP is to be administered.
CSP can substantially benefit from simplifying its procedures. Instead of calculating individualized resource assessments qualifying a participant to move to a higher tier, NRCS may use state-developed minimum requirements for each resource in a given watershed to be met before a participant graduates to the next Tier. For example, a wildlife minimum criteria may require participating cropland acres to plant native grass/forb field borders 30 feet wide on 50 percent of enrolled field(s). Similarly a riparian minimum may involve a 50-foot buffer of native grass/trees/shrubs on all intermittent and permanent streams. Each state or watershed would develop their own unique minimum requirements based on the needs of local wildlife species.
CSP enhancement payments are cumbersome and contribute greatly to unneeded complexity in program administration. A simple solution is to integrate separate enhancement payments into Tier payments. Further, Tier 1 eligibility criteria may be eliminated, allowing all willing applicants to participate, and their payment is based on the whether they meet minimum criteria for a given resource. The new Tier payment structure based on consolidated payments with minimum criteria may look like the following:
Tier 1
Level 1—does not meet minimum criteria for soil and water quality—No payment
Level 2—meets minimum criteria for soil and water quality—$10 per acre payment
Level 3—exceeds minimum soil and water quality criteria by 50 percent—$15 per acre payment
Tier 2—wildlife resource addressed (practices may vary by state and watershed)
Level 1—native grass field border on 50 percent of field edges—$25 per acre payment
Level 2—Level 1 plus 1/10 acre shrubs in each field—$30 per acre payment
Level 3—Level 2 plus native grass field borders on 100 percent of field edges—$35 per acre payment
Tier 3—riparian resource addressed plus all other resources
Level 1—minimum 50’ native grass, shrub or tree buffer established on all permanent and intermittent streams—$45 per acre payment
Level 2—Level 1 plus in-stream habitat provided—$50 per acre payment
Level 3—Level 2 plus bank erosion addressed—$55 per acre payment
Note: minimum treatments levels will vary by watershed, state, and land use.
To improve farmer participation and wildlife benefits, CSP should continue with the practice of allowing a participant to enroll in other ag-conservation program such as continuous CRP, EQIP, WHIP, etc. to meet the criteria for different Tiers. Most resources conservation issues require a multifaceted treatment combining land-retirement and working land programs.
The Missouri experience has demonstrated how a successful partnership can unlock the potential for fish, forest and wildlife habitat in USDA Farm Bill conservation programs to make an impact on the landscape. The MDC & NRCS partnership provides a most enabling institutional structure, at the state level, to tailor and implement federal farm conservation programs to state conservation needs. Further, if appropriately and strategically
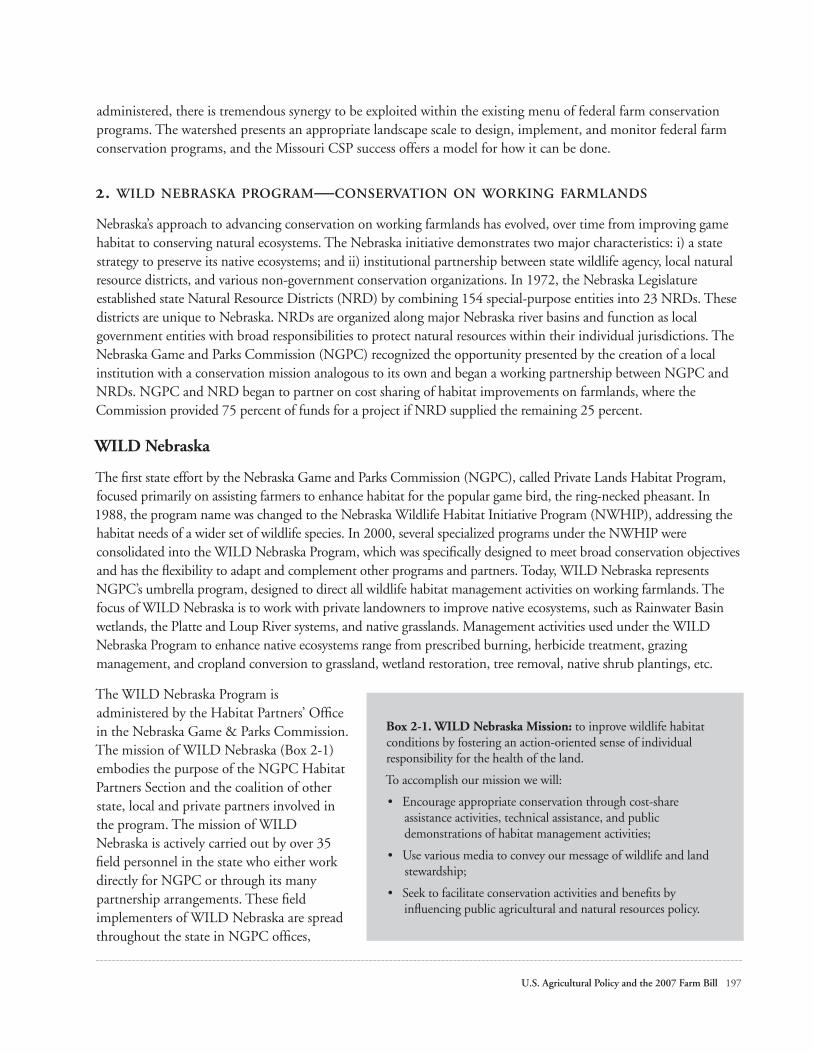
U.S. Agricultural Policy and the 2007 Farm Bill 197
administered, there is tremendous synergy to be exploited within the existing menu of federal farm conservation programs. The watershed presents an appropriate landscape scale to design, implement, and monitor federal farm conservation programs, and the Missouri CSP success offers a model for how it can be done.
. WILD NEBRASKA PROGRAM—CONSERVATION ON WORKING FARMLANDS
Nebraska’s approach to advancing conservation on working farmlands has evolved, over time from improving game habitat to conserving natural ecosystems. The Nebraska initiative demonstrates two major characteristics: i) a state strategy to preserve its native ecosystems; and ii) institutional partnership between state wildlife agency, local natural resource districts, and various non-government conservation organizations. In 1972, the Nebraska Legislature established state Natural Resource Districts (NRD) by combining 154 special-purpose entities into 23 NRDs. These districts are unique to Nebraska. NRDs are organized along major Nebraska river basins and function as local government entities with broad responsibilities to protect natural resources within their individual jurisdictions. The Nebraska Game and Parks Commission (NGPC) recognized the opportunity presented by the creation of a local institution with a conservation mission analogous to its own and began a working partnership between NGPC and NRDs. NGPC and NRD began to partner on cost sharing of habitat improvements on farmlands, where the Commission provided 75 percent of funds for a project if NRD supplied the remaining 25 percent.
WILD Nebraska
The first state effort by the Nebraska Game and Parks Commission (NGPC), called Private Lands Habitat Program, focused primarily on assisting farmers to enhance habitat for the popular game bird, the ring-necked pheasant. In 1988, the program name was changed to the Nebraska Wildlife Habitat Initiative Program (NWHIP), addressing the habitat needs of a wider set of wildlife species. In 2000, several specialized programs under the NWHIP were consolidated into the WILD Nebraska Program, which was specifically designed to meet broad conservation objectives and has the flexibility to adapt and complement other programs and partners. Today, WILD Nebraska represents NGPC’s umbrella program, designed to direct all wildlife habitat management activities on working farmlands. The focus of WILD Nebraska is to work with private landowners to improve native ecosystems, such as Rainwater Basin wetlands, the Platte and Loup River systems, and native grasslands. Management activities used under the WILD Nebraska Program to enhance native ecosystems range from prescribed burning, herbicide treatment, grazing management, and cropland conversion to grassland, wetland restoration, tree removal, native shrub plantings, etc.
The WILD Nebraska Program is administered by the Habitat Partners’ Office in the Nebraska Game & Parks Commission. The mission of WILD Nebraska (Box 2-1) embodies the purpose of the NGPC Habitat Partners Section and the coalition of other state, local and private partners involved in the program. The mission of WILD Nebraska is actively carried out by over 35 field personnel in the state who either work directly for NGPC or through its many partnership arrangements. These field implementers of WILD Nebraska are spread throughout the state in NGPC offices,
Box 2-1. WILD Nebraska Mission: to inprove wildlife habitat conditions by fostering an action-oriented sense of individual responsibility for the health of the land.
To accomplish our mission we will:
• Encourage appropriate conservation through cost-share assistance activities, technical assistance, and public demonstrations of habitat management activities;
• Use various media to convey our message of wildlife and land stewardship;
• Seek to facilitate conservation activities and benefits by influencing public agricultural and natural resources policy.

198 WOODS INSTITUTE FOR THE ENVIRONMENT | STANFORD UNIVERSITY
NRCS offices, and offices of various partners such as Pheasants Forever, Ducks Unlimited, The Nature Conservancy, and others. Figure 2-1 shows the administrative boundaries of the Habitat Partners’ Office.
Figure 2-1. Administrative Districts of NGPC Habitat Partners’ Division.
Innovation of WILD Nebraska
The major contribution of the WILD Nebraska Program is to organize all NGPC conservation activities directed on working farmlands at a landscape level, along the ecosystems defined by the grouping of dominant native vegetative cover type (Figure 2-2). Ecological associations based on native vegetative cover types represents the best practicable proxy to assess biodiversity health and richness of a region. The policy direction is straightforward—the state should strive to propagate native vegetation, whenever possible,, as part of the working agricultural landscape. The policy presupposes that land under healthy native vegetative cover would sustain the ecologically appropriate level of ecosystem services including biodiversity, water filtration, etc.
WILD Nebraska conservation activities are arranged around four broad categories. Three categories refer to the dominant vegetative type occurring in Nebraska viz. grassland, wetland, and woodland. The fourth general category addresses all the activities that are not specific to any one vegetative type but cut across them all. This approach represents an effective way to arrange conservation actions in ecologically sound hierarchical groups, identify conservation priorities across the landscape, and strategically deliver federal and state conservation programs. Another strength of this approach is that it is adaptive, i.e. new activities or new conservation issues can be easily accommodated within the existing structure. The major conservation or wildlife stewardship activities encouraged in different vegetative types across the state are described in Box 2-2.
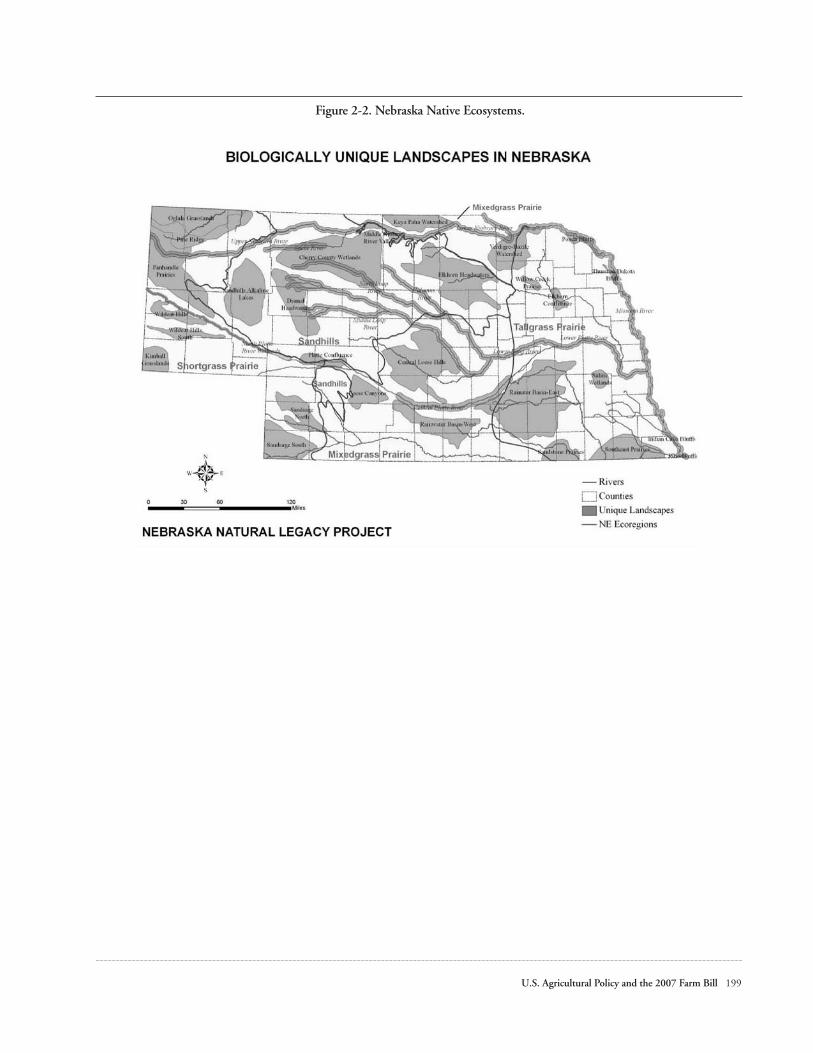
U.S. Agricultural Policy and the 2007 Farm Bill 199
Figure 2-2. Nebraska Native Ecosystems.

200 WOODS INSTITUTE FOR THE ENVIRONMENT | STANFORD UNIVERSITY
Box 2-2. Conservation Activities under WILD Nebraska Program:
Grassland & Prairie Activities Grazing Management for Grassland Wildlife Interseeding Established Grasslands with Legumes and Other Forbs Prescribed Burning Disking Grassland Haying and/or Shredding Herbicide Treatment of Grasslands Grassland or Prairie Establishment
Wetland Activities Drain Closure Irrigation Re-Use Pit Closure Quick-cycle Tailwater Recovery System Installation Water Control Structure Installation Stream Weir Installation Stream Restoration Silt and Fill Removal Vegetation Management Wetland Creation
Woodland Activities Wildlife Shelterbelts Wildlife Shrub Plantings Native Woodland Enhancement for Wildlife Riparian Forest Buffers
General Activities
Wildlife Habitat Enhancement Alternative Water Source Removal of Invasive Woody Plants Food-and-Cover Plot Establishment Habitat Protection by Fence Construction Rare/Unique Community Management Incentive Wildlife Watering Facility Watchable Wildlife Backyard Habitat Establishment Nesting Structures Wildlife Viewing Structures Recreational Access Extended Access Program Hunting Habitat and Access—CRP-MAP (Management Access Program) Hunter Access Bonus Incentive Stewardship Recognition Stewardship Recognition Program

U.S. Agricultural Policy and the 2007 Farm Bill 201
WILD Nebraska Partnerships
An important feature of WILD Nebraska has been its focus on partnerships among federal, state, local and private institutions. The serious commitment to this mode of operations is demonstrated by the name of the office that administers WILD Nebraska—the Habitat Partners Division. These partnerships provide substantial organizational flexibility, utilizing the collective strengths of the partners in creative ways to complement each others’ efforts. It is frequently easier for private conservation organizations to hire additional staff promptly, for whom government institutions may be able to provide office space and support services, while others may be able to provide vehicles. WILD Nebraska is deliberately structured to avail of such latent synergies.
Partners are key to the success of WILD Nebraska. The founding partnership is that between NGPC and NRDs, with active coordination of funds and personnel between the Commission and 21 of the 23 Natural Resources Districts in the state. WILD Nebraska has also been designed to build upon and complement federal ag-conservation programs such as Wildlife Habitat Incentives Program (WHIP), Environmental Quality Incentives Program (EQIP), Conservation Reserve Program (CRP), Conservation Reserve Enhancement Program (CREP), Conservation Security Program (CSP), and Wetlands Reserve Program (WRP) among others.
Application of WILD Nebraska: Case of Rainwater Basin in South-Central District
The South-central District of the Nebraska Game and Parks Commission is comprised largely of mixed grass prairie. Here, the southern end of the Sandhills—the largest contiguous native prairie in the nation—blends into the loess mixed grass prairie that extends south into Kansas. The district is heavily farmed. In addition to the native prairie habitat, the district harbors the crucial bottleneck in the Central Flyway—a major migratory corridor for waterfowl and other migratory birds. The area supports two major wetland complexes built around the big bend of the Platter River and the Loup, Cedar, and Republican rivers (see Figures 2-3 & 2-4).
Figure 2-4. The Central Flyway “Hourglass” Constriction in the Rainwater Basin Area.
Figure 2-3. The Rainwater Basin Area
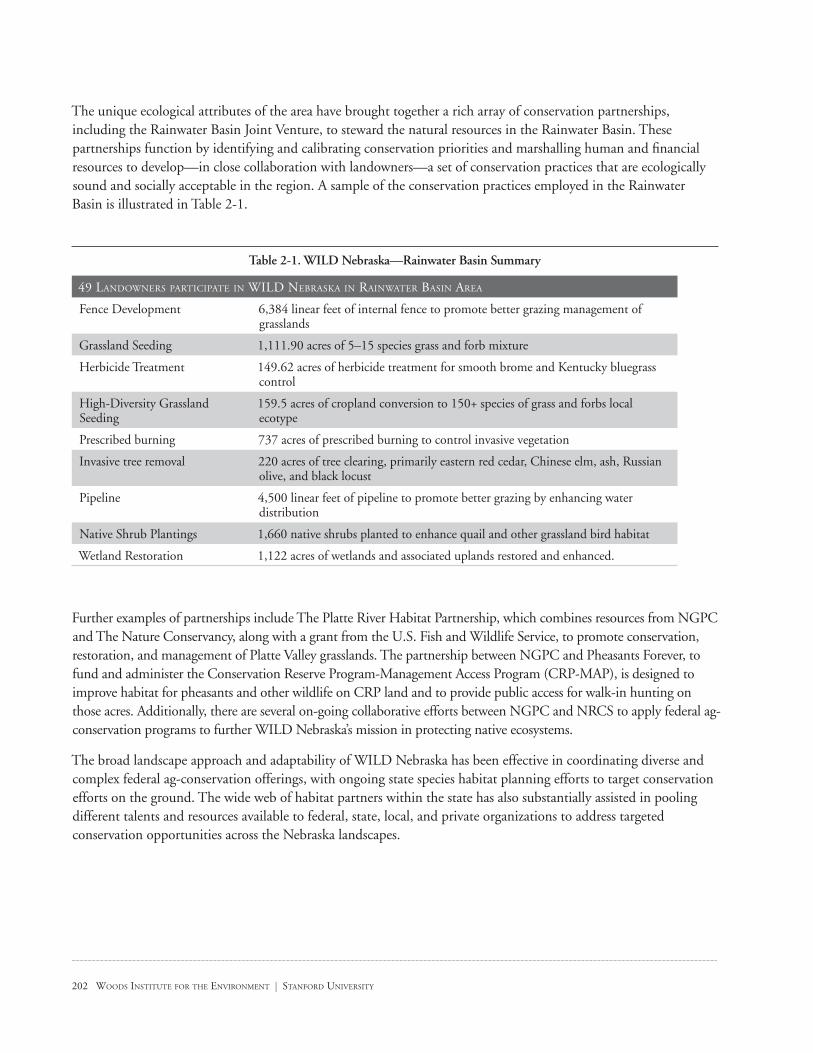
202 WOODS INSTITUTE FOR THE ENVIRONMENT | STANFORD UNIVERSITY
The unique ecological attributes of the area have brought together a rich array of conservation partnerships, including the Rainwater Basin Joint Venture, to steward the natural resources in the Rainwater Basin. These partnerships function by identifying and calibrating conservation priorities and marshalling human and financial resources to develop—in close collaboration with landowners—a set of conservation practices that are ecologically sound and socially acceptable in the region. A sample of the conservation practices employed in the Rainwater Basin is illustrated in Table 2-1.
Table 2-1. WILD Nebraska—Rainwater Basin Summary
49 LANDOWNERS PARTICIPATE IN WILD NEBRASKA IN RAINWATER BASIN AREA
Fence Development 6,384 linear feet of internal fence to promote better grazing management of grasslands
Grassland Seeding 1,111.90 acres of 5–15 species grass and forb mixture
Herbicide Treatment 149.62 acres of herbicide treatment for smooth brome and Kentucky bluegrass control
High-Diversity Grassland Seeding
159.5 acres of cropland conversion to 150+ species of grass and forbs local ecotype
Prescribed burning 737 acres of prescribed burning to control invasive vegetation
Invasive tree removal 220 acres of tree clearing, primarily eastern red cedar, Chinese elm, ash, Russian olive, and black locust
Pipeline 4,500 linear feet of pipeline to promote better grazing by enhancing water distribution
Native Shrub Plantings 1,660 native shrubs planted to enhance quail and other grassland bird habitat
Wetland Restoration 1,122 acres of wetlands and associated uplands restored and enhanced.
Further examples of partnerships include The Platte River Habitat Partnership, which combines resources from NGPC and The Nature Conservancy, along with a grant from the U.S. Fish and Wildlife Service, to promote conservation, restoration, and management of Platte Valley grasslands. The partnership between NGPC and Pheasants Forever, to fund and administer the Conservation Reserve Program-Management Access Program (CRP-MAP), is designed to improve habitat for pheasants and other wildlife on CRP land and to provide public access for walk-in hunting on those acres. Additionally, there are several on-going collaborative efforts between NGPC and NRCS to apply federal ag-conservation programs to further WILD Nebraska’s mission in protecting native ecosystems.
The broad landscape approach and adaptability of WILD Nebraska has been effective in coordinating diverse and complex federal ag-conservation offerings, with ongoing state species habitat planning efforts to target conservation efforts on the ground. The wide web of habitat partners within the state has also substantially assisted in pooling different talents and resources available to federal, state, local, and private organizations to address targeted conservation opportunities across the Nebraska landscapes.

U.S. Agricultural Policy and the 2007 Farm Bill 203
III. Synergy Between State and Federal Ag-Conservation Programs and Policies: Lessons from Missouri and NebraskaFederal ag-conservation programs often constitute the largest pool of funds available to address resource conservation on agricultural landscapes. Leveraging federal resources at the local level is good government. It provides added efficiencies and contributes to the overall effectiveness of grossly applied national programs. Local involvement often ensures a greater degree of acceptance and application of federal ag-conservation programs, as farmers are more receptive to programs delivered with a “local feel.”
Federal ag-conservation programs have two key strengths: large sums of available funds and considerable flexibility in application. Their weaknesses include a lack of strategic application and an overworked and undertrained staff. States such as Missouri and Nebraska have developed their respective private lands programs to complement and leverage the synergy of federal ag-conservation programs. In Missouri, the MDC-NRCS partnership laid the foundation for a successful application of CSP and WILD Nebraska, which provides a progressive institutional structure to coordinate various federal, state, local and private efforts for conserving Nebraska’s native ecosystems.
States can substantially bolster the strategic application of federal ag-conservation programs to enhance their conservation effectiveness. Every state and territory in the United States has recently developed a Comprehensive Wildlife Conservation Strategy for its area. In Nebraska it is referred to as the Natural Legacy Project.6 These “State Action Plans,” as they are generally referred to, offer a blueprint for state wildlife conservation efforts addressing the higher priorities first. Each plan includes species and habitat status in the state, with associated threats and opportunities identified. These State Action Plans are emblematic of the collective consciousness of the wildlife and resources conservation profession to undertake meaningful strategic conservation efforts at the landscape scale. The era of piecemeal, band-aid approaches to wildlife conservation is in the past. The development of Total Maximum Daily Load (TMDL) standards for pollutants standards in major watersheds in a state, as required by the federal Clean Water Act, represents a similar state effort to assess and strategically improve water quality within a state. States are increasingly developing comprehensive and sophisticated databases for various natural resources such as wildlife habitat and water quality that should be integrated in application of federal ag-conservation programs.
Increasingly, state and local conservation strategies make use of local watersheds as ecological and administrative units to prioritize conservation issues and target conservation programs. The development of TMDL is by definition watershed-based. The State Action Plans for wildlife conservation often divide the state in eco-regions that often track along similar large and small watershed boundaries. Even though Natural Resource Conservation Districts usually mirror a state county in its jurisdiction, increasingly understanding of resource issues and application of ag-conservation program is undertaken along watersheds. Further, the watershed approach is increasingly integrated into major ag-conservation programs such as CSP, Conservation Reserve Enhancement Program (CREP) and EQIP. The strategic application of federal ag-conservation programs by watersheds, in conjunction with growing state and local efforts along the same lines, can enormously enhance their conservation effectiveness.
States are well-situated to substantially improve the institutional efficiency in administering federal ag-conservation programs. In Missouri, the close institutional partnership between MDC and NRCS allowed for sharing of information and resources to ensure successful application of CSP. States that did not benefit from such institutional relationships fared poorly in applying CSP. WILD Nebraska offers a broad framework to facilitate opportunistic partnerships between federal, state, local, and private institutions sharing personnel, funds, and
6 www.ngpc.state.ne.us/wildlife/programs/legacy/legacy.asp

204 WOODS INSTITUTE FOR THE ENVIRONMENT | STANFORD UNIVERSITY
information in addressing strategic resource conservation issues. In Nebraska, several local Farm Bill Wildlife Biologists are funded and supported jointly by NGPC, NRCS and private wildlife conservation organizations, e.g. Pheasants Forever etc. These Farm Bill wildlife biologists are located at NRCS offices and tasked with administering federal ag-conservation programs to meet specific, locally determined conservation objectives. The conservation objectives differ by landscape based on local conservation priorities, farmer demand for conservation programs, and program availability.
NRCS is notoriously understaffed to effectively administer ag-conservation programs of growing complexity on their own. Specifically, they have few specialists, like wildlife biologists and plant ecologists. Conservation programs, actions, and tools continue to develop at a staggering pace. Federal and state field personnel are in a constant state of learning new rules and procedures to deliver new and old programs, while simultaneously advocating modifications in existing programs to better meet conservation purposes and the needs of landowners. Close institutional collaboration between state and federal agencies allows for more efficient adaptation to the rapidly evolving environment of conservation practices on agricultural landscapes.
IV. ConclusionThe case of Missouri and Nebraska strongly suggest that states play a strong role in improving strategic application and institutional efficiency of federal ag-conservation programs. With growing sophistication of ag-conservation program, a cooperative federalism structure for administering the program is needed. NRCS is woefully understaffed to effectively administer federal ag-conservation programs on their own, and they often lack specialists who can help to maximize conservation services. Most Midwestern states including Iowa, Missouri, Nebraska, and Ohio employ the practice of co-locating state wildlife biologists in NRCS offices to assist with federal ag-conservation program. Several of these states have also funded field positions with conservation organizations to assess and direct federal ag-conservation programs. Moreover, most states are fast developing sophisticated state strategies to identify specific water and wildlife conservation needs across their states. The next step for states is to develop appropriate state institutions that effectively coordinate federal, state, local and private efforts to collectively address the conservation needs of the state in a strategic manner.
Federal ag-conservation programs represent the largest influx of federal monies to address natural resource conservation on private lands. Their capacity to contribute to meeting state conservation objectives are immense. States are ideally situated to assist in targeting federal ag-conservation programs to optimize conservation benefits—good reasons why the design and application of federal ag-conservation programs should formally account for state and local institutional collaboration.
A range of policy actions can be enacted to strengthen the cooperative federalism attributes in administering federal ag-conservation programs, including expanding block grants along the lines of CREP to apply to the full range of federal ag-conservation programs and developing USDA policies that require NRCS to coordinate with state resource agencies in administering ag-conservation programs such as CSP, WRP, CRP, EQIP etc. Further, Congress may undertake to enact a nominal excise tax on agricultural equipment, supplies, and associated items that is distributed back to states to be applied to agricultural conservation measures. This would be creating a fund similar to the existing Pittman-Robertson and Dingell-Johnson funds from tax on hunting and fishing equipment to fund state fish and wildlife activities in the state.
The 2007 Farm Bill offers a good opportunity to formally recognize and integrate principles of cooperative federalism in application of federal ag-conservation programs. By so doing Congress may not only enhance

U.S. Agricultural Policy and the 2007 Farm Bill 205
conservation effectiveness of federal programs, but also positively influence a growing trend among states to address their conservation priorities in a coordinated and strategic manner along ecological units such as watersheds.
Reference: U.S. Government Accountability Office. 2006. Conservation Security Program: Despite Cost Controls, Improved USDA Management
Is Needed to Ensure Proper Payments and Reduce Duplication with Other Programs. GAO-06-312. 102 pp. April 2006.

206 WOODS INSTITUTE FOR THE ENVIRONMENT | STANFORD UNIVERSITY
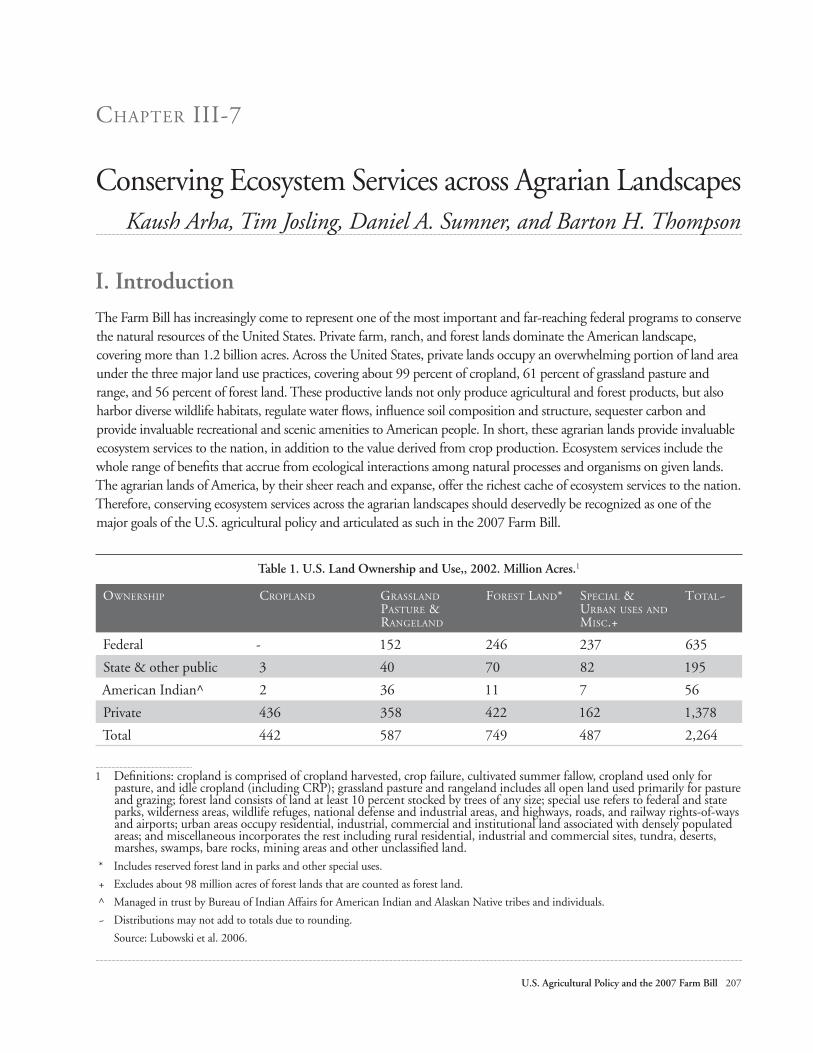
U.S. Agricultural Policy and the 2007 Farm Bill 207
CHAPTER III-7
Conserving Ecosystem Services across Agrarian Landscapes Kaush Arha, Tim Josling, Daniel A. Sumner, and Barton H. Thompson
I. IntroductionThe Farm Bill has increasingly come to represent one of the most important and far-reaching federal programs to conserve the natural resources of the United States. Private farm, ranch, and forest lands dominate the American landscape, covering more than 1.2 billion acres. Across the United States, private lands occupy an overwhelming portion of land area under the three major land use practices, covering about 99 percent of cropland, 61 percent of grassland pasture and range, and 56 percent of forest land. These productive lands not only produce agricultural and forest products, but also harbor diverse wildlife habitats, regulate water flows, influence soil composition and structure, sequester carbon and provide invaluable recreational and scenic amenities to American people. In short, these agrarian lands provide invaluable ecosystem services to the nation, in addition to the value derived from crop production. Ecosystem services include the whole range of benefits that accrue from ecological interactions among natural processes and organisms on given lands. The agrarian lands of America, by their sheer reach and expanse, offer the richest cache of ecosystem services to the nation. Therefore, conserving ecosystem services across the agrarian landscapes should deservedly be recognized as one of the major goals of the U.S. agricultural policy and articulated as such in the 2007 Farm Bill.
Table 1. U.S. Land Ownership and Use,, 2002. Million Acres.1
OWNERSHIP CROPLAND GRASSLAND PASTURE & RANGELAND
FOREST LAND* SPECIAL & URBAN USES AND MISC.+
TOTAL~
Federal - 152 246 237 635
State & other public 3 40 70 82 195
American Indian^ 2 36 11 7 56
Private 436 358 422 162 1,378
Total 442 587 749 487 2,264
1 Definitions: cropland is comprised of cropland harvested, crop failure, cultivated summer fallow, cropland used only for pasture, and idle cropland (including CRP); grassland pasture and rangeland includes all open land used primarily for pasture and grazing; forest land consists of land at least 10 percent stocked by trees of any size; special use refers to federal and state parks, wilderness areas, wildlife refuges, national defense and industrial areas, and highways, roads, and railway rights-of-ways and airports; urban areas occupy residential, industrial, commercial and institutional land associated with densely populated areas; and miscellaneous incorporates the rest including rural residential, industrial and commercial sites, tundra, deserts, marshes, swamps, bare rocks, mining areas and other unclassified land.
* Includes reserved forest land in parks and other special uses.
+ Excludes about 98 million acres of forest lands that are counted as forest land.
^ Managed in trust by Bureau of Indian Affairs for American Indian and Alaskan Native tribes and individuals.
~ Distributions may not add to totals due to rounding.
Source: Lubowski et al. 2006.
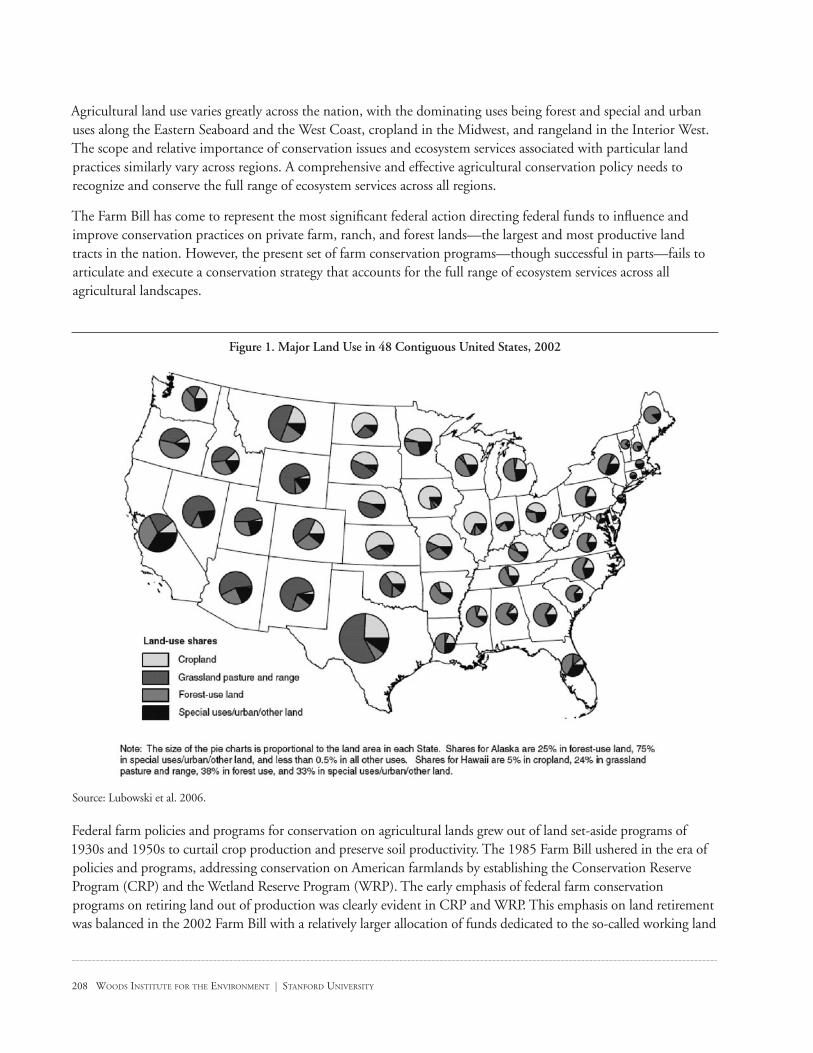
208 WOODS INSTITUTE FOR THE ENVIRONMENT | STANFORD UNIVERSITY
Agricultural land use varies greatly across the nation, with the dominating uses being forest and special and urban uses along the Eastern Seaboard and the West Coast, cropland in the Midwest, and rangeland in the Interior West. The scope and relative importance of conservation issues and ecosystem services associated with particular land practices similarly vary across regions. A comprehensive and effective agricultural conservation policy needs to recognize and conserve the full range of ecosystem services across all regions.
The Farm Bill has come to represent the most significant federal action directing federal funds to influence and improve conservation practices on private farm, ranch, and forest lands—the largest and most productive land tracts in the nation. However, the present set of farm conservation programs—though successful in parts—fails to articulate and execute a conservation strategy that accounts for the full range of ecosystem services across all agricultural landscapes.
Figure 1. Major Land Use in 48 Contiguous United States, 2002
Source: Lubowski et al. 2006.
Federal farm policies and programs for conservation on agricultural lands grew out of land set-aside programs of 1930s and 1950s to curtail crop production and preserve soil productivity. The 1985 Farm Bill ushered in the era of policies and programs, addressing conservation on American farmlands by establishing the Conservation Reserve Program (CRP) and the Wetland Reserve Program (WRP). The early emphasis of federal farm conservation programs on retiring land out of production was clearly evident in CRP and WRP. This emphasis on land retirement was balanced in the 2002 Farm Bill with a relatively larger allocation of funds dedicated to the so-called working land

U.S. Agricultural Policy and the 2007 Farm Bill 209
conservation programs such as the Environmental Quality Incentives Program (EQIP) and the Conservation Security Program (CSP). Taken together, ag-conservation programs have produced environmental benefits, but there exists a great potential to do much better. In particular, the present set of programs reflects several remediable shortcomings, including lack of: strategic application across landscapes to address pressing conservation issues; accounting for the full range of ecosystem services; broad application across all regions and land use practices, including cropland, rangeland and forest land; ready performance measures; robust enforcement and reporting; and full use of institutional measures to coordinate program delivery and encourage free market mechanisms in agricultural conservation. The present efforts in ag-conservation stand to benefit from a clear articulation of a coherent and comprehensive conservation policy that describes the appropriate scope and application of such efforts.
This paper, after an introductory discussion of the value of agricultural landscapes to the natural resources of the nation, suggests a new policy paradigm for ag-conservation policies and programs. In so doing it evaluates the characteristics of existing farm conservation programs and recommends a range of actions to improve the policies, programs, and institutions to more effectively conserve ecosystem services across agrarian landscapes.
II. Conserving Ecosystem Services across Agrarian Landscapes: A New Paradigm Conserving ecosystem services across agrarian landscapes should be forcefully stated as one of the primary objectives of U.S. agricultural policy. By so doing the federal government may articulate a comprehensive and coherent policy paradigm to develop, execute and report on a range of existing and new agricultural conservation programs. The execution of agricultural conservation programs under such a new paradigm should strive to address the full range of ecosystem services across all agricultural landscapes—i.e. cropland, rangeland, and forest land—covering all regions from the Cascades to the Keys. One of the high priorities under such an approach will be to identify and understand the range of major ecosystem services from agricultural lands and direct ag-conservation programs to preserve and enhance their value.
There is an immeasurable array of ecosystem services that emanate from agricultural lands. We can name but a few and comprehend fewer still. However, for the purposes of program development, execution and reporting, a broad index of ecosystem services is readily available and can be used. The majority of ecosystem services from agricultural lands result from the ecological interactions among the elements and organisms found in the soil, vegetation, and water on those lands (Figure 2). The appropriate focus of the agricultural conservation programs may, at the core, be to conserve soil, vegetation, and water to preserve and enhance the natural processes that emanate from them. As indicated in Figure 2, several other important ecosystem services arise from these three ecological building blocks, such as biodiversity, crop production, carbon sequestration, pollination, air quality, scenic and cultural amenities, etc.
Moreover, among the three ecological blocks, water provides the most encompassing overall single index to gauge the ecosystem health of a given agrarian landscape. The water quality and quantity issues in a given landscape, such as water filtration and retention, nutrient runoff, flood control, etc., are directly dependent on the interactions between the composition and structure of the soil and the overlaying vegetation. As such, ag-conservation programs dedicated to conserving ecosystem services across agricultural landscapes may pay particular attention to water quality and quantity issues.
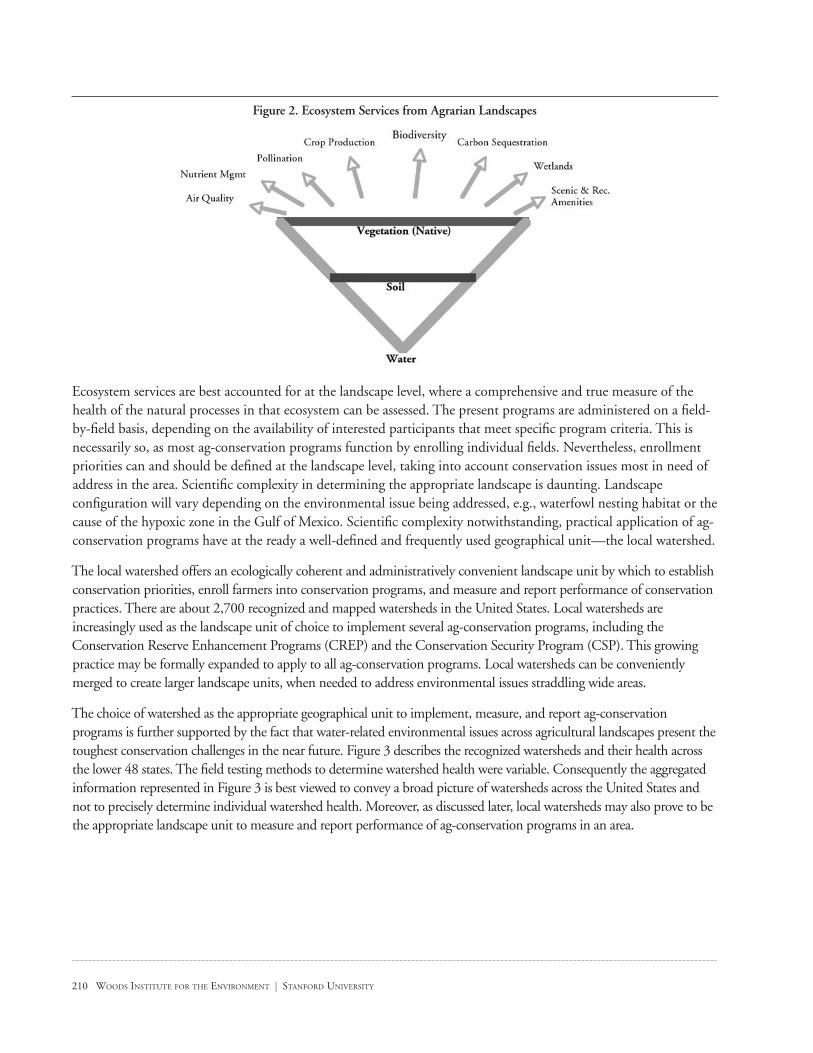
210 WOODS INSTITUTE FOR THE ENVIRONMENT | STANFORD UNIVERSITY
Figure 2. Ecosystem Services from Agrarian Landscapes
Ecosystem services are best accounted for at the landscape level, where a comprehensive and true measure of the health of the natural processes in that ecosystem can be assessed. The present programs are administered on a field-by-field basis, depending on the availability of interested participants that meet specific program criteria. This is necessarily so, as most ag-conservation programs function by enrolling individual fields. Nevertheless, enrollment priorities can and should be defined at the landscape level, taking into account conservation issues most in need of address in the area. Scientific complexity in determining the appropriate landscape is daunting. Landscape configuration will vary depending on the environmental issue being addressed, e.g., waterfowl nesting habitat or the cause of the hypoxic zone in the Gulf of Mexico. Scientific complexity notwithstanding, practical application of ag-conservation programs have at the ready a well-defined and frequently used geographical unit—the local watershed.
The local watershed offers an ecologically coherent and administratively convenient landscape unit by which to establish conservation priorities, enroll farmers into conservation programs, and measure and report performance of conservation practices. There are about 2,700 recognized and mapped watersheds in the United States. Local watersheds are increasingly used as the landscape unit of choice to implement several ag-conservation programs, including the Conservation Reserve Enhancement Programs (CREP) and the Conservation Security Program (CSP). This growing practice may be formally expanded to apply to all ag-conservation programs. Local watersheds can be conveniently merged to create larger landscape units, when needed to address environmental issues straddling wide areas.
The choice of watershed as the appropriate geographical unit to implement, measure, and report ag-conservation programs is further supported by the fact that water-related environmental issues across agricultural landscapes present the toughest conservation challenges in the near future. Figure 3 describes the recognized watersheds and their health across the lower 48 states. The field testing methods to determine watershed health were variable. Consequently the aggregated information represented in Figure 3 is best viewed to convey a broad picture of watersheds across the United States and not to precisely determine individual watershed health. Moreover, as discussed later, local watersheds may also prove to be the appropriate landscape unit to measure and report performance of ag-conservation programs in an area.

U.S. Agricultural Policy and the 2007 Farm Bill 211
Figure 3. Impaired Watersheds in the Lower 48 States.
Source: Ribaudo and Johansson, 2006.
In implementing the new paradigm of conserving ecosystem services across agrarian landscapes, the application and design of the present set of ag-conservation programs needs to be broadened to encompass the entire nation. In so doing, particular attention should be paid to land use practices that have heretofore not been targeted for ag-conservation programs, e.g., land growing fruits, nuts, vegetables and tree nurseries, forest land and rangeland. The basic foundation of the new paradigm that emphasizes the conservation of the full range of ecosystem services across agrarian landscapes—the local watershed—holds true across all of the major land use practices found on agricultural lands across the nation.
III. Ag-Conservation Programs: Need for Broader Criteria and ApplicationAg-conservation programs in the U.S. began with a focus on maintaining the soil productivity of croplands by improving vegetative cover and agricultural practices to check soil erosion. The early programs had a strong emphasis on land retirement. The 2002 Farm Bill made a concerted effort to disperse funds to ag-conservation programs directed at improving conservation practices on “working” farms engaged in agricultural production. The future challenge will be to modify and refine land retirement and working land conservation programs to address a growing array of complex environmental issues in diverse agricultural landscapes.
Federal policies directed at improving ecosystem services from agricultural lands fall into one of three broad categories: conservation compliance; incentive payments through land retirement, and working land program and technical assistance. Conservation compliance provisions are basic environmental conditions that a farmer must meet to receive any farm commodity, conservation, or disaster payments. The compliance provisions were initiated under the 1985 Farm Bill and currently target soil erosion and land productivity; sedimentation and water quality; and wetlands. Incentive payments began by paying farmers to take land out of production and have now evolved to rewarding farmers for a range of conservation practices under a wide array of programs including CRP, WRP, EQIP,
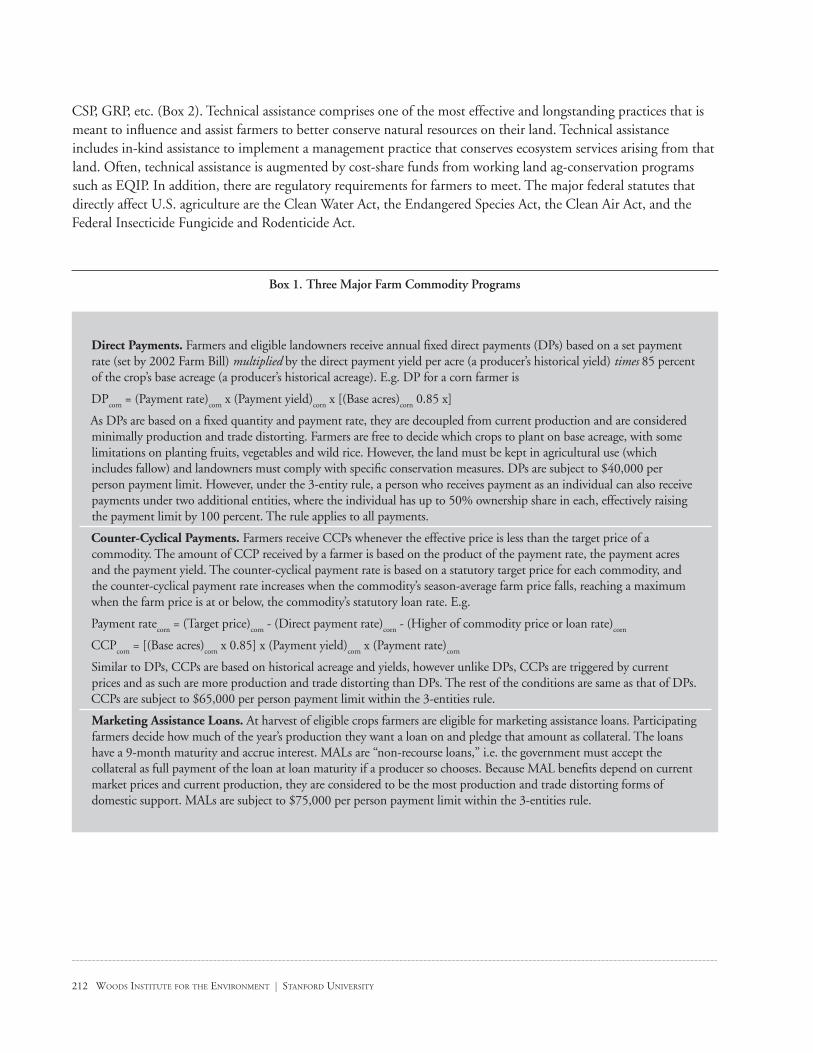
212 WOODS INSTITUTE FOR THE ENVIRONMENT | STANFORD UNIVERSITY
CSP, GRP, etc. (Box 2). Technical assistance comprises one of the most effective and longstanding practices that is meant to influence and assist farmers to better conserve natural resources on their land. Technical assistance includes in-kind assistance to implement a management practice that conserves ecosystem services arising from that land. Often, technical assistance is augmented by cost-share funds from working land ag-conservation programs such as EQIP. In addition, there are regulatory requirements for farmers to meet. The major federal statutes that directly affect U.S. agriculture are the Clean Water Act, the Endangered Species Act, the Clean Air Act, and the Federal Insecticide Fungicide and Rodenticide Act.
Box 1. Three Major Farm Commodity Programs
Direct Payments. Farmers and eligible landowners receive annual fixed direct payments (DPs) based on a set payment rate (set by 2002 Farm Bill) multiplied by the direct payment yield per acre (a producer’s historical yield) times 85 percent of the crop’s base acreage (a producer’s historical acreage). E.g. DP for a corn farmer is
DPcorn = (Payment rate)corn x (Payment yield)corn x [(Base acres)corn 0.85 x]
As DPs are based on a fixed quantity and payment rate, they are decoupled from current production and are considered minimally production and trade distorting. Farmers are free to decide which crops to plant on base acreage, with some limitations on planting fruits, vegetables and wild rice. However, the land must be kept in agricultural use (which includes fallow) and landowners must comply with specific conservation measures. DPs are subject to $40,000 per person payment limit. However, under the 3-entity rule, a person who receives payment as an individual can also receive payments under two additional entities, where the individual has up to 50% ownership share in each, effectively raising the payment limit by 100 percent. The rule applies to all payments.
Counter-Cyclical Payments. Farmers receive CCPs whenever the effective price is less than the target price of a commodity. The amount of CCP received by a farmer is based on the product of the payment rate, the payment acres and the payment yield. The counter-cyclical payment rate is based on a statutory target price for each commodity, and the counter-cyclical payment rate increases when the commodity’s season-average farm price falls, reaching a maximum when the farm price is at or below, the commodity’s statutory loan rate. E.g.
Payment ratecorn = (Target price)corn - (Direct payment rate)corn - (Higher of commodity price or loan rate)corn
CCPcorn = [(Base acres)corn x 0.85] x (Payment yield)corn x (Payment rate)corn
Similar to DPs, CCPs are based on historical acreage and yields, however unlike DPs, CCPs are triggered by current prices and as such are more production and trade distorting than DPs. The rest of the conditions are same as that of DPs. CCPs are subject to $65,000 per person payment limit within the 3-entities rule.
Marketing Assistance Loans. At harvest of eligible crops farmers are eligible for marketing assistance loans. Participating farmers decide how much of the year’s production they want a loan on and pledge that amount as collateral. The loans have a 9-month maturity and accrue interest. MALs are “non-recourse loans,” i.e. the government must accept the collateral as full payment of the loan at loan maturity if a producer so chooses. Because MAL benefits depend on current market prices and current production, they are considered to be the most production and trade distorting forms of domestic support. MALs are subject to $75,000 per person payment limit within the 3-entities rule.
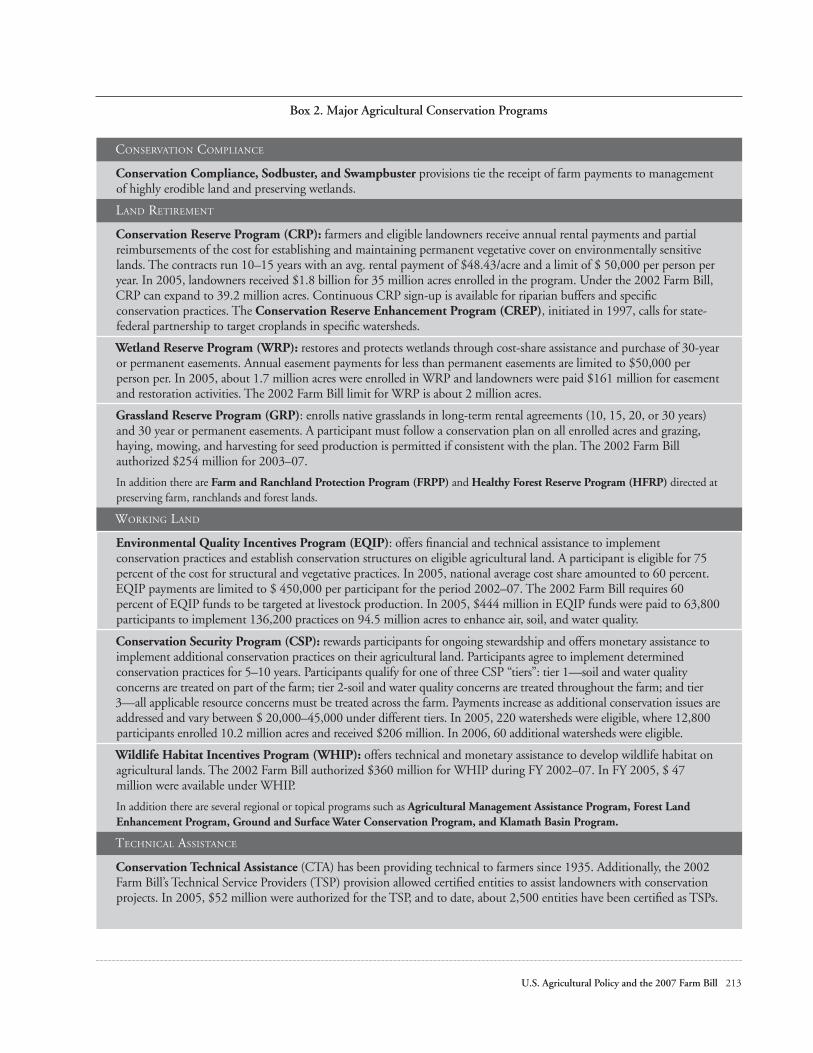
U.S. Agricultural Policy and the 2007 Farm Bill 213
Box 2. Major Agricultural Conservation Programs
CONSERVATION COMPLIANCE
Conservation Compliance, Sodbuster, and Swampbuster provisions tie the receipt of farm payments to management of highly erodible land and preserving wetlands.
LAND RETIREMENT
Conservation Reserve Program (CRP): farmers and eligible landowners receive annual rental payments and partial reimbursements of the cost for establishing and maintaining permanent vegetative cover on environmentally sensitive lands. The contracts run 10–15 years with an avg. rental payment of $48.43/acre and a limit of $ 50,000 per person per year. In 2005, landowners received $1.8 billion for 35 million acres enrolled in the program. Under the 2002 Farm Bill, CRP can expand to 39.2 million acres. Continuous CRP sign-up is available for riparian buffers and specific conservation practices. The Conservation Reserve Enhancement Program (CREP), initiated in 1997, calls for state-federal partnership to target croplands in specific watersheds.
Wetland Reserve Program (WRP): restores and protects wetlands through cost-share assistance and purchase of 30-year or permanent easements. Annual easement payments for less than permanent easements are limited to $50,000 per person per. In 2005, about 1.7 million acres were enrolled in WRP and landowners were paid $161 million for easement and restoration activities. The 2002 Farm Bill limit for WRP is about 2 million acres.
Grassland Reserve Program (GRP): enrolls native grasslands in long-term rental agreements (10, 15, 20, or 30 years) and 30 year or permanent easements. A participant must follow a conservation plan on all enrolled acres and grazing, haying, mowing, and harvesting for seed production is permitted if consistent with the plan. The 2002 Farm Bill authorized $254 million for 2003–07.
In addition there are Farm and Ranchland Protection Program (FRPP) and Healthy Forest Reserve Program (HFRP) directed at preserving farm, ranchlands and forest lands.
WORKING LAND
Environmental Quality Incentives Program (EQIP): offers financial and technical assistance to implement conservation practices and establish conservation structures on eligible agricultural land. A participant is eligible for 75 percent of the cost for structural and vegetative practices. In 2005, national average cost share amounted to 60 percent. EQIP payments are limited to $ 450,000 per participant for the period 2002–07. The 2002 Farm Bill requires 60 percent of EQIP funds to be targeted at livestock production. In 2005, $444 million in EQIP funds were paid to 63,800 participants to implement 136,200 practices on 94.5 million acres to enhance air, soil, and water quality.
Conservation Security Program (CSP): rewards participants for ongoing stewardship and offers monetary assistance to implement additional conservation practices on their agricultural land. Participants agree to implement determined conservation practices for 5–10 years. Participants qualify for one of three CSP “tiers”: tier 1—soil and water quality concerns are treated on part of the farm; tier 2-soil and water quality concerns are treated throughout the farm; and tier 3—all applicable resource concerns must be treated across the farm. Payments increase as additional conservation issues are addressed and vary between $ 20,000–45,000 under different tiers. In 2005, 220 watersheds were eligible, where 12,800 participants enrolled 10.2 million acres and received $206 million. In 2006, 60 additional watersheds were eligible.
Wildlife Habitat Incentives Program (WHIP): offers technical and monetary assistance to develop wildlife habitat on agricultural lands. The 2002 Farm Bill authorized $360 million for WHIP during FY 2002–07. In FY 2005, $ 47 million were available under WHIP.
In addition there are several regional or topical programs such as Agricultural Management Assistance Program, Forest Land Enhancement Program, Ground and Surface Water Conservation Program, and Klamath Basin Program.
TECHNICAL ASSISTANCE
Conservation Technical Assistance (CTA) has been providing technical to farmers since 1935. Additionally, the 2002 Farm Bill’s Technical Service Providers (TSP) provision allowed certified entities to assist landowners with conservation projects. In 2005, $52 million were authorized for the TSP, and to date, about 2,500 entities have been certified as TSPs.

214 WOODS INSTITUTE FOR THE ENVIRONMENT | STANFORD UNIVERSITY
A quick review of present programs—of which there are several, with only the major ones described in Box 2—indicates that soil erosion and productivity, water quality, and wildlife habitat have received particular emphasis in ag-conservation programs. There is a historical explanation for this. Ag-conservation programs were originally established to keep highly erodible croplands out of cultivation. Wildlife-habitat benefits from retired cropland now under permanent cover—particularly for grassland game species, such as ring-necked pheasant and waterfowl—energized the sportsmen and state wildlife agencies in the Midwest to play an increasingly important role in the design and execution of ag-conservation programs. The 2002 Farm Bill, with an objective to bolster ag-conservation programs on “working lands,” added substantial new funds for EQIP and, to a lesser degree, for CSP (Figure 4 and Table 2). The EQIP funds, in large measure, are targeted to address manure and nutrient management issues related to livestock production, particularly around Concentrated Animal Feeding Operations (CAFOs).
Figure 4. Trends in Ag-Conservation Program Spending
Source: Cattaneo et al. 2005.
Table 2. Funding for major USDA conservation programs, 2002–2205—in $ million
PROGRAM 2002 2003 2004 2005*
Land Retirement
Conservation Reserve Program
Wetland Reserve Program
Grassland Reserve Program
1,785 284 -
1,789 309 39
1,799 285 55
1,937 268 128
Working Land
Environmental Quality Incentives Program
Conservation Security Program
Wildlife Habitat Incentives Program
390
-
15
390 - 24
390 41 38
390 202 47
Technical Assistance
Conservation Technical Assistance 679 716 742 720
Agricultural Land Preservation
Farm and Ranchland Protection Program 51 78 91 112
* EstimatedSource: USDA, 2006

U.S. Agricultural Policy and the 2007 Farm Bill 215
The present set of ag-conservation programs have resulted in significant conservation benefits. USDA figures indicate that, between 1982 and 2003, soil erosion on U.S. cropland declined from 3.06 to 1.75 billion tons per year, i.e., by about 43 percent. (USDA, 2006) This decline is credited to a combination of conservation compliance, CRP, EQIP, and its predecessor programs, and improved production practices. Wetland losses to agriculture declined from over half a million acres per year during 1954–74, to 26,000 acres per year during 1992–1997, to “no net loss” during 1997–2003. In the last period, 1997–2003, a net gain of more than 260,000 wetland acres was recorded. The turnaround in wetland conservation is attributed in large part to the swampbuster provision of conservation compliance, CRP and WRP. Additionally, programs such as CRP, WRP, and WHIP have substantially increased wildlife habitat for grassland species in the Midwest, particularly for ring-necked pheasants and waterfowl. Notwithstanding the difficulty in reporting wildlife benefits in numerical terms, it is fair to state that pheasant and waterfowl nesting habitat increased multi-fold due to programs such as CRP and WRP, leading to large population increases of these species. The interesting question when assessing the performance of the existing ag-conservation programs is not whether they have delivered environmental benefits, but rather how efficient and effective they are in delivering them, and can we do better.
Ag-conservation programs to date have been relatively more effective at addressing issues concerning soil and vegetation over those concerning water. This may largely be due to the fact that it is relatively easier to address the former two, and the results are more readily apparent. Nonetheless, the biggest gains to be made going forward, and the most pressing conservation needs, involve improving the quality and quantity of water flowing across agricultural landscapes. Agriculture is the largest consumer of water in the nation and the primary source of nutrients in the nation’s surface and ground water. Excess nutrient runoff and leaching from croplands have impaired the water quality of several of America’s rivers, lakes and estuaries. Agriculture is the leading source of pollution in 48 percent of river miles, 41 percent of lake acres (excluding the Great Lakes) and 18 percent of estuarine waters found to be water-quality impaired (Ribaudo and Johansson, 2006). Agricultural runoff is the primary cause of large “dead” or hypoxic zones in the Chesapeake Bay and the Gulf of Mexico that have had catastrophic effects on local marine life. According to one study, ground-water levels are declining from 6 inches to 5 feet annually beneath over 14 million acres of irrigated land (Sloggett and Dickason, 1986). In the arid West, agriculture is engaged in increasing competition with growing cities—and diversions for environmental purposes—for ever-scarcer water. All trends point to water issues related to agriculture being the most complex and challenging conservation challenges of the future. Well designed and strategically implemented ag-conservation programs may go a long way in preparing workable solutions to these looming challenges.
In addition to water, soil and wildlife conservation issues also need a new set of tools to address future challenges. Recent literature seems to indicate that gains in reduced soil erosion and increased soil productivity have leveled off, with about one-third of U.S. cropland experiencing soil erosion and declining productivity. Wildlife benefits of ag-conservation programs outside grassland ecosystems of the Midwest are limited. In particular, ag-conservation programs have directed scant attention towards aquatic species and those found on forest lands and the arid rangelands of the interior west.
The initial application and subsequent concentration of ag-conservation programs is highest in the cropland states in the middle of the nation, running from North Dakota and Minnesota to Texas, a pattern that mirrors the geographical concentration of farm commodity payments (Table 3). Among ag-conservation programs, CRP payments dominate, accounting for almost two-thirds of all conservation payments in 2005. Most of the CRP payments are concentrated in the Plains and western Corn Belt states, where land is prone to wind erosion. In 2005, eight states including Illinois, Iowa, Kansas, Minnesota, Missouri, Montana, North Dakota, and Texas received more than $100 million in CRP payments and accounted for 57 percent of all CRP payments and about 46 percent of all conservation payments. (USDA, 2006) In contrast, application of EQIP, with its emphasis on livestock production, is relatively more widespread, covering more western states. One of the immediate actions

216 WOODS INSTITUTE FOR THE ENVIRONMENT | STANFORD UNIVERSITY
under the new paradigm of conserving ecosystem services across all agricultural landscapes must be the expansion of the geographical focus of ag-conservation programs to include croplands producing fruits, nuts, vegetables and tree nurseries, rangeland, and forest land.
Table 3. Top Ten States Receiving Conservation Payments, Estimated for Calendar Year 2005 ($ million)
STATES CRP WRP EQIP CSP FRPP TOTAL*
Iowa 217.5 13.3 13.0 18.6 0 264.0
Texas 140.4 0.6 47.8 2.3 1.5 193.4
Minnesota 110.6 15.4 14.7 5.6 0 147.1
Missouri 105.3 10.5 9.1 19.0 0 146.4
Illinois 120.2 9.5 6.1 9.4 0 145.5
Kansas 116.0 0.7 14.7 10.1 0.4 142.6
Montana 113.5 0.4 15.6 11.2 0.8 142.6
North Dakota 110.0 2.1 10.0 5.6 0.4 128.7
Nebraska 71.2 4.4 20.2 7.7 0.2 104.1
Washington 78.5 2.9 9.7 6.4 1.1 101.1
Total+ 1,822.6 160.6 443.9 206.0 112.4
* Total refers to all the conservation payments—including but not limited to CRP, WRP, EQIP, CSP, FRPP—received by the state. This includes payments from other conservation programs not listed.
+ Total refers to the total national outlays under the given conservation program for all states, including those not listed.
Source: USDA, 2006.
In 2004, 15 percent of all farms received conservation payments, with payments averaging about $5,330 per farm. (USDA, 2006) Conservation payments amounted to 4 percent of gross cash farm income for the farms that received conservation payments. In the same year about 10 percent or less of farms specializing in livestock production received conservation payments. Based on these figures, about 85 percent of row crop farms and more than 90 percent of livestock farmers did not receive any conservation payment and appear not to participate in federal ag-conservation program. There is substantial room for ag-conservation programs to grow.
It also appears that relative participation in present ag-conservation programs rises with farm size. In 2004, about 14 percent of rural residence farms,1 16 percent of intermediate farms and 20 percent of commercial farms received conservation payments (USDA, 2006). However, in absolute numbers, the majority of conservation payments go to rural residence farms. In 2004, 49 percent of the total conservation payments dispersed were received by rural residence farms, and they accounted for 59 percent of total farms receiving conservation payments. Furthermore, in 2004 conservation payments accounted for 79 percent of all government payments and 23 percent of gross cash income on rural residence farms that received conservation payments. In the same year conservation payments
1 Farm typology distinguishes among commercial farms, with sales of $250,000 or more whose farm operator reports farming as the major occupation (less than 10 percent of all farms); intermediate farms, with sales under $250,000 whose farm operator reports farming as the major occupation (25 percent of all farms); and rural residence farms, in which the farm operator’s major occupation is not farming, or the farm is a limited resource farm (65 percent of all farms). (USDA, 2006)
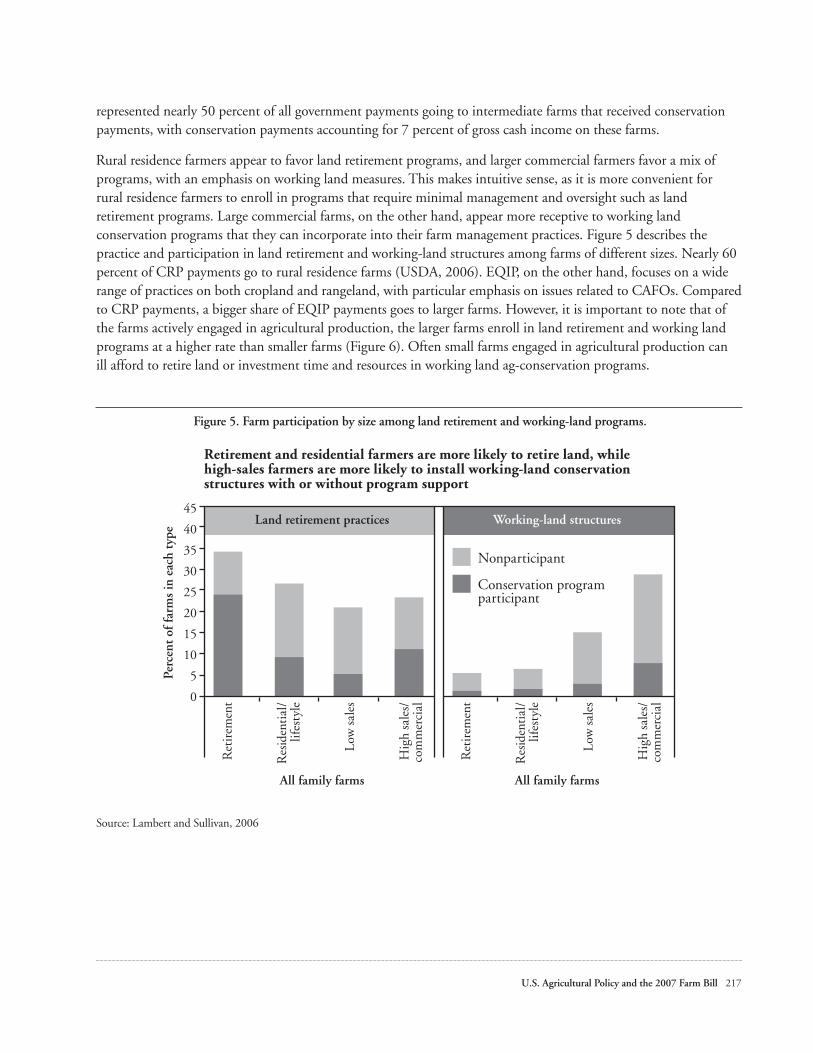
U.S. Agricultural Policy and the 2007 Farm Bill 217
represented nearly 50 percent of all government payments going to intermediate farms that received conservation payments, with conservation payments accounting for 7 percent of gross cash income on these farms.
Rural residence farmers appear to favor land retirement programs, and larger commercial farmers favor a mix of programs, with an emphasis on working land measures. This makes intuitive sense, as it is more convenient for rural residence farmers to enroll in programs that require minimal management and oversight such as land retirement programs. Large commercial farms, on the other hand, appear more receptive to working land conservation programs that they can incorporate into their farm management practices. Figure 5 describes the practice and participation in land retirement and working-land structures among farms of different sizes. Nearly 60 percent of CRP payments go to rural residence farms (USDA, 2006). EQIP, on the other hand, focuses on a wide range of practices on both cropland and rangeland, with particular emphasis on issues related to CAFOs. Compared to CRP payments, a bigger share of EQIP payments goes to larger farms. However, it is important to note that of the farms actively engaged in agricultural production, the larger farms enroll in land retirement and working land programs at a higher rate than smaller farms (Figure 6). Often small farms engaged in agricultural production can ill afford to retire land or investment time and resources in working land ag-conservation programs.
Figure 5. Farm participation by size among land retirement and working-land programs.
Source: Lambert and Sullivan, 2006

218 WOODS INSTITUTE FOR THE ENVIRONMENT | STANFORD UNIVERSITY
Figure 6. Farm participation by Ag. production among land retirement and working-land programs.
Source: Lambert and Sullivan, 2006
The future design and application of ag-conservation programs should be structured to correspond to the evolving agricultural landscape of the United States. The rural residence farmers prefer programs with minimal oversight, while larger farms are more receptive of working land conservation programs. This distinction bears note, as agricultural production in the U.S. is projected to continue to consolidate among increasingly fewer and larger commercial farms. Conversely, the ranks of rural residence farms, both in number and acres, may continue to rise.
IV. Implementing conservation of ecosystem services across agrarian landscapes: areas of improvement in policies and programs Several steps can be taken to better coordinate and deliver existing ag-conservation programs to strategically conserve ecosystem services across all agricultural landscapes. These include developing a land stewardship standard; greater use of performance measures at the landscape level; coordinating the delivery of ag-conservation programs; and expanding the scope and application of ag-conservation programs to all agricultural landscapes.
A. LAND STEWARDSHIP STANDARD
A preliminary question in implementing an ag-conservation program that rewards farmers for conservation practices is to determine what is expected of a responsible land steward to do on his own and what are the appropriate actions above and beyond those expected that should be rewarded. In other words, what is the conservation standard or baseline that a farmer should meet before he is eligible to participate in programs that assist, encourage, and reward further conservation practices? It is important to note that the land stewardship standard discussed here is voluntary. It defines a condition qualifying a farmer to receive additional farm payments.

U.S. Agricultural Policy and the 2007 Farm Bill 219
Three guiding principles may help inform the design of a land stewardship standard. First, it must minimize the negative environmental impacts from the farm to the broader ecological landscape e.g. local watershed. Second, it must promote practices that benefit the farmer in direct and substantial manner. Finally, the practices called for by the standard must be easy to implement as part of routine farm operations without the need for substantial additional resources. Existing conservation compliance programs offer a sound and tested base on which to develop a land stewardship standard. The conservation compliance programs, including sodbuster and swampbuster, condition the farmer’s receipt of any commodity support payments on implementing a soil management program for highly erodible soils and not converting wetlands to agriculture. The programs are familiar and accepted by farmers and have contributed to reduced soil erosion and wetland conversion.
A land stewardship standard may build on existing conservation compliance measures by adding new criteria and expanding the scope of compliance requirement. First, all farmers receiving any commodity, conservation, or comparable payments from USDA may be required to meet the land stewardship standard. It is important to note that although any additional payments to farmers may be conditional to their meeting the land stewardship standard, technical assistance and cost share should be readily available to all interested farmers to help them meet the land stewardship standard. The Department of Agriculture may develop a list of conservation attributes under the three principles stated above to define the land stewardship standard. In particular, nutrient management may be added alongside requirements to implement soil management schemes for highly erodible soils and prohibition on wetland conversion, since nutrient runoff and leaching from croplands is the primary contributor of water quality impairment in our nation’s waters. Moreover, cropland with the greatest potential for nutrient runoff and leaching is often the same that receives a large share of commodity payments and presently is subject to existing conservation compliance measures (Figure 7).
Figure 7. Croplands with the highest potential for nutrient runoff and leaching and those participating in existing conservation compliance measures, 1998.
Source: Claasen et al. 2004.
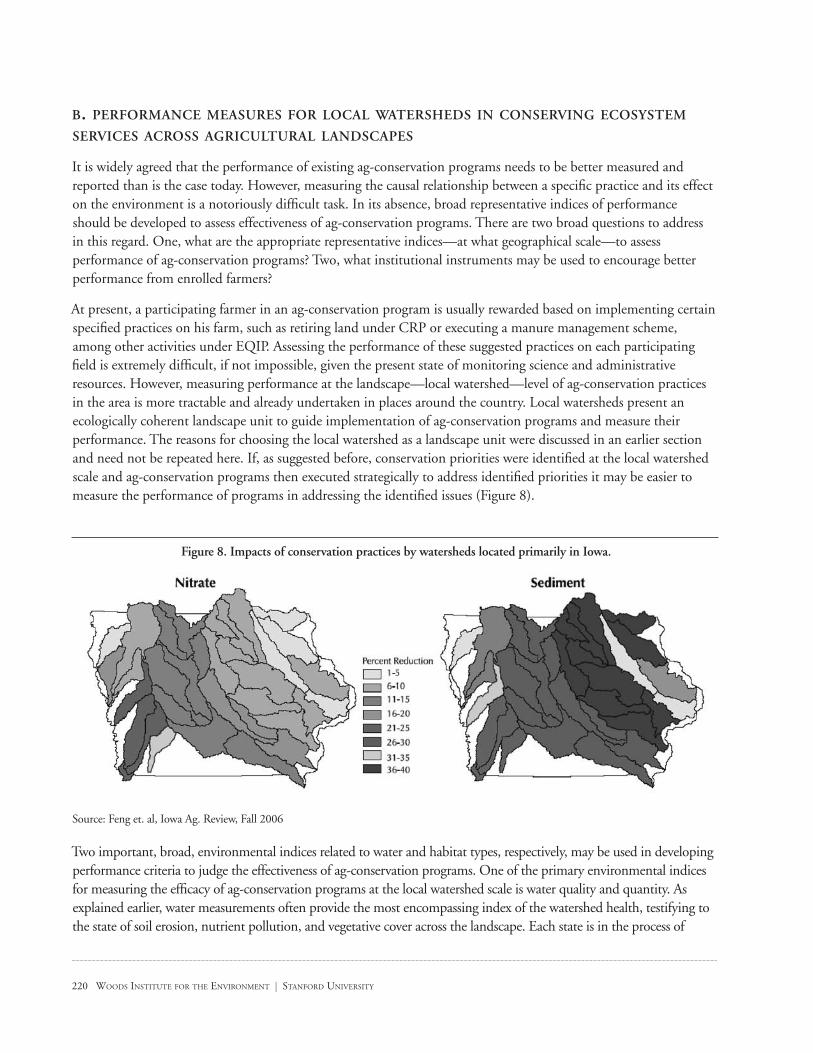
220 WOODS INSTITUTE FOR THE ENVIRONMENT | STANFORD UNIVERSITY
B. PERFORMANCE MEASURES FOR LOCAL WATERSHEDS IN CONSERVING ECOSYSTEM SERVICES ACROSS AGRICULTURAL LANDSCAPES
It is widely agreed that the performance of existing ag-conservation programs needs to be better measured and reported than is the case today. However, measuring the causal relationship between a specific practice and its effect on the environment is a notoriously difficult task. In its absence, broad representative indices of performance should be developed to assess effectiveness of ag-conservation programs. There are two broad questions to address in this regard. One, what are the appropriate representative indices—at what geographical scale—to assess performance of ag-conservation programs? Two, what institutional instruments may be used to encourage better performance from enrolled farmers?
At present, a participating farmer in an ag-conservation program is usually rewarded based on implementing certain specified practices on his farm, such as retiring land under CRP or executing a manure management scheme, among other activities under EQIP. Assessing the performance of these suggested practices on each participating field is extremely difficult, if not impossible, given the present state of monitoring science and administrative resources. However, measuring performance at the landscape—local watershed—level of ag-conservation practices in the area is more tractable and already undertaken in places around the country. Local watersheds present an ecologically coherent landscape unit to guide implementation of ag-conservation programs and measure their performance. The reasons for choosing the local watershed as a landscape unit were discussed in an earlier section and need not be repeated here. If, as suggested before, conservation priorities were identified at the local watershed scale and ag-conservation programs then executed strategically to address identified priorities it may be easier to measure the performance of programs in addressing the identified issues (Figure 8).
Figure 8. Impacts of conservation practices by watersheds located primarily in Iowa.
Source: Feng et. al, Iowa Ag. Review, Fall 2006
Two important, broad, environmental indices related to water and habitat types, respectively, may be used in developing performance criteria to judge the effectiveness of ag-conservation programs. One of the primary environmental indices for measuring the efficacy of ag-conservation programs at the local watershed scale is water quality and quantity. As explained earlier, water measurements often provide the most encompassing index of the watershed health, testifying to the state of soil erosion, nutrient pollution, and vegetative cover across the landscape. Each state is in the process of

U.S. Agricultural Policy and the 2007 Farm Bill 221
developing Total Maximum Daily Loads (TMDLs) of water pollutants for major state watersheds, as required under Clean Water Act. TMDLs would offer useful information to measure ag-conservation program performance. Additionally, USDA is in the process of developing and improving upon several models to simulate and assess water flows in local watersheds. Research and application of such tools should be strongly encouraged.
Another important environmental index to measure program performance may be the range and connectivity of native habitat types in a given local watershed. Most states have GIS coverages marking the existing eco-regions with representative habitat types found in the state. Several states have undertaken exhaustive conservation planning exercises to identify the threatened and decreasing habitat types in their state. The most recent such exercise has been to develop State Comprehensive Conservation Plans pursuant to Department of Interior grants. This information should be used at the local watershed and broader landscape level to strategically target land retirement and working land conservation programs to preserve and enhance the imperiled habitat communities within a state.
Water and native habitat types offer broad practical indices to both set performance goals for a watershed and then measure the performance of ag-conservation programs in achieving those goals. Such effective indices should be increasingly used to guide administration of ag-conservation programs.
In addition to developing performance indices, administration of ag-conservation programs may increasingly incorporate mechanisms to reward farmers based on performance. Participating farmers may be offered a tiered reward structure that provides greater reward based on greater performance. The Conservation Security Program follows this very tenet. However, it is important in administering a tiered reward scheme to strike the appropriate balance between the base and performance dependent rewards. CSP may need to be revised to better calibrate its tiered structure. Under CSP, to the extent possible, it is better to address the base requirements through a land stewardship standard and schedule additional payments on actions above and beyond. The above-mentioned indices of water and native habitat communities offer convenient tools to develop performance-based reward schemes. In the case of habitat communities, farmers may be offered bonuses if they support sensitive habitat in contiguous blocks. Additionally, application of reverse auctions in meeting performance standards in a given watershed should be fully explored.
It is imperative that information concerning both the environmental indices to measure performance of ag-conservation and performance-based rewards are made readily available to the wider public—preferably on the Web. Such information may be organized and represented by local watersheds in a given state. This would allow all interested public and private parties to readily inform themselves of the conservation status of watersheds in a given state and see what progress is being made, at what cost. It would be very encouraging if the best-performing watersheds were annually recognized within the state with deserved fanfare.
C. WHOLE FARM STEWARDSHIP AGREEMENT: COORDINATED DELIVERY OF AG-CONSERVATION PROGRAMS
A striking feature of the present crop of ag-conservation programs is the sheer number of them. There are presently about 25 major and minor ag-conservation programs available broadly or targeted to a specific area. Few, if any, state or federal employees—let alone farmers—have a full understanding of all the programs available and how they interact in their application. The vast and befuddling array of existing farm conservation programs result in inefficiencies in delivery systems, with lesser-known programs often underutilized. Nonetheless, there exist tremendous synergies among the various programs that could be harnessed by coordinating their delivery through a comprehensive and straightforward mechanism.

222 WOODS INSTITUTE FOR THE ENVIRONMENT | STANFORD UNIVERSITY
One relatively ready solution is to coordinate the delivery of ag-conservation programs, including technical assistance to an individual farmer, through a single comprehensive Whole Farm Stewardship Agreement. Instead of individually pitching separate ag-conservation programs to a farmer and signing separate agreements, one agreement would have all the available ag-conservation programs for the farmer to choose from. The Whole Farm Stewardship Agreement may contain four broad sections: 1) whether the farmer meets the Land Stewardship Standard (or needs technical assistance to meet it); 2) the conservation priorities in the local watershed; 3) the range of ag-conservation programs available to the farmer, with addendums for specific programs if needed; and 4) performance criteria if any to assess the efficacy of conservation practices on the farm.
A Whole Farm Stewardship Agreement, by offering the full range of ag-conservation programs available to the farmer, would allow for greater flexibility and enhanced value. One comprehensive agreement would reduce transaction costs for both the farmer and the administering agency. Further, with all available ag-conservation programs represented in one agreement, it would offer a full set of conservation tools to address the range of ecosystem services emanating from the farm. Effective conservation of ecosystem services across agrarian landscapes requires a combination of conservation tools ranging from technical assistance to land retirement to working land measures. The ability to offer and coordinate the delivery of these programs through one instrument, as opposed to several, makes common sense, offering a bigger bang for the buck for both the farmer and the administering agency. Administration of ag-conservation programs through one Whole Farm Stewardship Agreement per farm would persuade agency field personnel to comprehend the full range of ag-conservation programs and apply them in a way that uses their latent synergies to the maximum.
D. CONSERVATION OF ECOSYSTEM SERVICES ACROSS ALL AGRICULTURAL LANDSCAPES
The full range of ag-conservation programs should be made available to all owners and operators of cropland, rangeland, and forest land across the United States. Today, the majority of ag-conservation programs, much like commodity programs, are concentrated around the midwestern croplands. An effort to expand them to rangeland areas got a boost from the increased EQIP funding under the Farm Bill 2002. Nonetheless, participation in these programs by livestock operators in the interior West significantly lags behind that of farmers in the midwestern cropland areas. Little attention has been paid to tailoring ag-conservation programs to fruit and vegetable growing farms. It is important to note that given the nature of the farming for these specialty crops, the farmers there would be more amenable to working land conservation programs than land retirement programs. The area that is most untouched by ag-conservation program is the forest land. Forest lands offer a rich array of ecosystem services and are conducive to application of working land conservation programs. There exists an attractive opportunity to expand a modified application of present set of ag-conservation programs with emphasis on working land measure to forest lands across the nation.
V. Institutional Measures to Effect Conservation of Ecosystem Services across Agrarian Landscapes The reach and effectiveness of federal ag-conservation efforts may substantially benefit from institutional measures that directly leverage state and private actors to follow suit. There is a growing realization by state agencies and private organizations of the potential of ag-conservation programs to conserve ecosystem services across agrarian landscapes, the dominant land category in the United States. Federal farm policy can better utilize these largely untapped resources in design and execution of ag-conservation programs. Additionally, the federal government may commit to robust investment in agricultural research and extension services with a dual focus on improving farm productivity and conserving ecosystem services across agricultural landscapes.

U.S. Agricultural Policy and the 2007 Farm Bill 223
A. COOPERATIVE FEDERALISM
There is a strong tradition of federal-state collaboration in implementing ag-conservation programs, particularly in the midwestern states. Midwestern state natural resources and wildlife agencies have played an increasingly important role in both design and implementation of ag-conservation programs such as CRP, WRP, CSP, WHIP, CREP, etc. Programs such as CREP formally require state-federal partnership in both funds and execution, while the federal WHIP was based on state programs with a similar acronym in Kansas and Nebraska. The midwestern state agencies and conservation organizations remain, to this date, among the most active and influential voices on federal ag-conservation programs. This federal-state working relationship could be strengthened and expanded through all states and agricultural lands.
In the federal structure of the U.S. government, states act as valuable laboratories by effectively executing federal programs on the local terrain. Several states have taken a lead in implementing federal ag-conservation programs: the Missouri Department of Natural Resources is very active in implementing the CSP program on select state watersheds, with an emphasis on species conservation; meanwhile, the WILD Nebraska initiative takes a systems view, based on natural eco-regions of the state, to target federal and state ag-conservation programs, in a coordinated and strategic manner, to conserve the state’s imperiled natural habitats. In doing so, these state agencies have forged active partnerships with local chapters of conservation organizations such as Pheasants Forever and Ducks Unlimited.
Federal and state agencies have complementary strengths in implementing ag-conservation programs. State agencies are repositories of state ecological information and boast a rich network of field personnel, while the federal agencies have the appropriated funds to pay for the conservation programs. A collaborative federal-state working relationship is essential to identifying the pressing environmental issues across a state’s varied agricultural landscapes. States will be crucial partners in the application of ag-conservation programs to the landscape. State agencies are presently nearing completion on two very important conservation planning processes. First, most states, as mentioned earlier, have recently completed preparing Comprehensive Wildlife Conservation Strategies for the entire state, with particular attention to identifying imperiled habitat and species. Second, under provisions of the Clean Water Act, states are to develop Total Maximum Daily Loads (TMDLs) of pollutants for all watersheds of the state. The important information available from these and other state conservation planning exercises is directly relevant in administering ag-conservation programs that conserve ecosystem services across agrarian landscapes in the state.
To consolidate the tenets of cooperative federalism in the administration of ag-conservation programs, two broad actions may be considered. First, block grants may be made available to the states to implement programs conserving ecosystem services across their agrarian landscapes. Second, based on the model of the Pittman-Robertson and Dingall-Johnson funds, a nominal excise duty may be applied on agricultural appliances and the funds distributed among states for the implementation of ag-conservation measures.
B. NEW MARKETS
Beyond cooperative federalism, the federal government may analyze and facilitate private market valuation of ecosystem services emanating from agricultural lands. There are encouraging signs in the field, with a spurt of programs already trading in water pollution reduction credits, sequestered carbon credits, and wetland mitigation credits. Trade in water pollution-reduction credits offers great potential for creating robust local markets across agricultural landscapes. Under the provisions of the Clean Water Act, a discharge cap is set for polluting point sources in impaired watersheds based on their TMDLs. This would offer an attractive opportunity for farmers to build and trade pollution-reduction credits.

224 WOODS INSTITUTE FOR THE ENVIRONMENT | STANFORD UNIVERSITY
Federal actions can facilitate new markets on two broad fronts—first, by developing robust performance and reporting mechanisms to define and account for tradable environmental parameters, and second, by offering seed grants to facilitate establishment of marketing institutions trading in ecosystem services across agricultural landscapes. USDA had made modest progress on both these fronts. Under the 2002 Farm Bill, over $4 million were dispersed in 2004–2005 as Conservation Innovation Grants to establish trading programs in water quality, wildlife habitat and carbon sequestration (USDA, 2006). A more dedicated effort needs to be made in this area with a strong emphasis on water quality. One of the potentially high growth areas in this field lies in facilitating market transactions between urban centers and the farmers whose land practices affect the water quality of the downstream city.
C. RESEARCH AND EXTENSION
The agricultural research and extension effort needs to be reenergized with requisite investment, so it can help American farmers produce the full range of ecosystem services from their lands and benefit from these services. Agricultural research and extension efforts have been integral to the growth in productivity of American agriculture. However, public investment in this area has waned of late, with some indication that rate of agricultural productivity growth has suffered. At the same time, farmers and the general public are becoming increasingly aware of the inherent complexity of the environmental effects of agricultural practices. There is a growing clamor to better understand and account for the ecosystem services arising from all agricultural landscapes. This all portends a new and vibrant role for a reenergized and redirected agriculture research and extension service.
Agricultural research and extension efforts can assist with the administration of the ag-conservation programs by conducting new research related to ecosystem services from agricultural landscapes and by suggesting practical application of their findings. One of the pressing questions in research is how to calibrate the landscape environmental effects of farming practices on the field. Agricultural research and extension can also play a valuable role in the development of new markets for ecosystem services from agricultural lands. Strategic investment in agricultural research and extension services should include assessing the full range of ecosystem services emanation from agricultural landscapes, developing practical tools to measure performance of ag-conservation programs, and developing new markets for ecosystem services from agricultural lands.
VI. Ag-Conservation Programs and WTO Issues The Uruguay Round Agreement on Agriculture (URAA) imposes disciplines on domestic policies, in addition to measures such as tariffs and export subsidies that impact trade directly. Conservation programs that are included in the Farm Bill fall under these disciplines. However, the focus of the WTO regulations is on policies deemed to be trade-distorting, such as payments that stimulate production. These payments were subject to reduction commitments over the period 1995–2000 and are now subject to a strict limit. The URAA identifies a set of payments that are exempt from reductions. The criteria for such payments define a “Green Box” of policies that have “no, or at most minimal trade-distorting effects or effects on production.”
A range of ag-conservation programs fall under the Green Box, including:
1. research connected with environmental programs, under the general services exemption (expenditures on extension or training activities associated with the provision of environmental services would by implication also be exempt under the general exemption for such activities);
2. infrastructural works associated with environmental programs, but only for capital expenditures, not the subsidization of on-farm facilities or use of inputs (such as irrigation water);

U.S. Agricultural Policy and the 2007 Farm Bill 225
3. payments under environmental programs that are exempt, providing that they are part of a clearly defined government environmental or conservation program, dependent on the fulfillment of specific conditions including those relating to production methods or inputs, and subject to the condition that the amount of payment is limited to the extra costs or income foregone involved in complying with these conditions;
4. payments under structural adjustment efforts through resource retirement programs provided they are well-defined and remove land or other resources from marketable agricultural production for a minimum of three years (for livestock production, it is permanent).
The United States reported between $46 and $51 billion in annual Green Box payments to the WTO for the period 1995–2001, the largest component of which was for food and nutrition programs ($34 billion in 2001) followed by “General Services” at $9 billion. Government expenditures under a range of U.S. environmental programs included under the Green Box category ($291 million in 2001) account for less than one percent of the Green Box payments notified (Blandford et al. 2007).
The fact that many ag-conservation programs may appear to meet the criteria as minimally trade-distorting does not mean that the WTO constraints are unimportant. First, the design of conservation payments needs to take into account the conditions under which such payments would be considered eligible for the Green Box. Failure to do this could cause trading partners to challenge the U.S. notifications. Second, the payments themselves must not constitute specific subsidies that would contribute to additional production and contribute to “serious prejudice” to overseas producers—though it is unlikely that a successful challenge could be mounted against traditional land retirement programs, as they reduce production. Other programs that overcompensate for environmental investments or past the costs for farmers to comply with environmental regulations are vulnerable as one part of a package of subsidies. More important, a new program that provided generous “stewardship” incentives to farmers may be vulnerable to challenge, even if broad conservation benefits did accrue and even if the program were wrapped in a conservation flag.
Serious thought needs to be given to design of ag-conservation programs to ensure that the environmental incentives do not lead to product market distortions and the programs adhere to United States obligations under its WTO commitments. All ag-conservation programs need to meet the two necessary conditions to qualify as Green Box payments. First, the programs must be publicly funded, not transfers from consumers, and not have the effect of offering price support to farmers. Second, ag-conservation programs must meet relevant specific policy criteria described in Annex 2 of URAA. There are some legitimate concerns about whether a robust ag-conservation program would strictly adhere to the enumerated specific policy criteria in Annex 2 of URAA. These issues are discussed in detail in the paper by Blandford et al entitled “U.S. Environmental Programs and the WTO Green Box.” However, there also exist in Annex 2 policy criteria heretofore underutilized in the context of ag-conservation programs, such as de-coupled income support. In determining the future direction of ag-conservation programs, a thorough analysis of available policy tools under Annex 2 needs be conducted. Notwithstanding some uncertainty on the topic, an ag-conservation program with clearly defined participation and performance criteria and transparent execution will stand on firmer ground than ill-defined and opaque conservation farm payments shrouded in a veil of greenish hue.
VII. Concluding Observations The 2007 Farm Bill offers a good opportunity to announce a new chapter in American ag-conservation. The initial round of ag-conservation programs has delivered environmental benefits. A solid foundation has been laid to build upon, and much building needs to be done. Agriculture programs continue to evolve and proliferate. Thus far, the evolution of ag-conservation programs has been ad-hoc in nature driven by well-intentioned but narrow

226 WOODS INSTITUTE FOR THE ENVIRONMENT | STANFORD UNIVERSITY
environmental or agricultural interests dedicated to carving out a specialized program servicing their narrow needs. The needs of the conservation and agricultural groups active in formulating ag-conservation programs, and that of the entire nation, will be better served if the federal government articulated an overarching strategy and goal to develop, execute and report on conservation efforts under the Farm Bill. The ag-conservation strategy should be broad and nimble to address a range of future issues such as bio-energy crops and others. Conserving ecosystem services across agrarian landscapes provides one such cohesive strategy.
Large swaths of agricultural landscapes in American remain untouched by present application of ag-conservation programs, affecting only 15 percent of row crop farmers and 10 percent of livestock producers. Valuable ecosystem services produced on these untouched agrarian landscapes are neither accounted for nor improved under the present application of ag-conservation programs. This shortcoming should be readdressed with due haste. Ag-conservation programs should be applied across all agricultural landscapes, accounting for local conservation priorities under a unifying coherent national conservation strategy. Present programs have just scratched the surface, affecting less than 10 percent of American agricultural landscapes. An enormous opportunity to address conservation across more than a billion acres lies ahead. Additional funds to address conservation of ecosystem services across agricultural landscapes are always helpful; however substantial gains may be achieved by applying the present programs and funds in a more effective and efficient manner.
In expanding the effective reach and scope of ag-conservation programs it is important that the full range of ecosystem services are addressed in a given agricultural landscape. Of the three ecological blocks—soil, vegetation, and water—providing the foundation for all ecosystem services emanating from agricultural landscapes, water is the most stressed and least addressed by the present set of ag-conservation program. Agriculture, more than any other industry, consumes and affects the water quantity and quality of the United States. Regulation of water flow is one of the most important ecosystem services provided by agricultural lands. Flow of water across a landscape offers a comprehensive ecological barometer to measure the health of the land and the impact of the practices upon it. A national conservation strategy to conserve ecosystem services across all agrarian landscapes may build on the foundation of conserving soil, vegetation and water resources across each identified agricultural landscape. In doing so, more attention may be directed to conserving water resources, not only because they are presently most stressed, but also because some of most pressing conservation challenges looming over the horizon concern water.
Strategic application of ag-conservation programs across agricultural landscapes may prove to be both an effective and efficient means to achieve conservation objectives. The use of the local watershed as a landscape management unit should be strongly encouraged to identify conservation priorities, establish conservation goals, direct program application, and assess program performance. It may be both prudent and practical to apply ag-conservation programs on a per field basis and measure the performance of these actions at the scale of the local watershed. In this way, not only are the conservation priorities and goals set at the local watershed scale, but the performance of conservation practices is also measured at the same geographical scale. By designating the local watershed as management unit of choice to administer ag-conservation programs, the federal government would not only provide coherence and improve the effectiveness of its own programs, but also persuade other federal, state, local and private organizations to follow suit. Such a trend will greatly facilitate and energize research to develop and improve new scientific tools to design, implement and assess ag-conservation programs. Information related to the state of ecosystem services in a given local watershed and the ag-conservation efforts to improve them should be made publicly available for each state.
The application of existing ag-conservation programs can be greatly enhanced by better coordination under a strategic direction described in Figure 9. Going forward, it is important that a land stewardship standard be developed to clearly

U.S. Agricultural Policy and the 2007 Farm Bill 227
state reasonable actions expected by a responsible land manager. The Natural Resources Conservation Service already possesses the requisite information to develop such a standard. Existing conservation compliance programs offer a familiar base to build upon. There are very persuasive reasons to include nutrient management as one of the criteria in land stewardship standard. Ag-conservation programs may offer technical assistance to all interested farmers to meet the defined land stewardship standard. However, a farmer may be required to meet the land stewardship standard to be eligible to receive any additional payments under any federal farm program.
Figure 9. Program Delivery to Conserve Ecosystem Services across Agrarian Landscapes
228 WOODS INSTITUTE FOR THE ENVIRONMENT | STANFORD UNIVERSITY
A coordinated delivery of all ag-conservation programs through a Whole Farm Stewardship Agreement will facilitate better comprehension and treatment of the full range of ecosystem services arising from a given farm. A Whole Farm Stewardship Agreement dedicated to strategically targeting conservation priorities in the local watershed, through an optimal combination of available ag-conservation programs, will reduce redundant inefficiencies and enhance synergies in program application. Performance-based incentives could readily be incorporated into the administration of a Whole Farm Stewardship Agreement.
Ag-conservation programs should be executed in a manner encouraging state, local and private actors to play an ever-growing role in conserving ecosystem services across agrarian landscapes. Federal-state partnership in the application of ag-conservation programs has a rich and strong history in the Midwest. With the expanded application of ag-conservation programs, similarly strong relationships could be developed across the United States. Federal-State partnership may be further facilitated by establishing state block conservation grants aimed at addressing pressing conservation issues across agricultural landscapes in a strategic manner.
New markets for conserving ecosystem services across agricultural landscapes represent one of the most attractive and potentially rewarding growth areas. Markets trading credits in water pollution, carbon sequestration and wetland banking are already in existence. Federal seed-grants and efforts at developing precise parameters of environmental credits being traded may further facilitate the growth of markets in ecosystem services.
There is a growing need for public research and extension services to play a robust role in assisting farmers and the administering agencies, by empowering them with the proper set of management tools, to conserve ecosystem services across all agricultural landscapes in the country. Careful thought should be devoted to building regional multi-disciplinary centers where agricultural ecologists, economists, agronomists, and other experts address the full range of ecosystem services from agricultural lands and suggest ways of improving agricultural practices to better conserve them.
Across the United States, most of the additional conservation efforts in the 21st century will derive largely from lands under private management. Public lands were the focus of the past century, and the conservation benefits from them have largely been secured. Private farm, ranch, and forest lands account for more than 1.2 billion acres across the United States and offer the richest source of ecosystem services to the nation. Ag-conservation programs under the Farm Bill offer the most concerted federal effort at conserving ecosystem services arising from these varied landscapes. Ag-conservation programs over the last two decades have grown in sophistication and produced important environmental benefits. The 2007 Farm Bill offers an opportunity to expand and steer the application of ag-conservation programs across the full reach of America. Towards that end a national conservation strategy dedicated to conserving ecosystem services across agrarian landscapes may offer a sound start.

U.S. Agricultural Policy and the 2007 Farm Bill 229
ReferencesBlandford David, Tim Josling and Kaush Arha. (2007) U.S.
Environmental Programs and their Compatibility with Green Box Provisions under the WTO Agreement on Agriculture. in U.S. Agricultural Policy and the 2007 Farm Bill: Promoting the Economic Resilience and Conserving the Ecological Integrity of American Farmlands. Editors Kaush Arha, Tim Josling Daniel A. Sumner and Barton Thompson. Woods Institute of the Environment, Stanford University. 17 pp. May 2007.
Cattaneo, Andrea, Roger Claassen, Robert Johansson, and Marca Weinberg. Flexible Conservation Measures on Working Land: What Challenges Lie Ahead? Economic Research Service, USDA, Economic Research Report No. (ERR5) 79 pp, June 2005.
Claassen, Roger, Andrea Cattaneo, Vince Breneman, Robert Johansson, Shawn Bucholtz and Mitch Morehart. Environmental Compliance in U.S. Agricultural Policy: Past Performance and Future Potential. Economic Research Service, USDA, Economic Research Report No. (ERR832) 48 pp, June 2004.
Feng Hongli, Catherin King, Phillip Gassman, Manoj Jha, and Joshua Parcel. The Costs and Benefits of Conservation Practices in Iowa. Iowa Ag. Review, Fall 2006. Center for Agricultural and Rural Development, Iowa State University.
Lambert, Dayton and Patrick Sullivan. (2006) Land Retirement and Working-land Conservation Structures: A Look at Farmer’s Choices. Amber Waves—Agriculture and the Environment. Volume 4. Special Issue. 6 pp. July 2006.
Lubowski, Ruben, Marlow Vesterby and Shawn Bucholtz. Land Use in Agricultural Resources and Environmental Indicators, 2006 Edition. Editors Keith Wiebe and Noel Gollehon. Economic Research Service, USDA, Economic Research Report No. Economic Information Bulletin 16. 8 pp, July 2006.
Ribaudo, Marc and Robert Johansson. Water Quality Impact of Agriculture in Agricultural Resources and Environmental Indicators, 2006 Edition. Editors Keith Wiebe and Noel Gollehon. Economic Research Service, USDA, Economic Research Report No. Economic Information Bulletin 16. 8 pp, July 2006.
Sloggett, Gordon and C. Dickason. (1986) Ground-Water Mining in the United States. U.S. Department of Agriculture, ERS AER-555. 23 pp.
U.S. Department of Agriculture. (2006). “2007 Farm Bill Theme Paper: Conservation and the Environment,” Washington, DC. 41 pp. June 2006.

230 WOODS INSTITUTE FOR THE ENVIRONMENT | STANFORD UNIVERSITY

U.S. Agricultural Policy and the 2007 Farm Bill 231
CHAPTER IV—CONCLUSION
U.S. Agricultural Policy and the 2007 Farm Bill: Promoting the Economic Resilience and Conserving the Ecological Integrity of American Farmlands
Kaush Arha, Tim Josling, Daniel A. Sumner, and Barton H. Thompson
The Farm Bill offers a timely opportunity to chart the future course of U.S. agriculture and natural resources in a new domestic and political environment. Writing the 2007 Farm Bill provides an opportunity for Congress and the Administration to articulate the objectives of U.S. agricultural policy. The Farm Bill can be used to redefine the scope of federal government action in support of agriculture and rural America and develop more constructive linkages with state and local activities. The Farm Bill is a vehicle to reaffirm the implicit contract among consumers, farmers, resource owners and taxpayers. And, as many look to the U.S. Farm Bill as an indication of the approach that the U.S. is taking to global trade and development issues, the time is appropriate for a message of continued leadership toward a more open trade system in agricultural products.
The Farm Bill determines the major areas where funds are to be spent, from nutrition and commodity support to conservation and rural development. Separate categories are defined for research, trade, energy, credit, and forestry. On average, more than three-quarters of the USDA annual outlays under the Farm Bill are for nutrition and commodity support programs. But other programs, although traditionally smaller in budgetary terms, are nevertheless critical to the success of the Farm Bill. This means that the debate about the provisions of the bill should extend beyond the scramble for budget allocations and consider the broad direction of food, rural, resource and agricultural policy.
There has long been a lack of coherent strategy to integrate the functions that Congress directs USDA to carry out under the Farm Bill provisions. The lack of transparent cohesiveness and sheer size of the legislative package means that much of the Farm Bill is a collection of specialized projects that go almost unnoticed, except by their supporters, in the morass of programs that is the Farm Bill. In the absence of a coherent and well-articulated purpose for U.S. agricultural policy there is no way to appropriately address how and whether a suggested program advances or detracts from what the federal government is trying to achieve.
Perhaps even more than other specialized legislation, the Farm Bill inhabits a legislative and institutional world complete with its own cast of characters, folklore, jargon, and statistics. This often makes the legislative process inordinately complex and opaque, where many uninitiated but deeply interested Americans are left out of meaningful participation. For example, few individuals are aware of how all the programs funded under the Conservation Title operate and relate to one another, let alone how the programs under different Farm Bill Titles collectively try to achieve the overall goals of U.S. agricultural policy. This legislative muddle leads to waste and undercuts benefits intended for American agricultural producers, rural residents and the natural environment. Thus, an effort to increase the transparency of the programs under the Bill would help maintain the political stability and widen the support.
This concluding chapter attempts to provide some coherence to the Farm Bill debate by suggesting a set of objectives that could be generally agreed upon. Then the chapter draws together the proposals contained in the
232 WOODS INSTITUTE FOR THE ENVIRONMENT | STANFORD UNIVERSITY
individual chapters of this book, along with with the suggestions that have been made by other bodies. The Forum focused on the issues of conservation and commodity programs, but cohesion necessitates linkages with nutrition and rural development aspects of the Farm Bill.
Objectives of U.S. Agricultural Policies Certain key objectives can be identified for U.S. agricultural policies, with relatively little disagreement. Four objectives that might form the basis for a cohesive agricultural strategy include:
• Assistance to assure affordable, healthy, and safe food for U.S. consumers and those abroad. Production and distribution of food in the United States is a private sector activity. However the government has long played a role with supplementary programs, particularly the food stamp program, school lunch support, and other policies to make food more affordable for the poor. Regulations governing food safety and the provision of information to consumers regarding nutrition and quality attributes are also generally accepted. The farm and food industries have great incentives to maintain and improve the quality of U.S. foods in a global marketplace, and the government plays a role there as well, especially when government-to-government action is needed. Consumers may also turn to the government for objective information about nutrition and food safety. An important role for policy is to avoid distorting the market signals that encourage provision of foods consumers demand. The reduction of barriers on imported food and agricultural goods also promotes consumer objectives by increasing choice and allowing competition to keep domestic prices low.
• Assistance to agriculture to maintain and improve competitiveness and to increase productivity. Competitiveness can be maintained by increased investment in research and extension, particularly in those areas not adequately covered by the private sector. This research is needed to develop new uses for agricultural products and new food products to meet changing consumer tastes. In particular, it is essential that the growing demand for ethanol and other biofuels not be based on uneconomic production of biomass, requiring continued and even increasing subsidies to meet mandated targets. Research to lower production costs could have significant payoff in terms of reducing the demand for subsidies. Trade policy—opening markets and allowing U.S. agriculture to compete at home and abroad—is a fundamental part of maintaining competitiveness.
• Conservation of natural resources and habitats both on working farms and on land idled to avoid environmental damage. Incorporating strong and well-funded conservation programs within the Farm Bill is essential, not only for the political balance but as a crucial part of a sustainable agriculture. Current programs are fragmented and often not adequately funded. Farmers are natural stewards of the land, but need correct incentives if this stewardship limits their other farming activities. Rewarding stewardship is an objective that can yield direct benefits to habitats and provide the non-farm population with opportunities to enjoy the countryside. Farmers may need additional incentives to adopt production systems that reduce the environmental footprint of agriculture.
• A contribution to rural development by providing infrastructure to maintain the role of agriculture in the wider context of sustainable rural development. Rural communities face the problem of inadequate or expensive infrastructure, from roads and power utilities to telephone and Internet connections. Increased public investment in such infrastructure, as well as in rural health and educational services, will help both agriculture and other rural businesses. The boost to employment opportunities in rural areas in turn helps agriculture by providing diversified sources of income and mitigates the effects of the decline in population experienced by many rural counties.

U.S. Agricultural Policy and the 2007 Farm Bill 233
Notice that we did not include income transfers to producers of program commodities on this list of consensus policies. Those sorts of program may be strongly favored by traditional payment recipients, but they are no longer, if they ever were, recognized as broadly beneficial to the nation as a whole. Similarly, the clamor for a publicly funded farm safety net when farm prices and incomes are at their highest is a policy that does not stand up to close scrutiny.
Policies chosen to achieve these objectives must work within constraints. Three such constraints are particularly significant:
• Consistency with international aims and obligations, including obligations under the WTO, NAFTA and other trade agreements and with other international treaties to which the U.S. is a signatory. U.S. agriculture has gained much by the gradual development of a more open trade system in the past fifty years. There is much more to gain if the remaining tariff barriers are reduced and subsidies that distort trade are removed. So U.S. farm policy must be consistent with this broader aim and responsive to the opportunities that arise at the negotiating table. Similarly, the benefits to be derived from enforceable obligations in the WTO and elsewhere are dependent upon U.S. policy being brought into compliance promptly when found to be out of line with legal obligations. Without such compliance, it will be increasingly difficult to persuade other countries to play by the rules. Moreover, crafting the Farm Bill in such a way that international obligations are clearly respected gives producers more security that support programs will not be vulnerable to challenge.
• Fiscal responsibility, keeping the cost of farm programs within budget guidelines and contributing to the reduction of deficits. Funds available for farm programs must compete with other uses for tax revenue. Given the many spending priorities, agriculture will find additional funds increasingly scarce if budget deficits are taken seriously. Funding decisions are based on changes from current obligations over the life of the new bill. The fund available for the Farm Bill has decreased, based on projections of high crop prices for the next five years. But the budget process is complicated by the fact that many parts of farm policy require annual appropriations, which may have to be considered in different budget circumstances. So the constraint on farm legislation is real but complex.
• Political sustainability, including the need for a stable coalition of interested groups. Political balance is an important prerequisite for a stable policy environment. A policy that is seen to address the needs of all sectors of U.S. agriculture, and not just producers of a few select crops, is more sustainable. A policy that covers a full range of issues and contains an appropriate distribution of funds is likely to be more widely supported.
Proposals for the 2007 Farm BillThe objectives spelled out above, and the constraints under which they must be achieved, suggest some changes in agricultural policy that could be introduced in the 2007 Farm Bill. The chapters in this volume address several of these changes, particularly in the areas of commodity policy and conservation. The need to redirect the course of U.S. agricultural policy has been recognized by several groups. This section brings together some of these ideas and places them in the context of other proposals that have been made by various groups. Proposals have already been presented by commodity groups, think tanks, and environmental organizations. Those that will be specifically discussed here include those of the American Farmland Trust (AFT), the Chicago Council on Global Affairs (Chicago), and the United States Department of Agriculture (USDA): others mentioned include suggestions by the Cato Institute (Cato), the American Farm Bureau Federation (AFBF), and the National Association of Corn Growers (NACG). The Administration’s proposals were published in February 2007 and covered many of the aspects of the Farm Bill agenda. These proposals are also discussed briefly below and compared in Table 1.
234 WOODS INSTITUTE FOR THE ENVIRONMENT | STANFORD UNIVERSITY
COMMODITY PROGRAMS
The authors of the chapters above, along with many of the groups that have made proposals for the Farm Bill, agree that the time has come to rethink the main aspects of commodity programs. Sumner concludes that there are no good, objective policy reasons to explain why the federal government continues to persevere with its commodity programs just for select crops. Farm commodity programs, narrowly focused, do not contribute to alleviating rural poverty and in many instances exacerbate it by favoring the larger producers of program crops. The argument to smooth income variability on farms is also weakened when one considers the narrow range of crops involved. Why does a corn farmer need more protection from income variability than a walnut grower or a grocery store owner? Those farms that produce program crops enjoy income levels higher than average American households and off-farm revenue, investments, and other means for smoothing consumption over time. Farm commodity payments are not targeted to vulnerable rural communities. Today, less than 5 percent of the U.S. rural population is engaged in agriculture. Commodity payments are ineffective ways for dealing with rural development.
Nor can current U.S. programs be justified as a response to subsidies abroad. Of course, many other agricultural traders—notably the European Union, Norway, Switzerland, Korea, and Japan—also subsidize their agricultural sectors, and generally at a higher level than the U.S. But it is important to note that current programs are not tailored to countervailing agricultural subsidies of our trading partners. For the main program crops, the support in the U.S. lowers world prices and causes problems for our trade partners. And the cost of these measures is borne by U.S. taxpayers and consumers to a much greater extent than by farmers abroad. In the case of cotton, most important global competitors are not subsidized. Conversely, the U.S. does not subsidize fruit and vegetable production, while several competitor states do so heavily. Interestingly, U.S. fruit and vegetable growers call for increased federal funding for research, marketing and pest management as a way to support the sector, rather than farm support payments.
Commodity programs do not seem to further the objective of long-term productivity or the competitiveness of the industry. There is no evidence to suggest that subsidized commodity producers are more innovative or successful than those parts of agriculture with little or no subsidy. Moreover, there are costs associated with continuing the commodity programs. In order to continue the benefits for producers of a handful of crops, the costs are borne by the entire agricultural sector and the economy. And one of the major factors contributing to the failure of July 2006 negotiations at the Doha Round was reluctance on the part of the U.S. to offer real reductions to its traditional commodity support programs. Should the Doha Round fail, this would cost many producers of non-program crops the chance to benefit from improved market access abroad.
In summary, it is difficult to articulate a policy rationale for federal programs that, within agriculture, favor growers of certain crops over others. The only convincing reason to continue the current commodity programs is because we have had them for so long.
All policy proposals to shift the emphasis from the current commodity programs have to confront the hurdle that any change will result in a substantial loss to some interests. The present beneficiaries of commodity programs will experience reduced support, and other sectors of U.S. agriculture may see a gain. The question is not whether this will happen—it seems inevitable in the future—but whether to eliminate the programs quickly or allow them to continue with lower funding and more constraints. Some observers advocate simply eliminating the commodity programs as swiftly as possible (Cato and AEI). They argue that any extension of such programs reaffirms a strong expectation on the part of the beneficiaries that government will continue to support and subsidize their operations. Furthermore, they argue that no prior efforts to gradually decrease farm payments have been credible in staying true to their course. They argue that any unnecessary government intrusion leads to imperfect market signals and misallocation of resources, depressing social welfare. Further, they point to growing calls by conservation groups

U.S. Agricultural Policy and the 2007 Farm Bill 235
such as AFT and ED for publicly funded farm safety net programs as misguided in the short term and dangerously harmful in the long run, as they substantially bolster farmers’ expectations for continued federal income support. However, the political support for a drastic cut in commodity support programs is now quite limited among those who are most engaged in the farm policy debate.
Conversely, representatives of the major beneficiaries of the present commodity programs such as the American Farm Bureau Federation and the cotton and rice commodity groups support a continuation of existing policies, pointing to the need to provide adequate incentives for production and to the ostensibly unfair practices of foreign agricultural trading states, among many of the other rationales discussed above. Proposals from some groups argue for increases in loan rates and an enlarged budget allocation for program crops. The rationale for an increase in budget allocation is that the current program costs are lower than expected, as a result of higher market prices. The increase in loan rates and in the budget expenditure is therefore seen as a recognition that budget outlays have fallen. The 2002 Farm Bill has “delivered” on its promise of a safety net, and has come in below budget, and therefore should be continued and enhanced. The main argument of these groups is that their constituencies are important and they benefit from the status quo.
Proposals from most groups fall somewhere in the middle ground and recommend both a quantitative and qualitative shift away from present commodity policies. These proposals suggest reducing the overall outlays under commodity programs and increasing investments in public goods, thus benefiting all U.S. agriculture through such measures as conservation, research, and rural infrastructure. The American Farmland Trust recommends revenue insurance and green payments; the Chicago Council on Global Affairs supports the notion of replacing existing commodity support programs with a new portfolio of policies that is less trade-distorting. This proposal also includes a universal revenue insurance scheme and a new land stewardship program.
The U.S. Department of Agriculture, in its own proposal, has put forth a comprehensive set of specific suggestions that appear to be directed at three broad objectives. One is to modify present commodity programs to increase efficiency and discourage excess farm payments. The USDA paper recommends the establishment of more market-based loan rates, set at 85 percent of the five-year Olympic average, which would result in an immediate reduction in loan rates for most commodities, with a maximum not far from the current rates. The proposal would also replace the existing price-based, counter-cyclical program with a revenue-based, counter-cyclical program.
In addition, the USDA proposal would also attempt to redirect payments away from higher income individuals. The USDA proposes to reduce the Adjusted Gross Income (AGI) eligibility cap for all farm commodity program payments from the current $2.5 million to $200,000 annually. Moreover, to encourage more decoupled and less trade-distorting support, the USDA recommends increasing overall direct payments; increasing direct payments to beginning farmers by 20 percent; and offering farmers with program crop base acreage a “conservation enhanced payment” that amounts to 10 percent more than their annual direct payment level, if they forego their marketing assistance loan and counter-cyclical program benefits. The USDA also recommends removing the fruits and vegetable prohibition on direct payment recipients, so direct payments are more likely to be consistent with the so-called Green Box criteria for decoupled income support.
If the Congress were to adopt the USDA’s proposals on commodity programs, it would be a substantial step toward a more market-oriented agricultural policy. However, the experience of ad-hoc market loss assistance payments following the 1996 Farm Bill, and the experience with dairy price supports and wool and honey programs, leaves uncertain the willingness of Congress to adopt a progressive reform in commodity payments and then stick to it when prices decline. Furthermore, the USDA proposal would still continue the practice of favoring a select group of farmers over others, albeit in a less trade-distorting and reduced manner.

236 WOODS INSTITUTE FOR THE ENVIRONMENT | STANFORD UNIVERSITY
A swift eradication of all commodity programs is improbable. The options are then to embark on a credible strategy to transition away from current commodity programs. The USDA proposals represent a good mix of politically attractive elements to encourage a shift away from the existing commodity programs towards direct payments. However, the USDA proposals do not attempt to address the institutional structure that fosters current commodity programs.
CONSERVATION PROGRAMS
Unlike the commodity title, the existing range of conservation programs in the existing Farm Bill offer a good foundation for a comprehensive and effective national strategy designed to address the conservation priorities across all agricultural landscapes in the nation.
The present set of agricultural conservation programs originated from the land retirement programs as supply control measures. Their application has resulted in arresting soil erosion and wetland conversion and has resulted in benefits to wildlife species associated with grassland ecosystems in the Midwest. However, their application to the country as a whole is limited by this focus on croplands in the Midwest; by the preference for land retirement programs such as CRP; by a lack of strategic application to address conservation priorities across landscape, by poor performance measures; by a number of duplicative, uncoordinated conservation programs; and by the very large budget costs if the strategy were extended to all of agriculture.
Environmental considerations found their way into U.S. agricultural policy on the shoulders of land retirement programs to curtail crop production and have since steadily grown in importance. The 2007 Farm Bill offers an opportunity to articulate Conservation of Agricultural Landscapes as one of the primary objectives of U.S. Agricultural Policy. This would direct the USDA to develop agricultural programs to address the pressing conservation issues and not design programs that are, in part, designed to support farm income and in part to address ill-defined environmental concerns. Furthermore, the application of agricultural conservation should strategically invest program resources in addressing the conservation priorities across all agricultural landscapes including cropland, rangeland, and forest land. Any conservation priority would thus be considered against an ecological unit—a defined landscape.
The 2007 Farm Bill offers an opportunity to coordinate agricultural conservation program delivery to address priorities within local watersheds. The conservation benefits of investing the considerable sums available in agricultural conservation programs in a strategic manner by local watersheds will introduce a new conservation era across America. Increasingly conservation across landscapes including agriculture is using local watersheds as ecological units to identify, prioritize, and measure conservation priorities. Several of the state wildlife conservation plans, recently completed under grants from Department of Interior, use watersheds to map important habitat types within the state. State wildlife management units are often based on local watershed boundaries. Natural resource conservation districts often plan their activities by watershed boundaries. So do local irrigation districts. The 2002 Farm Bill-initiated Conservation Security Program is administered by select watersheds across the nation, and the USDA proposal calls for expanding the program to affect 10 percent of available lands over the next 10 years. In addition, the USDA proposes a new Regional Water Enhancement Program (RWEP) to improve water quality and quantity over local watersheds or irrigation districts. The Farm Bill has the opportunity to consolidate this growing phenomenon by institutionalizing delivery of agricultural conservation programs by local watersheds. Of course watersheds are not the only ecologically sound basis for considering environmental policies, and in some cases air basins or species range may be more appropriate. However, a local watershed-based system can be easily modified by aggregation or subtraction to form a more apt ecological unit to address air quality or recover an imperiled species etc.

U.S. Agricultural Policy and the 2007 Farm Bill 237
In addition, the Farm Bill conservation title could be enhanced to accommodate issues such as bio-energy crops and a move from commodity payments to “green” payments, as represented by USDA’s proposed conservation enhancement payment option. A baseline set of conservation expectations must be established before farmers would be rewarded for additional conservation practices.
USDA proposals attempt to consolidate a range of similar programs, bolster compliance programs, and improve water quality and quantity by increasing wetlands and addressing issues on a watershed level. In consolidating similar programs, USDA proposes to integrate several cost-share programs, such as the Wildlife Habitat Incentive Program, the Agricultural Management Assistance Program, the Forest Land Enhancement Program, the Ground and Surface Water Conservation Program, and the Klamath Basin Program into a newly designed Environmental Quality Incentives Program (EQIP). Similarly, it proposes to consolidate existing easement programs, such as the Grassland Reserve Program, the Farm and Ranchland Protection Program and the Healthy Forest Reserve Program into the Private Lands Protection Program. It also proposes to combine post-catastrophic event response programs, such as the Emergency Watershed Protection and Emergency Conservation Program, into the new Emergency Landscape Restoration Program. In improving compliance programs, the USDA proposes two new programs: a Sod Saver program to discourage converting native grassland to cropland, and a new conservation enhancement payment option for current program crop producers, if they forego marketing loan assistance and counter-cyclical benefits. To improve water conservation, the USDA proposes to increase the enrollment limit of the Wetland Reserve Program by 50 percent to 3.5 million acres; to streamline and expand the Conservation Security Program from 15.5 million acres to 96.5 million acres over the next 10 years; and to create a new Regional Water Enhancement Program to improve water quality and quantity on a regional scale, based on watersheds or irrigation districts. In addition, the USDA recommends reauthorizing the Conservation Reserve Program, with priority within whole-field enrollment for lands utilized for biomass production for energy. The USDA proposals are clearly pointed towards larger and more effective conservation programs, but fall short of what might be accomplished in the 2007 Farm Bill.
LINKS WITH NUTRITION AND RURAL DEVELOPMENT
The papers in this volume have focused on commodity programs and conservation. Two other major policy areas addressed in the Farm Bill are nutrition and rural development. Though each of these areas is important in its own right, the linkages between them and conservation and commodity programs are also significant. Coherence in agricultural policy requires at the least that different aspects of that policy do not conflict and, at best, are complementary. Commodity programs are not currently in tune with the major nutrition programs, such as guidelines for nutrition established by government agencies. Regulations governing food safety and the provision of information to consumers regarding nutrition and quality attributes are recognized as essential aspects of food policy, though not a major part of the Farm Bill. The reduction of tariffs on imported food and agricultural goods also promotes consumer benefits by increasing choice and allowing competition to keep domestic prices low, tariff levels, however, are likewise not included in the Farm Bill.
Agriculture makes a vital contribution to rural development, although its dominance as an activity in rural counties is long past. Government action can help by providing infrastructure to maintain the role of agriculture in the wider context of sustainable rural development. Rural communities face the problem of inadequate or expensive infrastructure, from roads and power utilities to telephone and Internet connections. Increased public investment in such infrastructure, as well as in rural health and educational services, will help both agriculture and other rural businesses. The boost to employment opportunities in rural areas, in turn, helps agriculture by providing diversified sources of income and mitigates the effects of the decline in population experienced by many rural counties. Agriculture is in many ways more dependent on the level of rural development than the rural economy is on agriculture.
238 WOODS INSTITUTE FOR THE ENVIRONMENT | STANFORD UNIVERSITY
THE OPPORTUNITY FOR CHANGE
Would the reformed programs, as discussed above, give adequate support for farm incomes in the face of yield and price fluctuations and natural disasters? Many sectors suffer from fluctuating incomes, but agriculture has had a tradition of receiving help from the federal government to offset the impact of such fluctuations. Political support for any Farm Bill by program crop interests is likely to be contingent on the continuation of such programs. However, it is clear that existing programs are partial in coverage of risk and partial in coverage of the farm sector. The current programs have limited ability to smooth income variability for agriculture in the United States.
The opportunity to change farm policies is offered infrequently. The combination of high projected commodity prices due to the increased demand for ethanol and buoyant exports set a stage for farm program changes in 2007. The chances are good that farm incomes from crop farms in the parts of the country where program crops dominate will be strong for the next few years. High market prices and market-driven incomes should allow Congress to make changes that are good for the longer-term health of the farm sector, consistent with the national interest in promoting a more open trade system and supportive of investments in ecosystem conservation and a vibrant rural economy.

U.S. Agricultural Policy and the 2007 Farm Bill 239
Table 1: Farm Bill Recommendations for Commodity and Conservation Policy and Programs
COMMODITIES CONSERVATION
USDA • Revenue-based, counter-cyclical program; factor crop yield to determine payments
• Reform Marketing Assistance Loan; set rates at lesser of 85 percent of the five-year Olympic average or 2002 level
• Increase direct payments, do not update program payment bases and yields
• Allow planting flexibility of fruits, vegetables, and wild rice on base acres.
• Offer conservation-enhanced payment option; foregoes marketing loan and counter-cyclical benefits
• Consolidate programs into newly designed Environmental Quality Incentives Program (EQIP) and Regional Water Enhancement Program (RWEP); add $4.2 billion funding
• $50 million to stimulate private-sector investment in conservation programs.
AMERICAN FARM BUREAU
• No unilateral change in commodity support.
• Same level of funding, adjusted for inflation.
• Oppose a means test for farm program eligibility.
• No changes specified in sources used
NATIONAL FARMERS UNION
• Counter-cyclical payments indexed to the cost of production.
• Price supports reflecting cost of production shifts for producers.
• Full funding for Conservation Security Program
• Increased funding for Natural Resources Conservation Service (NRCS)
CHICAGO COUNCIL ON GLOBAL AFFAIRS
• Change product-specific, trade-distorting income and support programs to non-distorting Green Box-compliant rules.
• Direct payments that are de-linked for specific types of production and from market conditions to fully comply with Green Box standards.
• A universal subsidized revenue insurance program on all commodities (not crop specific, Green Box-eligible).
• Change domestic policies and export subsidies to get strong Doha agreement.
• Resources redirected from payments to individuals to broader public investment.
• A new land stewardship program that pays producers according to the kind and amount of environmental goods and services they provide.
WESTERN GROWERS • Restrictions on planting flexibility remain in place.
• Specialty crop producers with higher production costs receive larger proportion of disaster assistance.
• Expand/Improve EQIP; specialty crops receive 25 percent of total funding
• Eliminate Adj. Gross Income Limit on Conservation Programs.
AMERICAN FARMLAND TRUST
• Replace counter-cyclical and loan-deficiency payments with green payments and market-oriented, revenue-based risk protection.
• Significant reduction in global tariffs, and establishment and enforcement of uniform, scientifically based health and safety standards.
• Funding shift from direct payments to green payments.
• Make green payments available to all agricultural producers who provide environmental benefits; index environmental benefits. Payments based on graduated scale.
• Improve funding.
• Streamline programs.
• Protect the best agricultural land.
240 WOODS INSTITUTE FOR THE ENVIRONMENT | STANFORD UNIVERSITY
Sources:The Chicago Council on Global Affairs
http://www.thechicagocouncil.org/taskforce_details.php?taskforce_id=1
American Farmland Trust http://www.farmland.org/programs/campaign/default.asp
American Farm Bureau http://www.fb.org/index.php?fuseaction=newsroom.newsfocus&year=2007&file=nr0302.html
http://www.fb.org/index.php?fuseaction=newsroom.agendafocus&year=2006&file=ag10-2006.html
USDA Farm Bill Proposal http://www.usda.gov/documents/07finalfbp.pdf
Western Growers http://www.wga.com/LinkClick.aspx?link=DocumentLibrary%2FSpecialty+Crop+Farm+Bill+Alliance+2007+Farm+Bill+Recs.Final.pdf&tabid=332&mid=1497
National Farmers Union http://www.nfu.org/wp-content/2007-sob_farm-bill.pdf
National Corn Growers Association http://www.ncga.com/farmDev/main/PDF/12_01_06NFSA_FB_Brief.pdf